the Creative Commons Attribution 4.0 License.
the Creative Commons Attribution 4.0 License.
 | 31 Jan 2024
The contribution of residential wood combustion to the PM2.5 concentrations in the Helsinki metropolitan area
Leena Kangas
Jaakko Kukkonen
Mari Kauhaniemi
Kari Riikonen
Mikhail Sofiev
Anu Kousa
Jarkko V. Niemi
Ari Karppinen
This article has investigated the contribution of residential wood combustion (RWC) to the fine particulate matter (PM2.5) concentrations in the Helsinki metropolitan area (HMA) for 6 years, from 2009 to 2014. We have used the PM2.5 concentrations measured at eight air quality measurement stations. The dispersion of emissions on an urban scale was evaluated with multiple-source Gaussian dispersion models, UDM-FMI (urban dispersion model of the Finnish Meteorological Institute) and CAR-FMI (Contaminants in the Air from a Road model of the Finnish Meteorological Institute), and on a regional scale using the chemical transport model SILAM (System for Integrated modeLling of Atmospheric coMposition). The overall agreement of the predicted concentrations with measurements of PM2.5 was good or fairly good for all stations and years; e.g. at the permanent residential station the daily average values of the index of agreement ranged from 0.69 to 0.81, and the fractional bias values ranged from −0.08 to 0.11, for the considered 6 years. Both the measured and predicted daily averaged concentrations showed increasing trends towards the lower-temperature values. The highest predicted annual averaged concentrations in the region occurred in the vicinity of major roads and streets and in the suburban residential areas to the northwest, north, and northeast of the city centre. The average concentrations of PM2.5 attributed to RWC in winter were up to 10- or 15-fold, compared to the corresponding concentrations in summer. During the considered 6-yearly period, the spatially highest predicted fractions of RWC of the annual PM2.5 concentrations ranged from 12 % to 14 %. In winter, the corresponding contributions ranged from 16 % to 21 %. The RWC contribution was higher than the corresponding urban vehicular traffic contribution at all the residential stations during all years. The study has highlighted new research needs for the future, in particular (i) the modelling of the RWC emissions that would be explicitly based on the actual ambient temperatures and (ii) the modelling of the impacts of the most important holiday periods on the emissions from RWC.
- Article
(5275 KB) - Full-text XML
- BibTeX
- EndNote


Exposure to fine particulate matter (PM2.5) in ambient air has been shown to be associated with adverse health effects, such as acute lower respiratory infections, asthma, chronic obstructive pulmonary disease, lung cancer, and cardiovascular disease, as well as excess mortality (e.g. Horne et al., 2018; Anenberg et al., 2018; Li et al., 2016; Pope and Dockery, 2006; Pope et al., 2020; Lelieved et al., 2020). It has been estimated that 4.2 million deaths per year have been caused globally by ambient PM2.5 concentrations (Cohen et al., 2017).
One of the major sources of PM2.5 concentrations is residential wood combustion (RWC). Wood combustion is a significant source of energy for cooking and heating in many countries worldwide (e.g. Bonjour et al., 2013; WHO, 2016). Also in developed countries, where RWC was largely replaced by other forms of energy in the 20th century, wood is still widely used as a heating source, especially in rural areas (Fernandes et al., 2007). In urban areas, wood-burning stoves and fireplaces are commonly used as a supplementary heating method and for recreational use (WHO, 2015; Amann et al., 2018; Kukkonen et al., 2020).
Residential combustion was estimated to cause 45 % of global anthropogenic and 27 % of global total PM2.5 emissions in 2010, with an especially high share in Africa and parts of Asia (Klimont et al., 2017). In EU countries, residential combustion was estimated to account for 46 % of anthropogenic PM2.5 emissions in 2005, of this 80 % was estimated to originate from the combustion of biomass (Amann et al., 2018). However, there was a substantial variation within the EU countries: the contribution of biomass combustion to PM2.5 emissions ranged from less than 10 % in the Netherlands, Ireland, Cyprus, and Malta to 70 %–80 % in Croatia, Latvia, and Lithuania.
In most Nordic and Baltic countries (except for Iceland), wood has commonly been used as a fuel for decades. Many of these countries have historically had ample resources of local wood (Denier van der Gon et al., 2015; Kukkonen et al., 2020). In many urban areas in the continental Nordic countries (i.e. Finland, Denmark, Norway, and Sweden), the RWC share of the local emissions of PM2.5 has commonly been considerably lower than that in rural areas. This has been partly due to (i) the use of firewood only as a supplementary heating method in cities and (ii) clearly, the other urban emission sources. However, the total amount of RWC emissions has nevertheless been significant in part of the Nordic cities, due to either many RWC-heated detached houses or the heating of larger blocks of flats by RWC (Kukkonen et al., 2020). For instance, in the Helsinki metropolitan area (HMA), RWC has been estimated to have caused 45 % of the urban PM2.5 emissions from combustion in 2021 (Korhonen et al., 2022).
From 1990 to 2015, the biomass consumption for residential heating doubled in the EU (Bertelsen and Mathiesen, 2020). According to Viana et al. (2015), in some countries, such as Norway, Austria, Denmark, and Bulgaria, the relative share of biomass of all fuels in the residential sector continued to increase from 1990 to 2012. However, in some other countries, e.g. Spain, Greece, Hungary, and Croatia, the contribution of biomass combustion decreased from 1990 to 2005, after which the contribution started to increase. The latter trend was partly due to the economic situation in these countries and the domestic supply of wood and partly due to climate policies (Viana et al., 2015). According to Eurostat (2023), in all these countries, the consumption of primary solid biofuels in the residential sector increased from 1990 to 2012, especially in Bulgaria (340 %), Hungary (234 %), and Denmark (146 %). In the other above-mentioned countries, the increase was 20 %–34 %, and the average increase in the EU was 95 %. In more recent years, the consumption of primary solid biofuels in the residential sector has slightly decreased; it was 82 % higher in 2020 as compared to the corresponding level in 1990 (Eurostat, 2023).
The growing concern for the health impacts associated with PM2.5 emissions has resulted in a range of abatement measures for RWC emissions. Such measures have already been taken, e.g. in continental Nordic countries; these were reviewed by Kukkonen et al. (2020). On the other hand, substituting fossil fuels with renewable energy has been recommended by the EU. The political target has been set to increase the share of renewable energy to 32 % by the year 2030 (EU Renewable Energy Directive 2018/2001, RED II). For instance, in Helsinki, the coal-fired district heating has partly been replaced by other options, one of which is bioenergy heating plants (Helen Ltd, 2023). The increased use of renewable energy in Europe has, however, been dominated by the increase in RWC in residential stoves, instead of the commonly more controlled and efficient combustion of wood in heating plants (Sikkema et al., 2021). This has resulted in a significant increase in PM2.5 emissions in Europe from 2005 to 2016 (Couvidat et al., 2021). It has also been pointed out that the sustainable resource of biomass is limited, and therefore alternative renewable energy sources should be encouraged instead of biomass (Andersen et al., 2021). Due to these conflicting goals, it is challenging to predict the future development of RWC emissions. In Finland, the energy security considerations and the tradition of using fairly easily available fuelwood have favoured RWC. To diminish harmful impacts, reducing emissions by updating appliances and using more environmentally friendly energy sources can be encouraged (Savolahti, 2020). It has been estimated that Finnish RWC emissions might decline slightly in the 2020s (Ohtonen et al., 2023).
The PM2.5 emissions originating from RWC are commonly released at low altitudes and may therefore have a substantial adverse impact on local air quality and human health. It is important to quantitatively determine the contribution of RWC emissions to the PM2.5 concentrations in ambient air and evaluate the impact of potential emission reduction measures. Karagulian et al. (2015) evaluated in a global review that an average of 20 % of urban ambient PM2.5 originated from domestic fuel burning; the corresponding value for vehicular traffic was 25 %. However, they also found that there was a wide variation between different regions. In western, northwestern, and central and eastern European countries, these contributions were 15 %, 22 %, and 32 %, respectively. According to a review of source apportionment studies by Belis et al. (2013), the relative contribution of biomass combustion to PM2.5 concentrations in Europe was 15 % ± 7 %, with the highest relative contributions in urban areas occurring in the Alps and in northern Europe.
In countries where wood is used for residential heating, the seasonal variation in RWC is pronounced (Klimont et al., 2017). Episodes with high PM2.5 concentrations often occur in winter, due to both intensive local emissions and meteorologically stable periods and low wind speeds. Trompetter et al. (2010) have compared PM2.5 source contributions in winter and summer, based on several source apportionment studies in New Zealand; the contribution of wood combustion ranged from 63 % to 91 % in winter and from 9 % to 45 % in summer. In northern Italy, the contributions of biomass combustion in the period including autumn and winter were 25 %–30 % and 27 %–31 % in urban and rural sites, respectively. In summer, the corresponding contributions were 1 % and 3 % (Perrone et al., 2012).
In the HMA, Hellén et al. (2017) have previously evaluated the significance of RWC to the concentrations of benzo[a]pyrene (BaP), which is a good indicator substance for wood burning. Soares et al. (2014) and Aarnio et al. (2016) evaluated in detail the contribution of different emission sources on the PM2.5 concentrations in the HMA; however, these earlier studies did not include the contributions originating from wood combustion. The first attempts to estimate the effect of wood combustion on the PM2.5 concentrations in the HMA were described by Ahtoniemi et al. (2010). More recently, Teinilä et al. (2022) have assessed the impact of residential combustion on air quality in a detached-housing area in Helsinki, based on air quality measurements.
An unprecedentedly detailed emission inventory for RWC has been compiled in the HMA by the Helsinki Region Environmental Services Authority (Kaski et al., 2016). Kukkonen et al. (2020) used this emission inventory to model the PM2.5 concentrations, including RWC. This study also evaluated the concentrations of PM2.5 and the related contributions of RWC in three other Nordic cities, viz. Copenhagen, Oslo, and Umeå. Kukkonen et al. (2020) focused on estimating the annually averaged concentrations, and the study also solely addressed the PM2.5 concentrations during a single year, for each of the selected target cities. Orru et al. (2022) also studied the health impacts of PM2.5 from RWC in the same four Nordic cities.
In another study, Kukkonen et al. (2018) evaluated the contributions of various source categories to the annually averaged concentrations of PM2.5 in the HMA during a multidecadal period. They provided evidence that the emissions of PM2.5 originating from small-scale combustion in the HMA increased slightly in time from the 1980s to the early 2010s. However, the relative share of RWC with respect to the total emissions in that area increased substantially during that period. The reasons for this relative increase were that both the emissions from local vehicular traffic and the long-range transported background of the PM2.5 concentrations decreased during that period, the former by a factor of 5 (Kukkonen et al., 2018). Based on the measured BaP concentrations, it can be estimated that the current level of RWC emissions in the HMA is slightly lower than in the beginning of 2010s. In the early 2010s, the annual average of BaP concentration at the residential measurement station at Vartiokylä ranged from 0.5 to 0.7 ng m−3, while in recent years the level has ranged from 0.4 to 0.5 ng m−3 (Korhonen et al., 2023).
The above-mentioned studies indicated that in the Helsinki metropolitan area (HMA), RWC had a significant impact on the emissions of PM2.5 and on public health in the early 2010s. However, these studies did not include an in-depth analysis of the model performance or diagnostic model evaluation.
The main aim of this article is to investigate in depth the contribution of RWC to the PM2.5 concentrations in the HMA for several years (2009–2014). The specific objectives were (i) to evaluate the seasonal and shorter-term variations in the concentrations attributed to RWC, including their spatial variability; (ii) to analyse both the temporal and spatial year-to-year variation in pollution from RWC; and (iii) to evaluate the model predictions against data in more depth, including diagnostic evaluation. The results can be used for understanding better both the interannual and shorter-term temporal variations in the pollution from RWC. The results can also be used for developing more effective policies for the abatement of pollution attributed to RWC and for deriving insights for an improved modelling of the contributions from RWC.
2.1 The considered domain and the measurement network for concentrations
2.1.1 Modelling domain
The Helsinki metropolitan area (HMA) is an agglomeration of four cities: Helsinki, Espoo, Vantaa, and Kauniainen. The total population of this agglomeration is approximately 1.21 million (2022). The cities are in a fairly flat coastal area by the Baltic Sea. The annual average temperature in the centre of Helsinki is currently 6.5 ∘C; the monthly average ranges from −3.8 ∘C in February to 18.1 ∘C in July (Jokinen et al., 2021). The locations of the cities and the measurement stations selected for this study are presented in Fig. 1.
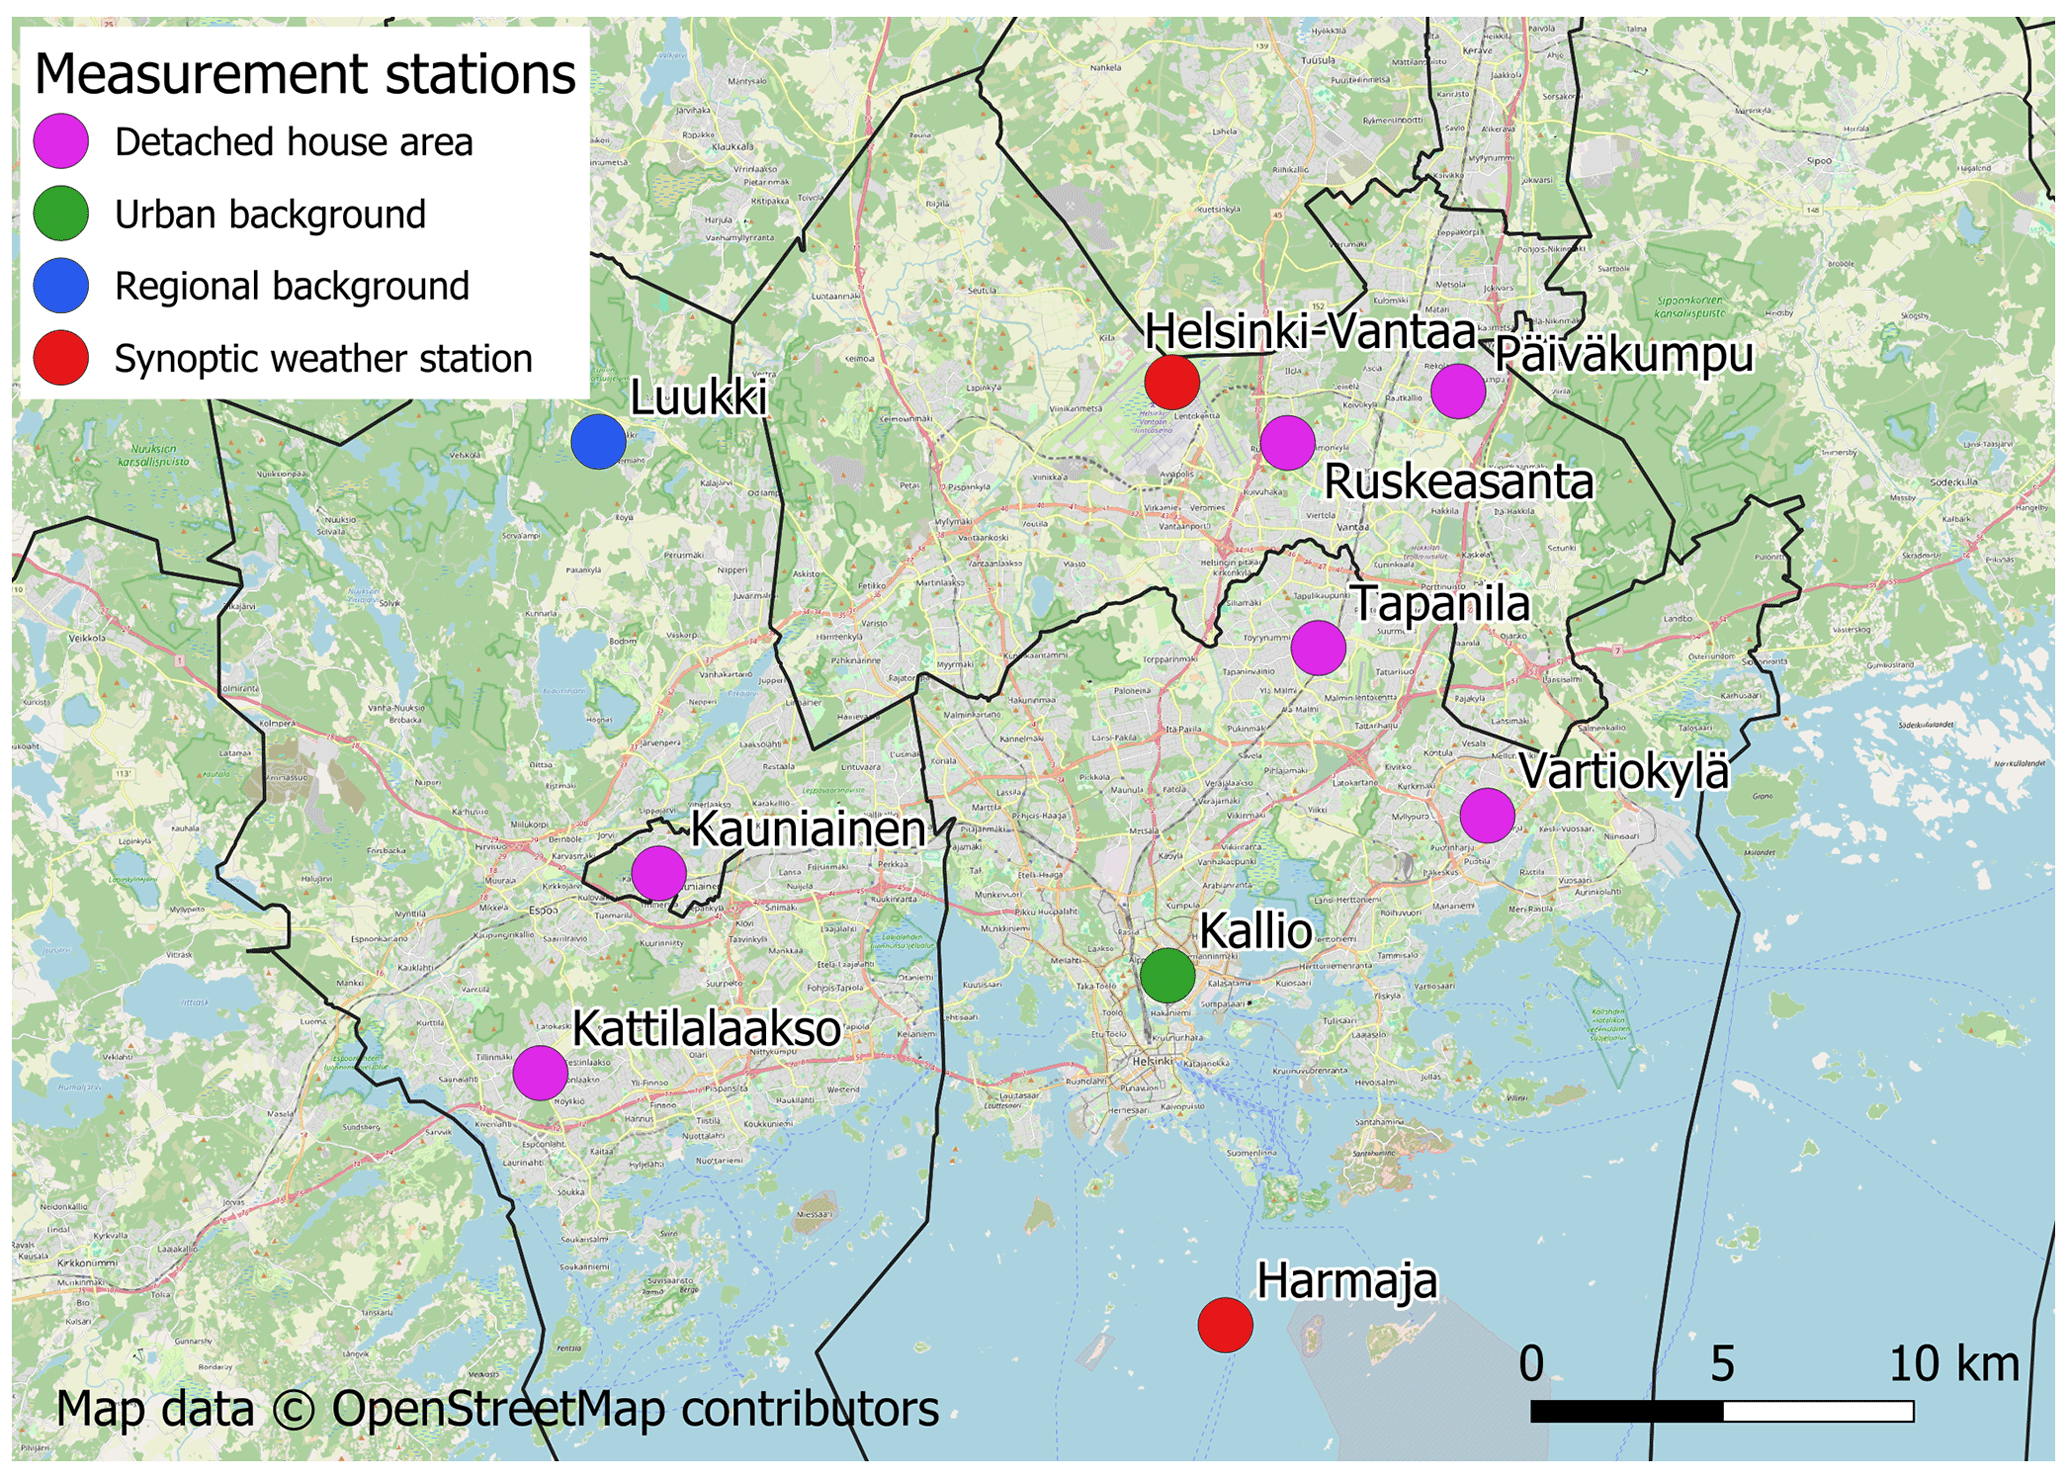
Figure 1The cities in the Helsinki metropolitan area and the air quality measurement stations used for this study. Three categories of air quality stations were included: detached-house areas and urban and regional backgrounds. The urban-background station is located in central Helsinki, and the regional-background station is in the northern part of the city of Espoo. We also used weather data from two synoptic meteorological stations. © OpenStreetMap contributors 2019. Distributed under the Open Data Commons Open Database License (ODbL) v1.0.
2.1.2 Concentration measurement network
We have used the hourly time series of the PM2.5 concentrations, measured at eight air quality measurement stations operated by the Helsinki Region Environmental Services Authority (HSY). The locations of the stations are presented in Fig. 1. The classification of the sites, the years of measurement, and the measurement devices are presented in Table 1. The monitoring height for all these sites was approximately 4 m.
Table 1The measurement sites used in this study, their site classifications, the years of measurement, and the measurement devices for PM2.5. The detached-house areas have been additionally classified as more densely and more sparsely built ones.
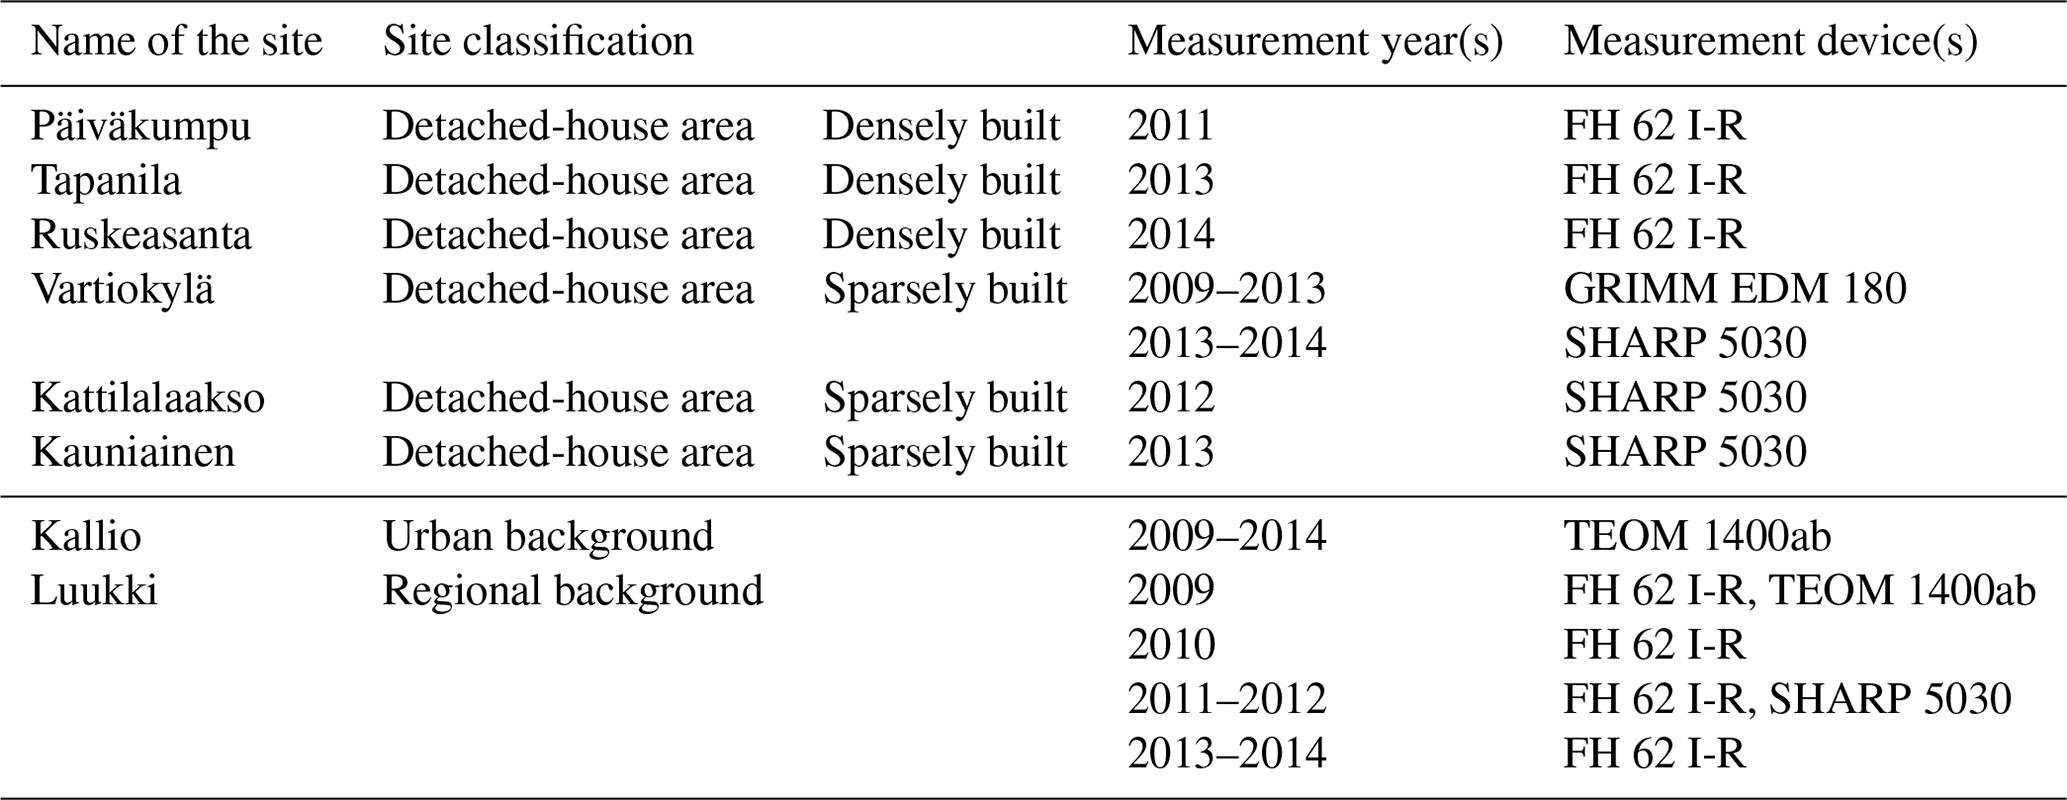
We selected six measurement stations located in detached-house areas (Vartiokylä, Päiväkumpu, Kattilalaakso, Kauniainen, Tapanila, and Ruskeasanta). The residential wood combustion emissions in this region almost exclusively originate from residential combustion in detached houses (Kukkonen et al., 2020). The urban- and regional-background stations at Kallio and Luukki, respectively, have been selected for the analysis of urban and local concentration increments.
The concentrations were measured with continuous measurement methods. The FH 62 I-R monitor is based on the attenuation of β rays by a filter, which is directly related to the amount of mass on the filter. The GRIMM EDM 180 instrument uses an optical technique in which particles are divided into different sizes in diameter based on light scattering. SHARP 5030 (Synchronized Hybrid Ambient Real-time Particulate Monitor) is a particulate monitor combining light-scattering photometry and beta radiation attenuation. TEOM 1400ab (tapered element oscillating microbalance) uses the tapered element oscillating microbalance technique to measure the mass concentration of particulate matter on a filter (Walden et al., 2010). The measured values were corrected with calibration equations based on Walden et al. (2010); these ensure equivalence with reference methods.
The surroundings of the measurement stations in detached-house areas are substantially different. The immediate vicinity of stations of three sites (Päiväkumpu, Tapanila, and Ruskeasanta) is more densely built, compared to that of the other three considered stations in detached-house areas. The site of Kattilalaakso is located lower than its surroundings, which may be unfavourable for the efficient mixing of pollution. All stations in detached-house areas are located in regions with relatively low traffic volumes, except for the site of Ruskeasanta, as there is a densely trafficked highway at a distance of 700 m from the site. This highway had an estimated average traffic volume on weekdays of 58 200 vehicles per day in 2013 (Malkki and Loukkola, 2015).
The urban-background station at Kallio is located on the edge of a sports field in the city centre, at a distance of 80 m from a street with an average traffic volume on weekdays of 6300–8800 vehicles per day (2009–2014). The regional measurement station of Luukki is located in a rural area. However, it may occasionally be exposed to pollution caused by vehicular traffic on a local minor road, as well as previously by a camping centre, which was situated in the vicinity of the site, until the station was moved a distance of 300 m further from this local source in May 2012.
2.2 Emission inventories
We have evaluated the PM2.5 emissions from urban RWC and vehicular traffic. It has previously been found that the contribution of other urban source categories to the PM2.5 concentrations has not been significant in this region (Kukkonen et al., 2018; Hannuniemi et al., 2016). For shipping and harbour activities, the contribution in the 3-year period of 2012–2014 has been estimated to exceed 10 % only in the immediate vicinity of major harbours (Kukkonen et al., 2018). The contribution of power production to local PM2.5 concentrations has been negligible in most parts of the area (Hannuniemi et al., 2016). The construction and maintenance activities of housing and streets could also potentially affect the measured concentrations. However, there is no reliable emission inventory regarding these source categories for this area. The construction and maintenance activities have relatively more importance in the central regions of the cities in the considered metropolitan area; these have less importance in detached-house residential areas.
Evaluation of the emissions originating from RWC and traffic emissions is presented briefly in this paper. For a more detailed description of the methodology, the reader is referred to Kukkonen et al. (2018).
2.2.1 Evaluation of the emissions from residential wood combustion
The emissions of RWC used in this study were based on an emission inventory by the local environmental authority, HSY, for 2013–2014. The amount of wood combusted in different types of fireplaces and the habitual uses of wood combustion were estimated using a questionnaire (Kaski et al., 2016). The results were applied to all detached and semi-detached houses in the regional register for dwellings of the HMA. The emission factors for different types of fireplaces were based on the results of a national measurement programme and available literature (Kaski et al., 2016; Savolahti et al., 2016).
In the HMA, 90 % of the detached houses have wood combustion appliances. However, only 2 % of the houses use RWC as a primary heating method.
The meteorological variables, especially ambient temperature, influence the amount of RWC. The average variations in RWC between months, days of the week, and hours of the day were included in the model, using coefficients based on the temporal distributions. These coefficients were based on analysing the data from both the questionnaire for 2013–2014 (Kaski et al., 2016) and from a previous survey for the HMA, in which the temporal variation in fireplace usage was estimated in detail for 2008–2009 (Gröndahl et al., 2012). However, the impact of the actual temporal variation in ambient temperatures (e.g. based on measured temperature data for each hour) has not been explicitly considered, due to the lack of sufficiently detailed data.
The emissions were evaluated separately for three different source categories: heating boilers, sauna stoves, and other fireplaces. The temporal variation is different for each of these categories: sauna stoves are used throughout the year in Finland, whereas the other fireplace types are mostly used during cold seasons. The variation in the ambient temperature is expected to be closely related to the use of heating boilers, but it does not have a straightforward relation to the use of sauna stoves and other fireplaces. The use of the latter two RWC source categories is more closely related to social habits, including the convenience use of fireplaces. The seasonal variation is described in detail in Appendix A.
The same spatial distribution of the emissions from RWC was used in the modelling for all the considered years. However, an estimate of the variation in the total annual emission value was computed based on the available data on the number of detached houses, firewood consumption, and the temporal changes in the share of different heating methods. This variation is described in detail by Kukkonen et al. (2018). The annual total emissions in the HMA from RWC in 2009–2014 ranged from 189 to 175 t a−1.
The emission height, including the initial plume rise, was assumed to be equal to 7.5 m. This value is based on the average height of the detached and semi-detached houses in the area and separate computations of the effects of plume rise and downwash for the applied stove techniques (Karppinen et al., 1998).
2.2.2 Evaluation of the emissions from vehicular traffic
The traffic emissions were evaluated for vehicular exhaust and suspension for the roads and streets in the HMA for 2009–2014. Traffic emissions were evaluated for 26 536 line sources.
The spatial distribution of traffic volume data was computed using the EMME/2 transportation planning system for the year 2008 (HSL, 2011); these data were provided by Helsinki Region Transport. The data consisted of mileage for 3 selected hours for a day for each road link and regression-based factors for evaluating hourly traffic volumes. These data were given for weekdays, Saturdays, and Sundays. Exhaust emissions for each year were calculated using average emission factors and total emission values for the HMA based on a national calculation system for traffic emissions, called LIPASTO (Mäkelä and Auvinen, 2009). The annual total emissions in the HMA originating from exhausts have a decreasing trend; these ranged from 214 t a−1 in 2009 to 124 t a−1 in 2014.
Suspension emissions were evaluated from exhaust emissions with a semi-empirical modelling approach, based on the average monthly ratio of concentrations from suspension and exhaust emissions. These coefficients were computed using previous concentration results computed with emissions from a detailed road dust suspension model, FORE (Kauhaniemi et al., 2011, 2014). The annual total emissions in the HMA originating from suspension ranged from 85 to 83 t a−1 from 2009 to 2014.
2.3 Meteorological measurements and modelling
We used the synoptic weather and radiation observations from Helsinki-Vantaa Airport, located 18 km north of the Helsinki city centre; synoptic weather observations from the marine station of Harmaja, located on an island 7 km south of the city centre; and sounding observations from Jokioinen, 90 km northwest of Helsinki, for 2009–2014. The locations of the synoptic stations are presented in Fig. 1.
The meteorological pre-processing model of the Finnish Meteorological Institute (MPP-FMI; Karppinen et al., 2000a) was used for analysing the measured meteorological data. The model is based on the energy budget method of van Ulden and Holtslag (1985). The output of the MPP-FMI includes an hourly time series of meteorological data needed for the dispersion modelling, such as temperature, wind speed, wind direction, calculated atmospheric turbulence parameters, and the boundary layer height. The same meteorological data were applied to the whole HMA.
2.4 Atmospheric dispersion modelling
Urban-scale dispersion of emissions from RWC and traffic were evaluated with multiple-source Gaussian dispersion models. The dispersion parameters were modelled as a function of Monin–Obukhov length, friction velocity, and boundary layer height. Fine particulate matter (PM2.5) was treated as an inert substance; chemical reactions or aerosol transformation were not included in the modelling. The influence of terrain was included in the model as average surface roughness. Time series of hourly concentrations of PM2.5 were computed for the HMA for 2009–2014.
The dispersion of RWC emissions was computed with the urban dispersion model of the Finnish Meteorological Institute (UDM-FMI; Karppinen et al., 2000c), which is a multiple-source Gaussian dispersion model for point, area, and volume sources. The model has been evaluated against measured data, e.g. by Karppinen et al. (2000b). In the model computations, the RWC emissions were treated as area emissions uniformly distributed in squares of 100 m×100 m.
The dispersion of vehicular emissions was evaluated with CAR-FMI (Contaminants in the Air from a Road model of the Finnish Meteorological Institute), which is a Gaussian finite-length line source model (e.g. Härkönen, 2002; Karppinen et al., 2000c; Kukkonen et al., 2001). The CAR-FMI model has been evaluated against measured data, e.g. by Karppinen et al. (2000b), Kauhaniemi et al. (2008), Aarnio et al. (2016), Singh et al. (2014), and Srimath et al. (2017). Street canyon dispersion modelling was not applied. The coefficients of the variation in weekly emissions were included in the calculations.
The calculation grid consisted of two sub-grids: the sub-grid for RWC, with a horizontal resolution of 100 m×100 m, and the sub-grid for traffic, including 52 301 calculation points, with spatial resolution ranging from 20 m in the vicinity of the roads to 500 m in background areas.
The regional-background concentrations were based on concentrations computed with a global- to meso-scale dispersion model, SILAM (System for Integrated modeLling of Atmospheric coMposition; Sofiev et al., 2006, 2015). The concentrations were evaluated for the European domain, and their computation has been described in detail by Kukkonen et al. (2018). For estimating the hourly average regional-background concentrations, we selected four SILAM grid points closest to the HMA and calculated the average of the concentrations at these four locations for all the chemical components of PM2.5, except for mineral dust. For mineral dust, we used the minimum concentration value in the four selected points. The regional-background concentrations were added to the computed urban concentrations in the post-processing phase.
2.5 Statistical parameters
For evaluating model performance, we have computed the following statistical parameters: the index of agreement (IA); the square of the correlation coefficient, also called R-squared (R2); the normalized mean square error (NMSE); the factor of 2 (FAC2); and the fractional bias (FB).
The index of agreement is defined as (Willmott, 1981)
where CP and CO are the predicted and observed concentration and overbar denotes the average over the dataset. The index of agreement is a measure of the degree to which observed deviations about correspond to predicted deviations about , and it is sensitive to the differences between the observed and predicted means (Willmott, 1981). The index of agreement varies from 0.0 to 1.0; the latter value corresponds to a perfect agreement. The value of the IA of approximately 0.4 corresponds to the agreement of two random time series which have the same average value (Karppinen et al., 2000b).
The parameters R2, NMSE, and FAC2 are measures of correlation of the predicted and observed concentration time series. R2 is the square of the correlation coefficient R:
where σC denotes standard deviation over the dataset. NMSE is defined as (e.g. Chang and Hanna, 2004)
FAC2 is defined as the fraction of data for which ; i.e. it describes the share of predictions within a factor of 2 compared with observations.
Fractional bias is a measure of the agreement of the observed and predicted mean concentrations, and it is defined as
Values of FB between −0.67 and 0.67 describe under- and over-estimation by a factor of 2.
We first evaluate the predicted concentrations against measurements. Second, we present and discuss the predicted concentrations of PM2.5, their year-to-year variation, and the difference between concentration values annually and in winter. We also compare the contributions from RWC and traffic to the PM2.5 concentrations in residential areas and examine the temporal variations in these contributions.
We have also presented an analysis of the representativity of the measurement stations in areas containing detached houses in Appendix B. This analysis was done in terms of the location and amount of emissions from RWC in the vicinity of each measurement station. The stations were exposed to substantially varying amounts of emissions originating from RWC.
3.1 Evaluation of predicted concentrations against measurements
3.1.1 Statistical analysis
The annual average concentrations and statistical parameters for the selected measurement stations are presented in Tables 2 and 3. Statistical parameters were calculated from daily average concentrations. The concentrations were measured for all the considered years at only one residential site (Vartiokylä) and the regional- and urban-background sites.
Table 2Observed and predicted annual average concentrations (µg m−3) and statistical parameters (IA, R2, NMSE, FB, FAC2) for the residential station at Vartiokylä and for the urban- and regional-background stations at Kallio and Luukki, respectively. Parameters were calculated based on daily concentrations. The number of daily averages (N) is also presented.
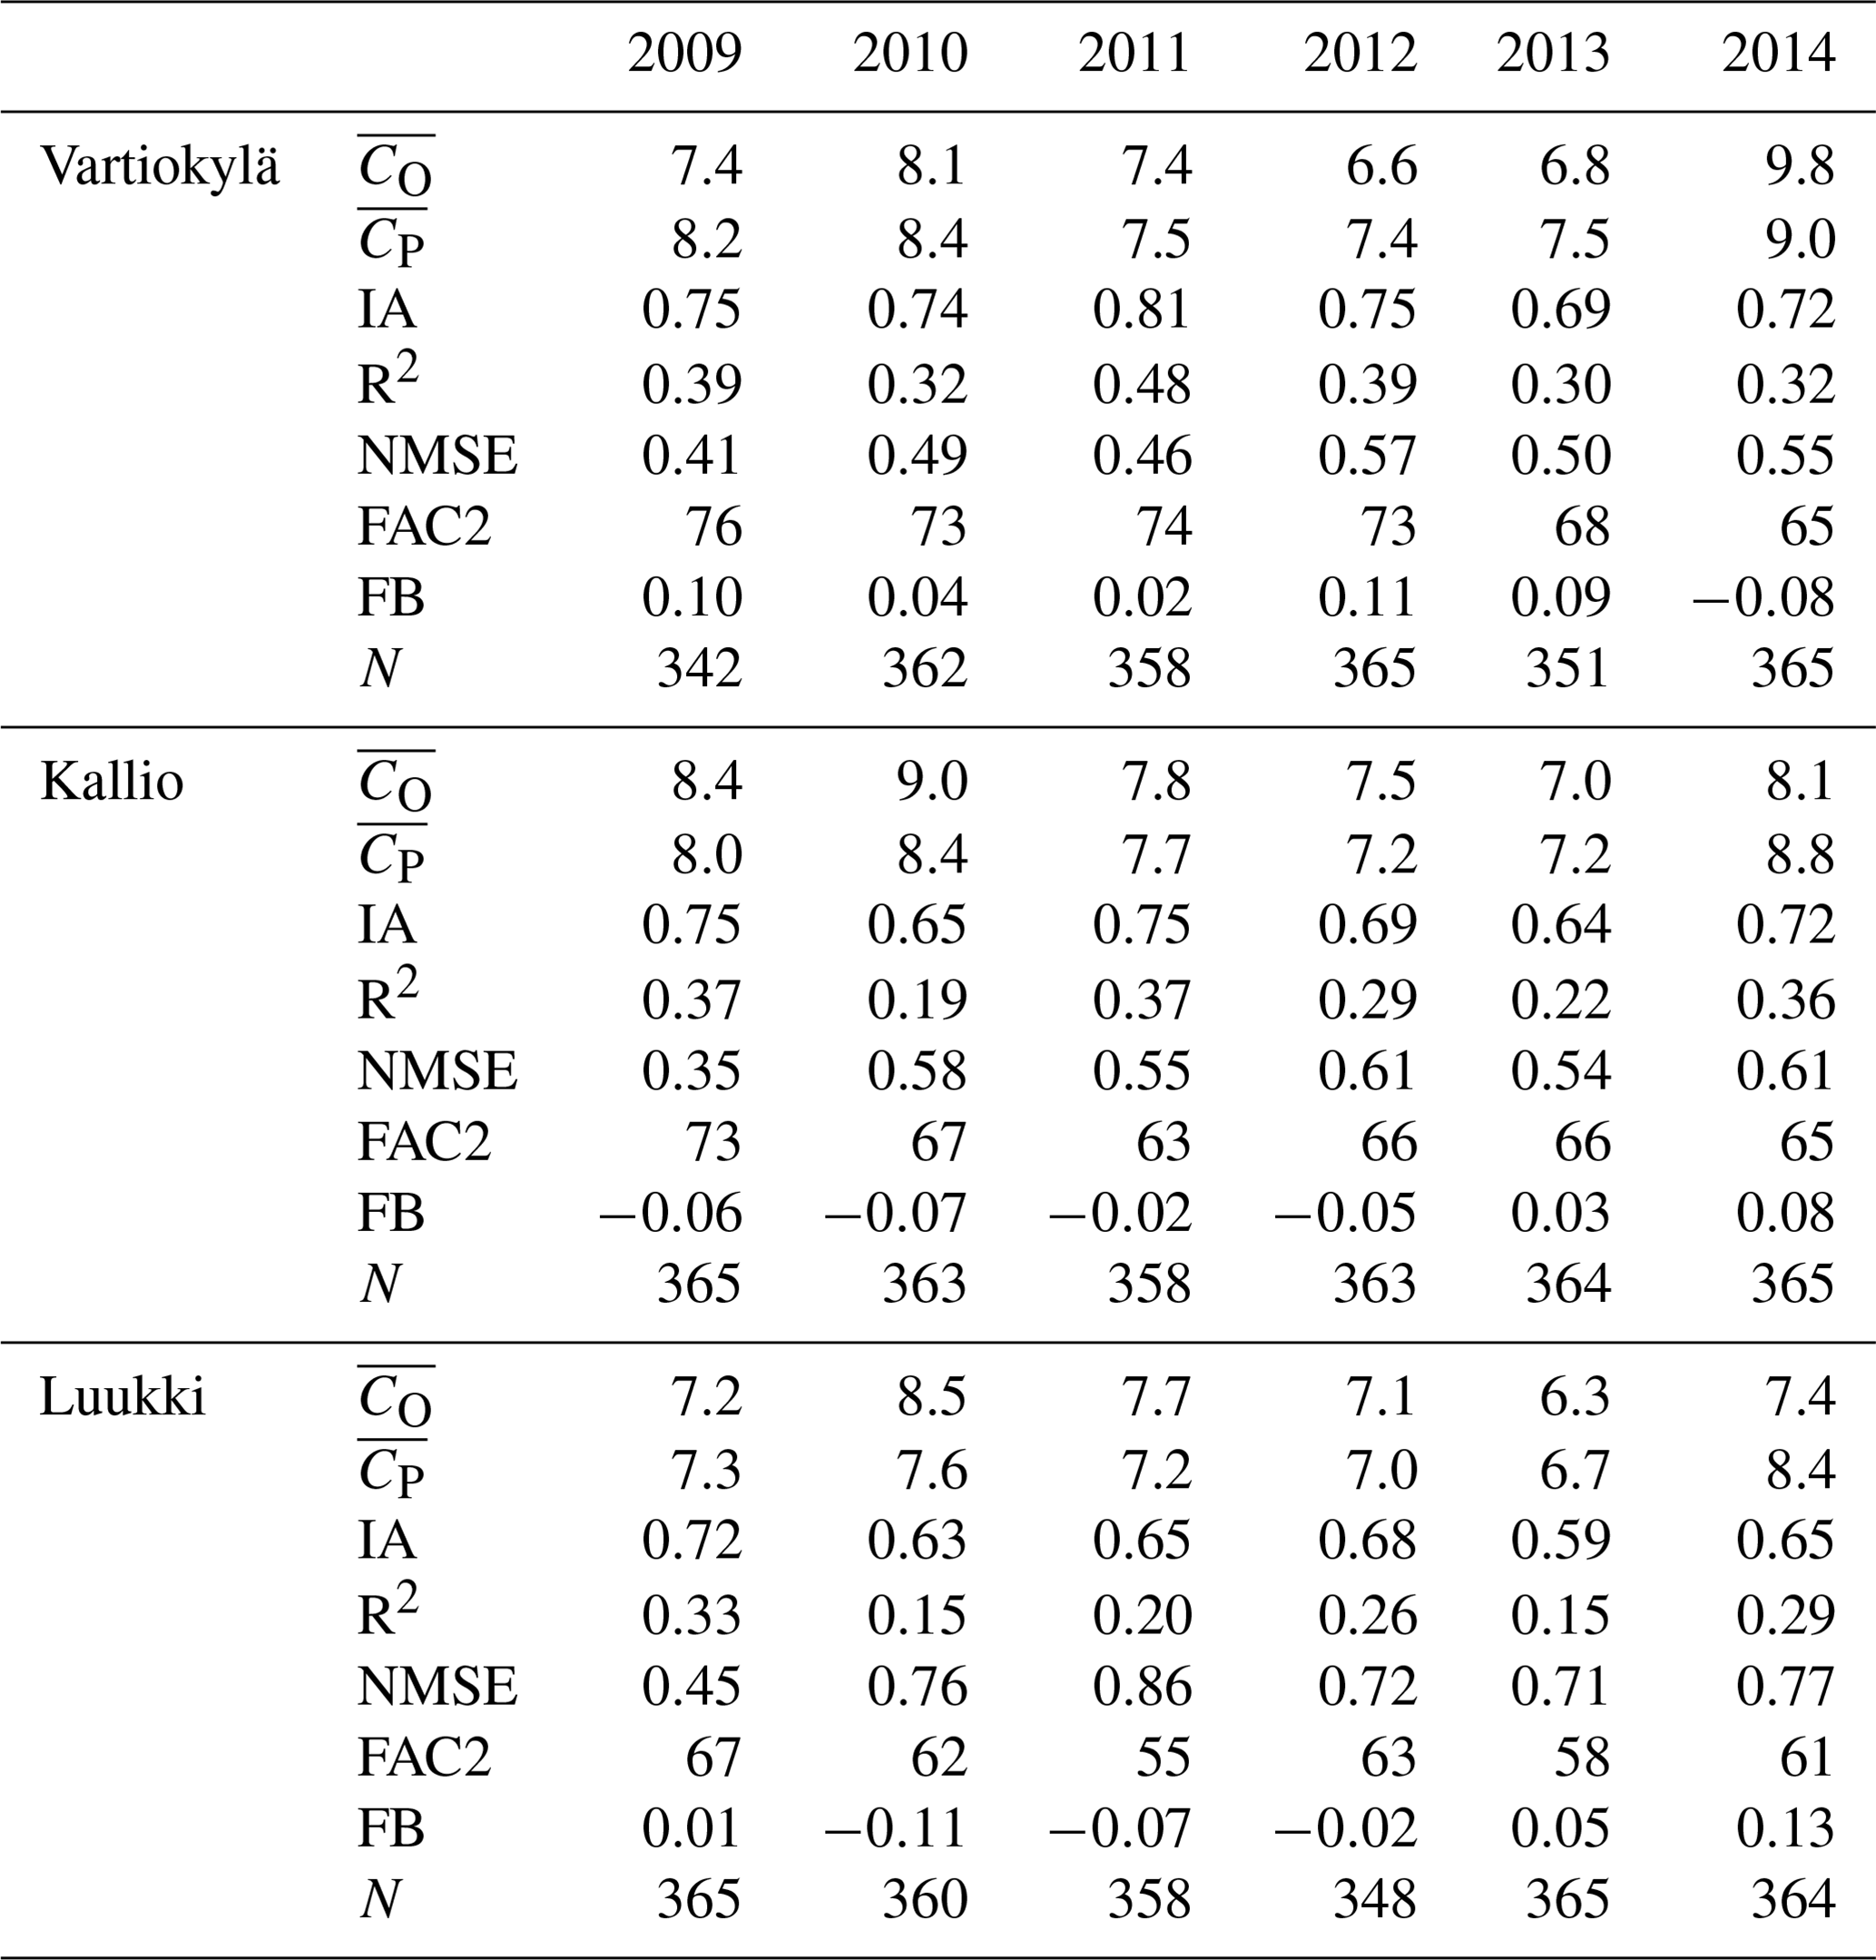
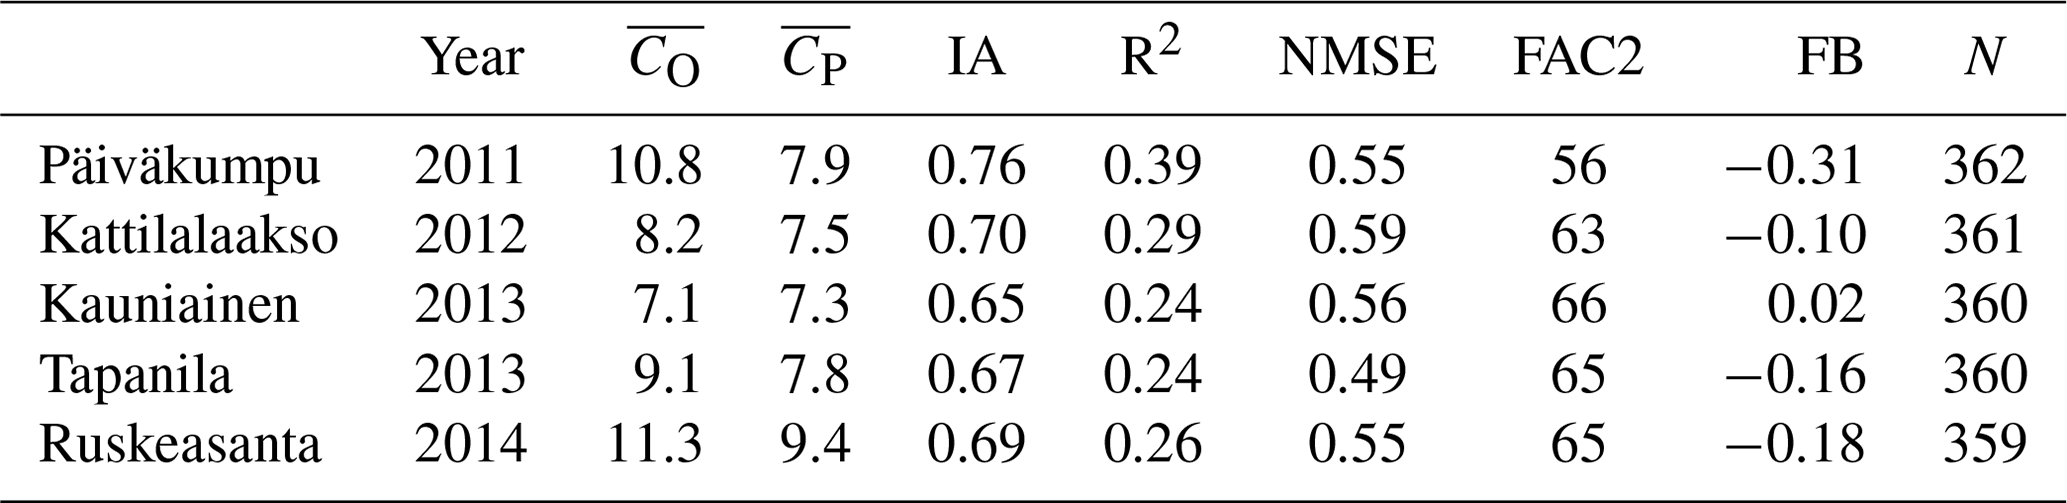
Table 3Observed and predicted annual average concentrations (µg m−3) and statistical parameters (IA, R2, NMSE, FB, FAC2) for five measurement stations in residential areas. Parameters were calculated from daily concentrations. The number of daily averages (N) is also presented.
The differences between the predicted and observed concentrations at RWC stations are partly due to the setup of the model. The emissions of RWC were considered on a spatial resolution of 100 m×100 m. Clearly, this can average out the spatial emission distribution on a finer scale. The highest measured short-term local concentration peaks may therefore be under-predicted by the model. These impacts are probably highest in the more densely built residential areas.
The predicted concentrations near the sources are also sensitive to the evaluation of the effective emission height. Clearly, the effective emission height is dependent on the meteorological conditions and the structural details of buildings in each region. There are also uncertainties regarding the spatial distribution of the emissions in each computational grid cell. All the observed values were measured at a height of 4 m. Near an emission source the predicted concentration at the ground level may not accurately represent the observed concentration value at the height of 4 m.
However, the overall agreement of predicted concentrations with measurements can be considered to be good or fairly good for all stations.
In the regional-background station, IA ranges from 0.59 to 0.72, and fractional bias ranges from −0.11 to 0.13. For the urban-background station, the IA ranges from 0.64 to 0.75, and fractional bias ranges from −0.07 to 0.08. The model agreement is therefore slightly better at the urban-background station, compared with the regional background. The corresponding model performance statistics for the permanent residential site (Vartiokylä) are close to those at the urban-background station (IA ranges from 0.69 to 0.81, and FB ranges from −0.08 to 0.11). For the other residential sites, the IA ranges from 0.65 to 0.76, which is close to the corresponding agreement at the urban-background station. The FB values are different between more densely (FB from −0.31 to −0.16) and more sparsely built areas (FB from −0.1 to 0.02); the model slightly under-predicts values in densely built areas.
Regarding the permanent residential site, the year-to-year variation in model performance can be considered to be substantial. These differences are probably mainly caused by the changing weather conditions. The modelling of the amounts of RWC was based on semi-empirical temporal profiles of the amount of RWC (for months, days of the week, and hours of the day), instead of the actual measured temperature values.
According to our previous studies (e.g. Kukkonen et al., 2018), the model performance measures for traffic stations in the HMA were in the same range, compared with those found at the RWC stations in this study. This provides evidence that the impacts of RWC were modelled with an accuracy comparable to the modelling of the impacts of vehicular traffic.
3.1.2 Seasonal and monthly average concentrations
We have computed average concentrations for the seasons of the year, during the whole of the considered 6-year period. The seasons have been defined as follows: winter as January, February, and December; spring as March, April, and May; summer as June, July, and August; and autumn as September, October, and November. Seasonal average concentrations are presented in Fig. 2a–c for three categories of stations.
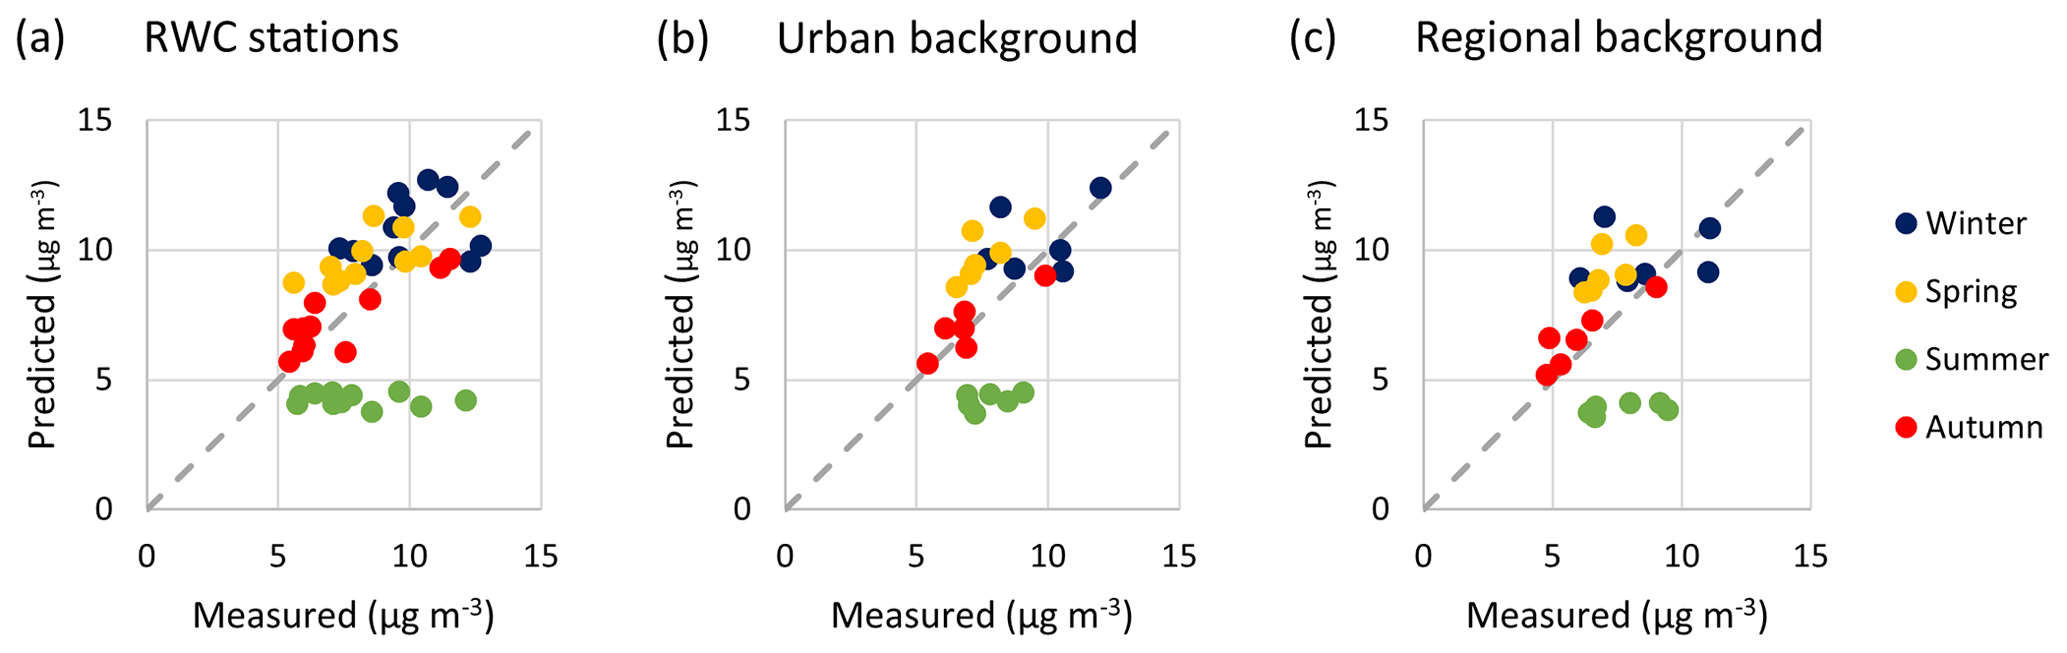
Figure 2Predicted and measured concentrations (µg m−3) during the seasons of the year for three categories of stations, i.e. residential and urban and regional background, during 2009–2014.
In summer, the concentrations were substantially under-predicted for all the categories of stations. The regional-background concentration values were extracted directly from the predictions of the chemical transport model SILAM. The model skill scores for the PM2.5 concentrations of the SILAM model have previously been found to be relatively worse in summer, due to uncertain particulate matter components in summer, such as biogenic organics and the contributions from wildland fires (Prank et al., 2016). The agreement in summer is worse for RWC stations than for the background stations, which may be due to some missing emission sources specifically in summer in the model, e.g. particulate matter from barbecues in some residential areas.
The agreement of predicted and measured concentrations was fairly good during the other seasons. There were over-predictions for most of the values in spring. In autumn, there were both over- and under-predictions. In winter, differences between the years are obvious: the predicted concentrations were higher than observed in 2013 and 2014 for all stations including those at Kallio and Luukki. In 2012 the model under-predicted values for all stations except Vartiokylä. Over-estimation occurred more often for RWC stations than for the regional- and urban-background stations. These differences between years were probably caused by the assumed semi-empirical seasonal variation in RWC emissions in winter, which does not take into account the year-to-year variation in the meteorological conditions during the considered periods.
To evaluate the impact of seasonal variation functions for emissions, we have analysed the bias of the model predictions in terms of the severity of the winter. In addition, we have compared observed and predicted long-term winter averages separately for weekdays and weekends, as well as for holiday weeks and other weeks for Vartiokylä. These results have been presented in Appendix C.
These results showed that there were slightly more model over-predictions in the case of the relatively warmer winters, some difference between weekdays and weekends, and a clear difference between holiday weeks and other weeks. The model under-predicted values especially in December at the residential sites. This could have been caused by the increased recreational wood burning and cooking by wood-burning stoves during the Christmas holiday season and, in addition, the fireworks of the New Year celebration. The model under-predictions in December were not correlated with ambient temperatures. The results also highlight that the local holiday weeks in January and February have an impact on the amount of wood combustion.
3.1.3 Correlations of daily average concentrations and ambient temperatures
To analyse in depth the impact of ambient temperature to local RWC concentrations in winter, we first selected the cases for which the RWC contribution was above the average value, according to the model computations. The observed and predicted concentrations at the residential stations are presented in Fig. 3a–l for these cases against the ambient temperatures.
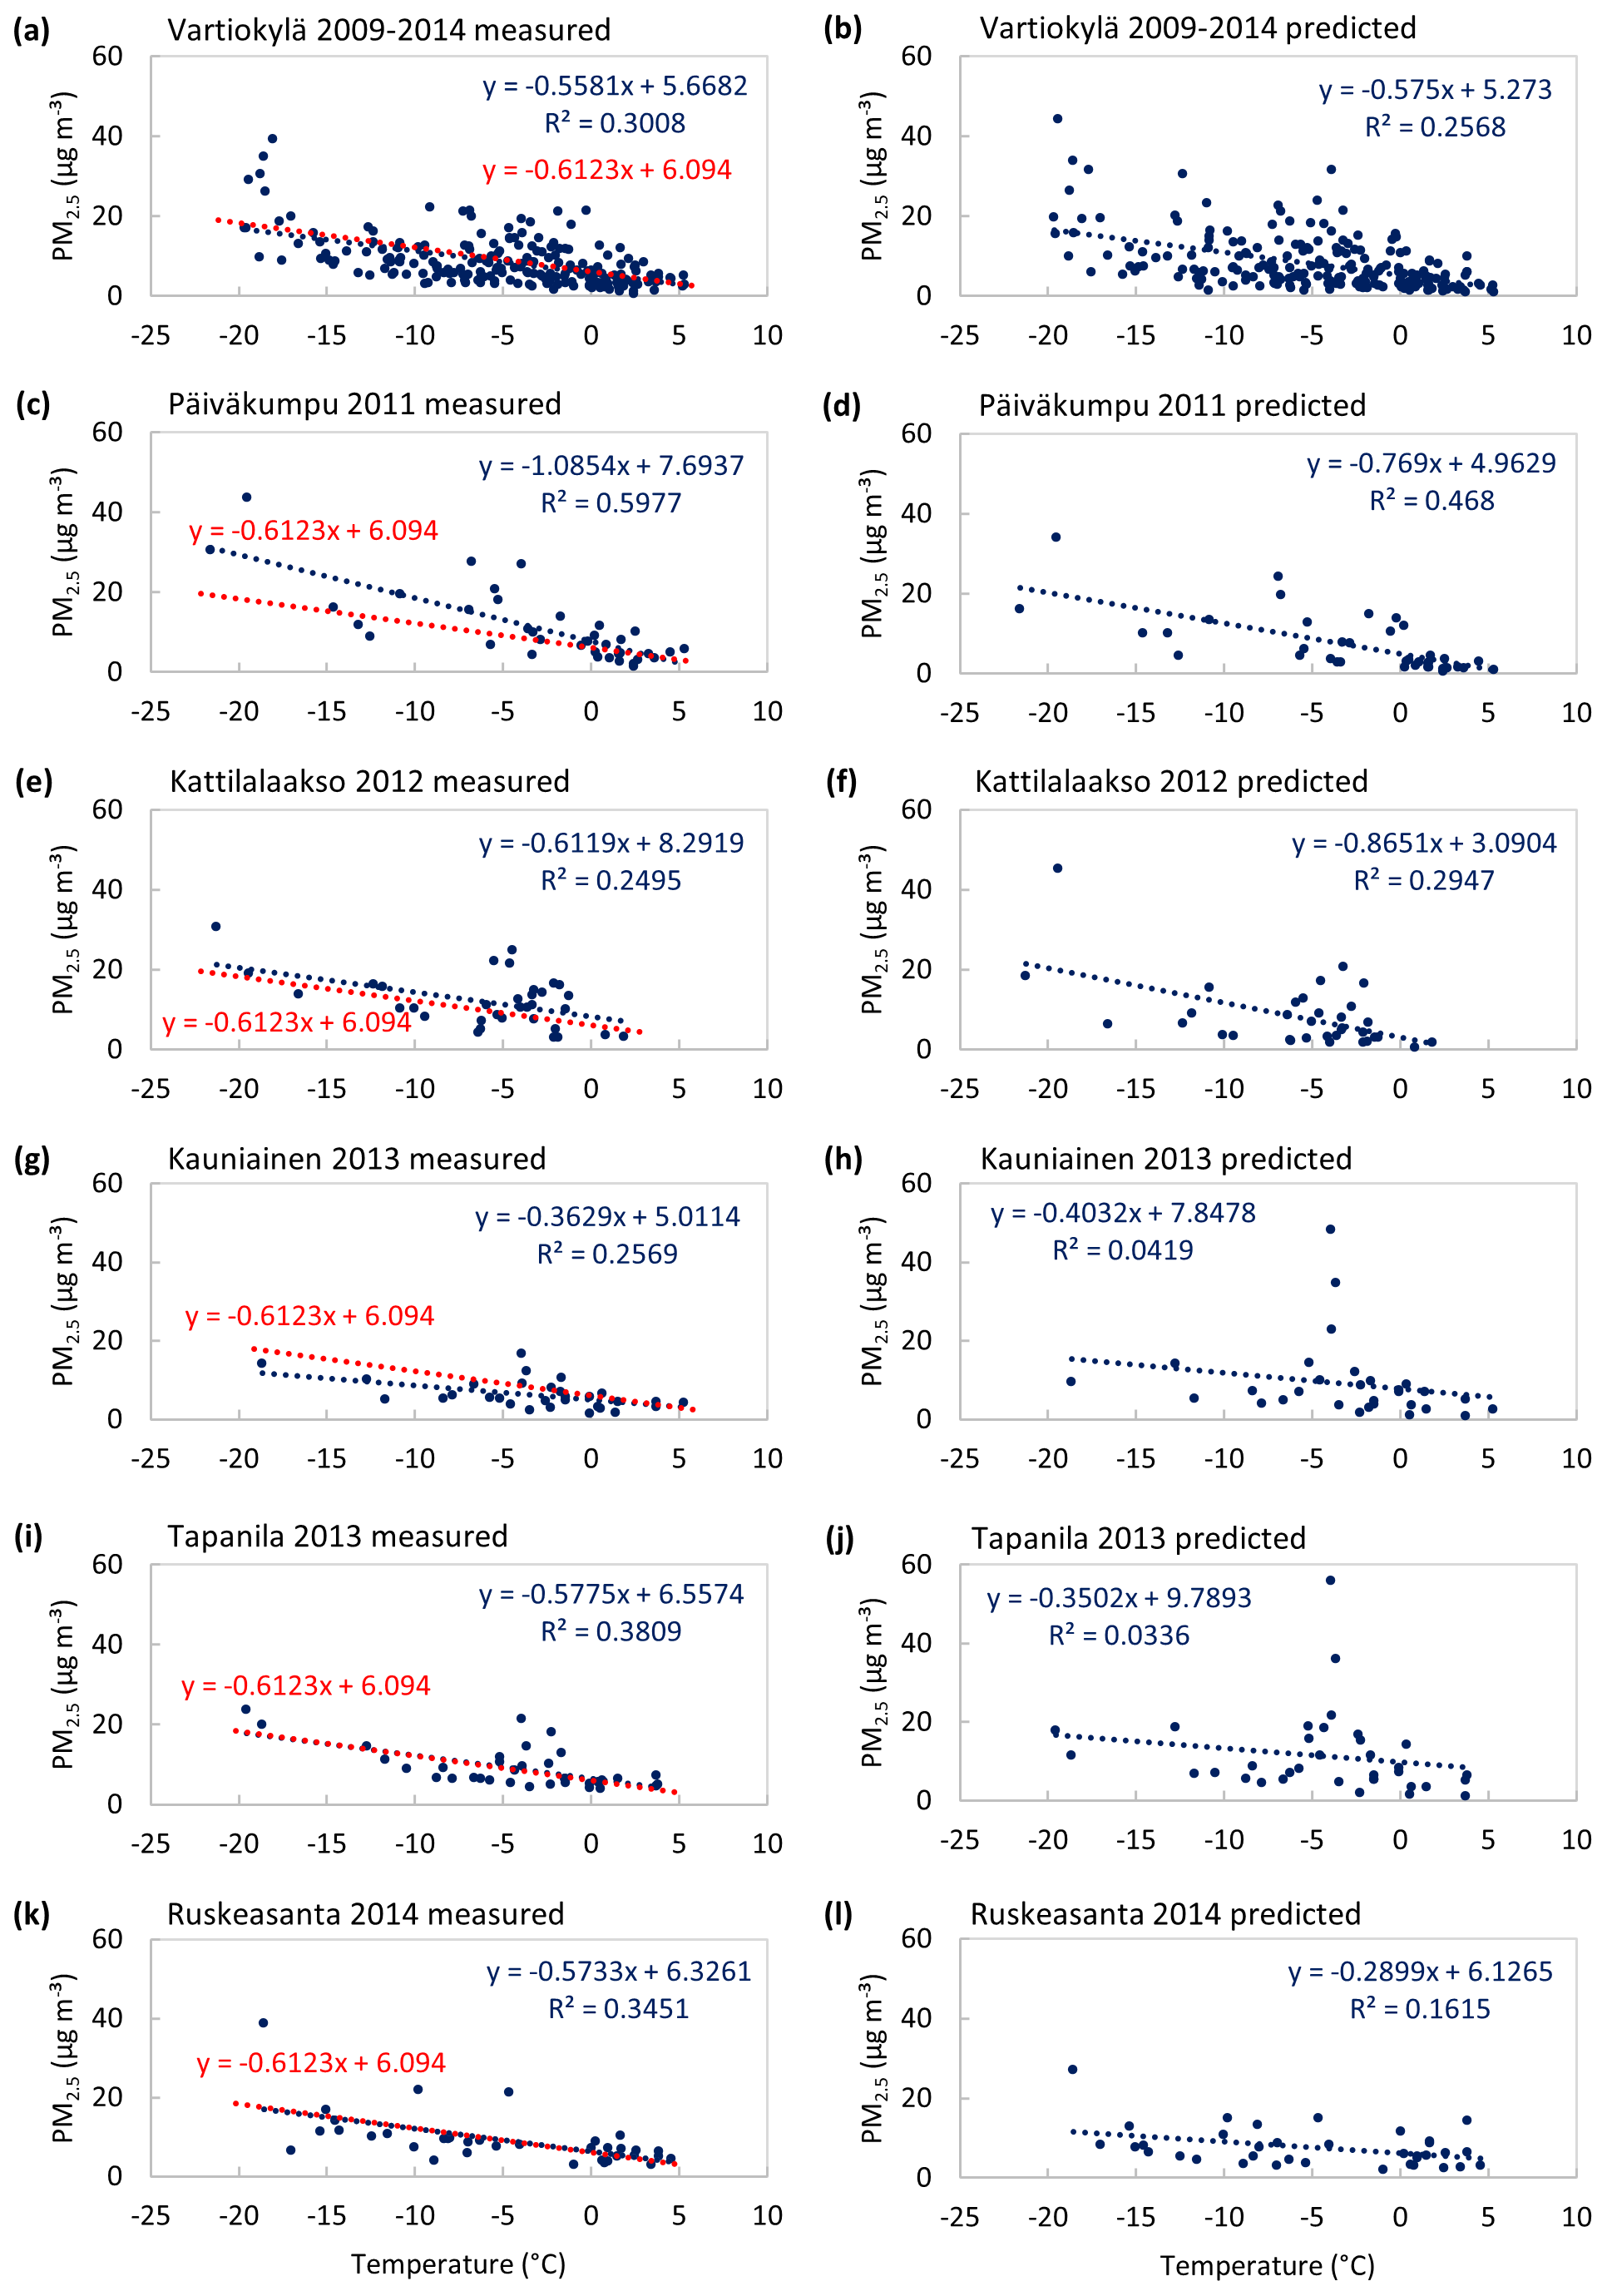
Figure 3Daily average measured (left-hand side panels) and predicted (right-hand side panels) concentrations as a function of the ambient temperature. The data have only been presented for the cases in which the contribution attributed to RWC was above the average value at the residential stations. The linear trends of data in each figure have been presented by the blue lines. The overall average trend of observed concentrations on temperature for all years and stations is presented by the red lines; this trend is therefore the same for all the panels on the left-hand side.
Both the measured and predicted daily averaged concentrations show increasing trends towards the lower-temperature values. The trends and the distribution of data points are similar for all the stations, both for the measured and predicted data. As expected, the observed concentrations were slightly better correlated with temperature than the predicted concentrations, with one exception (the residential site at Kattilalaakso).
We examined in detail several individual cases in which the predicted concentrations clearly differed from the measured values. As an example, there is a particularly clear difference at two residential stations (Tapanila and Kauniainen), at which excessively high daily concentrations (compared with the corresponding measured values) were predicted at a fairly cold ambient temperature of −4 ∘C. The reason for predicting such high concentration values in this particular case was connected to especially inefficient dilution of pollution during prevailing very low winds, combined with high predicted RWC emissions during a weekend. The observed concentrations at the time were not substantially elevated. These days corresponded to the local holiday week in winter, during which a large fraction of people are traditionally travelling, most of them outside of the metropolitan region. A detailed examination of the data revealed that there were also over-predictions of concentrations during other holiday periods. These results therefore provide evidence that the influence of the main holidays should be considered in modelling the temporal variation in RWC emissions.
3.2 Predicted spatial concentration distributions
The predicted spatial distributions of annual PM2.5 concentrations and those averaged for winter are presented in Fig. 4a–d for 2 years, 2009 and 2010. These concentrations include the contributions originating from both urban vehicular traffic and RWC and the regional background. We have chosen these 2 years to highlight the year-to-year variation in the RWC contributions. During the considered period (2009–2014), the concentrations of PM2.5 in winter originating from urban wood combustion were the lowest in 2009 and the highest in 2010.
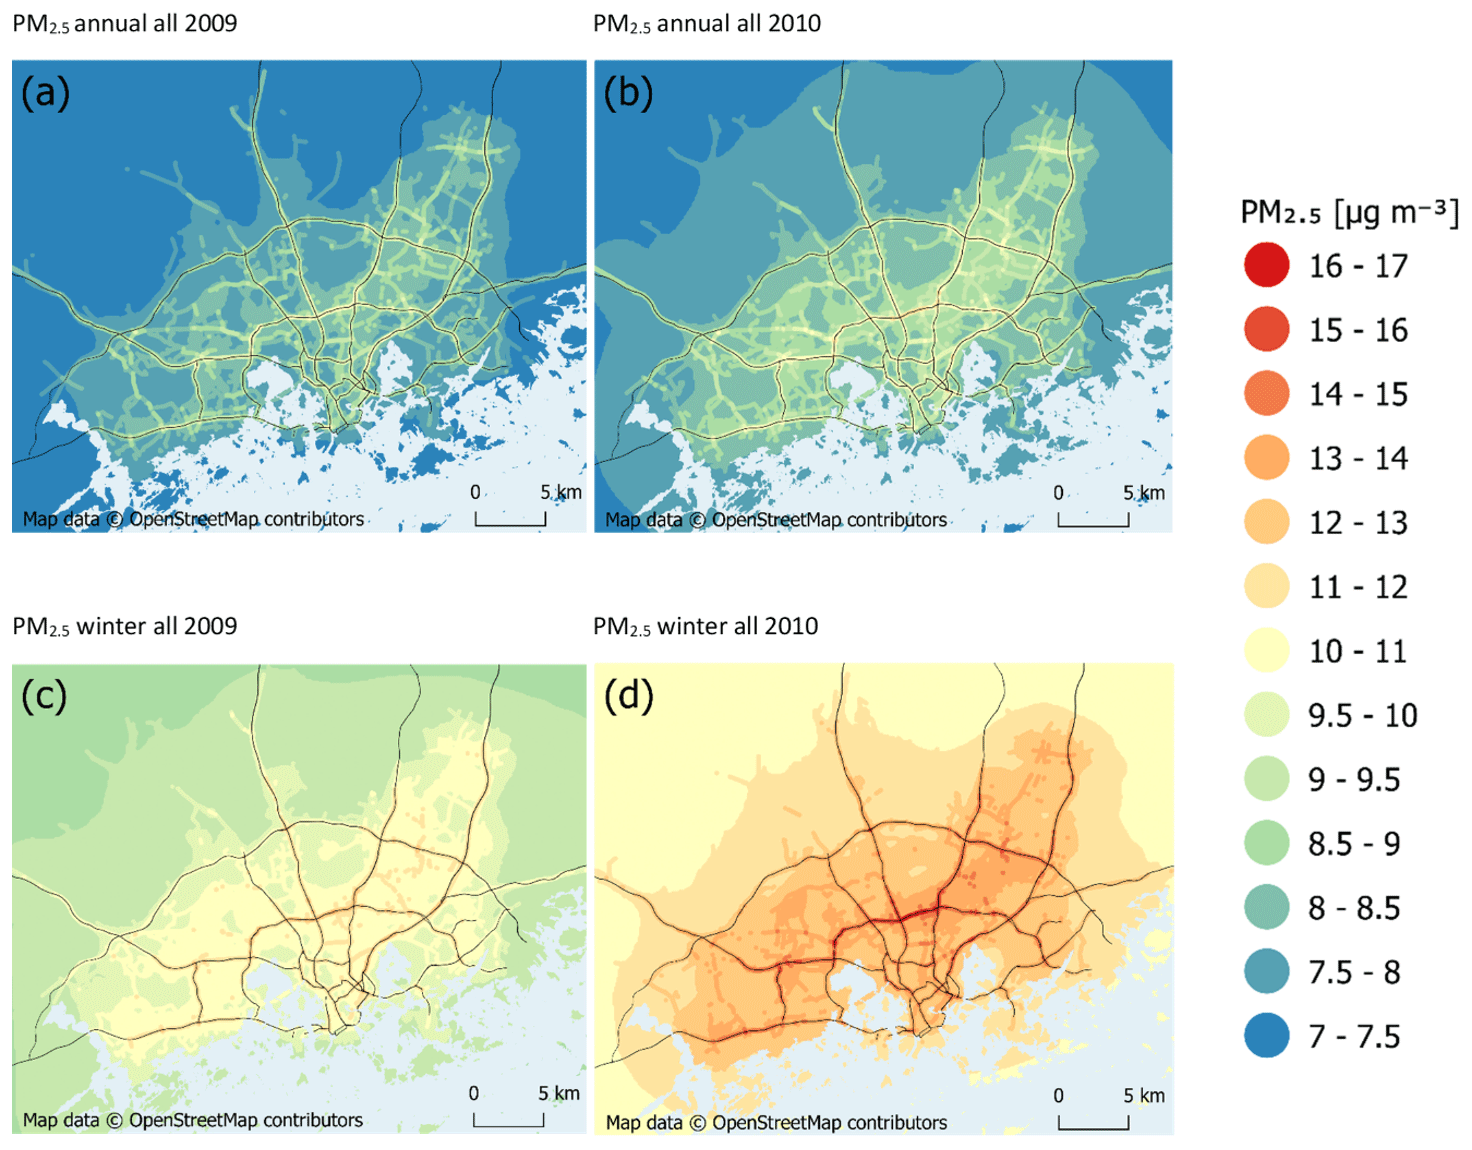
Figure 4The predicted average concentrations of PM2.5 (µg m−3) in the Helsinki region, as annual averages in (a) 2009 and (b) 2010 and as winter averages in (c) 2009 and (d) 2010. The main street and road network are presented with the black lines, and the sea areas are in a light-blue colour. The physical scales of figures are indicated by the bars on the lower right-hand sides of each panel. © OpenStreetMap contributors 2019. Distributed under the Open Data Commons Open Database License (ODbL) v1.0.
The centre of Helsinki is located on a peninsula, in the southern middle region of the maps. The highest annually averaged concentrations (Fig. 4a and b) occurred in the vicinity of major roads and streets and in the suburban residential areas to the northwest, north, and northeast of the city centre. The predicted annual average concentrations ranged from 7.2 to 11.0 and from 7.4 to 11.7 µg m−3 in 2009 and 2010, respectively.
The contribution from shipping and harbours is not included in the computed concentrations. According to Kukkonen et al. (2018) this contribution exceeds 10 % only in the immediate vicinity of major harbours in the centre of Helsinki and in the southeastern part of the area.
The modelling takes into account the seasonal variation in the RWC emissions using a semi-empirical variation function, which has been assumed to be the same for all the years. The differences in the predicted annual concentrations in different years are therefore mainly caused by (i) the different urban meteorological conditions in different years (affecting the atmospheric dispersion) and (ii) the different regional-background concentrations.
In winter (Fig. 4c and d), the corresponding average concentrations were higher for both years, and these were more focused on the residential areas. The differences in the annual and winter concentrations in each year are caused not only by a clear difference between background concentrations but also by the higher RWC contribution in winter. The concentrations in winter ranged from 8.9 to 13.1 µg m−3 in 2009 and from 10.5 to 16.4 µg m−3 in 2010.
In winter, the highest concentrations from RWC to PM2.5 were 1.7 and 2.8 µg m−3 in 2009 and 2010, respectively. In summer, the corresponding seasonal values were approximately 0.2 µg m−3 with a negligible variation between different years. Consequently, the average concentrations attributed to RWC in winter were up to 10- or 15-fold, compared to corresponding concentrations in summer in 2009 and 2010, respectively.
The relative fractions of the contribution of RWC to the PM2.5 concentrations are presented in Fig. 5a–d, as annual averages and in winter. The highest predicted fractions of RWC of the annual PM2.5 concentrations were 12 % and 14 % in 2009 and 2010, respectively. In winter, the highest average contributions were 16 % in 2009 and 21 % in 2010. In the city centre, the source contribution of RWC was low, due to almost negligible local emissions.
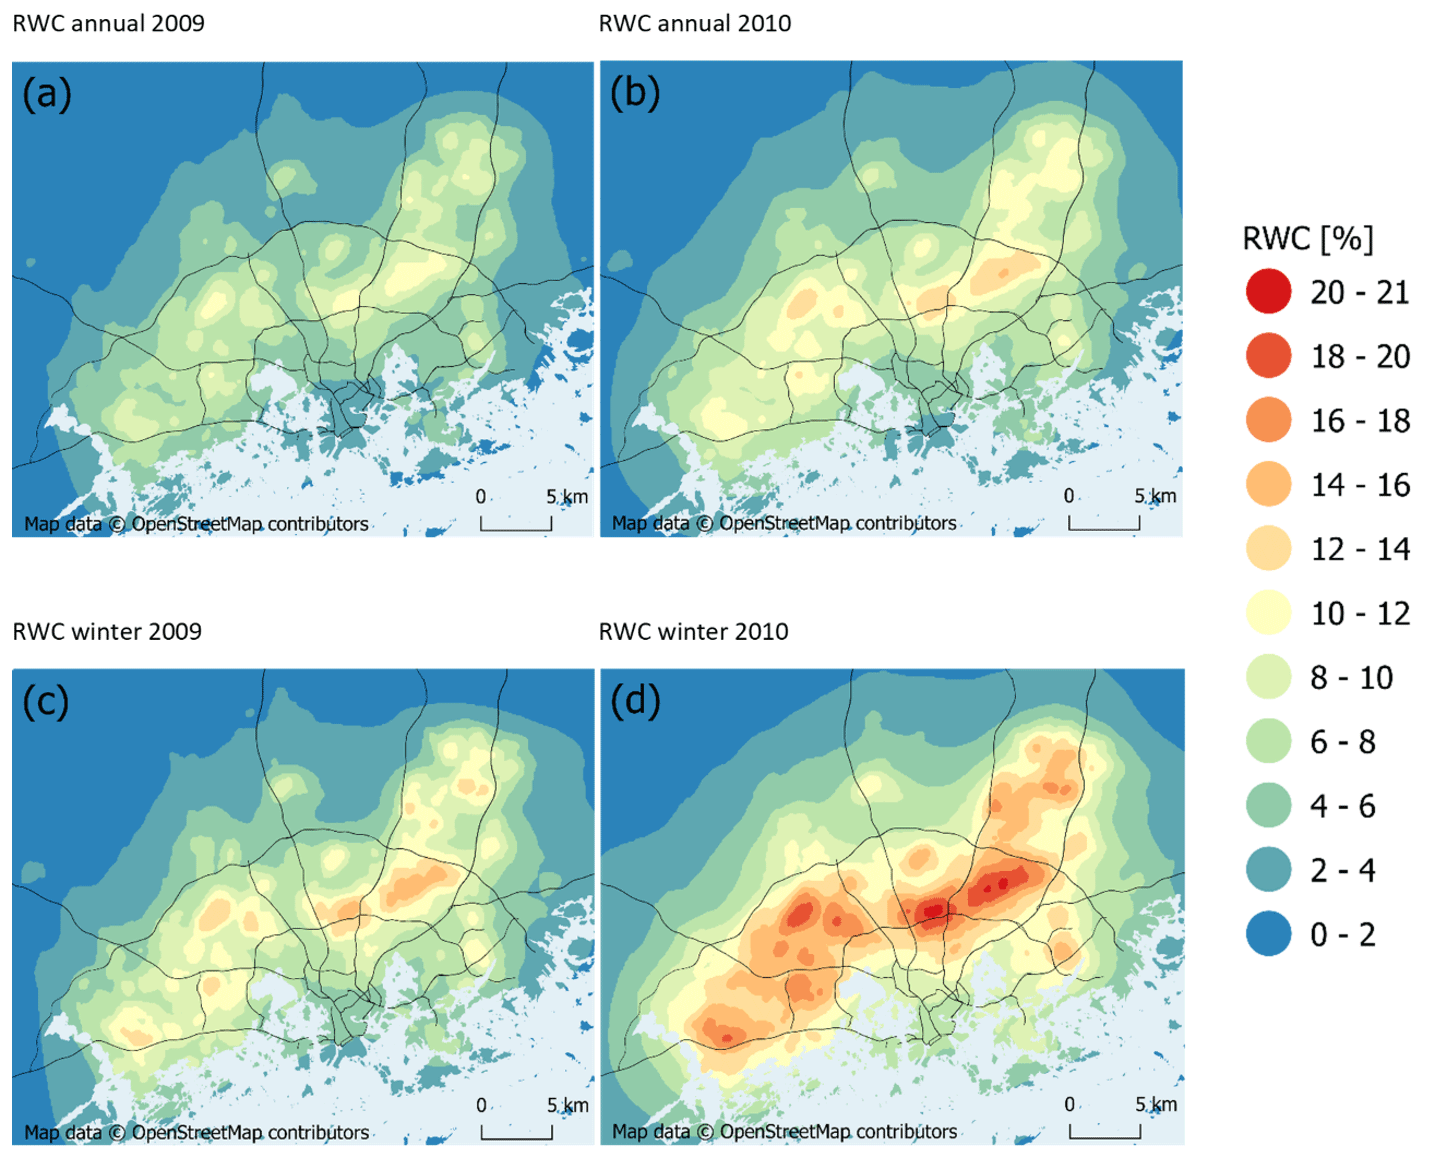
Figure 5Contribution of residential wood combustion to the concentrations of PM2.5 (a, b) annually and (c, d) in winter in 2009 and 2010 (%). © OpenStreetMap contributors 2019. Distributed under the Open Data Commons Open Database License (ODbL) v1.0.
3.3 Monthly average contributions from traffic and residential wood combustion
Predicted monthly concentrations, attributed to urban RWC and vehicular traffic are presented for measurement stations in Fig. 6a–c.
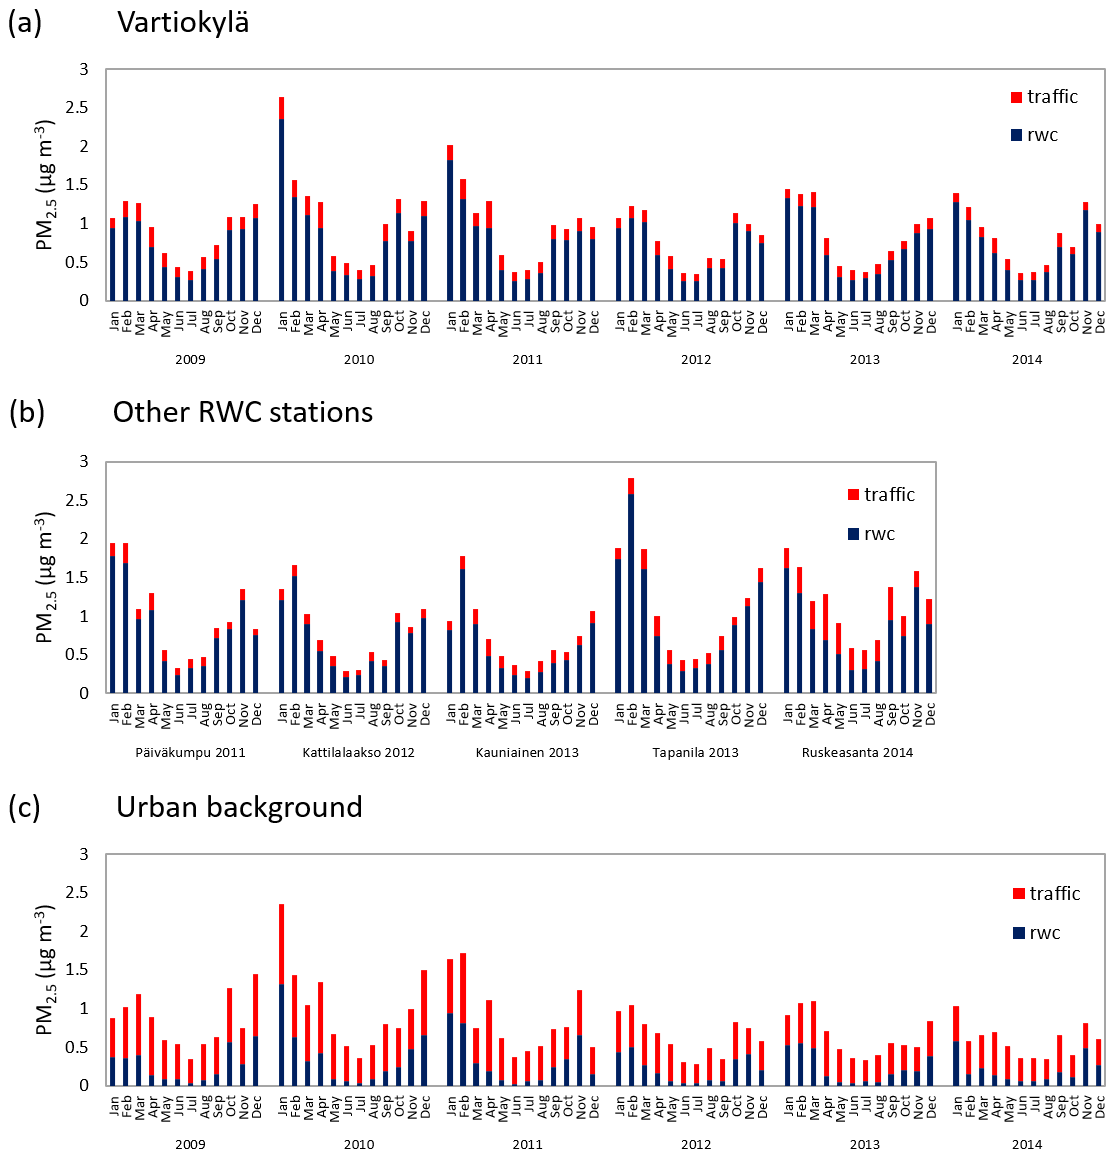
Figure 6Predicted monthly average concentrations originating from urban sources, attributed to urban vehicular traffic and residential wood combustion. The regional background has been excluded.
Clearly, the PM2.5 concentrations attributed to RWC were much higher in winter. In the case of vehicular traffic, the seasonal variation is moderate. The predicted time series for the permanent residential site (Vartiokylä) highlights the year-to-year variation, which is caused mainly by the differences in urban meteorological conditions.
At all the RWC stations during all years, the RWC contribution was higher than the corresponding vehicular traffic contribution for all the considered months. However, at one site (Ruskeasanta), the monthly average concentrations from traffic and RWC were comparable in summer; this was caused by the emissions from a heavily trafficked highway in the vicinity of the site. At the urban-background station in Kallio, the concentrations attributed to urban traffic were dominant.
Residential wood combustion (RWC) has been found to be an important source of fine particulate matter worldwide, and its relative significance has been projected to increase in the future. Previous studies have indicated that in the Helsinki metropolitan area (HMA), RWC has had a significant impact on the emissions and concentrations of PM2.5 (Kukkonen et al., 2018, 2020) and on public health (Orru et al., 2022). In the present study, we have substantially extended the previous analyses, by investigating in depth both the year-to-year and seasonal variations in the emissions and concentrations originating from RWC, based both on model computations and measurements.
The model performance against measured data was statistically evaluated at six residential monitoring stations and regional- and urban-background stations during a 6-year period. The overall agreement of predicted concentrations with measurements was good or fairly good for all stations and years. In more sparsely built residential areas the measurement stations seem to be more representative of a larger area than in more densely populated residential areas. The model performance was on the average better for the residential and urban-background sites, compared with the regional-background station. The interannual variation in the model performance was substantial, mainly caused by the changing weather conditions from year to year. The modelling of the emissions of RWC was based on semi-empirical temporal profiles, which were assumed to be the same for each year.
We also analysed the seasonal variation in the model performance. In particular, in winter, the concentrations especially at the residential stations were slightly over-predicted for some years, whereas there was some under-prediction for other years. This was probably caused by the inaccuracies due to the assumed semi-empirical seasonal variation in the RWC emissions, which did not take into account meteorological differences between years. The analysis regarding the monthly variation in the model performance showed, in particular, that the model under-predicted values in December at the residential sites. This was most likely caused by the traditional increased recreational wood burning and cooking by wood-burning stoves during the Christmas holiday season. The modelling did not allow for the specific influence of holidays on RWC.
As expected, at the residential sites, both the measured and predicted daily averaged concentrations were substantially higher at lower ambient temperature values. The higher concentrations were caused both by the increased RWC and the more frequent inefficient dispersion conditions during periods of prevailing low temperatures. In particular, it was found that there were some substantial model over-predictions during a local holiday week in winter. During that period, a large fraction of people traditionally travel, which has not been taken into account in the modelling. We conclude that holiday periods should be taken into account in the modelling of RWC. This conclusion was supported by the in-depth analysis of the observed and predicted concentrations for holidays weeks and other weeks, based on all the data during the considered 6-year period.
The highest predicted annually averaged concentrations in the Helsinki region occurred in the vicinity of major roads and streets and in the suburban residential areas to the northwest, north, and northeast of the city centre. In the city centre, the source contribution of RWC was low, due to almost negligible local emissions.
In winter, the concentrations were clearly higher than the annual average concentrations, and, as expected, the spatial distributions were more focused on the residential areas. The average concentrations attributed to RWC in winter were up to 10- or 15-fold, compared to corresponding concentrations in summer, in 2009 and 2010, respectively. The interannual variation in concentrations was considerable especially in winter.
The regional background is the largest contributor to the concentrations of PM2.5 in the HMA. During the considered 6-year period, the spatially highest predicted fractions of RWC of the annual PM2.5 concentrations ranged from 12 % to 14 %. In winter, the corresponding contributions ranged from 16 % to 21 %. At all the residential stations during all the considered years, the RWC contribution was higher than the corresponding contribution attributed to vehicular traffic, for all months of the year.
The study has highlighted some research needs for the future. It would be more accurate if the modelling of the RWC emissions would be directly based on the actual hourly meteorological parameters, especially the ambient temperatures. Clearly, this would necessitate a development of new semi-empirical, temperature-dependent temporal profile functions, regarding the variation in RWC emissions, on a daily, weekly, and seasonal basis. However, the variation in the ambient temperature is expected to be closely related to the use of heating boilers but probably not so closely related to the use of sauna stoves and fireplaces. The use of the latter two RWC source categories is more closely related to social habits and the convenience use of fireplaces.
The impacts of the most important holiday periods should also be taken into account in the modelling of the emissions originating from RWC. For this aim, one would need a more detailed survey of human activities, including especially the possible increased recreational use of fireplaces, and an evaluation of the fraction of people travelling during holidays.
The temporal variation functions for RWC emissions applied in the model are averages applied for all years, and they were determined separately for sauna stoves, boilers, and other fireplaces. With the exception of boilers, the functions were estimated by analysing the datasets based on questionnaires for the years 2008–2009 (Gröndahl et al., 2012), which included data on the monthly, daily, and hourly variation in RWC, and for the years 2013–2014 (Kaski et al., 2016), which included additional data on monthly variation. However, the number of boilers in the questionnaire was not adequate for estimating the seasonal variation, and it was therefore estimated based on monthly heating degree days and estimates for the amount of energy required for heating water. The temporal variation functions are presented in Fig. A1a–c.
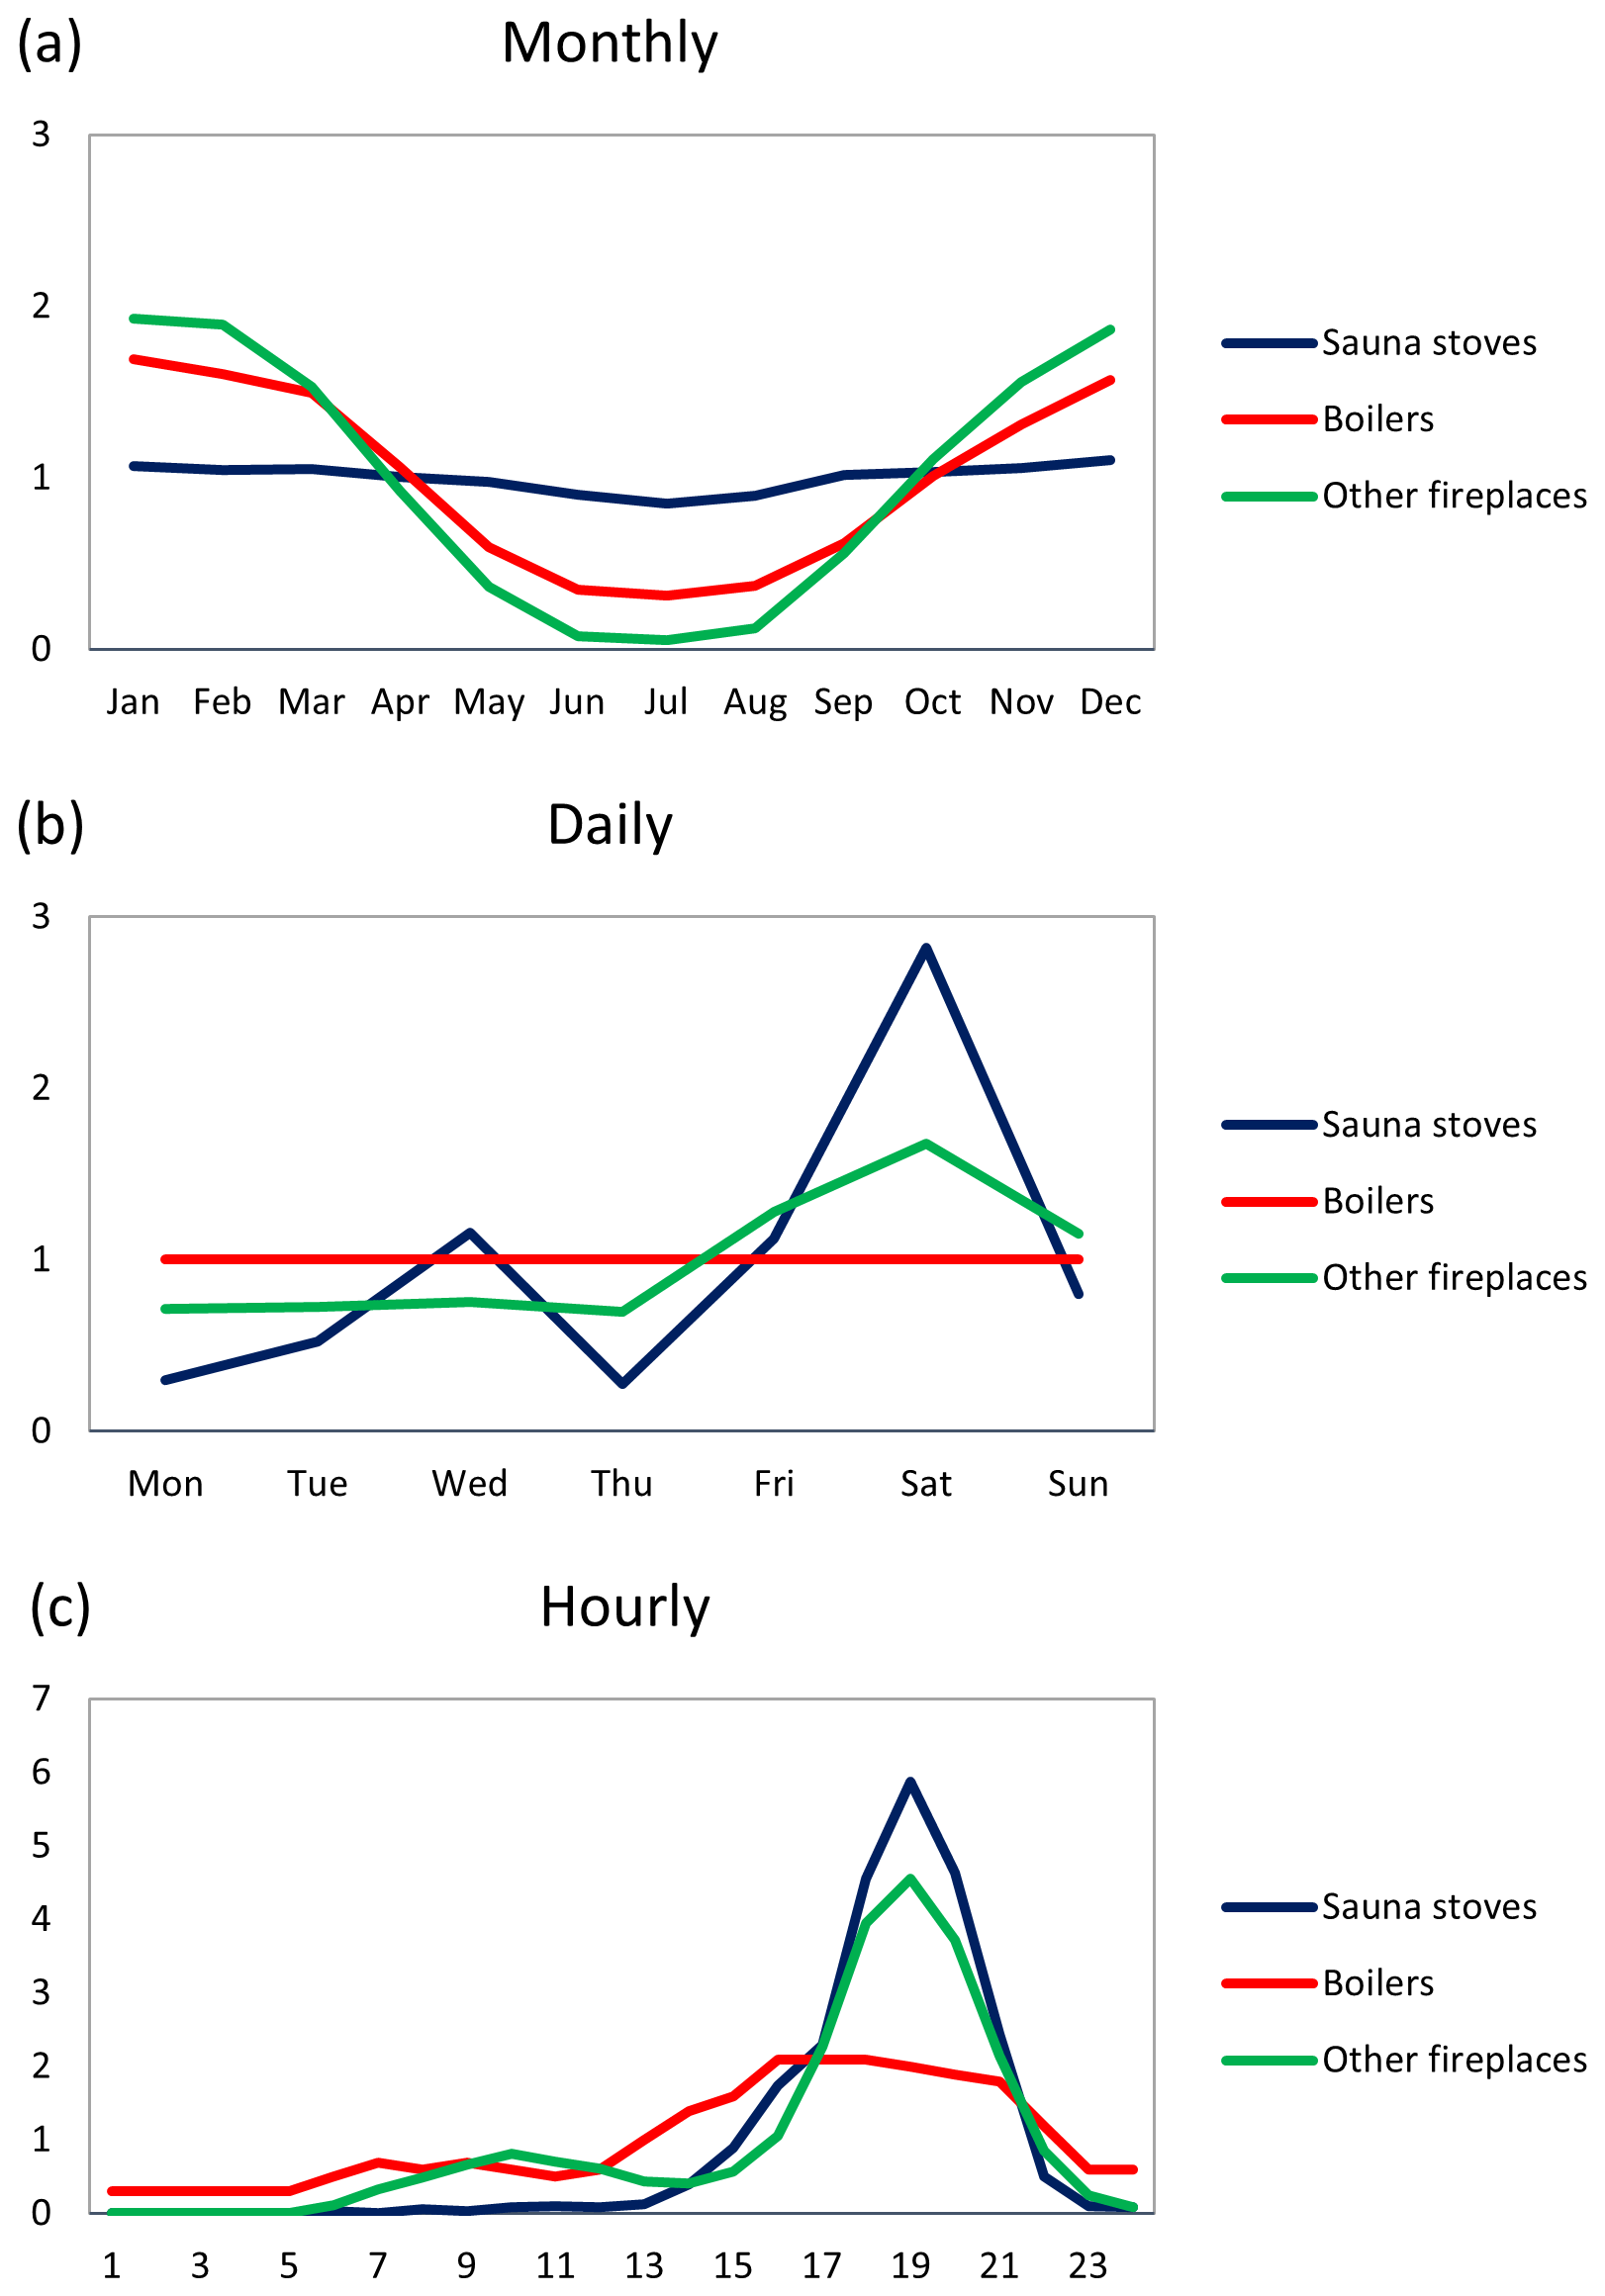
Figure A1Temporal monthly, daily, and hourly variation coefficients of the RWC emissions for the different categories of wood combustion.
This method of estimating the temporal variation in RWC deviates from the method of using an average variation based on the heating degree days. That method is applied in several air quality models; it is also used e.g. for the temporal profiles of the CAMS-TEMPO database (Guevara et al., 2021).
However, at least in the region addressed in the present study, the temporal variation in RWC emissions is significantly different for the various source categories of RWC. The majority of the RWC emissions in the Helsinki region originate from sauna stoves and recreational use of other fireplaces; neither of these is substantially dependent on the heating degree days. The temporal variation for the emissions originating from boilers could be modelled based on heating degree days; however, in this study we have chosen to apply the same temporal variation for all the considered years. The recreational use of other fireplaces could be partially dependent on the ambient temperature, but the available data regarding their usage were insufficient to estimate reliably this dependence.
We have examined the total amounts of emissions originating from RWC in the immediate vicinity (at distances from 50 to 150 m) of the measurement stations at the targeted residential areas. The results are presented in Fig. B1.
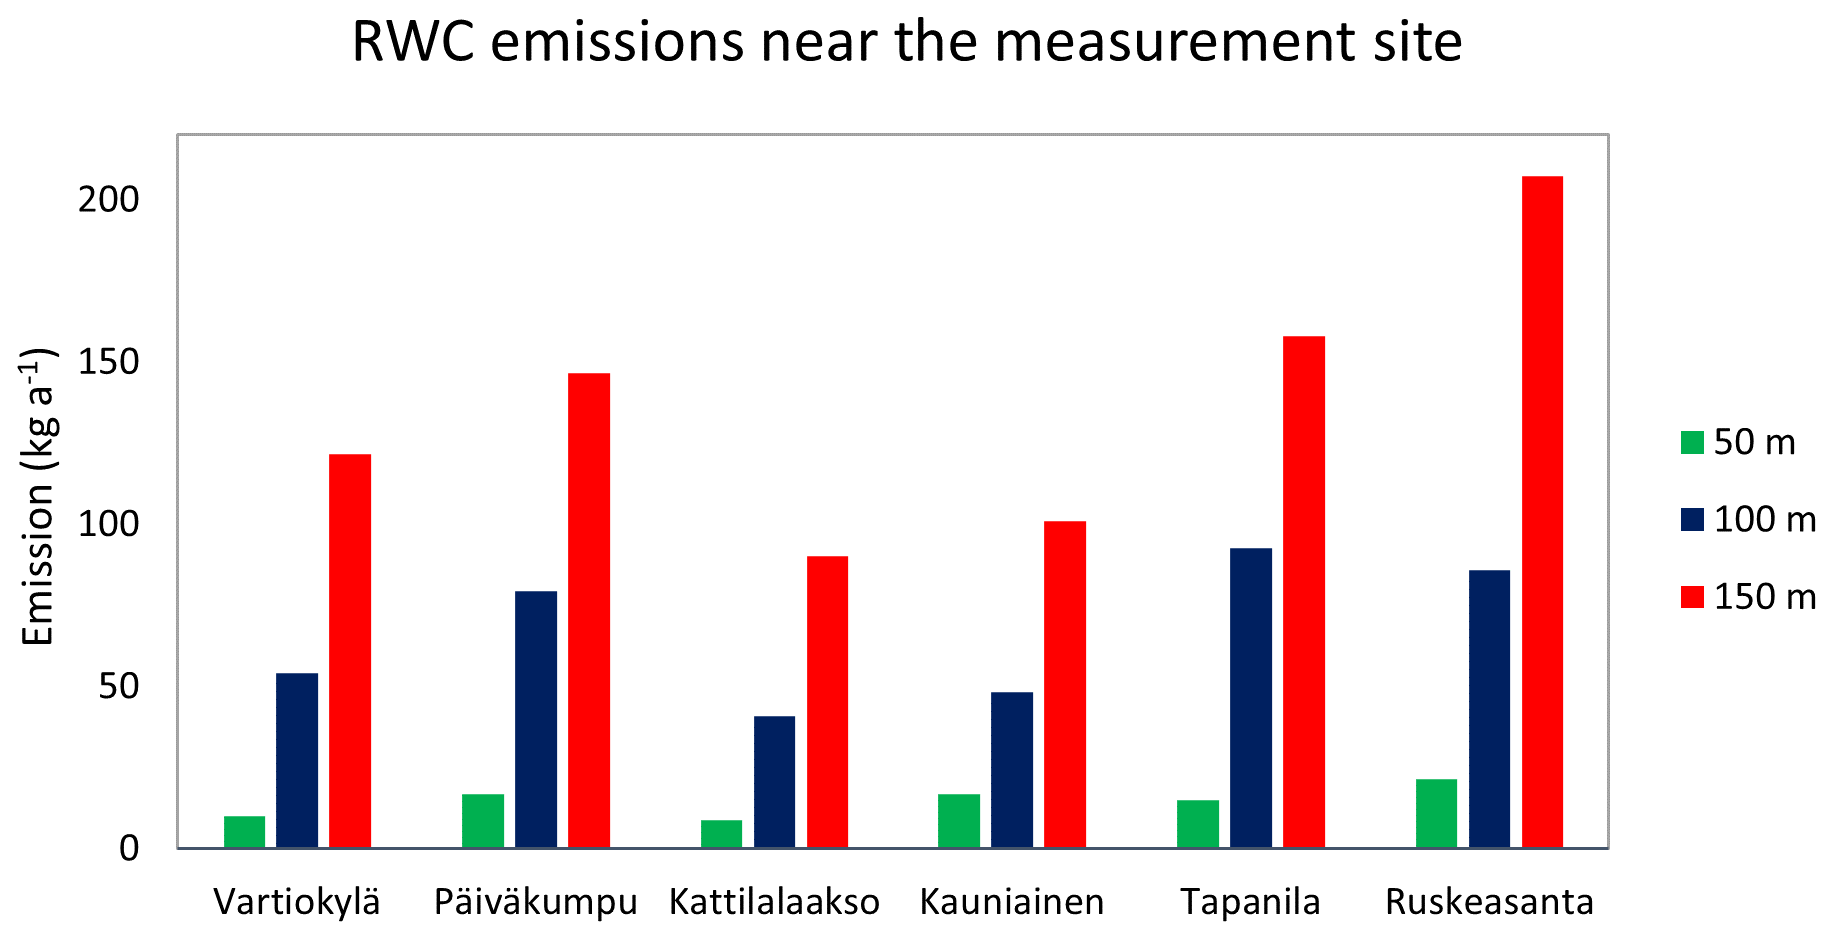
Figure B1The modelled total amounts of emissions originating from RWC near the residential measurement sites. The legend indicates different radial distances from the measurement site.
The considered stations are exposed to substantially varying amounts of emissions from RWC. For instance, at the site of Ruskeasanta, the amount of emissions within a radius of 150 m of the site was more than 2-fold compared to the those at stations located in less densely built areas.
We have examined the fractional bias values of the predicted and measured concentrations for the winter months, in terms of the ambient temperature. These results are presented in Figs. C1a and b and C2a and b.
The biases are presented against the ambient temperature, for each month. The results have been presented separately for the regional- and urban-background stations and for the permanent residential station of Vartiokylä. That was the only residential station which provided data for several years. For the permanent residential station, we have also compared the biases calculated for all data in winter with the biases, which were calculated after excluding the local holiday weeks.
There are slightly more over-predictions in case of the relatively warmer winters, for both the urban- and regional-background and residential stations. The applied seasonal variation function of the RWC emissions could therefore possibly be adjusted based on these results, in future research. During the holiday week in February, it is known that a large fraction of people are travelling, and the amount of wood combustion is therefore smaller than during other weeks. We conclude that in addition to the temperature dependence of the emissions from RWC, the impact of local holidays should be considered.
There have been mostly under-predictions in December at the residential sites. This may have been caused by the traditionally increased recreational wood burning and cooking during the Christmas holiday season. This under-prediction is not correlated with ambient temperature.
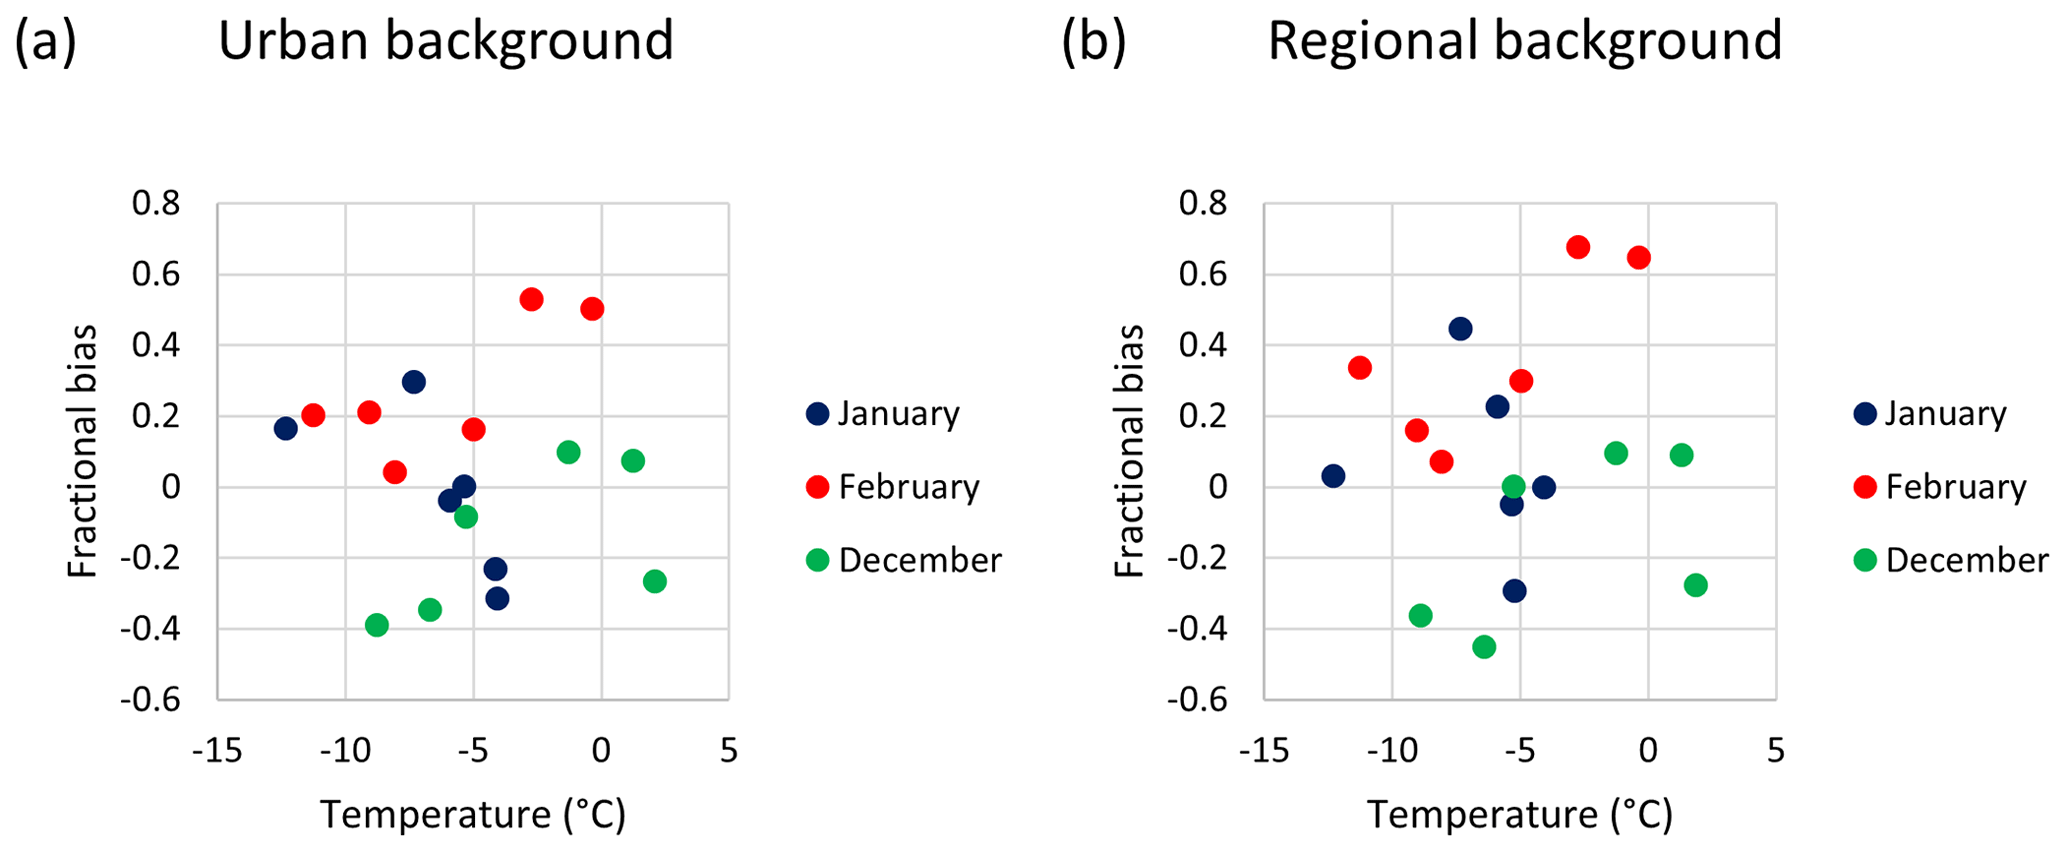
Figure C1Fractional bias of the computations for the winter months as a function of the ambient temperature for the (a) urban- and (b) regional-background stations. A positive bias corresponds to a model over-prediction. The data include all the years targeted in this study.
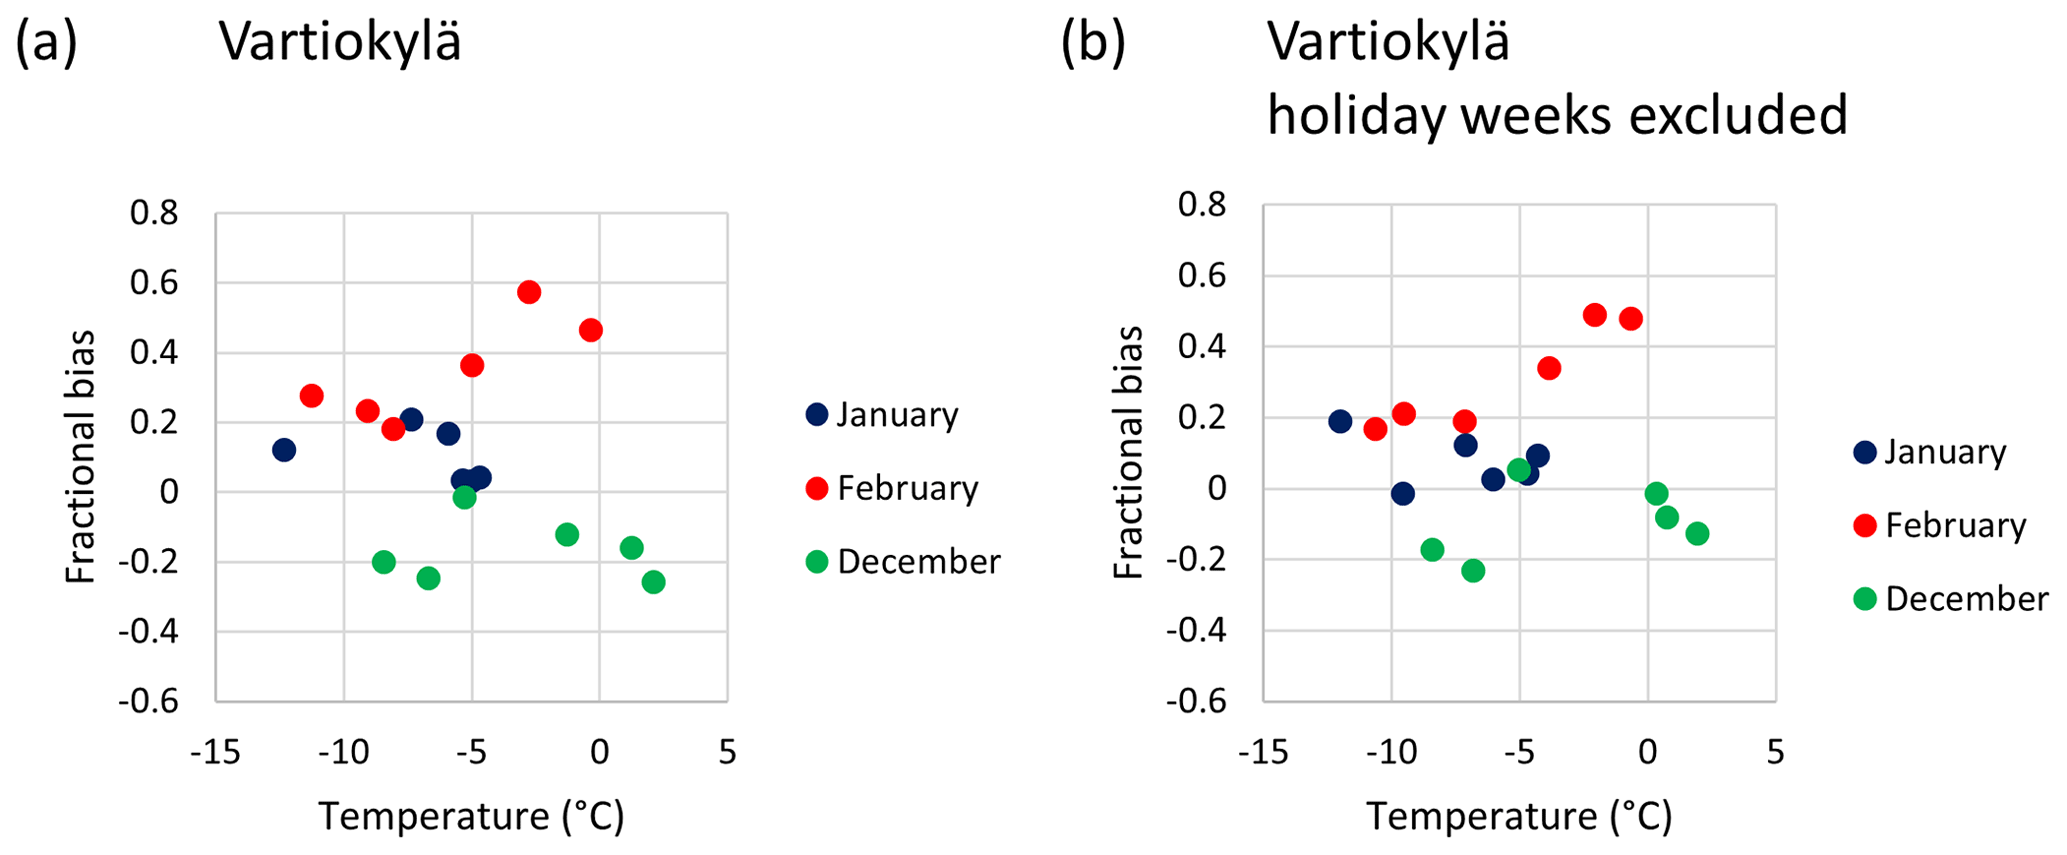
Figure C2Fractional bias of the computations for the winter months as a function of the ambient temperature for the permanent residential station of Vartiokylä. Panel (a) presents all the considered data, and panel (b) presents all the data except for that during the holiday weeks in winter. A positive bias corresponds to a model over-prediction. The data include all the years targeted in this study.
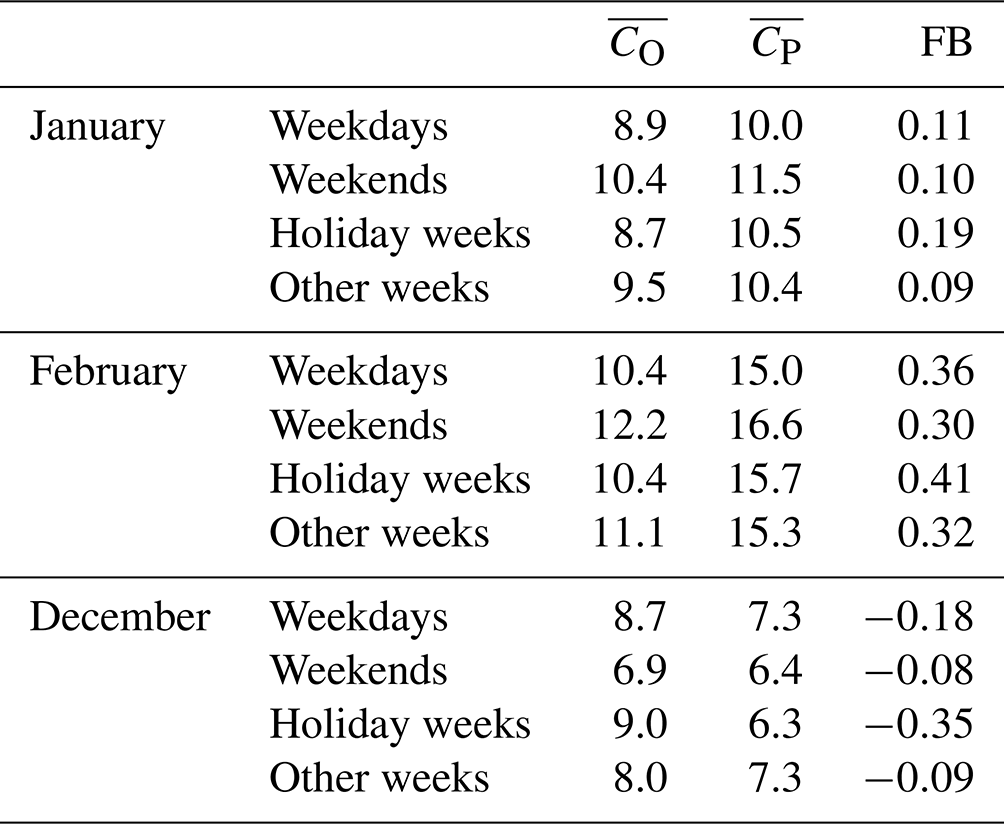
The average observed and predicted concentrations have also been compared separately for weekdays and weekends, as well as for holiday weeks and other weeks, for the 6-year period for the permanent residential station. This comparison is presented in Table C1. The holiday weeks were assumed to be the nationally observed holiday periods before and after the New Year, from 24 December to 6 January, and the school holiday week in February (this starts in southern Finland on Monday between 15 and 21 February), including the weekends before and after the holiday periods.
There is a clear difference in biases between weekdays and weekends. However, the differences in biases are especially high between holidays and non-holiday periods. In December, the concentrations are under-predicted, and the under-prediction is substantial particularly during the holiday week. In February, the concentrations are clearly over-predicted for the holiday week. The behaviour of the inhabitants in the area is probably different during these two holiday seasons: a large fraction of people are travelling during the holiday week in February, whereas the seasonal holidays including Christmas, especially in December, are spent more in homes, and the RWC emissions are therefore increased mainly due to recreational wood burning and cooking.
Table C1Observed and predicted 6-yearly average concentrations (µg m−3) and fractional biases for weekdays, weekends, holiday weeks, and other weeks for the permanent residential station (Vartiokylä). Parameters were calculated based on daily concentrations.
The measured and predicted concentration data are available by contacting the corresponding author of this article (leena.kangas@fmi.fi). The SILAM code is available at https://doi.org/10.5281/zenodo.5713862 (Kouznetsov, 2024).
LK, JK, and ArK: planning the research goals; LK: urban-scale model computations, evaluation and statistical analysis of the model results, writing the original draft of the article; JK: revision of the text, discussion of the results; MK: contribution to emission and measurement datasets; KR: contribution to post-processing and analysis of concentration data; MS: SILAM model computations; AnK and JVN: compilation of the RWC emission inventory for the Helsinki metropolitan area. All authors reviewed and commented on the manuscript.
The contact author has declared that none of the authors has any competing interests.
This work reflects only the authors' view, and the Innovation and Networks Executive Agency is not responsible for any use that may be made of the information it contains.
Publisher's note: Copernicus Publications remains neutral with regard to jurisdictional claims made in the text, published maps, institutional affiliations, or any other geographical representation in this paper. While Copernicus Publications makes every effort to include appropriate place names, the final responsibility lies with the authors.
This activity has received funding from the European Union's Horizon 2020 research and innovation programme (EXHAUSTION project).
We would also like to thank for the funding of NordForsk under the Nordic initiative on Health and Welfare (NordicWelfAir – Understanding the link between Air pollution and Distribution of related Health Impacts and Welfare in the Nordic countries). The funding of the Academy of Finland for the project Global health risks related to atmospheric composition and weather (GLORIA) is also acknowledged.
This research has been supported by the European Union's Horizon 2020 research and innovation programme (grant no. 820655; EXHAUSTION), by the NordForsk (grant no. 75007; NordicWelfAir), and by the Academy of Finland (grant no. 310373; GLORIA).
This paper was edited by Samara Carbone and reviewed by two anonymous referees.
Aarnio, M. A., Kukkonen, J., Kangas, L., Kauhaniemi, M., Kousa, A., Hendriks, C., Yli-Tuomi, T., Lanki, T., Hoek, G., Brunekreef, B., Elolähde, T., and Karppinen, A.: Modelling of particulate matter concentrations and source contributions in the Helsinki Metropolitan Area in 2008 and 2010, Boreal Environ. Res., 21, 445–460, 2016.
Ahtoniemi, P., Tainio, M., Tuomisto, J. T., Karvosenoja, N., Kupiainen, K., Porvari, P., Karppinen, A., Kangas, L., and Kukkonen, J.: Health risks from nearby sources of fine particulate matter: Domestic wood combustion and road traffic (PILTTI), National Institute for Health and Welfare, Report 3/2010, https://urn.fi/URN:NBN:fi-fe201205085050 (last access: 23 January 2024), 2010.
Amann, M., Cofala, J., Klimont, Z., Nagl, C., and Schieder, W.: Measures to address air pollution from small combustion sources, Report under Specific Agreement 11 under Framework Contract ENV. C.3/FRA/2013/00131 of DG-Environment of the European Commission, available from the Clean Air Outlook site http://ec.europa.eu/environment/air/clean_air/outlook.htm (last access: 23 January 2024), 2018.
Andersen, S. P., Allen, B., and Domingo, G. C.: Biomass in the EU Green Deal: Towards consensus on the use of biomass for EU bioenergy. Policy report, Institute for European Environmental Policy (IEEP), https://ieep.eu/publications/biomass- in-the-eu-green-deal-towards-consensus-on-sustainable-use-of- biomass-for-eu-bioenergy/ (last access: 23 January 2024), 2021.
Anenberg, S. C., Henze, D. K., Tinney, V., Kinney, P. L., Raich, W., Fann, N., Malley, C. S., Roman, H., Lamsal, L., Duncan, B., Martin, R. V., van Donkelaar, A., Brauer, M., Doherty, R., Jonson, J. E., Davila, Y., Sudo, K., and Kuylenstierna, J. C. I.: Estimates of the Global Burden of Ambient PM2.5, Ozone, and NO2 on Asthma Incidence and Emergency Room Visits, Environ. Health Persp., 126, 107004, https://doi.org/10.1289/EHP3766, 2018.
Belis, C. A., Karagulian, F., Larsen, B. R., and Hopke, P. K.: Critical review and meta-analysis of ambient particulate matter source apportionment using receptor models in Europe, Atmos. Environ., 69, 94–108, https://doi.org/10.1016/j.atmosenv.2012.11.009, 2013.
Bertelsen, N. and Mathiesen, B. V.: EU-28 Residential Heat Supply and Consumption: Historical Development and Status, Energies, 13, 1894, https://doi.org/10.3390/en13081894, 2020.
Bonjour, S., Adair-Rohani, H., Wolf, J., Bruce, N. G., Mehta, S., Prüss-Ustün, A., Lahiff, M., Rehfuess, E. A., Mishra, V., and Smith, K. R.: Solid Fuel Use for Household Cooking: Country and Regional Estimates for 1980–2010, Environ. Health Persp., 121, 784–790, https://doi.org/10.1289/ehp.1205987, 2013.
Chang, J. C. and Hanna, S. R.: Air quality performance evaluation, Meteorol. Atmos. Phys., 87, 167–196, https://doi.org/10.1007/s00703-003-0070-7, 2004.
Cohen, A. J., Brauer, M., Burnett, R., Anderson, H. R., Frostad, J., Estep, K., Balakrishnan, K., Brunekreef, B., Dandona, L., Dandona, R., Feigin, V., Freedman, G., Hubbell, B., Jobling, A., Kan, H., Knibbs, L., Liu, Y., Martin, R., Morawska, L., Pope III, C. A., Shin, H., Straif, K., Shaddick, G., Thomas, M., van Dingenen, R., van Donkelaar, A., Vos, T., Murray, C. J. L., and Forouzanfar, M. H.: Estimates and 25 year trends of the global burden of disease attributable to ambient air pollution: an analysis of data from the Global Burden of Diseases Study 2015, Lancet, 389, 1907–1918, https://doi.org/10.1016/S0140-6736(17)30505-6, 2017.
Couvidat, F., Lopez-Aparicio, S., Schucht, S., Real, E., and Grythe, H.: Development of Renewable Energy and its Impact on Air Quality. Co-benefits and Trade-Offs, Eionet Report – ETC/ATNI 2020/6, European Environment Agency, https://www.eionet.europa.eu/etcs/all-etc-reports (last access: 23 January 2024), 2021.
Denier van der Gon, H. A. C., Bergström, R., Fountoukis, C., Johansson, C., Pandis, S. N., Simpson, D., and Visschedijk, A. J. H.: Particulate emissions from residential wood combustion in Europe – revised estimates and an evaluation, Atmos. Chem. Phys., 15, 6503–6519, https://doi.org/10.5194/acp-15-6503-2015, 2015.
Eurostat: https://ec.europa.eu/eurostat/databrowser/view/ten00125/default/line?lang=en, last access: 7 November 2023.
Fernandes, S. D., Trautmann, N. M., Streets, D. G., Roden, C. A., and Bond, T. C.: Global biofuel use, 1850–2000, Global Biogeochem. Cy., 21, GB2019, https://doi.org/10.1029/2006GB002836, 2007.
Gröndahl, T., Makkonen, J., Myllynen, M., Niemi, J., and Tuomi, S.: Tulisijojen käyttö ja päästöt pääkaupunkiseudun pientaloista (The use of fireplaces and the emissions from detached-houses in the Helsinki Metropolitan Area), HSY Publications, Helsinki, 39 pp., 2012 (in Finnish).
Guevara, M., Jorba, O., Tena, C., Denier van der Gon, H., Kuenen, J., Elguindi, N., Darras, S., Granier, C., and Pérez García-Pando, C.: Copernicus Atmosphere Monitoring Service TEMPOral profiles (CAMS-TEMPO): global and European emission temporal profile maps for atmospheric chemistry modelling, Earth Syst. Sci. Data, 13, 367–404, https://doi.org/10.5194/essd-13-367-2021, 2021.
Hannuniemi, H., Salmi, J., Rasila, T., Wemberg, A., Komppula, B., Lovén, K., and Pietarila, H.: Pääkaupunkiseudun päästöjen leviämismalliselvitys. Autoliikenteen, energiantuotannon, laivaliikenteen ja lentoliikenteen typenoksidi-, pienhiukkas- ja rikkidioksidipäästöjen leviämismallinnus (Study of the dispersion of emissions in the Helsinki Metropolitan Area. Dispersion modelling of nitrogen oxides, fine particulate matter and sulphur dioxide emissions from road transport, energy production, shipping, and aviation), Finnish Meteorological Institute, Expert Services, Air Quality and Energy, https://www.ilmatieteenlaitos.fi/1.-kaupunkien-ilmanlaatututkimuksia (last access: 23 January 2024), 2016 (in Finnish).
Härkönen, J.: Regulatory dispersion modelling of traffic-originated pollution, Finnish Meteorological Institute, Contributions No. 38, http://urn.fi/URN:ISBN:952-10-0815-6 (last access: 23 January 2024), 2002.
Helen Ltd: https://www.helen.fi/en/about-us/energy/future-energy/biolampolaitokset/vuosaari-bioenergy-heating-plant, last access: 7 November 2023.
Hellén, H., Kangas, L., Kousa, A., Vestenius, M., Teinilä, K., Karppinen, A., Kukkonen, J., and Niemi, J. V.: Evaluation of the impact of wood combustion on benzo[a]pyrene (BaP) concentrations; ambient measurements and dispersion modeling in Helsinki, Finland, Atmos. Chem. Phys., 17, 3475–3487, https://doi.org/10.5194/acp-17-3475-2017, 2017.
Horne, B. D., Joy, E. A., Hofmann, M. G., Gesteland, P. H., Cannon, J. H., Lefler, J. S., Blagev, D. P., Korgenski, E. K., Torosyan, N., Hansen, G. I., Kartchner, D., and Pope III, C. A.: Short-Term Elevation of Fine Particulate Matter Air Pollution and Acute Lower Respiratory Infection, Am. J. Resp. Crit. Care, 198, 759–766, https://doi.org/10.1164/rccm.201709-1883OC, 2018.
HSL: Helsingin seudun työssäkäyntialueen liikenne-ennustemallit 2010 (Traffic forecast models for the Helsinki Region Commuting Area 2010), HSL Helsinki Region Transport, HSL Publications 33/2011, Helsinki, ISBN 978-952-253-125-4, 2011 (in Finnish).
Jokinen, P., Pirinen, P., Kaukoranta, J.-P., Kangas, A., Alenius, P., Eriksson, P., Johansson, M., and Wilkman, S.: Climatological and oceanographic statistics of Finland 1991–2020, Finnish Meteorological Institute, Reports 2021:8, https://doi.org/10.35614/isbn.9789523361485, 2021.
Karagulian, F., Belis, C. A., Dora, C. F. C., Prüss-Ustün, A. M., Bonjour, S., Adair-Rohani, H., and Amann, M.: Contributions to cities' ambient particulate matter (PM): A systematic review of local source contributions at global level, Atmos. Environ., 120, 475–483, https://doi.org/10.1016/j.atmosenv.2015.08.087, 2015.
Karppinen, A., Kukkonen, J., Nordlund, G., Rantakrans, E., and Valkama, I.: A dispersion modelling system for urban air pollution, Finnish Meteorological Institute, Publications on Air Quality 28, Helsinki, ISBN 951-697-480-5, 1998.
Karppinen, A., Joffre, S. M., and Kukkonen, J.: The refinement of a meteorological preprocessor for the urban environment, Int. J. Environ. Pollut., 14, 565–572, 2000a.
Karppinen, A., Kukkonen, J., Elolähde, T., Konttinen, M., and Koskentalo, T.: A modelling system for predicting urban air pollution: comparison of model predictions with the data of an urban measurement network, Atmos. Environ., 34, 3735–3743, 2000b.
Karppinen, A., Kukkonen, J., Elolähde, T., Konttinen, M., Koskentalo, T., and Rantakrans, E.: A modelling system for predicting urban air pollution: model description and applications in the Helsinki metropolitan area, Atmos. Environ., 34, 3723–3733, 2000c.
Kaski, N., Vuorio, K., Niemi, J., Myllynen, M., and Kousa, A.: Tulisijojen käyttö ja päästöt pääkaupunkiseudulla vuonna 2014 (Use of fireplaces; emissions in the Helsinki Metropolitan Area in 2014), Helsinki Region Environmental Services Authority HSY, HSY publications 2/2016, Helsinki, ISBN 978-952-7146-08-8, 2016 (in Finnish).
Kauhaniemi, M., Karppinen, A., Härkönen, J., Kousa, A., Alaviippola, B., Koskentalo, T., Aarnio, P., Elolähde, T., and Kukkonen, J.: Evaluation of a modelling system for predicting the concentrations of PM2.5 in an urban area, Atmos. Environ., 42, 4517–4529, https://doi.org/10.1016/j.atmosenv.2008.01.071, 2008.
Kauhaniemi, M., Kukkonen, J., Härkönen, J., Nikmo, J., Kangas, L., Omstedt, G., Ketzel, M., Kousa, A., Haakana, M., and Karppinen, A.: Evaluation of a road dust suspension model for predicting the concentrations of PM10 in a street canyon, Atmos. Environ., 45, 3646–3654, https://doi.org/10.1016/j.atmosenv.2011.04.055, 2011.
Kauhaniemi, M., Stojiljkovic, A., Pirjola, L., Karppinen, A., Härkönen, J., Kupiainen, K., Kangas, L., Aarnio, M. A., Omstedt, G., Denby, B. R., and Kukkonen, J.: Comparison of the predictions of two road dust emission models with the measurements of a mobile van, Atmos. Chem. Phys., 14, 9155–9169, https://doi.org/10.5194/acp-14-9155-2014, 2014.
Klimont, Z., Kupiainen, K., Heyes, C., Purohit, P., Cofala, J., Rafaj, P., Borken-Kleefeld, J., and Schöpp, W.: Global anthropogenic emissions of particulate matter including black carbon, Atmos. Chem. Phys., 17, 8681–8723, https://doi.org/10.5194/acp-17-8681-2017, 2017.
Korhonen, S., Loukkola, K., Portin, H., and Niemi, J.: Ilmanlaatu pääkaupunkiseudulla vuonna 2021 – Vuosiraportti (Air quality in Helsinki Metropolitan Area in 2021 – annual report), Helsinki Region Environmental Services Authority HSY, HSY Publications 3/2022, ISBN 978-952-7146-65-1, 2022 (in Finnish).
Korhonen, S., Loukkola, K., Portin, H., and Niemi, J.: Ilmanlaatu pääkaupunkiseudulla vuonna 2022 (Air quality in Helsinki Metropolitan Area in 2022), Helsinki Region Environmental Services Authority HSY, HSY Publications 1/2023, ISBN 978-952-7146-67-5, 2023 (in Finnish).
Kouznetsov, R.: fmidev/silam-model, Zenodo [code], https://doi.org/10.5281/zenodo.5713862, 2024.
Kukkonen, J., Härkönen, J., Walden, J., Karppinen, A., and Lusa, K.: Evaluation of the CAR-FMI model against measurements near a major road, Atmos. Environ., 35, 949–960, 2001.
Kukkonen, J., Kangas, L., Kauhaniemi, M., Sofiev, M., Aarnio, M., Jaakkola, J. J. K., Kousa, A., and Karppinen, A.: Modelling of the urban concentrations of PM2.5 on a high resolution for a period of 35 years, for the assessment of lifetime exposure and health effects, Atmos. Chem. Phys., 18, 8041–8064, https://doi.org/10.5194/acp-18-8041-2018, 2018.
Kukkonen, J., López-Aparicio, S., Segersson, D., Geels, C., Kangas, L., Kauhaniemi, M., Maragkidou, A., Jensen, A., Assmuth, T., Karppinen, A., Sofiev, M., Hellén, H., Riikonen, K., Nikmo, J., Kousa, A., Niemi, J. V., Karvosenoja, N., Santos, G. S., Sundvor, I., Im, U., Christensen, J. H., Nielsen, O.-K., Plejdrup, M. S., Nøjgaard, J. K., Omstedt, G., Andersson, C., Forsberg, B., and Brandt, J.: The influence of residential wood combustion on the concentrations of PM2.5 in four Nordic cities, Atmos. Chem. Phys., 20, 4333–4365, https://doi.org/10.5194/acp-20-4333-2020, 2020.
Lelieved, J., Pozzer, A., Pöschl, U., Fnais, M., Haines, A., and Münzel, T.: Loss of life expectancy from air pollution compared to other risk factors: a worldwide perspective, Cardiovasc. Res., 116, 1910–1917, https://doi.org/10.1093/cvr/cvaa025, 2020.
Li, J., Sun, S., Tang, R., Qiu, H., Huang, Q., Mason, T. G., and Tian, L.: Major air pollutants and risk of COPD exacerbations: a systematic review and meta-analysis, Int. J. Chronic Obstr., 11, 3079–3091, https://doi.org/10.2147/COPD.S122282, 2016.
Mäkelä, K. and Auvinen, H.: LIPASTO – transport emission database, in: Life Cycle Assessment of Products and Technologies, VTT Technical Research Centre of Finland, VTT Symposium 262, Espoo, Finland, 6 October 2009, 134–142, ISBN 978-951-38-7586-2, 2009.
Malkki, M. and Loukkola, K.: Ilmanlaatu pääkaupunkiseudulla vuonna 2014 (Air Quality in the Helsinki Metropolitan Area in 2014), Helsinki Region Environmental Services Authority HSY, HSY publications 6/2015, ISBN 978-952-6604-98-5, 2015 (in Finnish).
Ohtonen, K., Savolahti, M., Anttila, P., Vainio-Mattila, B., and Liljaniemi, P.: First update of the national air pollution control programme 2030, Publications of the Ministry of the Environment 2023:24, http://urn.fi/URN:ISBN:978-952-361-426-0 (last access: 23 January 2024), 2023.
Orru, H., Olstrup, H., Kukkonen, J., López-Aparizio, S., Segersson, D., Geels, C., Tamm, T., Riikonen, K., Maragkidou, A., Sigsgaard, T., Brandt, J., Grythe, H., and Forsberg, B.: Health impacts of PM2.5 originating from residential wood combustion in four nordic cities, BMC Public Health, 22, 1286, https://doi.org/10.1186/s12889-022-13622-x, 2022.
Perrone, M. G., Larsen, B. R., Ferrero, L., Sangiorgi, G., De Gennaro, G., Udisti, R., Zangrando, R., Gambaro, A., and Bolzacchini, E.: Sources of high PM2.5 concentrations in Milan, Northern Italy: Molecular marker data and CMB modelling, Sci. Total Environ., 414, 343–355, https://doi.org/10.1016/j.scitotenv.2011.11.026, 2012.
Pope III, C. A. and Dockery, D. W.: Health Effects of Fine Particulate Air Pollution: Lines that Connect, J. Air Waste Manage., 56, 709–742, https://doi.org/10.1080/10473289.2006.10464485, 2006.
Pope III, C. A., Coleman, N., Pond, Z. A., and Burnett, R. T.: Fine particulate air pollution and human mortality: 25+ years of cohort studies, Environ. Res., 183, 108924, https://doi.org/10.1016/j.envres.2019.108924, 2020.
Prank, M., Sofiev, M., Tsyro, S., Hendriks, C., Semeena, V., Vazhappilly Francis, X., Butler, T., Denier van der Gon, H., Friedrich, R., Hendricks, J., Kong, X., Lawrence, M., Righi, M., Samaras, Z., Sausen, R., Kukkonen, J., and Sokhi, R.: Evaluation of the performance of four chemical transport models in predicting the aerosol chemical composition in Europe in 2005, Atmos. Chem. Phys., 16, 6041–6070, https://doi.org/10.5194/acp-16-6041-2016, 2016.
Savolahti, M.: Climate and Health Impacts of Residential Wood Combustion in Finland, Aalto University publication series, Doctoral dissertations 32/2020, http://urn.fi/URN:ISBN:978-952-60-8966-9 (last access: 23 January 2024), 2020.
Savolahti, M., Karvosenoja, N., Tissari, J., Kupiainen, K., Sippula, O., and Jokiniemi, J.: Black carbon and fine particle emissions in Finnish residential wood combustion: Emission projections, reduction measures and the impact of combustion practices, Atmos. Environ., 140, 495–505, https://doi.org/10.1016/j.atmosenv.2016.06.023, 2016.
Sikkema, R., Proskurina, S., Banja, M., and Vakkilainen, E.: How can solid biomass contribute to the EU's renewable energy targets in 2020, 2030 and what are the GHG drivers and safeguards in energy- and forestry sectors?, Renew. Energ., 165, 758–772, https://doi.org/10.1016/j.renene.2020.11.047, 2021.
Singh, V., Sokhi, R., and Kukkonen, J.: PM2.5 concentrations in London for 2008 – A modeling analysis of contributions from road traffic, J. Air Waste Manage., 64, 509–518, https://doi.org/10.1080/10962247.2013.848244, 2014.
Soares, J., Kousa, A., Kukkonen, J., Matilainen, L., Kangas, L., Kauhaniemi, M., Riikonen, K., Jalkanen, J.-P., Rasila, T., Hänninen, O., Koskentalo, T., Aarnio, M., Hendriks, C., and Karppinen, A.: Refinement of a model for evaluating the population exposure in an urban area, Geosci. Model Dev., 7, 1855–1872, https://doi.org/10.5194/gmd-7-1855-2014, 2014.
Sofiev, M., Siljamo, P., Valkama, I., Ilvonen, M., and Kukkonen, J.: A dispersion modelling system SILAM and its evaluation against ETEX data, Atmos. Environ., 40, 674–685, https://doi.org/10.1016/j.atmosenv.2005.09.069, 2006.
Sofiev, M., Vira, J., Kouznetsov, R., Prank, M., Soares, J., and Genikhovich, E.: Construction of the SILAM Eulerian atmospheric dispersion model based on the advection algorithm of Michael Galperin, Geosci. Model Dev., 8, 3497–3522, https://doi.org/10.5194/gmd-8-3497-2015, 2015.
Srimath, S. T. G., Sokhi, R., Karppinen, A., Singh, V., and Kukkonen, J.: Evaluation of an urban modelling system against three measurement campaigns in London and Birmingham, Atmos. Pollut. Res., 8, 38–55, https://doi.org/10.1016/j.apr.2016.07.004, 2017.
Teinilä, K., Timonen, H., Aurela, M., Kuula, J., Rönkkö, T., Hellén, H., Loukkola, K., Kousa, A., Niemi, J. V., and Saarikoski, S.: Characterization of particle sources and comparison of different particle metrics in an urban detached housing area, Finland, Atmos. Environ., 272, 118939, https://doi.org/10.1016/j.atmosenv.2022.118939, 2022.
Trompetter, W. J., Davy, P. K., and Markwitz, A.: Influence of environmental conditions on carbonaceous particle concentrations within New Zealand, J. Aerosol Sci., 41, 134–142, https://doi.org/10.1016/j.jaerosci.2009.11.003, 2010.
van Ulden, A. P. and Holtslag, A. A. M.: Estimation of Atmospheric Boundary Layer Parameters for Diffusion Applications, J. Clim. Appl. Meteorol., 24, 1196–1207, 1985.
Viana, M., Alastuey, A., Querol, X., Guerreiro, C., Vogt, M., Colette, A., Collet, S., Albinet, A., Fraboulet, I., Lacome, J.-M., Tognet, F., and de Leeuw, F.: Contribution of residential combustion to ambient air pollution and greenhouse gas emissions, European Topic Centre on Air Pollution and Climate Change Mitigation, ETC/ACM Technical Paper 2015/1, https://www.eionet.europa.eu/etcs/all-etc-reports (last access: 23 January 2024), 2015.
Waldén, J., Hillamo, R., Aurela, M., Mäkelä, T., and Laurila, S.: Demonstration of the equivalence of PM2.5 and PM10 measurement methods in Helsinki 2007–2008, Finnish Meteorological Institute, Studies No. 3, ISBN 978-951-697-726-6, 2010.
WHO, Regional Office for Europe: Residential heating with wood and coal: health impacts and policy options in Europe and North America, World Health Organization, Regional Office for Europe, https://apps.who.int/iris/handle/10665/153671 (last access: 23 January 2024), 2015.
WHO: Burning opportunity: clean household energy for health, sustainable development, and wellbeing of women and children, World Health Organization, https://apps.who.int/iris/handle/10665/204717 (last access: 23 January 2024), 2016.
Willmott, C. J.: On the validation of models, Phys. Geogr., 2, 184–194, 1981.
- Abstract
- Introduction
- Methods
- Results and discussion
- Conclusions
- Appendix A: The modelled temporal variation in RWC emissions
- Appendix B: Evaluation of the representativity of the residential measurement stations
- Appendix C: Comparison of monthly and long-term averaged concentrations in winter
- Code and data availability
- Author contributions
- Competing interests
- Disclaimer
- Acknowledgements
- Financial support
- Review statement
- References