the Creative Commons Attribution 4.0 License.
the Creative Commons Attribution 4.0 License.
Lidar measurements of noctilucent clouds at Río Grande, Tierra del Fuego, Argentina
Bernd Kaifler
Markus Rapp
Guiping Liu
Diego Janches
Gerd Baumgarten
Jose-Luis Hormaechea
Noctilucent clouds (NLCs) are sensitive tracers of upper-mesospheric temperature, water vapor, and dynamics and thus open windows to study our atmosphere from very large to very small scales, including topics of climate, circulation, waves, and turbulence. NLCs are weaker in the Southern Hemisphere compared to the Northern Hemisphere where there are numerous observations, but no vertical soundings at Southern Hemisphere mid-latitudes were available until now. We determine the properties of NLCs above a Southern Hemisphere mid-latitude site at 53.8° S in southern Argentina. The Compact Rayleigh Autonomous Lidar has provided high-resolution vertical lidar soundings since 2017. Noctilucent clouds are detected every summer, with the earliest (latest) detection on 29 November (29 January), giving 19 events in total of 33.8 h length at an average height of 83.3 km, a maximum brightness of 24 × 10−10 , an occurrence rate of 7 %, and a maximum in the morning hours (05:00–07:00 UTC, i.e., 02:00–04:00 LT). The latter coincides with a positive amplitude of the semi-diurnal tide of the meridional wind as measured by the Southern Argentina Agile Meteor Radar. The ambient temperature above the site is on average too high to support local ice formation. We find no correlation with the solar flux; indeed, the latest season of 2023/2024 shows the most NLC detections. This leaves transport from more southerly and colder regions and potentially increasing upper-mesospheric water vapor levels as a result of increasing space traffic as possible explanations for the occurrence and unexpectedly large brightness of NLCs above Río Grande.
- Article
(4553 KB) - Full-text XML
- BibTeX
- EndNote
Noctilucent clouds (NLCs) were discovered at Northern Hemisphere mid-latitudes by visual observation of the horizon in twilight conditions (Backhouse, 1885; Jesse, 1885; Leslie, 1885; Tseraskii, 1887). Ground-based camera networks were very successful in systematically observing the skies for the occurrence of noctilucent clouds (Witt, 1962; Fogle and Haurwitz, 1966; Dalin et al., 2008; Dubietis et al., 2010). A century after the initial observations, measurements with satellite instruments and ground-based lidars confirmed the peak occurrence and brightness of the ice clouds poleward of the polar circle (Olivero and Thomas, 1986; Hansen et al., 1989), where they remain invisible to ground-based observers in the polar daylight. Historical observations from the Southern Hemisphere are rare and limited to the reports by Jesse (1889), Fogle (1965), and Fogle and Haurwitz (1966) from Punta Arenas located at the southern tip of South America, the only landmass within the 50 to 60° latitude band of the Southern Hemisphere except for small and remote islands. Satellite and lidar soundings of NLCs above Antarctica revealed significantly higher altitudes, lower brightness, and lower occurrence compared to soundings from conjugate latitudes in the Northern Hemisphere (Gardner et al., 2001; Chu et al., 2003, 2006; Bailey et al., 2007; Lübken and Berger, 2007; Chu et al., 2011; Hervig et al., 2013), making ground-based observations of NLCs in the Southern Hemisphere even more challenging. The formation of NLCs sensitively depends on temperature and the available water vapor (Hervig et al., 2016), making them a potential indicator of climate change (Thomas, 1996). Establishing long-term trends, however, requires careful analysis of data sets and correction of varying responses of NLCs to the solar cycle and planetary waves (DeLand et al., 2003; Kirkwood and Stebel, 2003; Gerding et al., 2013a; Russell III et al., 2014; Hervig et al., 2019). Although with the rise of digital cameras amateur reports from Europe and North America are now numerous, studies of long-term ground-based and satellite records found no general long-term trend (Kirkwood et al., 2008; Dubietis et al., 2010; Pertsev et al., 2014; Zalcik et al., 2014, 2016; Dalin et al., 2020). In the summer of 2009, mid-latitude NLCs were caused by meridional transport of cooler polar air masses to mid-latitudes by means of tidal winds, sometimes influenced by planetary wave activity (e.g., Nielsen et al., 2011; Hultgren et al., 2011). In one case of a NLC detected by lidar at 48° N in Germany in 2016, NLC particles were likely transported confined within the cold phases of a gravity wave that propagated from higher latitudes to the observation site in an upper-mesospheric duct generated by a 2 d planetary wave (Kaifler et al., 2018). Another mechanism that is discussed is the direct injection of water vapor into the lower thermosphere by the exhaust of orbital rockets, which can be transported within few days over large distances (Siskind et al., 2003; Stevens et al., 2005a; Dalin et al., 2013).
The development of the Compact Rayleigh Autonomous lidar (CORAL) at the Deutsches Zentrum für Luft- und Raumfahrt (DLR) made it possible to deploy powerful lidar systems for middle atmosphere research to locations worldwide without the need for sophisticated local infrastructure and availability of on-site operators (Kaifler and Kaifler, 2021). With the purpose of studying gravity waves within the stratospheric hotspot of South America, the CORAL system was deployed to Río Grande, Tierra del Fuego, Argentina (53.8° S, 67.8° W, 18 m above sea level), in November 2017 (Kaifler et al., 2020). This site in the lee of the Andes is often free of tropospheric clouds and thus provides better observation conditions than sites at the western coast of South America or on the Antarctic Peninsula. Prior to the deployment, no recent NLC observations were known from this latitude. So the detection of NLCs by the CORAL instrument was rather unexpected, given that NLCs observed in ground-based images are typically located 500 to 1000 km poleward of the observation site. After the first detection of NLCs by CORAL, we installed ground-based cameras in 2019 for potential joint observations of NLCs above Tierra del Fuego. The instruments are described in Sect. 2. In Sect. 3.1, we present the set of NLC detections obtained with the CORAL instrument during seven summer seasons since November 2017, as well as simultaneous and additional detections of NLCs in images of the ground-based cameras (Sect. 3.2). To characterize the thermal background, we analyze lidar temperature measurements in the upper mesosphere in Sect. 3.3. The NLC parameters of height and brightness are discussed in Sect. 4.1, and possible mechanisms facilitating the occurrence of NLCs at mid-latitudes, considering meridional winds, tides, and planetary waves based on observations provided by the co-located Southern Argentina Agile Meteor Radar (SAAMER), are explored in Sect. 4.2. We discuss influences on the start of the NLC season and intra-annual and interannual variations in the occurrence rate in Sect. 4.3 before concluding in Sect. 5.
2.1 CORAL lidar
The CORAL lidar at Estación Astronómica Río Grande, Argentina, is primarily used to study gravity waves by means of analyzing temperature perturbations in the stratosphere and mesosphere between 30 and 90 km altitude (Reichert et al., 2021). The instrument is a high-powered Rayleigh backscatter lidar with capabilities for nighttime autonomous operation, thus maximizing the observation time by taking measurements whenever weather conditions allow for operation of the instrument. In the seven summers since 2017, CORAL measured temperature during 282 h (120 nights) in November, 231 h (120 nights) in December, and 269 h (125 nights) in January (updated from Reichert et al., 2021). The number of measurement hours per day is significantly reduced compared to winter due to the short nights. Between 20 November and 31 January, measurements were generally undertaken between 01:53 UTC and 07:41 UTC (22:53 and 04:41 LT), and within ± 10 d from the solstice the maximum measurement duration per night was 5.2 h. Because the scientific focus of the instrument is on gravity waves that propagate freely into the middle atmosphere only in winter, no daylight filters were included in the initial instrument design.
NLCs are detected in lidar data by comparing the backscatter signal to a model density profile fitted to the measured profile below NLC altitudes in a similar way to what was described in Kaifler et al. (2022). The NLC retrieval uses photon counts of the upper channel of CORAL that are binned to 100 m vertical resolution. A detector dead-time correction is applied, and the data are rebinned in time to 10 s and 10 min to obtain a high- and low-resolution NLC data set. To obtain an error estimate, we carry out 200 Monte Carlo simulations where we perturb the photon counts with a random factor between 0 and 1 multiplied by their square root (Poisson statistics). We remove a linear background estimated between 125–220 km altitude and account for range by multiplication with the range squared. The resulting profiles that are now proportional to air density are then normalized to a reference density profile between 45–50 km altitude. For this, the NRL-MSIS2 density profile of 10 January 2018 at 04:00 UTC at 54° S, 292° E is used. The profile has a vertical spacing of 1 km and ranges from 0 to 100 km altitude. Before the normalization, we interpolate this reference profile to match the altitude vector of the lidar observations. The volume backscatter coefficient β in units of 10−10 (also termed “NLC brightness”) is calculated from Eq. (2) of Kaifler et al. (2022). The final β(z) is calculated as the mean of the 200 Monte Carlo runs and the uncertainty Δβ(z) as the standard deviation. We discriminate between the NLC layer and the background using the condition β(z)>sΔβ(z) with a threshold of s=2.5. For CORAL, Δβ(z) is on the order of 0.03 × 10⁻¹⁰ .
The capability of the instrument for the detection of even faint NLCs, as well as for measuring the temperature in the upper mesosphere in regions without NLCs, was demonstrated by Kaifler et al. (2018). A detailed description of the temperature retrieval is given by Kaifler and Kaifler (2021). Following a pyramid structure, profiles with increasing resolution are computed using seed temperatures from previously retrieved lower-resolution profiles. The initial seed temperature is taken from the closest temperature profile of the Sounding of the Atmosphere using Broadband Emission Radiometry satellite instrument. In this work, we use two CORAL temperature data sets: nightly mean profiles and hourly profiles. Both data sets have a vertical resolution of 900 m.
2.2 NLC cameras
Encouraged by the lidar's initial NLC detections, we installed three automatic GoPro cameras for NLC observations in Argentina. The sites and viewing directions were chosen such that the cameras' fields of view (FOVs) include the CORAL lidar beam and extend the observed area towards the south, enabling comparisons between the vertical lidar soundings and the spatial imaging in a common volume. A further goal was the detection of NLC events at latitudes south of Río Grande. Starting on 14 November 2019, two cameras located at Río Gallegos at the Observatorio Atmosferico de la Patagonia Austral (51.6° S, 69.3° W, about 260 km north of Río Grande) and Ushuaia (54.8° S, 68.3° W, 120 km south of Río Grande) observe the sky in the direction of the southern horizon. A third camera was installed in Río Grande in December 2020.
2.3 Meteor radar
Co-located with the CORAL instrument in Río Grande is the SAAMER radar (Fritts et al., 2010). SAAMER is a high-powered, eight-beam meteor radar operating at 32.55 MHz. The inferred radial velocities of advected meteor trails at off-zenith angles between 15 and 50° are used to derive mean hourly zonal and meridional winds between approximately 70 and 110 km altitude at 3 km vertical resolution. SAAMER measurements have revealed significant tidal and planetary wave amplitudes (Fritts et al., 2010). Most relevant for this work are a significant semidiurnal tide and planetary waves with periods between 2 and 16 d.
3.1 Lidar NLC detections
Using the CORAL instrument, NLCs were detected above the site in Río Grande in every season since the beginning of measurements in 2017. The first detection succeeded on 10 January 2018 and included a 3 h long and unexpectedly bright NLC display. The NLCs were also visible in camera images used to monitor the surroundings for tropospheric clouds. The detection by the vertically pointed lidar implies that the ice cloud must have been visible from more equatorward locations looking towards the southern horizon as well, but no sightings were reported, likely due to the lack of incidental observers in the very early morning hours. The first season ended with a second weak detection 1 week later, on 18 January 2018, with measured backscattered coefficients that were barely above the detection threshold. The next season started 2 weeks earlier than the 2017/2018 season, on 24 December 2018, with a bright two-night display, followed by two weaker displays on 4 and 9 January 2019. The 2019/2020 season offered no bright displays but started very early on 29 November 2019 and ended on 31 December 2019. The 2020/2021 season held only one display on 3 January 2021, yet it was again of high brightness. This event is exceptional because it includes the lowest altitude of any NLC detections at Río Grande (81.7 km). The single detection of the next season occurred very late. On 23/24 January 2022, NLCs were detected right after sunset, but the lidar turned itself off in the middle of the night due to forecasted rain. After a manual start of the instrument at 05:30 UTC, the NLC layer turned out to be very bright and at remarkably high altitudes. In the 2022/2023 season a single detection happened even later on 29 January 2023, but the NLCs were of low brightness. Interestingly, in 2023/2024, a total of six events of low brightness were recorded. Table 1 summarizes the key parameters of all NLCs observed to date.
Table 1List of all lidar NLC soundings above Río Grande in the seven summer seasons of 2017/2018 to 2023/2024 based on 10 min resolution. The abbreviation dfs denotes days from summer solstice on 21 December. Times indicate the first and last NLC detection on that night.
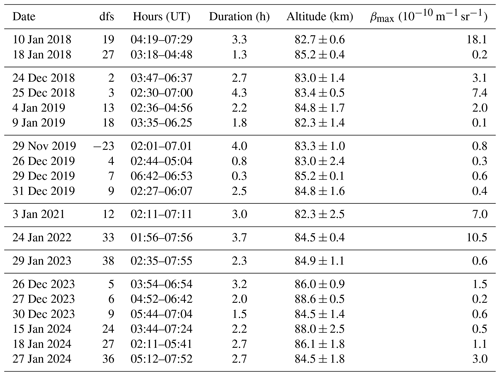
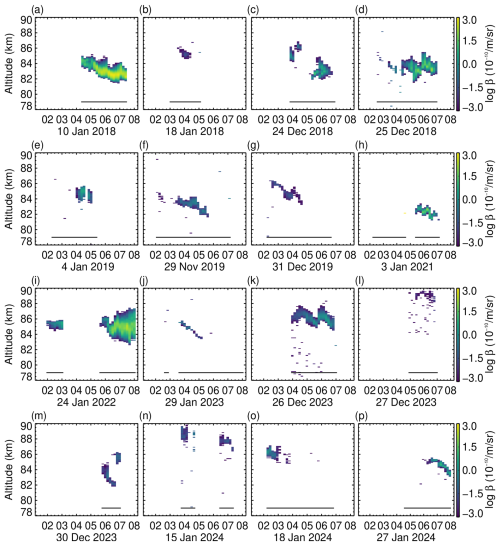
Figure 1The main NLC detections at 100 m × 10 min resolution. Figure axes are identical to facilitate easy visual comparisons. The horizontal lines at 79 km altitude indicate measurement times.
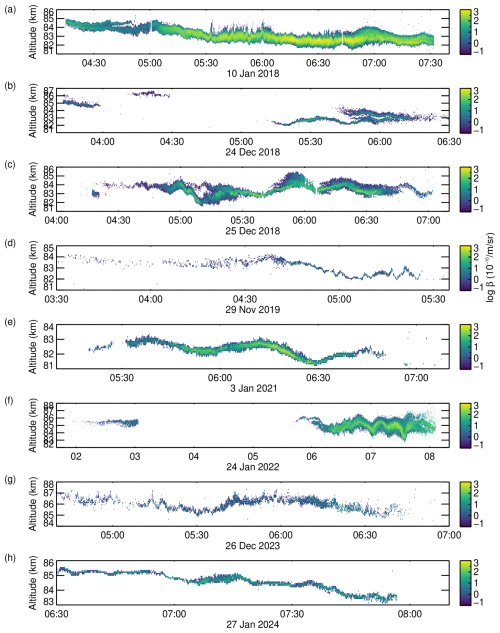
Figure 1 shows the measured NLC brightness for main NLC events from 2017 to 2024. The coarse temporal resolution of 10 min results in an increased signal-to-noise ratio that facilitates the detection of weak events. Many NLC detections span multiple hours and occur in coherent layers. The NLC layer width is highly variable, from few hundred meters (e.g., Fig. 1j) to 4 km (Fig. 1i). Weaker layers emerging at high altitudes descend to altitudes around 82 km while increasing in brightness, e.g., Fig. 1a, f, g, j, and p. This behavior is rather typical and also known from lidar observations in the Northern Hemisphere (e.g., Nussbaumer et al., 1996). On many days, sudden changes in NLC layer altitude occur (see Fig. 1a, d, f, h, and i). These changes are likely due to the vertical motion of the background atmosphere induced by gravity waves. For bright NLC displays that offer a high signal-to-noise ratio, we were able to increase the temporal resolution to 10 s. The high-resolution data sets shown in Fig. 2 reveal a range of oscillations imprinted on the NLC layers by gravity waves and instabilities produced by breaking of these waves, with periods ranging from few minutes to about 1 h. In particular, on 10 January 2018 between 05:20 to 06:50 UTC (Fig. 2a), possibly until the end of measurement at 07:30 UTC, the NLC layer is perturbed at periods below the Brunt–Vaisälä period, indicative of instabilities. During the 30 min from 05:30 to 06:00 UTC, modulations of the wide NLC layer with displacements of almost 2 km were likely caused by Kelvin–Helmholtz instabilities exhibiting tube and knot dynamics (Fritts et al., 2023). Some NLC layers are very thin with widths below 500 m, e.g., Fig. 1d and h. A stack of three narrowly spaced layers was detected on 24 December 2018 shortly before 06:00 UTC (Fig. 2b). Other layers are very wide; e.g., a layer approaching a vertical extent of 4 km was detected on January 2022 (Figs. 1i and 2f). Except for the two brightest NLCs recorded on 10 January 2018 and 24 January 2022, the layers seem to have (mostly) faded by the time the lidar turned off due to sunrise, which occurs at Río Grande between 07:08 and 08:07 UTC in the relevant period of time. The accumulation of NLCs at the end of the night is discussed with respect to the effect of thermal tides in Sect. 4.2.
3.2 Camera observations
Coincident and common-volume observations of NLCs with ground-based lidars and cameras are challenging, as only a narrow latitude band offers the right combination of background conditions for both instruments. Optimal observing conditions are twilight for cameras and darkness for lidars. Difficulties with the interpretation of ground-based images mostly concern the foreground that obstructs the view towards the horizon and may also degrade the image quality due to unfavorable lighting conditions, e.g., by reflections from street lights in haze. Moreover, the analysis of images is often complicated by a partly overcast sky that allows for only fragments of the NLC layer to be seen. For joint observations with the cameras in Río Gallegos and the lidar at Río Grande, observing conditions must be good at both places. But even in cases with good observing conditions, detections of NLCs using cameras are much more likely given that the FOVs of cameras are extremely large compared to lidars. If the NLC layer is very patchy, it might be possible that although NLCs are visible at locations close to lidar beam, they are not detected in the small spot observed by the lidar. In Table 2 we list all visual detections of NLCs. It is remarkable that for nights with detections of NLCs by lidar, NLCs were visually confirmed by at least one camera in almost all cases since the cameras were installed. In the 2019/2020 summer season, we identified a total of 10 occurrences of NLCs detected by a camera, among them are five cases where the visual detection is without doubt. For two of the events with uncertain detections, the presence of NLCs was confirmed by lidar. In comparison, and also in agreement with the lidar observations, the summer season 2020/2021 offered fewer nights with NLCs. A total of 16 nights in December 2020 were without NLC detections from either Río Gallegos or Río Grande, and the remaining nights were overcast. A first coincident observation with lidar and cameras succeeded on 3 January 2021, followed by another detection of NLCs in camera images 1 week later. Towards the very end of the 2021/2022 season, NLCs were sighted in a region east of CORAL in the morning hours of 19 January 2022 from both Río Grande and Río Gallegos, followed 5 d later by a bright and wide display with coincident detections by lidar and cameras. In the 2023/2024 season, four coincident events were recorded. Overall, our data suggest that NLCs can be observed visually from Tierra del Fuego 2 to 10 nights per season, either after sunset or before sunrise. The total hours of visual observations in five seasons is more than 23 h.
Table 2List of NLC detections using cameras in Río Gallegos (RIGA), Ushuaia (USHU), and Río Grande (RIOG). An “x” denotes a successful detection, a “∼” denotes a possible detection, a “–” denotes a confirmed absence, and a blank space indicates that the instrument was not operational or that it was cloudy. In the column labeled “hours”, the first and last NLC detection of the night is noted. Lidar detections are noted in the last column for reference.
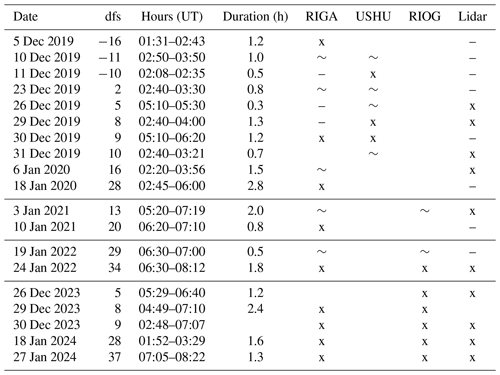
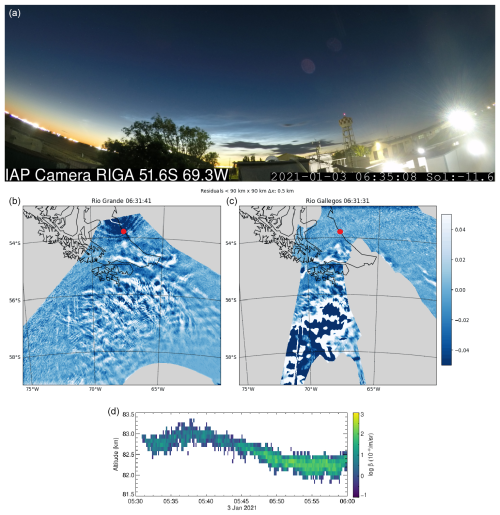
Figure 3(a) Image taken at Río Gallegos on 3 January 2021 at 06:35 UTC. The silvery-white clouds above the horizon are NLCs, while tropospheric clouds appear dark. (b, c) Two images from Río Grande and Río Gallegos projected to 83 km altitude on a Universal Transverse Mercator (UTM) grid. The foreground has been masked, the sky background removed, and the contrast enhanced to highlight structures within NLCs. The red dots mark the location of Río Grande. (d) Part of the lidar observations showing small-scale perturbations.
The coincident detections on 3 January 2021 and 24 January 2022 showed bright and structured NLCs. In the morning of 3 January 2021, bright NLCs covered large parts of the sky (one image is shown in Fig.3). The projected and geo-located images suggest that the area covered by NLCs is at least 500 km × 800 km. Furthermore, the images show evidence of localized small-scale gravity waves with a horizontal wavelength of few kilometers that move in different directions and interfere with each other. The strongest activity appears at latitudes south of Tierra del Fuego. Above Río Grande, the NLC layer, although confirmed by the lidar soundings, is too weak to show up in the twilight images, making a direct comparison between the height-resolved backscatter signal and the imaged NLC layer impossible. However, observations from both instruments agree qualitatively. The lidar profiling shows a periodic modulation of the NLC layer with 1 to 1.5 km vertical displacement with maxima around 06:14 and 06:45 UTC. The modulation is likely caused by gravity waves that give rise to smaller-scale variability that is imaged above the Drake Passage. Evidence for the very same small-scale dynamics is also found throughout the lidar soundings in the form of very short-period (around 1 min) modulations of the NLC layer with vertical displacements of a few hundred meters. A detailed analysis of the second coincident and common-volume observation on 24 January 2022 will be presented in a separate work, which will include additional OH imaging and meteor radar data sets that are available for this particular event.
3.3 Lidar temperature
Inherently, no temperature can be measured within NLC layers by Rayleigh lidar, as scattering by ice particles contaminates the lidar return signal, which normally, without the presence of ice particles, just comprises Rayleigh scattering from air at these altitudes. However, for all nights without NLCs (which account for most measurements), upper-mesospheric temperatures can be retrieved from lidar measurements. Figure 4a shows a smoothed composite of 7 years of measurements in the summer months. Minimum temperatures of about 160 K are reached at around 88 km altitude in the beginning of January. The transition from winter to summer and summer to winter conditions occurs in the first half of November and in the second half of February, respectively. Figure 4b allows a more detailed look at temperature variations within and between years. It shows all nightly mean temperatures measured by CORAL between October and March and averaged between 82 and 85 km altitude as colored dots. The yearly series are smoothed with a Hanning window of 50 d length (solid lines) to highlight the seasonal variation. The typical variation in temperature from one night to another (dots) is on the order of 20 K. This variability is not due to measurement errors, which are around 3 K. It should be noted that nights are short in the summer season, and taking the nightly means is unlikely to average out the effect of gravity waves. Hence, we believe that the large variability is indicative of the upper mesosphere being disturbed by gravity waves. There is also significant variation between years, with the first three seasons exhibiting lower temperatures than the last four.
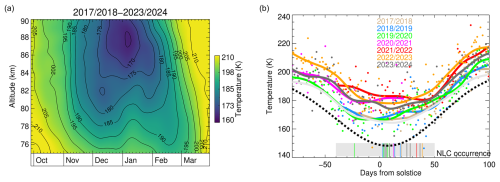
Figure 4(a) Nightly mean CORAL temperatures, excluding nights with NLCs, smoothed with Hanning windows of 30 d and 2 km. (b) Nightly mean CORAL temperatures averaged between 82 and 85 km altitude, excluding nights with NLCs. The time series are smoothed with a Hann filter of 50 d (solid lines, per season). The nights with NLC detections are marked by vertical lines at the bottom. The gray line shows mean SABER temperatures (Yue et al., 2024) of up to 800 km distance to CORAL. The dotted black line shows the mean temperature at 84 km altitude at Kühlungsborn (54° N), which is close to the conjugated point in the Northern Hemisphere (Gerding et al., 2008).
As demonstrated by Fig. 4b, NLC detections occur well within the period of time when the upper mesosphere is coldest. Although nightly mean temperatures below 160 K are occasionally measured, the mean temperature on days without NLCs is generally above 170 K and thus more than 20 K above the temperature that is required for the formation of NLCs. The 2002–2007 mean for Kühlungsborn at 54° N (dashed black line in Fig. 4b) shows temperatures much closer to and below the frost point in the middle of the season (gray box). In comparing the temperatures at both places, one would expect fewer NLCs at Río Grande and a shorter season, but neither is the case (see the discussion in Sect. 4.3). We conclude that the NLC detections are unexpected with respect to the thermal background that seems, in general, not favorable for local formation of NLCs.
4.1 NLC brightness and altitude
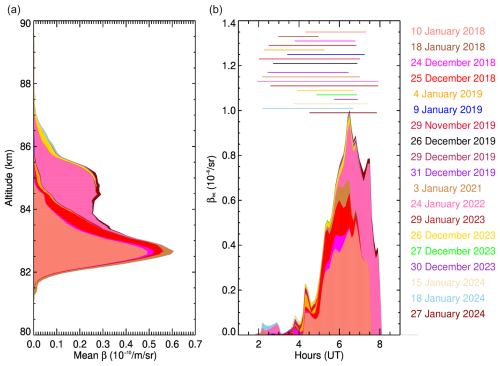
We turn to statistical analysis of the NLC parameters measured by lidar. Figure 5a shows the mean brightness profile, i.e., the sum of all profiles with significant NLCs divided by the number of profiles. Colors indicate the date of the observation. NLC backscatter originates from the 81–87 km altitude region and is dominated by a number of bright events, most notably 10 January 2018 around 82.6 km altitude and 24 January 2022 around 85 km altitude. The brightness of 4 out of the 19 events is above β = 14 × 10−10 , while 14 events are of low brightness below β = 4 × 10⁻¹⁰ . A similar distribution was reported by Gerding et al. (2013b) from multi-year observations at 54° N in the Northern Hemisphere. The weighted mean altitude of all CORAL profiles is 83.3 km. Extrapolating the NLC altitude from South Pole, McMurdo, and Rothera (Fig. 2 of Chu et al., 2011) to 54° S, one would expect a mean NLC altitude at Río Grande of approximately 83.5 km. This is surprisingly close to our value despite our statistics being limited by the number of observations. The mean centroid altitude from Gerding et al. (2013b, 54° N) is 82.7 km and thus 600 m below our value. Gerding et al. (2013b) note that strong NLCs tend to occur at lower altitudes and have a smaller vertical extent compared to weak NLCs. This is in contrast to our NLC observations in the Southern Hemisphere, which can be characterized as high altitude and having a large vertical extent. However, we also note that our observations are dominated by singular events, most notably the event on 24 January 2022.
4.2 Local time dependence
NLCs were detected by lidar more often in the early morning hours before sunrise than after sunset. Considerable local time variations with peak occurrence frequency and brightness in the early morning are known from Northern Hemisphere observations (Fiedler et al., 2017). In Fig. 5b we show detections of NLCs as a function of time of day. The peak in brightness between 05:00–07:30 UTC (02–04:30 LT) suggests that the occurrence of NLCs is tied to the phase of the meridional wind. The analysis of radar wind data presented in Liu et al. (2020, their Fig. 1) reveals signatures of a strong semi-diurnal tide in the upper mesosphere with meridional winds exceeding 10 m s−1 above Río Grande between 6:00–8:00 UTC in the yearly mean. Low zonal winds and positive meridional winds at Rothera (1500 km south of Río Grande) around 00:00 UTC and lasting a few hours favor transport of cold air masses from more southerly regions to Río Grande. However, a steady mean flow of 10 m s−1 over a period of time of 8 h is not sufficient for transporting NLC particles from polar latitudes south of 60° S to Río Grande. We therefore investigate SAAMER data for the specific dates of our NLC measurements.
Table 3The meridional wind v measured by SAAMER at 84 km altitude for NLC events. Here, v6 (v12,v24) denotes the mean meridional wind during a period of time of 6 h (12 h, 24 h) prior to the time of maximum NLC brightness. Significant tidal and planetary wave (PW) periods of v are taken from the analysis presented in Fig. 6.
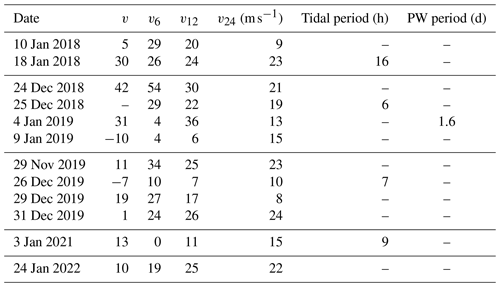
We analyze hourly values of the meridional wind component at 84 km altitude that was measured by the SAAMER radar during five seasons from 2017–2022. Specifically, we look at the hourly winds at times when the NLCs were brightest and determine the mean wind 6, 12, and 24 h prior to these times as done by Pokhotelov et al. (2019, their Fig. 6). Table 3 lists our results. Indeed, in quite a few cases the wind speeds were significantly larger than 10 m s−1. It is obvious that the larger the wind speed, the more likely we are to find transport from polar latitudes toward Río Grande. The only dates where transport from the south seems unlikely based on this analysis are 9 January 2019, 26 December 2019, and 3 January 2021. The former two dates represent very weak NLC events.
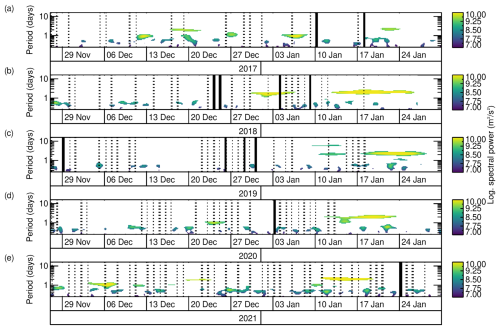
Figure 6Significant spectral power of the meridional wind at 84 km altitude, tested against red noise with 95 % confidence level, between periods of 6 h to 16 d. Nights with lidar detections of NLCs are indicated by bold vertical lines, and nights with lidar measurements without NLCs by dotted vertical lines. Matches of NLC detections and significant spectral power of meridional wind variations are listed in Table 3.
To study the influence of planetary waves and tides on NLCs in more detail, we performed a wavelet analysis of the meridional wind at 84 km using a Morlet wavelet. Spectral power for periods between 6 h and 16 d are presented in Fig. 6. The most prominent feature is the concentration of spectral power at periods of around 2 d, in particular in January, indicating a quasi 2 d planetary wave (Baumgaertner et al., 2008). Only one NLC observation, the short and weak detection on 4 January 2019 (Fig. 6b), coincides with significant planetary wave activity (1.6 d period). For all other NLC detections there was no significant planetary wave activity. This result is in agreement with the finding of Siskind and McCormack (2014) that periods of time with enhanced quasi 2 d wave activity are related to high-latitude temperature enhancements that are linked to disappearance of NLCs. Patterns in noctilucent cloud brightness related to the 5 d planetary wave are known from satellite measurements (Merkel et al., 2003, 2008; Dalin et al., 2011). However, at Río Grande in the summers of 2017–2021, the 5 d planetary wave was weak. We conclude that the observed recurrence of NLCs after 2, 3, or 5 d in some seasons happened by chance and is not related to planetary waves. Focusing on tidal periods below 1 d, note that the majority of NLC detections happened at times when the wave activity was low, i.e., times with no significant spectral power.
4.3 Start of the NLC season
Given that there are summer seasons with just a single NLC detection, using the term “NLC season” in these cases may be deceptive. However, we decided to stick with this term since it is used in many studies. At any rate, our data show that the first NLC detection of a summer season is highly variable, ranging from −23 d from the solstice to 38 d past the solstice. These late first NLC occurrences are much later and seemingly uncorrelated with the onsets of the Southern Hemisphere polar mesospheric cloud (another term for noctilucent clouds used for observations from space) season as determined from two satellite experiments with values between −36 and −30 d from the solstice (DeLand and Gorkavyi, 2021, their Fig. 10, 2017–2020, south of 60° S).
Karlsson et al. (2011) have shown that the timing of the breakdown of the Southern Hemisphere polar vortex influences the onset of the Southern Hemisphere NLC season. Figure 7 shows zonal-mean zonal winds at 00:00 UTC and 60° S from ERA5 at 10 hPa. The Antarctic minor sudden stratospheric warming in September 2019 caused a reduction in wind speed that is visible at around −95 d from the solstice (green curve in Fig. 7). The warming event weakened the polar vortex, resulting in an earlier breakdown. It is evident from Fig. 4b that temperatures in the NLC altitude region were low in 2019 (green curve) compared to other years. The lower mesospheric temperature due to the stratospheric warming and thus the earlier start of summer has likely contributed to the early detection of NLC that occurred on 29 November 2019. This event is the so far only detection of NLC by CORAL at Río Grande before summer solstice.
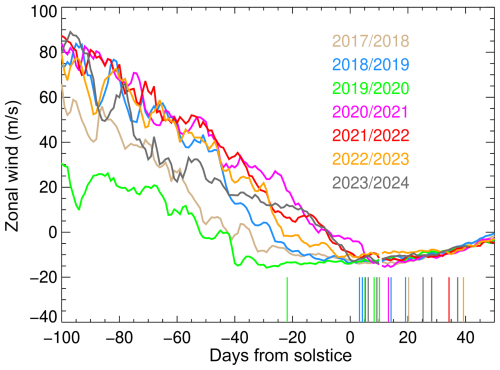
Figure 7ERA5 zonal-mean zonal wind at 00:00 UTC, 10 hPa and −60° S latitude (Hersbach et al., 2023). Solstice refers to 21 December. NLC occurrences observed by CORAL are indicated by vertical lines at the bottom.
4.4 Occurrence rate
Table 4Measurement statistics and NLC occurrence rate between 27 November and 31 January based on 10 min resolution with s=4. The last column lists the mean composite Lyman-alpha index (Machol et al., 2019; LISIRD, 2024).
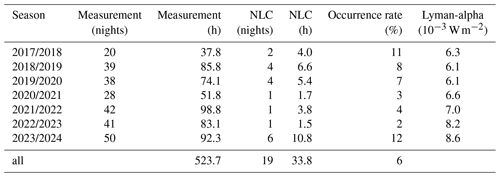
The middle of the season at Río Grande is found on 2 January (12 d from the solstice, median of column 2 of Table 1). We define the occurrence rate as the accumulated time of NLC detections divided by the accumulated measurement time between 27 November and 31 January of each season. These dates were chosen to include our earliest and latest observation dates and are very similar to the dates used by Gerding et al. (2013a) (that would be 1 December to 4 February in the Southern Hemisphere). Measurement nights and hours per season are listed in Tab. 4. NLCs were detected in one to six nights per season, with occurrence rates ranging between 2 % and 12 %. Considering all seasons, in total 523.7 h have lidar observations, of which 33.8 h contain certain NLC detections, resulting in an occurrence rate of 6 %. This compares well to the value of 6 % from 21 h with NLC detections in 2005/2006 at Davis (68.6° S) in East Antarctica found by Klekociuk et al. (2008). Chu et al. (2006) derived higher values with a mean of 27.9 % from three seasons of NLC observations (2002/2003 to 2004/2005, 128 h with NLCs) at Rothera (67.5° S), which is located at a comparable longitude but higher latitude than Río Grande. Their values were, however, calculated from a shorter core season and vary significantly over the three seasons (as in our case) since they are dominated by singular events in individual years. Indications of strong interannual variability also come from Gerding et al. (2013a), who report a variability between 0 % and 19 % from 15 years of lidar observations (1997–2011) at Kühlungsborn (54° N). Surprisingly, the 15-year mean is 6 %, the same value we find for Río Grande. From satellite measurements in the two seasons 2017/2018 and 2018/2019, DeLand and Thomas (2019, their Fig. 4) derived an occurrence rate in the 50°–64° latitude band of the Southern Hemisphere of just 0.5 %. This rate is a factor of 4 smaller compared to about 2 % for the same band in the Northern Hemisphere. Given the obviously large variability, it is hard to reliably compare occurrence rates at different sites, but looking at the available data, the occurrence rate at Río Grande seems to be higher than what would be expected in terms of ambient temperature, latitude, and inter-hemispheric differences.
A potential source of interannual variability is the variation of the solar flux with the solar cycle. Solar Lyman-alpha radiation photodissociates water vapor, resulting in fewer NLCs during solar maximum (Garcia, 1989). DeLand et al. (2003) found an anti-correlation with no phase lag in the Southern Hemisphere from a satellite record spanning two solar cycles. After 2020, however, satellite and model results suggest a significantly reduced response of noctilucent clouds to solar variations (Hervig et al., 2019; Vellalassery et al., 2023). Our observations are limited to 7 years within solar cycles 24 and 25. As evident from Table 4, the occurrence rate is high during the first three seasons (solar minimum) and seemingly low thereafter when the composite solar Lyman-alpha index increases. However, the last season of 2023/2024 at the peak of the solar maximum showed unexpectedly high occurrence rates and durations. In fact, this is the season with the most NLC events (six nights) so far. We conclude that for our observations at a mid-latitude site in the Southern Hemisphere, solar activity with solar Lyman-alpha values as a proxy is not a main driver for the observed variability.
An additional source of water vapor in the upper mesosphere and lower thermosphere that might trigger bright NLCs, especially at mid-latitudes, is rocket engine exhaust (Stevens et al., 2012; Siskind et al., 2013; Dalin et al., 2013; Stevens et al., 2022). The first evidence was presented by Stevens et al. (2005a), who found increased NLC occurrence rates and larger ice mass in the Northern Hemisphere up to 8 d after a Space Shuttle launch. Soon after, the thermospheric transport of a space shuttle exhaust plume containing water vapor and iron into the Southern Hemisphere was investigated using lidar and satellite measurements. Stevens et al. (2005b) showed that the exhaust plume reached the Antarctic Peninsula within 3 d. Since then, the number of rocket launches has dramatically increased. We looked at launch dates of rockets launched from major space centers that may potentially be linked to NLCs observed above Río Grande. These centers are the Guiana Space Center in Kourou, French Guiana (6700 km to the north); the Kennedy Space Center and Cape Canaveral Space Force Station (9300 km to the north); and the Mahia Peninsula in New Zealand (8000 km west of Río Grande). Exhaust from the Electron rockets launched at Mahia Peninsula may be transported to Río Grande by the eastward winds above 85 km altitude as shown by Hindley et al. (2022); however, these smaller rockets inject only a small amount of water vapor into the lower thermosphere. Close temporal proximity between Electron rocket launches and NLC observations by lidar at Río Grande are found for 16 December 2018 (8 d prior to a NLC event), 24 January 2023 (5 d prior), and 15 December 2023 (11 d prior). Soyuz launches from Kourou took place on 19 December 2018, 18 December 2019, 29 December 2020, and 21 January 2022, i.e., 5, 8, 5, and 3 d prior to NLC observations at Río Grande, respectively. For almost all NLC events we find Falcon 9 launches from Kennedy Space Center within 3 to 12 d prior to NLC observations. Given the large number of possibilities, better modeling of the transport of the rocket exhaust by wind, taking into account the strong tidal winds in the lower thermosphere, is needed to confirm a potential direct effect of rocket exhaust on the occurrence of NLCs. At this point, the temporal proximity and large number of rocket launches make space traffic a potential factor contributing to the unexpectedly large number of NLC events observed above Río Grande.
There was also major natural event that potentially contributed to the large number of NLC observations in the 2023/2024 season. The eruption of the Hunga Tonga undersea volcano in January 2022 injected large amounts of water vapor into the stratosphere, which then reached the mesosphere several months later (Nedoluha et al., 2023). The eruption also induced changes in circulation patterns of the middle atmosphere with effects on mesospheric temperature (Yu et al., 2023). However, detailed model studies and observations of water vapor in particular are necessary to investigate these effects. Such work is beyond the scope of this paper.
We reported on NLC observations by lidar at Río Grande, Tierra del Fuego, which is located at mid-latitudes in the Southern Hemisphere (53.8° S). The 19 events detected in seven summer seasons represent the first NLC observations by lidar in the Southern Hemisphere outside of Antarctica. The occurrence rate of about 6 % is unexpectedly high and comparable to measurements at a conjugate latitude in the Northern Hemisphere. The mean altitude (83.3 km) is higher than in the Northern Hemisphere. We observed several events of high brightness that lasted several hours. The local time dependence of NLC observations reveals the influence of a pronounced semi-diurnal tidal wind that transports ice particles from Antarctic latitudes to the north towards Río Grande. Northward transport seems to be crucial because, as confirmed by our measurements, the mean temperature at the height of NLCs above Río Grande is well above the frost point and thus effectively prevents local formation of ice particles. Our lidar temperature measurements agree with previous assessments of inter-hemispheric differences in the local thermal background. Another factor might be increased amounts of water vapor by anthropogenic or natural causes. Whether there are direct links to orbital rocket launches should be studied with modeling in the future. Here, we conclude that unexpectedly bright NLCs occurred above Río Grande. These NLC displays must be visible by naked eye possibly up to hundreds of kilometers to the north. That there are very few visual reports from South America, unlike in the Northern Hemisphere, may be attributed to populated areas being few and sparse. Whether the appearance of bright NLCs above Tierra del Fuego is anomalous with respect to longitude, similar to the winter stratospheric gravity wave hotspot caused by the Andes, is unknown.
Lidar data are available from the HALO database https://halo-db.pa.op.dlr.de/mission/111 (Deutsches Zentrum für Luft- und Raumfahrt, HALO Database, 2024). ERA5 reanalysis data are available from https://doi.org/10.24381/cds.adbb2d47 (Hersbach et al., 2023). SABER data are available from https://saber.gats-inc.com/data.php (Yue et al., 2024). Composite Lyman-alpha is available from https://lasp.colorado.edu/data/timed_see/composite_lya/lyman_alpha_composite.nc (LISIRD, 2024).
BK and NK built and operated the CORAL lidar. BK and NK performed the data analysis and wrote the manuscript. MR provided funding. GL and DJ provided meteor radar data. GB provided camera images and projections. JLH supported lidar operations in Río Grande. All authors revised the manuscript.
The contact author has declared that none of the authors has any competing interests.
Publisher's note: Copernicus Publications remains neutral with regard to jurisdictional claims made in the text, published maps, institutional affiliations, or any other geographical representation in this paper. While Copernicus Publications makes every effort to include appropriate place names, the final responsibility lies with the authors.
Natalie Kaifler and Bernd Kaifler thank Alejandro de la Torre for his support in bringing CORAL to Río Grande and Robert Reichert for providing help with the initial installation and servicing of the instrument. Gerd Baumgarten and Natalie Kaifler acknowledge the work of the members of the German forum Arbeitskreis Meteore (https://www.meteoros.de/, last access: 1 March 2024) and Simon Herbst in particular, who screen and discuss sightings of NLCs from all available online sources including the IAP camera network and discovered several of the NLC events mentioned here in the real-time camera images. Gerd Baumgarten thanks Michael Priester for screening the IAP camera images. Natalie Kaifler thanks Isabell Krisch for providing helpful comments.
The article processing charges for this open-access publication were covered by the German Aerospace Center (DLR).
This paper was edited by John Plane and reviewed by two anonymous referees.
Backhouse, T. W.: The luminous cirrus cloud of June and July, Meteorol. Mag., 20, 133–133, 1885. a
Bailey, S. M., Merkel, A. W., Thomas, G. E., and Rusch, D. W.: Hemispheric differences in Polar Mesospheric Cloud morphology observed by the Student Nitric Oxide Explorer, J. Atmos. Sol.-Terr. Phy., 69, 1407–1418, https://doi.org/10.1016/j.jastp.2007.02.008, 2007. a
Baumgaertner, A., McDonald, A., Hibbins, R., Fritts, D., Murphy, D., and Vincent, R.: Short-period planetary waves in the Antarctic middle atmosphere, J. Atmos. Sol.-Terr. Phy., 70, 1336–1350, https://doi.org/10.1016/j.jastp.2008.04.007, 2008. a
Chu, X., Gardner, C. S., and Roble, R. G.: Lidar studies of interannual, seasonal, and diurnal variations of polar mesospheric clouds at the South Pole, J. Geophys. Res.-Atmos., 108, 8447, https://doi.org/10.1029/2002JD002524, 2003. a
Chu, X., Espy, P. J., Nott, G. J., Diettrich, J. C., and Gardner, C. S.: Polar mesospheric clouds observed by an iron Boltzmann lidar at Rothera (67.5° S, 68.0° W), Antarctica from 2002 to 2005: Properties and implications, J. Geophys. Res.-Atmos., 111, D20213, https://doi.org/10.1029/2006JD007086, 2006. a, b
Chu, X., Huang, W., Fong, W., Yu, Z., Wang, Z., Smith, J. A., and Gardner, C. S.: First lidar observations of polar mesospheric clouds and Fe temperatures at McMurdo (77.8° S, 166.7° E), Antarctica, Geophys. Res. Lett., 38, L16810, https://doi.org/10.1029/2011GL048373, 2011. a, b
Dalin, P., Pertsev, N., Zadorozhny, A., Connors, M., Schofield, I., Shelton, I., Zalcik, M., McEwan, T., McEachran, I., Frandsen, S., Hansen, O., Andersen, H., Sukhodoev, V., Perminov, V., and Romejko, V.: Ground-based observations of noctilucent clouds with a northern hemisphere network of automatic digital cameras, J. Atmos. Sol.-Terr. Phy., 70, 1460–1472, https://doi.org/10.1016/j.jastp.2008.04.018, 2008. a
Dalin, P., Pertsev, N., Dubietis, A., Zalcik, M., Zadorozhny, A., Connors, M., Schofield, I., McEwan, T., McEachran, I., Frandsen, S., Hansen, O., Andersen, H., Sukhodoev, V., Perminov, V., Baliunas, R., and Romejko, V.: A comparison between ground-based observations of noctilucent clouds and Aura satellite data, J. Atmos. Sol.-Terr. Phy., 73, 2097–2109, https://doi.org/10.1016/j.jastp.2011.01.020, 2011. a
Dalin, P., Perminov, V., Pertsev, N., Dubietis, A., Zadorozhny, A., Smirnov, A., Mezentsev, A., Frandsen, S., Grønne, J., Hansen, O., Andersen, H., McEachran, I., McEwan, T., Rowlands, J., Meyerdierks, H., Zalcik, M., Connors, M., Schofield, I., and Veselovsky, I.: Optical studies of rocket exhaust trails and artificial noctilucent clouds produced by Soyuz rocket launches, J. Geophys. Res.-Atmos., 118, 7850–7863, https://doi.org/10.1002/jgrd.50549, 2013. a, b
Dalin, P., Perminov, V., Pertsev, N., and Romejko, V.: Updated Long-Term Trends in Mesopause Temperature, Airglow Emissions, and Noctilucent Clouds, J. Geophys. Res.-Atmos., 125, e2019JD030814, https://doi.org/10.1029/2019JD030814, 2020. a
DeLand, M. T. and Gorkavyi, N.: PMC observations from the OMPS Limb Profiler, J. Atmos. Sol.-Terr. Phy., 213, 105505, https://doi.org/10.1016/j.jastp.2020.105505, 2021. a
DeLand, M. T. and Thomas, G. E.: Extending the SBUV polar mesospheric cloud data record with the OMPS NP, Atmos. Chem. Phys., 19, 7913–7925, https://doi.org/10.5194/acp-19-7913-2019, 2019. a
DeLand, M. T., Shettle, E. P., Thomas, G. E., and Olivero, J. J.: Solar backscattered ultraviolet (SBUV) observations of polar mesospheric clouds (PMCs) over two solar cycles, J. Geophys. Res.-Atmos., 108, 8445, https://doi.org/10.1029/2002JD002398, 2003. a, b
Dubietis, A., Dalin, P., Balčiūnas, R., and Černis, K.: Observations of noctilucent clouds from Lithuania, J. Atmos. Sol.-Terr. Phy., 72, 1090–1099, https://doi.org/10.1016/j.jastp.2010.07.004, 2010. a, b
Hersbach, H., Bell, B., Berrisford, P., Biavati, G., Horányi, A., Muñoz Sabater, J., Nicolas, J., Peubey, C., Radu, R., Rozum, I., Schepers, D., Simmons, A., Soci, C., Dee, D., and Thépaut, J-N.: ERA5 hourly data on single levels from 1940 to present, Copernicus Climate Change Service (C3S) Climate Data Store (CDS) [data set], https://doi.org/10.24381/cds.adbb2d47, 2023. a, b
Fiedler, J., Baumgarten, G., Berger, U., and Lübken, F.-J.: Long-term variations of noctilucent clouds at ALOMAR, J. Atmos. Sol.-Terr. Phy., 162, 79–89, https://doi.org/10.1016/j.jastp.2016.08.006, 2017. a
Fogle, B.: Noctilucent Clouds over Punta Arenas, Chile, Nature, 207, 66, https://doi.org/10.1038/207066a0, 1965. a
Fogle, B. and Haurwitz, B.: Noctilucent clouds, Space Sci. Rev., 6, 279–340, 1966. a, b
Fritts, D. C., Janches, D., Iimura, H., Hocking, W. K., Mitchell, N. J., Stockwell, R. G., Fuller, B., Vandepeer, B., Hormaechea, J., Brunini, C., and Levato, H.: Southern Argentina Agile Meteor Radar: System design and initial measurements of large-scale winds and tides, J. Geophys. Res.-Atmos., 115, D19123, https://doi.org/10.1029/2010JD013850, 2010. a, b
Fritts, D. C., Baumgarten, G., Pautet, P.-D., Hecht, J. H., Williams, B. P., Kaifler, N., Kaifler, B., Kjellstrand, C. B., Wang, L., Taylor, M. J., and Miller, A. D.: Kelvin–Helmholtz Instability “Tube” and “Knot” Dynamics. Part I: Expanding Observational Evidence of Occurrence and Environmental Influences, J. Atmos. Sci., 80, 2419–2437, https://doi.org/10.1175/JAS-D-22-0189.1, 2023. a
Garcia, R. R.: Dynamics, radiation, and photochemistry in the mesosphere: Implications for the formation of noctilucent clouds, J. Geophys. Res.-Atmos., 94, 14605–14615, https://doi.org/10.1029/JD094iD12p14605, 1989. a
Gardner, C. S., Papen, G. C., Chu, X., and Pan, W.: First lidar observations of middle atmosphere temperatures, Fe densities, and polar mesospheric clouds over the north and south poles, Geophys. Res. Lett., 28, 1199–1202, https://doi.org/10.1029/2000GL012622, 2001. a
Gerding, M., Höffner, J., Lautenbach, J., Rauthe, M., and Lübken, F.-J.: Seasonal variation of nocturnal temperatures between 1 and 105 km altitude at 54° N observed by lidar, Atmos. Chem. Phys., 8, 7465–7482, https://doi.org/10.5194/acp-8-7465-2008, 2008. a
Gerding, M., Höffner, J., Hoffmann, P., Kopp, M., and Lübken, F.-J.: Noctilucent cloud variability and mean parameters from 15 years of lidar observations at a mid-latitude site (54° N, 12° E), J. Geophys. Res.-Atmos., 118, 317–328, https://doi.org/10.1029/2012JD018319, 2013a. a, b, c
Gerding, M., Kopp, M., Hoffmann, P., Höffner, J., and Lübken, F.-J.: Diurnal variations of midlatitude NLC parameters observed by daylight-capable lidar and their relation to ambient parameters, Geophys. Res. Lett., 40, 6390–6394, https://doi.org/10.1002/2013GL057955, 2013b. a, b, c
Deutsches Zentrum für Luft- und Raumfahrt, HALO Database: Mission: Southwave, Deutsches Zentrum für Luft- und Raumfahrt [data set], https://halo-db.pa.op.dlr.de/mission/111 (last access: 7 May 2024), 2024. a
Hansen, G., Serwazi, M., and von Zahn, U.: First detection of a noctilucent cloud by lidar, Geophys. Res. Lett., 16, 1445–1448, https://doi.org/10.1029/GL016i012p01445, 1989. a
Hervig, M. E., Siskind, D. E., Stevens, M. H., and Deaver, L. E.: Inter-hemispheric comparison of PMCs and their environment from SOFIE observations, J. Atmos. Sol.-Terr. Phy., 104, 285–298, https://doi.org/10.1016/j.jastp.2012.10.013, 2013. a
Hervig, M. E., Gerding, M., Stevens, M. H., Stockwell, R., Bailey, S. M., Russell, J. M., and Stober, G.: Mid-latitude mesospheric clouds and their environment from SOFIE observations, J. Atmos. Sol.-Terr. Phy., 149, 1–14, https://doi.org/10.1016/j.jastp.2016.09.004, 2016. a
Hervig, M. E., Siskind, D. E., Bailey, S. M., Merkel, A. W., DeLand, M. T., and Russell III, J. M.: The Missing Solar Cycle Response of the Polar Summer Mesosphere, Geophys. Res. Lett., 46, 10132–10139, https://doi.org/10.1029/2019GL083485, 2019. a, b
Hindley, N. P., Mitchell, N. J., Cobbett, N., Smith, A. K., Fritts, D. C., Janches, D., Wright, C. J., and Moffat-Griffin, T.: Radar observations of winds, waves and tides in the mesosphere and lower thermosphere over South Georgia island (54° S, 36° W) and comparison with WACCM simulations, Atmos. Chem. Phys., 22, 9435–9459, https://doi.org/10.5194/acp-22-9435-2022, 2022. a
Hultgren, K., Körnich, H., Gumbel, J., Gerding, M., Hoffmann, P., Lossow, S., and Megner, L.: What caused the exceptional mid-latitudinal Noctilucent Cloud event in July 2009?, J. Atmos. Sol.-Terr. Phy., 73, 2125–2131, https://doi.org/10.1016/j.jastp.2010.12.008, 2011. a
Jesse, O.: Auffallende Erscheinungen am Abendhimmel, Meteorol. Z., 2, 311–312, 1885. a
Jesse, O.: Die leuchtenden Nachtwolken, Meteorol. Z., 5, 184–186, 1889. a
Kaifler, B. and Kaifler, N.: A Compact Rayleigh Autonomous Lidar (CORAL) for the middle atmosphere, Atmos. Meas. Tech., 14, 1715–1732, https://doi.org/10.5194/amt-14-1715-2021, 2021. a, b
Kaifler, N., Kaifler, B., Wilms, H., Rapp, M., Stober, G., and Jacobi, C.: Mesospheric Temperature During the Extreme Midlatitude Noctilucent Cloud Event on 18/19 July 2016, J. Geophys. Res.-Atmos., 123, 13775–13789, https://doi.org/10.1029/2018JD029717, 2018. a, b
Kaifler, N., Kaifler, B., Dörnbrack, A., Rapp, M., Hormaechea, J. L., and de la Torre, A.: Lidar observations of large-amplitude mountain waves in the stratosphere above Tierra del Fuego, Argentina, Sci. Rep., 10, 1–10, 2020. a
Kaifler, N., Kaifler, B., Rapp, M., and Fritts, D. C.: The polar mesospheric cloud dataset of the Balloon Lidar Experiment (BOLIDE), Earth Syst. Sci. Data, 14, 4923–4934, https://doi.org/10.5194/essd-14-4923-2022, 2022. a, b
Karlsson, B., Randall, C., Shepherd, T., Harvey, V., Lumpe, J., Nielsen, K., Bailey, S., Hervig, M., and Russell III, J.: On the seasonal onset of polar mesospheric clouds and the breakdown of the stratospheric polar vortex in the Southern Hemisphere, J. Geophys. Res.-Atmos., 116, D18107, https://doi.org/10.1029/2011JD015989, 2011. a
Kirkwood, S. and Stebel, K.: Influence of planetary waves on noctilucent cloud occurrence over NW Europe, J. Geophys. Res.-Atmos., 108, 8440, https://doi.org/10.1029/2002JD002356, 2003. a
Kirkwood, S., Dalin, P., and Réchou, A.: Noctilucent clouds observed from the UK and Denmark – trends and variations over 43 years, Ann. Geophys., 26, 1243–1254, https://doi.org/10.5194/angeo-26-1243-2008, 2008. a
Klekociuk, A. R., Morris, R. J., and Innis, J. L.: First Southern Hemisphere common-volume measurements of PMC and PMSE, Geophys. Res. Lett., 35, L24804, https://doi.org/10.1029/2008GL035988, 2008. a
Leslie, R. C.: Sky glows, Nature, 32, 245–245, 1885. a
LISIRD – LASP Interactive Solar Irradiance Data Center: Composite Solar Lyman Alpha, Laboratory for Atmospheric and Space Physics (LASP) [data set], https://lasp.colorado.edu/data/timed_see/composite_lya/lyman_alpha_composite.nc (last access: 18 April 2024), 2024. a, b
Liu, G., Janches, D., Lieberman, R. S., Moffat-Griffin, T., Fritts, D. C., and Mitchell, N. J.: Coordinated Observations of 8- and 6-hr Tides in the Mesosphere and Lower Thermosphere by Three Meteor Radars Near 60° S Latitude, Geophys. Res. Lett., 47, e2019GL086629, https://doi.org/10.1029/2019GL086629, 2020. a
Lübken, F.-J. and Berger, U.: Interhemispheric comparison of mesospheric ice layers from thea LIMA model, J. Atmos. Sol.-Terr. Phy., 69, 2292–2308, https://doi.org/10.1016/j.jastp.2007.07.006, 2007. a
Machol, J., Snow, M., Woodraska, D., Woods, T., Viereck, R., and Coddington, O.: An Improved Lyman-Alpha Composite, Earth Space Sci., 6, 2263–2272, https://doi.org/10.1029/2019EA000648, 2019. a
Merkel, A. W., Thomas, G. E., Palo, S. E., and Bailey, S. M.: Observations of the 5-day planetary wave in PMC measurements from the Student Nitric Oxide Explorer Satellite, Geophys. Res. Lett., 30, 1196, https://doi.org/10.1029/2002GL016524, 2003. a
Merkel, A. W., Garcia, R. R., Bailey, S. M., and Russell III, J. M.: Observational studies of planetary waves in PMCs and mesospheric temperature measured by SNOE and SABER, J. Geophys. Res.-Atmos., 113, D14202, https://doi.org/10.1029/2007JD009396, 2008. a
Nedoluha, G. E., Gomez, R. M., Boyd, I., Neal, H., Allen, D. R., Lambert, A., and Livesey, N. J.: Mesospheric Water Vapor in 2022, J. Geophys. Res.-Atmos., 128, e2023JD039196, https://doi.org/10.1029/2023JD039196, 2023. a
Nielsen, K., Nedoluha, G. E., Chandran, A., Chang, L. C., Barker-Tvedtnes, J., Taylor, M. J., Mitchell, N. J., Lambert, A., Schwartz, M. J., and Russell III, J. M.: On the origin of mid-latitude mesospheric clouds: The July 2009 cloud outbreak, J. Atmos. Sol.-Terr. Phy., 73, 2118–2124, https://doi.org/10.1016/j.jastp.2010.10.015, 2011. a
Nussbaumer, V., Fricke, K. H., Langer, M., Singer, W., and von Zahn, U.: First simultaneous and common volume observations of noctilucent clouds and polar mesosphere summer echoes by lidar and radar, J. Geophys. Res.-Atmos., 101, 19161–19167, https://doi.org/10.1029/96JD01213, 1996. a
Olivero, J. J. and Thomas, G. E.: Climatology of polar mesospheric clouds, J. Atmos. Sci., 43, 1263–1274, 1986. a
Pertsev, N., Dalin, P., Perminov, V., Romejko, V., Dubietis, A., Balčiunas, R., Černis, K., and Zalcik, M.: Noctilucent clouds observed from the ground: sensitivity to mesospheric parameters and long-term time series, Earth Planets Space, 66, 1–9, 2014. a
Pokhotelov, D., Stober, G., and Chau, J. L.: Statistical climatology of mid-latitude mesospheric summer echoes characterised by OSWIN (Ostsee-Wind) radar observations, Atmos. Chem. Phys., 19, 5251–5258, https://doi.org/10.5194/acp-19-5251-2019, 2019. a
Reichert, R., Kaifler, B., Kaifler, N., Dörnbrack, A., Rapp, M., and Hormaechea, J. L.: High-Cadence Lidar Observations of Middle Atmospheric Temperature and Gravity Waves at the Southern Andes Hot Spot, J. Geophys. Res.-Atmos., 126, e2021JD034683, https://doi.org/10.1029/2021JD034683, 2021. a, b
Russell III, J. M., Rong, P., Hervig, M. E., Siskind, D. E., Stevens, M. H., Bailey, S. M., and Gumbel, J.: Analysis of northern midlatitude noctilucent cloud occurrences using satellite data and modeling, J. Geophys. Res.-Atmos., 119, 3238–3250, https://doi.org/10.1002/2013JD021017, 2014. a
Siskind, D. E. and McCormack, J. P.: Summer mesospheric warmings and the quasi 2 day wave, Geophys. Res. Lett., 41, 717–722, https://doi.org/10.1002/2013GL058875, 2014. a
Siskind, D. E., Stevens, M. H., Emmert, J. T., Drob, D. P., Kochenash, A. J., Russell III, J. M., Gordley, L. L., and Mlynczak, M. G.: Signatures of shuttle and rocket exhaust plumes in TIMED/SABER radiance data, Geophys. Res. Lett., 30, 1819, https://doi.org/10.1029/2003GL017627, 2003. a
Siskind, D. E., Stevens, M. H., Hervig, M. E., and Randall, C. E.: Recent observations of high mass density polar mesospheric clouds: A link to space traffic?, Geophys. Res. Lett., 40, 2813–2817, https://doi.org/10.1002/grl.50540, 2013. a
Stevens, M. H., Englert, C. R., DeLand, M. T., and Hervig, M.: The polar mesospheric cloud mass in the Arctic summer, J. Geophys. Res.-Space, 110, A02306, https://doi.org/10.1029/2004JA010566, 2005a. a, b
Stevens, M. H., Meier, R. R., Chu, X., DeLand, M. T., and Plane, J. M. C.: Antarctic mesospheric clouds formed from space shuttle exhaust, Geophys. Res. Lett., 32, L13810, https://doi.org/10.1029/2005GL023054, 2005b. a
Stevens, M. H., Lossow, S., Fiedler, J., Baumgarten, G., Lübken, F.-J., Hallgren, K., Hartogh, P., Randall, C. E., Lumpe, J., Bailey, S. M., Niciejewski, R., Meier, R. R., Plane, J. M. C., Kochenash, A. J., Murtagh, D. P., and Englert, C. R.: Bright polar mesospheric clouds formed by main engine exhaust from the space shuttle's final launch, J. Geophys. Res.-Atmos., 117, D19206, https://doi.org/10.1029/2012JD017638, 2012. a
Stevens, M. H., Randall, C. E., Carstens, J. N., Siskind, D. E., McCormack, J. P., Kuhl, D. D., and Dhadly, M. S.: Northern Mid-Latitude Mesospheric Cloud Frequencies Observed by AIM/CIPS: Interannual Variability Driven by Space Traffic, Earth Space Sci., 9, e2022EA002217, https://doi.org/10.1029/2022EA002217, 2022. a
Thomas, G.: Is the polar mesosphere the miner's canary of global change?, Adv. Space Res., 18, 149–158, https://doi.org/10.1016/0273-1177(95)00855-9, 1996. a
Tseraskii, V. K.: Astronomichesky fotometr i ego prilozhenia (Astronomical photometer and its applications), Matematicheskii sbornik, 13, 76–81, 1887. a
Vellalassery, A., Baumgarten, G., Grygalashvyly, M., and Lübken, F.-J.: Greenhouse gas effects on the solar cycle response of water vapour and noctilucent clouds, Ann. Geophys., 41, 289–300, https://doi.org/10.5194/angeo-41-289-2023, 2023. a
Witt, G.: Height, structure and displacements of noctilucent clouds, Tellus, 14, 1–18, https://doi.org/10.3402/tellusa.v14i1.9524, 1962. a
Yu, W., Garcia, R., Yue, J., Smith, A., Wang, X., Randel, W., Qiao, Z., Zhu, Y., Harvey, V. L., Tilmes, S., and Mlynczak, M.: Mesospheric Temperature and Circulation Response to the Hunga Tonga-Hunga-Ha'apai Volcanic Eruption, J. Geophys. Res.-Atmos., 128, e2023JD039636, https://doi.org/10.1029/2023JD039636, 2023. a
Yue, J., Mlynczak, M. G., Russell III, J. M., and Gordley, L. L.: Sounding of the Atmosphere using Broadband Emission Radiometry (SABER) Level 2 temperature, GATS [data set] https://saber.gats-inc.com/data.php (last access: 8 April 2024), 2024. a, b
Zalcik, M. S., Noble, M. P., Dalin, P., Robinson, M., Boyer, D., Dzik, Z., Heyhurst, M., Kunnunpuram, J. G., Mayo, K., Toering, G., Toering, M., Wooden, K., Creusot, N., Hengen, B., McVey, S., Packham, C., Prokop, G., Wilson, L., Connors, M., and Schofield, I.: In Search of Trends in Noctilucent Cloud Incidence from the La Ronge Flight Service Station (55° N 105° W), J. Roy. Astron. Soc. Can., 108, 148–155, 2014. a
Zalcik, M. S., Lohvinenko, T. W., Dalin, P., and Denig, W.: North American Noctilucent Cloud Observations in 1964–77 and 1988–2014: Analysis and Comparisons, J. Roy. Astron. Soc. Can., 110, 8–15, 2016. a


