the Creative Commons Attribution 4.0 License.
the Creative Commons Attribution 4.0 License.
Seasonal, regional, and vertical characteristics of high-carbon-monoxide plumes along with their associated ozone anomalies, as seen by IAGOS between 2002 and 2019
Thibaut Lebourgeois
Bastien Sauvage
Pawel Wolff
Béatrice Josse
Virginie Marécal
Yasmine Bennouna
Romain Blot
Damien Boulanger
Hannah Clark
Jean-Marc Cousin
Philippe Nedelec
Valérie Thouret
In situ measurements from the In-service Aircraft for a Global Observing System (IAGOS) are used to characterise extreme values of carbon monoxide (CO) in large regions of the globe in the troposphere between 2002 and 2019. The SOFT-IO model, combining the FLEXPART Lagrangian dispersion model with emission inventories over the footprint region, is used to identify the origins of the CO in the sampled plumes. The impact of biomass burning and anthropogenic emissions on such CO plumes is characterised through CO mixing ratios and simultaneously recorded ozone (O3) ones.
In the Northern Hemisphere, CO reaches its maximum values in DJF in the lower troposphere, which can be attributed to elevated anthropogenic emissions and reduced convective activity during the season. Due to the low photochemistry and the fresh age of the air masses, the O3 values of these plumes are low. CO plumes in the upper troposphere (UT) result from intense emissions and efficient vertical transport, peaking during JJA. The largest values of CO in the Northern Hemisphere are found in eastern Asia in the lower troposphere (LT) and middle troposphere (MT) and in Siberia in the upper troposphere.
Among the anomalies detected in the upper troposphere in JJA, the ones with higher associated O3 values are the ones associated with biomass-burning emissions. The middle troposphere is a combination of the characteristics of the LT and the UT, with contributions from both local emissions and long-range transport. Among the studied regions, the troposphere above the Middle East and the UT above Siberia presented extremely high O3 values.
Indian CO anomalies have different characteristics depending on the season, as the wet and dry phases of the monsoon have a strong impact on the transport of the pollutant in this region.
Similarly, the shift in the intertropical convergence zone (ITCZ) strongly impacts the seasonality of the emissions and the transport patterns above Africa. In that region, convection is no longer the limiting factor, and the transport of the CO plumes is driven by the ITCZ shift, trade winds, and the upper branch of the Hadley cell redistributing the pollution to higher latitudes.
- Article
(9246 KB) - Full-text XML
- BibTeX
- EndNote
Extreme weather can sometimes be incorrectly reproduced and predicted by global and regional models (e.g. Shastri et al., 2017; Lavaysse et al., 2019). Extreme pollution events can also be difficult to predict, as they can be explained by multiple factors such as abnormal weather conditions and/or unusually intense emissions (from anthropogenic or natural sources or both). Hence, it is essential to better understand the distributions of pollutants or their precursors in the atmosphere under such circumstances, thus leading to a better representation by the models and an improvement in their ability to predict the peak values. Among the short-lived climate forcers, tropospheric ozone (O3) is a key component of our atmosphere, and carbon monoxide (CO) is one of its main precursors. First, O3 is a pollutant that is dangerous for human life (Chen et al., 2007; Liu et al., 2018) and for crops (Fuhrer et al., 1997; Davison and Barnes, 1998; Ashmore, 2005). Secondly, it is a trace gas with a major influence on the oxidative capacity of the atmosphere, as it is the main source of hydroxyl radicals in the troposphere (Seinfeld and Pandis, 2016). Finally, it is a greenhouse gas (GHG) with a positive radiative effect in the troposphere. Moreover multiple studies have shown the upper troposphere–lower stratosphere (UTLS) to be the region with the largest changes in radiative effect from changes in the O3 mixing ratio (Riese et al., 2012; Xia et al., 2018). O3 can thus have as much of an impact on air quality as on climate. This compound in the troposphere is photochemically produced from NOx and volatile organic compounds (VOCs) or CO (Seinfeld and Pandis, 2016). Hence, a good estimation of its chemical precursors, as well as a better understanding of the processes leading to precursor distribution at a global scale, are of prime importance.
For these reasons, this study is focused on analysing the most intense anomalies of CO throughout the troposphere over different regions of the world and on how O3 distributions behave in such plumes.
Apart from being a precursor of O3, CO is also one of the biggest sinks of hydroxyl radicals (Lelieveld et al., 2016) and thus has an impact on the oxidative capacity of the atmosphere, which can lead to increased lifetimes of other greenhouse gases such as CH4. Moreover, the oxidation of CO produces greenhouse gases like O3 and CO2. CO is thus believed to cause indirect positive radiative forcing (Szopa et al., 2021). Finally, CO is a good tracer for pollution export pathways thanks to its long chemical lifetime in the troposphere – a few weeks in summer to a few months in winter (Lelieveld et al., 2016).
CO is mostly emitted in the planetary boundary layer (PBL) and can be removed via different mechanisms. These mechanisms are highly dependent on the regions and seasons. Convective activity represents an significant part of the pollution export pathway from the PBL. Some regions are more prone to exporting pollutants than others. Tropical regions have permanent convective activity due to the close proximity of the intertropical convergence zone (ITCZ; Andreae et al., 2001; Lannuque et al., 2021). Regions like southern and eastern Asia benefit from the different phases of the monsoon season (Ricaud et al., 2014; Kar et al., 2004; Park et al., 2007; Lawrence, 2004) or cold-front and warm-conveyor-belt activity (Liang et al., 2004; Ding et al., 2009; Dickerson et al., 2007). North American pollution is mostly exported through cold fronts and warm conveyor belts (Owen et al., 2006; Cooper and Parrish, 2004). CO from biomass burning in boreal regions can be emitted directly above the PBL and as high as the upper troposphere (UT) through pyroconvection, whereas tropical fires emit mainly in the lower troposphere (Rémy et al., 2017; Val Martin et al., 2010; Damoah et al., 2006). Once in the free troposphere, CO is transported via westerlies or jet streams and can be rapidly transported across the hemisphere (Stohl, 2001; Stohl et al., 2002) and can influence the atmospheric composition of a downwind continent (Liang et al., 2004; Cooper et al., 2004). In special cases, heavily polluted air masses can reach the UT (e.g. Nedelec et al., 2005). Those events happen when polluted air masses are transported upward by strong (pyro-)convective episodes, and they can have a relatively large impact on the chemistry in the UT.
CO is a precursor to O3 that has a chemical lifetime long enough to reach the UT, so in this part of the atmosphere CO is believed to have an impact on O3 mixing ratio as long as reservoirs for NOx are available (Seinfeld and Pandis, 2016).
Moreover, large values of CO in the UT are an indication of surface-influenced air masses potentially rich in many pollutants, which illustrates the importance of better understanding phenomena able to bring vast amounts of CO to the upper part of the troposphere. Studies on the export of large quantities of CO to the free troposphere or above have been facilitated by access to satellite data. An important number of studies have been focused on the eastern/southern part of Asia and especially on the export of the CO emitted into different regions (e.g. Fadnavis et al., 2011; Barret et al., 2016; Smoydzin and Hoor, 2022). Barret et al. (2016) used data from the Infrared Atmospheric Sounding Interferometer (IASI) on board the MetOp-A satellite in order to analyse the provenance of the pollution in the upper-tropospheric south Asian monsoon anticyclone (SAMA) and showed that emissions from the Indo-Gangetic Plain were uplifted during the Asian summer monsoon and trapped in its upper-level anticyclone. Smoydzin and Hoor (2022) recently used MOPITT to investigate large CO anomalies in the North Pacific and attributed those extremes to emissions from East Asia. Some studies have used the In-service Aircraft for a Global Observing System (IAGOS) database to analyse the characteristics of CO and O3 values in the troposphere and lower stratosphere. This is the case for Cohen et al. (2018), who used this dataset to study the climatology and trends in O3 and CO in the UTLS. Petetin et al. (2018b), Lannuque et al. (2021), and Tsivlidou et al. (2023) used IAGOS to study the characteristics of CO in different regions of the world or at different altitude layers. Tsivlidou et al. (2023) studied CO and O3 characteristics in the tropical regions. They highlighted the origins of the CO in the different regions of the tropics. They especially showed the importance of anthropogenic emissions to explain the values of CO in the tropical troposphere. Lannuque et al. (2021) studied the meridional distribution of O3 and CO over Africa using IAGOS and the satellite IASI (Infrared Atmospheric Sounding Interferometer). They showed the importance of the ITCZ and the upper branch of the Hadley cell for the redistribution of the pollutants over Africa. A pollutant emitted at the surface is transported by trade winds toward the ITCZ, where it is transported to the UT and redistributed to higher latitudes by the Hadley cell. Petetin et al. (2018b) studied the CO vertical profile over different airport clusters. They characterised the seasonal profile as well as the seasonality of the highest CO anomalies (95th and 99th percentiles). They showed strong seasonal variability in the most extreme anomalies in northern North America, which were due to biomass-burning (BB) emissions. They also looked at the origins of the CO responsible for the CO anomalies at the different airport clusters.
This result emphasises the importance of transport when studying CO extremes in remote parts of the atmosphere. Most of the studies cited above focused on the export of plumes with high CO mixing ratios in one region at a certain altitude, and only a few of them were focused on the most extreme CO anomalies. IAGOS (In-service Aircraft for a Global Observing System; http://www.iagos.org, last access: November 2024) is European research infrastructure using commercial aircraft in order to measure the atmospheric composition. Thanks to the IAGOS database, we benefit from a large and long-term in situ sampling of the atmosphere, complementing the dedicated field campaigns and more-global satellite datasets.
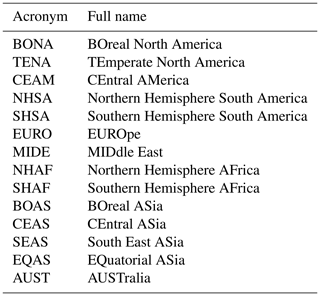
The goal of this paper is to characterise the seasonal, regional, and vertical CO mixing ratio anomalies for different regions over the globe for almost 20 years as seen by IAGOS, along with the simultaneously recorded O3 between 2002 and 2019. The analysis will explore CO anomalies, their source types (anthropogenic vs. biomass burning), and the regions of emission (14 defined regions of the Global Fire Emissions Database (GFED); Giglio et al., 2013). It aims to characterise the distributions and origins of extreme events of polluted plumes in terms of (i) mixing ratios of CO and O3 and (ii) frequency and seasonality at different altitudes. O3 values are presented as additional information, thus characterising the average O3 content in those plumes of extreme CO. Note that a detailed analysis of the O3 values is outside the scope of the current paper. Such characteristics will form a set of diagnostics that are of particular importance to further test the ability of the models to reproduce extreme events and the impact on the distributions of CO and O3 throughout the troposphere.
2.1 IAGOS dataset
The data used in this study are from the European research infrastructure IAGOS (Petzold et al., 2015; Thouret et al., 2022), which has measured different trace gases, particles, and meteorological components from passenger aeroplanes over several decades. IAGOS builds on the experience of the MOZAIC programme (Marenco et al., 1998), which was originally set up in 1994. O3 and water vapour were the initial compounds measured, with CO measurements added in December 2001. O3 and CO are measured with a UV and an infrared absorption photometer, respectively (Thouret et al., 1998; Nédélec et al., 2015), with a total uncertainty of ±2 ppb ± 2 % for O3 and ±5 ppb ± 5 % for CO and with a time resolution of 4 and 30 s, respectively. IAGOS took over from MOZAIC in 2011, including an overlap period between 2011 and 2014 (Petetin et al., 2016). The IAGOS European research infrastructure also includes the complementary predecessor programme CARIBIC (Brenninkmeijer et al., 1999). Consistency between the MOZAIC, IAGOS, and CARIBIC datasets is regularly checked following the methodology of Nédélec et al. (2015) and Blot et al. (2021), to ensure the internal consistency of the CO and O3 measurements since 1994.
As this study focuses on CO and O3, the dataset used is from the start of the CO measurement (January 2002) to December 2019. This dense network of measurements allows an unprecedented number of pollution events to be sampled from an in situ dataset with a higher vertical resolution than satellite datasets. In total, more than 43 000 flights were performed by the different aircraft during this period. These flights were performed by 10 different airlines, allowing in situ measurements in several regions of the world. In addition, each flight takes two vertical profiles (during takeoff and landing). In contrast with other in situ datasets from field campaigns, IAGOS is not dedicated to the study of a single phenomenon but rather to the long-term sampling of the atmosphere. This makes the large and precise IAGOS dataset particularly suitable for a thorough analysis of the variability in the CO anomalies (see Sect. 2.3.2 for the formal definition) in the different parts of the troposphere.
2.2 SOFT-IO, the source–receptor link
Since IAGOS is not a research project focused on the study of one phenomenon in the atmosphere but is rather a global exploratory observing system sampling the atmosphere regardless of its current state, a tool was needed to obtain information on the type of source influencing the air mass (biomass-burning or anthropogenic emissions). This is the main usage of the SOFT-IO model.
SOFT-IO is described in detail in Sauvage et al. (2017a) and has been used in scientific studies (e.g. Petetin et al., 2018b; Lannuque et al., 2021; Cussac et al., 2020; Tsivlidou et al., 2023), so only a broad description of the model is given here. SOFT-IO is a model based on FLEXPART (Stohl et al., 2005) and emission inventories of anthropogenic and biomass-burning sources (described below) along the IAGOS flight tracks. A 20 d back trajectory is coupled to the emissions inventories to calculate the CO contributions from recent emissions. The model uses wind fields from ERA-Interim, with a horizontal resolution of 1°×1° and 137 vertical levels.
The biomass-burning inventory used in this version of SOFT-IO is the 1.2 version of the Global Fire Assimilation System (GFAS; Kaiser et al., 2012). The horizontal resolution is 0.1°×0.1°, with a daily temporal resolution. The top emission altitude is provided by GFAS (v1.2) and is calculated using the fire plume rise model (Paugam et al., 2015; Rémy et al., 2017). GFAS was chosen for its temporal resolution as well as its ability to model emission height. The anthropogenic emissions are from the Community Emissions Data System (CEDS; McDuffie et al., 2020), with a resolution of 0.5°×0.5° and a monthly temporal resolution.
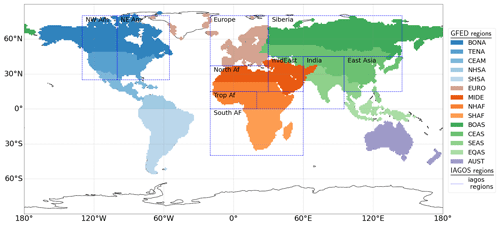
Figure 1Map of the IAGOS regions (dotted lines) and the GFED-defined regions (in colour). See Table A1 in the Appendix for the full names of the acronyms.
SOFT-IO models the CO source contributions and the geographical origin of the emitted CO. The geographical origin of the modelled CO is defined by the same 14 regions as were defined in the GFED project (see Fig. 1). These contributions cannot be directly compared with observations because SOFT-IO only models contributions from recent emissions (and not older contributions or the background mixing ratio). SOFT-IO is therefore used here as a qualitative tool to assess whether the modelled contributions are mainly due to anthropogenic or biomass-burning emissions and to label the corresponding observed plume as such.
Sauvage et al. (2017a) and Tsivlidou et al. (2023) made a thorough statistical evaluation of SOFT-IO. The model had a really good score at the detection of the CO anomalies (above 93 % on average). Detection frequency was at its maximum in the lower troposphere (LT), as most anomalies are from local emissions at this altitude. In the middle troposphere (MT) and upper troposphere (UT), the scores were lower but remained above 80 %, as the simulation of horizontal and vertical transport could suffer from some errors. It is important to note that the study presented here aims to use SOFT-IO only as a qualitative tool to attribute a source type and a relative geographical origin to the emissions leading to the detected anomalies. SOFT-IO is a model that has already been used in several studies similar to the current study (e.g Petetin et al., 2018b; Cussac et al., 2020; Lannuque et al., 2021; Tsivlidou et al., 2023).
In addition to the various observed parameters and to the SOFT-IO products, the IAGOS data centre provides some meteorological fields from the ECMWF operational analysis interpolated along the IAGOS flight track as ancillary data (https://doi.org/10.25326/3, Sauvage et al., 2017b). Among these parameters (potential temperature, planetary boundary layer height, potential vorticity), the potential vorticity (PV) is used to define whether the CO observations are above or below the dynamical tropopause (defined at 2 PVU as in Thouret et al., 2006; Cohen et al., 2018).
2.3 Methods
2.3.1 Regions and seasons
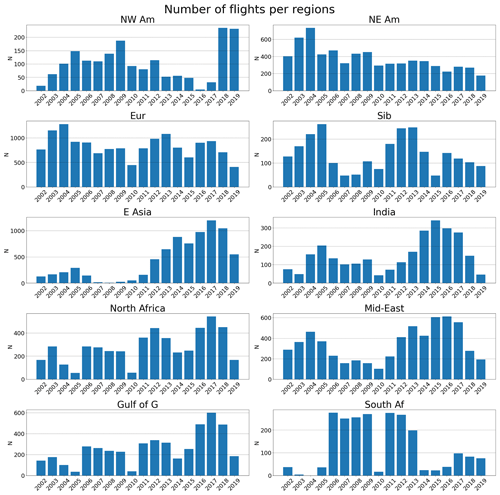
In order to synthesise the seasonal and regional characteristics of the CO anomalies, the observations from IAGOS are split into different regions. These regions are defined to be characteristic of specific meteorological and chemical regimes (sources of precursors) similar to in Cohen et al. (2018). This study is dedicated to the higher values of the CO distribution, so the sizes of the regions are larger here in order to increase the number of data points per region and not miss any extreme events. As IAGOS uses commercial aircraft to sample the atmosphere, the different regions are naturally not sampled equally over the same time period (see Fig. B1), but a minimum of 1500 flights per region over the full sampling period is required.
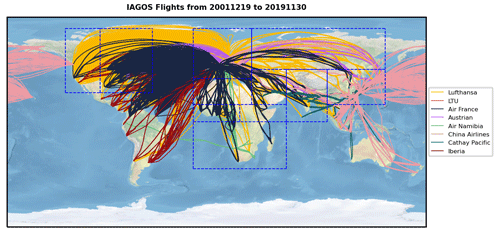
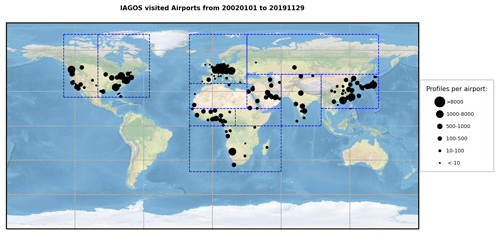
Figure 1 shows the 10 regions defined and used in this study (dotted lines). In addition, the colours of the map indicate the regions as defined by GFED, which are used to assign an origin to the emitted CO (see Sect. 2.2 and Table A1 in the Appendix for the full names of the acronyms). Figure B2 in the Appendix shows the IAGOS flight tracks from the 18 years of data. It is important to keep in mind that we are studying data from aircraft measurements, so they follow specific trajectories. Figure B3 in the Appendix shows the position of each airport visited by IAGOS aircraft. The lower and middle troposphere are sampled by IAGOS during landing and takeoff of the aircraft, so in proximity to these airports. Note that the average horizontal distance between the airport surface and 8 km in altitude is about 300 km (Petetin et al., 2018a). Figure B1 in the Appendix shows the availability of the data in each region. The number of flights is at a maximum over Europe due to the history of IAGOS and the dense traffic between the USA and Europe. However, since 2006, regular flights from Europe to southern Africa have been added. In addition, regular flights to eastern and equatorial Asia have been added since 2012.
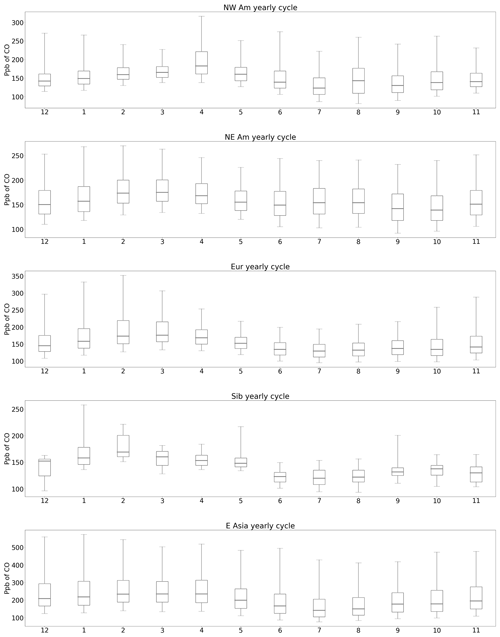
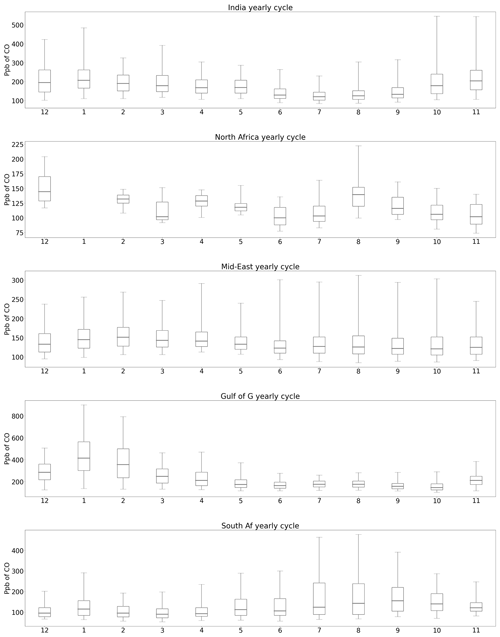
In the Northern Hemisphere midlatitudes (NW Am, NE Am, Eur, Sib, and E Asia), four periods of 3 months are defined according to the meteorological seasons (DJF, MAM, JJA, SON). Note that this study focuses only on the boreal summer and winter periods, one characterising the maximum of CO due to anthropogenic emissions in winter and the other the maximum of forest fire activity in summer (Sect. 3.1). The two transitional periods are not presented here, as we intend to highlight the influence of the biomass-burning emissions on the CO signal. In Africa, the seasons are defined according to the shift in the ITCZ and the rainy seasons (as defined in Lannuque et al., 2021): DJFM and JJASO. The results for the two transitional periods (April–May and November) are not presented here. For the Middle East, the seasons of interest for this study are defined in the same way as for Africa because DJFM and JJASO there also correspond to the maximum and minimum of the CO seasonal cycle, respectively (Figs. C1 and C2). Furthermore, the Middle East is connected to Africa in terms of emissions, as seen in Fig. 1 (Sect. 3.3). India (as defined Fig. 1) is also an interesting region regarding the different influences of biomass-burning and anthropogenic emissions from the different continents. Differently from the northern midlatitudes and northern Africa or the Middle East, the four seasons will be discussed here for India (Sect. 3.2).
Finally, in order to characterise these CO extremes at different altitudes, the datasets are divided into three vertical layers.
-
Lower troposphere (LT): from the surface to 2000 m.
-
Middle troposphere (MT): from 2000 to 8000 m.
-
Upper troposphere (UT): above 8000 m and below the dynamical tropopause (defined as 2 PVU as in Thouret et al., 2006; Cohen et al., 2018).
IAGOS samples the lower and free troposphere during landing and takeoff. Petetin et al. (2018a) showed that close to the surface, the IAGOS measurements are representative of urban areas and provide similar measurements to urban background stations. At higher altitudes, in the free troposphere, the samples are less influenced by local emissions and are therefore representative of regional background conditions following the flight tracks shown in Fig. B2 in the Appendix.
2.3.2 Definition of the CO anomalies
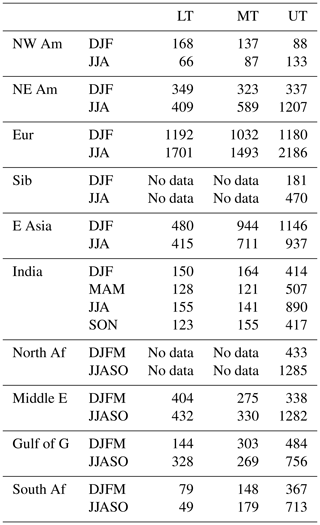
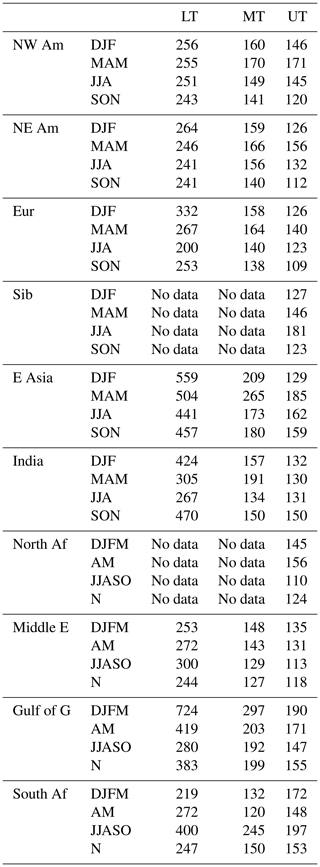
Figure 2 illustrates the detection of two plumes in the IAGOS observations. The CO anomalies are defined as CO values exceeding the threshold for three consecutive measurements (i.e. a distance of approximately 3 km during the cruising phase). The chosen threshold used in this study is the 95th percentile (q95) calculated for each region, season, and altitude range (see Table 1). Depending on the altitude layer, between 49 and 2186 anomalies have been observed per region, season, and altitude layer (Table A4).
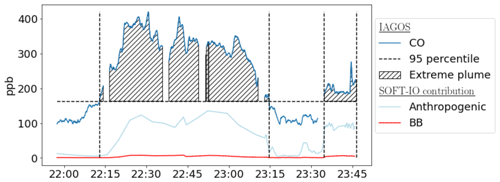
Figure 2Illustration of the method used to define the CO anomalies applied to part of an IAGOS flight (data here are taken over Siberia at cruising altitude (around 250 hPa) on 7 June 2013). The dark-blue line represents the CO measured by IAGOS. The horizontal dashed line represents the seasonal and regional 95th percentile of the IAGOS dataset (181 ppb). It is used as the threshold for the CO anomalies in this region and season at this altitude level (UT). The hatched area represents the defined anomalies. The light-blue and red lines represent the modelled anthropogenic and biomass-burning contributions modelled by SOFT-IO. The gaps are missing data.
Table 1q95 values (in ppb) used as thresholds for the different regions for different seasons. No airports in North Africa and Siberia are visited by IAGOS aircraft, so there are no data available for the MT and LT layers.
SOFT-IO is then used as a qualitative tool to assign a source type to each of the detected anomalies. This diagnostic is only applied if the contributions modelled by SOFT-IO are above a detection threshold, defined as 5 ppb. Several thresholds were tested during this study and did not have a significant impact on the results. According to the method used in Petetin et al. (2018b), the four categories are defined as follows.
-
Anthropogenic – if the anthropogenic contributions calculated by SOFT-IO are at least twice those of the biomass burning.
-
Biomass burning – if the biomass-burning contributions calculated by SOFT-IO are at least twice those of the anthropogenic contributions.
-
MIX sources – if neither of the contributions calculated by SOFT-IO is twice the other.
-
The contributions were observed by IAGOS but not detected by SOFT-IO.
In Fig. 2, both plumes of high CO mixing ratios are clearly attributed to anthropogenic sources. In addition, SOFT-IO provides information on the emitting region of the contributions (see Sect. 2.2). This diagnosis is repeated for each plume detected. Thus, we can compute the main emitting regions responsible for all detected plumes.
The first part of the results is dedicated to the five regions in the Northern Hemisphere midlatitudes (NW and NE America, Europe, Siberia, and East Asia), then India and Africa (North Africa, the Gulf of Guinea and southern Africa), and the Middle East. Each vertical layer will be treated individually from the lower troposphere (LT) to the upper troposphere (UT). Siberia and North Africa are only sampled in the UT. The characteristics of the extreme-CO plumes will be given before presenting the associated O3 distributions in such plumes.
3.1 Northern Hemisphere midlatitudes
3.1.1 Lower troposphere (LT)
In the LT (Fig. 3) in most regions, the distribution of CO is higher in DJF than in JJA due to the higher anthropogenic emissions during the winter months (e.g the mean of the anthropogenic emissions from CEDS in Europe is 60 % higher in DJF than in JJA).
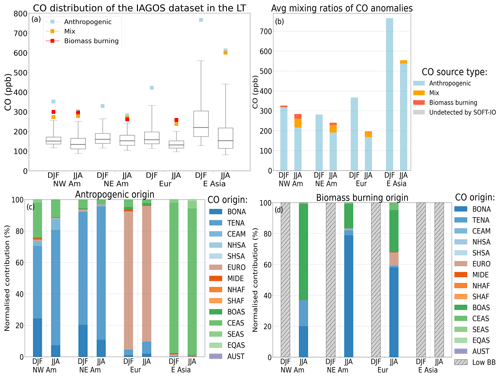
Figure 3(a) CO measured by IAGOS in the LT (below 2 km). The boxplots represent the 5th, 25th, 50th, 75th, and 95th percentiles of the CO distribution, while the coloured squares represent the mean values of CO inside the detected anomalies (each colour represents a type of CO anomaly attributed to a different source with SOFT-IO: red for biomass burning, blue for anthropogenic, and orange for MIX sources). (b) Bar plot showing the averaged mixing ratios of CO in all the detected anomalies (> q95) in the LT in each region for JJA and DJF (given by the total height of the bar) and the proportions according to the different sources (blue for anthropogenic, red for biomass burning, and orange for MIX; the relative height of the coloured blocks represents the proportion of each type of anomalies). The proportion of plumes where no contribution is modelled by SOFT-IO is represented in grey (in this figure all anomalies were detected by SOFT-IO out of 4804 observed). (c) Regional origin (according to GFED regions, as in Fig. 1) of the anthropogenic contributions of the anomalies associated with MIX and anthropogenic sources in the LT in the Northern Hemisphere extratropics (the hatched part covers regions/seasons with not enough anomalies attributed to the MIX or anthropogenic categories). (d) Same for the origin of the biomass-burning contributions associated with MIX and biomass-burning anomalies. Low BB (hatched grey patches) is applied if a region has less than 3 % of its plumes attributed to either MIX or BB sources.
The higher levels of CO near the surface in winter are also due to the weak convection and mixing in this season, which allows pollutants to accumulate in the boundary layer (Cohen et al., 2018), and the longer chemical lifetime due to lower photochemistry during this season (Novelli et al., 1998).
IAGOS observations in the LT are similar to those from urban background stations (Petetin et al., 2018a). So as expected, anthropogenic contributions have a strong local influence in this layer (Fig. 3c). For example, anthropogenic contributions in the LT are almost entirely from local sources in NW America, NE America, and Europe. Intercontinental transport generally needs no more than a few days in the in the middle troposphere of the Northern Hemisphere because of the strong prevailing winds there (Jaffe et al., 1999; Liang et al., 2007). Polluted air masses can also be transported for long distances at lower altitudes or sink to the PBL after having been transported at higher altitudes, but this generally requires a few additional days (Stohl et al., 2002). Most of the European pollution is exported via low-altitude pathways and can impact the concentration of CO in the LT of eastern Asia, North America, and northern Africa (Huntrieser and Schlager, 2004; Duncan et al., 2008; Li et al., 2002). However those contributions in North America and East Asia are generally low compared to the mixing ratio of CO in the LT of those regions. Here, we are interested in the extreme values at the surface close to the major airports of the region (and therefore close to urbanised areas), so the low contributions from Europe are of minor importance but could have more impact in remote parts of Asia.
In DJF, as there are almost no fires in the Northern Hemisphere midlatitudes, almost all of the CO anomalies are attributed to anthropogenic emissions.
In JJA, even if they remain rare, some regions have a few of their anomalies attributed to biomass-burning (BB) emissions, which are mostly from boreal regions. Even in Europe, more than half of the BB contributions of the MIX and BB anomalies are from boreal North America.
In the LT, the highest values of CO are found in eastern Asia during both seasons. The anomalies can even reach a mixing ratio over 700 ppb in DJF. Those extremely high values are due to the emissions from local anthropogenic sources and especially from the industrial and residential sectors (Qu et al., 2022).
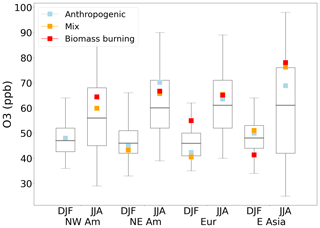
As outlined in the introduction, CO is an interesting tracer for surface-influenced air masses, but it is also interesting due to being a precursor of O3. It is therefore also important to analyse the O3 mixing ratio within the detected CO plume. This is shown in Fig. 4. The figure shows the seasonal distribution of O3 measured in the 18 years of data and the values of O3 measured in the different types of CO anomalies.
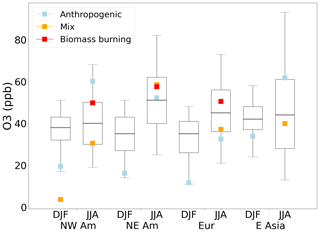
Figure 4O3 distribution measured by IAGOS in the lower troposphere (LT; from the surface to 2000 m). Coloured points represent O3 mixing ratios inside the detected CO anomalies (each colour represents a type of CO anomaly attributed to a different source by SOFT-IO). The boxplots represent the 5th, 25th, 50th, 75th, and 95th percentiles of the O3 distribution of the complete database (of these regions, seasons, and vertical layers) during the period studied with the simultaneous CO records.
In the LT in DJF, our results are similar regardless of the region. We observe values of O3 inside the CO anomalies close to the minima of the seasonal O3 cycle. We can see that in addition to the low photochemical activity linked to the boreal winter, we see a cycle of O3 destruction in the CO-rich fresh air masses. These low values of O3 in polluted urban air masses are often characteristic of NO titration (e.g. Yang et al., 2019). In JJA, the mean O3 mixing ratios in the CO anomalies are closer to the median. However, there are strong regional variations showing the significant local influence at this altitude. East Asia is a region with significant O3 values and a region that has frequent high-O3 episodes (Chang et al., 2017; Lu et al., 2018). In this region, anthropogenic CO anomalies are also associated with elevated O3 values (20 ppb above the median).
3.1.2 Middle troposphere (MT)
At higher altitudes, the measured CO is less influenced by the local conditions and emissions. This altitude layer is more impacted by long-range transport, as the strong westerly winds present in the free troposphere (middle and upper troposphere) allow the rapid transport of the polluted air masses across the Northern Hemisphere midlatitudes. (Jaffe et al., 1999; Stohl et al., 2002; Liang et al., 2007).
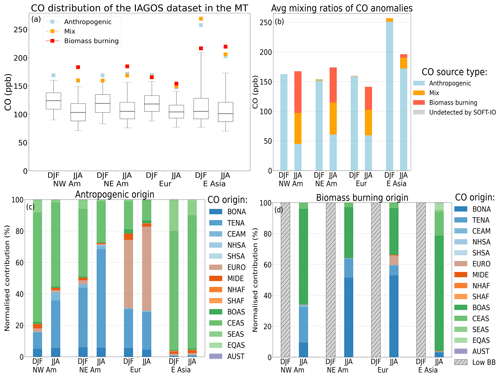
Figure 5Same as Fig. 3 but for the MT (between 2000 and 8000 m). At this altitude, 24 anomalies out of the 5341 observed were not detected by SOFT-IO, representing 0.4 % (in grey in panel (b)).
In the MT (Fig. 5), the CO distribution presents a maximum in DJF. In this layer of the atmosphere, the local influence of the anthropogenic contributions is still strong (Fig. 5c). The warm conveyor belts (WCB) and frontal systems are well-known efficient processes for long-range transport of pollution (e.g. Cooper et al., 2004; Ding et al., 2009), which can transport polluted surface air masses to higher altitudes where strong winds (e.g. the jet stream at midlatitude) can rapidly transport those air masses to another continent. So, in general, there is significant export of the pollutant from the regions at the western part of an ocean (start of the WCB), and the continent in the eastern part of the ocean will be the receptor (Europe and western America; Stohl et al., 2002; Huntrieser and Schlager, 2004; Cooper and Parrish, 2004). This feature is captured well by SOFT-IO, where we can see that a significant part of the contribution in NW America is coming from eastern Asia. It is also true for Europe, where more than half of the contributions are coming from either North America or Asia. We can also see the lower contribution from long-range transport in summer when the WCB is weaker (Cooper and Parrish, 2004). East Asia is mostly impacted by its own pollution during the two seasons. The upwind continent is Europe, and there is no efficient vertical transport pathway over this continent. Therefore, it is not prone to exporting its pollution. In contrast, East Asia is one of the regions with the most efficient vertical transport (Stohl et al., 2002).
In JJA, BB contributions come mostly from boreal America and Asia. Most of the time, the airports sampled by IAGOS are further south than most of the intense boreal fires. So it is not surprising that little influence from the BB is detected in the LT. However, the influence from the BB grows with altitude. In the MT, we observe an increased number of episodes attributed to either BB emissions or MIX sources in the MT of America and Europe in JJA (Fig. 5b). Figure 5a shows that the plumes attributed to BB emissions are the most intense in JJA.
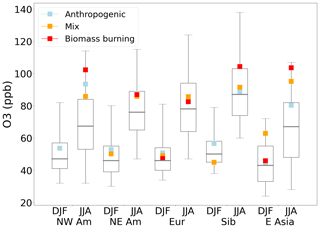
Figure 6 shows the mixing ratio of O3 associated with high values of CO. In the MT, there is almost no signal during the winter months (the mixing ratio of O3 inside CO anomalies is close to or below the median) because of the relatively weak photochemical activity. In JJA, the O3 mixing ratio within the CO anomalies is between the median and the 75th percentile of the total O3 distribution, so the mixing ratio of O3 in the CO plume is on average 5 to 10 ppb higher than the median values depending on the region. In East Asia, BB (and MIX) plumes are rare and mostly come from boreal northern Asia. O3 values within those plumes are 20 ppb higher than the median and 10 ppb higher than the plumes from anthropogenic emissions.
3.1.3 Upper troposphere
To reach the UT, a polluted air mass needs to meet with an intense vertical transport episode, but when in the UT, those air masses can rapidly cross the entire hemisphere.
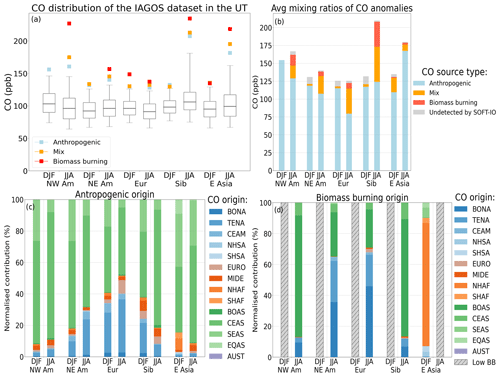
Figure 7Same as Fig. 3 but for the UT (between 8000 m and the dynamical tropopause (2 PVU)). At this altitude, 223 anomalies out of the 7865 observed were not detected by SOFT-IO, representing 2.8 % (in grey in panel (b)).
Figure 7 is the same as Fig. 3 but for the upper-tropospheric layer. Some regions, like Europe, do not show significant variations between the 95th percentiles in JJA and DJF, while other regions, like Siberia and East Asia, present drastic increases during JJA.
We can see in Fig. 7b that in DJF, the majority of the plumes are explained by anthropogenic emissions. In JJA, the number of anomalies attributed to BB increases with the onset of the Northern Hemisphere fire season. However, a higher number of anomalies are still explained by anthropogenic emissions, which is different from what we observe in the MT over America and Europe. This is due to the fact that the most-intense pyroconvection episodes, which involve direct emission into the UT, are rare (Labonne et al., 2007). Thus, regardless of the emission intensity, vertical transport is required for a CO plume to reach the UT. Anthropogenic emissions continuously inject CO into the boundary layer. Consequently, episodes of significant vertical transport of air masses from the surface to the UT may cause a drastic increase in the upper-tropospheric CO mixing ratios even if local emissions are not higher than usual. However, due to the intensity of BB emissions, when these plumes reach the UT, they often are the most-intense CO anomalies (Fig. 7a). The most-intense anomalies are detected in northwestern America and Siberia (and a small proportion in East Asia), and they are attributed to emissions from biomass burning in boreal Asia. In the UT, even if those anomalies are not the most frequent, they are extremely intense. Siberia and East Asia both present two of the most significant amplitudes of the CO seasonal cycle. The large increase in CO in JJA in Siberia with respect to DJF can be partly attributed to the local fires. However, approximately 60 % of the episodes are still related to anthropogenic emissions, and around 25 % are due to MIX sources. The mean mixing ratio of these episodes during the summer months also increased significantly compared with the winter values. Furthermore, East Asia shows a similar summertime increase in the mixing ratio of its extremes without a significant number of BB plumes.
In DJF in Siberia, the anthropogenic contributions are small, and there is no clear signal. In JJA however, there is a 50 % increase in the anthropogenic contribution, of which 70 % comes from CEAS. The low mixing ratio and contribution in winter are partly explained by the presence of the Siberian high, which prevents the export of polluted surface air masses from the eastern part of Asia (Pochanart et al., 2004).
However, the wind direction changes with the onset of the East Asian summer monsoon. In JJA, there are strong southeasterly ascending winds that transport pollution and moisture into the upper troposphere of East Asia. These air masses can even reach the northern part of Siberia, which can explain the contribution of CO from CEAS during this season in Siberia. It can also explain the very low number of episodes associated with fire emissions (MIX and BB) in East Asia, as heavy rainfall prevents fires in this region, and the prevailing winds from the Pacific Ocean are less likely to bring air masses polluted by Siberian fires (Pochanart et al., 2004).
In the other regions (North America and Europe), the most intense anomalies remain those attributed to BB emissions, and they represent around 5 % to 10 % of the number of anomalies. As we stated previously, the BB anomalies in NW America are attributed to emissions from boreal Asian fires. In NE America and Europe, those anomalies are less intense, and they are attributed to fires from boreal America, boreal Asia, and temperate North America (TENA). Most of the BB contributions are from the two boreal regions (boreal America and boreal Asia), which is probably due to the higher emissions height of those fires increasing the probability of the emitted CO reaching the UT (Dentener et al., 2006).
In the two regions of North America, the main anthropogenic contributions to CO anomalies come from CEAS, but it can be seen that the influence of American emissions is greater in the eastern part, while the contributions in the western part originate almost entirely from CEAS. Europe's anthropogenic contributions come from Asia and North America. Only a small fraction is emitted locally, which is not surprising given the relatively weak convective activity in the region (Stohl et al., 2002).
The most-polluted air masses in the UT are often rapidly transported upward after their emission (Huang et al., 2012). Among the emitting regions, eastern Asia is one that is more prone to vertical uplift of its pollutants because of the convective activity of the regions (WCB, east Asian monsoon, etc.; Stohl et al., 2002) and the presence of the Tibetan plateau, which can play an important role by lofting polluted air masses into the upper part of the troposphere (Bergman et al., 2013; Pan et al., 2016). Once in the UT, those air masses can be transported around the hemisphere, which can be seen in the anthropogenic contribution from SOFT-IO, where CEAS alone accounts for at least 40 % of the anthropogenic contribution in the different regions and even reaches 79 % in NW America. The total emissions from CEAS during this period account for about half of the Northern Hemisphere emissions. There is significant vertical uplift also in North America because of frequent deep-convection episodes and the midlatitude cyclone starting in the regions (Cooper and Parrish, 2004).
The European region, in contrast, is identified as having few vertical uplift pathways (Huntrieser and Schlager, 2004). It means that the high level of emissions is not the only parameter to take into account, but there is also the fact that the East Asian atmosphere is characterised by strong convective activity (e.g. Stohl et al., 2002), which allows the polluted air to be quickly transported to the MT or UT, where it can be distributed all over the Northern Hemisphere.
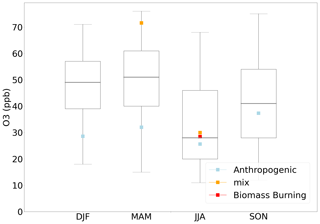
Mixing ratios of O3 within CO anomalies are shown in Fig. 8. As explained in Sect. 2, the UT is defined as being below the 2 PVU level. It may therefore include some stratospheric air or at least part of the mixing layer. The O3 values measured within the CO anomalies shown in Fig. 8 are mostly typical of tropospheric values, but it is possible that a small fraction of them are contaminated by some stratospheric air masses. O3 presents a stronger seasonal cycle than CO (Fig. 8). In DJF, the O3 mixing ratio is at its minimum, and values within the CO anomalies are slightly lower than the 75th percentile in most regions. However, during the summer months there are significant regional variations. Some regions show values of O3 between the 75th and 95th percentiles inside the CO anomalies, whereas in Europe, for example, the O3 values are just above the median level.
Previous studies already noticed the O3 maximum over Siberia (Gaudel et al., 2018). Cohen et al. (2018) suggested that this maximum could be due to a higher stratospheric influence over the region. In the anthropogenic CO anomalies, the O3 values are close to the background. However, as demonstrated in Fig. 7, a significant portion of polluted air masses is transported from the surface of East Asia to the UT of Siberia via the East Asian summer monsoon, which could potentially influence the production of O3.
On average for the other regions, O3 mixing ratios in CO anomalies are 13 ppb higher than their respective median, and this difference can reach 21 ppb for the CO anomalies associated with biomass-burning emissions. The CO anomalies with the highest values of O3 are the anomalies associated with BB emissions from boreal Asia and detected in NW America, East Asia, and Siberia. One reason for these high ozone levels is that those anomalies all come from Siberia, a region with very high ozone levels. Moreover, we saw that those fires were responsible for particularly intense CO anomalies and so probably emitted not only CO but also many reactive compounds such as VOCs and NOx, which are other precursors of O3. As for episodes associated with anthropogenic emissions, the associated mixing ratios of O3 are often above median levels, but a lot of variation can be observed depending on the region. In NW America in JJA, levels of O3 inside the anthropogenic CO anomalies are high (93 ppb, so 10 ppb above the 75th percentile); those anomalies are associated with emission from CEAS, so the air mass rich in pollutants had the time to produce a significant quantity of O3 before reaching the North American continent. Production or elevated values of O3 during the transport of polluted plumes from East Asia have already been observed during the Intercontinental Transport and Chemical Transformation 2002 campaign (ITCT 2K2; Nowak et al., 2004; Hudman et al., 2004), so similar processes could be at play here.
3.2 India
The seasonal cycle of CO over India is characterised by a minimum in JJA in the LT and MT and a maximum in SON and DJF in the LT, superimposed by a maximum in MAM in the MT (Figs. D1 and D2 in the Appendix). The Asian monsoon has a strong influence on the redistribution of the pollutants emitted at the surface in this part of the world (Lawrence, 2004). Interesting and specific features appear in all four seasons in the UT, as highlighted in Fig. 9. DJF and MAM have a similar signal in the UT, as the same sources are at the origin of most of the CO anomalies. We can see in Fig. 9b that half of the CO anomalies are linked to BB emissions (pure BB and MIX sources) and half are pure anthropogenic anomalies. From December until late March it is the fire season in the Northern Hemisphere of Africa, and we can see in Fig. 9d that those emissions can reach the UT of India. It is also the period of the winter monsoon in southern Asia. This season is characterised by weak convective activity and northerly prevailing wind, transporting pollution at low altitudes toward the Indian Ocean (Lelieveld et al., 2001; Lawrence and Lelieveld, 2010). This consequently explains the relatively high values of CO in the LT and MT during this period (Figs. D1 and D2 in the Appendix), as well as the low contribution from SEAS in the UT. In the UT, the anthropogenic CO anomalies are influenced by CEAS and SEAS but also by NHAF. In JJA, it is the wet phase of the monsoon in India, so the convective activity and precipitation associated with this period (Kar et al., 2004) lead to rapid transport of the South Asian emission to the UT while preventing BB: almost all the CO anomalies are caused by anthropogenic emissions from India or regions in close proximity (SEAS and CEAS). In SON, the CO anomalies are at their maximum and are caused by anthropogenic emissions from SEAS and CEAS but also by BB emissions from EQAS. The BB anomalies are clearly the most intense during this season. It is interesting to note that the vast majority of the BB anomalies recorded by IAGOS during SON were from 2015. That year was hit by a strong El Niño phenomenon characterised by especially intense fires over the equatorial part of Asia (Field et al., 2016). According to Kar et al. (2004), during this season in 2002 there was also significant transport of CO from tropical fires.
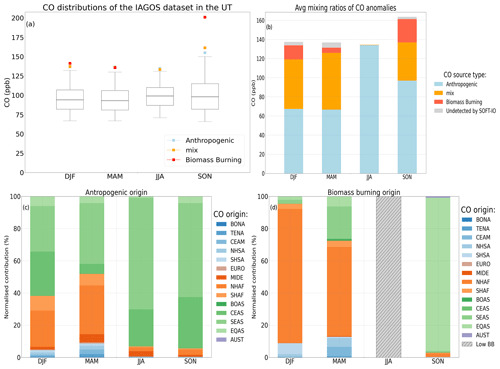
Figure 9Same as Fig. 3 but for only the Indian region during the four seasons for the UT (between 8000 m and the dynamical tropopause). In MAM in panel (a) the other squares are below the one from BB origins). At this altitude, 37 anomalies out of the 2228 observed were not detected by SOFT-IO, representing 1.7 % (in grey in panel (b)).
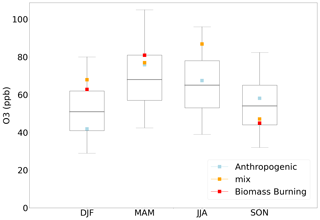
The O3 cycle shown here is similar to the cycle described in Lal et al. (2014). In the LT (see Fig. D3 in the Appendix), the minimum values of O3 are reached during the summer monsoon in JJA. The low values can be explained by the increased marine influence during this period (Lawrence and Lelieveld, 2010). At this altitude, the O3 values recorded at the same time as the CO anomalies are low and show the low O3 production in those plumes.
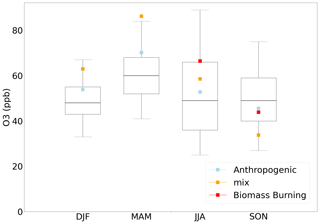
In the MT (see Fig. D4 in the Appendix) and UT (see Fig. 10), the maximum of the O3 is reached during MAM, and the minimum is reached during DJF. In the UT in DJF and MAM, some of the CO anomalies come from northern African BB. Those plumes are associated with higher values of O3 (11 and 10 ppb above the median, respectively, for DJF and MAM). CO anomalies in JJA are caused by the local emission of anthropogenic CO rapidly transported to the UT by the strong convective activity of the South Asian summer monsoon. This rapid transport could explain why the associated values of O3 are close to the median (65 ppb). In the post-monsoon season (SON), BB anomalies from equatorial Asia are added to the local anthropogenic anomalies. The values of O3 in the BB plumes are low and close to the 25th percentile (44 ppb), which is explained by the lower background values of O3 in equatorial Asia compared to India (Cohen et al., 2018).
3.3 Africa and the Middle East
3.3.1 Lower and middle troposphere
This section is focused on the CO anomalies detected over Africa and the Middle East. As the results in the LT and in the MT present similar characteristics they are treated simultaneously.
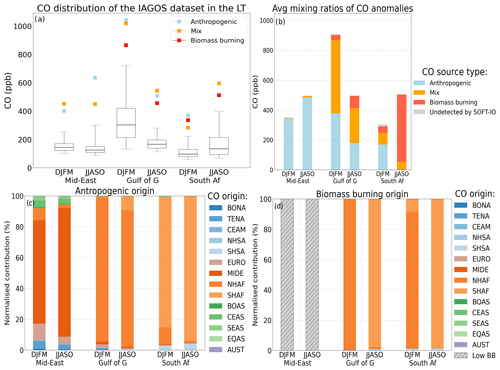
Figure 11Same as Fig. 3 but for the LT (below 2000 m) in Africa and the Middle East. At this altitude, 3 anomalies out of the 1449 observed were not detected by SOFT-IO, representing 0.2 % (in grey in panel (b)).
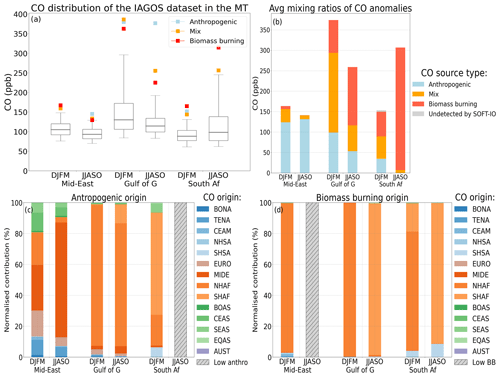
Figure 12Same as Fig. 3 but for the MT (between 2000 and 8000 m) in Africa and the Middle East. At this altitude, 8 anomalies out of the 1528 observed were not detected by SOFT-IO, representing 0.5 % (in grey in panel (b)).
Figures 11a and 12a show the CO distribution in the two regions of Africa (the Gulf of Guinea and southern Africa) and in the Middle East in the LT and the MT. Both layers present a maximum in DJFM in the Gulf of Guinea, with a 95th percentile above 724 ppb in the LT and 297 ppb in the MT. DJFM is the dry season in the northern part of Africa, which causes high levels of CO from biomass-burning emissions (see Fig. 11c). In the Gulf of Guinea, the maximum values of CO are reached during DJFM, which come from the biomass-burning episodes in the region during this season. The population is also large, which explains the significant anthropogenic contribution. The accumulation of the pollution observed in the LT during this season has already been characterised in Sauvage et al. (2005) and is caused by the Harmattan winds. It brings rich CO air masses caused by the upwind fires to the southwest of the Gulf of Guinea, where most of the airports visited by IAGOS aircraft are located (see Fig. B3 in the Appendix).
In JJASO, the southwesterly trade winds bring air masses from the Atlantic Ocean. These air masses are cleaner with respect to anthropogenic pollution but can bring BB plumes from southern Africa.
The proportion of BB sources increased in the MT. The contribution of anthropogenic emissions maximised near the surface, especially over the Gulf of Guinea, one of the most-populated and most-polluted urban areas on the continent. In the middle troposphere (MT), the intensity of the CO anomalies attributed to anthropogenic sources decreases in favour of those from BB and MIX sources.
The changes in origins of the BB contributions in DJFM and JJASO follow the shift in the biomass-burning season from the Northern Hemisphere to the Southern Hemisphere.
In JJASO, during the dry season in southern Africa, the anomalies are the most intense there. The MT 95th percentile is just below 250 ppb in JJASO, and most of the anomalies detected in southern Africa are attributed to emissions from Southern Hemisphere fires.
The Middle Eastern plumes in the LT and the MT have a high contribution from anthropogenic emissions during both seasons. The Middle East has been identified in previous studies as receiving pollution from multiple regions (Li et al., 2001; Stohl et al., 2002; Duncan et al., 2008). Europe mostly exports its pollution via low-altitude pathways, and we can see in Figs. 11c and 12c that up to 20 % of the anthropogenic contributions can come from Europe. There are also contributions from temperate North America and southern and East Asia, but contrary to the European contributions, these probably followed higher-altitude pathways before sinking to the MT or LT (Li et al., 2001; Stohl et al., 2002). We can also see significant differences between the provenances of the anthropogenic contributions in DJFM and JJASO.
In JJASO, we mostly see contributions from the local regions (MIDE) similar to the contributions to the LT. According to previous studies, the planetary boundary layer in this region can reach 4000 or 5000 m in JJA (Gamo, 1996; Ntoumos et al., 2023). So, these differences between the origins of the contributions in DJFM and JJASO may be caused by the higher boundary layer height in JJASO.
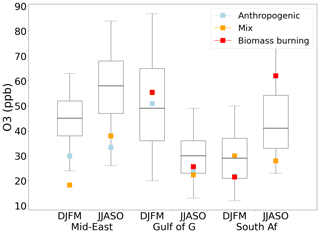
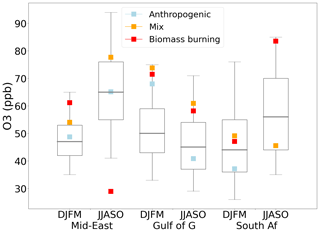
Figures 13 and 14 show the O3 distribution measured by IAGOS as well as its mixing ratio inside the detected CO anomalies. In the following paragraph if not otherwise mentioned, the O3 mixing ratio refers to the mixing ratio inside the CO anomalies. The boxplots in Fig. 13 show that the lower part of the troposphere presents strong variability between regions and seasons.
In the Middle East, the O3 values are among the highest in JJASO in the LT and MT. The summertime median is also higher than the median from East Asia (see Figs. 4 and 6), a region with identified extreme O3 values (Chang et al., 2017; Lu et al., 2018). Li et al. (2001) suggested that the high tropospheric O3 values in the Middle East were due to the constant import of pollution from different regions trapped in the upper-level anticyclone. The strong subsidence associated with it cause an accumulation of the O3 in the region. Here, the CO anomalies detected are mostly caused by emissions from the Middle East rather than from long-range transport. In the Middle Eastern LT, values of O3 inside CO anomalies attributed to anthropogenic emissions are lower than the 25th percentile, which is similar to the observation made in the Northern Hemisphere midlatitudes. In the MT, the anthropogenic anomalies are close to the median during both seasons.
In DJFM in the Gulf of Guinea, values of O3 associated with the CO anomalies are just above the median in the LT, whereas they are nearly as high as the 95th percentile in the MT. In JJASO, values of O3 in the Gulf of Guinea exceed the median only during the MIX and BB anomalies in the MT. Southern Africa presents low values of O3 in DJFM but much higher values during the BB season in the Southern Hemisphere. As in the Northern Hemisphere, the mixing ratio of O3 inside plumes of CO influenced by BB is higher than the median. The high mixing ratio of O3 in the BB anomalies was already discussed previously for the Northern Hemisphere midlatitude CO anomalies. It can be caused by the high quantity of reactive gases emitted by biomass burning that act as O3 precursors (e.g. Galanter et al., 2000; Mauzerall et al., 1998).
3.3.2 Upper troposphere
As the seasonality of CO in the African upper troposphere has already been described in Lannuque et al. (2021), this section will emphasise the differences between the seasonal cycle of CO presented in Lannuque et al. (2021) and the extreme values of CO presented here. Similar to the study of the CO seasonal cycle from Lannuque et al. (2021), the anomalies are the most intense in the hemisphere of the strongest Hadley cell. In DJFM, the dry season is in the African Northern Hemisphere, causing fires emitting a lot of CO, whereas in JJASO, the dry season is in the Southern Hemisphere and the most intense CO anomalies are detected in southern Africa.
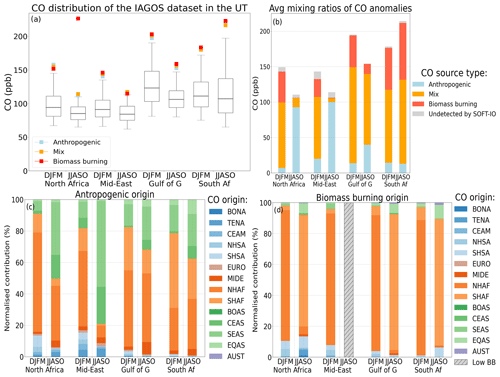
Figure 15Same as Fig. 3 but for the UT (between 8000 m and the dynamical tropopause) in Africa and the Middle East. At this altitude, 268 anomalies out of the 5859 observed were not detected by SOFT-IO, representing 4.6 % (in grey in panel (b)).
The Middle East and the north of Africa, similarly to the Gulf of Guinea, show significant seasonal variations with a maximum in DJFM. Figure 15b shows that the DJFM maximum reached in the Northern Hemisphere regions is mostly caused by biomass-burning plumes from NHAF (Fig. 15d). In JJASO it is the wet season in NHAF, so BB emissions are drastically reduced in the region. Furthermore, as Lannuque et al. (2021) showed, anthropogenic CO is transported from SEAS (Fig. 15c). There are significant anthropogenic emissions on the Indian subcontinent, and the active convection brought by the Asian summer monsoon allows the emitted CO to be rapidly transported from the surface to the UT. There, it is trapped in the Asian monsoon anticyclone (Park et al., 2008; Barret et al., 2008; Tsivlidou et al., 2023).
Anomalies in the UT in the Gulf of Guinea and in southern Africa are heavily influenced by BB emissions: only a small fraction of the plumes in these two regions is solely caused by anthropogenic emissions. The others are caused by either pure BB emissions or MIX sources. The BB contribution comes from either NHAF or SHAF depending on the season. In DJFM in southern Africa, it is interesting to note that the CO mixing ratios are higher in the UT than in the MT (see Figs. 12 and 15 and Table 1). It shows the importance of the Hadley cell circulation for the distribution of the pollutant in the UT.
The signals observed in the climatologies studied by Lannuque et al. (2021) and in the CO anomalies studied here show similarities. The main differences are the increased BB proportions from NHAF in DJFM in the four regions. The small contribution from North America observed by Lannuque et al. (2021) is barely visible here, as the air masses transported from there are probably too diluted (i.e. close to the median) to contribute to any anomalies of CO.
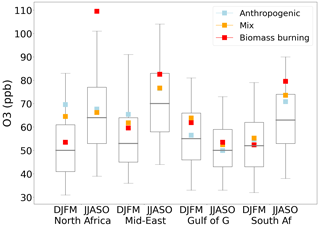
The O3 mixing ratio associated with the observed CO anomalies is shown in Fig. 16. The upper-troposphere signal is not as clear as the one from the Northern Hemisphere. However, like in the MT in the Middle East and northern Africa, we can see that the O3 mixing ratio in the BB anomalies is higher than the median of O3 and can even reach the 75th percentile of O3 in DJFM. The Middle East shows the highest values of O3 during JJASO. At this altitude layer, CO anomalies are mostly from anthropogenic emissions originating from SEAS. Those anomalies show a 7 ppb enhancement compared to the median of 70 ppb. This is in agreement with a previous study from Li et al. (2001) showing elevated O3 values in the Middle East due to significant import of anthropogenic pollution from polluted regions and very little from stratospheric intrusion. Middle Eastern meteorological conditions are favourable for O3 production (Duncan et al., 2008) as well as for the constant import of the pollutant from Asian emissions (Stohl et al., 2002) and an influx of NOx produced by lightning during the Asian monsoon (Li et al., 2001).
In the Gulf of Guinea, the overall distribution of O3 measured by IAGOS is lower than in the rest of Africa. Its maximum values of O3 are observed in DJFM during the fire seasons in North Africa. The O3 values observed in the CO anomalies are a bit lower than the 75th percentile in DJFM and close to the median in JJASO. In southern Africa in DFJM, during the rainy season, no clear signal is observed. In JJASO during the fire seasons, O3 is at its maximum, and high values are observed in the CO anomalies.
3.4 Discussion of the sensitivity test analysis
Our study is based on extreme CO mixing ratios, which we have defined as observations above the regional and seasonal 95th percentile. In order to ensure the robustness of the results with respect to this parameter, we performed a sensitivity test to check whether any major changes in the features could be observed with a threshold defined as the 75th or 99th percentile. Overall, the same characteristics were observed with just a few differences. In the Northern Hemisphere, increasing the threshold causes a slight increase in the proportion of fire-related plumes (diagnosed as BB or MIX), which is not surprising as we have seen that these plumes are the most intense most of the time.
Our study focused on CO anomalies measured between 2002 and 2019, but important trends in CO and O3 in the atmosphere have been observed in several of the studied regions (e.g. Novelli et al., 1998; Kim et al., 2023; Gaudel et al., 2020). So, we performed the same analysis with only the last 10 years of the IAGOS measurements. Several regions showed a decreased 95th percentile in this dataset (see Tables A2 and A3 in the Appendix). However, the origins and sources of the anomalies remained similar in regions with a sufficient amount of data. The conclusion of the study remained largely unchanged for the CO anomalies of the last 10 years.
IAGOS is research infrastructure that uses commercial aircraft to measure atmospheric composition. In total, over the 18 years of measurements, more than 43 000 IAGOS-equipped flights were made. This study is based on the in situ IAGOS CO anomalies defined as the observations above the 95th percentile of each individual altitude range (LT, MT, or UT), region, and season. In addition, SOFT-IO allows us to give a diagnosis of the main type of source as well as the region of emission responsible for the CO anomalies detected. SOFT-IO is based on FLEXPART retro-plumes initiated at each IAGOS measurement point. The back trajectory ensembles are then coupled to two CO emissions inventories: GFAS for the biomass-burning and CEDS for anthropogenic emissions. The conclusions below relate only to CO anomalies (values above the 95th percentile of the region, season, and altitude).
In the northern midlatitudes, anthropogenic emissions peak in winter, and biomass-burning emissions peak in summer. In the LT, the anomalies are strongly influenced by the higher local emissions during the winter months as well as by the weak convection and low photochemical activity, which facilitate the accumulation of the CO during this season. O3 values in the CO anomalies of this season are between 8 and 23 ppb lower than the median in the different regions. In summer at this altitude, there are significant regional variations that probably highlight the local environments that are more or less prone to O3 production/destruction.
In the MT, the high CO plumes over NW and NE America and Europe in JJA are mainly due to boreal fire emissions. Those fires originate from either boreal Asia or boreal America. High CO plumes from anthropogenic origins still account for a significant proportion of the anomalies, but unlike the LT, the origins of these emissions are split between a local and a long-range influence. East Asia continues to be dominated by anthropogenic pollution throughout the year and to show the higher CO levels observed at this altitude in the Northern Hemisphere. O3 in the MT in JJA shows higher values than normal in the CO anomalies (from 7 to 9 ppb higher than the median).
In the UT in northern midlatitudes, anomalies caused by BB emissions remain less frequent than those from anthropogenic emissions, but they are the most intense during the boreal fire season (JJA). East Asian emissions strongly influence the anomalies observed in the different regions of the Northern Hemisphere. The O3 mixing ratios associated with CO anomalies are regularly higher than normal, and O3 reaches its maximum over Siberia. So, the exported CO plumes from Siberia will cause high anomalies of O3 in the regions with a lower O3 environment.
The LT and MT of the Indian subcontinent are mostly influenced by the local anthropogenic emissions. In the UT, however, the pollution pattern is dominated by the phases of the monsoon. In DJF and MAM, a significant contribution comes from anthropogenic and BB emissions from northern Africa. In JJA, strong convective activity favours the export of local pollution to the UT, and most plumes are therefore attributed to local anthropogenic emissions. In SON, the UT above India can be strongly affected by BB emissions from the Maritime Continent.
CO anomalies in the African troposphere follow a different regime. Fires are much more frequent and are responsible for a large proportion of the CO anomalies, even in the lower layers of the troposphere. The CO anomalies observed throughout the troposphere over Africa are deeply influenced by the transition between the wet and dry seasons and the ITCZ shift, which changes the transport patterns of the emitted CO. A part of the CO can also come from southern Asian emissions, where it has been transported upward by the South Asian monsoon and trapped in the South Asian monsoon anticyclone before being transported westwards and influencing the northern part of Africa and the Middle East. In the LT and MT, the maximum O3 values are found above the Middle East. Previous studies assumed that the high O3 in the regions was due to long-range transport of polluted air masses followed by chemical production in the regions (Li et al., 2001; Duncan et al., 2008). In the African regions, O3 levels are at a maximum during their respective dry seasons, and the CO anomalies associated with BB emissions show enhanced values of O3 (22 and 28 ppb higher than the median in the MT for the Gulf of Guinea and southern Africa, respectively).
We have presented a detailed analysis of the characteristics of high-carbon-monoxide plumes and their associated ozone anomalies in different regions of the world. It is important for the IAGOS infrastructure to continue those measurements and to expand the regions sampled by the research infrastructure in order to provide these diagnostics in additional regions. This is particularly important in tropical regions, where anthropogenic emissions are increasing and impact the O3 trend globally (Zhang et al., 2016). An increased number and sampling frequency of measurements of NOx and aerosols by IAGOS will be valuable for future analysis focusing on O3 photochemical production or air quality.
Table A2q95 values (in ppb) used as thresholds for the different regions using data from 2002 to 2019 (a) and using data from 2010 to 2019 (b).
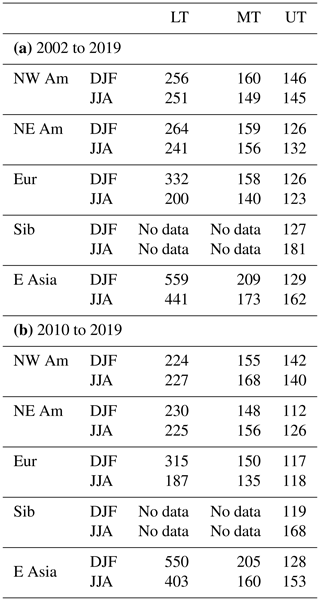
Table A3q95 values (in ppb) used as thresholds for the different regions using data from 2002 to 2019 (a) and using data from 2010 to 2019 (b).
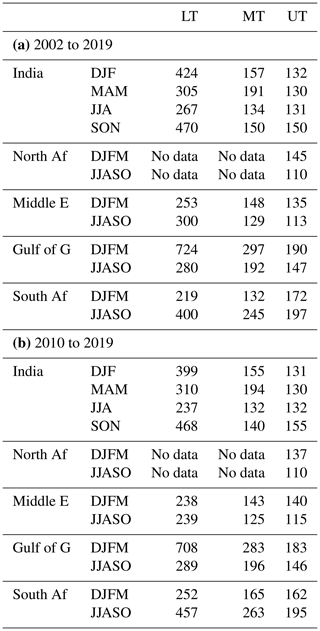
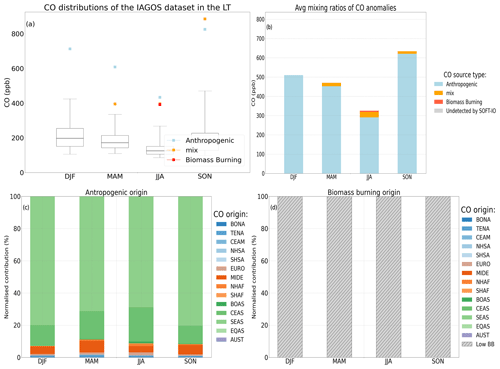
Figure D1Same as Fig. 3 but only for the Indian region during the four seasons for the LT (below 2000 m). At this altitude, all anomalies were detected by SOFT-IO (in grey in panel (b)).
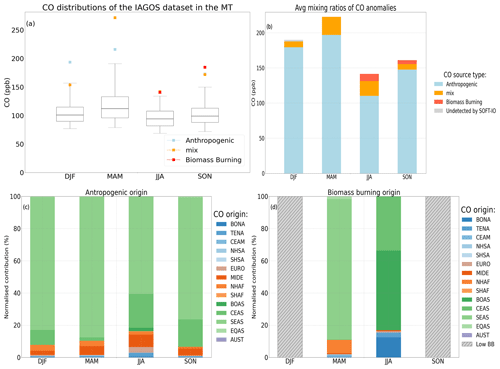
Figure D2Same as Fig. 3 but only for the Indian region during the four seasons for the MT (between 2000 and 8000 m). At this altitude, 2 anomalies were not detected by SOFT-IO (in grey in panel (b)).
The IAGOS data are available from the IAGOS data portal (https://doi.org/10.25326/20, Boulanger et al., 2019), and more precisely, the time series data are found at https://doi.org/10.25326/06 (Boulanger et al., 2018) and at https://doi.org/10.25326/3 (Sauvage et al., 2017b).
TL, BS, BJ, VM, and VT designed the study. The IAGOS and SOFT-IO data were provided by BS, PW, YB, RB, DB, HC, JMC, PN, and VT. The paper was written by TL; was reviewed by BS, BJ, and VT; and was edited and approved by all the authors.
The contact author has declared that none of the authors has any competing interests.
Publisher's note: Copernicus Publications remains neutral with regard to jurisdictional claims made in the text, published maps, institutional affiliations, or any other geographical representation in this paper. While Copernicus Publications makes every effort to include appropriate place names, the final responsibility lies with the authors.
This article is part of the special issue “Tropospheric Ozone Assessment Report Phase II (TOAR-II) Community Special Issue (ACP/AMT/BG/GMD inter-journal SI)”. It is a result of the Tropospheric Ozone Assessment Report, Phase II (TOAR-II, 2020–2024).
We acknowledge the strong support of the European Commission, Airbus, and the airlines (Deutsche Lufthansa, Air France, Austrian, Air Namibia, Cathay Pacific, Iberia, China Airlines, Hawaiian Airlines, and Air Canada so far) that have carried the MOZAIC or IAGOS equipment and performed the maintenance since 1994. IAGOS has been funded by European Union projects IAGOS–DS and IAGOS–ERI. Additionally, IAGOS has been funded by INSU-CNRS (France), Météo-France, Université Paul Sabatier (Toulouse, France), and Research Center Jülich (FZJ, Jülich, Germany). The IAGOS database is supported in France by AERIS (https://www.aeris-data.fr, last access: November 2024).
This research has been supported by the École Normale Supérieure (contrat doctoral spécifique normalien).
This paper was edited by Tanja Schuck and reviewed by two anonymous referees.
Andreae, M. O., Artaxo, P., Fischer, H., Freitas, S., Grégoire, J.-M., Hansel, A., Hoor, P., Kormann, R., Krejci, R., Lange, L., Lelieveld, J., Lindinger, W., Longo, K., Peters, W., de Reus, M., Scheeren, B., Silva Dias, M., Ström, J., van Velthoven, P., and Williams, J.: Transport of biomass burning smoke to the upper troposphere by deep convection in the equatorial region, Geophys. Res. Lett., 28, 951–954, 2001. a
Ashmore, M.: Assessing the future global impacts of ozone on vegetation, Plant Cell Environ., 28, 949–964, 2005. a
Barret, B., Ricaud, P., Mari, C., Attié, J.-L., Bousserez, N., Josse, B., Le Flochmoën, E., Livesey, N. J., Massart, S., Peuch, V.-H., Piacentini, A., Sauvage, B., Thouret, V., and Cammas, J.-P.: Transport pathways of CO in the African upper troposphere during the monsoon season: a study based upon the assimilation of spaceborne observations, Atmos. Chem. Phys., 8, 3231–3246, https://doi.org/10.5194/acp-8-3231-2008, 2008. a
Barret, B., Sauvage, B., Bennouna, Y., and Le Flochmoen, E.: Upper-tropospheric CO and O3 budget during the Asian summer monsoon, Atmos. Chem. Phys., 16, 9129–9147, https://doi.org/10.5194/acp-16-9129-2016, 2016. a, b
Bergman, J. W., Fierli, F., Jensen, E. J., Honomichl, S., and Pan, L. L.: Boundary layer sources for the Asian anticyclone: Regional contributions to a vertical conduit, J. Geophys. Res.-Atmos., 118, 2560–2575, 2013. a
Blot, R., Nedelec, P., Boulanger, D., Wolff, P., Sauvage, B., Cousin, J.-M., Athier, G., Zahn, A., Obersteiner, F., Scharffe, D., Petetin, H., Bennouna, Y., Clark, H., and Thouret, V.: Internal consistency of the IAGOS ozone and carbon monoxide measurements for the last 25 years, Atmos. Meas. Tech., 14, 3935–3951, https://doi.org/10.5194/amt-14-3935-2021, 2021. a
Boulanger, D., Blot, R., Bundke, U., Gerbig, C., Hermann, M., Nédélec, P., Rohs, S., and Ziereis, H.: IAGOS final quality controlled Observational Data L2 – Time series, Aeris [data set], https://doi.org/10.25326/06, 2018. a
Boulanger, D., Thouret, V., and Petzold, A.: IAGOS Data Portal, AERIS [data set], https://doi.org/10.25326/20, 2019. a
Brenninkmeijer, C., Crutzen, P., Fischer, H., Güsten, H., Hans, W., Heinrich, G., Heintzenberg, J., Hermann, M., Immelmann, T., Kersting, D., Maiss, M., Nolle, M., Pitscheider, A., Pohlkamp, H., Scharffe, D., Specht, K., and Wiedensohler, A.: CARIBIC – Civil aircraft for global measurement of trace gases and aerosols in the tropopause region, J. Atmos. Ocean. Tech., 16, 1373–1383, 1999. a
Chang, K.-L., Petropavlovskikh, I., Cooper, O. R., Schultz, M. G., and Wang, T.: Regional trend analysis of surface ozone observations from monitoring networks in eastern North America, Europe and East Asia, Elem. Sci. Anth., 5, 50, https://doi.org/10.1525/elementa.243, 2017. a, b
Chen, T.-M., Kuschner, W. G., Gokhale, J., and Shofer, S.: Outdoor air pollution: ozone health effects, Am. J. Med. Sci., 333, 244–248, 2007. a
Cohen, Y., Petetin, H., Thouret, V., Marécal, V., Josse, B., Clark, H., Sauvage, B., Fontaine, A., Athier, G., Blot, R., Boulanger, D., Cousin, J.-M., and Nédélec, P.: Climatology and long-term evolution of ozone and carbon monoxide in the upper troposphere–lower stratosphere (UTLS) at northern midlatitudes, as seen by IAGOS from 1995 to 2013, Atmos. Chem. Phys., 18, 5415–5453, https://doi.org/10.5194/acp-18-5415-2018, 2018. a, b, c, d, e, f, g
Cooper, O. R. and Parrish, D. D.: Air Pollution Export from and Import to North America: Experimental Evidence, in: Air Pollution: Intercontinental Transport of Air Pollution, edited by: Stohl, A., Springer, Berlin, Heidelberg, ISBN 978-3-540-40037-0, 41–67, https://doi.org/10.1007/b94523, 2004. a, b, c, d
Cooper, O. R., Forster, C., Parrish, D., Trainer, M., Dunlea, E., Ryerson, T., Hübler, G., Fehsenfeld, F., Nicks, D., Holloway, J., de Gouw, J., Warneke, C., Roberts, J. M., Flocke, F., and Moody, J.: A case study of transpacific warm conveyor belt transport: Influence of merging airstreams on trace gas import to North America, J. Geophys. Res.-Atmos., 109, D23S08, https://doi.org/10.1029/2003JD003624, 2004. a, b
Cussac, M., Marécal, V., Thouret, V., Josse, B., and Sauvage, B.: The impact of biomass burning on upper tropospheric carbon monoxide: a study using MOCAGE global model and IAGOS airborne data, Atmos. Chem. Phys., 20, 9393–9417, https://doi.org/10.5194/acp-20-9393-2020, 2020. a, b
Damoah, R., Spichtinger, N., Servranckx, R., Fromm, M., Eloranta, E. W., Razenkov, I. A., James, P., Shulski, M., Forster, C., and Stohl, A.: A case study of pyro-convection using transport model and remote sensing data, Atmos. Chem. Phys., 6, 173–185, https://doi.org/10.5194/acp-6-173-2006, 2006. a
Davison, A. and Barnes, J.: Effects of ozone on wild plants, New Phytol., 139, 135–151, 1998. a
Dentener, F., Kinne, S., Bond, T., Boucher, O., Cofala, J., Generoso, S., Ginoux, P., Gong, S., Hoelzemann, J. J., Ito, A., Marelli, L., Penner, J. E., Putaud, J.-P., Textor, C., Schulz, M., van der Werf, G. R., and Wilson, J.: Emissions of primary aerosol and precursor gases in the years 2000 and 1750 prescribed data-sets for AeroCom, Atmos. Chem. Phys., 6, 4321–4344, https://doi.org/10.5194/acp-6-4321-2006, 2006. a
Dickerson, R. R., Li, C., Li, Z., Marufu, L. T., Stehr, J. W., McClure, B., Krotkov, N., Chen, H., Wang, P., Xia, X., Ban, X., Gong, F., Yuan, J., and Yang, J.: Aircraft observations of dust and pollutants over northeast China: Insight into the meteorological mechanisms of transport, J. Geophys. Res.-Atmos., 112, D24S90, https://doi.org/10.1029/2007JD008999, 2007. a
Ding, A., Wang, T., Xue, L., Gao, J., Stohl, A., Lei, H., Jin, D., Ren, Y., Wang, X., Wei, X., Qi, Y., Liu, J., and Zhang, X.: Transport of north China air pollution by midlatitude cyclones: Case study of aircraft measurements in summer 2007, J. Geophys. Res.-Atmos., 114, D08304, https://doi.org/10.1029/2008JD011023, 2009. a, b
Duncan, B. N., West, J. J., Yoshida, Y., Fiore, A. M., and Ziemke, J. R.: The influence of European pollution on ozone in the Near East and northern Africa, Atmos. Chem. Phys., 8, 2267–2283, https://doi.org/10.5194/acp-8-2267-2008, 2008. a, b, c, d
Fadnavis, S., Buchunde, P., Ghude, S. D., Kulkarni, S., and Beig, G.: Evidence of seasonal enhancement of CO in the upper troposphere over India, International J. Remote Sens., 32, 7441–7452, 2011. a
Field, R. D., Van Der Werf, G. R., Fanin, T., Fetzer, E. J., Fuller, R., Jethva, H., Levy, R., Livesey, N. J., Luo, M., Torres, O., and Worden, H.: Indonesian fire activity and smoke pollution in 2015 show persistent nonlinear sensitivity to El Niño-induced drought, P. Natl. Acad. Sci. USA, 113, 9204–9209, 2016. a
Fuhrer, J., Skärby, L., and Ashmore, M. R.: Critical levels for ozone effects on vegetation in Europe, Environ. Pollut., 97, 91–106, 1997. a
Galanter, M., Levy, H., and Carmichael, G. R.: Impacts of biomass burning on tropospheric CO, NOx, and O3, J. Geophys. Res.-Atmos., 105, 6633–6653, 2000. a
Gamo, M.: Thickness of the dry convection and large-scale subsidence above deserts, Bound.-Lay. Meteorol., 79, 265–278, 1996. a
Gaudel, A., Cooper, O. R., Ancellet, G., Barret, B., Boynard, A., Burrows, J. P., Clerbaux, C., Coheur, P.-F., Cuesta, J., Cuevas, E., Doniki, S., Dufour, G., Ebojie, F., Foret, G., Garcia, O., Granados-Muñoz, M. J., Hannigan, J. W., Hase, F., Hassler, B., Huang, G., Hurtmans, D., Jaffe, D., Jones, N., Kalabokas, P., Kerridge, B., Kulawik, S., Latter, B., Leblanc, T., Le Flochmoën, E., Lin, W., Liu, J., Liu, X., Mahieu, E., McClure-Begley, A., Neu, J. L., Osman, M., Palm, M., Petetin, H., Petropavlovskikh, I., Querel, R., Rahpoe, N., Rozanov, A., Schultz, M. G., Schwab, J., Siddans, R., Smale, D., Steinbacher, M., Tanimoto, H., Tarasick, D. W., Thouret, V., Thompson, A. M., Trickl, T., Weatherhead, E., Wespes, C., Worden, H. M., Vigouroux, C., Xu, X., Zeng, G., and Ziemke, J.: Tropospheric Ozone Assessment Report: Present-day distribution and trends of tropospheric ozone relevant to climate and global atmospheric chemistry model evaluation, Elem. Sci. Anth., 6, 39, https://doi.org/10.1525/elementa.291, 2018. a
Gaudel, A., Cooper, O. R., Chang, K.-L., Bourgeois, I., Ziemke, J. R., Strode, S. A., Oman, L. D., Sellitto, P., Nédélec, P., Blot, R., Thouret, V., and Granier, C.: Aircraft observations since the 1990s reveal increases of tropospheric ozone at multiple locations across the Northern Hemisphere, Science Advances, 6, eaba8272, https://doi.org/10.1126/sciadv.aba8272, 2020. a
Giglio, L., Randerson, J. T., and Van Der Werf, G. R.: Analysis of daily, monthly, and annual burned area using the fourth-generation global fire emissions database (GFED4), J. Geophys. Res.-Biogeo., 118, 317–328, 2013. a
Huang, L., Fu, R., Jiang, J. H., Wright, J. S., and Luo, M.: Geographic and seasonal distributions of CO transport pathways and their roles in determining CO centers in the upper troposphere, Atmos. Chem. Phys., 12, 4683–4698, https://doi.org/10.5194/acp-12-4683-2012, 2012. a
Hudman, R. C., Jacob, D. J., Cooper, O. R., Evans, M. J., Heald, C. L., Park, R. J., Fehsenfeld, F., Flocke, F., Holloway, J., Hübler, G., Kita, K., Koike, M., Kondo, Y., Neuman, A., Nowak, J., Oltmans, S., Parrish, D., Roberts, J. M., and Ryerson, T.: Ozone production in transpacific Asian pollution plumes and implications for ozone air quality in California, J. Geophys. Res.-Atmos., 109, D23S10, https://doi.org/10.1029/2004JD004974, 2004. a
Huntrieser, H. and Schlager, H.: Air Pollution Export from and Import to Europe: Experimental Evidence, in: Air Pollution: Intercontinental Transport of Air Pollution, edited by: Stohl, A., Springer, Berlin, Heidelberg, ISBN 978-3-540-40037-0, 69–98, https://doi.org/10.1007/b94524, 2004. a, b, c
Jaffe, D., Anderson, T., Covert, D., Kotchenruther, R., Trost, B., Danielson, J., Simpson, W., Berntsen, T., Karlsdottir, S., Blake, D., Harris, J., Carmichael, G., and Uno, I.: Transport of Asian air pollution to North America, Geophys. Res. Lett., 26, 711–714, https://doi.org/10.1029/1999GL900100, 1999. a, b
Kaiser, J. W., Heil, A., Andreae, M. O., Benedetti, A., Chubarova, N., Jones, L., Morcrette, J.-J., Razinger, M., Schultz, M. G., Suttie, M., and van der Werf, G. R.: Biomass burning emissions estimated with a global fire assimilation system based on observed fire radiative power, Biogeosciences, 9, 527–554, https://doi.org/10.5194/bg-9-527-2012, 2012. a
Kar, J., Bremer, H., Drummond, J. R., Rochon, Y. J., Jones, D. B. A., Nichitiu, F., Zou, J., Liu, J., Gille, J. C., Edwards, D. P., Deeter, M. N., Francis, G., Ziskin, D., and Warner, J.: Evidence of vertical transport of carbon monoxide from Measurements of Pollution in the Troposphere (MOPITT), Geophys. Res. Lett., 31, L23105, https://doi.org/10.1029/2004GL021128, 2004. a, b, c
Kim, S.-W., Kim, K.-M., Jeong, Y., Seo, S., Park, Y., and Kim, J.: Changes in surface ozone in South Korea on diurnal to decadal timescales for the period of 2001–2021, Atmos. Chem. Phys., 23, 12867–12886, https://doi.org/10.5194/acp-23-12867-2023, 2023. a
Labonne, M., Bréon, F.-M., and Chevallier, F.: Injection height of biomass burning aerosols as seen from a spaceborne lidar, Geophys. Res. Lett., 34, L11806, https://doi.org/10.1029/2007GL029311, 2007. a
Lal, S., Venkataramani, S., Chandra, N., Cooper, O. R., Brioude, J., and Naja, M.: Transport effects on the vertical distribution of tropospheric ozone over western India, J. Geophys. Res.-Atmos., 119, 10012–10026, https://doi.org/10.1002/2014JD021854, 2014. a
Lannuque, V., Sauvage, B., Barret, B., Clark, H., Athier, G., Boulanger, D., Cammas, J.-P., Cousin, J.-M., Fontaine, A., Le Flochmoën, E., Nédélec, P., Petetin, H., Pfaffenzeller, I., Rohs, S., Smit, H. G. J., Wolff, P., and Thouret, V.: Origins and characterization of CO and O3 in the African upper troposphere, Atmos. Chem. Phys., 21, 14535–14555, https://doi.org/10.5194/acp-21-14535-2021, 2021. a, b, c, d, e, f, g, h, i, j, k, l
Lavaysse, C., Naumann, G., Alfieri, L., Salamon, P., and Vogt, J.: Predictability of the European heat and cold waves, Clim. Dynam., 52, 2481–2495, 2019. a
Lawrence, M. G.: Export of Air Pollution from Southern Asia and its Large-Scale Effects, in: Air Pollution: Intercontinental Transport of Air Pollution, edited by: Stohl, A., Springer, Berlin, Heidelberg, ISBN 978-3-540-40037-0, 131–172, https://doi.org/10.1007/b94526, 2004. a, b
Lawrence, M. G. and Lelieveld, J.: Atmospheric pollutant outflow from southern Asia: a review, Atmos. Chem. Phys., 10, 11017–11096, https://doi.org/10.5194/acp-10-11017-2010, 2010. a, b
Lelieveld, J., Crutzen, P. J., Ramanathan, V., Andreae, M. O., Brenninkmeijer, C. A. M., Campos, T., Cass, G. R., Dickerson, R. R., Fischer, H., de Gouw, J. A., Hansel, A., Jefferson, A., Kley, D., de Laat, A. T. J., Lal, S., Lawrence, M. G., Lobert, J. M., Mayol-Bracero, O. L., Mitra, A. P., Novakov, T., Oltmans, S. J., Prather, K. A., Reiner, T., Rodhe, H., Scheeren, H. A., Sikka, D., and Williams, J.: The Indian Ocean Experiment: Widespread Air Pollution from South and Southeast Asia, Science, 291, 1031–1036, https://doi.org/10.1126/science.1057103, 2001. a
Lelieveld, J., Gromov, S., Pozzer, A., and Taraborrelli, D.: Global tropospheric hydroxyl distribution, budget and reactivity, Atmos. Chem. Phys., 16, 12477–12493, https://doi.org/10.5194/acp-16-12477-2016, 2016. a, b
Li, Q., Jacob, D. J., Logan, J. A., Bey, I., Yantosca, R. M., Liu, H., Martin, R. V., Fiore, A. M., Field, B. D., Duncan, B. N., and Thouret, V.: A tropospheric ozone maximum over the Middle East, Geophys. Res. Lett., 28, 3235–3238, https://doi.org/10.1029/2001GL013134, 2001. a, b, c, d, e, f
Li, Q., Jacob, D. J., Bey, I., Palmer, P. I., Duncan, B. N., Field, B. D., Martin, R. V., Fiore, A. M., Yantosca, R. M., Parrish, D. D., Simmonds, P. G., and Oltmans, S. J.: Transatlantic transport of pollution and its effects on surface ozone in Europe and North America, J. Geophys. Res.-Atmos., 107, ACH 4-1–ACH 4-21, https://doi.org/10.1029/2001JD001422, 2002. a
Liang, Q., Jaeglé, L., Jaffe, D. A., Weiss-Penzias, P., Heckman, A., and Snow, J. A.: Long-range transport of Asian pollution to the northeast Pacific: Seasonal variations and transport pathways of carbon monoxide, J. Geophys. Res.-Atmos., 109, D23S07, https://doi.org/10.1029/2003JD004402, 2004. a, b
Liang, Q., Jaeglé, L., Hudman, R. C., Turquety, S., Jacob, D. J., Avery, M. A., Browell, E. V., Sachse, G. W., Blake, D. R., Brune, W., Ren, X., Cohen, R. C., Dibb, J. E., Fried, A., Fuelberg, H., Porter, M., Heikes, B. G., Huey, G., Singh, H. B., and Wennberg, P. O.: Summertime influence of Asian pollution in the free troposphere over North America, J. Geophys. Res.-Atmos., 112, D12S11, https://doi.org/10.1029/2006JD007919, 2007. a, b
Liu, H., Liu, S., Xue, B., Lv, Z., Meng, Z., Yang, X., Xue, T., Yu, Q., and He, K.: Ground-level ozone pollution and its health impacts in China, Atmos. Environ., 173, 223–230, 2018. a
Lu, X., Hong, J., Zhang, L., Cooper, O. R., Schultz, M. G., Xu, X., Wang, T., Gao, M., Zhao, Y., and Zhang, Y.: Severe Surface Ozone Pollution in China: A Global Perspective, Environ. Sci. Technol. Lett., 5, 487–494, https://doi.org/10.1021/acs.estlett.8b00366, 2018. a, b
Marenco, A., Thouret, V., Nédélec, P., Smit, H., Helten, M., Kley, D., Karcher, F., Simon, P., Law, K., Pyle, J., Poschmann, G., Von Wrede, R., Hume, C., and Cook, T.: Measurement of ozone and water vapor by Airbus in-service aircraft: The MOZAIC airborne program, An overview, J. Geophys. Res.-Atmos., 103, 25631–25642, 1998. a
Mauzerall, D. L., Logan, J. A., Jacob, D. J., Anderson, B. E., Blake, D. R., Bradshaw, J. D., Heikes, B., Sachse, G. W., Singh, H., and Talbot, B.: Photochemistry in biomass burning plumes and implications for tropospheric ozone over the tropical South Atlantic, J. Geophys. Res.-Atmos., 103, 8401–8423, 1998. a
McDuffie, E. E., Smith, S. J., O'Rourke, P., Tibrewal, K., Venkataraman, C., Marais, E. A., Zheng, B., Crippa, M., Brauer, M., and Martin, R. V.: A global anthropogenic emission inventory of atmospheric pollutants from sector- and fuel-specific sources (1970–2017): an application of the Community Emissions Data System (CEDS), Earth Syst. Sci. Data, 12, 3413–3442, https://doi.org/10.5194/essd-12-3413-2020, 2020. a
Nedelec, P., Thouret, V., Brioude, J., Sauvage, B., Cammas, J.-P., and Stohl, A.: Extreme CO concentrations in the upper troposphere over northeast Asia in June 2003 from the in situ MOZAIC aircraft data, Geophys. Res. Lett., 32, L14807, https://doi.org/10.1029/2005GL023141, 2005. a
Nédélec, P., Blot, R., Boulanger, D., Athier, G., Cousin, J.-M., Gautron, B., Petzold, A., Volz-Thomas, A., and Thouret, V.: Instrumentation on commercial aircraft for monitoring the atmospheric composition on a global scale: the IAGOS system, technical overview of ozone and carbon monoxide measurements, Tellus B, 67, 27791, https://doi.org/10.3402/tellusb.v67.27791, 2015. a, b
Novelli, P. C., Masarie, K. A., and Lang, P. M.: Distributions and recent changes of carbon monoxide in the lower troposphere, J. Geophys. Res.-Atmos., 103, 19015–19033, https://doi.org/10.1029/98JD01366, 1998. a, b
Nowak, J. B., Parrish, D. D., Neuman, J. A., Holloway, J. S., Cooper, O. R., Ryerson, T. B., Nicks Jr., D. K., Flocke, F., Roberts, J. M., Atlas, E., de Gouw, J. A., Donnelly, S., Dunlea, E., Hübler, G., Huey, L. G., Schauffler, S., Tanner, D. J., Warneke, C., and Fehsenfeld, F. C.: Gas-phase chemical characteristics of Asian emission plumes observed during ITCT 2K2 over the eastern North Pacific Ocean, J. Geophys. Res.-Atmos., 109, D23S19, https://doi.org/10.1029/2003JD004488, 2004. a
Ntoumos, A., Hadjinicolaou, P., Zittis, G., Constantinidou, K., Tzyrkalli, A., and Lelieveld, J.: Evaluation of WRF Model Boundary Layer Schemes in Simulating Temperature and Heat Extremes over the Middle East–North Africa (MENA) Region, J. Appl. Meteorol. Clim., 62, 1315–1332, 2023. a
Owen, R., Cooper, O., Stohl, A., and Honrath, R.: An analysis of the mechanisms of North American pollutant transport to the central North Atlantic lower free troposphere, J. Geophys. Res.-Atmos., 111, D23S58, https://doi.org/10.1029/2006JD007062, 2006. a
Pan, L. L., Honomichl, S. B., Kinnison, D. E., Abalos, M., Randel, W. J., Bergman, J. W., and Bian, J.: Transport of chemical tracers from the boundary layer to stratosphere associated with the dynamics of the Asian summer monsoon, J. Geophys. Res.-Atmos., 121, 14159–14174, https://doi.org/10.1002/2016JD025616, 2016. a
Park, M., Randel, W. J., Gettelman, A., Massie, S. T., and Jiang, J. H.: Transport above the Asian summer monsoon anticyclone inferred from Aura Microwave Limb Sounder tracers, J. Geophys. Res.-Atmos., 112, D16309, https://doi.org/10.1029/2006JD008294, 2007. a
Park, M., Randel, W. J., Emmons, L. K., Bernath, P. F., Walker, K. A., and Boone, C. D.: Chemical isolation in the Asian monsoon anticyclone observed in Atmospheric Chemistry Experiment (ACE-FTS) data, Atmos. Chem. Phys., 8, 757–764, https://doi.org/10.5194/acp-8-757-2008, 2008. a
Paugam, R., Wooster, M., Atherton, J., Freitas, S. R., Schultz, M. G., and Kaiser, J. W.: Development and optimization of a wildfire plume rise model based on remote sensing data inputs – Part 2, Atmos. Chem. Phys. Discuss., 15, 9815–9895, https://doi.org/10.5194/acpd-15-9815-2015, 2015. a
Petetin, H., Thouret, V., Fontaine, A., Sauvage, B., Athier, G., Blot, R., Boulanger, D., Cousin, J.-M., and Nédélec, P.: Characterising tropospheric O3 and CO around Frankfurt over the period 1994–2012 based on MOZAIC–IAGOS aircraft measurements, Atmos. Chem. Phys., 16, 15147–15163, https://doi.org/10.5194/acp-16-15147-2016, 2016. a
Petetin, H., Jeoffrion, M., Sauvage, B., Athier, G., Blot, R., Boulanger, D., Clark, H., Cousin, J.-M., Gheusi, F., Nedelec, P., Steinbacher, M., and Thouret, V.: Representativeness of the IAGOS airborne measurements in the lower troposphere, Elem. Sci. Anth., 6, 23, https://doi.org/10.1525/elementa.280, 2018a. a, b, c
Petetin, H., Sauvage, B., Parrington, M., Clark, H., Fontaine, A., Athier, G., Blot, R., Boulanger, D., Cousin, J.-M., Nédélec, P., and Thouret, V.: The role of biomass burning as derived from the tropospheric CO vertical profiles measured by IAGOS aircraft in 2002–2017, Atmos. Chem. Phys., 18, 17277–17306, https://doi.org/10.5194/acp-18-17277-2018, 2018b. a, b, c, d, e
Petzold, A., Thouret, V., Gerbig, C., Zahn, A., Brenninkmeijer, C. A., Gallagher, M., Hermann, M., Pontaud, M., Ziereis, H., Boulanger, D., Marshall, J., Nédélec, P., Smit, H. G. J., Friess, U., Flaud, J.-M., Wahner, A., Cammas, J.-P., Volz-Thomas, A., and IAGOS Team: Global-scale atmosphere monitoring by in-service aircraft–current achievements and future prospects of the European Research Infrastructure IAGOS, Tellus B, 67, 28452, https://doi.org/10.3402/tellusb.v67.28452, 2015. a
Pochanart, P., Wild, O., and Akimoto, H.: Air pollution import to and export from East Asia, Air pollution: Intercontinental transport of air pollution, edited by: Stohl, A., Springer Berlin Heidelberg, Berlin, Heidelberg, 99–130, https://doi.org/10.1007/b94525, 2004. a, b
Qu, Z., Henze, D. K., Worden, H. M., Jiang, Z., Gaubert, B., Theys, N., and Wang, W.: Sector-based top-down estimates of NOx, SO2, and CO emissions in East Asia, Geophys. Res. Lett., 49, e2021GL096009, https://doi.org/10.1029/2021GL096009, 2022. a
Rémy, S., Veira, A., Paugam, R., Sofiev, M., Kaiser, J. W., Marenco, F., Burton, S. P., Benedetti, A., Engelen, R. J., Ferrare, R., and Hair, J. W.: Two global data sets of daily fire emission injection heights since 2003, Atmos. Chem. Phys., 17, 2921–2942, https://doi.org/10.5194/acp-17-2921-2017, 2017. a, b
Ricaud, P., Sič, B., El Amraoui, L., Attié, J.-L., Zbinden, R., Huszar, P., Szopa, S., Parmentier, J., Jaidan, N., Michou, M., Abida, R., Carminati, F., Hauglustaine, D., August, T., Warner, J., Imasu, R., Saitoh, N., and Peuch, V.-H.: Impact of the Asian monsoon anticyclone on the variability of mid-to-upper tropospheric methane above the Mediterranean Basin, Atmos. Chem. Phys., 14, 11427–11446, https://doi.org/10.5194/acp-14-11427-2014, 2014. a
Riese, M., Ploeger, F., Rap, A., Vogel, B., Konopka, P., Dameris, M., and Forster, P.: Impact of uncertainties in atmospheric mixing on simulated UTLS composition and related radiative effects, J. Geophys. Res.-Atmos., 117, D16305, https://doi.org/10.1029/2012JD017751, 2012. a
Sauvage, B., Thouret, V., Cammas, J.-P., Gheusi, F., Athier, G., and Nédélec, P.: Tropospheric ozone over Equatorial Africa: regional aspects from the MOZAIC data, Atmos. Chem. Phys., 5, 311–335, https://doi.org/10.5194/acp-5-311-2005, 2005. a
Sauvage, B., Fontaine, A., Eckhardt, S., Auby, A., Boulanger, D., Petetin, H., Paugam, R., Athier, G., Cousin, J.-M., Darras, S., Nédélec, P., Stohl, A., Turquety, S., Cammas, J.-P., and Thouret, V.: Source attribution using FLEXPART and carbon monoxide emission inventories: SOFT-IO version 1.0, Atmos. Chem. Phys., 17, 15271–15292, https://doi.org/10.5194/acp-17-15271-2017, 2017a. a, b
Sauvage, B., Wolff, P., Blot, R., Nédélec, P., and Boulanger, D.: IAGOS Carbon Monoxide contribution and interpolated modeled data from ECMWF – L4, Aeris [data set], https://doi.org/10.25326/3, 2017b. a, b
Seinfeld, J. and Pandis, S.: Atmospheric chemistry and physics, Wiley, New York, ISBN 978-1-118-94740-1, 2016. a, b, c
Shastri, H., Ghosh, S., and Karmakar, S.: Improving Global Forecast System of extreme precipitation events with regional statistical model: Application of quantile-based probabilistic forecasts, J. Geophys. Res.-Atmos., 122, 1617–1634, 2017. a
Smoydzin, L. and Hoor, P.: Contribution of Asian emissions to upper tropospheric CO over the remote Pacific, Atmos. Chem. Phys., 22, 7193–7206, https://doi.org/10.5194/acp-22-7193-2022, 2022. a, b
Stohl, A.: A 1-year Lagrangian “climatology” of airstreams in the northern hemisphere troposphere and lowermost stratosphere, J. Geophys. Res.-Atmos., 106, 7263–7279, https://doi.org/10.1029/2000JD900570, 2001. a
Stohl, A., Eckhardt, S., Forster, C., James, P., and Spichtinger, N.: On the pathways and timescales of intercontinental air pollution transport, J. Geophys. Res.-Atmos., 107, ACH 6-1–ACH 6-17, https://doi.org/10.1029/2001JD001396, 2002. a, b, c, d, e, f, g, h, i, j, k
Stohl, A., Forster, C., Frank, A., Seibert, P., and Wotawa, G.: Technical note: The Lagrangian particle dispersion model FLEXPART version 6.2, Atmos. Chem. Phys., 5, 2461–2474, https://doi.org/10.5194/acp-5-2461-2005, 2005. a
Szopa, S., Naik, V., Adhikary, B., Artaxo, P., Berntsen, T., Collins, W. D., Fuzzi, S., Gallardo, L., Kiendler-Scharr, A., Klimont, Z., Liao, H., Unger, N., and Zanis, P.: Short-Lived Climate Forcers, in: Climate Change 2021: The Physical Science Basis. Contribution of Working Group I to the Sixth Assessment Report of the Intergovernmental Panel on Climate Change, edited by: Masson-Delmotte, V., Zhai, P., Pirani, A., Connors, S. L., Péan, C., Berger, S., Caud, N., Chen, Y., Goldfarb, L., Gomis, M. I., Huang, M., Leitzell, K., Lonnoy, E., Matthews, J. B. R., Maycock, T. K., Waterfield, T., Yelekçi, O., Yu, R., and Zhou, B., Cambridge University Press, Cambridge, United Kingdom and New York, NY, USA, 817–922, https://doi.org/10.1017/9781009157896.008, 2021. a
Thouret, V., Marenco, A., Logan, J. A., Nédélec, P., and Grouhel, C.: Comparisons of ozone measurements from the MOZAIC airborne program and the ozone sounding network at eight locations, J. Geophys. Res.-Atmos., 103, 25695–25720, 1998. a
Thouret, V., Cammas, J.-P., Sauvage, B., Athier, G., Zbinden, R., Nédélec, P., Simon, P., and Karcher, F.: Tropopause referenced ozone climatology and inter-annual variability (1994–2003) from the MOZAIC programme, Atmos. Chem. Phys., 6, 1033–1051, https://doi.org/10.5194/acp-6-1033-2006, 2006. a, b
Thouret, V., Clark, H., Petzold, A., Nédélec, P., and Zahn, A.: IAGOS: Monitoring Atmospheric Composition for Air Quality and Climate by Passenger Aircraft, Handbook of Air Quality and Climate Change, Springer Naturem Singapore, 18, 17277–17306, https://doi.org/10.1007/978-981-15-2527-8_57-1, 2022. a
Tsivlidou, M., Sauvage, B., Bennouna, Y., Blot, R., Boulanger, D., Clark, H., Le Flochmoën, E., Nédélec, P., Thouret, V., Wolff, P., and Barret, B.: Tropical tropospheric ozone and carbon monoxide distributions: characteristics, origins, and control factors, as seen by IAGOS and IASI, Atmos. Chem. Phys., 23, 14039–14063, https://doi.org/10.5194/acp-23-14039-2023, 2023. a, b, c, d, e, f
Val Martin, M., Logan, J. A., Kahn, R. A., Leung, F.-Y., Nelson, D. L., and Diner, D. J.: Smoke injection heights from fires in North America: analysis of 5 years of satellite observations, Atmos. Chem. Phys., 10, 1491–1510, https://doi.org/10.5194/acp-10-1491-2010, 2010. a
Xia, Y., Huang, Y., and Hu, Y.: On the climate impacts of upper tropospheric and lower stratospheric ozone, J. Geophys. Res.-Atmos., 123, 730–739, 2018. a
Yang, J., Liu, J., Han, S., Yao, Q., and Cai, Z.: Study of the meteorological influence on ozone in urban areas and their use in assessing ozone trends in all seasons from 2009 to 2015 in Tianjin, China, Meteorol. Atmos. Phys., 131, 1661–1675, https://doi.org/10.1007/s00703-019-00664-x, 2019. a
Zhang, Y., Cooper, O. R., Gaudel, A., Thompson, A. M., Nédélec, P., Ogino, S.-Y., and West, J. J.: Tropospheric ozone change from 1980 to 2010 dominated by equatorward redistribution of emissions, Nat. Geosci., 9, 875–879, 2016. a


