the Creative Commons Attribution 4.0 License.
the Creative Commons Attribution 4.0 License.
 | 30 Jan 2024
Diurnal variations in oxygen and nitrogen isotopes of atmospheric nitrogen dioxide and nitrate: implications for tracing NOx oxidation pathways and emission sources
Sarah Albertin
Joël Savarino
Slimane Bekki
Albane Barbero
Roberto Grilli
Quentin Fournier
Irène Ventrillard
Nicolas Caillon
Kathy Law
The oxygen (Δ17O) and nitrogen (δ15N) isotopic compositions of atmospheric nitrate (NO) are widely used as tracers of its formation pathways, precursor (nitrogen oxides (NOx) ≡ nitric oxide (NO) + nitrogen dioxide (NO2)) emission sources, and physico-chemical processing. However, the lack of observations on the multi-isotopic composition of NO2 perpetuates significant uncertainties regarding the quantitative links between the isotopic composition of NOx and NO, which ultimately may bias inferences about NO formation processes and the distribution of sources, particularly in winter urban atmospheres. We report here on the first simultaneous atmospheric observations of Δ17O and δ15N in NO2 (n=16) and NO (n=14). The measurements were carried out at sub-daily (∼3 h) resolution over 2 non-consecutive days in an Alpine city in February 2021. A strong diurnal signal is observed in both NO2 and NO multi-isotopic composition. Δ17O of NO2 and NO ranges from 19.6 ‰ to 40.8 ‰ and from 18.3 ‰ to 28.1 ‰, respectively. During the day and night, the variability in Δ17O(NO2) is mainly driven by the oxidation of NO by ozone, with a substantial contribution from peroxy radicals in the morning. NO mass balance equations, constrained by observed Δ17O(NO2), suggest that during the first day of sampling, most of the NO was formed locally from the oxidation of NO2 by hydroxyl radicals by day and via heterogeneous hydrolysis of dinitrogen pentoxide at night. For the second day, calculated and observed Δ17O(NO) do not match, particularly daytime values; the possible effects on Δ17O(NO) of a Saharan dust event that occurred during this sampling period and of winter boundary layer dynamics are discussed. δ15N of NO2 and NO ranges from −10.0 ‰ to 19.7 ‰ and from −4.2 ‰ to 14.9 ‰, respectively. Consistent with theoretical predictions of N isotope fractionation, the observed variability in δ15N(NO2) is explained by significant post-emission equilibrium N fractionation. After accounting for this effect, vehicle exhaust is found to be the primary source of NOx emissions at the sampling site. δ15N(NO) is closely linked to δ15N(NO2) variability, bringing further support to relatively fast and local NOx processing. Uncertainties in current N fractionation factors during NO2 to NO conversion are underlined. Overall, this detailed investigation highlights the potential and necessity of simultaneously using Δ17O and δ15N in NO2 and NO in order to better constrain quantitative inferences about the sources and formation chemistry of NO in urban environments in winter.
- Article
(1012 KB) - Full-text XML
-
Supplement
(1500 KB) - BibTeX
- EndNote


Despite extensive efforts in emission controls in recent decades, global anthropogenic emissions of nitrogen oxides (NOx ≡ nitrogen monoxide (NO) + nitrogen dioxide (NO2)) remain more than 2 orders of magnitude higher than before the industrial revolution (Hoesly et al., 2018). Atmospheric nitrate (NO ≡ nitric acid (HNO3) + particulate nitrate (p-NO)) is the main end product of NOx oxidation and a key component of fine particulate matter (PM), which adversely affects human health (WHO, 2021) and contributes to climate change (Masson-Delmotte et al., 2021). NO can be transported far from emission sources and can be removed from the atmosphere through dry and wet deposition within hours to days (Alexander et al., 2020; Park et al., 2004). The additional input of this “reactive” nitrogen (Nr) into natural environments is known to have detrimental consequences, particularly regarding biodiversity and water quality (Galloway et al., 2008; Vitousek et al., 1997). It is therefore important to have a comprehensive understanding of NOx emission sources and oxidation processes, on which effective air quality and climate change mitigation strategies rely (e.g. Bauer et al., 2007; Huang et al., 2014; Shah et al., 2018; Tsimpidi et al., 2008; Wang et al., 2013, 2020).
Several studies have noted that the response of NO concentration in air to NOx emission reduction is contrasting, particularly in winter (e.g. Shah et al., 2018; Tørseth et al., 2012; Wang et al., 2020; Zhou et al., 2019). This is because a variety of factors controls the NOx conversion efficiency and the NO content in PM, including precursor emission sources, complex multiphase chemical reactions with other reactive species, and environmental conditions (e.g. temperature, relative humidity, solar radiation) (Zhang et al., 2015). It remains difficult to assess the contribution of each parameter to the non-linear Nr chemistry, which is partly driven by close links between changes in aerosol acidity, gas–particle partitioning, and atmospheric oxidation capacity (Shah et al., 2018; Fu et al., 2020; Shi et al., 2019; K. Li et al., 2021). Ozone (O3) and hydroxyl radicals (OH) (Finlayson-Pitts and Pitts, 2000) are the major oxidants in the atmosphere whose chemical cycles are largely controlled by solar radiation. As a result, there are significant diurnal and seasonal variations in NOx chemistry (e.g. Prabhakar et al., 2017; Alexander et al., 2020). Notably, NO formation is generally dominated by homogeneous OH oxidation and heterogeneous O3 chemistry during the day and summer and during the night and winter, respectively (Alexander et al., 2020). However, assessing the relative contributions of individual formation channels, together with their sensitivity to environmental parameters, is not straightforward and requires extensive in situ observations combined with modelling tools (e.g. Alexander et al., 2020; Brown et al., 2006; Newsome and Evans, 2017; Xue, 2022; Prabhakar et al., 2017).
Upon release into the atmosphere, NOx, mainly emitted as NO, undergoes oxidation to form NO2. During the day, a rapid photochemical equilibrium is established between NO and NO2, known as the “photostationary state” (PSS; Leighton, 1961), via key interconversion reactions (Reactions R1–R3):
This cycle can be disturbed by peroxy radicals (RO2 ≡ hydroperoxyl radical (HO2) + methyl peroxy radical (CH3O2)) via typically Reaction (R4):
Note that in polluted atmospheres where NOx mixing ratios often exceed parts-per-billion (ppb) levels, Reaction (R4) followed by Reactions (R1)–(R2) leads to the formation of O3 (Crutzen, 1979). Although the role of RO2 in the NOx oxidation is crucial in O3 formation and NOx oxidation rate, measuring the RO2 mixing ratio remains challenging due to the need for state-of-the art instrumentation coupled with photochemical models to establish chemical budgets (e.g. Ren et al., 2006; Tan et al., 2018). While NO is usually oxidised relatively quickly into NO2 in summer due to the high levels of O3 and solar radiation, the shorter day length and lower temperature in winter result in a contrasting NOx cycling. In particular, the formation of a temperature inversion at the surface can trap pollutants emitted close to the surface in a shallow layer for hours to days (e.g. Largeron and Staquet, 2016; Olofson et al., 2009). Under those conditions, it is not uncommon for O3 levels to be very low due to quasi-complete titration by NO, which can have further impacts on the atmospheric oxidation capacity. However, pronounced O3 pollution episodes may also arise in winter in highly polluted areas, such as in oil-producing regions due to intense volatile organic compound (VOC) emissions (Edwards et al., 2014) or in China, where pollution control strategies mainly target NOx while VOC emissions remain more or less constant (Ren et al., 2022). In urban areas, NO2 is generally mainly removed from the atmosphere by reaction with OH during the day via Reaction (R5) (Dentener and Crutzen, 1993):
NO2 can also react with O3 to form nitrate radicals (NO3) via Reaction (R6):
However, NO3 is rapidly photolysed during the day, regenerating NO2 (Wayne et al., 1991). Another important NO3 loss reaction is that with NO in polluted environments (Brown and Stutz, 2012). At night, without photolytic activity and with lower precursor emissions, the lifetime of NO3 radicals substantially increases. NO3 reacts with NO2 to form dinitrogen pentoxide (N2O5; Reaction R7), which then undergoes heterogeneous hydrolysis to form HNO3 (Reaction R8):
Reaction (R7) is temperature dependent, so N2O5 can eventually decompose to reform NO2 and NO3, with the ratio being negatively correlated with temperature. N2O5 is an important nocturnal sink for NOx, notably in winter in urban atmospheres due to high aerosol loads and low temperatures. However, the efficiency of Reaction (R8) is difficult to determine because it strongly depends on parameters such as the aerosol surface density and its chemical composition (Brown et al., 2006), which are not often well characterised. In addition, NO3 can react with hydrocarbons to produce HNO3, which could significantly contribute to the formation of NO in industrialised regions with high hydrocarbon emissions (Brown et al., 2011). It is estimated that the Reactions (R1) to (R8) lead to the formation of 82 % of NO near the surface on a global scale (Alexander et al., 2020). In polluted environments, the respective contributions of Reaction (R5) (OH pathway) and Reactions (R6)–(R8) (N2O5 pathway) are more contrasted and are still debated (e.g. Chan et al., 2021; Fu et al., 2020). In addition, the reaction of N2O5 with chlorine on aerosols can contribute to NO production in urban atmospheres (Thornton et al., 2010), with further impacts on O3 production in continental polluted atmospheres in winter (X. Wang et al., 2019). Other reactions, such as those involving halogen and organic intermediates, may become significant for NO production in specific regions, such as in polar, oceanic, and coastal areas (Alexander et al., 2020; Penkett et al., 2007; Savarino et al., 2013; Simpson et al., 2015).
To help better constrain the atmospheric Nr chemistry and budget, the last 3 decades has seen a growing interest in stable oxygen (O) and nitrogen (N) isotopes, notably in NO (Elliott et al., 2019; Savard et al., 2018). The isotopic composition is reported as an isotopic enrichment (δ) with respect to a reference material, defined as , and expressed in per mill (‰). R refers to the elemental abundance ratio of the heavy isotope to the light isotope (e.g. , , ) in the sample and in an international isotopic reference material (Vienna Standard Mean Ocean Water for O, Li et al., 1988; atmospheric N2 for N, Mariotti, 1984). A powerful tool to help trace the relative importance of different NOx-to-NO oxidation pathways is through the use of the 17O excess (Δ17O = δ17O − 0.52×δ18O). Δ17O is transferred to NO by O3, which possesses a very unique Δ17O ((26.2±1.3) ‰; Vicars and Savarino, 2014) due to mass-independent fractionation during its formation process (Thiemens, 2006). In comparison, the Δ17O of other atmospheric oxidants such as OH is near zero due to isotopic exchange with atmospheric water vapour (Dubey et al., 1997). Similarly, as the isotopic anomaly of atmospheric O2 is very close to 0 ‰ (Barkan and Luz, 2003) and since RO2 is mostly produced by the reactions R + O2 and H + O2, Δ17O of RO2 can be considered negligible (Alexander et al., 2020). Therefore, Δ17O in NO represents a unique tracer of the O3 implication in its formation processes that can provide valuable constraints on the relative contributions of individual reactions (e.g. Morin et al., 2011; Alexander et al., 2009; Michalski et al., 2003). By a simple mass balance calculation of O atoms in NO, the 17O excess of NO produced by an individual NO2-to-NO conversion process i ((Δ17O(NO)i) can be expressed as
where Δ17O(NO2) is the 17O excess of atmospheric NO2 and Δ17O(add. O)i is the transferrable 17O excess of the oxidant responsible for the conversion of NO2 into NO (Michalski et al., 2003). From Eq. (1), if Δ17O(NO2) is constrained, one can derive individual Δ17O transfer to NO relative to an i conversion process and compare this value with observed Δ17O(NO).
Recent studies in urban areas have attempted to interpret the variability in Δ17O(NO) in aerosols in order to quantify the relative contribution of homogeneous and heterogeneous processes to NO formation (e.g. Fan et al., 2023, 2022; He et al., 2020, 2018; Lim et al., 2022; Wang et al., 2023; Y. L. Wang et al., 2019; Kim et al., 2023; Y.-L. Zhang et al., 2022; Z. Li et al., 2022). However, to that end, it is necessary to have a clear quantitative understanding of the transfers of Δ17O in the Nr cycle. To date, due to very limited observational data, there is a lack of well-established knowledge on the dynamics of Δ17O in NO2, the key intermediate species in the formation of NO. Consequently, strong assumptions about Δ17O(NO2) have to be made when interpreting Δ17O(NO) measurements, which could potentially lead to biased conclusions. Notably, the most difficult regions for the interpretation of NO records are potentially polluted areas where the isotopic composition of NO2 is expected to be highly variable in space and time. Most studies typically estimate Δ17O(NO2) during the day by assuming that an isotopic steady state (ISS) is reached between NOx and O3, resulting in Δ17O(NO2) depending only on the relative contributions of different oxidants to NO oxidation. A recent study reported the first in situ observations of Δ17O(NO2) in an urban environment (Grenoble, France) in spring (Albertin et al., 2021). Time-resolved NO2 sampling (ca. 3 h) during 24 h revealed a strong diurnal cycle in Δ17O(NO2), reaching ca. 40 ‰ during the day and decreasing down to ca. 20 ‰ at night. The observed Δ17O(NO2) values and dial variability were consistent with its expected behaviour derived from Δ17O mass balance equations under the ISS assumption during the day. However, this first Δ17O(NO2) dataset is very small. More measurements are needed to test the applicability of this new isotopic tool in different environments and seasons and to assess whether the ISS is still valid. At night, the low Δ17O(NO2) measured by Albertin et al. (2021) is consistent with the oxidation of freshly emitted NO by O3. Nonetheless, since the timescale for the oxidation of NO2 into NO is thought to exceed the duration of the night (Alexander et al., 2020), it is also common to assume that the isotopic composition of nocturnal NO2 reflects more daytime formation and conditions of the previous days. While this assumption may hold true in remote areas (Morin et al., 2011), significant uncertainties subsist in urban areas where the nighttime NO chemistry may be more efficient. In such circumstances, the production of NO from NO2 formed at night would lead to a lower-than-expected Δ17O transfer to NO. For these reasons, the dual survey of the O isotopic composition of NO2 and NO would certainly help to accurately interpret Δ17O(NO) observations in polluted atmospheres, particularly with sampling at sub-daily timescales, which would allow us to study the diurnal dynamics of Δ17O(NO2) and its links with Δ17O(NO).
In addition to Δ17O, δ15N in NO (δ15N(NO)) can be used as a tracer of NO sources and/or chemical processing. As different NOx emission sources often have distinct δ15N fingerprints depending on the NOx production mechanism (Heaton, 1990; Felix et al., 2012; Fibiger and Hastings, 2016; Walters et al., 2015a, b; Yu and Elliott, 2017; Miller et al., 2018), δ15N(NO) is a potentially valuable tool to trace the origins of its gaseous precursor. However, due to N fractionation effects associated with physico-chemical processing, δ15N is altered during the conversion of NOx to NO (Elliott et al., 2019). Therefore, the variability in δ15N(NO) can be attributed to the following: (1) a change in NOx emission sources and (2) N isotopic fractionations between NO and NO2, between NO2 and NO, and during the transport of NO. These effects co-exist with relative contributions varying according to environmental conditions and the mix of NOx emissions. Numerous observations in diverse environments have emphasised the substantial influence of N fractionation effects in altering the original 15N composition of emitted gaseous NO precursors (e.g. Bekker et al., 2023; Chang et al., 2018; Geng et al., 2014; Luo et al., 2023; Vicars et al., 2013; J. Li et al., 2021). Although some N fractionation factors are available from calculations (Walters and Michalski, 2015) and laboratory experiments (Li et al., 2020; Walters et al., 2016), there is still a lack of observational constraints on the magnitude of the N isotopic partitioning between NOx and NO, which could lead to biased interpretations of δ15N(NO) observations.
Following the preliminary work of Albertin et al. (2021), this study presents for the first time simultaneous measurements of atmospheric NO2 and NO multi-isotopic compositions. The sampling took place at a high temporal resolution (∼3 h) in late February 2021 in an urban Alpine city. data of NO2 and NO, meteorological parameters, and atmospheric observations (NO, NO2, O3, and PM) are collated in order to investigate diurnal Nr chemistry, N fractionation effects, and NOx emissions. Our winter measurements extend the atmospheric NO2 multi-isotopic composition record, which is only composed of spring measurements performed during a single day by Albertin et al. (2021). The general aim of this case study is to test NO2-based isotopic approaches for tracing the origins and fate of NOx, for instance in urban areas on sub-daily timescales. The added value of Δ17O(NO2) measurements in Nr chemistry studies is more critically assessed here than in Albertin et al. (2021) through the use of accurate NOx measurements. Besides, using the isotopic theoretical framework developed previously, we explore the potential benefits of combining isotopic observations of NO2 and NO to gain a more detailed and quantitative understanding of the links between atmospheric Nr chemistry processes and variability in NO2 and NO isotopic composition. The framework used in inferring dominant NOx emission sources from NO2δ15N measurements is also tested.
2.1 Study site and sample collection
The study was conducted in February 2021 in Chamonix-Mont-Blanc, France (45∘55′21′′ N, 6∘52′11′′ E; altitude 1035 m above sea level, m a.s.l.). This narrow (∼ 2 km wide on average in Chamonix) 23 km Alpine valley of about 12 000 inhabitants is surrounded by high-elevation mountains. The city can experience severe PM pollution events during the winter season, mainly due to wood-combustion for domestic heating and road traffic (Chazette et al., 2005; Quimbayo-Duarte et al., 2021; Weber et al., 2018; Aymoz et al., 2007). The study's sampling site was located at a CNRS (Centre National de la Recherche Scientifique) facility in a residential area, 1.2 km south of the Chamonix city centre and 1.4 km north of the Mont-Blanc tunnel. Ambient air monitoring inlets and off-line gas and aerosol samplers were installed on the facility's terrace, 3 m above ground level (m a.g.l.). Over the campaign, the surface was partly covered with snow.
Atmospheric particles (aerosols) were collected using a high-volume sampler (Digitel®, DH77, total suspended particle inlet, 1 m3 min−1) and glass fibre (GF) filters (Whatman®, 150 mm diameter). Evaluating the collection efficiency of total NO has long been debated (e.g. Schaap et al., 2002; Appel et al., 1980), and, although not free from sampling artefacts (e.g. potential volatilisation of HNO3 after exposure to ambient air), GF filters have been used on several times to study nitrate isotopes, mainly in coastal sites (e.g. Savarino et al., 2007; Michalski et al., 2003; Morin et al., 2009; Frey et al., 2009; Morin et al., 2007a; Patris et al., 2007; Vicars et al., 2013). Under these conditions, the aerosol alkalinity is supposed to allow the collection of HNO3 (Prospero and Savoie, 1989). In our case, as the ambient air in Chamonix is expected to be free of sea salt, the GF filters were not washed before use in order to keep the initial NaCl coating inherited from the filter manufacturing process. Therefore, in addition to p-NO, we are confident that the high GF filter NaCl loading allowed the quantitative collection of HNO3 at our site, as has been shown previously in the literature (Appel et al., 1981; see also our reply to the comments of Reviewer 2 and related data on this specific issue, Albertin, 2023). Two field blanks were performed to evaluate the initial content of trace elements and possible contamination during handling. Atmospheric NO2 was collected concurrently to filter samples using a pre-cleaned honeycomb denuder tube coated with a mixture of 2.5 M KOH (in methanol) and ultrapure guaiacol inserted into a ChemComb® 3500 speciation cartridge (Thermo Scientific®, USA). A second coated denuder was placed in series into the cartridge to check for NO2 breakthrough. After sampling, denuders were rinsed with 10 mL of deionised water to solubilise trapped NO2. Detailed information on the denuder sampling protocol is available in Albertin et al. (2021). Similarly to blank filters, two blank denuders were prepared. Blank filters and denuders were subjected to the same handling, storage, and analytical treatment as field samples. Filters and denuder extractions were stored and transported frozen to IGE (Grenoble, France) for analysis.
Following the objective to investigate the diurnal isotopic composition of NO2 and NO, denuder and filter samplings were conducted continuously for 24 h with sampling time steps ranging from 1.5 to 7.5 h. During the day, denuder and filter samplings were synchronised. At night, two filter samplings were performed while three sets of denuder tubes were collected. This sampling protocol was conducted on 2 non-consecutive days, from 19 February 2021 at 21:00 local time (LT) to 20 February 2021 at 21:00 LT (sampling period no. 1 denoted SP 1) and from 24 February 2021 at 07:30 LT to 25 February 2021 at 07:30 LT (sampling period no. 2 denoted SP 2).
2.2 Chemical and isotopic analysis
Concentrations of major ions from filter extractions in deionised water were determined by ion chromatography (Thermo Scientific® Dionex™ Integrion™ HPIC). Reported to the total filter surface, the NO contribution from blank filters represented on average (8 ± 9) % of sampled NO. Atmospheric mass concentrations (expressed in µg m−3) were calculated as the ratio of the total ion filter loading (corrected for the blank contribution) to the total volume of air pumped through the filter in standard temperature and pressure (STP) conditions. NO concentrations in denuder extractions were first estimated using the Griess–Saltzman reaction and UV–Vis spectrometry at 544 nm. Even though the eluted matrix can interfere with colorimetric analyses, measured concentrations on first denuder tubes were relatively well correlated with ambient NO2 measurements during atmospheric sampling and allowed us to give indications regarding field blanks and regarding the volume needed to perform isotopic analysis.
Isotopic analyses were performed using an isotope ratio mass spectrometer (IRMS; Thermo Finnigan™ MAT 253) for analyses of , , and in NO and NO2 samples. Briefly, NO from filter extractions was converted into gaseous N2O by the bacterial denitrifier method (Sigman et al., 2001; Casciotti et al., 2002; Kaiser et al., 2007) in which ≈100 nmol of NO ions were injected into 2 mL of a bacteria medium (strain of Pseudomonas aureofaciens) under anaerobic conditions. NO2 denuder extractions were treated separately with the azide method (McIlvin and Altabet, 2005; Albertin et al., 2021) in which 2 mL of a 2 M sodium azide acetic acid 100 % buffer was injected into ≈100 nmol of NO, allowing quantitative conversion into N2O. For both filter and denuder extractions, ions were converted into N2O, which was further thermally decomposed into O2 and N2 in a gold tube heated at 850 ∘C. Then, O2 and N2 molecules were separated on a chromatography column and sent separately into the IRMS for the dual analysis of O and N isotopes (see Morin et al., 2009, for more details on the analytical line). The isotopic composition of NO samples was analysed in triplicate (the mean value of replicate measurements and the associated repeatability are reported in Table S2 in the Supplement). The limited number of NO2 samples did not allow for replicate measurements. From UV–Vis analysis, all NO2 samples presented a negligible blank (<4 %; mean of 1.7 nmol mL−1) except for the sample collected between 13:30 and 16:30 LT during SP 2, which showed a blank of around (14.0 ± 1.4) %. Therefore, the measured Δ17O of this sample was corrected for the blank effect assuming that the contaminated NO possessed a Δ17O of 0 ‰. No correction from this blank effect was applied to the δ15N measurements of NO2 because the δ15N fingerprint of the contamination could not be characterised. This uncertainty is propagated in the calculations of Sect. 3 and considered in the discussions. Possible isotopic changes resulting from the conversion and analysis process of NO and NO2 samples were evaluated using international NO and NO isotopic reference materials, respectively (Table S3). Accuracy of the analytical method was estimated as the standard deviation (σ) of the residuals between measurements of the reference materials and their expected values. In our study, average measurement uncertainties in δ15N, δ17O, δ18O, and Δ17O were estimated to be ± 0.3 ‰, ± 0.9 ‰, ± 1.3 ‰, and ± 0.4 ‰, respectively, for NO samples and ± 0.3 ‰, ± 0.4 ‰, ± 0.9 ‰, and ± 0.3 ‰, respectively, for NO2 samples. Detailed information about the calibration procedure can be found in Morin et al. (2009) and in Albertin et al. (2021) for NO and NO2 samples, respectively.
2.3 Ancillary data
During atmospheric samplings, surface NOx mixing ratios were measured at the study site using an incoherent broadband cavity-enhanced absorption spectrometer for NO2 (IBBCEAS; Barbero et al., 2020) and an optical-feedback cavity-enhanced absorption spectrometer for NO (OFCEAS; Richard et al., 2018). PM concentrations (PM10 and PM2.5) were monitored by an optical particle counter (GRIMM®, EDM 164). The O3 mixing ratio was monitored at the local air quality monitoring site located a kilometre north of the sampling site (Environnement SA®, O3 42M; https://www.atmo-auvergnerhonealpes.fr/, last access: 5 November 2021). Surface temperature (Tsurface) and relative humidity (RH) were measured by a portable logger (Tinytag, TGP-4500, Gemini Data Loggers) located at the air quality monitoring site. Vertical temperatures were measured from 11 similar loggers fixed along the Planpraz cable car (45∘55′39′′ N, 6∘51′55′′ E) from 1098 to 2021 m a.s.l. (data obtained from personal communications with Catherine Coulaud, IGE, 2021). The NO2 photolysis rate () was calculated for the two sampling periods using a photochemical box model (CiTTyCAT version 2.02; Galeazzo et al., 2018; Pugh et al., 2012) using the Fast-J photolysis scheme of Wild et al. (2000) and a surface albedo fixed to 0.65, a value representative of a snow-covered surface (average value between fresh and old snow; more details can be found in Text S1 in the Supplement).
2.4 Interpretation framework for isotopic signals
In this section, we briefly state the key concepts and equations necessary to interpret isotopic signals measured in NO2 and NO. A more detailed description and complete equation derivations can be found in the cited references.
2.4.1 Δ17O mass balance equations
Because NO2 and NO loss processes do not fractionate in terms of the oxygen mass-independent anomaly and considering that each source reaction induces a transfer of Δ17O to NO2 and NO, one considers the mass conservation of Δ17O during fractionation processes in the Nr cycle. Hence, one can implement Δ17O in the general mass balance equation of NO2 and NO. An overall expression of the time derivative of Δ17O in the species X (Δ17O(X), with X being NO2 or NO) is derived as a function of its deviation from Δ17O transferred through each production channel i (Pi) (Δ17Oi(X)), weighted according to the relative contributions of the production channels (Vicars et al., 2013):
where Pi expresses reaction rate constant times of the atmospheric concentrations of reacting species and τ is the atmospheric lifetime of the species X at steady state (, with [X] being the atmospheric mixing ratio of the species X).
During the day, the rapid photochemical cycling of NOx (Reactions R1–R4) leads to an isotopic equilibrium between NO and NO2; i.e. Δ17O(NO) ≈ Δ17O(NO2) (Michalski et al., 2014). Therefore, using the steady-state approximation and considering NO + O3 (Reaction R3) and NO + RO2 (Reaction R4) the main sources of NO2 at our site, the overall daytime Δ17O in NO2 can be expressed by
where is the O3 isotopic anomaly transferred to NO through Reaction (R3) (Savarino et al., 2008). , sometimes named A in the literature, represents the proportion of O atoms originating from O3 in NO2, hence the relative importance of Reaction (R3) in the conversion of NO into NO2 (Michalski et al., 2003; Morin et al., 2007b; Albertin et al., 2021):
where and are the kinetic constants of Reactions (R3) and (R4), respectively. The kinetic constants used in this study are listed in Table A1 in Appendix A. At night, considering that (1) Δ17O(NO) ≈ 0 ‰ (NOx emission without NO2 recycling), (2) there is no Δ17O equilibrium between NO and NO2 (no photochemical cycling), and (3) O3 is the main oxidant of NO (no nighttime production of RO2), Δ17O(NO2) is determined by the Δ17O transfer via Reaction (R3) and by the nighttime residuals of NO2 formed during the previous daytime hours (Albertin et al., 2021) following
where x is the NO2 formed during the day as a fraction of the total NO2 measured at night.
At our sampling site, we hypothesise that Reaction (R5) (OH pathway) and Reactions (R6)–(R8) (N2O5 pathway) are the main daytime and nighttime NO production channels, respectively. At steady state, from Eq. (2), we derive general expressions for Δ17O in NO during the day and night, associated with the OH and N2O5 pathways, respectively (Alexander et al., 2020):
where is the 17O excess transfer from O3 to NO3 during Reaction (R6) (Berhanu et al., 2012). Without wet scavenging, dry deposition is the main sink of NO (Park et al., 2004). Assuming a mean NO deposition velocity of 0.5 cm s−1 (mean value of the dry-deposition velocities of HNO3 and p-NO; Zhang et al., 2009), and considering the maximum daytime and minimum nighttime boundary layer heights of 500 and 100 m a.g.l., respectively (estimations based on measured vertical temperature profiles; Fig. S2 in the Supplement), the estimated residence time of NO against dry deposition can reach up to 28 h during the day and 6 h at night (Table B1 in Appendix B). Therefore, on sub-daily timescales, the 17O excess in NO during the day is more likely to reflect a combination of daytime and nighttime production processes than that during the night. Note that our estimated residence times for NO against dry deposition are upper limits as they represent the time required to reduce by a factor e the concentration of NO present at the top of the boundary layer; NO close to the surface would have a much shorter residence time.
2.4.2 Nitrogen isotopic fractionation effects
Each source of NOx generates a δ15N fingerprint which depends on the type and conditions (temperature and pressure) of combustion and on the type of fuel (e.g. coal, oil, gas) (Heaton, 1990; Felix et al., 2012; Fibiger and Hastings, 2016; Walters et al., 2015a, b; Yu and Elliott, 2017; Miller et al., 2018). The mean δ15N of NOx (δ15N(NOx)) emitted in the atmosphere results from the sum of each NOx emission δ15N fingerprint weighted by their relative contribution to the total NOx emissions. Once in the atmosphere, NOx is subjected to oxidation processes and isotopic exchanges that alter the initial δ15N(NOx). As a result, δ15N in NO2 and in NO is a complex function of both the δ15N signature of NOx emissions and N isotopic effects. These latter can be categorised into three groups: (1) the equilibrium isotope effect (EIE), (2) the kinetic isotope effect (KIE), and (3) the photochemical isotope fractionation effect (PHIFE) (Miller and Yung, 2000; Young et al., 2002). The magnitude of these isotopic effects is quantified as the 15N enrichment factor (ε), which is defined as (α−1), where α represents the N isotopic fractionation factor.
A general expression for δ15N(NO2) can be derived as a function of a factor FN, which represents the overall N isotopic fractionation effects between NOx emissions and NO2 (expressed in ‰), the fraction of NO2 with respect to NOx ( = ), and δ15N(NOx) (Albertin et al., 2021; Li et al., 2020):
Therefore, the 15N isotopic shift between δ15N(NO2) and δ15N(NOx) is given by
Physico-chemical processes between NO and NO2 can preferentially promote or deplete 15N in NO2 with respect to emissions of NOx (i.e. δ15N(NO2) ≠ δ15N(NOx)). The importance of this fractionation shift is modulated by the factor (). When NO is almost entirely converted into NO2 (), N fractionation effects can be neglected (i.e. δ15N(NO2) ≈ δ15N(NOx)).
From samples collected at Jülich, Germany, Freyer et al. (1993), observed for the first time the linear relation described by Eq. (8) and set the theoretical framework to interpret δ15N variabilities in atmospheric NO2. They showed that the observed seasonal variation in δ15N(NO2) was driven by N fractionation effects (represented in the FN factor) caused by photochemistry and isotopic equilibrium. Based on this work, as well as that of Li et al. (2020), Albertin et al. (2021) derived an expression of FN during the day assuming that the NO–NO2 system is in isotopic equilibrium (steady state):
where is the fractionation factor of combined KIE and PHIFE (LCIE stands for Leighton cycle isotope effect) and is the EIE fractionation factor between NO and NO2. and are temperature dependent and can be calculated following the theoretical approach of Walters and Michalski (2015) (Table D1 in Appendix D). From calculations based on the zero-point energy of 15NO2 and the absorption cross section of 14NO2, αPHIFE is estimated to vary between 1.0020 and 1.0042 for a range of solar zenith angles between 90 and 0∘ (Fang et al., 2021). In this study we use a mean value of αPHIFE at 1.0031. is defined as the ratio of the NO2 lifetime with respect to isotopic exchanges over the daytime NO2 chemistry lifetime. is the NO2 photolysis rate, is the rate constant of Reaction (R3), and is the rate constant of the isotopic exchange . During the day, Δ15(NO2 − NOx) varies according to the environmental conditions. In low-NOx conditions (e.g. remote and polar regions) Δ15(NO2 − NOx) is predicted to be controlled by LCIE factors (), whereas an EIE-dominated regime () is expected in polluted environments (high-NOx conditions). At night, and αPHIFE are null and is defined as the ratio of the NO lifetime with respect to isotopic exchange with NO2 to the NO chemical lifetime at night . In this study, we consider only one particular case with , which means that isotopic exchanges are much faster than NO oxidation by O3. In this scenario, KIEs are negligible compared to EIEs and can be expressed as
The complete derivation of Eqs. (10) and (11) is given in Albertin et al. (2021).
KIE and EIE are also expected during the conversion of NO2 to NO. The 15N partitioning associated with isotopic equilibrium between N2O5 and NO2 (Reaction R7) can be theoretically computed as a function of temperature (Walters and Michalski, 2015; Table D1). At 298 K, if N isotopic equilibrium is reached, N2O5 is predicted to have δ15N values 27.6 ‰ higher than NO2. Considering that the isotopic fractionation through the N2O5 pathway is solely controlled by EIE, NO is therefore expected to be enriched in 15N relative to NO2. However, to date, no experimental study has reported on 15N partitioning between atmospheric NO2 and NO, and the fractionation factors are still being debated (Freyer, 1991; Fang et al., 2021). The dominant NOx-to-NO conversion processes considered in this study, along with corresponding Δ17O transfer factors and the known 15N enrichment factors at 298 K (determined from both experimental and computational studies), are illustrated in Fig. C1 in Appendix C.
3.1 Temporal variations in general atmospheric observations
Surface temperatures during SP 1 and SP 2 show similar values, with a marked diurnal cycle (from −2 to 16 ∘C; Fig. 1). A positive temperature gradient with altitude is observed from the late evening to morning. Surface temperature rises around midday and reaches a maximum at around 15:00 LT, resulting in a negative temperature gradient with altitude. In deep alpine valleys, the diurnal variability in surface air temperature is strongly influenced by the temporal evolution of the boundary layer structure, particularly in winter with the formation of a surface layer inversion (Whiteman, 1982). As previously observed in Chamonix (Chazette et al., 2005), the nocturnal surface layer inversion regularly thickens during the night of the sampling periods. After sunrise, air masses warm up until the nocturnal inversion layer breaks down in the late morning. Observed RH behaviour relatively correlates with the increase in temperature during the day, showing a rapid decrease between the mid-morning and early afternoon (from 96 % to 23 % and from 96 % to 30 % for SP 1 and SP 2, respectively; Fig. 1).
During SP 1 and SP 2, the mixing ratios of NO, NO2, and O3 exhibit diurnal patterns (Fig. 1) that are typical in Chamonix in late February (Fig. S3) and more generally in urban areas (Mayer, 1999). The highest NO level is observed in the morning, peaking at around 10:30 LT (82 and 152 nmol mol−1 for SP 1 and SP 2, respectively). The concurrent increase in NO2 and decrease in O3 (down to 1 nmol mol−1) can be attributed to Reaction (R3) (NO + O3). NOx decreases in the late morning, likely due to a combination of lower emissions, NO2 oxidation, and the dilution effect. Meanwhile, O3 gradually recovers to ca. 30 nmol mol−1, a typical winter background air level in Europe (Gaudel et al., 2018). Due to local emissions, NOx increases again from 16:00 LT, resulting in O3 titration, and subsequently to an increase in NO2 (up to 40 nmol mol−1). After 18:30 LT, NO remains low until the morning, and NO2 decreases slowly until midnight, stalls around 10 nmol mol−1, and then rises again at 05:30 LT. After the late-afternoon titration, O3 gently recovers and stays relatively low throughout the night, likely due to a titration effect from nocturnal NO emissions which are confined in the surface layer inversion.
Both SP 1 and SP 2 show diurnal variations in PM mass concentrations (Fig. 1), with morning and evening peaks related to local emissions from traffic and home heating (Aymoz et al., 2007). PM10 concentrations display an additional increase at midday following the breakdown of the temperature inversion. At 12:30 LT, while PM10 concentrations increase moderately during SP 1 to reached 38.6 µg m−3, a sharp increase to 119 µg m−3 is observed during SP 2. Then PM10 concentrations decrease during the afternoon of SP 1 but remain high during the afternoon of SP 2 until the surface inversion layer forms. On average, PM10 concentration is 3 times higher during SP 2 ((59.4 ± 37.6) µg m−3) than during SP 1 ((20.6 ± 10.2) µg m−3). The considerable increase in PM10 concentrations between SP 1 and SP 2 is likely to be explained by a Saharan dust episode that started on 23 February (Figs. S3, S4, and S5). Saharan dust deposition is a well-known phenomenon in the Alps and is characterised by a sudden increase in coarse particles, mainly composed of alumino-silicates as well as calcium and potassium (Angelisi and Gaudichet, 1991; Delmas, 1994; Di Mauro et al., 2019; Goudie and Middleton, 2001; Greilinger et al., 2018; Schwikowski et al., 1995; Sodemann et al., 2006).
The NO mass concentration varies from 0.3 to 3.4 µg m−3, with an average of (0.9 ± 0.6) µg m−3 for SP 1 and of (1.2 ± 0.9) µg m−3 for SP 2 (Fig. 1). During both sampling periods, NO concentration is within the range of previous observations made in Chamonix in winter (Allard, 2018). NO shows a distinctive peak at 3.4 µg m−3 during SP 2 between 10:30 and 13:30 LT, correlated with the PM10 surge. During transport, dust can undergo heterogeneous uptake and conversion of gases on its surface, leading to the inclusion of secondary species such as NO, sulfate, and ammonium (Usher et al., 2003). NO on dust results mainly from HNO3 uptake and heterogeneous reactions of N2O5 (see Usher et al., 2003, for a review and also references therein). Mineral dust is believed to significantly contribute to NO formation and size distribution, particularly in regions close to dust emission sources (Karydis et al., 2016). However, the origin of NO during SP 2 at our site remains unclear and could be attributed to the advection of both nitrated-dust particles formed through heterogeneous processes during transport and anthropogenic fine particles (Aymoz et al., 2004).
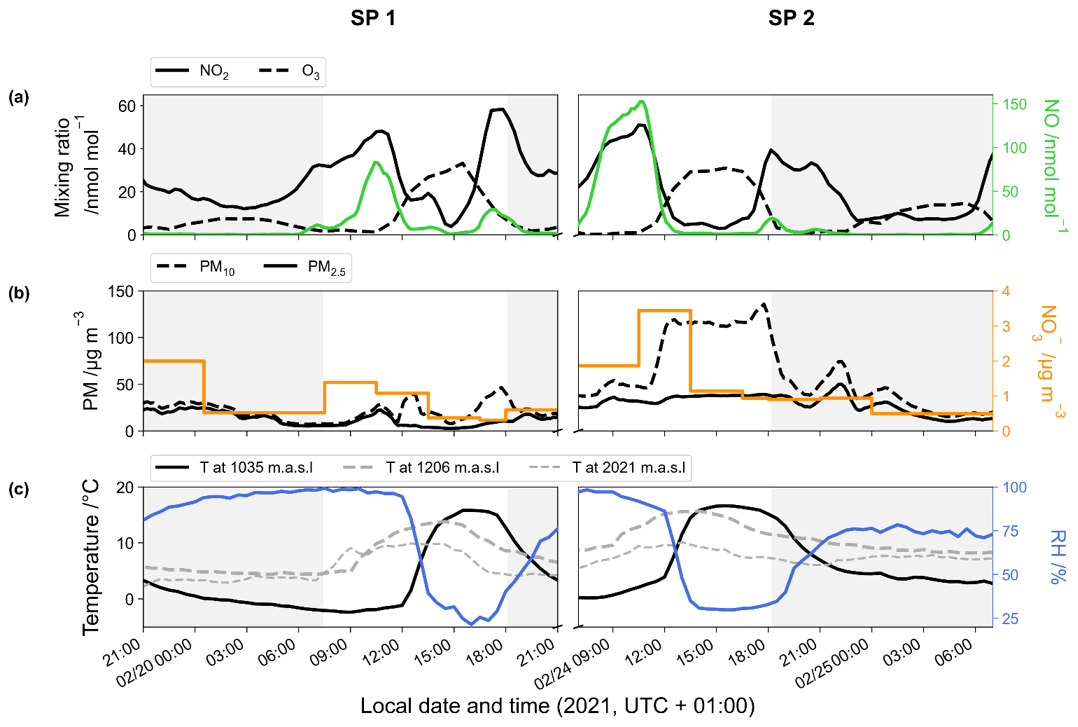
Figure 1Temporal evolution of the 1 h rolling mean of (a) NO2 (black line), O3 (dashed line), and NO (green line) mixing ratios; (b) PM (dashed line for PM10 and solid line for PM2.5) and NO (orange line) mass concentrations; and (c) temperature at the surface (black line), at 1206 m (dashed grey line), and at 2021 m (light dashed grey line) and surface relative humidity (blue line). Data were collected during the two sampling periods (SP 1 and SP 2) in Chamonix. Grey-backdrop-shaded areas represent the nighttime (sunset to sunrise).
Figure 2 shows the temporal evolution of measured Δ17O and δ15N of NO2 and NO in Chamonix during the two sampling periods (SP 1 and SP 2). All isotopic data used in this study are reported in Tables S1 and S2. In the following analysis, first we describe Δ17O(NO2) measurements and give interpretation in light of NOx chemistry cycling (Sect. 3.2). Then, an analysis of Δ17O(NO) measurements is proposed, aggregating daytime and nighttime periods and comparing them with Δ17O(NO) estimates derived from Δ17O(NO2) measurements and Δ17O mass balance for major chemical processes (Sect. 3.3). In light of these results and atmospheric conditions during SP 1 and SP 2, sub-daily Δ17O(NO) dynamics are investigated. In Sect. 3.4, N fractionation effects in the NOx cycle are quantified and the dominant NOx emission source is identified. The dynamics of δ15N(NO are also described, and its use to trace NOx emission sources and oxidation processes is discussed.
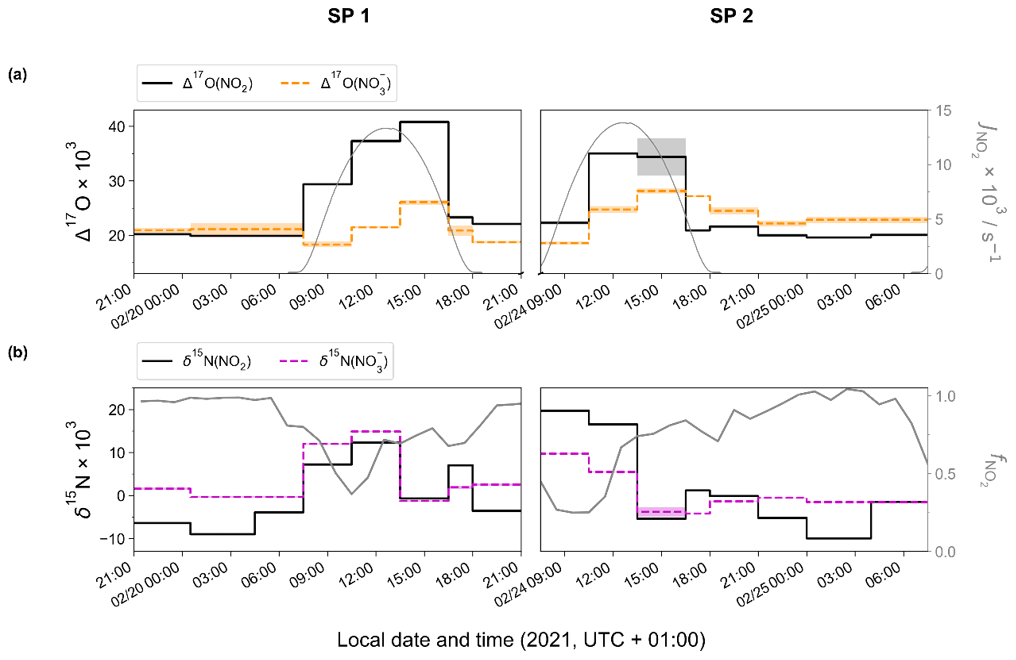
Figure 2Temporal evolution of observed (a) Δ17O and (b) δ15N of atmospheric NO2 (top and bottom solid black line) and NO (top orange and bottom dashed magenta line) in Chamonix (length of horizontal line denotes sampling period; shaded area denotes overall analytical error). The NO2 photolysis rate (, top grey line) is from CiTTyCAT box-model output. = ); bottom grey line) is calculated from the hourly mean mixing ratio of NO and NO2.
3.2 Δ17O of NO2 and NOx diurnal cycling
Over the course of SP 1 and SP 2, Δ17O(NO2) shows a large diurnal variability (from 19.6 ‰ to 40.8 ‰) with a weighted mean ± 1 standard deviation of (25.2 ± 7.1) ‰. Δ17O(NO2) values during the day (07:30–18:00 LT, (28.5 ± 7.3) ‰) are significantly higher (p value = 0.002, n=16) than during the night (18:00–07:30 LT, (20.8 ± 1.0) ‰). By day, Δ17O(NO2) follows a similar increasing trend during SP 1 and SP 2, reaching a respective maximum of 40.8 ‰ between 13:30–16:30 LT and 35.0 ‰ between 10:30–13:30 LT. For both sampling periods, after sunset, Δ17O(NO2) stabilises between 21:00 and 07:30 LT at ca. 20 ‰. Using the same sampling methodology in a mid-latitude urban area in spring, Albertin et al. (2021) reported very similar Δ17O(NO2) values over the course of a day (20.5 ‰–39.2 ‰), following a comparable diurnal pattern. As presented above (Sect. 2.4.1), according to the ISS (isotopic steady state) framework, the variability in Δ17O(NO2) reflects changes in the relative contributions of Reaction (R3) (NO + O3) and Reaction (R4) (NO + RO2) to the overall production of NO2. At our site, Δ17O(NO2) drops rapidly during the 16:30–18:00 LT interval to 23.3 ‰ and 20.9 ‰ during SP 1 and SP 2, respectively. Since the isotope recycling rate in the NOx–O3 system is driven at first order by (Michalski et al., 2014), due to low solar radiation between 16:30–18:00 LT at our site, such a rapid drop of Δ17O(NO2) suggests that sampled NO2 might not be at ISS anymore when the NO2 photolysis is very slow, notably at the end of the day in winter. Therefore, we only consider that ISS holds between 07:30 and 16:30 LT in order to avoid the questionable end-of-the day measurements in our ISS-based analysis. At night (i.e. no ISS), the observed drop of Δ17O(NO2) in the early evening reflects the rapid replacement of NO2 formed during the day by NO2 produced during the night via the conversion of freshly emitted NO, in line with Eq. (5). Then, high NO2 throughout the night, along with relatively low O3, supports observations of low Δ17O(NO2) at night (i.e. ≈ 20 ‰).
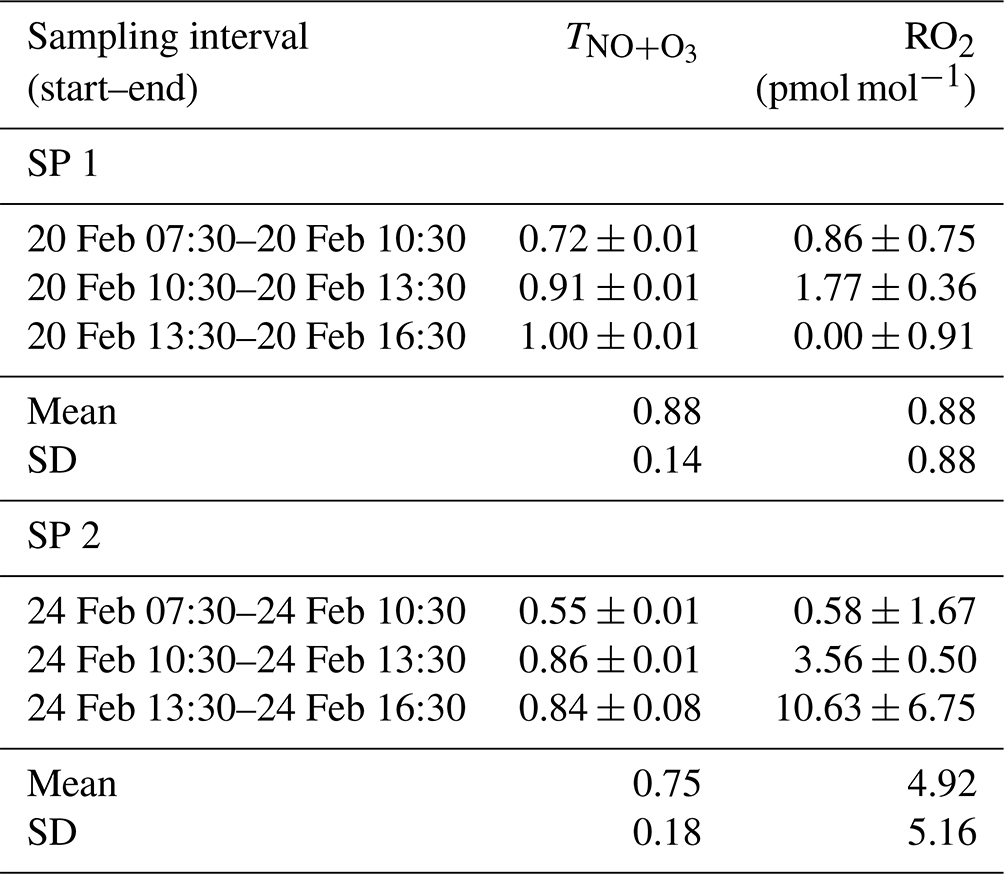
Using Eq. (3), we derive from Δ17O(NO2) observations the relative contribution of Reaction (R3) (NO + O3) to Reaction (R4) (NO + RO2) in the formation of NO2 ():
Between 07:30 and 16:30 LT, varies from 0.55 to 1.00 (Table 1), with a mean of 0.88 and 0.75 for SP 1 and SP 2, respectively. The NO + O3 pathway is dominant between 13:30 and 16:30 LT, corresponding to the time when O3 is highest (Fig. 1). In contrast, the maximum contribution for the NO + RO2 pathway is observed between 07:30 and 10:30 LT, when NO levels are high and rising continuously. Interestingly, previous studies have reported a high sensitivity of RO2 to changes in NOx, particularly at high NOx levels (Ren et al., 2006; Stone et al., 2012). Sources of RO2 in wintertime are mainly driven by the production of OH radicals from HONO photolysis, alkene ozonolysis, and formaldehyde photolysis (Tan et al., 2018). During winter, HONO plays a crucial role in chemistry, particularly in the morning, as its photolysis can potentially accelerate daytime oxidation processes, leading to increased RO2 production (Alicke et al., 2003; Aumont et al., 2003). Direct emissions from vehicle exhaust could be a significant source of VOCs and HONO at our site (Brulfert et al., 2005; Gu et al., 2019; Kirchstetter et al., 1996; Kurtenbach et al., 2001; Liu et al., 2023). Heterogeneous processes acting on ground surfaces and aerosols can also contribute to HONO formation (Aumont et al., 2003). In addition, snowpack releases may also be a potential source of HONO (Grannas et al., 2007), as detected in Paris after a snow event, which could significantly impact the urban OH budget (Michoud et al., 2015).
Following the approach of Albertin et al. (2021), combining Eqs. (3) and (4) allows us to derive the RO2 mixing ratio from observed Δ17O(NO2) and the O3 mixing ratio following
Between 07:30 and 16:30 LT, we estimate an average RO2 mixing ratio at our site of (0.88 ± 0.88) pmol mol−1 and (4.92 ± 5.16) pmol mol−1 during SP 1 and SP 2, respectively (Table 1). Studies conducted in urban winter environments reported RO2 measurements at a few pmol mol−1 (Ren et al., 2006; Emmerson et al., 2005; Tan et al., 2018; Kanaya et al., 2007), in good agreement with our estimations. Similarly, RO2 mixing ratios derived by Albertin et al. (2021) from observed Δ17O(NO2) in spring (mean of (13.8 ± 11.2) pmol mol−1) were also found to be in line with studies conducted in the same season. The fact that our isotopic inference of RO2 mixing ratios carried out in two different seasons (winter and spring) are both comparable to direct in situ RO2 measurements confirms the sensitivity of our method in probing the chemical dynamics. We think that our method may be very valuable in deciphering oxidation processes of Nr species, down to sub-daily temporal scales. Nonetheless, we recognise that without concurrent in situ measurements of RO2 and Δ17O(NO2), it is not possible to validate unambiguously the quantitative estimation of RO2 levels with our method.
Table 1 and RO2 mixing ratio (mean value ± overall uncertainty) derived from the isotopic measurements.
At this point, it is important to recall that the choice of the in Eq. (12) is of particular importance for quantifying (as for RO2). In the literature, varies between 35 ‰ and 41 ‰ (Michalski et al., 2003; Savarino et al., 2016; Vicars et al., 2012; Y.-L. Zhang et al., 2022; Y. Li et al., 2022). This relatively wide range of values is partly a result of some confusion in defining , the Δ17O transfer from O3 to NO. Indeed, the term Δ17O(O) is sometimes erroneously used as the transfer function of Δ17O from O3 to NO2 during Reaction (R3). Δ17O(O) is actually defined as Δ17O of O3 terminal atoms and is also named Δ17O(O3)term in the literature. As the Δ17O in O3 is borne by its terminal atoms, Δ17O(O) = 1.5 × Δ17O(O3)bulk. However, can be equal to 1.5×Δ17O(O3)bulk if only terminal atoms of O3 react with NO. But laboratory experiments by Savarino et al. (2008) did show that O3 does react with NO not solely with its terminal atoms but also, to a small but significant extent, with its central atom (probability of (8 ± 5) % for the abstraction of central atoms during the reaction NO + O3). Consequently, is slightly lower than 1.5×Δ17O(O3)bulk and the expression determined by Savarino et al. (2008) should be used: ‰.
Assuming that their maximum measured daytime Δ17O(NO2) reflects the conversion of NO to NO2 only through Reaction (R3) (i.e. ), Albertin et al. (2021) derived a value of 39.2 ‰ from Eq. (3). Given the respective analytical uncertainties (around ± 1 ‰), their value is in very good agreement with the maximum daytime value of 40.8 ‰ we observed in Chamonix. Similarly to Albertin et al. (2021), assuming that the highest daytime Δ17O(NO2) value at our site corresponds to leads to ‰. Using the experimental transfer function determined by Savarino et al. (2008), we estimate a bulk 17O excess of O3 () at (29.0 ± 2.2) ‰. This value is consistent with the range of direct measurements at mid-latitudes (mean of (26.2±1.3) ‰; Vicars and Savarino, 2014), although falling at the upper end of the range. Interestingly, Vicars and Savarino (2014) reported a significant peak in Δ17O(O3)bulk during February–March in Grenoble, France (located 120 km southwest of Chamonix), based on year-round measurements with Δ17O(O3)bulk values 2 ‰–3 ‰ higher than the annual mean of 26.2 ‰. Although the cause of increased values during this period is unknown, our derived Δ17O(O3)bulk matches remarkably well the February–March measurements reported by Vicars and Savarino (2014).
It is worth pointing out that a more accurate calibration of Δ17O(NO2) measurements is desirable. There is currently no internationally accepted nitrite salt standard with a positive Δ17O. Nevertheless, we are rather confident in our present calibration methodology. Indeed, the Δ17O(NO2) values measured in Chamonix closely align with previous observations in Grenoble. In both studies, the maximum (daytime) and minimum (nighttime) Δ17O(NO2) measurements conform to the expected values derived from the Δ17O theoretical framework (based on well-established NOx chemistry and Δ17O(O3) measurements) when O3 overwhelmingly dominates the NO-to-NO2 conversion. Therefore, at this stage, we do not consider that Δ17O(NO2) calibration is an issue for this study. However, as we cannot completely rule out a small bias in our calibration, we have manufactured enriched nitrite salts and are presently working on refined new nitrite salt standards. Note that the rapid exchange of nitrite O isotopes in aqueous solution (Casciotti et al., 2007) is a challenge for inter-laboratory data comparisons. If new measurements of nitrite Δ17O references are found to differ from our current calibration, we plan to publish a correction to the paper with updated values and any potential implications.
3.3 Interpretation of Δ17O in atmospheric nitrate
Over the two sampling periods, Δ17O(NO) varies significantly (from 18.3 ‰ to 28.1 ‰), with a weighted mean of (22.5 ± 3.1) ‰. While Δ17O(NO2) values are relatively similar during the two sampling periods, Δ17O(NO) values are systematically higher during SP 2 than during SP 1, except during the 07:30–10:00 LT interval. Δ17O(NO) in Chamonix is in the same range as that of most previous observations in urban environments (9 ‰–44 ‰; e.g. Kim et al., 2023; Wang et al., 2023; Fan et al., 2023; Y.-L. Zhang et al., 2022; Lim et al., 2022; Z. Li et al., 2022) but lower than most values measured during the cold season, which are typically >25 ‰. Unlike Δ17O(NO2), daytime and nighttime Δ17O(NO) values at our site are not significantly different (p value > 0.05, n=14). Similarly, from 12 h resolved sampling in winter Beijing, He et al. (2018) found no significant difference between daytime and nocturnal Δ17O(NO) and suggest that each sample reflects NO produced during both the day and the night. From high-time-resolution (3 h) aerosol sampling in winter Beijing, Y.-L. Zhang et al. (2022) reported Δ17O(NO) values of between 23.4 ‰ and 39.3 ‰, with higher values observed at night ((31.0±2.6) ‰) than during the day ((29.3 ± 3.0) ‰). This diurnal behaviour of Δ17O(NO) was attributed to the changes in the branching ratio of nocturnal and photochemical reactions on NO formation. In Chamonix, the range of Δ17O(NO) values is very different from Y.-L. Zhang et al. (2022) observations, with consistently lower values and a distinct diurnal tendency. However, in the cases of Δ17O(NO) measurements at sub-daily temporal scale, the atmospheric lifetime of NOx and NO is critical for comparing Δ17O(NO) records from one site to another. Pollutant levels and atmospheric conditions between Chamonix and Beijing are very different, notably in winter when Asian urban areas can experience severe haze pollution episodes with NO mass concentration exceeding 70 µg m−3, which is over 10 times higher than in Chamonix (Lim et al., 2022; He et al., 2018; Y.-L. Zhang et al., 2022). In such conditions, PM can reach several hundreds of µg m−3 for several days, which can significantly impact atmospheric processes involved in the formation of secondary species. Aside from the intrusion of Saharan dust during SP 2, the pollutant level in Chamonix is indicative of a moderately polluted region, with significant diurnal variations.
3.3.1 Steady-state evaluation of Δ17(NO)
To investigate the factors influencing the variability in Δ17O(NO) at our site, one compares observed Δ17O(NO) with estimated values of Δ17O(NO) derived from Δ17O mass balance and observed Δ17O(NO2), assuming the OH and N2O5 pathways dominate the formation of NO at our site. Therefore, calculated Δ17O(NO) reflects the theoretical Δ17O transfer during the oxidation of NO2 to NO at our site through the dominant chemical process during the day (i.e. OH pathway) and at night (i.e. N2O5 pathway).
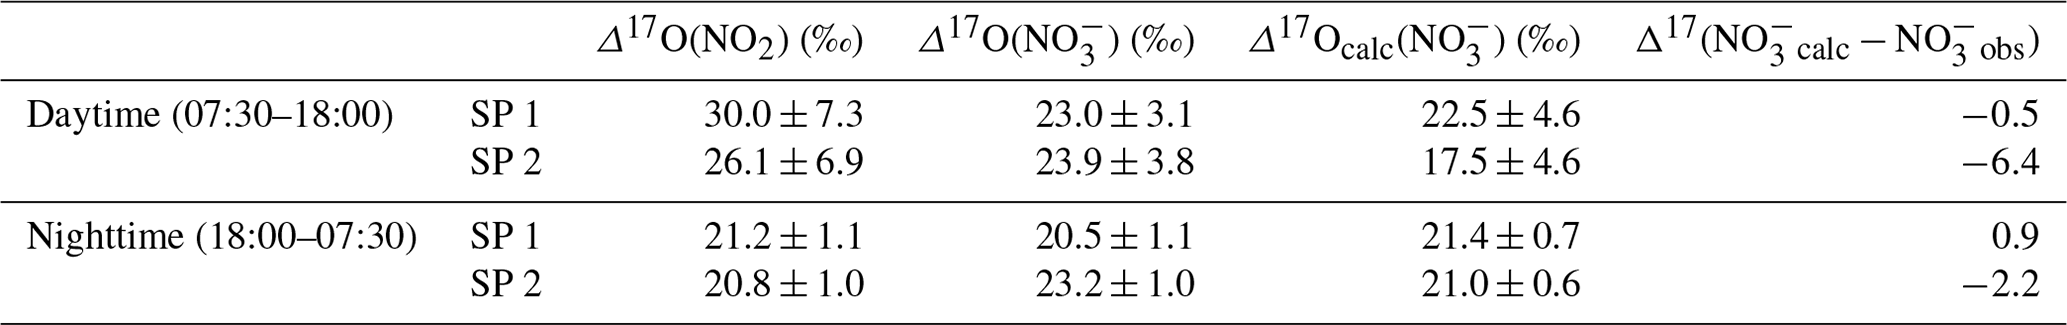
As presented, during the day, we consider the conversion of NO2 into NO to be predominantly influenced by Reaction (R5) (OH pathway). Hence, the theoretical corresponding 17O excess transfer to NO is estimated using Eq. (6) and observed Δ17O(NO2) between 07:30 and 18:00 LT (n=3 per sampling period). Then, in order to estimate a daytime average value of Δ17O(NO) which is representative of the potential for the formation of NO from surface NO2 by the OH pathway, each calculated Δ17O(NO) is weighted by the product [NO2] × (the diurnal variability in the OH mixing ratio is assumed to follow the diurnal variation; Liu et al., 2021). Finally, an overall mean daytime Δ17O(NO) for SP 1 and SP 2 is estimated by taking the sum of the weighted calculated values (=Δ17Ocalc(NO)). The same approach is used during the night, assuming that the conversion of NO2 into NO is dominated by Reactions (R6)–(R8) (N2O5 pathway). Equation (7) and observed Δ17O(NO2) between 18:00 and 07:30 LT (n=3 per sampling day) are used to estimate Δ17O(NO). Each calculated Δ17O(NO) is weighted by the product [NO2] × [O3] (i.e. NO3 production rate) and summed to estimate a mean nighttime Δ17O(NO) for SP 1 and SP 2. The 17O excess transferred from O3 to NO2 during Reaction (R6) () is fixed at 44.7 ‰. This value is set according to the transfer function reported by Berhanu et al. (2012), whereby and ‰ (see Sect. 2.4.1). We compare hereafter Δ17Ocalc(NO) with the weighted day and night averages of observed Δ17O(NO) at our site. During the day, Δ17Ocalc(NO) is compared with Δ17O(NO) observations averaged between 07:30 and 18:30 LT (n=3). At night, Δ17Ocalc(NO) is compared with Δ17O(NO) observations averaged between 18:30 and 07:30 LT.
At night during SP 1, observed Δ17O(NO) and Δ17Ocalc(NO are in good agreement (Δ17Ocalc(NO) − Δ17O(NO) = Δ17(NOcalc − NOobs) = 0.9 ‰), suggesting a local and rapid (<12 h) conversion of NO2 into NO via the N2O5 pathway. During the day, observed Δ17O(NO) is 0.5 ‰ higher than Δ17Ocalc(NO), also suggesting that NO is formed locally during the day for oxidation of surface NO2 through the OH pathway. Small differences between observed and calculated Δ17O of NO during the day and night could be explained by the presence of NO residues formed during the previous night and day, respectively, which are not considered in the calculations since they do not account for the NO lifetime. In contrast to SP 1, Δ17Ocalc(NO) during SP 2 is significantly lower than the mean observed Δ17O(NO), particularly during the day with a Δ17(NOcalc − NOobs) of −6.4 ‰. The significant gap between observed and calculated Δ17O(NO) suggests a different origin and/or formation process of NO during SP 2 compared to SP 1. Although less important than during the day, Δ17Ocalc(NO) values for SP 2 at night are lower by 2.2 ‰ compared to the observed value. This small shift can be explained by residuals of enriched daytime NO. It is important to point out that, although the NO2 sample collected on 24 February between 13:30 and 16:30 LT presents an important blank (ca. 14 %), ambient NO2 is low during the sampling period (mean of (4.5 ± 1.8) nmol mol−1). Therefore, as each Δ17O value used to estimate Δ17Ocalc(NO) is weighted by the mean ambient NO2 mixing ratio over the sampling period, the incertitude related to this blank has little influence on the daily average of Δ17Ocalc(NO). Given the low Δ17(NOcalc − NOobs) during SP 1, observed Δ17O(NO) can be explained by the local and rapid (<12 h) oxidation of NO2, dominated by the OH and N2O5 pathway during the day and night, respectively. However, in contrast to SP 1, the 17O excess measured in NO during the day of SP 2 cannot be fully constrained by the oxidation of surface NO2 through the OH pathway, suggesting that the formation mechanisms of NO are different between SP 1 and SP 2 and/or the presence of NO not formed locally during SP 2. Below we examine the changes in the sub-daily dynamics of Δ17O(NO) between SP 1 and SP 2 in light of atmospheric observations.
Table 2Mean observed Δ17O data of NO2 (Δ17O(NO2)) and NO(Δ17O(NO)) in Chamonix and mean calculated Δ17O of NO (Δ17Ocalc(NO)) using Eqs. (6) and (7) in the day and at night, respectively, constrained with observed Δ17O(NO2). Calculated day and night values were weighted by [NO2] × and [NO2] × [O3], respectively
3.3.2 Δ17(NO) sub-daily dynamics
Between 07:30–10:30 LT, Δ17O(NO) is very similar during SP 1 (18.3 ‰) and SP 2 (18.6 ‰). Nonetheless, in the following sampling time step (i.e. between 10:30–13:30 LT), Δ17O(NO) is significantly different between SP 1 (21.5 ‰) and SP 2 (24.7 ‰). Intriguingly, between 07:30–13:30 LT, Δ17O(NO2) during SP 2 (26.9 ‰) is lower compared to SP 1 (32.8 ‰). As a consequence, if one considers the notion that NO is formed from the oxidation of local NO2 through identical pathways during SP 1 and SP 2, observed Δ17O(NO) should be lower during SP 2 than during SP 1. Therefore, the more pronounced increase in observed Δ17O(NO) during the 10:30–12:30 LT interval of SP 2 suggests a different origin and/or formation channel of NO, as mentioned previously. One more piece of evidence is that, during this period of time, PM10 and NO levels increase significantly during SP 2, alongside the disruption of the inversion layer (depicted in Fig. 1). It can be inferred that this rise in PM10 is mostly due to the presence of Saharan dust. The simultaneous increase in NO and of Δ17O(NO) corroborates the hypothesis that this NO was not formed from the oxidation of ambient NO2. Furthermore, such an increase in Δ17O(NO) can only be supported by the oxidation of NO2 through the N2O5 pathway, which is not expected to be important during the day due to the rapid photolysis of NO3 and its titration by NO (Brown and Stutz, 2012).
Interestingly, aerosol samplings conducted at various heights (8, 120, and 260 m a.g.l.) in Beijing, China, revealed a positive vertical gradient of Δ17O(NO) in winter, from on average 29 ‰ to 33 ‰ (Fan et al., 2022). In summer, the Δ17O(NO) values at the three altitudes were very similar. This increase in Δ17O(NO) with altitude in winter was believed to result from a stratification of NO2-to-NO oxidation processes due to low vertical mixing and elevated surface NOx emissions. However, the authors did not consider the potential variability in Δ17O(NO2) with altitude, which can be substantial in urban areas at night as low Δ17O(NO2) results from surface NO oxidation. For our study, we propose an alternative interpretation of the vertical variability in Δ17O(NO), where Δ17O(NO2) is considered the main driver. During the formation of the nocturnal boundary layer, NO2 formed during the day can be trapped above the surface layer in the nocturnal residual layer (NRL). This NO2 has a high Δ17O because it was formed during the previous daytime hours under the ISS framework (Eq. 3). Throughout the night, this highly enriched NO2 (ca. 37 ‰, which is the average of the maximum Δ17O(NO2) during SP 1 and SP 2) can be converted to NO via the N2O5 pathway, hence leading to a substantial Δ17O transfer to NO at around 32 ‰, which is in the range of Δ17O(NO) observed by Fan et al. (2022) in winter. In the meantime, NO emitted at the surface during the night can be converted to NO2 by O3, with a Δ17O transfer of ca. 20 ‰ (Eq. 5 with x=0). This low enriched NO2 can be further oxidised to NO by the N2O5 pathway, which results in a Δ17O transfer at around 21 ‰. This NO2 with a low Δ17O is very likely to be formed only at the surface during the night in areas experiencing important NOx emissions (Michalski et al., 2014). Furthermore, surface NO2 with low Δ17O is not expected to be transported aloft as it is formed in the surface inversion layer during the night. Therefore, NO formed in the NRL during winter nights may be more enriched than the NO formed concurrently at the surface, regardless of the NO2 oxidation process involved. When the inversion layer breaks during the following day, the NO that was formed in the NRL during the night is mixed with the NO formed at the surface, resulting in an increase in the overall surface Δ17O. In this scenario, the presence of the Saharan dust during SP 2 may have increased the NO loading aloft by promoting heterogeneous processes acting on aerosol surfaces in the vicinity of Chamonix. Hence, NO2 stratification at night could explain the observed increase in Δ17O of NO at the surface following the collapse of the nocturnal inversion layer. However, we cannot determine whether the enriched NO was formed in the vicinity of Chamonix and/or transported to our site by Saharan dust.
Although the exact nature of the high 17O excess measured in NO during SP 2 remains unclear, boundary layer dynamics is thought to play a significant role in the variability in Δ17O(NO) at the surface due to the stratification of NO2. Therefore, a wider consideration of such factors should be explored to avoid possible over-interpretation of Δ17O(NO) variabilities at the surface, especially in urban areas experiencing significant boundary layer dynamics in winter and high surface emissions of NOx at night. Measuring Δ17O(NO2) at various altitudes could provide better insights into the vertical dynamics of Δ17O(NO) and subsequently quantitative information on NO production processes.
3.4 Nitrogen isotopic compositions
3.4.1 N fractionation effects in the NOx cycle
Over the two sampling periods, δ15N(NO2) shows substantial diurnal variability (from −10.0 ‰ to 19.7 ‰, n=16) with a weighted mean of (4.0 ± 9.1) ‰. In contrast, Albertin et al. (2021) reported a weak diurnal fluctuation in δ15N(NO2) in spring in Grenoble, in a narrow range from about −12 ‰ to −10 ‰. In summer in an urban–suburban location, Walters et al. (2018) also observed a wide range of δ15N(NO2) values; however, unlike in our study, these are almost consistently negative (from −31.4 ‰ to 0.4 ‰) with an overall mean at (−11.4 ± 6.9) ‰. As shown in Eq. (8), fluctuations in δ15N(NO2) reflect changes in NOx emission sources and/or N fractionation effects, these latter being weighted by ; i.e. the more NOx is in the form of NO, the greater the N fractionation effects (see Sect. 2.4). Hence, in the previous works of Albertin et al. (2021) and Walters et al. (2018), due to high (>0.7), isotope effects were small (<2.7 ‰) and δ15N(NO2) was mostly driven by changing contributions of NOx emission sources. At our site, shows a wider range, from 0.3 to 1.0, suggesting significant N isotopic fractionation effects, with minimum and maximum contributions corresponding to the highest and lowest observed value of δ15N(NO2), respectively. This pronounced seasonal behaviour of N isotope fractionation effects within the NOx cycle has previously been outlined in a seminal study of Freyer et al. (1993). Overall, compared with summer, lower during winter months due to lower O3 concentrations and higher NOx emissions favours EIE between NO and NO2, which also has a higher fractionation factor due to the lower temperatures (see Appendix D: “Equilibrium N fractionation factors”). Besides, this seasonal fluctuation in can be expected to be observed on smaller timescales, typically on the diurnal scale in urban areas where NO is generally fully oxidised into NO2 at night due to a lower NOx emission rate, resulting in higher at night than during the day, as observed in our sampling (Fig. 2).
Figure 3 shows the linear dependence of δ15N(NO2) on () over the two sampling periods, indicating the significant influence of atmospheric processes that alter the N isotopic distribution during the conversion of NOx into NO2. The linear regression gives a slope and an intercept of about (43.6 ± 3.3) ‰ and (−8.8 ± 1.0) ‰, respectively. According to Eqs. (10) and (11), the linearity between daytime (07:30–18:00 LT) and nighttime (18:00–07:30 LT) values suggests that EIE dominates the N fractionation processes between NOx and NO2. The influence of LCIE during the day could explain the greater variability around the linear fit in the daytime observations.
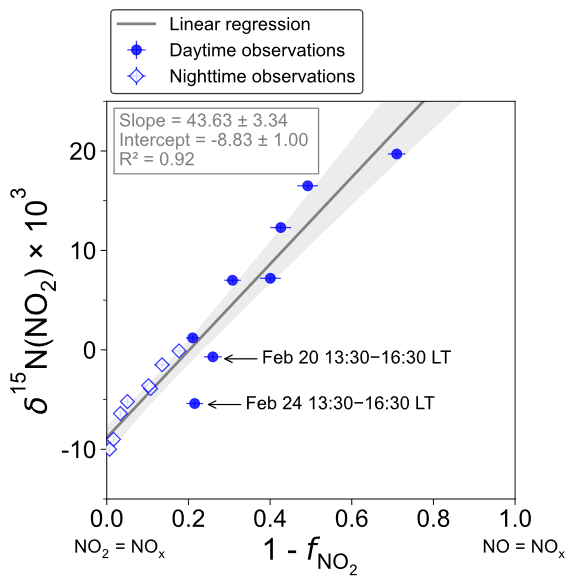
Figure 3Correlation plot of δ15N of atmospheric NO2 vs. () from observations in Chamonix in February 2021. values are averaged over the collection period of each NO2 sample. The grey shading is the 95 % confidence interval. White diamonds and blue dots represent the nighttime (18:00–07:30 LT) and daytime (07:30–18:00 LT) observations, respectively. The linear regression is plotted over the nighttime and daytime observations.
The relative importance of EIE and LCIE in the N fractionation between emitted NOx and NO2 is assessed by calculating the A∗ factor during the day (07:30–18:00 LT; ) and night (18:00–07:30 LT; ) (Table 3). and expressions are given in Sect. 2.4.2. Overall, during NO2 sampling intervals, the A∗ values are small (mean ± 1 standard deviation: 0.21 ± 0.51) and reflect an EIE-dominated regime with high NOx (Li et al., 2020). It is interesting to note that the highest A∗ values are observed between 13:30 and 16:30 LT and correspond to the two data points in Fig. 3 that lie outside the 95 % confidence interval of the regression line. These results suggest that EIE is the dominant N fractionation process between NOx and NO2 during both the day and the night (), with the exception of mid-afternoon when LCIE competes with EIE ().
To quantify the overall N fractionation effect (FN) between NOx and NO2, we dissociate the two samples collected between 13:30 and 16:30 LT into a different group (group no. 1 denoted GP 1) from the other samples (group no. 2 denoted GP 2). FN of GP 1 and GP 2 is calculated using Eq. (10) (which combines LCIE and EIE regimes) and Eq. (11) (which considers only the EIE regime), respectively. Calculated FN values are reported in Table 3, and data used for calculations can be found in Sect. 2.4.2 and in the Supplement. Calculated FN is significantly different between GP 1 and GP 2, with a mean of 16.4 ‰ and 42.3 ‰, respectively. The close match between the calculated average FN of GP 2 and the observed FN ((43.6 ± 3.3) ‰; slope of the regression line in Fig. 3) provides strong evidence for the reliability of Eq. (11), as well as the expression of used therein, to accurately describe the N fractionation between NOx emissions and NO2 at our site and, hence, to describe most of the variability in δ15N(NO2) measurements. This result holds significant importance in confirming the theoretical N isotopic fractionation framework used in prior research studies. It is also important to stress the influence of LCIE effects for GP 1, highlighting the high dependency of δ15N(NO2) on local environmental conditions. According to the A∗ factor, a greater influence of LCIE in the mid-afternoon could have contributed to the outlying of the two samples collected between 13:30 and 16:30 LT (GP 1). However, as mentioned above, the sample collected on 24 February between 13:30 and 16:30 LT has a significant blank. Therefore, it cannot be confirmed with certainty that the reason this sample falls outside the 95 % confidence interval of the regression line is solely due to LCIE. Nevertheless, the overall conclusion that EIE dominates the variability in δ15N(NO2) at our site is not affected by this uncertainty.
The δ15N shift in NO2 relative to emitted NOx (Δ15(NO2 − NOx)) is calculated for individual NO2 samples using the mean ambient temperature during each sampling period. The mean atmospheric δ15N of NOx (δ15N(NOx)) is then estimated by subtracting the Δ15(NO2 − NOx) value from the observed δ15N(NO2) value. Δ15(NO2 − NOx) and δ15N(NOx) estimates are reported in Table 3. Δ15(NO2 − NOx) varies greatly over the two sampling periods (from 0.7 ‰ to 30.7 ‰) with a mean value of ca. 9 ‰ (mean of GP 1 and GP 2). δ15N(NOx) shows much less variability with an overall mean at (−7.8 ± 1.9) ‰ (mean of GP 1 and GP 2), in very good agreement with the value derived from the regression relationship (−8.8 ‰; intercept of the regression line in Fig. 3). Therefore, there appears to be little variation in NOx emission sources at our site, and the wide variability in δ15N(NO2) is mainly driven by important equilibrium post-emission isotopic effects.
Table 3Summary table of data used to estimate the N isotopic fractionation between NOx emissions and NO2 at our site (Δ15(NO2 − NOx)) and to derive NOx emissions δ15N-fingerprint (δ15N(NOx)). The data reported are the mean values for each NO2 sampling period (mean value ± absolute uncertainty).
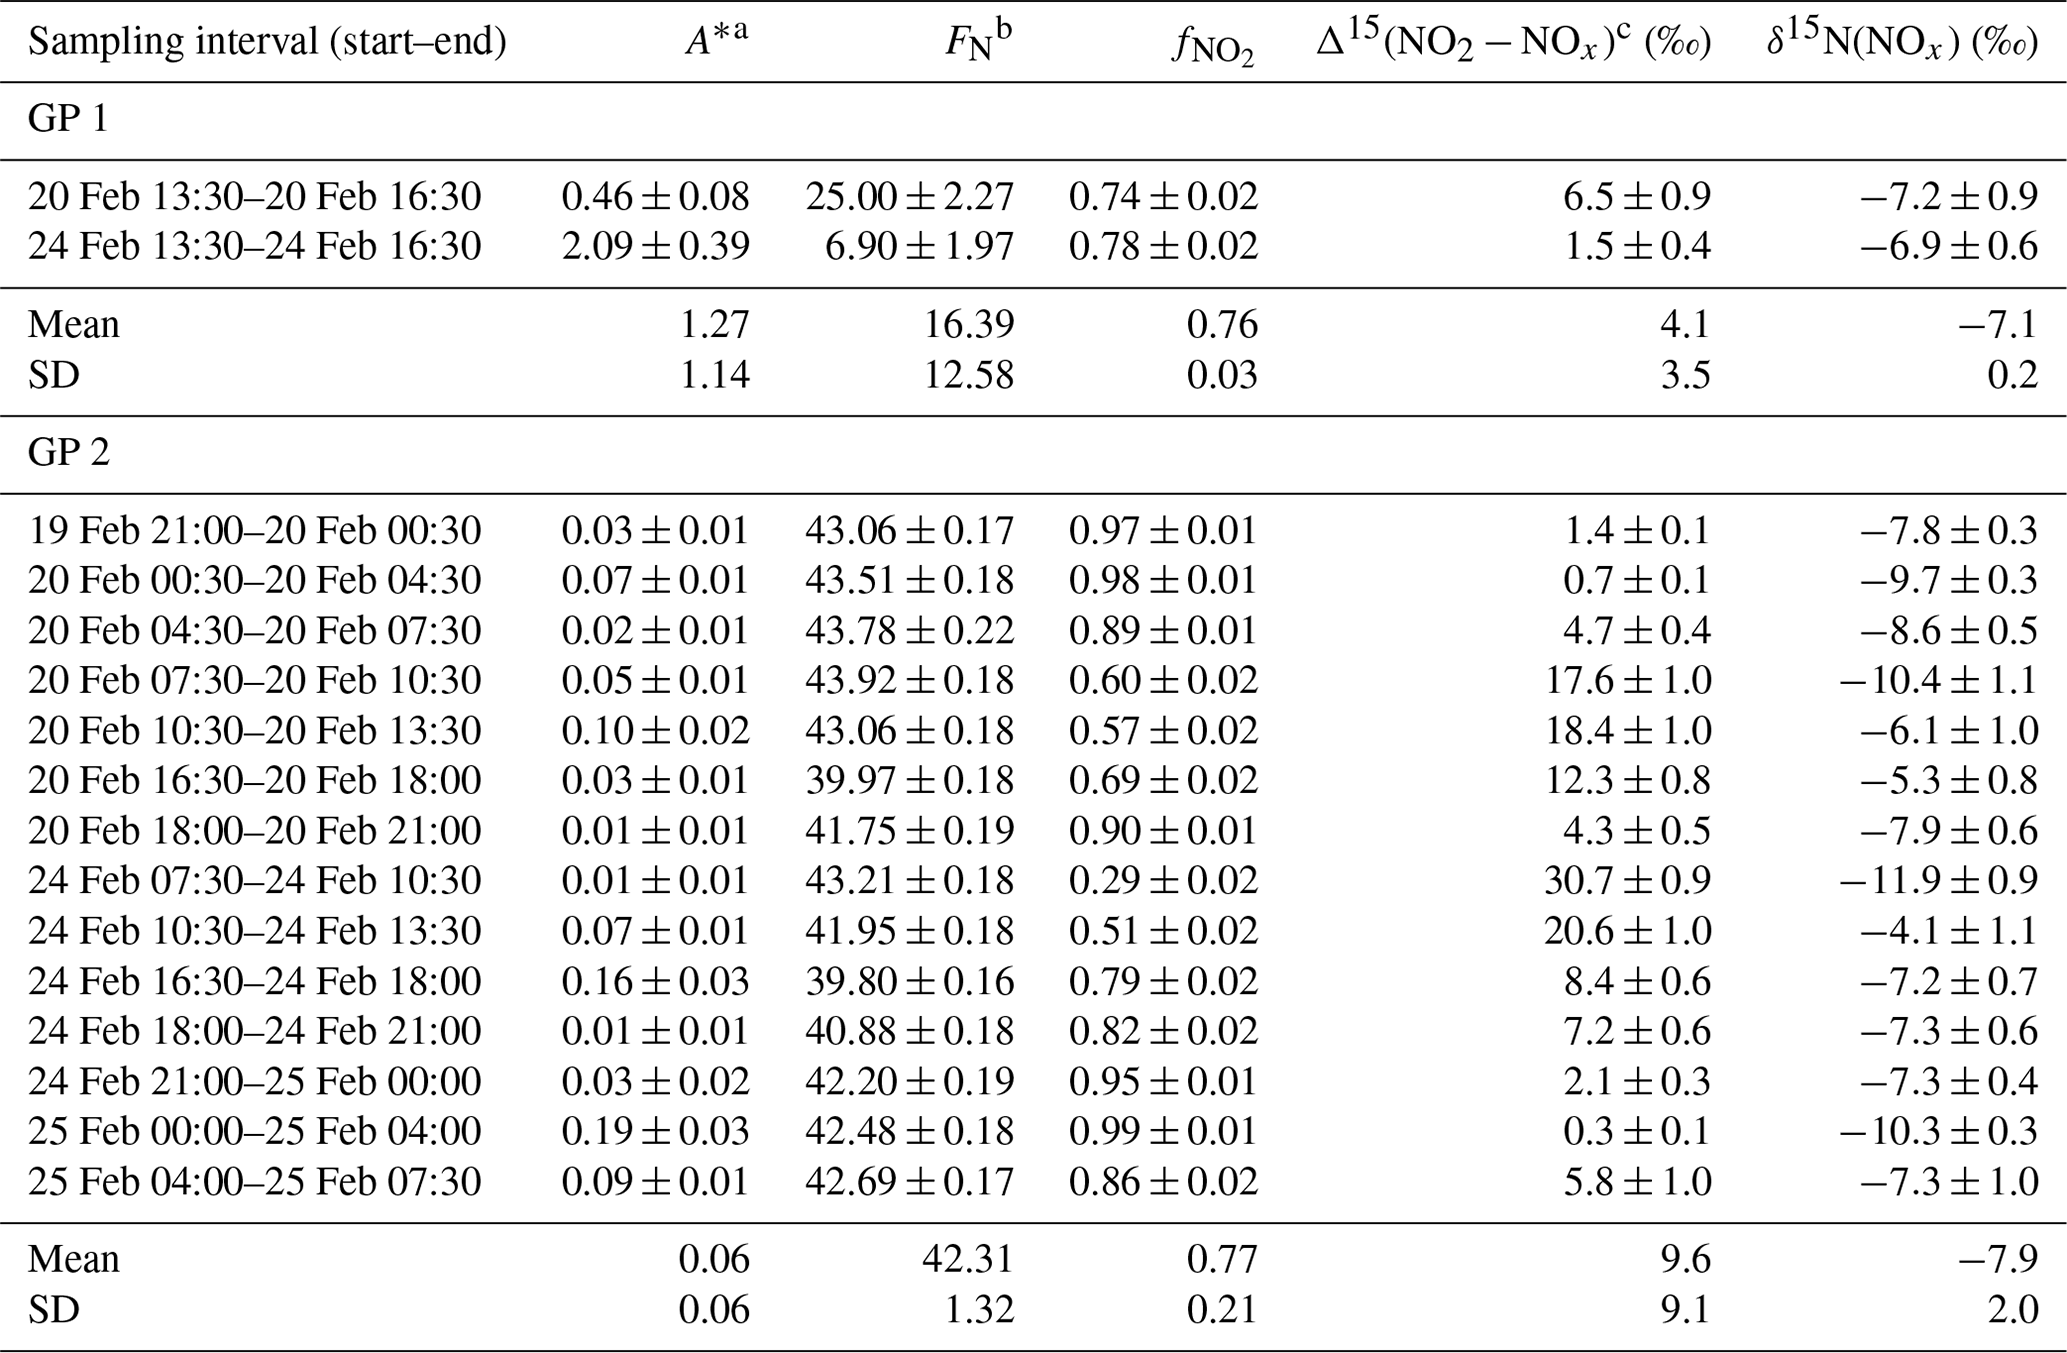
a Calculated from between 07:30–18:00 LT and from between 18:00–07:30 LT ( and expressions are given in Sect. 2.4.2). b Calculated from Eq. (10) for GP 1 and from Eq. (11) for GP 2. c Calculated from Eq. (9).
3.4.2 NOx emission sources derived from δ15N(NO2)
To identify the main source of NOx that contributes to the calculated δ15N(NOx) values at our site, Fig. 4 displays the temporal variation in δ15N(NOx) obtained from individual NO2 samples (dashed horizontal line) and the δ15N range for different NOx emission sources (coloured bands) such as for coal combustion ((19.5 ± 2.3) ‰ for power plants with selective catalytic reduction technology; Felix et al., 2012; Elliott et al., 2019), fossil gas combustion ((−16.5 ± 1.7) ‰; Walters et al., 2015a), and fertilised soils ((−33.8 ± 12.2) ‰; Miller et al., 2018). The δ15N of NOx released during biomass combustion is primarily driven by the δ15N of the biomass burnt (Fibiger and Hastings, 2016). We estimate an average δ15N of biomass combustion NOx at (−0.1 ± 1.3) ‰, using the empirical relationship of Chai et al. (2019) (which was derived from the combustion of several North American wood species), and an average δ15N of biomass at (−2.8 ± 2.0) ‰ representative of temperate forests (Martinelli et al., 1999). Regarding road traffic emissions, we have to stress that δ15N values reported in the literature are rather variable mainly because N fractionations during the process of NOx production can vary depending on the type of fuel used, the type of vehicle, the presence of an emission control system, and the time of commuting (Ammann et al., 1999; Felix and Elliott, 2014; Heaton, 1990; Miller et al., 2017; Walters et al., 2015b; Zong et al., 2020, 2017). We use here the mean vehicle-emitted δ15N(NOx) value given by Song et al. (2022) at () ‰, calculated from 181 measurements reported in the literature.
As previously noted, the values of estimated δ15N(NOx) show much less variability than δ15N(NO2), with no significant differences observed between daytime and nighttime values. The values of δ15N(NOx) range from −11.0 ‰ to −4.1 ‰, and despite the associated uncertainty, they are consistent with the δ15N range of NOx emissions from vehicle exhaust. The two sampling periods show similar δ15N(NOx) values with a slight diel variability. The estimated small variation in δ15N(NOx) throughout the day can be attributed to the temporal changes in the δ15N signature of mobile NOx sources. It has been shown that NOx emitted by cold engines has a lower δ15N signature compared to NOx emitted from warm engines (Walters et al., 2015b). Hence, the early morning drop in δ15N(NOx) could be attributed to the influence of NOx emitted from cold engines. As the day progresses, the time of commuting increases and therefore δ15N(NOx) tends to be less negative. Conversely, during the night, the slow δ15N(NOx) decline could be due to the replacement of NOx from vehicle exhaust by NOx emitted by fossil gas combustion, which is commonly used in Chamonix for home heating. Although biomass burning used for home heating would also tend to increase δ15N(NOx) during the day, it is unlikely to contribute more during the day than at night.
According to local NOx emission inventories (Atmo-Auvergne-Rhône-Alpes, 2018; ORCAE, 2022), road transport is responsible for 64 % of NOx emissions, ahead of heating-oil and fossil gas combustion. Despite the consistency between our results and existing inventories, the significant variability in the δ15N signature of NOx emissions from vehicle exhaust precludes a reliable quantitative source apportionment of NOx emissions from our estimated δ15N(NOx). Furthermore, the lack of information on the exact δ15N signature of NOx emitted from heating-oil combustion could also contribute to the potential bias of the emission source apportionment.
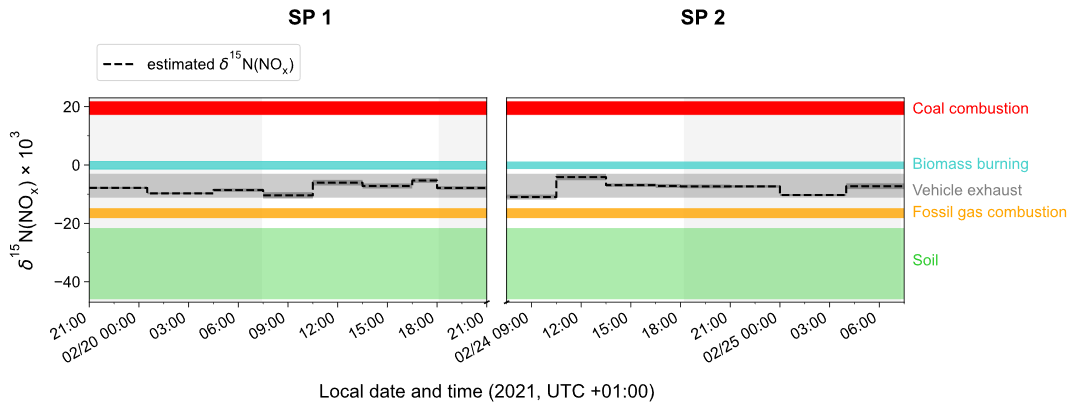
Figure 4Time evolution of δ15N(NOx) (dashed black line) estimated from δ15N(NO2) observations in Chamonix after correction of N fractionation effects (length of horizontal line denotes sampling period; dark-grey-shaded area denotes overall calculation error bar). Coloured shaded areas represent the standard deviation of the mean δ15N value of individual NOx emission source (coal combustion in red, biomass burning in blue, vehicle exhaust in grey, fossil gas in orange, and soil emissions in green). Grey-backdrop-shaded areas represent the nighttime (sunset to sunrise).
3.4.3 Interpretation of δ15N(NO) observations
δ15N(NO) also exhibits substantial variability during the day, ranging from −1.3 ‰ to 14.9 ‰ and from −4.2 ‰ to 9.7 ‰ during SP 1 and SP 2, respectively. At night, δ15N(NO) is less variable, with an overall mean of (1.4 ± 1.2) ‰ and (−1.1 ± 0.4) ‰ during SP 1 and SP 2, respectively. δ15N(NO) is within the range of observations reported in urban areas (He et al., 2020; W. Zhang et al., 2022). A similar diurnal pattern was observed in samples collected during a cruise along the Californian coast in spring 2010 (Vicars et al., 2013), and isotopic exchanges between NO and NO2 during the day were found to be the primary driver of the diel variability. In the previous section, we demonstrated that there is a significant 15N partitioning between NOx emissions and NO2, the latter being enriched in 15N compared to NOx emissions. Interestingly, important enrichments in 15N are also observed in NO.
As described above, at night during SP 1 and SP 2, δ15N(NO2) is close to δ15N(NOx) due to small N fractionation effects. However, between 18:00–07:30 LT, NO is enriched in 15N relative to NO2 by +6.3 ‰ and +1.4 ‰ on average during SP 1 and SP 2, respectively (Table 4). If we assume that, at night, NO is formed mainly by the conversion of surface NO2 via the N2O5 pathway, then the difference between δ15N(NO) and δ15N(NO2) (Δ15(NO − NO2)) should reflect the N enrichment factor associated with this oxidation process. It is likely that an isotopic equilibrium is established between NO2, NO3, and N2O5, hence affecting the partitioning of 15N between NO2 and NO produced at night (Walters and Michalski, 2016). Neglecting KIE associated with the N2O5 pathway and using the expression of the EIE fractionation factor between N2O5 and NO2 given by Walters and Michalski (2015) (Appendix D) constrained with the mean nighttime temperature at our site, the isotopic composition of NO is expected be enriched in 15N by about 29 ‰ compared to NO2. This estimated 15N enrichment is about 3 times higher than the observed Δ15(NO − NO2) at our site. As daytime NO exhibits higher δ15N values than during the night, it is not possible for daytime residuals at night to account for the lower-than-predicted fractionation effect between NO2 and NO. These results highlight the importance of improving our understanding of the 15N fractionation between NO2 and NO associated with the N2O5 pathway. This could be achieved in an atmospheric simulation chamber that allows us to reproduce individual processes in controlled conditions. The 15N isotopic enrichment of NO2 and NO collected from 07:30 to 18:00 LT shows a very contrasted distribution between SP 1 and SP 2, with a respective average Δ15(NO − NO2) of −0.4 ‰ and −10.0 ‰ (Table 4). Although subjected to significant uncertainties (Fan et al., 2019), the OH pathway is often associated with a KIE of −3 ‰ (Freyer, 1991), which is at odds with our observations. Similarly to the N2O5 pathway, there is an important need to better estimate the fractionation factor associated with the OH pathway.
There are significant differences in Δ15(NO − NO2) between SP 1 and SP 2, providing further evidence that NO collected during these two periods has undergone different formation processes and/or originates from different sources of NO2. In addition, possible fractionation associated with phase change between HNO3 and p-NO3 during transport of Saharan dust could influence the δ15N of NO collected during SP 2. However, given the lack of knowledge about N fractionation factors between NO2 and NO and our limited dataset, we cannot conclude on whether the changes in the distribution of NO isotopes during SP 2 result from changes in the phase distribution of NO or in NO2 oxidation processes.
Table 4Mean observed δ15N data of NO2 (δ15N(NO2)) and NON(NO)), calculated atmospheric δ15N of NOx (δ15N(NOx)), and δ15N shift between δ15N(NO) and δ15N(NO2) (Δ15(NO − NO2)).
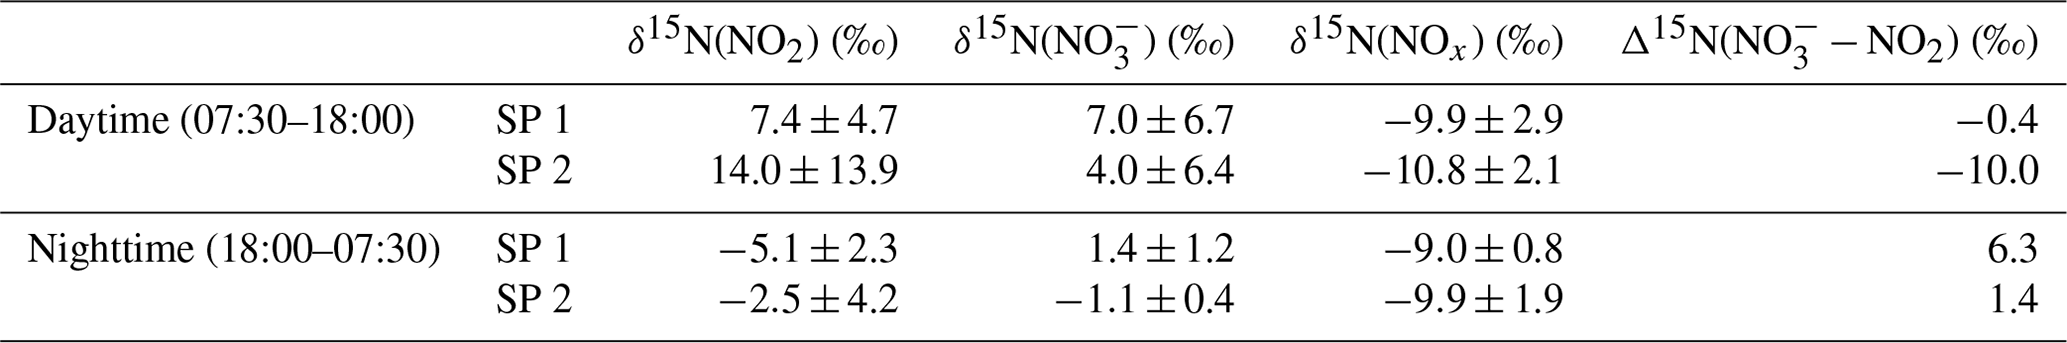
This study reports the first simultaneous measurements and analysis of Δ17O and δ15N in NO2 and NO. The samplings were conducted at high temporal resolution (∼3 h) in Chamonix, the French Alps, over 2 distinct days in late February 2021. The isotopic signals of both NO2 and NO show substantial diurnal variabilities, which are investigated in the light of local meteorological parameters and atmospheric observations (NO, NO2, O3, and PM).
The observed variability in Δ17O(NO2) can be well explained using Δ17O mass balance equations and corroborates the analysis of previous observations carried out in Grenoble, the French Alps, over a single day in spring (Albertin et al., 2021). On average, the high levels of NO2 at our site are primarily driven by the oxidation of local NO emissions by O3. The observed diurnal variability in Δ17O(NO2) appears to be consistent with the diurnal variability expected in the chemistry, with RO2 levels of the order of pmol mol−1, which is in agreement with the range of direct winter RO2 measurements reported in the literature. RO2 is thought to contribute significantly to the formation of NO2 in the early morning under high-NOx conditions, which is in line with the effective morning production of radical species reported in urban areas in winter. At night, Δ17O(NO2) reflects the nocturnal oxidation of surface NO emissions by O3. These results provide additional evidence that Δ17O(NO2) measurements represent valuable constraints in the study of the reactive NOx chemistry, down to the sub-daily temporal scales.
A clear linear relationship is found between δ15N(NO2) and the ratio, indicating significant post-emission N fractionation effects. Theoretical N isotopic fractionation factors between NO and NO2 at equilibrium and fractionation factors derived from the isotopic observations are found to be in good agreement, providing further support for the N isotopic fractionation theoretical framework commonly applied to the Leighton cycle. Observed δ15N(NO2) corrected for N fractionation effects allows us to estimate the overall δ15N signature of ambient NOx at our site. Based on the existing δ15N fingerprints of different NOx emission sources, the main contribution at our site is very likely to be vehicle exhaust, which is confirmed by local emission inventories.
We use Δ17O mass balance equations of NO constrained by observed Δ17O(NO2) to assess whether NO could originate locally from the oxidation of NO2 at our site. During the first day of sampling, Δ17O records of NO2 and NO support the local oxidation of NO2 to NO by OH radicals during the day and via the heterogeneous hydrolysis of N2O5 during the night. The second day of sampling was affected by a Saharan dust event, accompanied by notable changes in the isotopic composition of NO. We propose that the formation of a surface inversion layer at night could have influenced the vertical distribution of Δ17O(NO2) and resulted in a positive gradient of Δ17O(NO) with altitude, independently of the local NO2-to-NO conversion processes near the surface. In such a scenario, the presence of Saharan dust could have promoted heterogeneous NO2 oxidation, leading to higher Δ17O in NO formed aloft. The latter would have then mixed with the NO formed near the surface when the inversion broke up during the day. Although still uncertain, the influence of the boundary layer dynamics on the distribution of Δ17O in NO should be investigated in the future, notably for urban areas in winter.
The combined analysis of the first concurrent observations of δ15N in NO2 and NO highlights persistent uncertainties in the current estimates of the N fractionation factors associated with NO2 and NO conversion processes. However, δ15N(NO) records need to be corrected for N fractionation effects if they are to be used to trace back the δ15N fingerprint of the primary NOx emission sources. Detailed simulation chamber experiments could provide more kinetic data on the various N fractionation processes in order to better exploit δ15N(NO) records to identify and quantify of the sources of reactive nitrogen.
The present thorough investigation of the Δ17O and δ15N in NO2 and NO highlights (1) the potential to use sub-daily Δ17O and δ15N records to trace the sources and formation chemistry of NO, (2) the importance of measuring the NO2 isotopic composition to avoid misinterpretation of NO isotopic records, and (3) the persistent knowledge gaps that prevent a complete assessment of the factors driving the variability in NO isotopic records. In most studies, the NO isotopic composition is interpreted on the basis of estimates of the isotopic composition of its precursor gases, assuming that both the chemistry of NO2 (including its conversion to NO) and N isotopic fractionation effects are known. However, these assumptions are subject to very significant uncertainties, mainly in urban atmospheres. Hence, given the recent development of a method for measuring the multi-isotopic composition of NO2, the accuracy and validity of the current interpretation framework of NO isotopic records should be tested in various environments. Such investigation can be performed by simultaneously collecting NO2 and NO, as done here. We recommend using this combined isotopic record in order to avoid biased interpretations of NO isotopic records, particularly in urban areas during winter, preferably at high temporal resolution (<24 h). In addition, the vertical distribution of NO2 and NO isotopic composition should be documented in order to explore the possible role of the boundary layer dynamics in the variability in NO2 and NO isotopic composition observed at the surface.
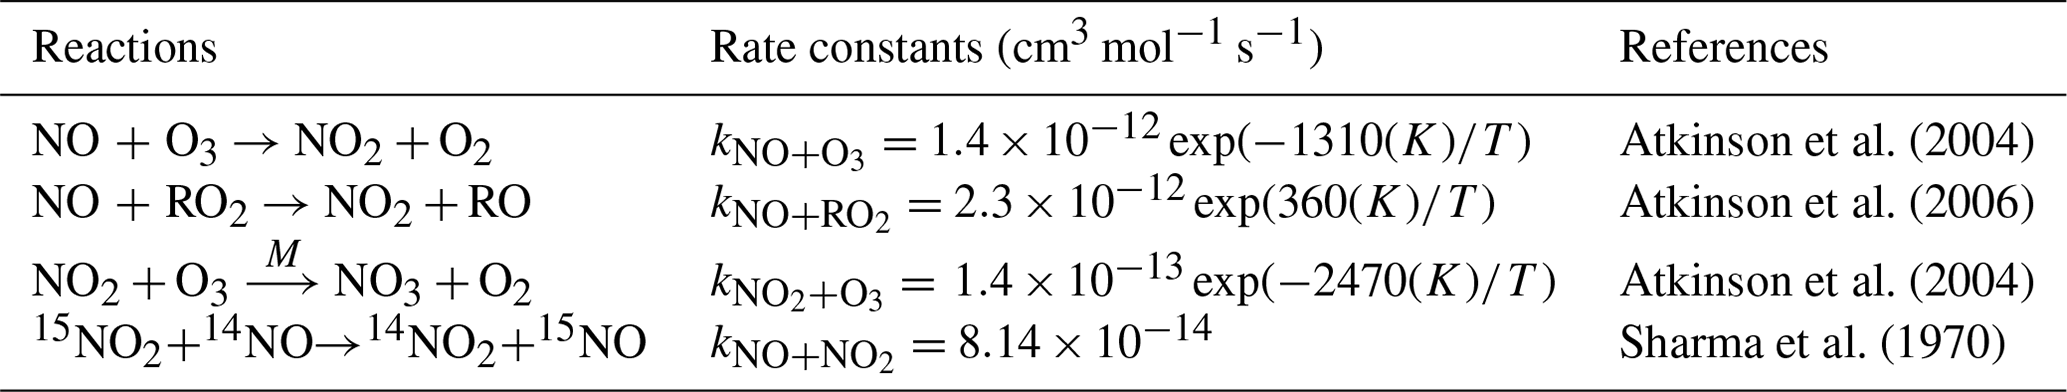
Table B1Mean daytime (07:30–18:00 LT) and nighttime (18:00–07:30 LT) atmospheric lifetime of NO2 () and NO () and dry-deposition constant (, where Vd is the dry-deposition velocity and BLH is the boundary layer height).
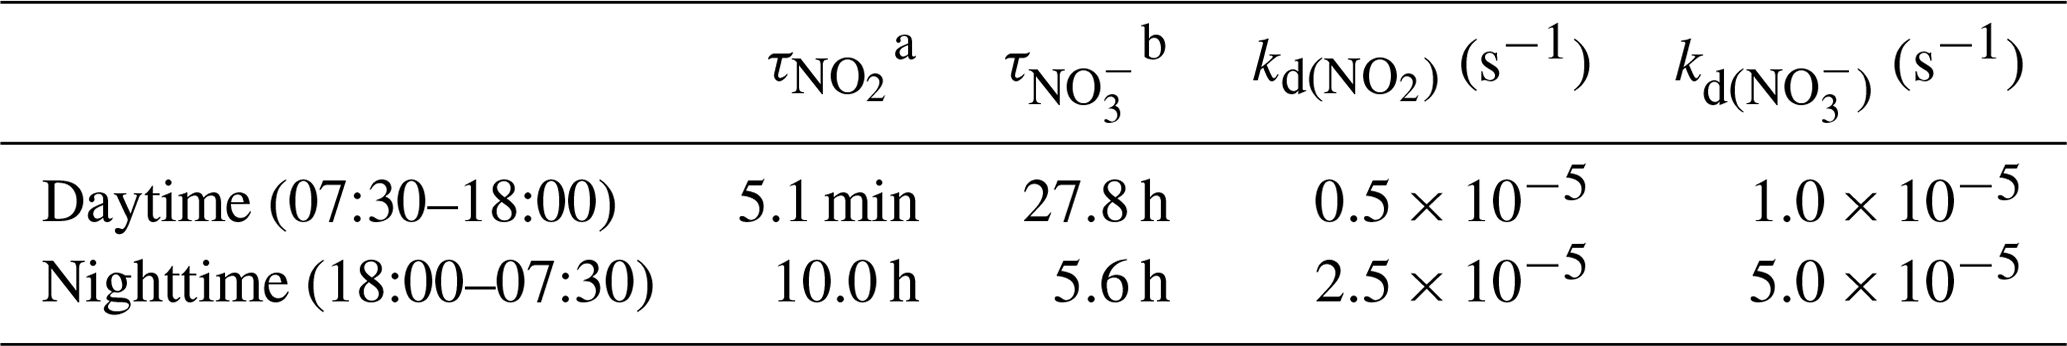
a Atmospheric lifetime relative to photolysis during the day (dry deposition and reaction NO2 + OH are negligible) and to dry deposition and oxidation via O3 during the night. b Atmospheric lifetime relative to dry deposition. The boundary layer is fixed at 500 m during the day and at 100 m during the night. The dry-deposition velocity (Vd) is fixed at 0.25 and 0.50 cm s−1 for NO2 and NO, respectively (Holland et al., 1999; Zhang et al., 2009).
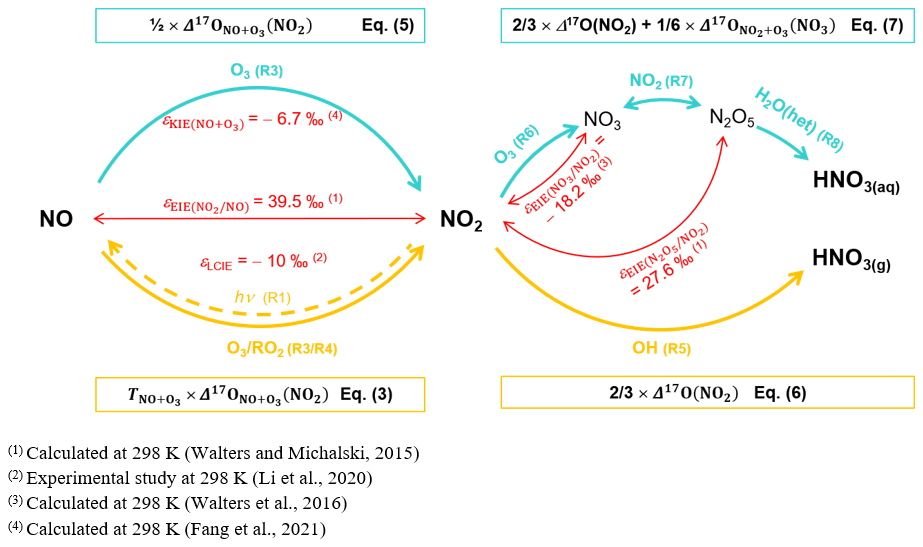
Figure C1Adapted from Elliott et al. (2019). Sketch of dominant daytime (thick yellow arrows) and nighttime (thick cyan arrows) NOx-to-NO conversion processes and associated quantified N fractionation effects at 298 K (thin red arrows and text) and Δ17O transfers (yellow and cyan boxes).
Table D1Calculated regression coefficients for the N isotope exchange between and over the temperature range of 150 to 450 K (Walters and Michalski, 2015) and for the N kinetic fractionation for the reaction NO + O3 over the temperature range of 220 to 320 K (Fang et al., 2021).
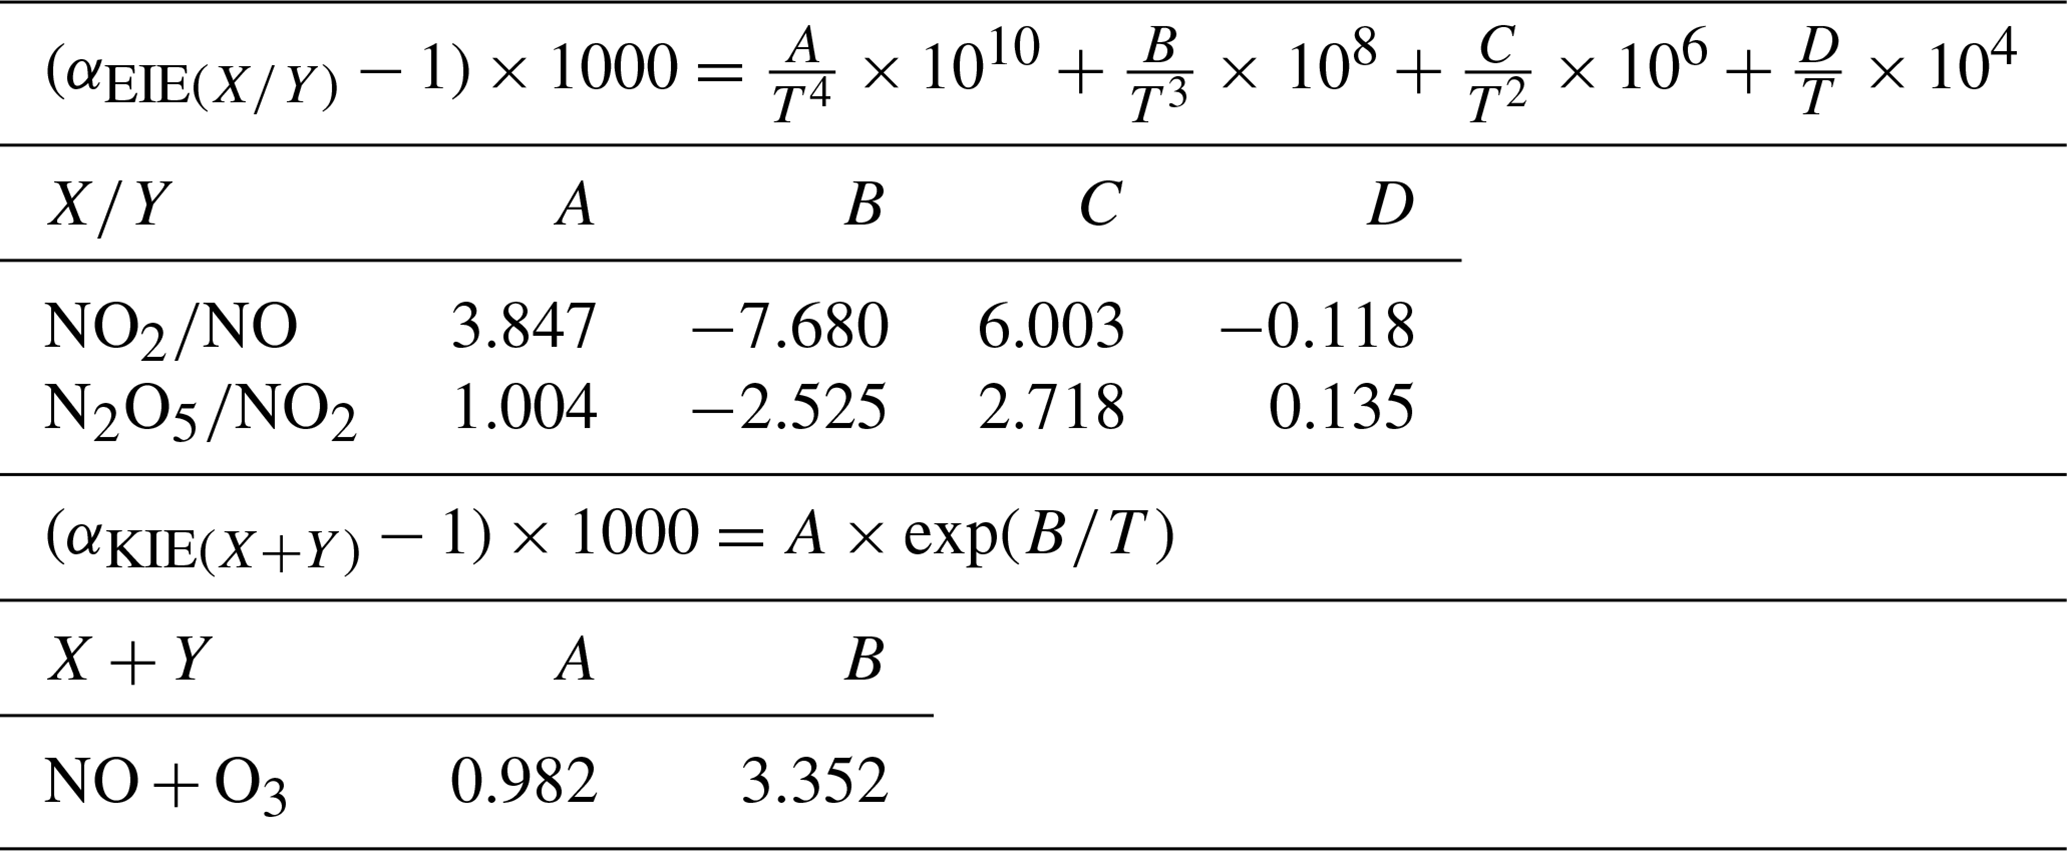
Data presented in this article are included in the Supplement.
The supplement related to this article is available online at: https://doi.org/10.5194/acp-24-1361-2024-supplement.
Grants obtained by KL and JS funded the project. AB, RG, QF, and IV performed the calibration of IBBCEAS and OFCEAS instruments, data acquisition, and post-processing. SA conducted the sampling and laboratory analysis. NC provided technical support for isotopic mass spectrometry analysis. The study was designed as part of SA's PhD thesis supervised by SB and JS. The paper was written by SA under the supervision of JS and SB and with contributions from all co-authors.
The contact author has declared that none of the authors has any competing interests.
Publisher’s note: Copernicus Publications remains neutral with regard to jurisdictional claims made in the text, published maps, institutional affiliations, or any other geographical representation in this paper. While Copernicus Publications makes every effort to include appropriate place names, the final responsibility lies with the authors.
This work benefited from CNRS and IGE infrastructures and laboratory platforms. The authors acknowledge the support of the CASPA programme (Climate-relevant Aerosol Sources and Processes in the Arctic). The authors gratefully acknowledge Catherine Coulaud for providing temperature data in Chamonix; Jean-Luc Jaffrezo for providing data of previous filter measurements in Chamonix; and Anthony Lemoine, Matthieu Lafaysse, and Louis Le Toumelin for providing S2M reanalysis and meteorological data. The authors particularly thank Patrick Ginot, Anthony Vella, Armelle Crouzet, and Bruno Jourdain for instrumental and laboratory technical support. Finally, the authors thank Alexis Lamothe for assistance during the sampling campaign and Pete Akers for his thorough proofreading of the manuscript and his constructive comments.
This research has been supported by the Agence Nationale de la Recherche (ANR) via contract ANR-21-CE01-0017 CASPA and INSU/CNRS (National Institute of Sciences of the Universe) via its national LEFE programme (Les Enveloppes Fluides et l'Environnement) and by a grant from LabEx OSUG@2020 (Investissements d'avenir – ANR10 LABX56) and the IDEX-UGA ANR project ANR-15-IDEX-02.
This paper was edited by Markus Ammann and reviewed by Lei Geng and one anonymous referee.
Albertin, S.: Author Comment 2, Reply on RC2, https://doi.org/10.5194/egusphere-2023-744-AC2, 2023.
Albertin, S., Savarino, J., Bekki, S., Barbero, A., and Caillon, N.: Measurement report: Nitrogen isotopes (δ15N) and first quantification of oxygen isotope anomalies (Δ17O, δ18O) in atmospheric nitrogen dioxide, Atmos. Chem. Phys., 21, 10477–10497, https://doi.org/10.5194/acp-21-10477-2021, 2021.
Alexander, B., Hastings, M. G., Allman, D. J., Dachs, J., Thornton, J. A., and Kunasek, S. A.: Quantifying atmospheric nitrate formation pathways based on a global model of the oxygen isotopic composition (Δ17O) of atmospheric nitrate, Atmos. Chem. Phys., 9, 5043–5056, https://doi.org/10.5194/acp-9-5043-2009, 2009.
Alexander, B., Sherwen, T., Holmes, C. D., Fisher, J. A., Chen, Q., Evans, M. J., and Kasibhatla, P.: Global inorganic nitrate production mechanisms: comparison of a global model with nitrate isotope observations, Atmos. Chem. Phys., 20, 3859–3877, https://doi.org/10.5194/acp-20-3859-2020, 2020.
Alicke, B., Geyer, A., Hofzumahaus, A., Holland, F., Konrad, S., Pätz, H. W., Schäfer, J., Stutz, J., Volz-Thomas, A., and Platt, U.: OH formation by HONO photolysis during the BERLIOZ experiment, J. Geophys. Res.-Atmos., 108, PHO 3-1–PHO 3-17, https://doi.org/10.1029/2001JD000579, 2003.
Allard, J.: Qualité de l'air dans la Vallée de l'Arve: météorologie locale et mesures des réductions des émissions liées au chauffage au bois, PhD Thesis, Université Grenoble Alpes, https://theses.hal.science/tel-01901636 (last access: 25 January 2024), 2018.
Ammann, M., Siegwolf, R., Pichlmayer, F., Suter, M., Saurer, M., and Brunold, C.: Estimating the uptake of trafic-derived NO2 from 15N abundance in Norway spruce needles, Oecologia, 118, 124–131, https://doi.org/10.1007/s004420050710, 1999.
Angelisi, M. D. and Gaudichet, A.: Saharan dust deposition over Mont Blanc (French Alps) during the last 30 years, Tellus B, 43, 61–75, https://doi.org/10.1034/j.1600-0889.1991.00005.x, 1991.
Appel, B. R., Wall, S. M., Tokiwa, Y., and Haik, M.: Simultaneous nitric acid, particulate nitrate and acidity measurements in ambient air, Atmos. Environ., 14, 549–554, https://doi.org/10.1016/0004-6981(80)90084-0, 1980.
Appel, B. R., Tokiwa, Y., and Haik, M.: Sampling of nitrates in ambient air, Atmos. Environ., 15, 283–289, https://doi.org/10.1016/0004-6981(81)90029-9, 1981.
Atkinson, R., Baulch, D. L., Cox, R. A., Crowley, J. N., Hampson, R. F., Hynes, R. G., Jenkin, M. E., Rossi, M. J., and Troe, J.: Evaluated kinetic and photochemical data for atmospheric chemistry: Volume I – gas phase reactions of Ox, HOx, NOx and SOx species, Atmos. Chem. Phys., 4, 1461–1738, https://doi.org/10.5194/acp-4-1461-2004, 2004.
Atkinson, R., Baulch, D. L., Cox, R. A., Crowley, J. N., Hampson, R. F., Hynes, R. G., Jenkin, M. E., Rossi, M. J., Troe, J., and IUPAC Subcommittee: Evaluated kinetic and photochemical data for atmospheric chemistry: Volume II – gas phase reactions of organic species, Atmos. Chem. Phys., 6, 3625–4055, https://doi.org/10.5194/acp-6-3625-2006, 2006.
Atmo-Auvergne-Rhône-Alpes: Bilan des connaissances sur la qualité de l'air dans la vallée de l'Arve, Atmo-Auvergne-Rhône-Alpes, https://www.atmo-auvergnerhonealpes.fr/publications/bilan-des-connaissances-sur-la-qualite-de-lair-dans-la-vallee-de-larve (last access: July 2021), 2018.
Aumont, B., Chervier, F., and Laval, S.: Contribution of HONO sources to the NOx/HOx/O3 chemistry in the polluted boundary layer, Atmos. Environ., 37, 487–498, https://doi.org/10.1016/S1352-2310(02)00920-2, 2003.
Aymoz, G., Jaffrezo, J.-L., Jacob, V., Colomb, A., and George, Ch.: Evolution of organic and inorganic components of aerosol during a Saharan dust episode observed in the French Alps, Atmos. Chem. Phys., 4, 2499–2512, https://doi.org/10.5194/acp-4-2499-2004, 2004.
Aymoz, G., Jaffrezo, J. L., Chapuis, D., Cozic, J., and Maenhaut, W.: Seasonal variation of PM10 main constituents in two valleys of the French Alps. I: fractions, Atmos. Chem. Phys., 7, 661–675, https://doi.org/10.5194/acp-7-661-2007, 2007.
Barbero, A., Blouzon, C., Savarino, J., Caillon, N., Dommergue, A., and Grilli, R.: A compact incoherent broadband cavity-enhanced absorption spectrometer for trace detection of nitrogen oxides, iodine oxide and glyoxal at levels below parts per billion for field applications, Atmos. Meas. Tech., 13, 4317–4331, https://doi.org/10.5194/amt-13-4317-2020, 2020.
Barkan, E. and Luz, B.: High-precision measurements of and of O2 and ratio in air, Rapid Commun. Mass Sp., 17, 2809–2814, https://doi.org/10.1002/rcm.1267, 2003.
Bauer, S. E., Koch, D., Unger, N., Metzger, S. M., Shindell, D. T., and Streets, D. G.: Nitrate aerosols today and in 2030: a global simulation including aerosols and tropospheric ozone, Atmos. Chem. Phys., 7, 5043–5059, https://doi.org/10.5194/acp-7-5043-2007, 2007.
Bekker, C., Walters, W. W., Murray, L. T., and Hastings, M. G.: Nitrate chemistry in the northeast US – Part 1: Nitrogen isotope seasonality tracks nitrate formation chemistry, Atmos. Chem. Phys., 23, 4185–4201, https://doi.org/10.5194/acp-23-4185-2023, 2023.
Berhanu, T. A., Savarino, J., Bhattacharya, S. K., and Vicars, W. C.: 17O excess transfer during the NO2 + O3 → NO3 + O2 reaction, J. Chem. Phys., 136, 044311, https://doi.org/10.1063/1.3666852, 2012.
Brown, S. S. and Stutz, J.: Nighttime radical observations and chemistry, Chem. Soc. Rev., 41, 6405–6447, https://doi.org/10.1039/c2cs35181a, 2012.
Brown, S. S., Ryerson, T. B., Wollny, A. G., Brock, C. A., Peltier, R., Sullivan, A. P., Weber, R. J., Dubé, W. P., Trainer, M., Meagher, J. F., Fehsenfeld, F. C., and Ravishankara, A. R.: Variability in Nocturnal Nitrogen Oxide Processing and Its Role in Regional Air Quality, Science, 311, 67–70, https://doi.org/10.1126/science.1120120, 2006.
Brown, S. S., Dubé, W. P., Peischl, J., Ryerson, T. B., Atlas, E., Warneke, C., de Gouw, J. A., te Lintel Hekkert, S., Brock, C. A., Flocke, F., Trainer, M., Parrish, D. D., Feshenfeld, F. C., and Ravishankara, A. R.: Budgets for nocturnal VOC oxidation by nitrate radicals aloft during the 2006 Texas Air Quality Study, J. Geophys. Res.-Atmos., 116, D24305, https://doi.org/10.1029/2011JD016544, 2011.
Brulfert, G., Chemel, C., Chaxel, E., and Chollet, J. P.: Modelling photochemistry in alpine valleys, Atmos. Chem. Phys., 5, 2341–2355, https://doi.org/10.5194/acp-5-2341-2005, 2005.
Casciotti, K. L., Sigman, D. M., Hastings, M. G., Böhlke, J. K., and Hilkert, A.: Measurement of the oxygen isotopic composition of nitrate in seawater and freshwater using the denitrifier method, Anal. Chem., 74, 4905–4912, https://doi.org/10.1021/ac020113w, 2002.
Casciotti, K. L., Böhlke, J. K., McIlvin, M. R., Mroczkowski, S. J., and Hannon, J. E.: Oxygen Isotopes in Nitrite: Analysis, Calibration, and Equilibration, Anal. Chem., 79, 2427–2436, https://doi.org/10.1021/ac061598h, 2007.
Chai, J., Miller, D. J., Scheuer, E., Dibb, J., Selimovic, V., Yokelson, R., Zarzana, K. J., Brown, S. S., Koss, A. R., Warneke, C., and Hastings, M.: Isotopic characterization of nitrogen oxides (NOx), nitrous acid (HONO), and nitrate (pNO) from laboratory biomass burning during FIREX, Atmos. Meas. Tech., 12, 6303–6317, https://doi.org/10.5194/amt-12-6303-2019, 2019.
Chan, Y.-C., Evans, M. J., He, P., Holmes, C. D., Jaeglé, L., Kasibhatla, P., Liu, X.-Y., Sherwen, T., Thornton, J. A., Wang, X., Xie, Z., Zhai, S., and Alexander, B.: Heterogeneous Nitrate Production Mechanisms in Intense Haze Events in the North China Plain, J. Geophys. Res.-Atmos., 126, e2021JD034688, https://doi.org/10.1029/2021JD034688, 2021.
Chang, Y., Zhang, Y., Tian, C., Zhang, S., Ma, X., Cao, F., Liu, X., Zhang, W., Kuhn, T., and Lehmann, M. F.: Nitrogen isotope fractionation during gas-to-particle conversion of NOx to NO in the atmosphere – implications for isotope-based NOx source apportionment, Atmos. Chem. Phys., 18, 11647–11661, https://doi.org/10.5194/acp-18-11647-2018, 2018.
Chazette, P., Couvert, P., Randriamiarisoa, H., Sanak, J., Bonsang, B., Moral, P., Berthier, S., Salanave, S., and Toussaint, F.: Three-dimensional survey of pollution during winter in French Alps valleys, Atmos. Environ., 39, 1035–1047, https://doi.org/10.1016/j.atmosenv.2004.10.014, 2005.
Crutzen, P. J.: The Role of NO and NO2 in the Chemistry of the Troposphere and Stratosphere, Annu. Rev. Earth Planet. Sc., 7, 443–472, https://doi.org/10.1146/annurev.ea.07.050179.002303, 1979.
Delmas, R. J.: Snow chemistry of high altitude glaciers in the French Alps, Tellus B, 46, 304–324, https://doi.org/10.3402/tellusb.v46i4.15806, 1994.
Dentener, F. J. and Crutzen, P. J.: Reaction of N2O5 on tropospheric aerosols: Impact on the global distributions of NOx, O3, and OH, J. Geophys. Res.-Atmos., 98, 7149–7163, https://doi.org/10.1029/92JD02979, 1993.
Di Mauro, B., Garzonio, R., Rossini, M., Filippa, G., Pogliotti, P., Galvagno, M., Morra di Cella, U., Migliavacca, M., Baccolo, G., Clemenza, M., Delmonte, B., Maggi, V., Dumont, M., Tuzet, F., Lafaysse, M., Morin, S., Cremonese, E., and Colombo, R.: Saharan dust events in the European Alps: role in snowmelt and geochemical characterization, The Cryosphere, 13, 1147–1165, https://doi.org/10.5194/tc-13-1147-2019, 2019.
Dubey, M. K., Mohrschladt, R., Donahue, N. M., and Anderson, J. G.: Isotope Specific Kinetics of Hydroxyl Radical (OH) with Water (H2O): Testing Models of Reactivity and Atmospheric Fractionation, J. Phys. Chem. A, 101, 1494–1500, https://doi.org/10.1021/jp962332p, 1997.
Edwards, P. M., Brown, S. S., Roberts, J. M., Ahmadov, R., Banta, R. M., deGouw, J. A., Dubé, W. P., Field, R. A., Flynn, J. H., Gilman, J. B., Graus, M., Helmig, D., Koss, A., Langford, A. O., Lefer, B. L., Lerner, B. M., Li, R., Li, S.-M., McKeen, S. A., Murphy, S. M., Parrish, D. D., Senff, C. J., Soltis, J., Stutz, J., Sweeney, C., Thompson, C. R., Trainer, M. K., Tsai, C., Veres, P. R., Washenfelder, R. A., Warneke, C., Wild, R. J., Young, C. J., Yuan, B., and Zamora, R.: High winter ozone pollution from carbonyl photolysis in an oil and gas basin, Nature, 514, 351–354, https://doi.org/10.1038/nature13767, 2014.
Elliott, E. M., Yu, Z., Cole, A. S., and Coughlin, J. G.: Isotopic advances in understanding reactive nitrogen deposition and atmospheric processing, Sci. Total Environ., 662, 393–403, https://doi.org/10.1016/j.scitotenv.2018.12.177, 2019.
Emmerson, K. M., Carslaw, N., Carpenter, L. J., Heard, D. E., Lee, J. D., and Pilling, M. J.: Urban Atmospheric Chemistry During the PUMA Campaign 1: Comparison of Modelled OH and HO2 Concentrations with Measurements, J. Atmos. Chem., 52, 143–164, https://doi.org/10.1007/s10874-005-1322-3, 2005.
Fan, M.-Y., Zhang, Y.-L., Lin, Y.-C., Chang, Y.-H., Cao, F., Zhang, W.-Q., Hu, Y.-B., Bao, M.-Y., Liu, X.-Y., Zhai, X.-Y., Lin, X., Zhao, Z.-Y., and Song, W.-H.: Isotope-based source apportionment of nitrogen-containing aerosols: A case study in an industrial city in China, Atmos. Environ., 212, 96–105, https://doi.org/10.1016/j.atmosenv.2019.05.020, 2019.
Fan, M.-Y., Zhang, Y.-L., Lin, Y.-C., Hong, Y., Zhao, Z.-Y., Xie, F., Du, W., Cao, F., Sun, Y., and Fu, P.: Important Role of NO3 Radical to Nitrate Formation Aloft in Urban Beijing: Insights from Triple Oxygen Isotopes Measured at the Tower, Environ. Sci. Technol., 56, 6870–6879, https://doi.org/10.1021/acs.est.1c02843, 2022.
Fan, M.-Y., Zhang, W., Zhang, Y.-L., Li, J., Fang, H., Cao, F., Yan, M., Hong, Y., Guo, H., and Michalski, G.: Formation Mechanisms and Source Apportionments of Nitrate Aerosols in a Megacity of Eastern China Based On Multiple Isotope Observations, J. Geophys. Res.-Atmos., 128, e2022JD038129, https://doi.org/10.1029/2022JD038129, 2023.
Fang, H., Walters, W. W., Mase, D., and Michalski, G.: iNRACM: incorporating 15N into the Regional Atmospheric Chemistry Mechanism (RACM) for assessing the role photochemistry plays in controlling the isotopic composition of NOx, NOy, and atmospheric nitrate, Geosci. Model Dev., 14, 5001–5022, https://doi.org/10.5194/gmd-14-5001-2021, 2021.
Felix, J. D. and Elliott, E. M.: Isotopic composition of passively collected nitrogen dioxide emissions: Vehicle, soil and livestock source signatures, Atmos. Environ., 92, 359–366, https://doi.org/10.1016/j.atmosenv.2014.04.005, 2014.
Felix, J. D., Elliott, E. M., and Shaw, S. L.: Nitrogen Isotopic Composition of Coal-Fired Power Plant NOx: Influence of Emission Controls and Implications for Global Emission Inventories, Environ. Sci. Technol., 46, 3528–3535, https://doi.org/10.1021/es203355v, 2012.
Fibiger, D. L. and Hastings, M. G.: First Measurements of the Nitrogen Isotopic Composition of NOx from Biomass Burning, Environ. Sci. Technol., 50, 11569–11574, https://doi.org/10.1021/acs.est.6b03510, 2016.
Finlayson-Pitts, B. J. and Pitts, J. N.: Chemistry of the upper and lower troposphere, Academic Press, San Diego, California, https://doi.org/10.1016/B978-0-12-257060-5.X5000-X, 2000.
Frey, M. M., Savarino, J., Morin, S., Erbland, J., and Martins, J. M. F.: Photolysis imprint in the nitrate stable isotope signal in snow and atmosphere of East Antarctica and implications for reactive nitrogen cycling, Atmos. Chem. Phys., 9, 8681–8696, https://doi.org/10.5194/acp-9-8681-2009, 2009.
Freyer, H. D.: Seasonal variation of ratios in atmospheric nitrate species, Tellus B, 43, 30–44, https://doi.org/10.1034/j.1600-0889.1991.00003.x, 1991.
Freyer, H. D., Kley, D., Volz-Thomas, A., and Kobel, K.: On the interaction of isotopic exchange processes with photochemical reactions in atmospheric oxides of nitrogen, J. Geophys. Res.-Atmos., 98, 14791–14796, https://doi.org/10.1029/93JD00874, 1993.
Fu, X., Wang, T., Gao, J., Wang, P., Liu, Y., Wang, S., Zhao, B., and Xue, L.: Persistent Heavy Winter Nitrate Pollution Driven by Increased Photochemical Oxidants in Northern China, Environ. Sci. Technol., 54, 3881–3889, https://doi.org/10.1021/acs.est.9b07248, 2020.
Galeazzo, T., Bekki, S., Martin, E., Savarino, J., and Arnold, S. R.: Photochemical box modelling of volcanic SO2 oxidation: isotopic constraints, Atmos. Chem. Phys., 18, 17909–17931, https://doi.org/10.5194/acp-18-17909-2018, 2018.
Galloway, J. N., Townsend, A. R., Erisman, J. W., Bekunda, M., Cai, Z., Freney, J. R., Martinelli, L. A., Seitzinger, S. P., and Sutton, M. A.: Transformation of the Nitrogen Cycle: Recent Trends, Questions, and Potential Solutions, Science, 320, 889–892, https://doi.org/10.1126/science.1136674, 2008.
Gaudel, A., Cooper, O. R., Ancellet, G., Barret, B., Boynard, A., Burrows, J. P., Clerbaux, C., Coheur, P.-F., Cuesta, J., Cuevas, E., Doniki, S., Dufour, G., Ebojie, F., Foret, G., Garcia, O., Granados-Muñoz, M. J., Hannigan, J. W., Hase, F., Hassler, B., Huang, G., Hurtmans, D., Jaffe, D., Jones, N., Kalabokas, P., Kerridge, B., Kulawik, S., Latter, B., Leblanc, T., Le Flochmoën, E., Lin, W., Liu, J., Liu, X., Mahieu, E., McClure-Begley, A., Neu, J. L., Osman, M., Palm, M., Petetin, H., Petropavlovskikh, I., Querel, R., Rahpoe, N., Rozanov, A., Schultz, M. G., Schwab, J., Siddans, R., Smale, D., Steinbacher, M., Tanimoto, H., Tarasick, D. W., Thouret, V., Thompson, A. M., Trickl, T., Weatherhead, E., Wespes, C., Worden, H. M., Vigouroux, C., Xu, X., Zeng, G., and Ziemke, J.: Tropospheric Ozone Assessment Report: Present-day distribution and trends of tropospheric ozone relevant to climate and global atmospheric chemistry model evaluation, Elementa, 6, 39, https://doi.org/10.1525/elementa.291, 2018.
Geng, L., Alexander, B., Cole-Dai, J., Steig, E. J., Savarino, J., Sofen, E. D., and Schauer, A. J.: Nitrogen isotopes in ice core nitrate linked to anthropogenic atmospheric acidity change, P. Natl. Acad. Sci. USA, 111, 5808–5812, https://doi.org/10.1073/pnas.1319441111, 2014.
Goudie, A. S. and Middleton, N. J.: Saharan dust storms: nature and consequences, Earth-Sci. Rev., 56, 179–204, https://doi.org/10.1016/S0012-8252(01)00067-8, 2001.
Grannas, A. M., Jones, A. E., Dibb, J., Ammann, M., Anastasio, C., Beine, H. J., Bergin, M., Bottenheim, J., Boxe, C. S., Carver, G., Chen, G., Crawford, J. H., Dominé, F., Frey, M. M., Guzmán, M. I., Heard, D. E., Helmig, D., Hoffmann, M. R., Honrath, R. E., Huey, L. G., Hutterli, M., Jacobi, H. W., Klán, P., Lefer, B., McConnell, J., Plane, J., Sander, R., Savarino, J., Shepson, P. B., Simpson, W. R., Sodeau, J. R., von Glasow, R., Weller, R., Wolff, E. W., and Zhu, T.: An overview of snow photochemistry: evidence, mechanisms and impacts, Atmos. Chem. Phys., 7, 4329–4373, https://doi.org/10.5194/acp-7-4329-2007, 2007.
Greilinger, M., Schauer, G., Baumann-Stanzer, K., Skomorowski, P., Schöner, W., and Kasper-Giebl, A.: Contribution of Saharan Dust to Ion Deposition Loads of High Alpine Snow Packs in Austria (1987–2017), Front. Earth Sci., 6, 126, https://doi.org/10.3389/feart.2018.00126, 2018.
Gu, P., Dallmann, T. R., Li, H. Z., Tan, Y., and Presto, A. A.: Quantifying Urban Spatial Variations of Anthropogenic VOC Concentrations and Source Contributions with a Mobile Sampling Platform, Int. J. Environ. Res. Pu., 16, 1632, https://doi.org/10.3390/ijerph16091632, 2019.
He, P., Xie, Z., Chi, X., Yu, X., Fan, S., Kang, H., Liu, C., and Zhan, H.: Atmospheric Δ17O(NO) reveals nocturnal chemistry dominates nitrate production in Beijing haze, Atmos. Chem. Phys., 18, 14465–14476, https://doi.org/10.5194/acp-18-14465-2018, 2018.
He, P., Xie, Z., Yu, X., Wang, L., Kang, H., and Yue, F.: The observation of isotopic compositions of atmospheric nitrate in Shanghai China and its implication for reactive nitrogen chemistry, Sci. Total Environ., 714, 136727, https://doi.org/10.1016/j.scitotenv.2020.136727, 2020.
Heaton, T. H. E.: ratios of NOx from vehicle engines and coal-fired power stations, Tellus B, 42, 304–307, https://doi.org/10.1034/j.1600-0889.1990.00007.x-i1, 1990.
Hoesly, R. M., Smith, S. J., Feng, L., Klimont, Z., Janssens-Maenhout, G., Pitkanen, T., Seibert, J. J., Vu, L., Andres, R. J., Bolt, R. M., Bond, T. C., Dawidowski, L., Kholod, N., Kurokawa, J.-I., Li, M., Liu, L., Lu, Z., Moura, M. C. P., O'Rourke, P. R., and Zhang, Q.: Historical (1750–2014) anthropogenic emissions of reactive gases and aerosols from the Community Emissions Data System (CEDS), Geosci. Model Dev., 11, 369–408, https://doi.org/10.5194/gmd-11-369-2018, 2018.
Holland, E. A., Dentener, F. J., Braswell, B. H., and Sulzman, J. M.: Contemporary and pre-industrial global reactive nitrogen budgets, Biogeochemistry, 46, 7–43, https://doi.org/10.1023/A:1006148011944, 1999.
Huang, R.-J., Zhang, Y., Bozzetti, C., Ho, K.-F., Cao, J.-J., Han, Y., Daellenbach, K. R., Slowik, J. G., Platt, S. M., Canonaco, F., Zotter, P., Wolf, R., Pieber, S. M., Bruns, E. A., Crippa, M., Ciarelli, G., Piazzalunga, A., Schwikowski, M., Abbaszade, G., Schnelle-Kreis, J., Zimmermann, R., An, Z., Szidat, S., Baltensperger, U., Haddad, I. E., and Prévôt, A. S. H.: High secondary aerosol contribution to particulate pollution during haze events in China, Nature, 514, 218–222, https://doi.org/10.1038/nature13774, 2014.
Kaiser, J., Hastings, M. G., Houlton, B. Z., Röckmann, T., and Sigman, D. M.: Triple oxygen isotope analysis of nitrate using the denitrifier method and thermal decomposition of N2O, Anal. Chem., 79, 599–607, https://doi.org/10.1021/ac061022s, 2007.
Kanaya, Y., Cao, R., Akimoto, H., Fukuda, M., Komazaki, Y., Yokouchi, Y., Koike, M., Tanimoto, H., Takegawa, N., and Kondo, Y.: Urban photochemistry in central Tokyo: 1. Observed and modeled OH and HO2 radical concentrations during the winter and summer of 2004, J. Geophys. Res.-Atmos., 112, D21312, https://doi.org/10.1029/2007JD008670, 2007.
Karydis, V. A., Tsimpidi, A. P., Pozzer, A., Astitha, M., and Lelieveld, J.: Effects of mineral dust on global atmospheric nitrate concentrations, Atmos. Chem. Phys., 16, 1491–1509, https://doi.org/10.5194/acp-16-1491-2016, 2016.
Kim, H., Walters, W. W., Bekker, C., Murray, L. T., and Hastings, M. G.: Nitrate chemistry in the northeast US – Part 2: Oxygen isotopes reveal differences in particulate and gas-phase formation, Atmos. Chem. Phys., 23, 4203–4219, https://doi.org/10.5194/acp-23-4203-2023, 2023.
Kirchstetter, T. W., Harley, R. A., and Littlejohn, D.: Measurement of Nitrous Acid in Motor Vehicle Exhaust, Environ. Sci. Technol., 30, 2843–2849, https://doi.org/10.1021/es960135y, 1996.
Kurtenbach, R., Becker, K. H., Gomes, J. A. G., Kleffmann, J., Lörzer, J. C., Spittler, M., Wiesen, P., Ackermann, R., Geyer, A., and Platt, U.: Investigations of emissions and heterogeneous formation of HONO in a road traffic tunnel, Atmos. Environ., 35, 3385–3394, https://doi.org/10.1016/S1352-2310(01)00138-8, 2001.
Largeron, Y. and Staquet, C.: Persistent inversion dynamics and wintertime PM10 air pollution in Alpine valleys, Atmos. Environ., 135, 92–108, https://doi.org/10.1016/j.atmosenv.2016.03.045, 2016.
Leighton, P. A.: Photochemistry of Air Pollution, Academic Press, ISBN 978-0124333345, 1961.
Li, J., Zhang, X., Orlando, J., Tyndall, G., and Michalski, G.: Quantifying the nitrogen isotope effects during photochemical equilibrium between NO and NO2: implications for δ15N in tropospheric reactive nitrogen, Atmos. Chem. Phys., 20, 9805–9819, https://doi.org/10.5194/acp-20-9805-2020, 2020.
Li, J., Davy, P., Harvey, M., Katzman, T., Mitchell, T., and Michalski, G.: Nitrogen isotopes in nitrate aerosols collected in the remote marine boundary layer: Implications for nitrogen isotopic fractionations among atmospheric reactive nitrogen species, Atmos. Environ., 245, 118028, https://doi.org/10.1016/j.atmosenv.2020.118028, 2021.
Li, K., Jacob, D. J., Liao, H., Qiu, Y., Shen, L., Zhai, S., Bates, K. H., Sulprizio, M. P., Song, S., Lu, X., Zhang, Q., Zheng, B., Zhang, Y., Zhang, J., Lee, H. C., and Kuk, S. K.: Ozone pollution in the North China Plain spreading into the late-winter haze season, P. Natl. Acad. Sci. USA, 118, e2015797118, https://doi.org/10.1073/pnas.2015797118, 2021.
Li, W., Ni, B. L., Jin, D. Q., and Zhang, Q. G.: Measurement of the absolute abundance of Oxygen-17 in SMOW, Kexue Tongboa, Chinese Sci. Bull., 33, 1610–1613, https://doi.org/10.1360/sb1988-33-19-1610, 1988.
Li, Y., Shi, G., Chen, Z., Lan, M., Ding, M., Li, Z., and Hastings, M. G.: Significant Latitudinal Gradient of Nitrate Production in the Marine Atmospheric Boundary Layer of the Northern Hemisphere, Geophys. Res. Lett., 49, e2022GL100503, https://doi.org/10.1029/2022GL100503, 2022.
Li, Z., Walters, W. W., Hastings, M. G., Song, L., Huang, S., Zhu, F., Liu, D., Shi, G., Li, Y., and Fang, Y.: Atmospheric nitrate formation pathways in urban and rural atmosphere of Northeast China: Implications for complicated anthropogenic effects, Environ. Pollut., 296, 118752, https://doi.org/10.1016/j.envpol.2021.118752, 2022.
Lim, S., Lee, M., Savarino, J., and Laj, P.: Oxidation pathways and emission sources of atmospheric particulate nitrate in Seoul: based on δ15N and Δ17O measurements, Atmos. Chem. Phys., 22, 5099–5115, https://doi.org/10.5194/acp-22-5099-2022, 2022.
Liu, J., Liu, Z., Ma, Z., Yang, S., Yao, D., Zhao, S., Hu, B., Tang, G., Sun, J., Cheng, M., Xu, Z., and Wang, Y.: Detailed budget analysis of HONO in Beijing, China: Implication on atmosphere oxidation capacity in polluted megacity, Atmos. Environ., 244, 117957, https://doi.org/10.1016/j.atmosenv.2020.117957, 2021.
Liu, Z., Hu, K., Zhang, K., Zhu, S., Wang, M., and Li, L.: VOCs sources and roles in O3 formation in the central Yangtze River Delta region of China, Atmos. Environ., 302, 119755, https://doi.org/10.1016/j.atmosenv.2023.119755, 2023.
Luo, L., Wu, S., Zhang, R., Wu, Y., Li, J., and Kao, S.: What controls aerosol δ15N-NO? NOx emission sources vs. nitrogen isotope fractionation, Sci. Total Environ., 871, 162185, https://doi.org/10.1016/j.scitotenv.2023.162185, 2023.
Mariotti, A.: Natural 15N abundance measurements and atmospheric nitrogen standard calibration, Nature, 311, 251–252, https://doi.org/10.1038/311251a0, 1984.
Martinelli, L. A., Piccolo, M. C., Townsend, A. R., Vitousek, P. M., Cuevas, E., McDowell, W., Robertson, G. P., Santos, O. C., and Treseder, K.: Nitrogen stable isotopic composition of leaves and soil: Tropical versus temperate forests, Biogeochemistry, 46, 45–65, https://doi.org/10.1023/A:1006100128782, 1999.
Masson-Delmotte, V., Zhai, A., Pirani, A., Connors, S. L., Péan, C., Berger, S., Caud, N., Chen, Y., Goldfarb, L., Gomis, M. I., Huang, M., Leitzell, K., Lonnoy, E., Matthews, J. B. R., Maycock, T. K., Waterfield, T., Yelekçi, O., Yu, R., and Zhou, B. (Eds.): Climate Change 2021: The Physical Science Basis, Contribution of Working Group I to the Sixth Assessment Report of the Intergovernmental Panel on Climate Change, Cambridge University Press, Cambridge, United Kingdom and New York, NY, USA, 147–286, https://doi.org/10.1017/9781009157896.003, 2021.
Mayer, H.: Air pollution in cities, Atmos. Environ., 33, 4029–4037, https://doi.org/10.1016/S1352-2310(99)00144-2, 1999.
McIlvin, M. R. and Altabet, M. A.: Chemical Conversion of Nitrate and Nitrite to Nitrous Oxide for Nitrogen and Oxygen Isotopic Analysis in Freshwater and Seawater, Anal. Chem., 77, 5589–5595, https://doi.org/10.1021/ac050528s, 2005.
Michalski, G., Scott, Z., Kabiling, M., and Thiemens, M. H.: First measurements and modeling of Δ17O in atmospheric nitrate, Geophys. Res. Lett., 30, 1870, https://doi.org/10.1029/2003GL017015, 2003.
Michalski, G., Bhattacharya, S. K., and Girsch, G.: NOx cycle and the tropospheric ozone isotope anomaly: an experimental investigation, Atmos. Chem. Phys., 14, 4935–4953, https://doi.org/10.5194/acp-14-4935-2014, 2014.
Michoud, V., Doussin, J.-F., Colomb, A., Afif, C., Borbon, A., Camredon, M., Aumont, B., Legrand, M., and Beekmann, M.: Strong HONO formation in a suburban site during snowy days, Atmos. Environ., 116, 155–158, https://doi.org/10.1016/j.atmosenv.2015.06.040, 2015.
Miller, C. E. and Yung, Y. L.: Photo-induced isotopic fractionation, J. Geophys. Res.-Atmos., 105, 29039–29051, https://doi.org/10.1029/2000JD900388, 2000.
Miller, D. J., Wojtal, P. K., Clark, S. C., and Hastings, M. G.: Vehicle NOx emission plume isotopic signatures: Spatial variability across the eastern United States, J. Geophys. Res.-Atmos., 122, 4698–4717, https://doi.org/10.1002/2016JD025877, 2017.
Miller, D. J., Chai, J., Guo, F., Dell, C. J., Karsten, H., and Hastings, M. G.: Isotopic Composition of In Situ Soil NOx Emissions in Manure-Fertilized Cropland, Geophys. Res. Lett., 45, 12058–12066, https://doi.org/10.1029/2018GL079619, 2018.
Morin, S., Savarino, J., Bekki, S., Cavender, A., Shepson, P. B., and Bottenheim, J. W.: Major influence of BrO on the NO3 and nitrate budgets in the Arctic spring, inferred from Δ17O(NO) measurements during ozone depletion events, Environ. Chem., 4, 238–241, https://doi.org/10.1071/EN07003, 2007a.
Morin, S., Savarino, J., Bekki, S., Gong, S., and Bottenheim, J. W.: Signature of Arctic surface ozone depletion events in the isotope anomaly (Δ17O) of atmospheric nitrate, Atmos. Chem. Phys., 7, 1451–1469, https://doi.org/10.5194/acp-7-1451-2007, 2007b.
Morin, S., Savarino, J., Frey, M. M., Domine, F., Jacobi, H.-W., Kaleschke, L., and Martins, J. M. F.: Comprehensive isotopic composition of atmospheric nitrate in the Atlantic Ocean boundary layer from 65∘ S to 79∘ N, J. Geophys. Res.-Atmos., 114, D05303, https://doi.org/10.1029/2008JD010696, 2009.
Morin, S., Sander, R., and Savarino, J.: Simulation of the diurnal variations of the oxygen isotope anomaly (Δ17O) of reactive atmospheric species, Atmos. Chem. Phys., 11, 3653–3671, https://doi.org/10.5194/acp-11-3653-2011, 2011.
Newsome, B. and Evans, M.: Impact of uncertainties in inorganic chemical rate constants on tropospheric composition and ozone radiative forcing, Atmos. Chem. Phys., 17, 14333–14352, https://doi.org/10.5194/acp-17-14333-2017, 2017.
Olofson, K. F. G., Andersson, P. U., Hallquist, M., Ljungström, E., Tang, L., Chen, D., and Pettersson, J. B. C.: Urban aerosol evolution and particle formation during wintertime temperature inversions, Atmos. Environ., 43, 340–346, https://doi.org/10.1016/j.atmosenv.2008.09.080, 2009.
ORCAE: Rapport des profils climat air énergie de la communauté de communes de la Vallée de Chamonix-Mont-Blanc, https://www.orcae-auvergne-rhone-alpes.fr/ (last access: July 2021), 2022.
Park, R. J., Jacob, D. J., Field, B. D., Yantosca, R. M., and Chin, M.: Natural and transboundary pollution influences on sulfate-nitrate-ammonium aerosols in the United States: Implications for policy, J. Geophys. Res.-Atmos., 109, D15204, https://doi.org/10.1029/2003JD004473, 2004.
Patris, N., Cliff, S., Quinn, P., Kasem, M., and Thiemens, M.: Isotopic analysis of aerosol sulfate and nitrate during ITCT-2k2: Determination of different formation pathways as a function of particle size, J. Geophys. Res., 112, D23301, https://doi.org/10.1029/2005JD006214, 2007.
Penkett, S. A., Burgess, R. A., Coe, H., Coll, I., Hov, Ø., Lindskog, A., Schmidbauer, N., Solberg, S., Roemer, M., Thijsse, T., Beck, J., and Reeves, C. E.: Evidence for large average concentrations of the nitrate radical (NO3) in Western Europe from the HANSA hydrocarbon database, Atmos. Environ., 41, 3465–3478, https://doi.org/10.1016/j.atmosenv.2006.11.055, 2007.
Prabhakar, G., Parworth, C. L., Zhang, X., Kim, H., Young, D. E., Beyersdorf, A. J., Ziemba, L. D., Nowak, J. B., Bertram, T. H., Faloona, I. C., Zhang, Q., and Cappa, C. D.: Observational assessment of the role of nocturnal residual-layer chemistry in determining daytime surface particulate nitrate concentrations, Atmos. Chem. Phys., 17, 14747–14770, https://doi.org/10.5194/acp-17-14747-2017, 2017.
Prospero, J. M. and Savoie, D. L.: Effect of continental sources on nitrate concentrations over the Pacific Ocean, Nature, 339, 687–689, https://doi.org/10.1038/339687a0, 1989.
Pugh, T. A. M., Cain, M., Methven, J., Wild, O., Arnold, S. R., Real, E., Law, K. S., Emmerson, K. M., Owen, S. M., Pyle, J. A., Hewitt, C. N., and MacKenzie, A. R.: A Lagrangian model of air-mass photochemistry and mixing using a trajectory ensemble: the Cambridge Tropospheric Trajectory model of Chemistry And Transport (CiTTyCAT) version 4.2, Geosci. Model Dev., 5, 193–221, https://doi.org/10.5194/gmd-5-193-2012, 2012.
Quimbayo-Duarte, J., Chemel, C., Staquet, C., Troude, F., and Arduini, G.: Drivers of severe air pollution events in a deep valley during wintertime: A case study from the Arve river valley, France, Atmos. Environ., 247, 118030, https://doi.org/10.1016/j.atmosenv.2020.118030, 2021.
Ren, J., Guo, F., and Xie, S.: Diagnosing ozone–NOx–VOC sensitivity and revealing causes of ozone increases in China based on 2013–2021 satellite retrievals, Atmos. Chem. Phys., 22, 15035–15047, https://doi.org/10.5194/acp-22-15035-2022, 2022.
Ren, X., Brune, W. H., Mao, J., Mitchell, M. J., Lesher, R. L., Simpas, J. B., Metcalf, A. R., Schwab, J. J., Cai, C., Li, Y., Demerjian, K. L., Felton, H. D., Boynton, G., Adams, A., Perry, J., He, Y., Zhou, X., and Hou, J.: Behavior of OH and HO2 in the winter atmosphere in New York City, Atmos. Environ., 40, 252–263, https://doi.org/10.1016/j.atmosenv.2005.11.073, 2006.
Richard, L., Romanini, D., and Ventrillard, I.: Nitric Oxide Analysis Down to ppt Levels by Optical-Feedback Cavity-Enhanced Absorption Spectroscopy, Sensors, 18, 1997, https://doi.org/10.3390/s18071997, 2018.
Savard, M. M., Cole, A. S., Vet, R., and Smirnoff, A.: The Δ17O and δ18O values of atmospheric nitrates simultaneously collected downwind of anthropogenic sources – implications for polluted air masses, Atmos. Chem. Phys., 18, 10373–10389, https://doi.org/10.5194/acp-18-10373-2018, 2018.
Savarino, J., Kaiser, J., Morin, S., Sigman, D. M., and Thiemens, M. H.: Nitrogen and oxygen isotopic constraints on the origin of atmospheric nitrate in coastal Antarctica, Atmos. Chem. Phys., 7, 1925–1945, https://doi.org/10.5194/acp-7-1925-2007, 2007.
Savarino, J., Bhattacharya, S. K., Morin, S., Baroni, M., and Doussin, J.-F.: The NO + O3 reaction: A triple oxygen isotope perspective on the reaction dynamics and atmospheric implications for the transfer of the ozone isotope anomaly, J. Chem. Phys., 128, 194303, https://doi.org/10.1063/1.2917581, 2008.
Savarino, J., Morin, S., Erbland, J., Grannec, F., Patey, M. D., Vicars, W., Alexander, B., and Achterberg, E. P.: Isotopic composition of atmospheric nitrate in a tropical marine boundary layer, P. Natl. Acad. Sci. USA, 110, 17668–17673, https://doi.org/10.1073/pnas.1216639110, 2013.
Savarino, J., Vicars, W. C., Legrand, M., Preunkert, S., Jourdain, B., Frey, M. M., Kukui, A., Caillon, N., and Gil Roca, J.: Oxygen isotope mass balance of atmospheric nitrate at Dome C, East Antarctica, during the OPALE campaign, Atmos. Chem. Phys., 16, 2659–2673, https://doi.org/10.5194/acp-16-2659-2016, 2016.
Schaap, M., Müller, K., and ten Brink, H. M.: Constructing the European aerosol nitrate concentration field from quality analysed data, Atmos. Environ., 36, 1323–1335, https://doi.org/10.1016/S1352-2310(01)00556-8, 2002.
Schwikowski, M., Seibert, P., Baltensperger, U., and Gaggeler, H. W.: A study of an outstanding Saharan dust event at the high-alpine site Jungfraujoch, Switzerland, Atmos. Environ., 29, 1829–1842, https://doi.org/10.1016/1352-2310(95)00060-C, 1995.
Shah, V., Jaeglé, L., Thornton, J. A., Lopez-Hilfiker, F. D., Lee, B. H., Schroder, J. C., Campuzano-Jost, P., Jimenez, J. L., Guo, H., Sullivan, A. P., Weber, R. J., Green, J. R., Fiddler, M. N., Bililign, S., Campos, T. L., Stell, M., Weinheimer, A. J., Montzka, D. D., and Brown, S. S.: Chemical feedbacks weaken the wintertime response of particulate sulfate and nitrate to emissions reductions over the eastern United States, P. Natl. Acad. Sci. USA, 115, 8110–8115, https://doi.org/10.1073/pnas.1803295115, 2018.
Sharma, H. D., Jervis, R. E., and Wong, K. Y.: Isotopic exchange reactions in nitrogen oxides, J. Phys. Chem., 74, 923–933, https://doi.org/10.1021/j100699a044, 1970.
Shi, X., Nenes, A., Xiao, Z., Song, S., Yu, H., Shi, G., Zhao, Q., Chen, K., Feng, Y., and Russell, A. G.: High-Resolution Data Sets Unravel the Effects of Sources and Meteorological Conditions on Nitrate and Its Gas-Particle Partitioning, Environ. Sci. Technol., 53, 3048–3057, https://doi.org/10.1021/acs.est.8b06524, 2019.
Sigman, D. M., Casciotti, K. L., Andreani, M., Barford, C., Galanter, M., and Böhlke, J. K.: A Bacterial Method for the Nitrogen Isotopic Analysis of Nitrate in Seawater and Freshwater, Anal. Chem., 73, 4145–4153, https://doi.org/10.1021/ac010088e, 2001.
Simpson, W. R., Brown, S. S., Saiz-Lopez, A., Thornton, J. A., and von Glasow, R.: Tropospheric Halogen Chemistry: Sources, Cycling, and Impacts, Chem. Rev., 115, 4035–4062, https://doi.org/10.1021/cr5006638, 2015.
Sodemann, H., Palmer, A. S., Schwierz, C., Schwikowski, M., and Wernli, H.: The transport history of two Saharan dust events archived in an Alpine ice core, Atmos. Chem. Phys., 6, 667–688, https://doi.org/10.5194/acp-6-667-2006, 2006.
Song, W., Liu, X.-Y., Houlton, B. Z., and Liu, C.-Q.: Isotopic constraints confirm the significant role of microbial nitrogen oxides emissions from the land and ocean environment, Nat. Sci. Rev., 9, nwac106, https://doi.org/10.1093/nsr/nwac106, 2022.
Stone, D., Whalley, L. K., and Heard, D. E.: Tropospheric OH and HO2 radicals: field measurements and model comparisons, Chem. Soc. Rev., 41, 6348–6404, https://doi.org/10.1039/C2CS35140D, 2012.
Tan, Z., Rohrer, F., Lu, K., Ma, X., Bohn, B., Broch, S., Dong, H., Fuchs, H., Gkatzelis, G. I., Hofzumahaus, A., Holland, F., Li, X., Liu, Y., Liu, Y., Novelli, A., Shao, M., Wang, H., Wu, Y., Zeng, L., Hu, M., Kiendler-Scharr, A., Wahner, A., and Zhang, Y.: Wintertime photochemistry in Beijing: observations of ROx radical concentrations in the North China Plain during the BEST-ONE campaign, Atmos. Chem. Phys., 18, 12391–12411, https://doi.org/10.5194/acp-18-12391-2018, 2018.
Thiemens, M. H.: History and Applications of Mass-independent Isotope Effects, Annu. Rev. Earth Planet. Sc., 34, 217–262, https://doi.org/10.1146/annurev.earth.34.031405.125026, 2006.
Thornton, J. A., Kercher, J. P., Riedel, T. P., Wagner, N. L., Cozic, J., Holloway, J. S., Dubé, W. P., Wolfe, G. M., Quinn, P. K., Middlebrook, A. M., Alexander, B., and Brown, S. S.: A large atomic chlorine source inferred from mid-continental reactive nitrogen chemistry, Nature, 464, 271–274, https://doi.org/10.1038/nature08905, 2010.
Tørseth, K., Aas, W., Breivik, K., Fjæraa, A. M., Fiebig, M., Hjellbrekke, A. G., Lund Myhre, C., Solberg, S., and Yttri, K. E.: Introduction to the European Monitoring and Evaluation Programme (EMEP) and observed atmospheric composition change during 1972–2009, Atmos. Chem. Phys., 12, 5447–5481, https://doi.org/10.5194/acp-12-5447-2012, 2012.
Tsimpidi, A. P., Karydis, V. A., and Pandis, S. N.: Response of Fine Particulate Matter to Emission Changes of Oxides of Nitrogen and Anthropogenic Volatile Organic Compounds in the Eastern United States, J. Air Waste Manage., 58, 1463–1473, https://doi.org/10.3155/1047-3289.58.11.1463, 2008.
Usher, C. R., Michel, A. E., and Grassian, V. H.: Reactions on Mineral Dust, Chem. Rev., 103, 4883–4940, https://doi.org/10.1021/cr020657y, 2003.
Vicars, W. C. and Savarino, J.: Quantitative constraints on the 17O-excess (Δ17O) signature of surface ozone: Ambient measurements from 50∘ N to 50∘ S using the nitrite-coated filter technique, Geochim. Cosmochim. Ac., 135, 270–287, https://doi.org/10.1016/j.gca.2014.03.023, 2014.
Vicars, W. C., Bhattacharya, S. K., Erbland, J., and Savarino, J.: Measurement of the 17O-excess (Δ17O) of tropospheric ozone using a nitrite-coated filter, Rapid Commun. Mass Sp., 26, 1219–1231, https://doi.org/10.1002/rcm.6218, 2012.
Vicars, W. C., Morin, S., Savarino, J., Wagner, N. L., Erbland, J., Vince, E., Martins, J. M. F., Lerner, B. M., Quinn, P. K., Coffman, D. J., Williams, E. J., and Brown, S. S.: Spatial and diurnal variability in reactive nitrogen oxide chemistry as reflected in the isotopic composition of atmospheric nitrate: Results from the CalNex 2010 field study, J. Geophys. Res.-Atmos., 118, 10567–10588, https://doi.org/10.1002/jgrd.50680, 2013.
Vitousek, P. M., Aber, J. D., Howarth, R. W., Likens, G. E., Matson, P. A., Schindler, D. W., Schlesinger, W. H., and Tilman, D. G.: Human Alteration of the Global Nitrogen Cycle: Sources and Consequences, Ecol. Appl., 7, 737–750, https://doi.org/10.1890/1051-0761(1997)007[0737:HAOTGN]2.0.CO;2, 1997.
Walters, W. W. and Michalski, G.: Theoretical calculation of nitrogen isotope equilibrium exchange fractionation factors for various NOy molecules, Geochim. Cosmochim. Ac., 164, 284–297, https://doi.org/10.1016/j.gca.2015.05.029, 2015.
Walters, W. W. and Michalski, G.: Theoretical calculation of oxygen equilibrium isotope fractionation factors involving various NOy molecules, OH, and H2O and its implications for isotope variations in atmospheric nitrate, Geochim. Cosmochim. Ac., 191, 89–101, https://doi.org/10.1016/j.gca.2016.06.039, 2016.
Walters, W. W., Tharp, B. D., Fang, H., Kozak, B. J., and Michalski, G.: Nitrogen isotope composition of thermally produced NOx from various fossil-fuel combustion sources, Environ. Sci. Technol., 49, 11363–11371, https://doi.org/10.1021/acs.est.5b02769, 2015a.
Walters, W. W., Goodwin, S. R., and Michalski, G.: Nitrogen Stable Isotope Composition (δ15N) of Vehicle-Emitted NOx, Environ. Sci. Technol., 49, 2278–2285, https://doi.org/10.1021/es505580v, 2015b.
Walters, W. W., Simonini, D. S., and Michalski, G.: Nitrogen isotope exchange between NO and NO2 and its implications for δ15N variations in tropospheric NOx and atmospheric nitrate, Geophys. Res. Lett., 43, 440–448, https://doi.org/10.1002/2015GL066438, 2016.
Walters, W. W., Fang, H., and Michalski, G.: Summertime diurnal variations in the isotopic composition of atmospheric nitrogen dioxide at a small midwestern United States city, Atmos. Environ., 179, 1–11, https://doi.org/10.1016/j.atmosenv.2018.01.047, 2018.
Wang, X., Jacob, D. J., Eastham, S. D., Sulprizio, M. P., Zhu, L., Chen, Q., Alexander, B., Sherwen, T., Evans, M. J., Lee, B. H., Haskins, J. D., Lopez-Hilfiker, F. D., Thornton, J. A., Huey, G. L., and Liao, H.: The role of chlorine in global tropospheric chemistry, Atmos. Chem. Phys., 19, 3981–4003, https://doi.org/10.5194/acp-19-3981-2019, 2019.
Wang, Y., Zhang, Q. Q., He, K., Zhang, Q., and Chai, L.: Sulfate-nitrate-ammonium aerosols over China: response to 2000–2015 emission changes of sulfur dioxide, nitrogen oxides, and ammonia, Atmos. Chem. Phys., 13, 2635–2652, https://doi.org/10.5194/acp-13-2635-2013, 2013.
Wang, Y., Gao, W., Wang, S., Song, T., Gong, Z., Ji, D., Wang, L., Liu, Z., Tang, G., Huo, Y., Tian, S., Li, J., Li, M., Yang, Y., Chu, B., Petäjä, T., Kerminen, V.-M., He, H., Hao, J., Kulmala, M., Wang, Y., and Zhang, Y.: Contrasting trends of PM2.5 and surface-ozone concentrations in China from 2013 to 2017, Nat. Sci. Rev., 7, 1331–1339, https://doi.org/10.1093/nsr/nwaa032, 2020.
Wang, Y., Liu, J., Jiang, F., Chen, Z., Wu, L., Zhou, S., Pei, C., Kuang, Y., Cao, F., Zhang, Y., Fan, M., Zheng, J., Li, J., and Zhang, G.: Vertical measurements of stable nitrogen and oxygen isotope composition of fine particulate nitrate aerosol in Guangzhou city: Source apportionment and oxidation pathway, Sci. Total Environ., 865, 161239, https://doi.org/10.1016/j.scitotenv.2022.161239, 2023.
Wang, Y. L., Song, W., Yang, W., Sun, X. C., Tong, Y. D., Wang, X. M., Liu, C. Q., Bai, Z. P., and Liu, Z. Y.: Influences of Atmospheric Pollution on the Contributions of Major Oxidation Pathways to PM2.5 Nitrate Formation in Beijing, J. Geophys. Res.-Atmos., 124, 4174–4185, https://doi.org/10.1029/2019JD030284, 2019.
Wayne, R. P., Barnes, I., Biggs, P., Burrows, J. P., Canosa-Mas, C. E., Hjorth, J., Le Bras, G., Moortgat, G. K., Perner, D., Poulet, G., Restelli, G., and Sidebottom, H.: The nitrate radical: Physics, chemistry, and the atmosphere, Atmos. Environ. Pt. A-Gen., 25, 1–203, https://doi.org/10.1016/0960-1686(91)90192-A, 1991.
Weber, S., Uzu, G., Calas, A., Chevrier, F., Besombes, J.-L., Charron, A., Salameh, D., Ježek, I., Močnik, G., and Jaffrezo, J.-L.: An apportionment method for the oxidative potential of atmospheric particulate matter sources: application to a one-year study in Chamonix, France, Atmos. Chem. Phys., 18, 9617–9629, https://doi.org/10.5194/acp-18-9617-2018, 2018.
Whiteman, C. D.: Breakup of Temperature Inversions in Deep Mountain Valleys: Part I. Observations, J. Appl. Meteorol. Clim., 21, 270–289, https://doi.org/10.1175/1520-0450(1982)021<0270:BOTIID>2.0.CO;2, 1982.
WHO: World Health Organization global air quality guidelines. Particulate matter (PM2.5 and PM10), ozone, nitrogen dioxide, sulfur dioxide and carbon monoxide, Geneva, World Health Organization, 2021.
Wild, O., Zhu, X., and Prather, M. J.: Fast-J: Accurate simulation of in- and below-cloud photolysis in tropospheric chemical models, J. Atmos. Chem., 37, 245–282, https://doi.org/10.1023/A:1006415919030, 2000.
Xue, C.: Substantially Growing Interest in the Chemistry of Nitrous Acid (HONO) in China: Current Achievements, Problems, and Future Directions, Environ. Sci. Technol., 56, 7375–7377, https://doi.org/10.1021/acs.est.2c02237, 2022.
Young, E. D., Galy, A., and Nagahara, H.: Kinetic and equilibrium mass-dependent isotope fractionation laws in nature and their geochemical and cosmochemical significance, Geochim. Cosmochim. Ac., 66, 1095–1104, https://doi.org/10.1016/S0016-7037(01)00832-8, 2002.
Yu, Z. and Elliott, E. M.: Novel Method for Nitrogen Isotopic Analysis of Soil-Emitted Nitric Oxide, Environ. Sci. Technol., 51, 6268–6278, https://doi.org/10.1021/acs.est.7b00592, 2017.
Zhang, L., Vet, R., O'Brien, J. M., Mihele, C., Liang, Z., and Wiebe, A.: Dry deposition of individual nitrogen species at eight Canadian rural sites, J. Geophys. Res.-Atmos., 114, D02301, https://doi.org/10.1029/2008JD010640, 2009.
Zhang, R., Wang, G., Guo, S., Zamora, M. L., Ying, Q., Lin, Y., Wang, W., Hu, M., and Wang, Y.: Formation of Urban Fine Particulate Matter, Chem. Rev., 115, 3803–3855, https://doi.org/10.1021/acs.chemrev.5b00067, 2015.
Zhang, W., Bi, X., Zhang, Y., Wu, J., and Feng, Y.: Diesel vehicle emission accounts for the dominate NOx source to atmospheric particulate nitrate in a coastal city: Insights from nitrate dual isotopes of PM2.5, Atmos. Res., 278, 106328, https://doi.org/10.1016/j.atmosres.2022.106328, 2022.
Zhang, Y.-L., Zhang, W., Fan, M.-Y., Li, J., Fang, H., Cao, F., Lin, Y.-C., Wilkins, B. P., Liu, X., Bao, M., Hong, Y., and Michalski, G.: A diurnal story of Δ17O(NO) in urban Nanjing and its implication for nitrate aerosol formation, npj Clim. Atmos. Sci., 5, 1–10, https://doi.org/10.1038/s41612-022-00273-3, 2022.
Zhou, W., Gao, M., He, Y., Wang, Q., Xie, C., Xu, W., Zhao, J., Du, W., Qiu, Y., Lei, L., Fu, P., Wang, Z., Worsnop, D. R., Zhang, Q., and Sun, Y.: Response of aerosol chemistry to clean air action in Beijing, China: Insights from two-year ACSM measurements and model simulations, Environ. Pollut., 255, 113345, https://doi.org/10.1016/j.envpol.2019.113345, 2019.
Zong, Z., Wang, X., Tian, C., Chen, Y., Fang, Y., Zhang, F., Li, C., Sun, J., Li, J., and Zhang, G.: First Assessment of NOx Sources at a Regional Background Site in North China Using Isotopic Analysis Linked with Modeling, Environ. Sci. Technol., 51, 5923–5931, https://doi.org/10.1021/acs.est.6b06316, 2017.
Zong, Z., Sun, Z., Xiao, L., Tian, C., Liu, J., Sha, Q., Li, J., Fang, Y., Zheng, J., and Zhang, G.: Insight into the Variability of the Nitrogen Isotope Composition of Vehicular NOx in China, Environ. Sci. Technol., 54, 14246–14253, https://doi.org/10.1021/acs.est.0c04749, 2020.
- Abstract
- Introduction
- Material and methods
- Results and discussion
- Summary and implications
- Appendix A: Reaction chemical rate
- Appendix B: Atmospheric lifetime of NO2 and NO
- Appendix C: Schematic of the N reactive cycle and associated Δ17O transfers and N enrichment factors
- Appendix D: Equilibrium N fractionation factors
- Data availability
- Author contributions
- Competing interests
- Disclaimer
- Acknowledgements
- Financial support
- Review statement
- References
- Supplement