the Creative Commons Attribution 4.0 License.
the Creative Commons Attribution 4.0 License.
The long-term impact of biogenic volatile organic compound emissions on urban ozone patterns over central Europe: contributions from urban and rural vegetation
Marina Liaskoni
Lukáš Bartík
Alvaro Patricio Prieto Perez
Jan Karlický
Kateřina Šindelářová
The paper evaluates the long-term (2007–2016) impact of biogenic volatile organic compound (BVOC) emissions on urban ozone patterns over central Europe, specifically focusing on the contribution of urban vegetation using a regional climate model coupled offline to a chemistry transport model. BVOCs are emitted by terrestrial ecosystems, and their impact is considered especially important over NOx-rich environments such as urban areas. The study evaluates the impact of BVOC emissions on ozone (O3), formaldehyde (HCHO), and hydroxyl radical (OH) near-surface concentrations, showing an increase in summer ozone by 6 %–10 % over large areas in central Europe due to their emissions. It also demonstrates a substantial increase in formaldehyde concentrations. Additionally, the impact of BVOC emissions on hydroxyl radical concentrations shows a decrease over most of the modeled region by 20 %–60 %, with some increases over urban areas. Impacts on peroxy radicals (HO2 and higher RO2) are shown too.
Importantly, the study explores the partial role of urban vegetation in modulating ozone and evaluates its contribution to the overall ozone formation due to all BVOC emissions. The findings reveal that urban BVOC emissions contribute to around 10 % of the total impact on ozone and formaldehyde concentrations in urban areas, indicating their significant but localized influence.
The study also conducts sensitivity analyses to assess the uncertainty arising from the calculation of the urban fraction of BVOC emissions. The results show that the impact of urban BVOC emissions responds to their magnitude nearly linearly, with variations up to 4-fold, emphasizing the importance of accurately quantifying the urban BVOC fluxes. Overall, the study sheds light on the intricate relationship between urban vegetation, BVOC emissions, and their impact on atmospheric chemistry, providing valuable insights into the regional chemistry of BVOC emissions over central Europe and the causes of urban ozone pollution.
- Article
(14394 KB) - Full-text XML
-
Supplement
(11119 KB) - BibTeX
- EndNote
Biogenic volatile organic compounds (BVOCs) are atmospheric organic trace gases which are emitted by terrestrial ecosystems. The function of these emissions is connected to the protection of these ecosystems against environmental changes (Simpraga et al., 2019) or herbivory (Yu et al., 2021) as a way of signaling communication, which enhances their growth and their reproduction. Emission inventories have shown that the prominent species are the terpenoids (i.e., isoprene, monoterpenes, and sesquiterpenes), followed by alcohols, carbonyls, and acids. Annually, global isoprene emissions can reach values of 440 Tg yr−1 and contribute to 50 % to the total BVOC emissions (Guenther et al., 2012; Sindelarova et al., 2022). Measured BVOC concentrations showed their chemical lifetimes ranging between few minutes to hours, and their reactivity is dependent on many atmospheric factors (Kesselmeier and Staudt, 1999). Due to their high reactivity, BVOCs significantly affect the chemistry of the lower troposphere by reacting with hydroxyl radical (OH), nitrate radical (NO3), and ozone (O3), leading also to the formation of secondary organic aerosols (Seinfeld and Pandis, 2016; Gu et al., 2021; Bartík et al., 2024).
Several factors influence the magnitude of BVOC emissions. First, meteorological factors such as the temperature and the solar radiation intensity have a positive correlation with the emission rates (Guidolotti et al., 2019). Grote et al. (2013) proved that the temperature sensitivity of these emissions depends also on different tree and plant species. Humidity is also another factor that affects the stress response of the plants. Droughts are linked with elevated BVOC emissions, whereas higher levels of humidity can reduce these emissions by closing the stomata of the leaves (Duan et al., 2023). The existence of herbivores and pathogens in the environment adds another factor that contributes to the BVOC emission rates. Injuries from these organisms can stress the plants, resulting in higher emissions (Fitzky et al., 2019).
BVOCs have a complicated role in the tropospheric chemistry. By reacting with OH radicals, BVOCs are oxidized to organic peroxy radicals (RO2), following with the reaction with NO to oxidize into NO2 if sufficient NOx is available (e.g., in urban areas). NO2 then undergoes photolysis, leading to ozone formation (Coates et al., 2016; Li et al., 2019). However, for low-NOx areas and/or those already rich in volatile organic compounds (VOCs), RO2 will react with each other or with HO2 with even a small negative effect on tropospheric O3 (Lerdau, 2007; Seinfeld and Pandis, 2016; Zhao et al., 2022). Apart from contributing to ozone formation, BVOCs can also reduce their abundance as O3 is another oxidant leading to the formation of Criegee biradical intermediates that consequently become aldehydes and ketones (ending in formaldehyde). Finally, during nighttime, the main oxidizing mechanism is the reaction with the nitrate radical dominating over the reaction with nighttime ozone (Seinfeld and Pandis, 2016).
It was also shown (e.g., Harrison et al., 2006; Seinfeld and Pandis, 2016) that Criegee intermediates further decompose to hydroxyl radicals and can significantly impact the OH budget over urban areas by being a dominant source for OH besides the well-known ozone photolysis pathway.
Among the wide family of BVOCs, a great deal of attention was given to isoprene for being the most abundant biogenic species – especially for its oxidation and its impact on recycling of hydroxyl radical and peroxy radicals (HO2 and higher RO2). Archibald et al. (2010) pointed out the complicated pathways that isoprene undergoes and showed that any simplification made in the chemical representation (as usually done in chemistry mechanisms within current chemistry transport models) reduces the HOx (OH+HO2) recycling, leading to lower OH values compared to measurements. More recently, Bates et al. (2019) also argued that the distribution of its products is highly dependent on the addition of OH and O2 to isoprene, and its proper representation allows a more prompt regeneration of OH. This consequently improves the ozone–NOx chemistry, leading more accurate ozone simulation in numerical models (Schwantes et al., 2020).
In summary, BVOCs affect the HOx and ozone concentrations and thus have a great impact on the oxidative capacity of the lower troposphere which refers to the ability of the atmosphere to remove air pollutants and trace gases (Thompson, 1992). Moreover, BVOCs can oxidize into low-volatility substances and thus also contribute to secondary organic aerosol (SOA) formation (Aksoyoglu et al., 2017; Liu et al., 2021; Huszar et al., 2024; Bartík et al., 2024).
Many studies have shown the overall impact of BVOC emissions on tropospheric ozone concentrations. On the global scale, it was found by many that, as expected, biogenic hydrocarbon emissions increase tropospheric ozone concentrations especially over high-NOx regions, while they can lead to even some decreases for the low-NOx case (Williams et al., 2009; Zeng et al., 2008; Rowlinson et al., 2020). Over continental scales, works often focused on highly polluted regions of North America or eastern Asia, where BVOC emissions are expected to have a large impact on ozone levels. Sartelet et al. (2012) showed that over North America, average summer ozone concentrations are about 10 % larger if BVOC emissions are considered. Zhang et al. (2017) performed a detailed source apportionment using Ozone Source Apportionment Technology (OSAT) and showed a similar contribution of BVOCs to regional ozone levels over the USA, while they also applied a brute-force (“zero-out”) method, which gave even higher contributions, especially over high-NOx areas. The increase in biogenic emissions of VOCs within a warming climate is also examined, and Lam et al. (2011) showed that in future BVOC emissions will become even more important with regards to ozone formation. The abovementioned OSAT technique to attribute the simulated ozone concentrations to different sources was applied by Zhang et al. (2017), and a contribution of more than 10 % to regional ozone concentrations was found, mainly above and near urban areas. Over Canada,Sakulyanontvittaya et al. (2016) showed that region-specific land use and plant-type data are needed to achieve a better performance in modeling regional-scale ozone, especially over urban areas, where the effect of BVOCs was found to be higher.
Over highly populated areas in eastern Asia, ozone is also strongly modulated by BVOC emissions, especially in connection with NOx plumes over downwind areas near large cities (Kim et al., 2013; Lee et al., 2014; Liu et al., 2018; Li et al., 2018; Wu et al., 2020). The elevated role of BVOCs in the ozone formation during heat waves when BVOC emissions are higher than average was calculated by Ma et al. (2019). Qu et al. (2013) and Gao et al. (2022b) pointed out that the interplay of anthropogenic and BVOC emissions is synergical, leading to higher-ozone concentrations than the sum of their separate contribution. It was shown for eastern Asia that the change in BVOC emissions is responsible for the observed ozone increases (Wang et al., 2022) during the 21st century. The role of BVOC modifications within the changing climate over China was also of interest, and due to the increase in BVOC emissions, ozone increases are also foreseen (Liu et al., 2019).
Over Europe, studies in the Mediterranean region showed that the maximum O3 increase due to the BVOC emissions can be of the order of 10 µg m−3 (Thunis and Cuvelier, 2000). The dominant role of natural VOC emissions over anthropogenic ones in ozone production (i.e., ozone concentrations are sensitive mostly to BVOC emissions) over the Mediterranean was shown also by Richards et al. (2013), especially over urban downwind areas, as highlighted earlier by Im et al. (2011). Previously, Curci et al. (2009) calculated an average of 5 % increase in daily ozone maxima as a result of BVOC emissions for 4 hot years (1997, 2000, 2001, and 2003), especially during the hottest summers. Many others pointed out the crucial role of BVOC emissions in air quality during heat waves (Castell et al., 2008; Strong et al., 2013; Hodnebrog et al., 2012). Furthermore, Castell et al. (2008) and Tagaris et al. (2014) showed that the magnitude of the impact of BVOCs depends on the NOx emission magnitude, and a reduction in these emissions in cities would decrease the BVOC impact on ozone. A more elaborate source attribution of European ozone was conducted by Karamchandani et al. (2017), who used OSAT and found too that biogenic emissions are important for summer ozone. As for the uncertainty in the effect on ozone due to the method of BVOC flux calculation, Jiang et al. (2019) showed that despite the “large differences in isoprene emissions (i.e., 3-fold), the resulting impact in predicted summertime ozone proved to be minor”. In central Europe, the produced ozone concentrations due to BVOC emissions are on average 12 % higher and can reach values up to 60 % on warm days in Berlin (Churkina et al., 2017).
It is clear from the studies above that from an ozone production perspective, BVOC emissions are important above urban areas with high-NOx pollution, where there is sufficient NO to be oxidized by peroxy radicals. Certainly, BVOC concentration “clouds” arriving over cities can have a large effect on ozone in this regard too (von Schneidemesser et al., 2011); however, urban areas in Europe are never totally non-vegetated, so the VOCs emitted by urban vegetation might have a very important role too. These emissions will probably be lower than emissions from rural/natural areas, but urban vegetation injects BVOCs right into a NOx-rich environment, potentially resulting in efficient ozone production (Gao et al., 2022a; Huszar et al., 2022) and being a dominant factor in the regulation of urban ozone (Fitzky et al., 2023). Moreover, the physiology of trees in urban environments differs from their rural/natural counterparts due to the different urban conditions. As an example, the so-called urban heat island effect creates higher temperatures compared to the rural environments (Huszar et al., 2018; Karlický et al., 2018, 2020). The increased CO2 concentrations can enhance the growth of vegetation and the release of BVOC emissions, a process which is also highly dependent on the plant/tree species (Yu and Blande, 2021). The low levels of soil moisture and humidity also act as a catalyst for increasing emissions. Fitzky et al. (2019) showed that the size of urban trees and the canopy play an important role in mitigating the air pollution, with taller trees being more suitable for this goal. Last, the global trend of an urban greening solution poses a further threat to urban ozone as it introduces new BVOC emissions in cities that can potentially enhance ozone concentrations (Ma et al., 2021; Gu et al., 2021)
A few studies already analyzed the partial role of urban vegetation in air quality in general and in ozone formation and removal via deposition specifically. Nowak et al. (2000) showed that by analyzing various micro-climatic conditions above the urban domain of Washington, D.C., to Massachusetts that the uptake of O3 due to BVOC emissions increases more than the formation of O3 during the daytime, while at night the formation of O3 dominates the uptake. Lerdau (2007) discussed that in an atmosphere of existing elevated O3 concentrations the physiology of the plants will be affected in a way that will produce further BVOC emissions, thus creating a positive feedback loop of O3 formation. Ghirardo et al. (2016) observed how the urban trees affected the emissions and the uptake of BVOCs. Between constitutive non-stressful conditions and stress-induced BVOCs, the stress-induced BVOCs constituted about 40 % of the total annual BVOC emissions, and this budget could be doubled with the increasing urban greening, highlighting the importance of the urban parameters in BVOC emission models. Calfapietra et al. (2013) and Bonn et al. (2018) further stressed that the choice of the urban trees within urban greening has a crucial importance too with high-BVOC-emitter trees being dangerous in typical urban conditions (i.e., VOC-limited ones). Using a box model to analyze the urban micro-climatic conditions, Simon et al. (2019) showed that increasing isoprene concentrations as a result of urban greening can significantly increase the street level ozone concentrations. Recently, Maison et al. (2024) calculated the role of urban vegetation in ozone and organic matter formation for Paris during a chosen summer which included a heat wave too. They found that ozone increased on average by about 2 %–3 % during summer, while the heat wave causes an even larger, 4 %–6 %, increase in near-surface ozone.
In summary, there is generally well-established knowledge on the role of BVOC emissions on ozone formation; however, most of the studies looked at only selected months or seasons or selected urban areas. It is certainly true that emissions of VOCs from vegetation are most important during the hottest days of the year; however, the long-term regional impact of BVOCs over decadal timescales has not been well addressed. Moreover, very few studies looked at the partial role of urban vegetation in modulating ozone, especially in the long term. Here, we try to address these gaps and propose a regional chemistry-transport-model-based study to evaluate the long-term impact of BVOC emissions on present-day ozone values in and around urban areas over central Europe. Our study, moreover, calculates the partial role of the urban vegetation and evaluates its contribution to the overall ozone formation due to all BVOC emissions. Apart from ozone, the study further assesses the changes in the oxidative capacity of the atmosphere in terms of OH and RO2 concentrations, as well as the impact on the products of BVOC oxidation (formaldehyde).
A further aim of the study is to better understand the causes of urban ozone pollution over Europe. According to the European Environmental Agency with regard to Europe's air quality status in 2022 (EEA, 2022), 12 % of the EU population is exposed to elevated ozone burdens (taking 120 µg m−3 as a threshold value for the daily maximum 8 h ozone), while if the WHO guidelines are taken into account (100 µg m−3), this percentage increases to 95 %.
2.1 Models used
To achieve the objectives of the study, the chemical transport model Comprehensive Air quality Model with extensions (CAMx) was coupled offline to the regional climate model, namely the Weather Research and Forecasting (WRF) Model. Biogenic emissions were calculated by the Model of Emissions of Gases and Aerosols from Nature (MEGAN). These three models are described in detail below.
2.1.1 Driving meteorological model
The BVOC emission model used and the chemical transport model were driven by the WRF (Weather Research and Forecasting) model version 4 (Skamarock et al., 2019) using the following parameterizations: the RRTMG (rapid radiative transfer model for GCMs) scheme (Iacono et al., 2008) for radiation; the Purdue–Lin scheme (Chen and Sun, 2002) and the Grell 3D scheme (Grell, 1993) for microphysical processes and convection, respectively; the Noah scheme for the land surface exchange (Chen and Dudhia, 2001); and, finally, the BouLac scheme (Bougeault and Lacarrère, 1989) to resolve the boundary layer processes. Static land use data for WRF are derived from CORINE Land Cover data, version CLC 2012 (CORINE, 2012). For urban grid boxes, the single-layer urban canopy model (SLUCM; Kusaka et al., 2001) is used with parameters for the urban built-up, as in Karlický et al. (2018). The choice of the combination of parameterizations follows the results of Karlický et al. (2020), who performed a series of sensitivity experiments to achieve the best possible model–observation agreement.
2.1.2 Chemical transport model
To account for the chemical transformation and transport of chemical species, we used the chemical transport model CAMx, version 7.20 (Comprehensive Air quality Model with extensions; Ramboll, 2022; Emery et al., 2024). CAMx is a Eulerian chemical transport model to calculate photochemistry, as well as aerosol processes. The CB6r5 gas phase chemical mechanism (Carbon Bond 6 revision 5) was used in this study. It is described in detail by Cao et al. (2021), with the complete list of chemical species and reactions in Ramboll (2022). Here we provide the most important oxidation pathways for BVOCs, namely for isoprene (ISOP) and monoterpenes (TERP).
In CB6r5, ISOP is oxidized most efficiently through a reaction with the OH radical, followed by a lumped species called ISO2 (“peroxy radicals followed by the reaction of OH with ISOP”). ISO2 then enters reaction chain, starting with the addition of NO to form NO2, along with further products like organic nitrates, formaldehyde, methacrolein, and methyl vinyl ketone, including the formation of peroxy radicals (HO2 and higher RO2). ISO2 can also react with other peroxy radicals (including acetyl peroxy radicals). Oxidation of ISOP by ozone is slower in CB6 and is included in one summary reaction resulting in the formation of formaldehyde (HCHO), methyl vinyl ketone, methacrolein, aldehydes, lumped paraffins, a hydroxyl radical, and peroxy radicals (both HO2 and higher RO2). This means that Criegee biradicals, as intermediate products of these oxidation pathways, are not explicitly included in the mechanism. CB6r5 considers a steady-state approximation for them, and only products from their decay are considered. Finally (and especially during the night), ISOP is oxidized in CB6r5 by the nitrate radical (NO3) resulting in formation of HCHO, higher aldehydes, methyl vinyl ketone, NO2, and organic nitrates, as well as peroxy radicals. The reaction of ISOP with nitrate is faster than with ozone but still slower than the OH oxidation. The main ISOP oxidation products (methyl vinyl ketone and methacrolein) are further oxidized by either OH, ozone, or NO3, ending in simpler aldehydes, ketones, methyl glyoxal, formic acid, hydroxyl radical, and, of course, some peroxy radicals.
In the case of monoterpenes, they are represented with one lumped species (called TERP) that represents all monoterpenes. Their oxidation in CB6r5 again follows three pathways (i.e., reaction with OH, ozone, and nitrate radicals). The fastest oxidation occurs with OH, followed by the reaction with nitrate radicals and ozone. These oxidation pathways are again represented by three summary reactions, with the products involving HCHO and higher aldehydes, organic nitrates, paraffins, a hydroxyl radical, and peroxy radicals. Again, Criegee intermediates are not explicitly calculated; this is only the case for consequent products (which include also hydroxyl radical). The monoterpene oxidation pathways are based on the older CB05 gas phase chemistry mechanism (Sarwar et al., 2008) which uses the reaction rate constants taken from the SAPRC99 mechanism (Carter, 2000). These reaction constants represent an average of the individual reaction constants for different compounds that comprise the monoterpene family.
It is seen that the oxidation of ISOP and TERP in CAMx is represented by a relatively simple set of reaction equations and does not account for the intermediate reaction steps and products including possible feedbacks, including the consideration of Criegee intermediates. In this regard, the Master Chemical Mechanism (MCM; https://mcm.york.ac.uk/MCM/, last access: 9 December 2024) could provide a much more detailed degradation scheme; alternatively, there are attempts to incorporate special schemes aimed at only isoprene (Bates et al., 2019) or isoprene and terpenes (Schwantes et al., 2020) that better represent, e.g., the HOx recycling and thus the impact on NOx–ozone chemistry, as detailed by Archibald et al. (2010) and with recent updates provided by Khan et al. (2021). CAMx is, however, intended to be employed over large domains, and in the case of longer numerical integrations like in this study, some compromise has to be made between the complexity of the chemistry and the computational feasibility. On the other hand, the “summary” reactions for TERP and ISOP mentioned above may introduce some error in the distribution of the oxidants, and efforts should be made towards a more explicit mechanism in future model works (e.g., the new CB7 mechanism; Schwantes et al., 2020).
As gas-phase chemical reactions are tightly coupled to heterogenous chemistry and aerosol processes, we also invoked the full aerosol chemistry in our simulations using the ISORROPIA thermodynamic equilibrium model v1.7 (Nenes et al., 1998, 1999) and RADM-AQ aqueous chemistry algorithm. A semi-volatile equilibrium scheme called SOAP (Strader et al., 1999) is used to form secondary organic aerosol from condensable vapors.
CAMx is coupled offline to WRF output using the WRFCAMx preprocessor that is provided with the CAMx code https://www.camx.com/download/support-software/ (last access: 25 September 2024). Vertical eddy diffusion coefficients (Kv) are computed in WRFCAMx, following the similarity method adopted from the Community Multiscale Air Quality (CMAQ) modeling system (Byun, 1999). The sensitivity to the choice of the method for the calculation of Kv was tested by Huszar et al. (2020a), and they found that the CMAQ method provides Kv values in the middle of the uncertainty range.
2.1.3 The biogenic emission model
Biogenic emissions from terrestrial ecosystems are calculated offline with MEGANv2.1 (Model of Emissions of Gases and Aerosols from Nature) (Guenther et al., 2012). MEGAN provides meteorology-dependent emission fluxes of a whole range of biogenic volatile compounds such as isoprene, monoterpenes, and sesquiterpenes, as well as methanol, ethanol, acetaldehyde, acetone, α-pinene, β-pinene, t-β-ocimene, limonene, ethene, and propene. MEGAN2.1 estimates emissions (Fi) of chemical species i from terrestrial landscapes according to
where ϵi,j is the emission factor at standard conditions for vegetation type j with fractional grid box areal coverage χj. The emission activity factor (γi) accounts for the processes controlling emission responses to environmental and phenological conditions. This includes a light response based on electron transport; a temperature response due to enzymatic activity; and further a dependence on leaf age, soil moisture, leaf area index (LAI), and CO2 concentration (called CO2 inhibition). MEGAN considers 16 vegetation types called plant functional types (PFTs) and emission factors for 19 biogenic species that are speciated to the target chemical mechanism (CB6r5 in our case). The meteorological input to MEGAN is obtained from WRF hourly outputs. The outputs of MEGAN are hourly emission fluxes for the target grid (see below).
2.2 Model setup and data
The WRF model and CAMx were run on a central European domain with a size of 189 × 165 grid boxes (from France to Ukraine and Italy to Denmark) at a 9 km × 9 km horizontal resolution centered over Prague (Czechia) (50.075 ° N, 14.44 ° E; Lambert conic conformal projection). WRF used 40 layers in the vertical, reaching 50 hPa as model top, while the lowermost layer was about 30 m thick. CAMx was applied over 18 layers, with the top layer at about 12 km. The first 10 CAMx layers matched the WRF layers.
Simulations were carried out for the 2007–2016 period. This length of time (10 years) ensures higher representativeness of the results providing “climatology” of the air quality impact of BVOC emissions.
To drive the regional climate in WRF, the ERA-Interim reanalysis (Simmons et al., 2010) was used. Chemical initial and boundary conditions for CAMx were adopted from CAM-Chem global model data (Buchholz et al., 2019; Emmons et al., 2020).
The TNO-MACC-III data (an update of the MACC-II version; Kuenen et al., 2014) from 2011 were used as anthropogenic emission data for the whole decade. This high-resolution (° latitude, ° longitude; roughly 6 km × 6 km) European emission database provides annual emission totals for non-methane volatile organic compounds (NMVOCs), NOx, methane (CH4), sulfur dioxide (SO2), ammonia (NH3), carbon monoxide (CO), and PM10 and PM2.5 (particles with diameters < 10 and 2.5 µm, respectively) in 11 activity categories. To redistribute the emissions to model grid cells, FUME version 2.0 (Flexible Universal processor for Modeling Emissions) was used (Benešová et al., 2018; Belda et al., 2024; http://fume-ep.org/, last access: 25 September 2024). FUME further performs the standard emission-processing steps, like chemical speciation and time disaggregation to hourly emissions with speciation profiles and temporal factors, based on Passant (2002) and van der Gon et al. (2011). The outputs of FUME are CAMx-ready hourly emission files speciated to model species (consistent with the used mechanism).
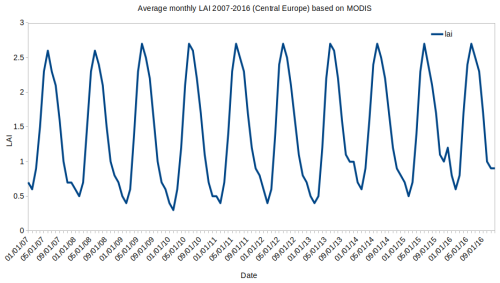
For MEGAN, the MODIS 0.1° × 0.1° LAI data from the year 2010 for an 8 d period were used (Yuan et al., 2011). Plant-functional-type data are extracted also from MODIS, following Lawrence and Chase (2007) for the same year (2010). Finally, emission factors for different plant types are based on Guenther et al. (2012). To justify to choice of 1 year as a representative one for the whole period, we plot the average monthly time series of LAI from the year-by-year data in Yuan et al. (2011) as the domain average in Fig. 3. The plot shows that for each simulated year, the LAI for summer months reaches slightly above 2.5 on average (about 2.6–2.7), while the year 2010 is not an outlier, meaning that it is a good representation of the decade (there are larger differences during winter between the years, but we were interested only in the summer months in this study). Regarding the plant-functional-type data, here we assume negligible modifications in land use over central Europe during this decade. This is true especially for crops and other farm land types and also for forests (EUROSTAT, 2020; FOREST EUROPE, 2020), at least compared to areas where intense urban development such as in China (Zhu et al., 2022) took place in the last few decades, thus requiring us to take the evolution of PFT distribution and LAI into account much more (Ma et al., 2021).
MEGAN was driven with a WRF-generated hourly meteorological output, resulting in hourly BVOC emissions files on a daily basis for the entire 2007–2016 period.
The modeled BVOC emissions
Figure 1 depicts the 2007–2016 average summer (June–July–August, JJA) emissions of BVOCs, as well as the sum of all anthropogenic VOC emissions for the same period. This allows us to compare the magnitudes of both sources.
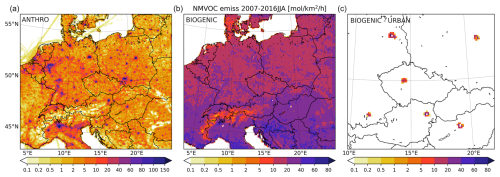
Figure 1The 2007–2016 JJA average emissions of anthropogenic (a) and biogenic (b) VOC emissions and the urban fraction of BVOCs (c) (in mol km−2 h−1). Please note that the color bars for the BVOC emission panels are slightly different from the anthropogenic emission figure.
As one of the objectives of the study is to evaluate the partial role of BVOC emissions originating from urban areas, the figure also shows the urban BVOC emissions for the six selected cities. The urban fraction was calculated by masking out the PFT data at the city boundaries such that, first, it was calculated that how much of the grid cell falls within the urban area, and second, this factor was applied to the PFT fractional data, thus allowing us to calculate the emissions of BVOCs from this fraction only.
From Fig. 1, it is seen that BVOC emissions are usually between 10 and 40 mol km−2 h−1, with emissions up to 60–80 mol km−2 h−1 over natural areas over the southern part of the domain (Italy and the Balkans). In the case of anthropogenic VOCs (except methane), they are usually lower over nonurban areas ranging up to 5 mol km−2 h−1 and thus smaller than the biogenic source. However, over cities – as expected – the anthropogenic source of VOCs is much stronger, reaching 100–150 mol km−2 h−1. The domain-wide average of anthropogenic and biogenic emissions of non-methane VOCs is 5.2 vs. 18.9 mol km−2 h−1, respectively. This means that VOCs have a roughly 3 × larger biogenic source over the area compared to anthropogenic ones during the summers in the examined decade; however, they have, of course, a substantially different spatial distribution.
The BVOC emissions originating from cities were calculated by masking out the total biogenic emission fields with the individual cities' administrative boundaries, based on shapefiles provided by GADM public database (https://gadm.org, last access: 8 May 2024). As the resolution of the MEGAN inputs (LAI and PFT), as well as the output resolution, were approximately the same and relatively coarse (around 0.1°, which is about 10 km in central Europe), this was the only possible method for an estimate of the urban portion of the BVOC emissions. However, we admit that the urban BVOC emissions can be higher or lower, depending on the exact distribution of the vegetation in and around cities. Therefore this study also contains sensitivity experiments aiming to evaluate the uncertainty in the results to the magnitude of the urban portion of the BVOC emissions (see below). The resulting BVOC emissions from urban vegetation are depicted in the right panel of the figures, and this shows that these emission are usually below 20 mol km−2 h−1; however, for some cities, there are model grid boxes with emissions up to 60 mol km−2 h−1. On the other hand, grid boxes that match the inner part of cities can exhibit almost zero BVOC emissions (like in the case of Berlin, Prague, or Budapest), creating a ring-like emission pattern.
As the modeled BVOC fluxes are dependent on the meteorology supplied, and this meteorology is marked with some biases, we also compared the modeled emission fluxes with emissions that were driven with more accurate meteorological data. For this purpose, the CAMS-GLOB-BIO3.1 data from the Copernicus Atmosphere Monitoring Service (Sindelarova et al., 2022) were chosen. These data are provided at 0.25° × 0.25° resolution, so they are somewhat comparable to our resolution, and they are driven by the ERA5 reanalysis. The results are depicted in Fig. 2. Both sets of emission data (those from MEGAN and from CAMS) lie between 0 and 40 mol km−2 h−1, but the CAMS fluxes are usually smaller. Over central Europe, CAMS fluxes often reach only 0.5–2 mol km−2 h−1, while, at the same locations, our emissions are around 5–10 mol km−2 h−1. On the other hand, over southern Europe, the isoprene emission peaks are similar in magnitude and have a similar geographic distribution (southern France, Italy, and the Balkans). The reason for these differences is probably due to the fact that version 3.1 of these data incorporated updated region-specific emission factors for different plants instead of using the default MEGAN emission factors (used in CAMS-GLOB-BIO2.1, as well as in our study), and this resulted in lower emissions over Europe compared to the default emission factors used in our setup (see the difference between versions 2.1 and 3.1 in the aforementioned study). Moreover, CAMS-GLOB-BIO3.1 was calculated based on ERA5, while the earlier version of CAMS-GLOB-BIO2.1, as well as WRF, were driven by ERA-Interim. Karlický et al. (2018), who used WRF driven by ERA-Interim over the same domain (and resolution) and with a similar set of parameterizations, showed some overestimation of near-surface temperatures in central Europe, which is connected to the overall positive bias in ERA-Interim temperatures. Consequently, we can expect that the temperatures in our simulations are also higher than they would have been if using ERA5. Lower temperatures in ERA5 thus also add to the difference between our BVOC fluxes and the ones in CAMS-GLOB-BIO3.1.
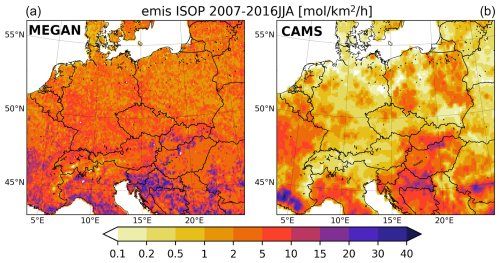
Figure 2Comparison of the 2007–2016 JJA average emissions of isoprene from biogenic sources from the MEGAN model (a) and from the CAMS global biogenic emission data (CAMS-GLOB-BIO; (b)) (in mol km−2 h−1).
In summary, these results indicate that our emission fluxes might be somewhat overestimated over the central part of the domain, which probably means that the effects on ozone are overestimated as well.
2.3 Model simulations
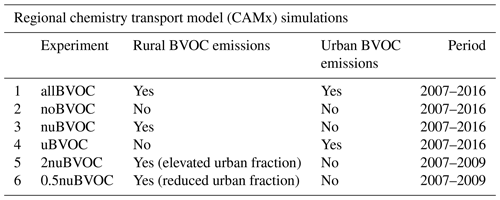
Multiple model experiments (simulations) were made by CAMx, depending on whether all BVOC emissions or only the urban/nonurban fractions of them were accounted for. The list of simulations is presented in Table 1. Note that each of these CAMx simulations was driven by the same WRF simulation; i.e., no differences between the driving meteorology between the individual simulations were present (the same WRF outputs were also used to drive the CAMx model in Liaskoni et al., 2023; Karlický et al., 2024). In the first simulation denoted “allBVOC”, all BVOC emissions were considered, i.e., those from rural and natural areas, as well as those originating from urban vegetation. In the “noBVOC” simulation, BVOC emissions were removed from the entire domain. For partitioning between the effect of the urban portion of BVOC emissions, we performed a further simulation in which all BVOC emissions were considered, except those originating from the six selected cities (called “nuBVOC” as only “nonurban” BVOCs are considered), and a simulation in which only the urban portion of the BVOC emissions is considered (“uBVOC”). To assess the sensitivity of the results to the number of urban BVOC emissions (i.e., the way the urban and rural fraction of the BVOC emissions is calculated), we performed two additional simulations, namely “2nuBVOC” and “0.5nuBVOC”, where the fraction of the BVOC emissions falling within the boundaries of the urban area is 2 × larger and half of the original fraction, respectively. These sensitivity simulations were carried out only over a 3-year-long period from 2007 to 2009.
3.1 Model validation
A comparison with both rural and urban air base station measurements for ozone and its precursor NO2 has been performed in order to assess CAMx's ability to capture the long-term monthly and daily variability in these pollutants. For ozone, 117 rural stations were used in total, while for each of the six selected cities, we chose all urban and suburban background stations that lie within the city (resulting in two to five stations per city). For NO2, we used stations from the previous selection that also contain this pollutant (to maintain consistency between the validation results for ozone and nitrogen dioxide). The model validation over rural stations aims to show the overall model performance in describing regional-scale concentrations, while the urban comparison serves to evaluate the model strengths and weaknesses over individual urban areas which logically have a different ozone regime (towards a VOC-limited one compared to the rural NOx-limited one). The complete list of the stations used is provided in the Supplement.
In Fig. 4, the annual cycle of the monthly means and the summer average diurnal variation for rural stations is shown, while we averaged over all stations (the corresponding standard deviation is shown too). The annual cycle is overestimated during almost all months, with the best match in winter. In summer, model values are overestimated by up to 15 µg m−3. The summer diurnal cycle shows that while the daily maxima are overestimated only slightly (by 5 µg m−3), the nighttime values are higher in CAMx by almost 20 µg m−3. This means that the overestimated nighttime ozone is probably the main cause of the summer overestimation of monthly means.
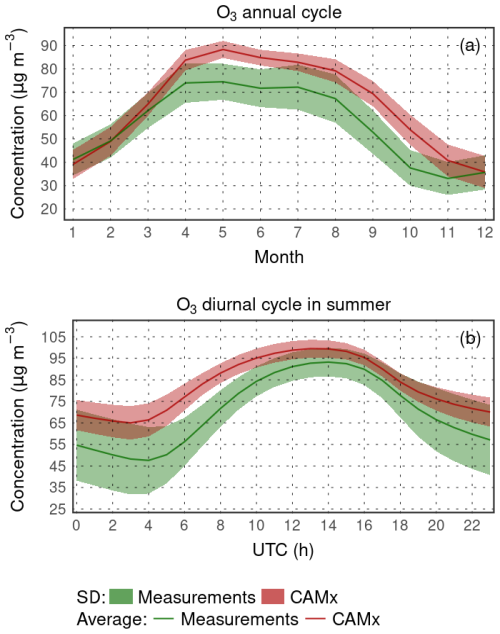
Figure 4Comparison of modeled surface ozone concentrations with rural background stations for the annual cycle of the average monthly means (a) and average JJA diurnal cycle (b) (in µg m−3).
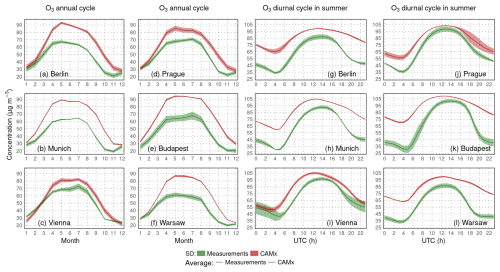
Figure 5Comparison of modeled surface ozone concentrations with urban background stations from six selected cities for the annual cycle of the average monthly means (a–f) and average JJA diurnal cycle (g–l) (in µg m−3).
Over urban areas (Fig. 5), the summer overestimation is even larger, reaching 20 µg m−3, while the nighttime ozone values are higher in model by more than 30–40 µg m−3. Moreover, over cities, the ozone daily maxima are also overestimated (by around 5–10 µg m−3), while the maxima are often reached a bit earlier than in the measured values.
The annual cycle of NO2 monthly means (Fig. 6a) shows a systematic underestimation by 2–3 µg m−3, while the largest occurs during January to April (up to 4 µg m−3). The overall shape of the annual cycle is, however, captured very well. The measured summer diurnal cycle (Fig. 6b) shows two maxima during the morning and evening hours, corresponding to morning and evening rush hours. These are somewhat captured in CAMx too, but the concentrations are underestimated, while the largest negative bias occurs between 08:00 and 12:00 LT (local time) (2–3 µg m−3).
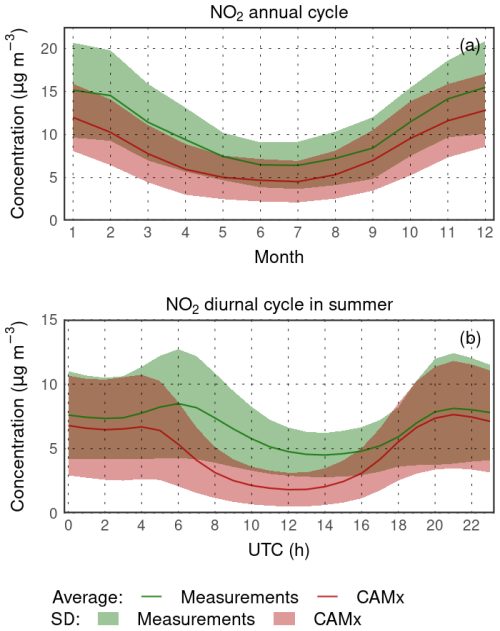
Figure 6Comparison of modeled surface NO2 concentrations with rural background stations for the annual cycle of the average monthly means (a) and average JJA diurnal cycle (b) (in µg m−3).
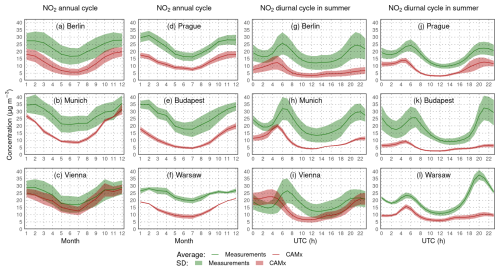
Figure 7Comparison of modeled surface NO2 concentrations with urban background stations from six selected cities for the annual cycle of the average monthly means (a–f) and average JJA diurnal cycle (g–l) (in µg m−3).
The underestimation of nitrogen dioxide is even larger over urban areas, but the magnitude is different across different cities. As monthly averages (Fig. 7; left), the negative bias ranges from 5 µg m−3 for Vienna to some 10–15 µg m−3 seen over Budapest, while it is usually larger during the cold season. The summer diurnal cycles show that the model has a tendency to predict the two measured NO2 maxima; however, their modeled timing is often not well captured (occurs a bit earlier) or the evening maximum is not present at all (over Berlin, Budapest, or Warsaw). Additionally, the underestimation is large and often exceeds 30 µg m−3 (but is usually around 10 µg m−3).
3.2 The impact of all BVOC emissions
The spatial and temporal distribution of the impact of all BVOC emissions on ozone, formaldehyde, and the hydroxyl radical is presented in this section as the difference between the allBVOC and noBVOC experiments (see Table 1). In the case of ozone and formaldehyde, the relative plots denote the relative contribution of BVOC emissions to the total concentrations that are calculated as (allBVOC − noBVOC) allBVOC × 100 %. For OH, the relative changes are calculated after introducing BVOC emissions, i.e., as (allBVOC − noBVOC) noBVOC × 100 %.
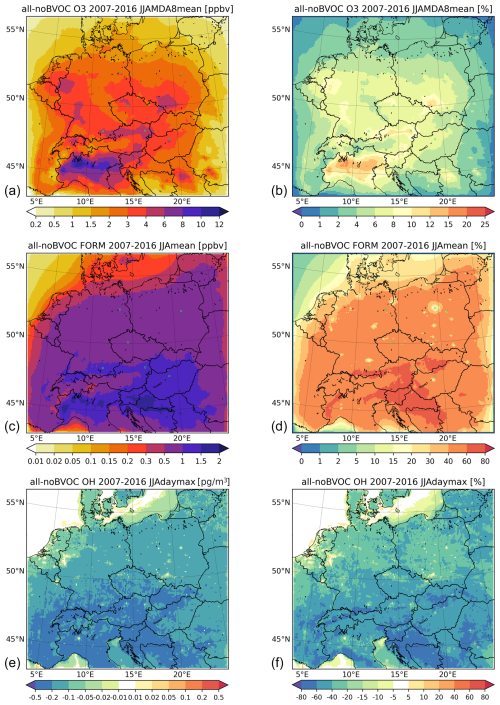
Figure 8The average 2007–2016 JJA impact of all BVOC emissions on the maximum daily 8 h ozone (MDA8; (a, b)), daily mean formaldehyde, and daily max hydroxyl radical near-surface concentrations (in ppbv) for O3 and HCHO (FORM in figure titles) and (in pg m−3) (10−6 µg m−3) for OH. Panels (a), (c), and (e) show the absolute impact. Panels (b), (d), and (f) show the relative contribution in percent.
The impact on 2007–2016 summer (JJA) average MDA8 ozone is presented in the upper row of Fig. 8, and it shows that ozone increases by 2–4 ppbv (6 %–10 % relative contribution) over large areas in central Europe, with maxima over urbanized areas exceeding 6 ppbv (10 %–12 %), while the highest impact is modeled over northern Italy and exceeds 12 ppbv (15 %–20 %).
We also plot, in the same figure (Fig. 8), the main oxidation product of BVOCs, namely formaldehyde, to see how it is increased due to this natural VOC source. The average JJA HCHO usually increases by 0.5–1 ppbv, which is around 40 %–60 % in the relative contribution, showing a substantial increase due to biogenic emissions. Over urban areas, however, the relative contribution is smaller due to the large anthropogenic VOC source over cities. The highest HCHO increases are modeled over the southern part of the domain, aligning with the largest BVOC emissions reaching 1–2 ppbv or 60 %–80 % in relative numbers.
Finally, as the hydroxyl radical is a key oxidant that is modulated by the presence of VOCs, it is also desirable to plot the impact of BVOC emissions on OH concentrations. Here, we are interested in the daytime OH values, so the impact on the JJA average daily maxima is plotted. Due to BVOC emissions, OH decreases over most of the domain by around 0.1–0.5 pg m−3 (20 %–40 %), while the decrease over urban areas is smaller or some increases are even modeled over cities. Over areas without BVOC emissions (sea), however, OH increases by around 0.01–0.02 pg m−3 (2 %–5 %).
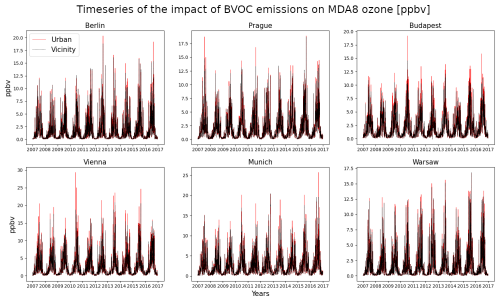
Figure 9The 2007–2016 time series of the BVOC impact of MDA8 ozone for the centers and vicinities of six selected cities (in ppbv).
Apart from the average impacts for summer, we also plot the day-by-day evolution of the impact on MDA8 ozone for six selected urban areas over central Europe (Berlin, Budapest, Munich, Prague, Vienna, and Warsaw) in Fig. 9. We also included the results for the vicinities of these cities to evaluate the difference in impact over urban centers with high-NOx environment vs. urban surroundings, where the NOx VOC ratio is much lower, leading to a potentially smaller BVOC impact. The plot shows that, as expected, the winter impacts are small, barely exceeding 1 ppbv. The JJA impacts are, on the other hand, usually above 5 ppbv, but extreme values in selected years can exceed 15 ppbv (especially for Berlin and Vienna, where it is exceeded at least once each year). It is also seen that the impact over urban surroundings is somewhat smaller, with maximum impacts lower by 2–3 ppbv compared to the maximum impacts over city centers.
Additionally, in the Supplement, we present the spatial impacts also calculated for individual simulated year. This also helps to reveal the inter-annual variability in the impacts (see Figs. S1–S6 in the Supplement).
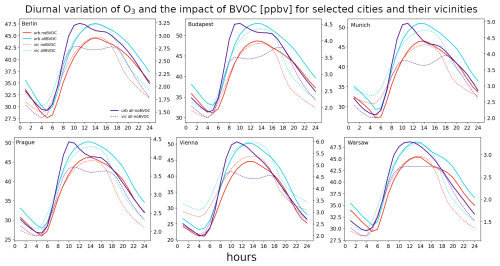
Figure 10The average 2007–2016 JJA diurnal cycle of near-surface O3 for six city centers (bold) and their vicinities (dashed) for the noBVOC (red) and allBVOC cases (cyan). The right y axis corresponds to the impact of BVOC emissions (allBVOC–noBVOC; violet). Cities are Berlin, Budapest, Munich, Prague, Vienna, and Warsaw (units in ppbv).
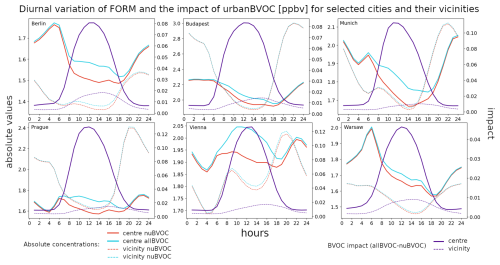
We also plot the diurnal cycle of the BVOC impact on the three analyzed species to analyze the variation in the BVOC role during different parts of the day. Figure 10 presents the results for the six cities and their vicinities, along with the absolute ozone concentrations. The diurnal variation in ozone values has the expected shape, with minima around sunrise and maxima during early afternoon, with values in the cities between 25–30 and 45–50 ppbv for the minimum and maximum values, respectively. Over the city surroundings, the corresponding values are slightly lower during afternoon and evening hours (by around 5 ppbv). The impact of BVOCs has a well-described shape during the day, with minimum values aligned with the minima of the absolute ones (around 1.5–2.5 ppbv). During the morning hours, there is a rapid increase in the impact reaching the maxima around noon (up to 4–5 ppbv), and this exhibits a slower decrease during afternoon and evening time. There is an indication for a small secondary maxima (for some cities) during late afternoon which might be caused by elevated emissions of NOx during this part of the day (afternoon rush hour). The impact of BVOCs over the city surroundings has a slightly different shape, with minima occurring around the same time as over city centers with similar values. However, the maxima are lower by around 1 ppbv.
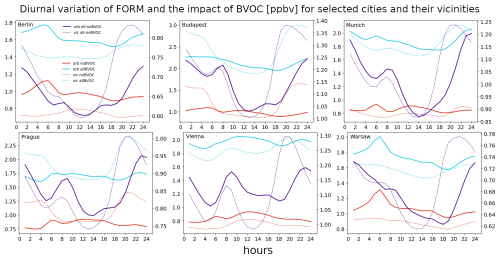
Analogous to O3, Fig. 11 depicts the diurnal cycles for formaldehyde. The absolute HCHO concentrations show a rather uniform pattern during the day with values around 1.5–2.5 ppbv for all city centers, while over city surroundings, the values are usually lower during the daytime. For nighttime, the values can be higher than city center values for some cities (Budapest, Prague, and partly Munich too) but are usually lower owing to smaller VOC emissions compared to city centers that decompose into formaldehyde. The impact of BVOC emissions has a double-peak pattern, with the highest values during nighttime reaching 0.7–1.2 ppbv, while the lowest values usually occur during the early afternoon (0.6–1 ppbv). A secondary maximum of the BVOC impact is visible in Budapest, Munich, Prague, and (to a smaller extent) Berlin during morning hours, reaching 0.6–1.2 ppbv. Over the urban vicinities, the impact of BVOCs on HCHO is slightly lower during the day compared to the impact over city centers, but it is about 0.1–0.2 ppbv higher during the evening hours.
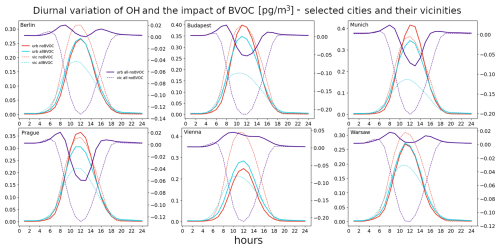
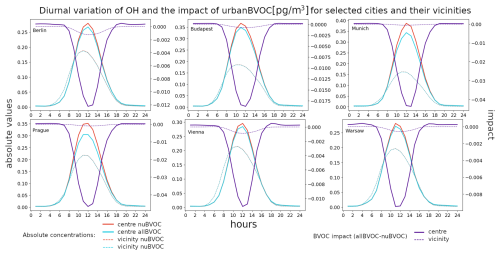
Finally, the diurnal variation in the absolute urban OH concentration and the impacts of BVOC emissions are plotted in Fig. 12. The absolute OH concentrations have the well-known diurnal pattern with very low residual values during the night and a strong peak during noon when solar insolation is at maximum. The maxima over urban centers reach about 0.25–0.35 pg m−3, while the maxima over city surroundings are somewhat lower at around 0.2 pg m−3. The impact of BVOC emissions is substantially different between the city centers and their vicinities. While there is a strong decrease over the vicinities during the day that peaks at around −0.1 to −0.2 pg m−3, over urban centers, there is first a slight increase during morning hours that turns to a decrease during noon and to an increase again during evening hours. However, in some cities (Vienna and Warsaw) the decrease in the impact during noon does not lead to negative values.
3.3 The impact of urban BVOC emissions
The partial impact of BVOC emissions from vegetation within the selected urban areas is plotted in Fig. 13. The impact is calculated as the difference in allBVOC and nuBVOC simulations, and the domain is enlarged to show the six cities (i.e., not showing the entire domain). Alternatively, we also calculated the impact of urban BVOCs as the difference in the simulations of uBVOC and noBVOC in Fig. 14. Thus, the impact is calculated with respect to two reference states, where the first one considers all BVOC emissions except for those in cities, while the second one considers no BVOC emissions at all (at least within the computational domain).
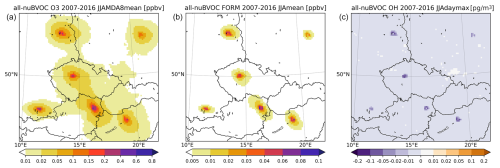
Figure 13The impact of urban BVOC emissions (calculated as allBVOC–nuBVOC) on the MDA8 ozone (a), daily mean HCHO (b), and maximum daily OH (c) averaged over 2007–2016 JJA. The plot is enlarged to show the cities analyzed (units are ppbv for ozone and FORM and pg m−3 (10−6 µg m−3) for OH).
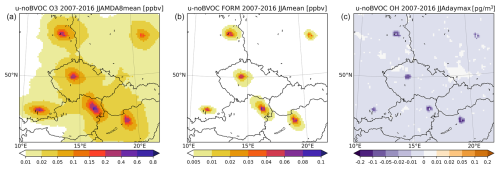
Figure 14The impact of urban BVOC emissions (calculated alternatively as uBVOC–noBVOC) on the MDA8 ozone (a), daily mean FORM (b), and maximum daily OH (c) averaged over 2007–2016 JJA. The plot is enlarged to show the cities analyzed (units are ppbv for ozone and FORM and pg m−3 (10−6 µg m−3) for OH).
The impact of urban BVOCs on ozone is a clear increase up to 0.6 ppbv over city centers, while a few tens of kilometers away from cities the impact reduces below 0.1 ppbv. HCHO increases due to urban BVOCs by about 0.08 ppbv, with maximum values often found at the edges of the cities which already have large vegetation cover and still belong to the city outskirts. This ring-like feature (seen in the emission plots) is also seen for OH, which decreases due to urban BVOCs by around 0.1–0.2 pg m−3. If the impact of urban BVOCs is calculated from the noBVOC background reference, it is clearly larger. The O3 increases reach 0.8 ppbv, and the diameter of the 0.1 ppbv increase around cities is larger. A larger impact is also seen for HCHO, where the increase reaches or even exceeds 0.1 ppbv. Finally, OH also decreases to a larger extent, reaching −0.2 pg m−3. This clearly shows the importance of the choice of a reference state towards which the impact is calculated.
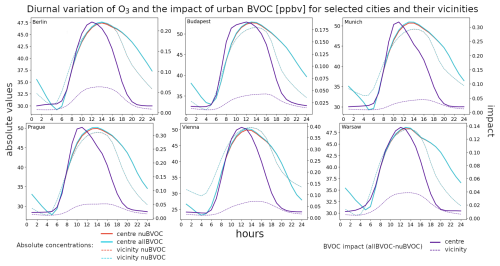
Figure 15The average 2007–2016 JJA diurnal cycle of near-surface O3 for six city centers (bold) and their vicinities (dashed) for the nuBVOC (red) and allBVOC cases (cyan). The right y axis corresponds to the impact of urban BVOC emissions (allBVOC–nuBVOC; violet). Cities are Berlin, Budapest, Munich, Prague, Vienna, and Warsaw (with units in ppbv).
In a similar fashion, as for the impact of all BVOC emissions, we plot the diurnal cycle of the impact of urban BVOCs in Figs. 15–17 for O3, HCHO, and the OH radical, respectively. We also plot the absolute values for the allBVOC and nuBVOC cases.
The impact of urban BVOCs on ozone over city centers has a distinct diurnal cycle with minimum values overnight up to 0.02 ppbv, while the maxima occur around noon and reach 0.1 to 0.4 ppbv, depending on the city (maximum for Vienna). Unlike the impact of all BVOCs, this impact has only one peak, which is much narrower than in the former case. The impact over the vicinities is (as expected) much smaller, reaching around 0.05 ppbv, with the peak occurring a few hours later than the peak over centers.
For formaldehyde, the urban BVOC impact has a very similar shape to ozone, with the maximum impact in city centers occurring at around noon and reaching 0.08 to 0.13 ppbv (highest for Prague), with the nighttime impact often below 0.01 ppbv. Over the city vicinities, the impact remains very small, peaking at around 0.01–0.02 ppbv during noon.
Finally, the impact of urban BVOCs on OH over urban centers has a distinct negative peak occurring during noon. It usually reaches −0.01 to −0.02 pg m−3, with a maximum decreases over Munich and Prague reaching −0.04 pg m−3. The impact over the vicinities is almost negligible, with a small peak around noon too.
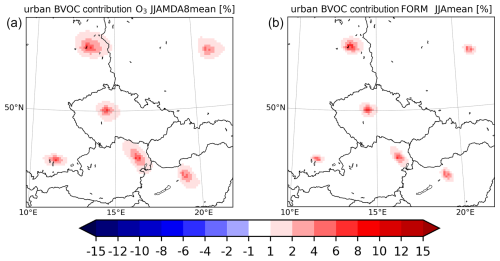
Figure 18The relative contribution of the impact of urban BVOC emissions to the total impact in percent for the MDA8 ozone (a) and daily mean HCHO (b) averaged over 2007–2016 JJA. The plot is enlarged to show the cities analyzed.
The quantification of the magnitude of the partial impact of urban BVOCs allows us to calculate their relative contribution to the impact of all BVOCs. This was calculated for ozone and formaldehyde and plotted in Fig. 18. OH was omitted from this figure, as the impact of all BVOCs is positive, while the impact of the urban vegetation is negative.
For ozone, urban BVOCs have a contribution to the total impact over city centers up to 8 %–10 % (highest share over Vienna and Berlin). In the case of HCHO, the contribution has a similar magnitude peaking at 8 %–10 %. For OH, we cannot clearly define its “contribution” to the total OH changes; however, comparing the positive impact of all BVOCs to the negative impact of urban BVOCs, these are very similar in absolute numbers. This indicates that if one considers only the urban vegetation, the impact can be qualitatively totally different from the impact of considering all vegetation (i.e., also from those above rural areas).
3.4 Impact on hydroxyl and peroxide radicals (OH, HO2, and RO2)
Given their importance in urban (but also rural) tropospheric chemistry and the atmospheric oxidation of VOCs including ozone formation, as well as facilitating the interpretation of the modeled impacts on ozone and formaldehyde, we further present the impact of BVOC emissions on peroxide radicals (HO2 and higher RO2). For completeness, we also included the impact on average OH (besides the impact on daily maximum OH presented above) to account for the whole HOx family.
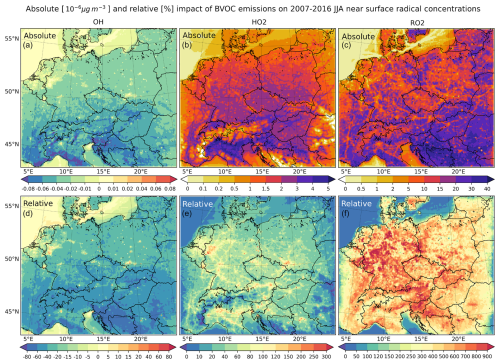
Figure 19The absolute (a–c) and relative (d–f) impact of all BVOC emissions on the near-surface concentrations of OH (a, d), HO2 (b, e), and RO2 (c, f) averaged over 2007–2016 JJA (units are pg m−3 (10−6 µg m−3) or % for the relative impact).
Figure 19 shows that the impact on absolute OH is about −0.02 to −0.08 pg m−3 over large regions, with the largest decreases over the southern parts of the domain reaching −0.1 pg m−3. This means that the decrease in the average values is about one-third of the decrease in the daily maximum ones. Over urban areas (similar to daily maximum values), concentrations tend to increase due to BVOCs by up to 0.02–0.04 pg m−3. In relative numbers, OH decreases by about 20 %–60 %, reaching 80 % over southern parts of the domain. Over cities, the increase is about 10 %.
The hydroperoxyl radical shows a clear increase due to BVOC emissions above 1 pg m−3 over many areas, with values being the highest over the southern part of the domain, where it reaches 4–5 pg m−3. In relative numbers, this means a 40 %–80 % increase over rural areas; however, over highly polluted regions (mostly urban areas), the increase is over 100 %, reaching as much as 300 %.
Finally, for total peroxy radicals (RO2), we modeled a 10–40 pg m−3 increase over rural areas (especially over the southern part of the domain), while the increase over urban areas is smaller, usually below 10–15 pg m−3. In relative numbers, the RO2 increase over rural areas due to BVOC emissions is remarkable, reaching 600 %–900 %, while over urban areas, this is about 200 %–300 %, confirming that BVOCs are a dominant source for RO2.
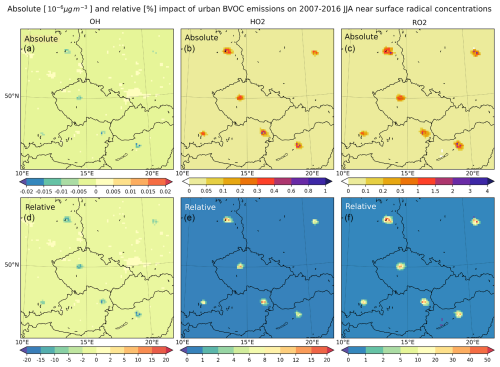
Figure 20The absolute (a–c) and relative (d–f) impact of urban BVOC emissions on the near-surface concentrations of OH (a, d), HO2 (b, e), and RO2 (c, f) averaged over 2007–2016 JJA (units are in pg m−3 (10−6 µg m−3) or % for the relative impact). The plot is enlarged to show the cities analyzed.
Focusing on urban BVOC emissions only, in Fig. 20 we see that the average summer OH is reduced by up to 0.02 pg m−3, representing a decrease of about −10 % to −20 %. In the case of HO2, it increases due to urban BVOCs by up to about 0.3–0.6 pg m−3, with peaks up to 1 pg m−3, making an increase of about 10 %–20 %. For the total peroxy radical concentrations, the increase is about 0.5–1 pg m−3 (up to 4 pg m−3) over the selected cities, meaning an increase of about 10 %–30 % (up to 40 %–50 % for Berlin).
3.5 Sensitivity to urban fraction of BVOC emissions
As already mentioned, the partition between urban and rural BVOC emissions was based on calculating the fraction of the grid cell that lies within the given city boundaries. This, however, brings some degree of uncertainty to the results as the distribution of vegetation within the given grid cell is usually not uniform. Here we assess this uncertainty by conducting further experiments with reducing/increasing the fraction of BVOC emissions that lie within or outside of the urban area. As already mentioned in Sect. 2, we took (1) a case for which only half of the urban fraction of grid cell area is considered and (2) a case for which the urban fraction of grid cell area is 2 × as large (upper-bounded by the grid cell total area itself). Of course, if a grid cell is entirely within the urban boundaries, 100 % of the BVOC emissions are considered urban. Figure 21 shows how the modified urban BVOC emissions differ from the default case in relative numbers. As expected, emissions are either reduced by around 50 %, with a smaller reduction near city edges and a larger one near centers, while in the second case, the emissions are almost twice as large as in the default case.
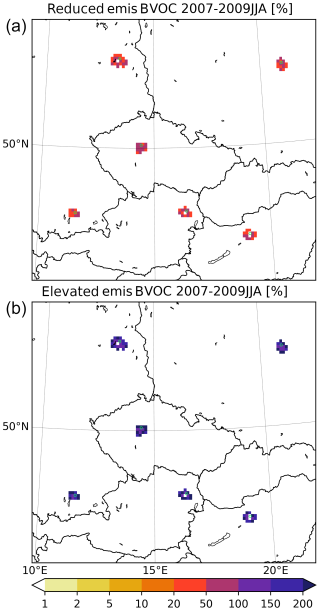
Figure 21The urban BVOC emissions used in the 0.5nuBVOC (a) and 2nuBVOC (b) experiments relative to the default urban emission fluxes seen in Fig. 1 (units in %).
Figure 22 shows that, under the reduced urban fraction of BVOC emissions, the impact on MDA8 ozone over city centers reduces to around 0.1–0.2 ppbv, while if the opposite is considered, the impact reaches 0.8 ppbv. In other words, it is roughly half or twice as large than in the default case, showing the strong sensitivity of ozone production to the amount of urban BVOCs. For HCHO (Fig. 23), the situation is similar. While at reduced urban BVOCs the impact is at around 0.02-0.04 ppbv over city centers, in the doubled urban BVOC case, the impact reaches 0.08–0.1 ppbv. These numbers represent, again, half and twice those in the default case, respectively. For the impact on the OH radical (Fig. 24), reduced urban BVOC emissions result in a negative impact smaller than 0.02 pg m−3 (usually even smaller than 0.01 pg m−3) in absolute numbers, while for the increased urban fraction of these emissions, the impact is much higher, reaching −0.2 pg m−3, which is more than double the default impact of urban BVOCs.
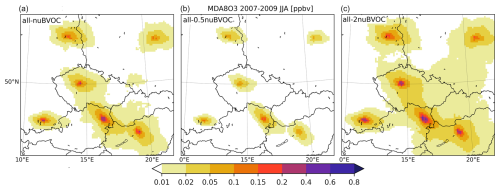
Figure 22The sensitivity of MDA8 ozone on the number of urban BVOC emissions (in ppbv) for the default situation (allBVOC–nuBVOC; (a)) and the modified urban fraction of the BVOC emissions (allBVOC–0.5nuBVOC, (b); allBVOC–2nuBVOC, (c)) averaged over 2007–2009 JJA. The plot is enlarged to show the cities analyzed.
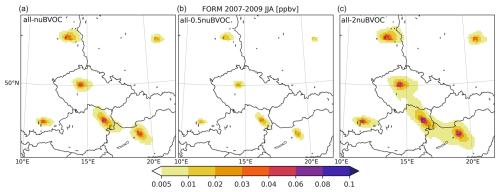
Figure 23Same as Fig. 22 but for formaldehyde.
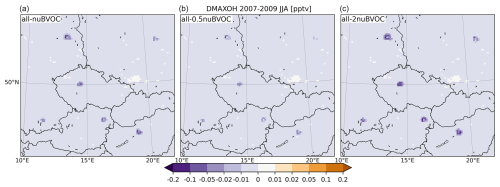
Figure 24Same as Fig. 22 but for OH (in pg m−3 (10−6 µg m−3)).
The study evaluated the present-day impact of emissions of biogenic volatile organic compounds on near-surface concentrations of ozone and formaldehyde, as well as on the oxidative capacity of the atmosphere in terms of hydroxyl and peroxy radical concentrations.
The comparison with surface measurements performed for ozone showed some distinct patterns in model biases that include (i) the overestimation of spring-to-autumn average ozone values and (ii) a large overestimation of summer nighttime ozone concentrations and a smaller overestimation of summer daily ozone maxima, especially over cities. Regarding the first bias pattern (an overestimation over rural areas up to 20 µg m−3, while it is up to 30 µg m−3 over cities), similar positive model bias was encountered earlier by Huszar et al. (2020a) for the same region for urban and rural stations, and they found that it occurs at all used horizontal resolutions (3, 9, or 27 km). Later, Huszar et al. (2020b) confirmed this bias too. It is probably caused mainly by the large nighttime overestimation of ozone, while the daytime values are captured more accurately. This behavior was seen in many previous and similarly oriented studies (e.g., Karlicky et al., 2017; Huszar et al., 2018; Otero et al., 2018) or recently in de la Paz et al. (2024) and is caused probably by inaccurate vertical mixing in the nocturnal boundary layer, as pointed out by Zanis et al. (2011), although the nocturnal ozone chemistry (CB6 in our case) is marked with deficiencies too (Im et al., 2015). It is thus clear that more emphasis should be made on improving the modeling of nighttime ozone to get a more reasonable starting point for the daytime ozone formation (Wong and Stutz, 2010). Another feature seen is the higher daily ozone maxima during summer in model compared to observations, especially over cities. Urban centers are affected by a high rate of titration due to concentrated NOx emissions. When the coarse resolution is used as in this study, then these concentrated city center emissions are not resolved, and they are instead diluted to the model grid, so the increase in the NOx concentration is not high enough for the first-order ozone titration; instead, it efficiently causes ozone production (Markakis et al., 2015). This behavior was recently seen in Zhu et al. (2024), where the daily urban ozone maxima were often overestimated for the mentioned reason. The conclusions above are also well supported by the NO2 model biases encountered. In our simulations, and especially over cities, nitrogen dioxide is strongly underestimated, which is probably connected to the instant dilution of emissions into the model grid box (of 9 km × 9 km size), as well as the overestimated vertical eddy diffusion which removes too much NOx from the lowermost model layer (Huszar et al., 2020a). However, this means ozone removal by titration (as stated above).
We modeled on average an increase of about 6–8 ppbv (up to 12 ppbv over southern Europe) in the near-surface ozone due to all BVOC emissions. This is in line with previous chemistry transport model studies applied over Europe (Thunis and Cuvelier, 2000; Curci et al., 2009; Richards et al., 2013). For example, Hodnebrog et al. (2012) found a peak impact of BVOC on ozone up to 10 ppbv over the Mediterranean, which corresponds well to our results. Moreover, we found that the highest impacts are often over regions with high-NOx pollution (Po Valley, western Germany, southern Poland, etc.), which is also reasonable, as these areas are VOC-limited; i.e., any addition of VOCs (of any origin, namely natural or anthropogenic) results in efficient ozone formation (Li et al., 2018; Gao et al., 2022a).
We have also seen that due to BVOC emissions, formaldehyde concentrations significantly increased (contributing by up to 40 %–60 %) with smaller increases in cities. This is in line with the fact that HCHO is the main product of the oxidation of most of the hydrocarbons, including those of biogenic origin (Luecken et al., 2012; Kaiser et al., 2015; Chen et al., 2023). The strong ties between BVOC emissions and HCHO burdens were studied earlier by many, often to infer biogenic emissions from HCHO columns (Dufour et al., 2009; Curci et al., 2010), and our results confirm the expectation. Indeed, the highest increases in formaldehyde are modeled for the southern part of the domain that exhibits the largest emissions. On the other hand, over urban areas with limited biogenic emission sources, the contribution is much smaller. Previously, Bastien et al. (2019) modeled the HCHO contributors and found a relative contribution from biogenic sources of the order of 20 %–40 %, which is a bit smaller than our number of 40 %–60 %. This latter number also corresponds to the fact that (as domain average) BVOC emissions are about 3 times higher during summer compared to anthropogenic ones, while it has to be kept in mind that not all VOCs are oxidized to formaldehyde with the same efficiency. Therefore, we cannot assume that the relative contribution to HCHO of a particular VOC source category (biogenic in this case) will equal to the relative contribution of the source to the total VOC emissions.
For the hydroxyl radical, large areas exhibited a decrease in the daily maxima, while over cities and oceans, increases were modeled due to BVOC emissions. As OH is one of the main oxidants of BVOCs (Kelly et al., 2018) (besides the nitrate radical and ozone), it is clear that introducing BVOCs adds a new sink to OH, making OH daytime concentrations lower, while not all OH is recycled. This apparently outweighs the additional OH production from ozone (via the atomic oxygen O1D and water vapor) or from the ozonolysis of BVOCs via Criegee intermediate decay (Seinfeld and Pandis, 2016). On the other hand, this later process is probably the reason for some increases in OH over urban areas. Over them, the BVOC emissions are very small, while the ozone increases were large, causing OH increases due to the direct production from atomic oxygen. Moreover, as already mentioned in Sect. 1, the ozonolysis of BVOCs (as well as of alkenes in general) leads to Criegee intermediate production which further decomposes, thus yielding additional OH. Averaged over day and night, this may exceed the OH yields from ozone photolysis (Johnson and Marston, 2008).
As for the diurnal variation in the above-presented impact in and around cities, it has a very distinct pattern for each of the three chemicals. For ozone, the impact follows more or less the absolute values as a result of the photochemical activity being the strongest during noon. However, the maximum impact occurs sooner than noon, indicating that maybe the maximum of the NO2 production from reaction of NO and peroxy radicals is playing a role here. This, besides RO2, is influenced by the available NO, which gets lower towards noon due to decrease in emissions after the morning peak. There is also an indication of an early evening peak for ozone formation due to BVOCs, which again might be connected to increased NOx emissions during evening rush hours. Over urban vicinities, the peak impact is smaller, which is a natural result of lower NOx emissions limiting the NO2 formation due to a reaction with peroxy radicals (Seinfeld and Pandis, 2016).
The impact on formaldehyde over urban centers has a more complicated diurnal cycle, often with two minima occurring during morning and late-afternoon hours and maximum values during evening. To explain this behavior, we have to understand the sinks and the sources of this chemical. The production of HCHO during daytime is mainly by the oxidation of VOCs due to OH, which is largest when both OH and VOC peak (e.g., Wu et al., 2023; Geo et al., 2023). This would imply a maximum impact of BVOCs during daytime. However, BVOCs can also be oxidized by ozone and nitrate radicals, which form the main mechanism during nighttime and low solar insolation (and also low OH), so HCHO is produced during nighttime too. There is, however, a strong sink for HCHO during the daytime in both the reaction with OH and photolysis, which is even more important than the reaction with OH during the day (Possanzini et al., 2002; Seinfeld and Pandis, 2016). During nighttime, the additional HCHO produced from BVOCs has thus a suppressed sink, leading to higher impact over the night than during the day. The impact over vicinities is even higher, which is a clear consequence of higher BVOC emissions, but the suppressed reactions forming peroxyacetyl nitrates (PANs) due to smaller NOx concentrations can play a role too.
In the case of OH, the diurnal pattern of the BVOC impact over city vicinities shows a clear decrease during noon, which is in line with the expectation that OH is consumed by the oxidation of BVOCs. However, over city centers, the pattern indicates that two competing process take place; the first is the already mentioned OH decrease due to the oxidation of BVOCs. However, the impact on OH first shows some increase before this decrease occurs. Here the fact that extra OH is produced from the BVOC-induced ozone via atomic oxygen (O1D), as well as from the ozonolysis of BVOCs and depending on the counteractions between this production and the loss due to BVOC oxidation, probably determines whether the average impact on OH will be negative or positive.
We showed that the hydroperoxide radical is increased due to BVOCs by more than 200 %, and this increase is larger over cities. This is due to the fact that absolute HO2 concentrations are much smaller over cities or over areas with a high-NOx source due to the reaction with NO. This in turn caused a large relative importance of BVOC emissions over such areas in terms of HO2 production. On the other hand, the total RO2 produced is highest in relative numbers (but also absolute numbers) over rural areas, which is probably connected to the simple fact that RO2 is largely composed of peroxides originating from BVOC oxidation yielding a high relative impact over areas with high-BVOC emissions. Or, in other words, most of the RO2 mass comes from BVOC oxidation. In both cases (HO2 or the total peroxides), however, the increases clearly explain the impact on ozone, as more NO can be oxidized to NO2 by a reaction with peroxy radicals.
Our analysis showed that the urban BVOC emissions alone act rather locally and cause an increase in urban ozone by less than 1 ppbv (usually a few 0.1 ppbv). One of the very important results of this study is that the urban fraction of BVOC emissions contributed to the total impact of all BVOCs by around 10 %. In the case of HCHO, the urban BVOC-induced changes are of the order of less then 0.1 ppbv, making this again a contribution of about 10 % to the total HCHO increases due to all BVOC emissions.
For OH, urban BVOCs caused a clear decrease, which is a crucial difference compared to the impact of all BVOCs. As already detailed above within the diurnal variation in the impacts, multiple competitive processes act to modulate OH modifications due to BVOC emissions. Evidently, if the isolated effect of urban BVOCs on OH is analyzed, the VOC+OH oxidation dominates over the extra OH produced due to photolysis of increased O3 or from BVOC ozonolysis (via the decay of Criegee intermediates). Also, the diurnal cycle of the impact of urban BVOCs on OH only shows a clear decrease during the day. The impact of urban BVOCs on OH is also very limited to the city outskirts, which means that the local BVOC emissions are important mainly for short-term chemical effects and radicals with a short lifetime (Seinfeld and Pandis, 2016); regarding the effect on chemicals with a longer lifetime, like ozone and formaldehyde, the impact propagates over a larger area (a few tens of kilometers from the city center), as seen in Fig. 13.
We also showed that if the impact of urban BVOCs is calculated from a “clean” reference with no BVOC emissions at all, then the impact is larger. This can be attributed to the fact that the OH radical competes for fewer BVOC molecules when urban BVOCs are emitted into a “BVOC-free” air, making their oxidation more efficient. This consequently leads to more RO2 formed and hence more NO oxidized into NO2, leading to enhanced ozone formation. With more BVOCs oxidized, more OH is removed, leading to larger decreases in OH.
A shortcoming of the study is the way the urban fraction of BVOCs is calculated, i.e., based on the fraction of emitting grid boxes that lie within the urban boundaries. To address the uncertainty arising from this approach, we calculated the impact of urban BVOCs under a decreased and increased urban fraction corresponding to about 50 % and 200 % of the original BVOC emissions. The uncertainty analysis showed that the impact on ozone ranges between about 0.2 to 0.8 ppbv, giving an almost 4-fold difference which corresponds well to the 4 times larger BVOC emissions in the former case. The situation was similar in the case of HCHO and OH too. This means that the impact of the urban fraction of BVOC emissions responds to their magnitude nearly linearly. The accurate quantification of the urban BVOC fluxes is therefore crucial and requires a precise description of the vegetation within the urban built-up environment (Calfapietra et al., 2013).
In summary, our study showed that an ineligible portion of the overall impact of BVOC emissions over central Europe's urban areas is attributable to local BVOC emissions. This is especially true for influencing the oxidative capacity of urban air via OH radicals. However, it also stressed a relatively high uncertainty regarding the quantification of this fraction. Future research should focus on high-resolution model assessments of the impact of local BVOC emissions to reflect the large spatial diversity of the vegetation within the urban areas. We also have to add that overall the BVOC emission fluxes are marked with uncertainty too (not only their “urban” fraction) as was seen from the comparison with available global biogenic emission data. This uncertainty has to be assessed in future research too.
CAMx version 7.20 is available at https://www.camx.com/download/source/ (CAMx, 2022; Ramboll, 2022). WRF version 4.0 can be downloaded from https://www2.mmm.ucar.edu/wrf/src/WRFV4.0.TAR.gz (WRF, 2018). The MEGAN v2.10 code can be obtained from https://bai.ess.uci.edu/megan/data-and-code/megan21 (Guenther et al., 2014), while the FUME emission model used is found at https://doi.org/10.5281/zenodo.10142912 (Belda et al., 2023). The raw CAMx model outputs from all simulations comprise about 20 TB of the 3-dimensional data of the concentrations of the main pollutants and are stored on the authors' storage facilities. These can be obtained upon request to the corresponding author. The extracted hourly near-surface concentrations (which are the basis of the presented analysis) are available from the Czech National Repository at https://doi.org/10.48700/datst.b6as3-v2y27 (Huszar, 2024). The observational data from the air base database can be obtained from https://discomap.eea.europa.eu/map/fme/AirQualityExport.htm (EEA, 2023).
The supplement related to this article is available online at: https://doi.org/10.5194/acp-24-13541-2024-supplement.
ML and PH conceptualized and designed the experiments and wrote the majority of the text. PH conducted the CAMx simulations. JK performed the WRF experiments. ML, LB, and APPP contributed to the analysis of the results. KS helped with processing the biogenic emissions and writing the text.
The contact author has declared that none of the authors has any competing interests.
Publisher's note: Copernicus Publications remains neutral with regard to jurisdictional claims made in the text, published maps, institutional affiliations, or any other geographical representation in this paper. While Copernicus Publications makes every effort to include appropriate place names, the final responsibility lies with the authors.
This work has been supported by the Czech Technological Agency (TACR), the Charles University Grant Agency (GAUK), and partly by Project OP JAK Georisks “Natural and anthropogenic georisks”) and partly by the Horizon Europe (HORIZON). We also acknowledge HPC infrastructure of the Ministry of Education, Youth and Sports of the Czech Republic (e-INFRA CZ, 90254) for providing their resources for calculations. We further acknowledge the TNO-MACC-III emissions dataset provided by the Copernicus Monitoring Service, the compiled air quality station data provided by the European Environmental Agency, and the ERA-Interim reanalysis provided by the European Center for Medium-Range Weather Forecasts.
This research has been supported by the Ministerstvo Školství, Mládeže a Tělovýchovy (grant no. CZ.02.01.01/00/22_008/0004605); the Technology Agency of the Czech Republic (grant no. SS02030031); the HORIZON EUROPE Framework Programme, HORIZON EUROPE Excellent Science (grant no. 101056783); and the Grantová Agentura, Univerzita Karlova (grant no. 298822).
This paper was edited by Carl Percival and reviewed by two anonymous referees.
Aksoyoglu, S., Ciarelli, G., El-Haddad, I., Baltensperger, U., and Prévôt, A. S. H.: Secondary inorganic aerosols in Europe: sources and the significant influence of biogenic VOC emissions, especially on ammonium nitrate, Atmos. Chem. Phys., 17, 7757–7773, https://doi.org/10.5194/acp-17-7757-2017, 2017. a
Archibald, A. T., Cooke, M. C., Utembe, S. R., Shallcross, D. E., Derwent, R. G., and Jenkin, M. E.: Impacts of mechanistic changes on HOx formation and recycling in the oxidation of isoprene, Atmos. Chem. Phys., 10, 8097–8118, https://doi.org/10.5194/acp-10-8097-2010, 2010. a, b
Bartík, L., Huszár, P., Karlický, J., Vlček, O., and Eben, K.: Modeling the drivers of fine PM pollution over Central Europe: impacts and contributions of emissions from different sources, Atmos. Chem. Phys., 24, 4347–4387, https://doi.org/10.5194/acp-24-4347-2024, 2024. a, b
Bastien, L. A. J., Brown, N. J., and Harley, R. A.: Contributions to local- and regional-scale formaldehyde concentrations, Atmos. Chem. Phys., 19, 8363–8381, https://doi.org/10.5194/acp-19-8363-2019, 2019. a
Bates, K. H. and Jacob, D. J.: A new model mechanism for atmospheric oxidation of isoprene: global effects on oxidants, nitrogen oxides, organic products, and secondary organic aerosol, Atmos. Chem. Phys., 19, 9613–9640, https://doi.org/10.5194/acp-19-9613-2019, 2019. a, b
Belda, M., Krč, P., Resler, J., Huszár, P., Benešová, N., Karlický, J., and Juruš, P.: FUME-dev/fume: Official 2.0 release (2.0), Zenodo [code], https://doi.org/10.5281/zenodo.10142912, 2023. a
Belda, M., Benešová, N., Resler, J., Huszár, P., Vlček, O., Krč, P., Karlický, J., Juruš, P., and Eben, K.: FUME 2.0 – Flexible Universal processor for Modeling Emissions, Geosci. Model Dev., 17, 3867–3878, https://doi.org/10.5194/gmd-17-3867-2024, 2024. a
Benešová, N., Belda, M., Eben, K., Geletič, J., Huszár, P., Juruš, P., Krč, P., Resler, J., and Vlček, O.: New open source emission processor for air quality models, in: Proceedings of Abstracts 11th International Conference on Air Quality Science and Application, edited by: Sokhi, R., Tiwari, P. R., Gállego, M. J., Craviotto Arnau, J. M., Castells Guiu, C., and Singh, V., 11th International Conference on Air Quality Science and Application, Barcelona, Spain, 12–16 March 2018, University of Hertfordshire, 27 pp., https://doi.org/10.18745/PB.19829, 2018. a
Bonn, B., von Schneidemesser, E., Butler, T., Churkina, G., Ehlers, C., Grote, R., Klemp, D., Nothard, R., Schäfer, K., von Stülpnagel, A., and Kerschbaumer, A.: Impact of vegetative emissions on urban ozone and biogenic secondary organic aerosol: Box model study for Berlin, Germany, J. Clean. Prod., 176, 827–841, https://doi.org/10.1016/j.jclepro.2017.12.164, 2018. a
Bougeault, P. and Lacarrère, P.: Parameterization of orography-induced turbulence in a meso-beta-scale model, Mon. Weather Rev., 117, 1872–1890, https://doi.org/10.1175/1520-0493(1989)117<1872:POOITI>2.0.CO;2, 1989. a
Buchholz, R. R., Emmons, L. K., Tilmes, S., and The CESM2 Development Team: CESM2.1/CAM-chem Instantaneous Output for Boundary Conditions, UCAR/NCAR – Atmospheric Chemistry Observations and Modeling Laboratory, Subset used Lat: 10 to 80, Lon: −20 to 50, December 2014–January 2017, https://doi.org/10.5065/NMP7-EP60, 2019. a
Byun, D. W., and Ching, J. K. S.: Science Algorithms of the EPA Model-3 Community Multiscale Air Quality (CMAQ) Modeling System, Office of Research and Development, U.S. EPA, North Carolina, EPA/600/R-99/030, 1999. a
Calfapietra, C., Fares, S., Manes, F., Morani, A., Sgrigna, G., and Loreto, F.: Role of Biogenic Volatile Organic Compounds (BVOC) emitted by urban trees on ozone concentration in cities: A review, Environ. Pollut., 183, 71–80, https://doi.org/10.1016/j.envpol.2013.03.012, 2013. a, b
CAMx: Comprehensive Air Quality Model With Extensions version 7.20 code, Ramboll US Corporation, Novato, CA 94945, USA [code], https://www.camx.com/download/source/ (last access: 15 May 2024), 2022. a
Cao, L., Li, S., and Sun, L.: Study of different Carbon Bond 6 (CB6) mechanisms by using a concentration sensitivity analysis, Atmos. Chem. Phys., 21, 12687–12714, https://doi.org/10.5194/acp-21-12687-2021, 2021. a
Carter, W. P. L.: Documentation Of The SAPRC-99 Chemical Mechanism For VOC Reactivity Assessment, Final Report to California Air Resources Board, Contract 92-329 and Contract 95-308, 00-AP-RT17-001-FR, University of California, Riverside, California 92521, 2000. a
Castell, N., Stein, A. F., Salvador, R., Mantilla, E., and Millán, M.: The impact of biogenic VOC emissions on photochemical ozone formation during a high ozone pollution episode in the Iberian Peninsula in the 2003 summer season, Adv. Sci. Res., 2, 9–15, https://doi.org/10.5194/asr-2-9-2008, 2008. a, b
Chen, F. and Dudhia, J.: Coupling an Advanced Land Surface Hydrology Model with the Penn State-NCAR MM5 Modeling System. Part I: Model Implementation and Sensitivity, Mon. Weather Rev., 129, 569–585, https://doi.org/10.1175/1520-0493(2001)129<0569:CAALSH>2.0.CO;2, 2001. a
Chen, S. and Sun, W.: A one-dimensional time dependent cloud model, J. Meteorol. Soc. Jpn., 80, 99–118, https://doi.org/10.2151/jmsj.80.99, 2002. a
Chen, Y., Liu, C., Su, W., Hu, Q., Zhang, C., Liu, H., and Yin, H.: Identification of volatile organic compound emissions from anthropogenic and biogenic sources based on satellite observation of formaldehyde and glyoxal, Sci. Total Environ., 859, 159997, https://doi.org/10.1016/j.scitotenv.2022.159997, 2023. a
Churkina, G., Kuik, F., Bonn, B., Lauer, A., Grote, R., Tomiak, K., and Butler, T. M.: Effect of VOC Emissions from Vegetation on Air Quality in Berlin during a Heatwave, Environ. Sci. Technol., 51, 6120–6130, https://doi.org/10.1021/acs.est.6b06514, 2017. a
Coates, J., Mar, K. A., Ojha, N., and Butler, T. M.: The influence of temperature on ozone production under varying NOx conditions – a modelling study, Atmos. Chem. Phys., 16, 11601–11615, https://doi.org/10.5194/acp-16-11601-2016, 2016. a
CORINE: CORINE Land Cover, European Union, Copernicus Land Monitoring Service 2012, European Environment Agency (EEA), https://land.copernicus.eu/pan-european/corine-land-cover (last access: 9 December 2024.), 2012. a
Curci, G., Beekmann, M., Vautard, R., Smiatek, G., Steinbrecher, R., Theloke, J., and Friedrich, R.: Modelling study of the impact of isoprene and terpene biogenic emissions on European ozone levels, Atmos. Environ., 43, 1444–1455, https://doi.org/10.1016/j.atmosenv.2008.02.070, 2009. a, b
Curci, G., Palmer, P. I., Kurosu, T. P., Chance, K., and Visconti, G.: Estimating European volatile organic compound emissions using satellite observations of formaldehyde from the Ozone Monitoring Instrument, Atmos. Chem. Phys., 10, 11501–11517, https://doi.org/10.5194/acp-10-11501-2010, 2010. a
de la Paz, D., Borge, R., de Andrés, J. M., Tovar, L., Sarwar, G., and Napelenok, S. L.: Summertime tropospheric ozone source apportionment study in the Madrid region (Spain), Atmos. Chem. Phys., 24, 4949–4972, https://doi.org/10.5194/acp-24-4949-2024, 2024. a
Duan, C., Liao, H., Wang, K., Ren, Y.: The research hotspots and trends of volatile organic compound emissions from anthropogenic and natural sources: A systematic quantitative review, Environ. Res., 216, 114386, https://doi.org/10.1016/j.envres.2022.114386, 2023. a
Dufour, G., Wittrock, F., Camredon, M., Beekmann, M., Richter, A., Aumont, B., and Burrows, J. P.: SCIAMACHY formaldehyde observations: constraint for isoprene emission estimates over Europe?, Atmos. Chem. Phys., 9, 1647–1664, https://doi.org/10.5194/acp-9-1647-2009, 2009. a
EEA: Europe's air quality status 2022, European Environmental Agency, Briefing no. 04/2022, https://doi.org/10.2800/049755, 2022. a
EEA: Air Quality e-Reporting products on EEA data service: E1a and E2a data sets, European Environment Agency, Copenhagen, Denmark [data set], https://discomap.eea.europa.eu/map/fme/AirQualityExport.htm (last access: 15 May 2024), 2023. a
Emery, C., Baker, K., Wilson, G., Yarwood, G.: Comprehensive Air Quality Model with Extensions: Formulation and Evaluation for Ozone and Particulate Matter over the US, Atmosphere, 15, 1158, https://doi.org/10.3390/atmos15101158, 2024. a
Emmons, L. K., Schwantes, R. H., Orlando, J. J., Tyndall, G., Kinnison, D., Lamarque, J.-F., Marsh, D., Mills, M. J., Tilmes, S., Bardeen, Ch., Buchholz, R. R., Conley, A., Gettelman, A., Garcia, R., Simpson, I., Blake, D. R., Meinardi, S., and Pétron, G.: The Chemistry Mechanism in the Community Earth System Model version 2 (CESM2), J. Adv. Model. Earth Sys., 12, e2019MS001882, https://doi.org/10.1029/2019MS001882, 2020. a
EUROSTAT: Farms and farmland in the European Union – statistics, European Commission – Eurostat, L-2920 Luxembourg, https://ec.europa.eu/eurostat/statistics-explained/SEPDF/cache/73319.pdf (last acces: 25 September 2024), 2020. a
Fitzky, A. C., Sandén, H., Karl, T., Fares, S., Calfapietra, C., Grote, R., Saunier, A., and Rewald, B.: The Interplay Between Ozone and Urban Vegetation – BVOC Emissions, Ozone Deposition, and Tree Ecophysiology, Frontiers in Forests and Global Change, 2, 50, https://doi.org/10.3389/ffgc.2019.00050, 2019. a, b
Fitzky, A. C., Kaser, L., Peron, A., Karl, T., Graus, M., Tholen, D., Halbwirth, H., Trimmel, H., Pesendorfer, M., Rewald, B., and Sandén, H.: Same, same, but different: Drought and salinity affect BVOC emission rate and alter blend composition of urban trees, Urban For. Urban Gree., 80, 127842, https://doi.org/10.1016/j.ufug.2023.127842, 2023. a
FOREST EUROPE: State of Europe's Forests 2020, Ministerial Conference on the Protection of Forests in Europe – FOREST EUROPE, Liaison Unit Bratislava, https://foresteurope.org/wp-content/uploads/2016/08/SoEF_2020.pdf (last access: 25 September 2024), 2020. a
Gao, Y., Ma, M., Yan, F., Su, H., Wang, S., Liao, H., Zhao, B., Wang, X., Sun, Y., Hopkins, J. R., and Chen, Q.: Impacts of biogenic emissions from urban landscapes on summer ozone and secondary organic aerosol formation in megacities, Sci. Total Environ., 814, 152654, https://doi.org/10.1016/j.scitotenv.2021.152654 2022a. a, b
Gao, Y., Yan, F., Ma, M., Ding, A., Liao, H., Wang, S., Wang, X., Zhao, B., Cai, W., Su, H., and Yao, X.: Unveiling the dipole synergic effect of biogenic and anthropogenic emissions on ozone concentrations, Sci. Total Environ., 818, 151722, https://doi.org/10.1016/j.scitotenv.2021.151722, 2022b. a
Gao, Y., Pan, H., Cao, L., Lu, C., Yang, Q., Lu, X., and Zhao, T.: Effects of anthropogenic emissions and meteorological conditions on diurnal variation of formaldehyde (HCHO) in the Yangtze River Delta, China, Atmos. Pollut. Res., 14, 101779, https://doi.org/10.1016/j.apr.2023.101779, 2023. a
Ghirardo, A., Xie, J., Zheng, X., Wang, Y., Grote, R., Block, K., Wildt, J., Mentel, T., Kiendler-Scharr, A., Hallquist, M., Butterbach-Bahl, K., and Schnitzler, J.-P.: Urban stress-induced biogenic VOC emissions and SOA-forming potentials in Beijing, Atmos. Chem. Phys., 16, 2901–2920, https://doi.org/10.5194/acp-16-2901-2016, 2016. a
Grell, G.: Prognostic evaluation of assumptions used by cumulus parameterizations, Mon. Weather Rev., 121, 764–787, https://doi.org/10.1175/1520-0493(1993)121<0764:PEOAUB>2.0.CO;2, 1993. a
Grote, R., Monson, R. K., and Niinemets, Ü.: Leaf-Level Models of Constitutive and Stress-Driven Volatile Organic Compound Emissions, in: Biology, Controls and Models of Tree Volatile Organic Compound Emissions, Tree Physiology, edited by: Niinemets, Ü. and Monson, R., Springer, Dordrecht, vol. 5, https://doi.org/10.1007/978-94-007-6606-8_12, 2013. a
Gu, S., Guenther, A., and Faiola, C.: Effects of Anthropogenic and Biogenic Volatile Organic Compounds on Los Angeles Air Quality, Environ. Sci. Technol., 5, 12191–12201, https://doi.org/10.1021/acs.est.1c01481, 2021. a, b
Guenther, A., Jiang, X., and Duhl, T.: MEGAN version 2.10, National Center for Atmospheric Research, Boulder, CO, USA [code], https://bai.ess.uci.edu/megan/data-and-code/megan21 (last access: 15 May 2024), 2014. a
Guenther, A. B., Jiang, X., Heald, C. L., Sakulyanontvittaya, T., Duhl, T., Emmons, L. K., and Wang, X.: The Model of Emissions of Gases and Aerosols from Nature version 2.1 (MEGAN2.1): an extended and updated framework for modeling biogenic emissions, Geosci. Model Dev., 5, 1471–1492, https://doi.org/10.5194/gmd-5-1471-2012, 2012. a, b, c
Guidolotti, G., Pallozzi, E., Gavrichkova, O., Scartazza, A., Mattioni, M., and Calfapietra, C.: Emission of constitutive isoprene, induced monoterpenes, and other volatiles under high temperatures in Eucalyptus camaldulensis: A 13C labelling study, Plant Cell Environ., 42, 1929–1938, https://doi.org/10.1111/pce.13521, 2019. a
Harrison, R. M., Yin, J., Tilling, R. M., Cai, X., Seakins, P. W., Hopkins, J. R., Lansley, D. L., Lewis, A. C., Hunter, M. C., Heard, D. E., Carpenter, L. J., Creasey, D. J., Lee, J. D., Pilling, M. J., Carslaw, N., Emmerson, K. M., Redington, A., Derwent, R. G., Ryall, D., Mills, G., and Penkett, S. A.: Measurement and modelling of air pollution and atmospheric chemistry in the U.K. West Midlands conurbation: Overview of the PUMA Consortium project, Sci. Total Environ., 360, 5–25, https://doi.org/10.1016/j.scitotenv.2005.08.053, 2006. a
Hodnebrog, Ø., Solberg, S., Stordal, F., Svendby, T. M., Simpson, D., Gauss, M., Hilboll, A., Pfister, G. G., Turquety, S., Richter, A., Burrows, J. P., and Denier van der Gon, H. A. C.: Impact of forest fires, biogenic emissions and high temperatures on the elevated Eastern Mediterranean ozone levels during the hot summer of 2007, Atmos. Chem. Phys., 12, 8727–8750, https://doi.org/10.5194/acp-12-8727-2012, 2012. a, b
Huszar, P.: CAMx simulations on BVOC impact over central Europe, Czech National Repository [data set], https://doi.org/10.48700/datst.b6as3-v2y27, 2024. a
Huszár, P., Karlický, J., Belda, M., Halenka, T., and Pišoft, P.: The impact of urban canopy meteorological forcing on summer photochemistry, Atmos. Environ., 176, 209–228, https://doi.org/10.1016/j.atmosenv.2017.12.037, 2018. a, b
Huszar, P., Karlický, J., Ďoubalová, J., Šindelářová, K., Nováková, T., Belda, M., Halenka, T., Žák, M., and Pišoft, P.: Urban canopy meteorological forcing and its impact on ozone and PM2.5: role of vertical turbulent transport, Atmos. Chem. Phys., 20, 1977–2016, https://doi.org/10.5194/acp-20-1977-2020, 2020a. a, b, c
Huszar, P., Karlický, J., Ďoubalová, J., Nováková, T., Šindelářová, K., Švábik, F., Belda, M., Halenka, T., and Žák, M.: The impact of urban land-surface on extreme air pollution over central Europe, Atmos. Chem. Phys., 20, 11655–11681, https://doi.org/10.5194/acp-20-11655-2020, 2020b. a
Huszar, P., Karlický, J., Bartík, L., Liaskoni, M., Prieto Perez, A. P., and Šindelářová, K.: Impact of urbanization on gas-phase pollutant concentrations: a regional-scale, model-based analysis of the contributing factors, Atmos. Chem. Phys., 22, 12647–12674, https://doi.org/10.5194/acp-22-12647-2022, 2022. a
Huszar, P., Prieto Perez, A. P., Bartík, L., Karlický, J., and Villalba-Pradas, A.: Impact of urbanization on fine particulate matter concentrations over central Europe, Atmos. Chem. Phys., 24, 397–425, https://doi.org/10.5194/acp-24-397-2024, 2024. a
Iacono, M. J., Delamere, J. S., Mlawer, E. J., Shephard, M. W., Clough, S. A., and Collins, W. D.: Radiative forcing by long-lived greenhouse gases: Calculations with the aer radiative transfer models, J. Geophys. Res.-Atmos., 113, D13103, https://doi.org/10.1029/2008JD009944, 2008. a
Im, U., Poupkou, A., Incecik, S., Markakis, K., Kindap, T., Unal, A., Melas, D., Yenigun, O., Topcu, S., Odman, M. T., Tayanc, M., and Guler, M.: The impact of anthropogenic and biogenic emissions on surface ozone concentrations in Istanbul, Sci. Total Environ., 409, 1255–1265, https://doi.org/10.1016/j.scitotenv.2010.12.026, 2011. a
Im, U., Bianconi, R., Solazzo, E., Kioutsioukis, I., Badia, A., Balzarini, A., Baró, R., Bellasio, R., Brunner, D., Chemel, C., Curci, G., Flemming, J., Forkel, R., Giordano, L., Jiménez-Guerrero, P., Hirtl, M., Hodzic, A., Honzak, L., Jorba, O., Knote, C., Kuenen, J. J., Makar, P. A., Manders-Groot, A., Neal, L., Pérez, J. L., Pirovano, G., Pouliot, G., San Jose, R., Savage, N., Schroder, W., Sokhi, R. S., Syrakov, D., Torian, A., Tuccella, P., Werhahn, J., Wolke, R., Yahya, K., Zabkar, R., Zhang, Y., Zhang, J., Hogrefe, C., and Galmarini, S.: Evaluation of operational on-line-coupled regional air quality models over Europe and North America in the context of AQMEII phase 2. Part I: Ozone, Atmos. Environ., 115, 404–420, https://doi.org/10.1016/j.atmosenv.2014.09.042, 2015. a
Jiang, J., Aksoyoglu, S., Ciarelli, G., Oikonomakis, E., El-Haddad, I., Canonaco, F., O'Dowd, C., Ovadnevaite, J., Minguillón, M. C., Baltensperger, U., and Prévôt, A. S. H.: Effects of two different biogenic emission models on modelled ozone and aerosol concentrations in Europe, Atmos. Chem. Phys., 19, 3747–3768, https://doi.org/10.5194/acp-19-3747-2019, 2019. a
Johnson, D. and Marston, G.: The gas-phase ozonolysis of unsaturated volatile organic compounds in the troposphere, Chem. Soc. Rev., 37, 699–716, https://doi.org/10.1039/B704260B, 2008. a
Kaiser, J., Wolfe, G. M., Min, K. E., Brown, S. S., Miller, C. C., Jacob, D. J., deGouw, J. A., Graus, M., Hanisco, T. F., Holloway, J., Peischl, J., Pollack, I. B., Ryerson, T. B., Warneke, C., Washenfelder, R. A., and Keutsch, F. N.: Reassessing the ratio of glyoxal to formaldehyde as an indicator of hydrocarbon precursor speciation, Atmos. Chem. Phys., 15, 7571–7583, https://doi.org/10.5194/acp-15-7571-2015, 2015. a
Karamchandani, P., Long, Y., Pirovano, G., Balzarini, A., and Yarwood, G.: Source-sector contributions to European ozone and fine PM in 2010 using AQMEII modeling data, Atmos. Chem. Phys., 17, 5643–5664, https://doi.org/10.5194/acp-17-5643-2017, 2017. a
Karlický, J., Huszár, P., and Halenka, T.: Validation of gas phase chemistry in the WRF-Chem model over Europe, Adv. Sci. Res., 14, 181–186, https://doi.org/10.5194/asr-14-181-2017, 2017. a
Karlický, J., Huszár, P., Halenka, T., Belda, M., Žák, M., Pišoft, P., and Mikšovský, J.: Multi-model comparison of urban heat island modelling approaches, Atmos. Chem. Phys., 18, 10655–10674, https://doi.org/10.5194/acp-18-10655-2018, 2018. a, b, c
Karlický, J., Huszár, P., Nováková, T., Belda, M., Švábik, F., Ďoubalová, J., and Halenka, T.: The “urban meteorology island”: a multi-model ensemble analysis, Atmos. Chem. Phys., 20, 15061–15077, https://doi.org/10.5194/acp-20-15061-2020, 2020. a, b
Karlický, J., Rieder, H. E., Huszár, P., Peiker, J., and Sukhodolov, T.: A cautious note advocating the use of ensembles of models and driving data in modeling of regional ozone burdens, Air. Qual. Atmos. Health, 17, 1415–1424, https://doi.org/10.1007/s11869-024-01516-3, 2024. a
Kelly, J. M., Doherty, R. M., O'Connor, F. M., and Mann, G. W.: The impact of biogenic, anthropogenic, and biomass burning volatile organic compound emissions on regional and seasonal variations in secondary organic aerosol, Atmos. Chem. Phys., 18, 7393–7422, https://doi.org/10.5194/acp-18-7393-2018, 2018. a
Kesselmeier, J. and Staudt, M.: Biogenic Volatile Organic Compounds (VOC): An Overview on Emission, Physiology and Ecology, J. Atmos. Chem., 33, 23–88, https://doi.org/10.1023/A:1006127516791, 1999. a
Khan, M. A. H., Schlich, B. L., Jenkin, M. E., Cooke, M. C., Derwent, R. G., Neu, J. L., Percival, C. J., and Shallcross, D. E.: Changes to simulated global atmospheric composition resulting from recent revisions to isoprene oxidation chemistry, Atmos. Environ., 244, 117914, https://doi.org/10.1016/j.atmosenv.2020.117914, 2021. a
Kim, S. Y., Jiang, X., Lee, M., Turnipseed, A., Guenther, A., Kim, J. C., Lee, S. J., and Kim, S.: Impact of biogenic volatile organic compounds on ozone production at the Taehwa Research Forest near Seoul, South Korea, Atmos. Environ., 70, 447–453, https://doi.org/10.1016/j.atmosenv.2012.11.005, 2013. a
Kuenen, J. J. P., Visschedijk, A. J. H., Jozwicka, M., and Denier van der Gon, H. A. C.: TNO-MACC_II emission inventory; a multi-year (2003–2009) consistent high-resolution European emission inventory for air quality modelling, Atmos. Chem. Phys., 14, 10963–10976, https://doi.org/10.5194/acp-14-10963-2014, 2014. a
Kusaka, H., Kondo, K., Kikegawa, Y., and Kimura, F.: A simple single-layer urban canopy model for atmospheric models: Comparison with multi-layer and slab models, Bound.-Lay. Meteorol., 101, 329–358, https://doi.org/10.1023/A:1019207923078, 2001. a
Lam, Y. F., Fu, J. S., Wu, S., and Mickley, L. J.: Impacts of future climate change and effects of biogenic emissions on surface ozone and particulate matter concentrations in the United States, Atmos. Chem. Phys., 11, 4789–4806, https://doi.org/10.5194/acp-11-4789-2011, 2011. a
Lawrence, P. J. and Chase, T. N.: Representing a new MODIS consistent land surface in the Community Land Model (CLM 3.0), J. Geophys. Res.-Biogeo., 112, G01023, https://doi.org/10.1029/2006JG000168, 2007. a
Lee, K. Y., Kwak, K. H., Ryu, Y. H., Lee, S. H., and Baik, J. J.: Impacts of biogenic isoprene emission on ozone air quality in the Seoul metropolitan area, Atmos. Environ., 96, 209–219, https://doi.org/10.1016/j.atmosenv.2014.07.036, 2014. a
Lerdau M.: A positive feedback with negative consequences, Science, 316, 212–213, https://doi.org/10.1126/science.1141486, 2007. a, b
Li, J., Wang, Y., and Qu, H.: Dependence of summertime surface ozone on NOx and VOC emissions over the United States: Peak time and value, Geophys. Res. Lett., 46, 3540–3550, https://doi.org/10.1029/2018GL081823, 2019. a
Li, N., He, Q., Greenberg, J., Guenther, A., Li, J., Cao, J., Wang, J., Liao, H., Wang, Q., and Zhang, Q.: Impacts of biogenic and anthropogenic emissions on summertime ozone formation in the Guanzhong Basin, China, Atmos. Chem. Phys., 18, 7489–7507, https://doi.org/10.5194/acp-18-7489-2018, 2018. a, b
Liaskoni, M., Huszar, P., Bartík, L., Prieto Perez, A. P., Karlický, J., and Vlček, O.: Modelling the European wind-blown dust emissions and their impact on particulate matter (PM) concentrations, Atmos. Chem. Phys., 23, 3629–3654, https://doi.org/10.5194/acp-23-3629-2023, 2023. a
Liu, S., Xing, J., Zhang, H., Ding, D., Zhang, F., Zhao, B., Sahu, S. K., and Wang, S.: Climate-driven trends of biogenic volatile organic compound emissions and their impacts on summertime ozone and secondary organic aerosol in China in the 2050s, Atmos. Environ., 218, 117020, https://doi.org/10.1016/j.atmosenv.2019.117020, 2019. a
Liu, Y., Li, L., An, J., Huang, L., Yan, R., Huang, Ch., Wang, H., Wang, Q., Wang, M., and Zhang, W.: Estimation of biogenic VOC emissions and its impact on ozone formation over the Yangtze River Delta region, China, Atmos. Environ., 186, 113–128, https://doi.org/10.1016/j.atmosenv.2018.05.027, 2018. a
Liu, Y., Nie, W., Li, Y., Ge, D., Liu, C., Xu, Z., Chen, L., Wang, T., Wang, L., Sun, P., Qi, X., Wang, J., Xu, Z., Yuan, J., Yan, C., Zhang, Y., Huang, D., Wang, Z., Donahue, N. M., Worsnop, D., Chi, X., Ehn, M., and Ding, A.: Formation of condensable organic vapors from anthropogenic and biogenic volatile organic compounds (VOCs) is strongly perturbed by NOx in eastern China, Atmos. Chem. Phys., 21, 14789–14814, https://doi.org/10.5194/acp-21-14789-2021, 2021. a
Luecken, D. J., Hutzell, W. T., Strum, M. L., and Pouliot, G. A.: Regional sources of atmospheric formaldehyde and acetaldehyde, and implications for atmospheric modeling, Atmos. Environ., 47, 477–490, 2012. a
Ma, M., Gao, Y., Wang, Y., Zhang, S., Leung, L. R., Liu, C., Wang, S., Zhao, B., Chang, X., Su, H., Zhang, T., Sheng, L., Yao, X., and Gao, H.: Substantial ozone enhancement over the North China Plain from increased biogenic emissions due to heat waves and land cover in summer 2017, Atmos. Chem. Phys., 19, 12195–12207, https://doi.org/10.5194/acp-19-12195-2019, 2019. a
Ma, M., Gao, Y., Ding, A., Su, H., Liao, H., Wang, S., and Gao, H.: Development and assessment of a high-resolution biogenic emission inventory from urban green spaces in China, Environ. Sci. Technol., 56, 175–184, https://doi.org/10.1021/acs.est.1c06170, 2021. a, b
Maison, A., Lugon, L., Park, S.-J., Baudic, A., Cantrell, C., Couvidat, F., D'Anna, B., Di Biagio, C., Gratien, A., Gros, V., Kalalian, C., Kammer, J., Michoud, V., Petit, J.-E., Shahin, M., Simon, L., Valari, M., Vigneron, J., Tuzet, A., and Sartelet, K.: Significant impact of urban tree biogenic emissions on air quality estimated by a bottom-up inventory and chemistry transport modeling, Atmos. Chem. Phys., 24, 6011–6046, https://doi.org/10.5194/acp-24-6011-2024, 2024. a
Markakis, K., Valari, M., Perrussel, O., Sanchez, O., and Honore, C.: Climate-forced air-quality modeling at the urban scale: sensitivity to model resolution, emissions and meteorology, Atmos. Chem. Phys., 15, 7703–7723, https://doi.org/10.5194/acp-15-7703-2015, 2015. a
Nenes, A., Pilinis, C., and Pandis, S. N.: ISORROPIA: A New Thermodynamic Model for Multiphase Multicomponent Inorganic Aerosols, Aquat. Geochem., 4, 123–152, https://doi.org/10.1023/A:1009604003981, 1998. a
Nenes, A., Pilinis, C., and Pandis, S. N.: Continued Development and Testing of a New Thermodynamic Aerosol Module for Urban and Regional Air Quality Models, Atmos. Environ., 33, 1553–1560, https://doi.org/10.1016/S1352-2310(98)00352-5, 1999. a
Nowak, D. J., Civerolo, K. L., Rao, S. T., Sistla, G., Luley, C. G., and Crane, D. E.: A modeling study of the impact of urban trees on ozone, Atmos. Environ., 34, 1601–1613, https://doi.org/10.1016/S1352-2310(99)00394-5, 2000. a
Otero, N., Sillmann, J., Mar, K. A., Rust, H. W., Solberg, S., Andersson, C., Engardt, M., Bergström, R., Bessagnet, B., Colette, A., Couvidat, F., Cuvelier, C., Tsyro, S., Fagerli, H., Schaap, M., Manders, A., Mircea, M., Briganti, G., Cappelletti, A., Adani, M., D'Isidoro, M., Pay, M.-T., Theobald, M., Vivanco, M. G., Wind, P., Ojha, N., Raffort, V., and Butler, T.: A multi-model comparison of meteorological drivers of surface ozone over Europe, Atmos. Chem. Phys., 18, 12269–12288, https://doi.org/10.5194/acp-18-12269-2018, 2018. a
Passant, N.: Speciation of UK Emissions of Non-methane Volatile Organic Compounds, DEFRA, Oxon, UK, https://uk-air.defra.gov.uk/assets/documents/reports/empire/AEAT_ENV_0545_final_v2.pdf (last access: 4 January 2024), 2002. a
Possanzini, M., Di Palo, V., and Cecinato, A.: Sources and photodecomposition of formaldehyde and acetaldehyde in Rome ambient air, Atmos. Environ., 36, 3195–3201, https://doi.org/10.1016/S1352-2310(02)00192-9, 2002. a
Qu, Y., An, J., and Li, J.: Synergistic impacts of anthropogenic and biogenic emissions on summer surface O3 in East Asia, J. Environ. Sci., 25, 520–530, https://doi.org/10.1016/S1001-0742(12)60069-2, 2013. a
Ramboll: User's Guide Comprehensive Air Quality Model With Extensions Version 7.20, User Guide, Ramboll US Corporation, Novato, CA 94945, USA, https://www.camx.com/Files/CAMxUsersGuide_v7.20.pdf (last access: 15 May 2024), 2022. a, b, c
Richards, N. A. D., Arnold, S. R., Chipperfield, M. P., Miles, G., Rap, A., Siddans, R., Monks, S. A., and Hollaway, M. J.: The Mediterranean summertime ozone maximum: global emission sensitivities and radiative impacts, Atmos. Chem. Phys., 13, 2331–2345, https://doi.org/10.5194/acp-13-2331-2013, 2013. a, b
Rowlinson, M. J., Rap, A., Hamilton, D. S., Pope, R. J., Hantson, S., Arnold, S. R., Kaplan, J. O., Arneth, A., Chipperfield, M. P., Forster, P. M., and Nieradzik, L.: Tropospheric ozone radiative forcing uncertainty due to pre-industrial fire and biogenic emissions, Atmos. Chem. Phys., 20, 10937–10951, https://doi.org/10.5194/acp-20-10937-2020, 2020. a
Sakulyanontvittaya, T., Cho, S., Aklilu, Y. A., Morris, R., and Nopmongcol, U.: An assessment of enhanced biogenic emissions influence on ozone formation in central Alberta, Canada, Air Qual. Atmos. Hlth., 9, 117–127, https://doi.org/10.1007/s11869-015-0324-9, 2016. a
Sartelet, K. N., Couvidat, F., Seigneur, C., and Roustan, Y.: Impact of biogenic emissions on air quality over Europe and North America, Atmos. Environ., 53, 131–141, https://doi.org/10.1016/j.atmosenv.2011.10.046, 2012. a
Sarwar, G., Luecken, D., Yarwood, G. Whitten, G. Z., and Carter, W. P. L.: Impact of an Updated Carbon Bond Mechanism on Predictions from the CMAQ Modeling System: Preliminary Assessment, J. Appl. Meteorol. Clim., 47, 3–14, https://doi.org/10.1175/2007JAMC1393.1, 2008. a
Schwantes, R. H., Emmons, L. K., Orlando, J. J., Barth, M. C., Tyndall, G. S., Hall, S. R., Ullmann, K., St. Clair, J. M., Blake, D. R., Wisthaler, A., and Bui, T. P. V.: Comprehensive isoprene and terpene gas-phase chemistry improves simulated surface ozone in the southeastern US, Atmos. Chem. Phys., 20, 3739–3776, https://doi.org/10.5194/acp-20-3739-2020, 2020. a, b, c
Seinfeld, J. H. and Pandis, S. N.: Atmospheric Chemistry and Physics: From Air Pollution to Climate Change, 3rd Edition, John Wiley and Sons, Hoboken, New Jersey, ISBN 978-1-118-94740-1, 2016. a, b, c, d, e, f, g, h
Simmons, A. J., Willett, K. M., Jones, P. D., Thorne, P. W., and Dee, D. P.: Low-frequency variations in surface atmospheric humidity, temperature and precipitation: inferences from reanalyses and monthly gridded observational datasets, J. Geophys. Res., 115, D01110, https://doi.org/10.1029/2009JD012442, 2010. a
Simon, H., Fallmann, J., Kropp, T., Tost, H., and Bruse, M.: Urban Trees and Their Impact on Local Ozone Concentration – A Microclimate Modeling Study, Atmosphere, 10, 154, https://doi.org/10.3390/atmos10030154, 2019. a
Simpraga, M., Ghimire, R. P., and Van Der Straeten, D.: Unravelling the functions of biogenic volatiles in boreal and temperate forest ecosystems, Eur. J. Forest. Res., 138, 763–787, https://doi.org/10.1007/s10342-019-01213-2, 2019. a
Sindelarova, K., Markova, J., Simpson, D., Huszar, P., Karlicky, J., Darras, S., and Granier, C.: High-resolution biogenic global emission inventory for the time period 2000–2019 for air quality modelling, Earth Syst. Sci. Data, 14, 251–270, https://doi.org/10.5194/essd-14-251-2022, 2022. a, b
Skamarock, W. C., Klemp, J. B., Dudhia, J., Gill, D. O., Liu, Z., Berner, J., Wang, W., Powers, J. G., Duda, M. G., Barker, D. M., and Huang, X.-Y.: A Description of the Advanced Research WRF Version 4, NCAR Tech, Note NCAR/TN-556+STR, 145, https://doi.org/10.5065/1dfh-6p97, 2019. a
Strader, R., Lurmann, F., and Pandis, S. N.: Evaluation of secondary organic aerosol formation in winter, Atmos. Environ., 33, 4849–4863, https://doi.org/10.1016/S1352-2310(99)00310-6, 1999. a
Strong, J., Whyatt, J. D., Metcalfe, S. E., Derwent, R. G., and Hewitt, C. N.: Investigating the impacts of anthropogenic and biogenic VOC emissions and elevated temperatures during the 2003 ozone episode in the UK, Atmos. Environ., 74, 393–401, https://doi.org/10.1016/j.atmosenv.2013.04.006, 2013. a
Tagaris, E., Sotiropoulou, R. E. P., Gounaris, N., Andronopoulos, S., and Vlachogiannis, D.: Impact of biogenic emissions on ozone and fine particles over Europe: Comparing effects of temperature increase and a potential anthropogenic NOx emissions abatement strategy, Atmos. Environ., 98, 214–223, https://doi.org/10.1016/j.atmosenv.2014.08.056, 2014. a
Thompson, A. M.: The oxidizing capacity of the earth's atmosphere: probable past and future changes, Science, 256, 1157–1165, https://doi.org/10.1126/science.256.5060.1157, 1992. a
Thunis, P. and Cuvelier, C.: Impact of biogenic emissions on ozone formation in the Mediterranean area – a BEMA modelling study, Atmos. Environ., 34, 467–481, https://doi.org/10.1016/S1352-2310(99)00313-1, 2000. a, b
van der Gon, H. D., Hendriks, C., Kuenen, J., Segers, A., and Visschedijk, A.: Description of current temporal emission patterns and sensitivity of predicted AQ for temporal emission patterns, EU FP7 MACC deliverable report D_D-EMIS_1.3, TNO, Utrecht, the Netherlands, https://atmosphere.copernicus.eu/sites/default/files/2019-07/MACC_TNO_del_1_3_v2.pdf (last access: 10 January 2024), 2011. a
von Schneidemesser, E., Monks, P. S., Gros, V., Gauduin, J., and Sanchez, O.: How important is biogenic isoprene in an urban environment? A study in London and Paris, Geophys. Res. Lett., 38, L19804, https://doi.org/10.1029/2011GL048647, 2011. a
Wang, X., Fu, T. M., Zhang, L., Lu, X., Liu, X., Amnuaylojaroen, T., Latif, M. T., Ma, Y., Zhang, L., Feng, X., and Zhu, L.: Rapidly changing emissions drove substantial surface and tropospheric ozone increases over Southeast Asia, Geophys. Res. Lett., 49, e2022GL100223, https://doi.org/10.1029/2022GL100223, 2022. a
Williams, J. E., Scheele, M. P., van Velthoven, P. F. J., Cammas, J.-P., Thouret, V., Galy-Lacaux, C., and Volz-Thomas, A.: The influence of biogenic emissions from Africa on tropical tropospheric ozone during 2006: a global modeling study, Atmos. Chem. Phys., 9, 5729–5749, https://doi.org/10.5194/acp-9-5729-2009, 2009. a
Wong, K. W., and Stutz, J.: Influence of nocturnal vertical stability on daytime chemistry: a one-dimensional model study, Atmos. Environ., 44, 3753–3760, https://doi.org/10.1016/j.atmosenv.2010.06.057, 2010. a
WRF: Weather Research and Forecast model code, version 4.0 source code [code], https://www2.mmm.ucar.edu/wrf/src/WRFV4.0.TAR.gz (last access 14 May 2024), 2018. a
Wu, K., Yang, X., Chen, D., Gu, S., Lu, Y., Jiang, Q., Wang, K., Ou, Y., Qian, Y., Shao, P., and Lu, S.: Estimation of biogenic VOC emissions and their corresponding impact on ozone and secondary organic aerosol formation in China, Atmos. Res., 231, 104656, https://doi.org/10.1016/j.atmosres.2019.104656, 2020. a
Wu, Y., Huo, J., Yang, G., Wang, Y., Wang, L., Wu, S., Yao, L., Fu, Q., and Wang, L.: Measurement report: Production and loss of atmospheric formaldehyde at a suburban site of Shanghai in summertime, Atmos. Chem. Phys., 23, 2997–3014, https://doi.org/10.5194/acp-23-2997-2023, 2023. a
Yu, H. and Blande, J. D.: Diurnal variation in BVOC emission and CO2 gas exchange from above- and belowground parts of two coniferous species and their responses to elevated O3, Environ. Pollut., 278, 116830, https://doi.org/10.1016/j.envpol.2021.116830, 2021. a
Yu, H., Holopainen, J. K., Kivimäenpää, M., Virtanen, A., and Blande, J. D.: Potential of Climate Change and Herbivory to Affect the Release and Atmospheric Reactions of BVOCs from Boreal and Subarctic Forests, Molecules 2021, 26, 2283, https://doi.org/10.3390/molecules26082283, 2021. a
Yuan, H., Dai, Y., Xiao, Z., Ji, D., and Shangguan, W.: Reprocessing the MODIS Leaf Area Index Products for Land Surface and Climate Modelling, Remote Sens. Environ., 115, 1171–1187, https://doi.org/10.1016/j.rse.2011.01.001, 2011. a, b
Zanis, P., Katragkou, E., Tegoulias, I., Poupkou, A., Melas, D., Huszar, P., and Giorgi, F.: Evaluation of near surface ozone in air quality simulations forced by a regional climate model over Europe for the period 1991–2000, Atmos. Environ., 45, 6489–6500, https://doi.org/10.1016/j.atmosenv.2011.09.001, 2011. a
Zeng, G., Pyle, J. A., and Young, P. J.: Impact of climate change on tropospheric ozone and its global budgets, Atmos. Chem. Phys., 8, 369–387, https://doi.org/10.5194/acp-8-369-2008, 2008. a
Zhang, R., Cohan, A, Biazar, A. P., and Coha, D. S.: Source apportionment of biogenic contributions to ozone formation over the United States, Atmos. Environ, 164, 8–19, https://doi.org/10.1016/j.atmosenv.2017.05.044, 2017. a, b
Zhao, Y., Li, Y., Kumar, A., Ying, Q., Vandenberghe, F., and Kleeman, M. J.: Separately resolving NOx and VOC contributions to ozone formation, Atmos. Environ., 285, 119224, https://doi.org/10.1016/j.atmosenv.2022.119224, 2022. a
Zhu, Q., Schwantes, R. H., Coggon, M., Harkins, C., Schnell, J., He, J., Pye, H. O. T., Li, M., Baker, B., Moon, Z., Ahmadov, R., Pfannerstill, E. Y., Place, B., Wooldridge, P., Schulze, B. C., Arata, C., Bucholtz, A., Seinfeld, J. H., Warneke, C., Stockwell, C. E., Xu, L., Zuraski, K., Robinson, M. A., Neuman, J. A., Veres, P. R., Peischl, J., Brown, S. S., Goldstein, A. H., Cohen, R. C., and McDonald, B. C.: A better representation of volatile organic compound chemistry in WRF-Chem and its impact on ozone over Los Angeles, Atmos. Chem. Phys., 24, 5265–5286, https://doi.org/10.5194/acp-24-5265-2024, 2024. a
Zhu, Z., Zhang, Z., Zhao, X., Zuo, L., and Wang, X.: Characteristics of Land Use Change in China before and after 2000, Sustainability, 14, 14623, https://doi.org/10.3390/su142114623, 2022. a


