the Creative Commons Attribution 4.0 License.
the Creative Commons Attribution 4.0 License.
Numerical simulation of aerosol concentration effects on cloud droplet size spectrum evolutions of warm stratiform clouds in Jiangxi, China
Yi Li
Hengjia Cai
Changes in aerosol amount and size distribution significantly impact cloud droplet size distribution, as aerosols act as cloud condensation nuclei (CCNs) and influence the relative dispersion (ε) of cloud droplet spectra. Relative dispersion plays a key role in parameterizing cloud processes in general circulation models (GCMs) and microphysical schemes, affecting precipitation estimates and climate predictions. However, the effects of varying aerosol modes on cloud microphysics remain debated, depending on thermodynamic conditions and cloud type. This study simulates a warm stratiform cloud in Jiangxi, China, using the Weather Research and Forecasting (WRF) Spectra–Bin Microphysics scheme (SBM-FAST) from 18:00 on 24 December 2014 to 06:00 on 25 December 2014 (UTC). Satellite and aircraft observations were used to validate the simulation, showing good agreement in cloud structure. Sensitivity experiments were conducted by increasing nucleation, accumulation, and coarse-mode aerosols 5-fold and by reducing the total aerosol concentration to 1/5 of the control. Results show that higher aerosol concentrations enhance cloud formation and broaden droplet spectra, while lower concentrations suppress cloud development. Accumulation-mode aerosols increase small-droplet concentrations, while nucleation- and coarse-mode aerosols favor larger droplets. The correlation between ε and volume-weighted radius (Rv) shifts from positive to negative as Rv increases. This transition is driven by cloud droplet collision–coalescence, condensation, and activation. Increased accumulation-mode aerosol concentrations shift the ε–Rv correlation from negative to positive in the Rv range of 4.5–8 µm, while reduced aerosol concentrations strengthen the negative correlation. Regardless of different coalescence intensities, ε converges with the increase in number concentration of cloud droplets (Nc).
- Article
(9628 KB) - Full-text XML
-
Supplement
(452 KB) - BibTeX
- EndNote
According to Lau and Wu (2003), warm clouds account for 32 % of total precipitation in tropical regions and cover 72 % of the total precipitation area. Warm clouds play a critical role in evaluating cloud–precipitation–climate feedback, making the understanding of their formation, development, and cloud microphysical processes a crucial topic in cloud physics (Seifert et al., 2010).
Grosvenor et al. (2018) identified a significant relationship between cloud droplet number concentration (Nc), cloud optical thickness, and cloud-top temperature, proposing an improved remote sensing retrieval algorithm for cloud droplet effective radius to reduce the errors in satellite measurements of Nc. Zheng et al. (2021) utilized merged CloudSat–CALIPSO–MODIS products to compare the macro- and microphysical properties of precipitating and non-precipitating clouds during the warm season in central–eastern China, focusing on parameters such as cloud optical thickness and the effective radius of cloud droplets. Their findings indicated that the probability of precipitation increased with the increasing of cloud optical thickness, liquid water path, and ice water path but showed a decreasing trend when the cloud droplet effective radius exceeded 22 µm. However, these studies have overlooked the impact of changes in particle size distribution in clouds, which may be critical for parameterization of cloud droplet effective radius, and is an essential factor that cannot be ignored during cloud–rain auto-conversion processes, affecting macroscopic and microscopic physical processes in clouds (Wang and Lu, 2023; Xie et al., 2015).
Cloud droplet spectral relative dispersion (ε) is an important parameter that describes the width and distribution of cloud droplet sizes. It is represented as the ratio between the standard deviation (σ) and the mean radius (Rave) of the droplets (Wang et al., 2023). On one hand, ε (the relative dispersion of cloud droplet spectra) influences the effective radius (Re) of cloud droplets by altering their size distribution. A higher ε typically leads to a broader droplet size distribution, which increases the effective radius, thereby enhancing the auto-conversion process that drives the formation of precipitation from cloud droplets (Liu et al., 2005, 2006; Zhu et al., 2020; Lu and Xu, 2021; Wang et al., 2022, 2023; Yang et al., 2023). On the other hand, ε modulates cloud–aerosol interactions by affecting cloud microphysical properties such as droplet concentration and liquid water content, which in turn influence cloud radiative properties and, consequently, climate (Xie et al., 2017).
Many researchers have conducted causal analyses of the uncertainty in the effect of cloud microphysical properties on ε. The results indicate that the variability in ε is influenced by various factors such as atmospheric temperature, humidity, and entrainment (Lu et al., 2013). Zhu et al. (2020) analyzed data from a flight observation conducted in Monterey, California, in July 2008 as part of the US POST (Physics of Stratocumulus Top) project and found that in adiabatic clouds, vertical velocity plays a dominant role; an increase in vertical velocity promotes the activation of cloud condensation nuclei (CCNs), leading to an increase in Nc and facilitating droplet coalescence and growth. On the other hand, Kumar et al. (2017) conducted idealized simulation experiments using direct numerical simulation (DNS) to study the mixing dynamics at cloud edges and their impact on the droplet size distribution (DSD). They showed that ε is also related to turbulent mixing and variations in vertical velocity within the cloud.
However, as Lu et al. (2020) pointed out, existing studies of ε primarily rely on empirical data from observations, leading to significant uncertainty in characterizing the ε within clouds. In addition, the relationship between ε and the volume mean radius (Rv) has shown varied conclusions in different studies: some indicate a negative correlation (Liu et al., 2008; Pandithurai et al., 2012), while others suggest a positive correlation (Tas et al., 2012). It was also found that as Rv increases, ε exhibits a converging trend (Chen et al., 2016). Meanwhile, the correlation between ε and Nc also shows uncertainty. Jin et al. (2021) conducted aircraft observational studies on stratiform warm clouds in Jiangxi, China, indicating that ε in both precipitating and non-precipitating warm clouds is negatively correlated with Nc. But some studies report a positive correlation (Pandithurai et al., 2012; Chen et al., 2016), while others indicate a negative correlation (Cecchini et al., 2017; Wang et al., 2011). Some studies even suggest that no significant correlation is observed between ε and Nc (Tas et al., 2015). Meanwhile, the correlation between ε and Nc also shows uncertainty. Jin et al. (2021) conducted aircraft observational studies on stratiform warm clouds in Jiangxi, China, that indicate that ε in both precipitating and non-precipitating warm clouds is negatively correlated with Nc. Similarly, Cecchini et al. (2017) and Wang et al. (2011) reported negative correlations between ε and Nc. However, some studies report a positive correlation (Pandithurai et al., 2012; Chen et al., 2016), while some studies even suggest that no significant correlation is observed between ε and Nc (Tas et al., 2015).
Studies by Ma et al. (2010) and Wang et al. (2011, 2019) have shown that changes in ε are highly sensitive to aerosol concentration and its activation process. Additionally, alterations in aerosol concentration or size distribution significantly impact the cloud–rain auto-conversion process through ε changes. Consequently, ε becomes a critical link connecting the aerosol–cloud interaction effects (Liu and Daum, 2002).
Liu et al. (2003) compared aircraft observations and satellite retrievals for stratiform warm clouds in both the Northern and Southern hemispheres and found that an increase in aerosol concentration leads to a decrease in cloud droplet effective radius and to a narrowing of the droplet spectrum, thus suppressing warm-precipitation processes. Fan et al. (2012) conducted a numerical simulation of variations in aerosol concentration in eastern China, demonstrating that an increase in CCNs leads to an increase in Nc and cloud droplet mass concentration, reduces the number concentration of raindrops, and delays the onset of precipitation. Yang et al. (2017) analyzed aerosol concentration and cloud droplet spectrum distribution in the high-altitude region of eastern China during summer, and their results showed that increased aerosol concentration inhibits the cloud–rain auto-conversion process, resulting in more cloud water remaining in the atmosphere and reducing warm precipitation. By analyzing the aerosol observations in India from 2000 to 2017. Kant et al. (2019) found that strong updrafts with abundant mineral dust aerosols can activate more cloud droplets, leading to competition for water vapor and narrowing of the droplet spectrum, limiting the growth of high-level liquid droplets. It suggests that an increase in aerosol concentration leads to a reduction in ε, thereby inhibiting the cloud–rain auto-conversion process (Chandrakar et al., 2016, 2018; Desai et al., 2019).
However, there are also studies indicating that an increase in aerosol concentration results in an increase in ε and enhances droplet collision–coalescence processes (Rotstayn and Liu, 2003; Yum and Hudson, 2005; Rotstayn and Liu, 2009; Prabha et al., 2012; Liu et al., 2020). For instance, Liu et al. (2020) found that increasing aerosol concentration in clean tropical or marine regions can prolong cloud lifetimes and enhance precipitation by modifying the cloud droplet spectrum distribution. Moreover, an influence of aerosol concentrations on cloud droplet size distribution has been found, exhibiting strong regional dependence and varying according to cloud types and geographical regions (Chandrakar et al., 2016, 2018).
In addition, the impact of aerosol concentrations on cloud droplet spectra varies for different size ranges of aerosols. Liu et al. (2022), using satellite data to investigate the influence of aerosols on warm-rain processes, found that fine particles with diameters ranging from 0.1 to 2.5 µm, acting as cloud condensation nuclei, can suppress precipitation and prolong the lifetime of warm stratiform clouds and shallow maritime cumulus clouds, similar to the conclusions of Kovačević (2019) and Lerach and Cotton (2018). On the other hand, an increase in coarse-mode marine condensation nuclei with larger particle sizes leads to a noticeable increase in cloud droplet effective radius and warm-rain intensity. Large particles with diameters exceeding 2 µm, acting as giant cloud condensation nuclei, can increase ε and facilitate cloud droplet growth during the collision–coalescence process (Yin et al., 2000; Jensen and Nugent, 2017). However, Wehbe et al. (2020) analyzed aircraft observations over the United Arab Emirates in 2019 and found that although giant cloud condensation nuclei were present, no significant collision–coalescence process was observed in marine warm stratiform clouds.
Furthermore, Rosenfeld et al. (2001) attributed the reduction in cloud droplet effective radius over the Sahara Desert to numerous submicron-sized cloud condensation nuclei (CCNs), which decreased ε and exacerbated the decrease in precipitation over the Sahara region. Numerical experiments by Flossmann and Wobrock (2010) yielded similar conclusions.
In summary, in the context of climate change, changes in the physicochemical properties of aerosols significantly affect the microphysical characteristics of warm clouds. Existing studies often rely on exploring the relationships between aerosol concentration and microphysical cloud quantities, such as Nc and Rv, and further research on ε, a key factor affecting the cloud–aerosol effect, is still needed. However, the response of warm clouds to aerosol physicochemical properties depends on the region and cloud type, and due to limitations in observational methods, the response of ε to changes in aerosol concentration varies significantly across studies, making this issue a crucial and controversial scientific question for climate prediction.
This study utilizes the Spectra–Bin Microphysics scheme (SBM-FAST) within the Weather Research and Forecasting (WRF) model to simulate a stratiform warm cloud event in Jiangxi, China. The numerical experiments aim to explore the impacts of changes in nucleation-, accumulation-, coarse-, and total-mode aerosol concentrations on the macroscopic and microscopic characteristics of stratiform warm clouds in this region. The paper is organized as follows. Section 2 outlines the numerical simulation setup, aircraft, and satellite observations used to validate simulation results and the computational formulas used in the analysis. Section 3 conducts validations of the control experiment's simulation results through comparisons with concurrent aircraft and satellite cloud-top temperature observations, uncovering the effects of different aerosol modes on the macroscopic and microscopic physical properties of clouds, with a particular focus on the correlation between ε and cloud microphysical properties. The last two sections include the discussion and conclusions.
2.1 Simulation setup and weather conditions
This paper selects a stratiform warm-cloud process that occurred in Jiangxi, China, on 25 December 2014, as shown in Fig. 1, where the region within the bold black provincial boundary represents Jiangxi, and conducts simulations using WRF (Weather Research and Forecasting) version 4.2. The experiment comprises one control and five aerosol spectrum modification experiments. Except for aerosol concentrations, all groups keep the initial field data and simulation settings consistent. The simulations use the fifth generation of ECMWF atmospheric reanalyses of the global climate (ERA5) hourly data on pressure levels as the initial field, with a resolution of 0.25° × 0.25°.
The simulations employ a two-layer nesting approach with 3 and 1 km grid resolutions. The model is divided vertically into 57 layers, reaching a top pressure level of 50 hPa. In the first two kilometers above ground level, the vertical grid resolution varies as follows: the lowest layer is at approximately 401 m, with subsequent layers at 457, 528, 618, 733, 876, 1053, 1270, 1533, 1845, and 2209 m. The innermost-layer grid contains 376×376 grid points. The microphysics scheme used is the new version of the SBM-FAST bin scheme (FSBM-2) under WRF 4.2 version. The boundary layer scheme selected is the Mellor–Yamada–Janjic (eta) turbulence kinetic energy (TKE) scheme, and the near-surface layer scheme uses the Monin–Obukhov (Janjic eta) scheme. The land surface process adopts the unified Noah land surface model. The (old) Goddard shortwave radiation scheme is used, and the Rapid Radiative Transfer Model (RRTM) scheme is chosen for longwave radiation.
The simulation region is illustrated in Fig. 1, and the simulation duration is from 18:00 on 24 December 2014 to 06:00 on 25 December 2014 (UTC), with no precipitation observed at the ground during the simulation period. The simulated area, Ganzhou city, is in the southern part of eastern China's Jiangxi province. It is located upstream of the Gan River and in the transitional zone between the southeastern coastal and central inland regions. The city is surrounded by mountains, with faulted basins traversed by rivers. The predominant topographical features are mountains, hills, and basins. The area is located at the southern edge of the subtropical zone and falls under the subtropical monsoon climate region.
As shown in Fig. 2, at the 500 hPa level, the isobars over southern Jiangxi are relatively flat, indicating the absence of significant trough or ridge systems. This suggests that the upper atmosphere in this region is under stable airflow control. A strong westerly jet is observed at this level, indicating the presence of a notable westerly jet stream aloft. At the 850 hPa level, a cyclonic circulation is evident, pointing to convergence in the lower atmosphere. As the warm-cloud system develops, the convergence intensifies, and the associated low-pressure system shifts eastward, providing favorable upward motion in the region. At the surface, a pronounced low-pressure system is present. As the process evolves, wind speeds increase, and the low-pressure system progresses southward. These features indicate that southern Jiangxi is dominated by a low-pressure system at the lower levels during this period, with dynamic conditions favorable for cloud development.
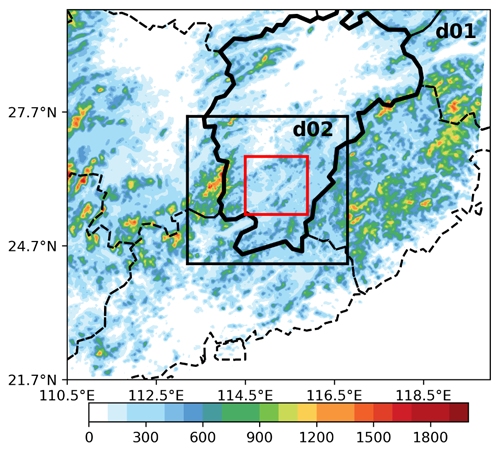
Figure 1Simulated region and nesting configuration. The shading represents the elevation (m) of the terrain, and the area within the red box is the analysis range. The region within the bold black provincial boundary represents Jiangxi. d01 and d02 refer to the nested grids with different resolutions in the model setup. d01 has a grid resolution of 3 km, and d02 has a grid resolution of 1 km..
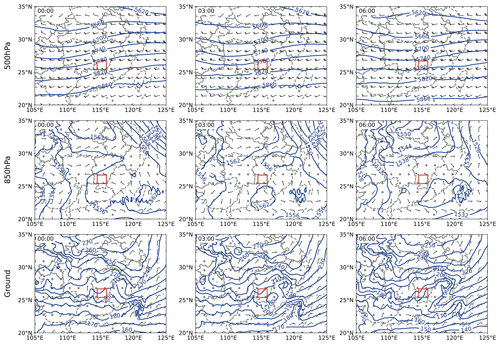
Figure 2The 500, 850 hPa, and surface geopotential height fields (blue contour lines; unit – geopotential meters (gpm)) and the wind fields (wind barbs) at 00:00 (UTC) on 25 December 2014. The area within the red box is the analysis range. Publisher's remark: please note that the above figure contains disputed territories.
2.2 Introduction to the microphysics scheme
The SBM-FAST scheme was initially developed by Khain and Lynn (2009) as a simplified version of the SBM-FULL bin scheme based on the original microphysics scheme included in the Hebrew University Cloud Model (HUCM; FSBM-1) (Khain and Sednev, 1996; Khain et al., 2000). The FSBM-2 used in this study is an improvement on the FSBM-1 by Shpund et al. (2019) and has been verified as exhibiting better simulation performance (Han et al., 2019).
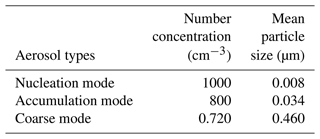
In FSBM-2, cloud and rain droplets are described using a unified liquid droplet bin scheme, which is divided into 33 bins. The aerosol scheme is divided into marine and continental components, and the aerosol spectrum distribution is described using 43 or 33 mass bins. Regardless of whether 33 or 43 aerosol bins are used, the maximum dry aerosol radius is set to 2 µm. In this scheme, aerosols are activated into liquid droplets only when cloud nucleation supersaturation conditions are met conditions (Pinsky and Khain, 2018). In the model, the minimum CCN size is assumed to be 0.003 µm, and the initial aerosol distribution is represented by the sum of three lognormal distributions corresponding to the nucleation mode (centered at 0.008 µm), accumulation mode (centered at 0.034 µm), and coarse mode (centered at 0.46 µm). The calculation of cloud droplet nucleation considers the effect of supersaturation, and the algorithm's accuracy is verified through comparison with large-eddy-simulation results (Ilotoviz et al., 2016).
2.3 Sensitivity experiment configuration
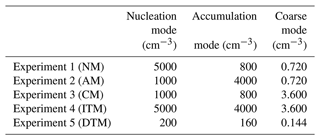
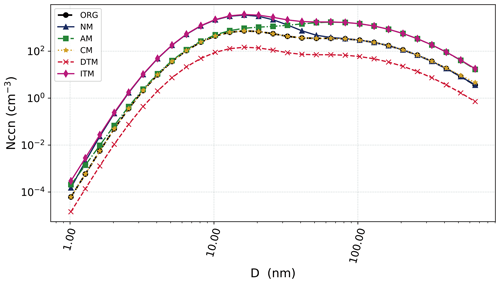
This paper includes five aerosol concentration modification experiments and one control experiment (ORG). The initial aerosol concentrations set in the control experiment are shown in Table 1. The initial aerosol concentrations are modified for the other five experiments, as shown in Table 2. According to an aircraft observational study on the impact of aerosol concentration changes on precipitation in eastern China (Qian et al., 2009) and a numerical simulation study on the effect of aerosol concentration changes on clouds and precipitation in eastern China (Fan et al., 2012), increasing the initial aerosol concentration 5 times reflects the background concentration of continental aerosols realistically under polluted conditions in eastern China. This adjustment is beneficial for demonstrating the realistic impacts of aerosol concentration changes on stratiform warm clouds in eastern China. Experiments 1, 2, and 3, modify the aerosol concentrations of the nucleation mode (NM), accumulation mode (AM), and coarse mode (CM), respectively, to 5 times their original values. Experiment 4 (ITM) simultaneously modifies the aerosol concentrations of the nucleation, accumulation, and coarse modes to 5 times their original values, and experiment 5 (DTM) reduces the aerosol concentrations by 5 times compared to the original group. The initial background aerosol spectra in the simulations are shown in Fig. 3.
2.4 Calculation of cloud droplet spectrum parameters
In this study, the changes in cloud droplet spectra and cloud droplet spectral parameters were analyzed. The mean cloud droplet radius (Rm), Rv, liquid water path (LWP), cloud–rain auto-conversion threshold (T), ε, and cloud droplet activation intensity (Fbs) were calculated as shown in the Supplement.
2.5 Introduction of data
2.5.1 Introduction of aircraft observation data
The aircraft observation data used in this study were sourced from a flight observation mission conducted in Jiangxi, China, on 25 December 2014. Observations were carried out using a Yun-12 aircraft equipped with a comprehensive set of aerosol–cloud–precipitation detectors. The cloud microphysical data were obtained from the Cloud–Aerosol Spectrometer (CAS), while flight altitude and path information were obtained from the Aircraft Integrated Meteorological Measurement System (AIMMS-20). To ensure the accuracy and reliability of the observation data, all probes and the observation platform were precisely calibrated prior to the observations, and outliers were removed from the post-observation data.
The observation flight area was located above Ganzhou city in Jiangxi province, spanning coordinates from 114.0 to 117.0° E and from 25 to 27° N. The aircraft took off from Ganzhou Airport and followed a flight pattern that included ascending, cruising, and spiralling down. The flight lasted from 01:29 to 04:45 (UTC), reaching a maximum altitude of 4126 m. To exclude data from non-cloud areas during the observation period, cloud region criteria of cloud liquid water content (Clw) > 0.001 g m−3 and number concentration of cloud droplets (Nc) > 10 particles cm−3 were applied (Jin et al., 2021; Wang et al., 2024).
2.5.2 Introduction to satellite-observed cloud-top temperature data
This study utilizes the standard format cloud-top temperature scan data from the MODIS (Aqua) satellite, with the satellite passing over the simulation area at 05:30 (UTC) on 25 December at a resolution of 5° × 5°. The Aqua satellite is part of NASA's Earth Observing System (EOS) and focuses on monitoring the Earth's water cycle. Equipped with the MODIS sensor, which has multispectral imaging capabilities ranging from visible to infrared wavelengths, Aqua provides high-resolution information on the Earth's surface and atmosphere. It is widely used in meteorological, oceanographic, and environmental research (Platnick et al., 2015).
3.1 Validation of simulation results
To verify the simulation performance of the control experiment, we compared the simulated results with cloud-top temperature observations from the MODIS (Aqua) satellite and aircraft observations on 25 December 2014.
Aircraft observation data on 25 December 2014 in Jiangxi province were chosen to further validate the simulated vertical distribution of cloud microphysical characteristics. The data were obtained from the CAS probe on board the aircraft, which measures aerosols and cloud particles with diameters ranging from 0.51 to 50 µm, covering 30 bins of varying size. The observation period was from 01:35 to 04:45 (UTC) on 25 December 2014. During the observation period, the stratiform warm cloud within the flight area had a maximum horizontal extent of over 50 km, and it was characterized as a stratiform warm-cloud process. For the control experiment, the cloud water content, cloud droplet number concentration, and average cloud droplet diameter were compared in the same observation duration and flight regions.
Figure 4 shows the flight trajectory and the cloud liquid water content along the observation path. To validate the control experiment's simulation results, a comprehensive cloud penetration segment from 04:10 to 04:20 UTC was selected. During this period, the Clw and Nc were calculated and compared to the simulation results in the same region and time frame, as illustrated in Fig. 5. To minimize the impact of differing vertical resolutions between aircraft observation data and model simulations, the cloud base height within the validation interval was set to 0 and the cloud-top height to 1, thus achieving height normalization. In the control experiment, the vertical distribution of Clw aligns well with the aircraft observations, both exhibiting a trend of increasing with height at first and then decreasing. The Clw values are relatively close between the simulation and observations below the mid-cloud region, but near the cloud top, the simulated Clw is slightly higher than that of the aircraft observations. Nevertheless, the maximum Clw in both cases occurs in the mid-cloud region. Additionally, the Nc in the control experiment is similar to the aircraft observations, with both showing no significant variation with height. The largest discrepancy appears in the Clw. This discrepancy may be due to the inherent errors in numerical simulations, as well as the differences in the resolution and the cloud sampling between the simulation and the aircraft observations. The spatial resolution of aircraft measurements can be from as fine as a few meters to tens of meters, while the numerical model's minimum grid resolution is 1 km. Therefore, the simulation results represent an average over a larger area within a similar temporal and spatial range. Moreover, the aircraft's flight path through the cloud may not have fully penetrated the entire cloud structure, with data possibly being collected from a narrower spatial range or from the cloud's edges. As a result, the observations may reflect the cloud's internal microphysical properties.
Figure 6 compares the cloud-top temperatures between the control experiment and the simulation results. During the simulation period, the MODIS (Aqua) satellite passed over the study region at 05:30 (UTC). To ensure consistency with the area observed by the aircraft, the comparison of cloud-top temperatures focuses on the region with concentrated warm clouds in southwestern Jiangxi. Both the control experiment and satellite observations show cloud-top temperatures in the range of 0–10 °C, with higher-temperature areas (5–10 °C) located west of 114° E. The results indicate that the observed cloud-top temperature distribution is consistent with the simulation results.
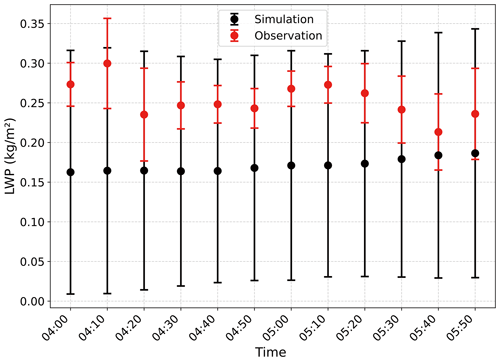
Figure 7 also compares the liquid water path (LWP) values observed by the ground-based microwave radiometer during the period of vigorous cloud development between 04:00 and 05:00 UTC. The RPG-HATPRO microwave radiometer features two bands: 22–31 GHz (7-channel filter-bank humidity profiler and LWP radiometer) and 51–58 GHz (7-channel filter-bank temperature profiler) (Liu et al., 2014). The microwave radiometer was located at 114.95° E, 25.85° N, and the simulation results were taken from the corresponding area centered on the radiometer. The results show a slight difference in the average LWP between the control experiment and the radiometer observations. However, the observed LWP values generally fall within the range of the simulated LWP, and their temporal distribution is largely consistent with the simulation. Overall, regarding the distribution of stratiform warm clouds and the vertical distribution of cloud microphysical properties, the simulation results are generally consistent with the observed data. Therefore, the simulation results are reliable.
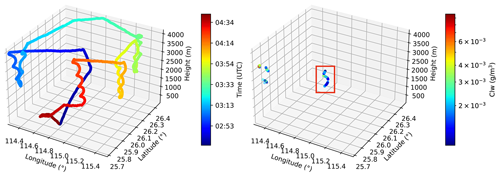
Figure 4Aircraft flight trajectory and cloud liquid water content (Clw) within the cloud region along the observation path. The red box indicates the comprehensive cloud penetration process from 04:10 to 04:20 UTC.
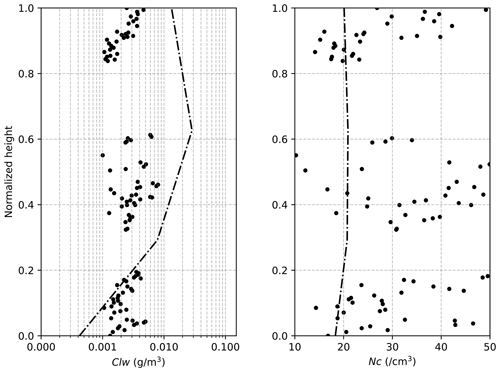
Figure 5Aircraft observations (scatter points) of cloud liquid water content (Clw; unit – g m−3), and cloud droplet number concentration (Nc; in cm3) on 25 December 2014 compared with model simulations (dashed black lines) of Clw and Nc.
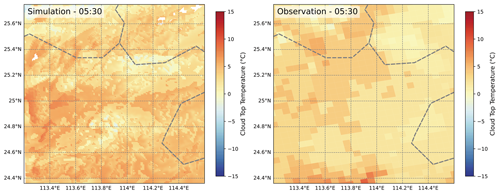
Figure 6Cloud-top temperatures observed by the MODIS (Aqua) satellite (05:30 UTC) and simulated by the control experiment on 25 December 2014. The dashed lines represent the provincial boundaries within China.
3.2 Analysis of the impact of background aerosols on warm cloud properties
3.2.1 Vertical distribution of cloud microphysical properties
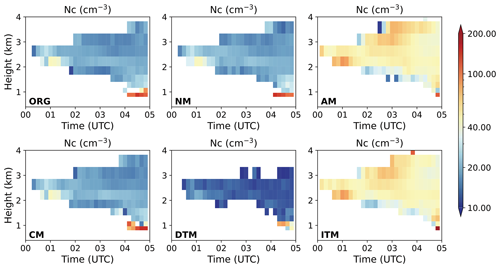
Figures 8–10 reflect that the cloud thickness significantly increases as the cloud system develops. Both Clw and Rm increase with height, showing high consistency. In contrast, Nc exhibits different trends with height at different times. From 00:00 to 02:00 UTC, when the cloud system is in the initial stage of development, Nc decreases with height, and many small cloud droplets appear at the cloud base, which is the main area for droplet activation. As the cloud system further develops from 03:00 to 04:00 UTC, Nc shows relatively uniform distribution with height. From 04:00 to 05:00 UTC, this trend changes again, with the maximum Nc appearing at the cloud base. Large numbers of small cloud droplets present at the cloud base, the primary area for droplet activation. The peak of Clw appears at higher cloud layers. In contrast, the maximum cloud droplet radius occurs in the middle to upper cloud layers, indicating that the main region of cloud droplet size increase is near the top and middle to upper parts of the cloud regions.
Compared to the control experiment, the increase in aerosol concentration promotes cloud development. This phenomenon is consistent with the findings of Khain et al. (2005) and Morrison et al. (2018). When the accumulation-mode aerosol concentration increases, this “promoting” effect becomes most evident. On the other hand, when aerosol concentration decreases, cloud development is suppressed, resulting in a noticeable decrease in cloud-top height.
In terms of cloud microphysical properties, with an increase in aerosol concentration, Nc noticeably increases. As a result, more cloud droplets of small sizes compete for water vapor, reducing cloud droplet size. The maximum Nc and minimum cloud droplet size are observed in the ITM and AM experiments. However, when aerosol concentration decreases despite cloud development being restrained, the DTM experiment exhibits the largest cloud droplet size.
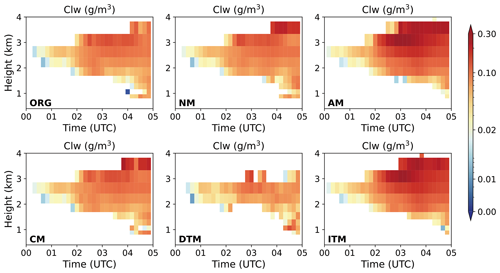
Figure 8The variations in averaged cloud liquid water content (Clw; unit – g m−3) with time (UTC) and altitude (km) within the study area of the different experiments. The acronyms in the bottom-left corners of the panels (and in all subsequent figures except Fig. 19) identify the results of different aerosol concentration variations for specific modes. The definitions and descriptions are provided in Table 2.
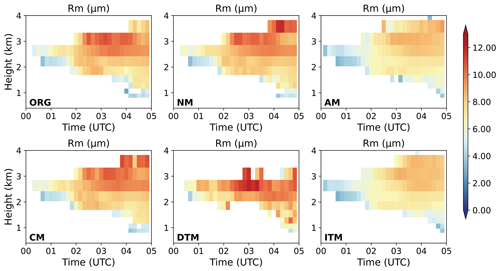
Figure 9The variations in averaged cloud droplet radius (Rm; unit – µm) with time (UTC) and altitude (km) within the study area of the different experiments.
3.2.2 Temporal distribution of regionally averaged cloud fraction
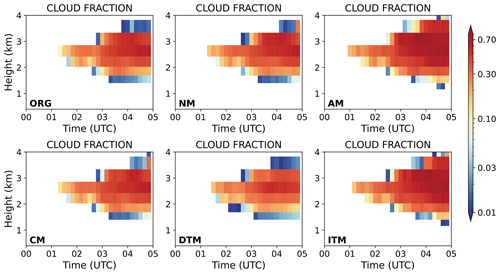
Figure 11 shows the hourly mean cloud fraction as a function of height. The cloud fraction in the model is a dimensionless ratio, representing the proportion of cloud cover within a grid cell. Throughout the simulation period from 00:00 to 05:00 UTC, the cloud fraction exhibits noticeable variations with both height and time, responding differently to changes in aerosol concentrations across the different modes. In the control experiment (ORG), the cloud fraction peaks between 2 and 3.5 km, with a maximum value exceeding 0.6 that occurs during the later stages of cloud development. This indicates strong cloud development in the mid-cloud layers.
In the NM and AM experiments, increased aerosol concentrations significantly enhance cloud formation, particularly between 03:00 and 05:00 UTC when the peak cloud fraction above 2 km increases. However, compared to the AM experiment, the increase in nucleation-mode aerosol concentration in the NM experiment has a weaker effect on promoting cloud fraction growth. In the AM experiment, the cloud fraction remains elevated above 3 km, suggesting extended cloud formation and persistence in the upper cloud layers. This result is consistent with the tendency of accumulation-mode aerosols to increase cloud droplet number concentrations and extend cloud lifetime, as reported by Liu et al. (2022). In the ITM experiment, the increase in cloud fraction is most prominent between 03:00 and 05:00 UTC, especially concentrated in the middle cloud layers at 2 to 3 km.
In contrast, the DTM experiment shows a significant reduction in cloud fraction, particularly in the upper cloud layers. The maximum cloud fraction only reaches about 0.4, with most cloud formation concentrated below 3 km. This suppression of cloud formation indicates that lower aerosol concentrations limit cloud development, reducing droplet activation and cloud water content.
3.2.3 Cloud droplet size distribution
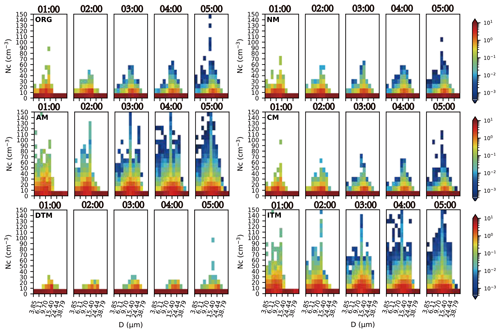
Figure 12 represents the hourly probability distribution of the averaged cloud droplet number concentration with respect to the mean diameter. As the cloud system develops, the cloud droplet spectrum widens and exhibits a unimodal distribution. When aerosol concentration increases, the cloud droplet spectrum broadens earlier, and the maximum Nc appears in the AM and ITM experiments. Additionally, the distribution characteristics of the droplet spectrum differ among the experiments. The AM and ITM experiments have their peaks in the 9–15 µm size range, while the NM and CM experiments have their peaks concentrated in the 15–24 µm size range. Meanwhile, with aerosol concentration decreasing in the DTM experiment, a tendency toward spectrum broadening is observed. However, the spectrum width is smaller than that in the control experiment, and the Nc is lower.
This analysis shows that increased aerosol concentration promotes cloud development and leads to an earlier widening of the cloud droplet spectrum. The increase in accumulation-mode aerosols tends to increase the number concentration of small-sized cloud droplets. In contrast, an increase in nucleation- and coarse-mode aerosols favors the production of large-sized cloud droplets. In the NM experiment, although the particle size of nucleation-mode aerosols is small, the increase in aerosol concentration still leads to an increase in cloud droplet number concentration because aerosol particle sizes follow a normal distribution in the WRF-SBM scheme. Therefore, aerosol particles with larger sizes within the nucleation-mode range can still participate in cloud droplet activation.
3.3 Analysis of cloud droplet spectrum characteristics
3.3.1 Vertical profiles of cloud droplet spectrum characteristics
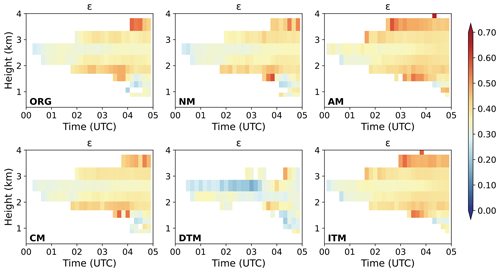
To analyze the impact of aerosols on cloud droplet spectra and cloud microphysical processes, Figs. 13–15 give out the variations in cloud–rain auto-conversion intensity (T), Rv, and hourly averaged ε with altitude. The T value represents the probability of auto-conversion occurrence, which can be used to assess the intensity of collision–coalescence processes during cloud and precipitation (Liu et al., 2005, 2006). In the early-development stage, the collision–coalescence intensity within the cloud is low. As the cloud system develops, at the vigorous-development stage, the T value increases significantly, and the intensity increases with altitude. The intense collision–coalescence processes (with T values > 0.5) are primarily located in the middle to upper parts of the cloud, consistent with the distribution trend of Rv with altitude. The relative dispersion ε does not change monotonically with Rv or T (Fig. 15). The correlation between them will be discussed in the next section.
Compared to the control experiment, the ITM and AM experiments have significantly smaller Rv values (Fig. 14), resulting in smaller cloud droplet sizes and lower collision–coalescence intensities than the other experiments. When the aerosol concentration decreases, the Rv in the DTM experiment increases, leading to higher collision–coalescence intensity compared to other experiments. Additionally, fewer small cloud droplets are activated due to the lower aerosol concentration in the DTM experiment, resulting in lower relative dispersion of cloud droplet spectra than in the other experiments.
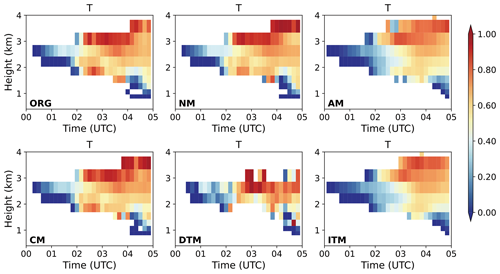
Figure 13Distribution of cloud droplet collision–coalescence intensity (T) over time (UTC) and altitude (km). The color shading indicates the collision–coalescence intensity values.
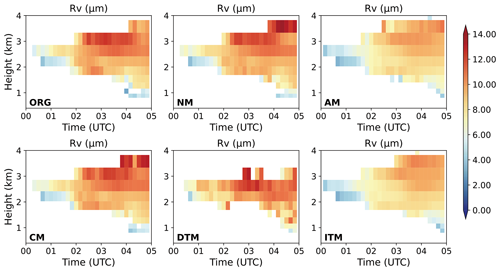
Figure 14Distribution of cloud droplet volume-weighted mean diameter (Rv; unit – µm) over time (UTC) and altitude (km). The color shading indicates the magnitude of Rv values.
3.3.2 Relationship between ε and Rv
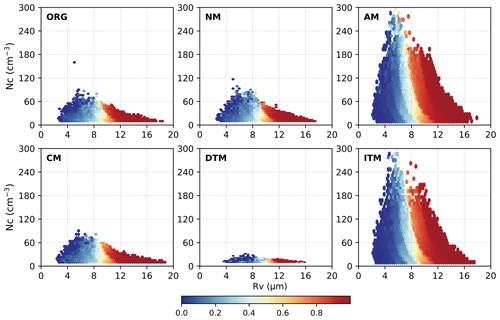
Figure 16 reflects the correlation between ε and Rv in experiments involving changes in concentration of aerosol modes within the cloud area from 01:00 to 05:00 UTC, illustrating the variation in ε during the growth of cloud droplet sizes. Fbs indicates the activation intensity corresponding to the fitted correlation in specific droplet size ranges. The ε–Rv correlation coefficient table is in the Supplement (Table S1). It can be seen that ε does not vary monotonically with Rv. There is a significant transition in cloud droplet collision–coalescence intensity around 8 µm radius of cloud droplets. When the Rv is smaller than 8 µm, cloud droplet growth mainly depends on the condensation process. At this stage, a critical radius (Rc) of 4.2 µm exists. When Rv < 4.2 µm, ε shows a positive correlation with Rv. While Rv > 4.2 µm, ε shows a negative correlation with Rv. This trend is close to that of Lu et al. (2020), but the value of Rc differs. Among the experiments, increased aerosol concentration enhances the positive correlation between ε and Rv, with Rv < 4.2 µm. In the ITM and AM experiments, when Rv is between 4.2 and 8 µm, the negative correlation trend changes to a positive one. In contrast, decreasing aerosol concentration strengthens the negative correlation trend between ε and Rv within the same size range (4.2 µm < Rv < 8 µm).
Cloud droplets primarily grow through condensation within the radius range (Rv) of 2–8 µm. Figure 17 illustrates the variation in cloud droplet number concentration (Nc) with Rv during the same stage as the ε–Rv correlation, reflecting the concurrent changes in Nc during the growth of cloud droplet sizes. As shown in Fig. 17, when Rv is less than 4.2 µm and is accompanied by higher intensity of cloud droplet activation, Nc increases with Rv, and ε shows a positive correlation with Rv. When Rv ranges between 4.2 and 8 µm, strong collision–coalescence processes have not yet been initiated, and activation intensity is lower. At this stage, Nc does not exhibit significant changes with increasing Rv. Due to the negative correlation between condensation growth efficiency and droplet size, smaller droplets grow rapidly through condensation, and larger droplets experience a slower growth rate. As Rv increases, ε exhibits a negative correlation with Rv, leading to a more uniform droplet size distribution and a narrower cloud droplet spectrum. This finding aligns with the results of Liu et al. (2006) and Peng et al. (2007). When Rv exceeds 8 µm, as Rv increases, higher collision–coalescence intensity rapidly depletes smaller droplets (Fig. 17), with ε showing a converging trend, ultimately approaching the range of 0.3–0.4, consistent with the findings of Lu et al. (2020).
For the sensitivity experiments, an increase in aerosol concentration enhances the activation of cloud droplets, enhancing the positive correlation between ε and Rv when 4.2 < Rv < 8 µm. Among different aerosol modes, an increase in accumulation-mode aerosol contributes to the prolonged maintenance of cloud droplet activation and significantly increases Nc (Fig. 17). When 4.2 < Rv < 8 µm, ε shows a positive correlation with Rv. However, when cloud droplet size increases above 8 µm, cloud droplet collision–coalescence intensity increases with particle size, while cloud droplet number concentration decreases as Rv increases. Therefore, in this situation, the dominant cloud droplet coalescence promotes the rapid growth of cloud droplet size, increasing large-sized cloud droplets while simultaneously consuming small-sized cloud droplets. As a result, ε tends to converge with droplet size.
It is shown in Fig. 17 that the correlation between Nc and cloud microphysical processes is more complex. Regions with the same Nc may be dominated by condensation growth or coalescence processes. Furthermore, the ε–Nc correlation, which is significantly influenced by cloud droplet activation, condensation, and collision–coalescence processes, may exhibit even more complex variations.
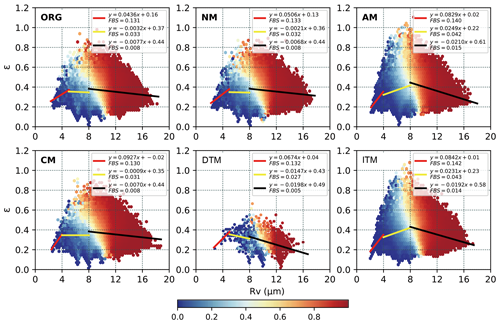
Figure 16The variation in relative dispersion (ε) of cloud droplet spectra vs. the cloud droplet volume-weighted radius (Rv; unit – µm) for different experiments. FBS indicates the cloud droplet activation intensity, and the shading represents the coalescence intensity.
3.3.3 Relationship between ε and Nc
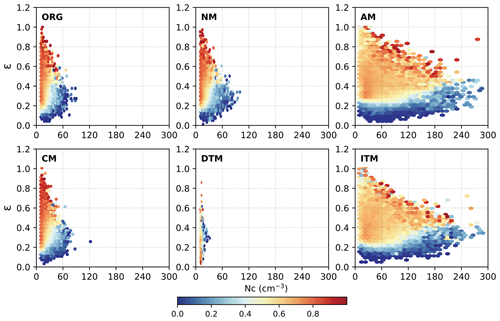
Figure 18 shows the relationship between ε and Nc in experiments involving changes in aerosol concentration modes within the cloud area from 01:00 to 05:00 UTC. As shown in Fig. 18, as Nc increases, ε tends to converge, consistent with the findings of Zhao et al. (2006) and Jin et al. (2021). Additionally, the coalescence intensity does not significantly impact the ε–Nc correlation. With increased coalescence intensity, the dispersion of ε in the low-Nc region decreases, but the ε–Nc relationship still shows a converging trend.
Compared to the control experiment, changes in aerosol concentration did not affect the ε–Nc correlation. When the aerosol concentration increased, Nc significantly increased, and in the AM and ITM experiments, the dispersion of ε slightly increased in the low-coalescence-intensity region. On the other hand, a decrease in aerosol concentration led to a significant reduction in Nc and increased cloud droplet size. In the region with T>0.8, the dispersion of ε was higher.
In this study, the increase in coarse-mode aerosol concentration resulted in an increase in Rv and enhanced collision–coalescence intensity, consistent with the findings of Liu et al. (2022). However, unlike Liu et al. (2022), the increase in nucleation-mode aerosol concentration in this study also promoted the early development of cloud tops above 3 km. Compared to the control experiment, both Rv and collision–coalescence intensity in the cloud-top region were enhanced. This difference may stem from the classification of aerosol particle sizes; in the WRF-SBM scheme, the distribution of different aerosol modes is assumed to follow a normal distribution. Therefore, for the nucleation mode, some aerosol particles also reach the size scale of the accumulation mode, promoting an increase in Nc and a rise in T values.
Moreover, due to the different physical mechanisms involved in the growth of cloud droplet sizes, aerosols of different modes exhibit varying effects. Here, we provide an additional summary based on the schematic mechanism in Fig. 19. When cloud droplet sizes are smaller than 8 µm, the collision–coalescence process is less active due to the smaller droplet sizes. The increase in accumulation-mode aerosol concentrations has the most pronounced effect on the activation of small cloud droplets, which enhances both the Nc and the condensational growth of droplets within the 4.2–8 µm range. This results in a shift in the correlation between the ε and the Rv from negative to positive. Aerosols in other modes have a less significant impact on the increase in Nc, which is why they do not alter the ε–Rv relationship. In contrast, a reduction in aerosol concentration weakens cloud droplet activation. As the droplets grow through condensation, their sizes become more uniform, thereby strengthening the negative correlation between ε and Rv when Rv is in the range of 4.2–8 µm.
The relationship between ε and cloud microphysical properties differs from previous studies. In this study, ε shows a convergence trend as Nc increases, and changes in aerosol concentration do not alter this trend but rather affect the degree of dispersion, like the findings of Deng et al. (2009). In contrast, study on non-precipitating stratiform clouds in northern China using aircraft observational data (Ma et al., 2010) showed that with an increase in aerosol concentration, ε tended to decrease with increasing Nc, whereas Anil Kumar et al. (2016) observed the opposite trend, with ε showing a positive correlation with Nc.
The complex variations in the ε–Nc relationship are mainly due to the sensitivity of Nc and ε to many microphysical processes, such as updraft strength, aerosol properties, or condensation-coalescence processes (Lu et al., 2012; Peng et al., 2007). During the fitting process of the ε–Nc relationship, it is challenging to determine the corresponding relationship between Nc and cloud microphysical processes. In regions with low Nc, it may correspond to strong collision–coalescence initiation zones, while in regions with high Nc, it may be in the condensation–coalescence dominant zone. As Liu et al. (2008) and Tas et al. (2012) have stated, compared to Nc, Rv considers the synergistic relationship between Nc and water content, providing a more explicit mapping to cloud microphysical processes. Therefore, this study explored the ε–Rv relationship to provide a more systematic understanding of the stratiform warm clouds in eastern China. The ε–Rv correlation is summarized in Fig. 16.
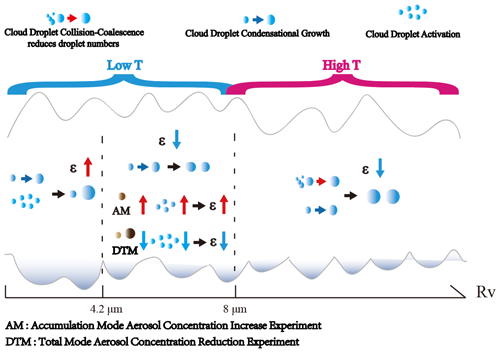
Figure 19Differences in the effects of aerosol modes on microphysical processes. Cloud droplet collision–coalescence reduces droplet numbers and represents the process where cloud droplet size increases while droplet number concentration decreases due to collision–coalescence growth. Cloud droplet condensational growth represents the process of cloud droplets growing by condensation. Cloud droplet activation refers to the activation of aerosol particles to form small cloud droplets. Upward-facing red arrows indicate an enhancement of physical quantities or processes, while downward-facing blue arrows indicate suppression.
This study used the SBM-FAST bin scheme in the WRF model to simulate a stratiform warm-cloud process in Jiangxi, China. Numerical experiments were further conducted to investigate the impact of changes in nucleation mode, accumulation mode, coarse mode, and total aerosol concentrations on the macroscopic and microscopic characteristics of stratiform warm clouds. The variations in cloud microphysical parameters with aerosol concentrations were analyzed; the ε–Rv and ε–Nc relationships were fitted to explore the influence of microphysical processes on ε. Specific conclusions are as follows.
The numerical simulation with the bin microphysics scheme reproduces stratiform warm clouds' macro- and microscopic characteristics in Jiangxi, China. Aerosols in the accumulation mode enhance cloud fraction by promoting cloud droplet nucleation and increasing cloud water content, while reduced aerosol concentrations suppress cloud fraction, particularly in the upper cloud layers. As the cloud system develops, Rv and T values gradually increase. Vertically, Rv increases with height, and T also strengthens synchronously with the enlargement of cloud droplet size. The relationship between ε and Rv is not strictly monotonic; as Rv increases, ε initially increases and then decreases. Furthermore, it was found that variations in aerosol concentrations exert a significant influence on cloud development. With an increase in the aerosol concentration of any mode, the cloud droplet spectrum widens earlier. Specifically, higher aerosol concentrations promote cloud growth, increasing cloud-top height. In comparison, lower aerosol concentrations impede cloud droplet activation, decreasing the concentration of cloud droplets and leading to a notable reduction in ε, increased Rv, and higher T values.
In contrast, different modes of aerosol concentration variation impact cloud microphysical properties differently. An increase in accumulation-mode aerosol tends to increase the concentration of small-size cloud droplets, leading to decreased Rv and a lower collision and coalescence intensity compared to the control experiment. An increase in nucleation-mode and coarse-mode aerosols favors the production of large cloud droplets. As a result, the increase in accumulation-mode aerosol has the most significant impact on Nc enhancement. On the other hand, increases in nucleation-mode and coarse-mode aerosol concentrations result in an increase in Rv and an enhancement of collision and coalescence intensity.
The variation in ε in the cloud is closely related to cloud microphysical processes. Fitting the ε with Rv and Nc reveals that as Rv increases, the correlation between ε and Rv changes from positive to negative, eventually converging. This transformation is mainly related to cloud droplet activation, condensation, and collision–coalescence processes within the cloud. When T values are less than 0.5, as cloud droplet condensation growth becomes more active and nucleation weakens, the cloud droplet spectrum relative dispersion transitions from an increasing trend to a decreasing trend with the increase in Rv. With the enhanced coalescence between cloud droplets, ε primarily decreases with the increase in Rv. Increasing accumulation-mode aerosol concentration contributes to the prolonged cloud droplet activation, causing the correlation between ε and Rv to shift from negative to positive. On the other hand, a decrease in aerosol concentration leads to a reduction in cloud droplet activation intensity, making the negative correlation trend between ε and Rv more pronounced. In addition, regardless of the different T values, ε converges with the increase in Nc. As Nc increases, ε converges to a range of 0.2–0.4. Changes in aerosol concentration for different modes do not alter the converging trend of ε with Nc but only affect the dispersion degree of ε at low Nc values.
Lastly, in this study, due to limitations of computational power, the vertical resolution of our simulation setup is relatively coarse. Future research could consider enhancing the resolution to reveal the variations in cloud–aerosol effects more effectively within the vertical profile of clouds. Moreover, while this study has explored the effects of variations in aerosol concentrations across different modes on the macroscopic and microscopic characteristics of stratiform warm clouds, mainly focusing on the influence of these variations on the relationship between ε and cloud microphysical properties, the interaction between clouds and aerosols is a complex process influenced by multiple factors, including cloud dynamics and supersaturation levels. Therefore, future research should investigate other vital factors affecting cloud–aerosol interactions further. Additionally, incorporating case studies from diverse regions could effectively reduce the regional dependency of cloud–aerosol effect research, thereby enhancing our comprehensive understanding of these complex interactions on a global scale.
The data used in this study can be accessed at the following link: https://doi.org/10.57760/sciencedb.11210 (Li et al., 2023). The data link includes the satellite-observed cloud-top temperature data, the WRF model simulation results, and the simulated initial aerosol spectrum information used in this study.
The cloud-top temperature data used in this study is obtained from NASA's Earth Observing System (EOS), specifically from the Aqua satellite within the MODIS instrument. The data has a horizontal resolution of 5 km × 5 km and is provided in .nc file format.
The WRF model simulation configurations are described in the article. The data format is .netcdf, and details about the data and their dimensions can be found in the data description.
The initial aerosol spectrum data include the distribution information of aerosol spectra within the first hour of the simulation for one control group and five experimental groups mentioned in the article. The temporal resolution is 10 min. Data details can be found in the data description.
In addition, the initial fields used in the numerical simulations are based on the fifth generation of ECMWF atmospheric reanalysis of the global climate (ERA5) hourly data on pressure levels. These data can be accessed at https://doi.org/10.24381/cds.bd0915c6 (Copernicus, 2018). The study utilized all height variables for every 6 h from 18:00 on 24 December 2014 to 06:00 on 25 December 2014.
The data can be accessed through the following link: (https://doi.org/10.57760/sciencedb.11210, Li et al., 2023). To access the data, you only need to use the database link and provide your name, affiliation, and purpose of the data request to the authors for download.
The supplement related to this article is available online at: https://doi.org/10.5194/acp-24-13525-2024-supplement.
Conceptualization – XL. Data curation – YL. Formal analysis – XL, YL, HC. Funding acquisition – XL. Investigation – XL, YL. Methodology – XL, YL. Resources – XL. Software – XL, YL, HC. Supervision – XL. Validation – YL, HC. Visualization – YL. Writing (original draft preparation) – YL. Writing (review and editing) – XL. All authors have read and agreed to the published version of the paper.
The contact author has declared that none of the authors has any competing interests.
Publisher's note: Copernicus Publications remains neutral with regard to jurisdictional claims made in the text, published maps, institutional affiliations, or any other geographical representation in this paper. While Copernicus Publications makes every effort to include appropriate place names, the final responsibility lies with the authors.
We acknowledge the High Performance Computing Platform of Nanjing University of Information Science & Technology for their support of this work. Moreover, this study was supported by the National Key Scientific and Technological Infrastructure project “Earth System Numerical Simulation Facility” (EarthLab).
This work was supported by the National Natural Science Foundation of China (grant nos. 42061134009 and 41975176) and the 2023 Jiangsu Provincial College Students’ Innovative Entrepreneurial Training Program (grant no. 202310300108Y).
This paper was edited by Jianping Huang and reviewed by Mónica Zamora Zapata and four anonymous referees.
Anil Kumar, V., Pandithurai, G., Leena, P. P., Dani, K. K., Murugavel, P., Sonbawne, S. M., Patil, R. D., and Maheskumar, R. S.: Investigation of aerosol indirect effects on monsoon clouds using ground-based measurements over a high-altitude site in Western Ghats, Atmos. Chem. Phys., 16, 8423–8430, https://doi.org/10.5194/acp-16-8423-2016, 2016.
Cecchini, M. A., Machado, L. A. T., Andreae, M. O., Martin, S. T., Albrecht, R. I., Artaxo, P., Barbosa, H. M. J., Borrmann, S., Fütterer, D., Jurkat, T., Mahnke, C., Minikin, A., Molleker, S., Pöhlker, M. L., Pöschl, U., Rosenfeld, D., Voigt, C., Weinzierl, B., and Wendisch, M.: Sensitivities of Amazonian clouds to aerosols and updraft speed, Atmos. Chem. Phys., 17, 10037–10050, https://doi.org/10.5194/acp-17-10037-2017, 2017.
Chandrakar, K. K., Cantrell, W., Chang, K., Ciochetto, D., Niedermeier, D., Ovchinnikov, M., Shaw, R. A., and Yang, F.: Aerosol indirect effect from turbulence-induced broadening of cloud-droplet size distributions, P. Natl. Acad. Sci. USA, 113, 14243–14248, 2016.
Chandrakar, K. K., Cantrell, W., and Shaw, R. A.: Influence of turbulent fluctuations on cloud droplet size dispersion and aerosol indirect effects, J. Atmos. Sci., 75, 3191–3209, 2018.
Chen, J., Liu, Y., Zhang, M., and Peng, Y.: New understanding and quantification of the regime dependence of aerosol-cloud interaction for studying aerosol indirect effects, Geophys. Res. Lett., 43, 1780–1787, 2016.
Copernicus: ERA5 hourly data on pressure levels from 1940 to present, Climate Data Store [data set], https://doi.org/10.24381/cds.bd0915c6, 2018.
Deng, Z., Zhao, C., Zhang, Q., Huang, M., and Ma, X.: Statistical analysis of microphysical properties and the parameterization of effective radius of warm clouds in Beijing area, Atmos. Res., 93, 888–896, 2009.
Desai, N., Glienke, S., Fugal, J., and Shaw, R.: Search for microphysical signatures of stochastic condensation in marine boundary layer clouds using airborne digital holography, J. Geophys. Res.-Atmos., 124, 2739–2752, 2019.
Fan, J., Leung, L. R., Li, Z., Morrison, H., Chen, H., Zhou, Y., Qian, Y., and Wang, Y.: Aerosol impacts on clouds and precipitation in eastern China: Results from bin and bulk microphysics, J. Geophys. Res.-Atmos., 117, D00K34, https://doi.org/10.1029/2010JD015257, 2012.
Flossmann, A. I. and Wobrock, W.: A review of our understanding of the aerosol–cloud interaction from the perspective of a bin resolved cloud scale modelling, Atmos. Res., 97, 478–497, 2010.
Grosvenor, D. P., Sourdeval, O., Zuidema, P., Ackerman, A., Alexandrov, M. D., Bennartz, R., Boers, R., Cairns, B., Chiu, J. C., and Christensen, M.: Remote sensing of droplet number concentration in warm clouds: A review of the current state of knowledge and perspectives, Rev. Geophys., 56, 409–453, 2018.
Han, B., Fan, J., Varble, A., Morrison, H., Williams, C. R., Chen, B., Dong, X., Giangrande, S. E., Khain, A., and Mansell, E.: Cloud-resolving model intercomparison of an MC3E squall line case: Part II. Stratiform precipitation properties, J. Geophys. Res.-Atmos., 124, 1090–1117, 2019.
Ilotoviz, E., Khain, A. P., Benmoshe, N., Phillips, V. T., and Ryzhkov, A. V.: Effect of aerosols on freezing drops, hail, and precipitation in a midlatitude storm, J. Atmos. Sci., 73, 109–144, 2016.
Jensen, J. B. and Nugent, A. D.: Condensational growth of drops formed on giant sea-salt aerosol particles, J. Atmos. Sci., 74, 679–697, 2017.
Jin, Y., Niu, S., and LÜ, J.: Study of the Microphysical Structural Characteristics and Cloud–Rain Autoconversion Threshold Function of Stratiform Warm Clouds in Jiangxi [J], Chin. J. Atmos. Sci., 45, 981–993, 2021.
Kant, S., Panda, J., and Gautam, R.: A seasonal analysis of aerosol-cloud-radiation interaction over Indian region during 2000–2017, Atmos. Environ., 201, 212–222, 2019.
Khain, A., Ovtchinnikov, M., Pinsky, M., Pokrovsky, A., and Krugliak, H.: Notes on the state-of-the-art numerical modeling of cloud microphysics, Atmos. Res., 55, 159–224, 2000.
Khain, A., Rosenfeld, D., and Pokrovsky, A.: Aerosol impact on the dynamics and microphysics of deep convective clouds, Q. J. Roy. Meteor. Soc., 131, 2639–2663, 2005.
Khain, A. and Lynn, B.: Simulation of a supercell storm in clean and dirty atmosphere using weather research and forecast model with spectral bin microphysics, J. Geophys. Res.-Atmos., 114, D19209, https://doi.org/10.1029/2009JD011827, 2009.
Khain, A. P. and Sednev, I.: Simulation of precipitation formation in the Eastern Mediterranean coastal zone using a spectral microphysics cloud ensemble model, Atmos. Res., 43, 77–110, 1996.
Kovačević, N.: Hail suppression effectiveness for varying solubility of natural aerosols in water, Meteorol. Atmos. Phys., 131, 585–599, 2019.
Kumar, B., Bera, S., Prabha, T. V., and Grabowski, W. W.: Cloud-edge mixing: Direct numerical simulation and observations in Indian Monsoon clouds, J. Adv. Model. Earth Syst., 9, 332–353, 2017.
Lau, K. and Wu, H.: Warm rain processes over tropical oceans and climate implications, Geophys. Res. Lett., 30, 2290, https://doi.org/10.1029/2003GL018567, 2003.
Lerach, D. G. and Cotton, W. R.: Simulating southwestern US desert dust influences on supercell thunderstorms, Atmos. Res., 204, 78–93, 2018.
Li, Y., Liu, X., Cai, H.: Satellite, Aerosol, and Numerical Simulation Dataset in Jiangxi, China [DS/OL], V2, Science Data Bank [data set], https://doi.org/10.57760/sciencedb.11210, 2023.
Liu, F., Mao, F., Rosenfeld, D., Pan, Z., Zang, L., Zhu, Y., Yin, J., and Gong, W.: Opposing comparable large effects of fine aerosols and coarse sea spray on marine warm clouds, Commun. Earth Environ., 3, 232, https://doi.org/10.1038/s43247-022-00562-y, 2022.
Liu, G., Shao, H., Coakley Jr, J. A., Curry, J. A., Haggerty, J. A., and Tschudi, M. A.: Retrieval of cloud droplet size from visible and microwave radiometric measurements during INDOEX: Implication to aerosols' indirect radiative effect, J. Geophys. Res.-Atmos., 108, AAC 2-1–AAC 2-10, 2003.
Liu, M., Li, L., Xu, L., Yu, J., and Liu, P.: Operation and maintenance of RPG-HATPRO multi-channel ground based microwave radiometer, Anal. Instrum., 89–92, https://doi.org/10.3936/j.issn.1001-232x.2014.05.018, 2014 (in Chinese).
Liu, Y. and Daum, P. H.: Indirect warming effect from dispersion forcing, Nature, 419, 580–581, 2002.
Liu, Y., Daum, P. H., and McGraw, R. L.: Size truncation effect, threshold behavior, and a new type of autoconversion parameterization, Geophys. Res. Lett., 32, L11811, https://doi.org/10.1029/2005GL022636, 2005.
Liu, Y., Daum, P. H., McGraw, R., and Miller, M.: Generalized threshold function accounting for effect of relative dispersion on threshold behavior of autoconversion process, Geophys. Res. Lett., 33, L11804, https://doi.org/10.1029/2005GL025500, 2006.
Liu, Y., Daum, P. H., Guo, H., and Peng, Y.: Dispersion bias, dispersion effect, and the aerosol–cloud conundrum, Environ. Res. Lett., 3, 045021, https://doi.org/10.1088/1748-9326/3/4/045021, 2008.
Liu, Y., Zhu, Q., Hua, S., Alam, K., Dai, T., and Cheng, Y.: Tibetan Plateau driven impact of Taklimakan dust on northern rainfall, Atmos. Environ., 234, 117583, https://doi.org/10.1016/j.atmosenv.2020.117583, 2020.
Lu, C., Liu, Y., Niu, S., and Vogelmann, A. M.: Observed impacts of vertical velocity on cloud microphysics and implications for aerosol indirect effects, Geophys. Res. Lett., 39, L21808, https://doi.org/10.1029/2012GL053599, 2012.
Lu, C., Niu, S., Liu, Y., and Vogelmann, A. M.: Empirical relationship between entrainment rate and microphysics in cumulus clouds, Geophys. Res. Lett., 40, 2333–2338, 2013.
Lu, C., Liu, Y., Yum, S. S., Chen, J., Zhu, L., Gao, S., Yin, Y., Jia, X., and Wang, Y.: Reconciling contrasting relationships between relative dispersion and volume-mean radius of cloud droplet size distributions, J. Geophys. Res.-Atmos., 125, e2019JD031868, https://doi.org/10.1029/2019JD031868, 2020.
Lu, C. and Xu, X.: Advances in the studies of cloud entrainment and mixing process, Torrent. Rain Disast., 40, 271–279, 2021 (in Chinese).
Ma, J., Chen, Y., Wang, W., Yan, P., Liu, H., Yang, S., Hu, Z., and Lelieveld, J.: Strong air pollution causes widespread haze-clouds over China, J. Geophys. Res.-Atmos., 115, D18204, https://doi.org/10.1029/2009JD013065, 2010.
Morrison, H., Witte, M., Bryan, G. H., Harrington, J. Y., and Lebo, Z. J.: Broadening of modeled cloud droplet spectra using bin microphysics in an Eulerian spatial domain, J. Atmos. Sci., 75, 4005–4030, 2018.
Pandithurai, G., Dipu, S., Prabha, T. V., Maheskumar, R., Kulkarni, J., and Goswami, B.: Aerosol effect on droplet spectral dispersion in warm continental cumuli, J. Geophys. Res.-Atmos., 117, D16202, https://doi.org/10.1029/2011JD016532, 2012.
Peng, Y., Lohmann, U., Leaitch, R., and Kulmala, M.: An investigation into the aerosol dispersion effect through the activation process in marine stratus clouds, J. Geophys. Res.-Atmos., 112, D11117, https://doi.org/10.1029/2006JD007401, 2007.
Pinsky, M. and Khain, A.: Theoretical analysis of the entrainment–mixing process at cloud boundaries. Part I: Droplet size distributions and humidity within the interface zone, J. Atmos. Sci., 75, 2049–2064, 2018.
Platnick, S., Ackerman, S., King, M., Meyer, K., Menzel, W., Holz, R., Baum, B., and Yang, P.: MODIS atmosphere L2 cloud product (06_L2), NASA MODIS Adaptive Processing System, Goddard Space Flight Center, 2, https://doi.org/10.5067/MODIS/MOD06_L2.061, 2015.
Prabha, T. V., Patade, S., Pandithurai, G., Khain, A., Axisa, D., Pradeep-Kumar, P., Maheshkumar, R., Kulkarni, J., and Goswami, B.: Spectral width of premonsoon and monsoon clouds over Indo-Gangetic valley, J. Geophys. Res.-Atmos., 117, D20205, https://doi.org/10.1029/2011JD016837, 2012.
Qian, Y., Gong, D., Fan, J., Leung, L. R., Bennartz, R., Chen, D., and Wang, W.: Heavy pollution suppresses light rain in China: Observations and modeling, J. Geophys. Res.-Atmos., 114, D00K02, https://doi.org/10.1029/2008JD011575, 2009.
Rosenfeld, D., Rudich, Y., and Lahav, R.: Desert dust suppressing precipitation: A possible desertification feedback loop, P. Natl. Acad. Sci. USA, 98, 5975–5980, 2001.
Rotstayn, L. D. and Liu, Y.: Sensitivity of the first indirect aerosol effect to an increase of cloud droplet spectral dispersion with droplet number concentration, J. Climate, 16, 3476–3481, 2003.
Rotstayn, L. D. and Liu, Y.: Cloud droplet spectral dispersion and the indirect aerosol effect: Comparison of two treatments in a GCM, Geophys. Res. Lett., 36, L10801, https://doi.org/10.1029/2009GL038216, 2009.
Seifert, A., Nuijens, L., and Stevens, B.: Turbulence effects on warm-rain autoconversion in precipitating shallow convection, Q. J. Roy. Meteor. Soc., 136, 1753–1762, 2010.
Shpund, J., Khain, A., Lynn, B., Fan, J., Han, B., Ryzhkov, A., Snyder, J., Dudhia, J., and Gill, D.: Simulating a mesoscale convective system using WRF with a new spectral bin microphysics: 1: Hail vs graupel, J. Geophys. Res.-Atmos., 124, 14072–14101, 2019.
Tas, E., Koren, I., and Altaratz, O.: On the sensitivity of droplet size relative dispersion to warm cumulus cloud evolution, Geophys. Res. Lett., 39, L13807, https://doi.org/10.1029/2012GL052157, 2012.
Tas, E., Teller, A., Altaratz, O., Axisa, D., Bruintjes, R., Levin, Z., and Koren, I.: The relative dispersion of cloud droplets: its robustness with respect to key cloud properties, Atmos. Chem. Phys., 15, 2009–2017, https://doi.org/10.5194/acp-15-2009-2015, 2015.
Wang, F., Li, Z., Zhao, D., Ma, X., Gao, Y., Sheng, J., Tian, P., and Cribb, M.: An airborne study of the aerosol effect on the dispersion of cloud droplets in a drizzling marine stratocumulus cloud over eastern China, Atmos. Res., 265, 105885, https://doi.org/10.1016/j.atmosres.2021.105885, 2022.
Wang, F. and Lu, C.: Advances of Theoretical, Observational, and Numerical Studies on Relative Dispersion of Cloud Droplet Spectra, Plateau Meteorol., 42, 809–820, 2023 (in Chinese).
Wang, X., Xue, H., Fang, W., and Zheng, G.: A study of shallow cumulus cloud droplet dispersion by large eddy simulations, Acta Meteorol. Sin., 25, 166–175, 2011.
Wang, Y., Niu, S., Lu, C., Liu, Y., Chen, J., and Yang, W.: An observational study on cloud spectral width in North China, Atmosphere, 10, 109, https://doi.org/10.3390/atmos10030109, 2019.
Wang, Y., Lu, C., Niu, S., Lv, J., Jia, X., Xu, X., Xue, Y., Zhu, L., and Yan, S.: Diverse dispersion effects and parameterization of relative dispersion in urban fog in eastern China, J. Geophys. Res.-Atmos., 128, e2022JD037514, https://doi.org/10.1029/2022JD037514, 2023.
Wang, Y., Jia, H., Zhang, P., Fang, F., Li, J., Zhu, L., Wang, Y., Wang, T., and Li, J.: Sensitivity of cloud microphysics to aerosol is highly associated with cloud water content: Implications for indirect radiative forcing, Atmos. Res., 309, 107552, https://doi.org/10.1016/j.atmosres.2024.107552, 2024.
Wehbe, Y., Temimi, M., and Adler, R. F.: Enhancing precipitation estimates through the fusion of weather radar, satellite retrievals, and surface parameters, Remote Sensing, 12, 1342, https://doi.org/10.3390/rs12081342, 2020.
Xie, X., Liu, X., and Wang, Z.: Review of influence of cloud droplet spectral dispersion on aerosol indirect effects, J. Earth Environ., 6, 127–134, 2015 (in Chinese).
Xie, X., Zhang, H., Liu, X., Peng, Y., and Liu, Y.: Sensitivity study of cloud parameterizations with relative dispersion in CAM5.1: impacts on aerosol indirect effects, Atmos. Chem. Phys., 17, 5877–5892, https://doi.org/10.5194/acp-17-5877-2017, 2017.
Yang, F., Lu, H., Yang, K., He, J., Wang, W., Wright, J. S., Li, C., Han, M., and Li, Y.: Evaluation of multiple forcing data sets for precipitation and shortwave radiation over major land areas of China, Hydrol. Earth Syst. Sci., 21, 5805–5821, https://doi.org/10.5194/hess-21-5805-2017, 2017.
Yang, S., Zhang, Y., Yu, X., Lu, C., and Li, Y.: Effects of aerosol number concentration and updraft velocity on relative dispersion during the collision–coalescence growth stage of warm clouds, Atmosphere, 14, 828, https://doi.org/10.3390/atmos14050828, 2023.
Yin, Y., Levin, Z., Reisin, T. G., and Tzivion, S.: The effects of giant cloud condensation nuclei on the development of precipitation in convective clouds – A numerical study, Atmos. Res., 53, 91–116, 2000.
Yum, S. S. and Hudson, J. G.: Adiabatic predictions and observations of cloud droplet spectral broadness, Atmos. Res., 73, 203–223, 2005.
Zhao, C., Tie, X., Brasseur, G., Noone, K. J., Nakajima, T., Zhang, Q., Zhang, R., Huang, M., Duan, Y., and Li, G.: Aircraft measurements of cloud droplet spectral dispersion and implications for indirect aerosol radiative forcing, Geophys. Res. Lett., 33, L16809, https://doi.org/10.1029/2006GL026653, 2006.
Zheng, X., Yang, Y., Yuan, Y., Cao, Y., and Gao, J.: Comparison of macro-and microphysical properties in precipitating and non-Precipitating clouds over Central-Eastern China during warm season, Remote Sens., 14, 152, https://doi.org/10.3390/rs14010152, 2021.
Zhu, L., Lu, C., Gao, S., and Yum, S. S.: Spectral Width of Cloud Droplet Spectra and Its Impact Factors in Marine Stratocumulus, Chin. J. Atmos. Sci., 44, 575–590, 2020.


