the Creative Commons Attribution 4.0 License.
the Creative Commons Attribution 4.0 License.
Viscosity of aqueous ammonium nitrate–organic particles: equilibrium partitioning may be a reasonable assumption for most tropospheric conditions
Liviana K. Klein
Allan K. Bertram
Andreas Zuend
Florence Gregson
Ulrich K. Krieger
The viscosity of aerosol particles determines the critical mixing time of gas–particle partitioning of volatile compounds in the atmosphere. The partitioning of the semi-volatile ammonium nitrate (NH4NO3) might alter the viscosity of highly viscous secondary organic aerosol particles during their lifetimes. In contrast to the viscosity of organic particles, data on the viscosity of internally mixed inorganic–organic aerosol particles are scarce. We determined the viscosity of an aqueous ternary inorganic–organic system consisting of NH4NO3 and a proxy compound for a highly viscous organic, sucrose. Three techniques were applied to cover the atmospherically relevant humidity range: viscometry, fluorescence recovery after photobleaching, and the poke-flow technique. We show that the viscosity of NH4NO3–sucrose–H2O with an organic to inorganic dry mass ratio of 4:1 is 4 orders of magnitude lower than the viscosity of the aqueous sucrose under low-humidity conditions (30 % relative humidity (RH), 293 K). By comparing viscosity predictions of mixing rules with those of the Aerosol Inorganic–Organic Mixtures Functional groups Activity Coefficients Viscosity (AIOMFAC-VISC) model, we found that a mixing rule based on mole fractions performs similarly when data from corresponding binary aqueous subsystems are available. Applying this mixing rule, we estimated the characteristic internal mixing time of aerosol particles, indicating significantly faster mixing for inorganic–organic mixtures compared to electrolyte-free particles, especially at lower RH. Hence, the assumption in global atmospheric chemistry models of quasi-instantaneous equilibrium gas–particle partitioning is reasonable for internally mixed single-phase particles containing dissolved electrolytes (but not necessarily for phase-separated particles), for most conditions in the planetary boundary layer. Further data are needed to see whether this assumption holds for the entire troposphere at midlatitudes and at RH > 35 %.
- Article
(5666 KB) - Full-text XML
- BibTeX
- EndNote
Aerosol particles are either emitted directly by anthropogenic activities and natural processes or form through gas–particle conversion. Their composition can be very complex, consisting of organic compounds, inorganic salts, or an internal mixture of both (Kanakidou et al., 2005; Fuzzi et al., 2006; Riemer et al., 2019). During their atmospheric lifetime, the composition may change via chemical reactions and gas–particle partitioning. The composition determines the physicochemical properties, such as the viscosity. Since molecular diffusivity is inversely proportional to dynamic viscosity, it affects the equilibration timescales of gas–particle partitioning of semivolatile organic and inorganic compounds and consequently long-range pollutant transport via aerosol particles (Shrivastava et al., 2017; Bastelberger et al., 2017; Mu et al., 2018). Global models often assume equilibrium partitioning is achieved for fine particulate matter within the typical model time steps used for periodic output (tens of minutes to ca. 1 h, e.g., Bian et al., 2017).
Ammonium nitrate (NH4NO3) is a semivolatile pollutant that is in equilibrium with ammonia and nitric acid in the gas phase and dissociates into ammonium and nitrate ions in an aqueous particle phase. Aqueous NH4NO3 generally remains in its ionic form and does not effloresce in aqueous solution at low relative humidities (Dassios and Pandis, 1999). Efflorescence is unlikely to occur in internally mixed aerosol containing secondary organic matter together with NH4NO3 (for example, in the findings of Marcolli et al., 2004). Currently, little is known about mass transfer limitations in viscous mixed NH4NO3–organic particles, potentially impeding gas–particle partitioning of ammonia and nitric acid. Due to significant efforts to reduce sulfur emissions in recent decades, the particulate nitrate sulfate ratio has generally increased (Weber et al., 2016). For example, following the implementation of the Clean Air Act in Beijing (2014–2017), the mass ratio of particulate nitrate / sulfate increased from 1.5 to 3.7 (Li et al., 2019). Recently, Liu et al. (2023) showed with particle rebound experiments that the relative humidity threshold for the transition from solid to liquid shifts to lower RH with increasing inorganic compound mass fraction. They concluded, “This allowed urban aerosol particles to exist in a liquid state at lower RH, and consequently, kinetic limitation by bulk diffusion in nitrate-dominated particles might be negligible,…”. This motivated us to study the viscosity of mixed NH4NO3–organic particles in detail in this work.
Only a few laboratory studies have been reported investigating the viscosity of internally mixed inorganic–organic aerosol systems (Tong et al., 2022; Song et al., 2021; Jeong et al., 2022; Rovelli et al., 2019; Power et al., 2013; Richards et al., 2020; Sheldon et al., 2023). The addition of inorganic salts to organic material in a liquid, homogeneously mixed particle is expected to decrease viscosity by orders of magnitude for all water activities for monovalent ions (Tong et al., 2022; Rovelli et al., 2019; Jeong et al., 2022). This decrease in viscosity is related to the plasticizing effect of the water associated with the hygroscopic salts. In contrast to these findings, Richards et al. (2020) and most recently Sheldon et al. (2023) report increased viscosities for certain mixed inorganic–organic systems compared to aqueous organic ones. Gel formation may explain this behavior for systems containing divalent ions (e.g., Ca2+ and Mg2+) as suggested by Richards et al. (2020). We know of only one study investigating the viscosity of an NH4NO3–organic system: Tong et al. (2022) reported an approximately 3 orders of magnitude lower viscosity at 40 % RH for levitated NH4NO3–sucrose particles with an organic-to-inorganic dry mass ratio (OIR) of 1 at a temperature of 298 K when compared to binary aqueous sucrose particles under the same conditions.
Currently, there are several methods to predict the viscosity of ternary systems: mixing rules based on data from the corresponding binary, aqueous mixtures and the Aerosol Inorganic–Organic Mixtures Functional groups Activity Coefficients Viscosity (AIOMFAC-VISC) thermodynamic model, which is applicable to any number of components of the mixture (Lilek and Zuend, 2022). Mixing rules have already been successfully applied to predict the viscosity of binary systems from data from pure components (Song et al., 2016b; Gervasi et al., 2020). However, for ternary systems, mixing rules have been tested in only two studies (Mahant et al., 2023; Rovelli et al., 2019). Of these two, only Rovelli et al. (2019) applied them to a mixed inorganic–organic (NaNO3–sucrose) system. They concluded that a mixing rule following the Zdanovskii–Stokes–Robinson (ZSR) relationship can predict the viscosity reasonably well. However, these and other simple mixing rules can only be applied if the viscosity of the binary systems is known. On the contrary, thermodynamic models such as AIOMFAC-VISC can predict the viscosity of complex mixtures of many components. However, data to validate and potentially improve this model are scarce. So far, it has only been tested for a limited number of inorganic–organic sucrose mixtures with NaNO3, (NH4)2SO4, Ca(NO3)2, and Mg(NO3)2 (Lilek and Zuend, 2022).
To address the shortcomings outlined above, we investigated internally mixed aqueous inorganic–organic solutions, droplets, and films consisting of NH4NO3 and a proxy for highly viscous organics, sucrose. We applied three different experimental techniques to determine viscosity in the atmospherically relevant RH range at room temperature (293.15 ± 1 K) for OIRs 1 and 4, namely viscometry, rectangular fluorescence recovery after photobleaching (rFRAP), and the poke-flow technique. We applied three different simple mixing rules to predict the viscosities of the ternary solutions based on those of the aqueous binary solutions, carried out simulations with AIOMFAC-VISC, and compared both of them with the experimental data. Furthermore, published data on the viscosity of inorganic–organic mixed aerosol particles were collected, and we assessed the applicability of the three mixing rules to this modest dataset. Finally, we used the average compositional data of aerosol particles collected by Zhang et al. (2011) to estimate the viscosities and the corresponding characteristic mixing times of internally mixed single-phase aerosol particles at three different locations to evaluate whether equilibrium partitioning is a valid assumption in global models for typical conditions of the planetary boundary layer (PBL).
2.1 Sample preparation
For all viscosity measurements, bulk solutions of NH4NO3–sucrose–H2O were prepared beforehand. Sucrose (purity 99 %, Alfa Aesar) and NH4NO3 (purity ≥ 99 %, Sigma-Aldrich) were used. Solutions containing OIRs of 1 and 4 were prepared at 20 wt % with Millipore-water (resistivity ≥ 18.2 MΩ cm). The solutions were freshly prepared before each measurement to avoid evaporation of HNO3 and NH3 from the solution before the experiment.
2.2 Poke-flow technique to measure viscosity in droplets
The poke-flow technique has been described in detail elsewhere (Murray et al., 2012; Grayson et al., 2015). To generate sample droplets, the solution was nebulized onto hydrophobic slides (d = 11 mm, Hampton Research, Canada), obtaining droplets with diameters of 50–200 µm. Subsequently, the slides were placed in a flow cell and mounted above an objective (40×) of an inverse optical microscope (AmScope, ME1400TC-INF). The flow cell was maintained at room temperature (293 ± 1 K), and relative humidity was controlled. The RH was controlled by combining dry and humidified zero air with flow rates in the range of 500–1000 sccm. To determine the relative humidity we need both the air temperature and the dew-point temperature, which are measured with a thermocouple mounted on the flow cell (OMEGA, HH-200a) and a chilled mirror hygrometer downstream of the cell (General Eastern optical dew point sensor, 1311DR; uncertainty ± 2.5 %). After RH was adjusted, we allowed the droplets to equilibrate with the surrounding conditions (see Appendix C for details). After conditioning, the droplets were poked with a 25 µm diameter tungsten needle (Roboz Surgical Instruments Co.). This deformed the droplet into a half-torus geometry. To minimize surface energy, the droplets recovered to a minimum surface (near-spherical) shape. The time needed to recover, the experimental relaxation flow time, was measured by taking pictures with a camera (AmScope, MA1000) every 500 ms. Pictures were analyzed with the software ImageJ (Collins, 2007). The outer area of the particle and the area of the poked hole were determined right after poking and after a certain relaxation time, namely, until the hole created by poking had reached one-quarter of its initial area or less if the relaxation time was on the order of days. Figure 1 shows a typical poke-flow experiment. The relaxation time was used to obtain the viscosity of this process through fluid dynamics simulations with the COMSOL multiphysics software; details are explained in Grayson et al. (2015). Surface tension, slip length, and the contact angle are the input parameters for the simulation and are shown in Table 1. The contact angle of a NH4NO3–sucrose–H2O (OIR = 4) droplet was measured with a laser scanning microscope (see Fig. A1). Slip length and surface tension values were based on measurements reported in the literature and represent conservative upper and lower limits (see Table 1, footnotes). At least three replicates were performed for each RH. The maximum upper and minimum lower limits of the viscosities are reported as error bars in Figs. 4 and 5 in the results section. If the droplets cracked upon poking, we report a lower limit of 5 × 10⁸ Pa s based on reference experiments by Renbaum-Wolff et al. (2013).

Figure 1Example of a poke-flow experiment. Microscopy images (40×) taken during the experiment before and after poking of a sucrose–NH4NO3–H2O (OIR = 4) droplet at 5 % RH and 293 ± 1 K. The droplet cracks during poking and does not show any movement for approximately 16 h.
Table 1Parameters for the COMSOL flow simulation for NH4NO3–sucrose–H2O (OIR = 4) experiments at 293 ± 1 K.
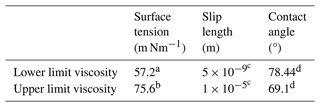
a This value has been used previously to represent a lower limit for sucrose–water solutions (Grayson et al., 2015; Rovelli et al., 2019). This number is also a lower limit to the surface tension observed in levitated sucrose–water droplets (Power, 2014; Singh et al., 2023).
b The surface tension of sucrose based on the extrapolation of aqueous sucrose measurements (MacDonald et al., 1996).
c The slip length is based on measurements of water and organic compounds on hydrophobic surfaces (see references in Grayson et al., 2015)
d To obtain a lower limit of the contact angle, Rhodamine 6G was added to the bulk solution and nebulized onto a siliconized glass slide (Hampton Research, Canada) at room conditions. The slide was placed under a confocal laser scanning fluorescence microscope (Zeiss Axio Observer LSM 510MP, oil objective, 60× magnification). A vertical profile was recorded for more than three droplets. With the height and radius of the vertical profile, the upper and lower limit of the contact angle were calculated, assuming a spherical geometry. Note that the simulated viscosities only depended weakly on the contact angles. For example, if the contact angle is changed by ±10 %, the simulated viscosities change on average by only roughly ±15 %, which is small compared to the overall uncertainties in the simulated viscosities (> 10×) (Rovelli et al., 2019).
2.3 rFRAP to determine viscosities
The rectangular fluorescence recovery after photobleaching (rFRAP) method has been described in detail previously (Deschout et al., 2010; Evoy et al., 2021; Chenyakin et al., 2017). With this method, the diffusion coefficient of a fluorescent dye that diffuses through a sample solution can be determined. In short, a rectangular square is photobleached in the sample, and then after some time fluorescence in this photobleached region recovers due to diffusion of unbleached dye into the photobleached region and photobleached dye molecules out into the unbleached region. From the time dependence of this recovery, a diffusion coefficient, Ddye, of the dye in the sample solution was determined. Afterward, the Ddye was used to calculate the dynamic viscosity, η, of the mixture assuming that the Stokes–Einstein relation holds:
where k is the Boltzmann constant, T is the absolute temperature, and rdye is the apparent radius of the diffusing molecule, which is assumed to be spherical. Since the size of the fluorescent dye used in these experiments is similar to or larger than the matrix molecules, the Stokes–Einstein relation should give reasonable estimates of the viscosities in these experiments (Evoy et al., 2020, 2019; Chenyakin et al., 2017). To prepare the sample for the rFRAP experiments, first, Rhodamine B isothiocyanate dextran (Sigma-Aldrich, rdye = 5.8 nm; Paës et al., 2017) was added as a fluorescent dye to the bulk solutions of aqueous NH4NO3–sucrose (0.01 mM). The solution was pipetted onto glass slides (Hampton Research, Canada), which were covered with vacuum grease on the perimeter. The samples were equilibrated above a saturated salt solution within a sealed glass jar, such that the headspace exhibited controlled RH (at 293 ± 1 K; K2CO3, NaBr, and NaCl for RH = 43 %, 59 %, and 75 %, respectively). The time required for the droplets to equilibrate with the gas phase was estimated using the characteristic mixing time τ of a droplet of radius rdroplet (Preston, 2022):
where is the diffusion coefficient of water in the condensed phase. The determination of the diffusion coefficients for the solution species of interest is described in detail in Appendix C. After equilibration, the jar containing the glass slides was placed inside a glove bag (Glas-Col, Terre Haute USA) with controllable RH. RH was controlled using a dry and humidified flow of nitrogen gas and is monitored with a handheld hygrometer (Omega RH85; uncertainty ± 2.5 %). When the RH in the glove bag reached the same RH as that in the jar, the jar was opened. A second glass slide was placed on top of the first glass slide containing the droplets, sandwiching the droplets into thin films ranging from 25 to 140 µm. Subsequently, the prepared sample was placed under a confocal laser scanning fluorescence microscope (Zeiss Axio Observer LSM 510MP; 0.3 NA objective, 10×) at room temperature (293 ± 1 K). A rectangular region was photo-bleached in the center of the sample using a 543 nm HeNe laser. The intensity of the laser was adjusted so that the fraction of photo-bleached molecules was around 30 %. Next, the confocal laser scanning fluorescence microscope was used to record fluorescence images of the sample and monitor the recovery of the fluorescence intensity in the photo-bleached region. Fluorescence images were processed with the software ImageJ (Collins, 2007). Time-lapse images of a representative rFRAP experiment are shown in Fig. 2. A MATLAB software program was used to determine the diffusion coefficient of the processed images using a mathematical description of the fluorescent intensity as a function of position and time after photobleaching as described in Deschout et al. (2010).

Figure 2Images from a typical rFRAP experiment. Diffusion of Rhodamine B isothiocyanate–Dextran in NH4NO3–sucrose–H2O (OIR = 4) at 59 % RH and 293 K. The first image shows the sample prior to photobleaching, with the black square indicating the region to be photobleached (19 µm × 19 µm). The other three images show the sample at different time points after photobleaching (t = 0, 100, and 300 s) and the recovery of the fluorescence.
2.4 Viscometry to measure viscosity in bulk solutions
For viscometer experiments, bulk solutions near saturation were prepared for OIR 1 and 4 and diluted with Milli-Q water to reach higher water activities. Water activities were measured for these compositions with an Aqualab water activity meter (aw precision of ±0.003). The viscosity of the sample solution was measured on the day of preparation to avoid evaporation. Since these were independent measurements, we approximated the uncertainty in water activity with ±2 % to account for small compositional differences.
Most bulk viscosity measurements were performed by the UBC BioProducts Institute with a rheometer (MCR302, Anton-Parr). Three replicates were performed for each water activity at a temperature of 298.1 ± 0.1 K. The shear rate varied from 1 to 1000 s−1. The viscosity average over all shear rates is reported for each solution assuming a Newtonian fluid.
The viscosities obtained for 298 K were converted to other temperatures, e.g., 293 K, by application of the Arrhenius equation for better comparability with our other measurements, which are conducted at 293 K,
Here, EA is the apparent activation energy of diffusion for viscous flow; for dilute aqueous sucrose solutions, EA is estimated to be 50 kJ mol−1 (Kiland et al., 2019). η is the dynamic mixture viscosity at temperature T, ηref is the corresponding viscosity at the reference temperature Tref, and R is the ideal gas constant.
Two additional viscosities for OIR = 1 at aw = 0.68 and 0.73 were measured with the Viscometer LVDV-II+ (Brookfield) with a YULA-15 spindle (1–2000 mPa s). The water bath was set to T = 293 K, and the sample was equilibrated with the water bath for at least 15 min. Three replicates were performed for each water activity. The water activity was measured with Aqualab for the same solutions.
2.5 Mixing rules to predict ternary mixture viscosities
To predict the viscosity of ternary solutions from known viscosities of binary aqueous solutions, we applied three different mixing rules. They all follow the same mathematical principle of summing the logarithms of the viscosities of the binary solutions but with different meanings of the coefficients f1 and f2:
where η is the viscosity of the ternary solution at a particular water activity, η0 denotes unity viscosity (1 Pa s), and ηi(aw) are the viscosities of the binary aqueous solutions at the same water activity.
First, we use a mole-fraction-based mixing rule, which was proposed by Arrhenius (1887) for predicting the viscosity of binary solutions, where f1 and f2 are the dry mole fractions of components 1 and 2. Second, the same approach is used, but mole fractions are replaced by mass fractions. Finally, and alternatively, Zdanovskii–Stokes–Robinson (ZSR; Zdanovskii, 1948; Stokes and Robinson, 1966) proposed an approach for estimating the water content of ternary solutions by adding up the water content of the two corresponding binary subsystems at the same water activity. A similar approach can be used to estimate the viscosity of a ternary mixture based on the corresponding binary aqueous subsystem viscosities at given RH (or water activity). We follow the same approach as applied by Song et al. (2021) and described in detail by Lilek and Zuend (2022), where f1 is
and ; winorg and worg are the mass fractions of the inorganic and organic compounds, respectively; and OIR is the organic-to-inorganic dry mass ratio.
The ZSR-based method preserves the OIR of the original multicomponent mixture, while the mole-fraction-based mixing rule does not. In addition, the weighting factors (f1, f2) need to be recomputed for each water activity level, since they are not constant even when the OIR is constant (Lilek and Zuend, 2022).
In this study, we applied the outlined viscosity mixing rules to the NH4NO3–sucrose–H2O systems that we studied in detail but also to published data for inorganic–organic mixed particles containing water, sucrose, and one of the following salts: NaNO3, NaCl, (NH4)2SO4, Ca(NO3)2, or Mg(NO3)2 (Rovelli et al., 2019; Power et al., 2013; Tong et al., 2022; Jeong et al., 2022; Song et al., 2021).
Viscosities for aqueous inorganics were obtained from the CRC Handbook of Chemistry and Physics (Rumble, 2023), Laliberté collection (Laliberté, 2007), and from other published data (Power et al., 2013; Song et al., 2021; Baldelli et al., 2016). Equilibrium water activities were calculated for the binary concentrations using the thermodynamic models E-AIM and AIOMFAC at 293.15 K, except where otherwise indicated. We use E-AIM for NH4NO3, (NH4)2SO4, NaNO3 (298.15 K), and NaCl (298.15 K) (Clegg et al., 1998; Friese and Ebel, 2010), and since Ca(NO3)2 and Mg(NO3)2 are not parameterized in E-AIM we use AIOMFAC instead (Zuend et al., 2008, 2011). We fitted polynomial functions to these binary aqueous-salt data to parameterize the viscosity as a function of water activity. For NH4NO3 we only considered the data by Laliberté (Laliberté, 2007) since they were measured at the temperature of interest, and we added a data point for the viscosity under dry conditions estimated from the subcooled NH4NO3 melt viscosity (Booth and Vinyard, 1967), as explained in Appendix A (see Fig. 3a). For aqueous sucrose, we fitted a polynomial function to the previously published viscosity data, our measurements, and assumed a viscosity of 1012 Pa s for the glass transition at 28 % RH and 293 K (Zobrist et al., 2008) (see Fig. 3b). The parameters for all fits are given in Table A1.
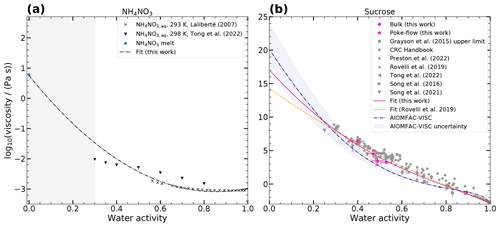
Figure 3Measured and predicted log 10(viscosity (Pa s)−1) of binary mixtures as a function of water activity at 293–298 K. Panel (a) shows log 10(viscosity (Pa s)−1) of aqueous NH4NO3 from published data (Laliberté, 2007; Tong et al., 2022; Booth and Vinyard, 1967) and a polynomial fit of the Laliberté and Booth data (dash-dotted gray line). Panel (b) shows log 10(viscosity (Pa s)−1) of aqueous sucrose measured in this work and in published experimental data, a polynomial fit (solid pink line), a fit by Rovelli et al. (2019) (dashed orange line), and independent predictions by the AIOMFAC-VISC model (dash-dotted blue line).
2.6 AIOMFAC-VISC to predict multicomponent mixture viscosities
AIOMFAC-VISC is an extension of the AIOMFAC model (Zuend et al., 2008, 2011) for the purpose of thermodynamics-based viscosity predictions in liquid (amorphous) phases. This viscosity model is described in detail by Gervasi et al. (2020) and Lilek and Zuend (2022). AIOMFAC is a thermodynamic group-contribution model primarily for the prediction of non-ideal mixing effects in multicomponent solutions, e.g., to determine activity coefficients and to facilitate the prediction of liquid–liquid phase separation under given equilibrium conditions. With the update by Lilek and Zuend (2022), AIOMFAC-VISC can predict the viscosity of organic–inorganic aerosol particle phases as a function of composition and temperature, in addition to other outputs such as water activity. Pure-component viscosity values of organic mixture components at a temperature of interest need to be provided as inputs to AIOMFAC-VISC or, alternatively, can be estimated during calculations via parameterizations or structure–activity relationships (e.g., DeRieux et al., 2018; Armeli et al., 2023).
The viscosity of NH4NO3 was modeled with the online version of the AIOMFAC-VISC model, while sucrose was modeled with an updated offline version (Jeong et al., 2022) to capture the water uptake of sucrose more accurately. For ternary solutions, the “aquelec mixing” model was applied, in which the viscosity of the solution was computed using the modified viscosity of water properties in an aqueous organic subsystem. This is achieved by accounting for how the electrolytes dissolved in the available water impact the viscosity of this hypothetical organic-free subsystem (see Lilek and Zuend, 2022, for details). In this work, predictions were made for the same systems and OIR conditions as those studied in the experiments. All viscosities are predicted for 293.15 K.
3.1 Viscosity measurements (viscometry, poke-flow, and rFRAP)
In order to determine the viscosities of the ternary mixture of NH4NO3–sucrose–H2O across the full water activity range, we applied three different measurement techniques: viscometry, the poke-flow technique, and rFRAP. In this study, we measured mixtures of NH4NO3–sucrose–H2O with OIRs of 1 and 4, which are similar to what have been observed in terms of organic-to-inorganic mass ratios in the lower troposphere (Zhang et al., 2011).
The viscosity data of all measurements are shown in Fig. 4 (viscometry – circles; poke-flow – diamonds; and rFRAP – squares; for tabulated results, see Tables C1, C2, and C3), together with the data from Tong et al. (2022). We provide regression lines for aqueous sucrose and aqueous NH4NO3 for comparison (dashed gray line and dash-dotted gray line, respectively).
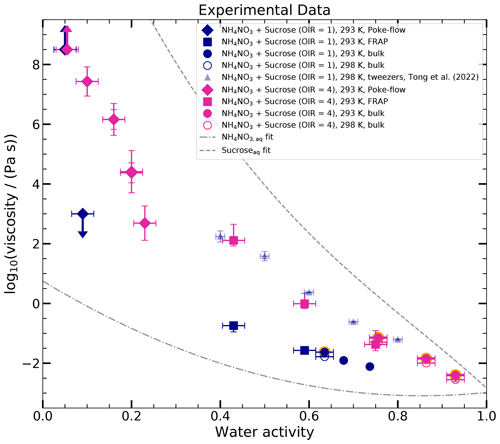
Figure 4Experimental data of the log 10(viscosity per pascal second) as a function of water activity of the ternary system sucrose–NH4NO3–H2O with OIR = 1 (blue) and OIR = 4 (pink) at 293 and 298 K. Different symbols indicate various measurement techniques: poke-flow (diamonds), rFRAP (squares), and viscometry/bulk (circles). The results of the poke-flow measurements are shown as the maximum and minimum of the simulated upper and lower viscosities of at least three replicates for each water activity. Diamonds represent the midpoints to guide the eye. Arrows in the upward and downward directions represent the lower and upper limits of the viscosities, respectively. Several error bars are present at the same water activity if two measurements were conducted for different equilibration times. The uncertainty in aw for the poke-flow technique originates from the uncertainty in the hygrometer, ±2.5 %. The rFRAP results (squares) represent the mean of at least three repeat measurements, with the error bar representing the maximum and minimum of the repeats. The aw error for the rFRAP results from the uncertainty in the hygrometer, ±2.5 %. Open circles indicate bulk measurements at 298 K that are converted to 293 K (filled circles with orange edges) using the Arrhenius equation. Bulk measurements at 293 K are shown as filled circles without orange edges. The aw error is assumed to be ±2 % due to possible compositional differences between the sample used for the viscosity measurement and the one used to measure the water activity. When the water activity was measured from the same sample as the one used in the viscosity measurements, the aw error is smaller than the data point. Fitted curves for aqueous sucrose (dashed gray line) and aqueous NH4NO3 (dash-dotted gray line) are shown for comparison. The light-blue triangles are published data for an OIR = 1 measured with optical tweezers by Tong et al. (2022).
For the bulk solutions, we determined viscosities from 0.008 to 0.017 Pa s (aw = 0.74 to aw = 0.635) for an OIR of 1 (blue) and 0.003 to 0.05 Pa s (aw = 0.93 to aw = 0.76) for an OIR of 4 (pink). For comparison, all of these solutions are less viscous than 10−1 Pa s (typical of olive oil; Koop et al., 2011).
The viscosities obtained via FRAP (squares, aw = 0.75 to aw = 0.43) agree well with the bulk measurements and continue the trend towards higher viscosities. The viscosity of the solution with OIR = 1 with a water activity of 0.43 is approximately 10−1 Pa s (similar to olive oil), and the one for the OIR = 4 is 102 Pa s (similar to ketchup; Koop et al., 2011).
With the poke-flow technique, for OIR = 4 we were able to obtain viscosities in the water activity range from 0.25 to 0.05. Viscosities range from 103 Pa s (peanut butter) to 108 Pa s (pitch). The droplets at aw of 0.05 cracked upon poking; thus a lower limit of 5×10⁸ Pa s was assumed. For the OIR = 1 sample, only an upper and lower limit (arrows) of the viscosity could be obtained. The droplets recovered immediately after the needle was removed for water activities ≥ 0.1. Since the shape recovery was faster than the fastest recovery of the sample with OIR = 4, we assume that the viscosity measured from the OIR = 4 sample is an upper limit for the sample with OIR = 1 (η ≤ 103 Pa s). The droplet cracked when poked for water activities ≤ 0.05; i.e., η ≥ 5×10⁸ Pa s.
The measured viscosities cover a wide range of about 10 orders of magnitude (10−1 to 108 Pa s). We observed a very sharp transition from liquid to semi-solid/glassy under low-humidity conditions for OIR = 1 (between aw of 0.1 and 0.05) and a more gradual increase for OIR = 4 (between 0.25 and 0.05). The viscosities of the mixed systems are between the viscosities of the binary solution of aqueous NH4NO3 and aqueous sucrose. Furthermore, the viscosities of OIR = 1 are lower than those of OIR = 4. A decrease in viscosity is expected when hygroscopic ions are added to an organic matrix due to the plasticizing effect of water (Zobrist et al., 2008; Koop et al., 2011).
The only existing data for aqueous NH4NO3–sucrose (OIR = 1) were reported by Tong et al. (2022), who used optical tweezers to measure viscosity. Their data are approximately 1 order of magnitude higher than ours for aw ≈ 0.7 and almost 3 orders of magnitude for aw ≈ 0.4. These differences significantly exceed the measurement uncertainties reported. Since the uncertainties in the bulk viscometry measurements are characterized well (±1 % according to the manufacturer), we conclude that the Tong et al. (2022) data are questionable.
The trend of viscosities with water activity observed in this study is similar to previously reported data for sucrose mixtures with other inorganic salts (Rovelli et al., 2019; Song et al., 2021; Jeong et al., 2022). As water acts as a plasticizer, a decrease in water activity is generally associated with an increase in viscosity. However, unlike Song et al. (2021) and the speculations of Jeong et al. (2022), who looked at different systems that crystallize more easily, in our system we do not believe that a phase change is responsible for the significant increase in viscosity below aw of 0.1. Our optical images indicate that NH4NO3 does not effloresce in our droplets, and a gel transition, as suggested by Song et al. (2021), is not expected for monovalent ions. However, we cannot prove that no crystallization of NH4NO3 occurred, causing the sudden increase in viscosity below aw equal 0.1 for the mixed droplets with OIR = 1.
3.2 Viscosity predictions of ternary solutions with mixing rules and AIOMFAC-VISC
Based on the viscosity measurements that we performed on the mixtures of NH4NO3–sucrose–H2O for two OIRs, we examined whether the viscosity of the ternary mixture could be predicted using different mixing rules and/or AIOMFAC-VISC. We studied three mixing rules: one based on mole fraction, one on mass fraction, and another one based on the ZSR approach (Eq. 4). These rules were applied to the log 10(viscosities (Pa s)−1) using our regressions for log 10(viscosity (Pa s)−1) as a function of aw for binary mixtures of aqueous sucrose and aqueous NH4NO3, as shown in Fig. 4. Additionally, the ternary mixtures were modeled using AIOMFAC-VISC.
Figure 5 shows the viscosities obtained for the ternary mixtures. The first column represents the results obtained using mixing rules, while the second column shows the results obtained using AIOMFAC-VISC. The upper row corresponds to OIR = 1, and the lower row corresponds to OIR = 4. To provide a comparison, the aqueous binary mixtures are also included in the figure, represented by a dashed gray line for aqueous sucrose and a dash-dotted gray line for aqueous NH4NO3. It should be noted that the measurement range for aqueous binary mixtures is limited to higher water activities (> 0.3). To indicate the uncertainty in these predictions, the region below 0.3 has been shaded in light gray. We only show the results of one example of the mass-fraction-based mixing rule in the supplementary information (see Fig. A2), since the results are very similar to the ZSR approach.
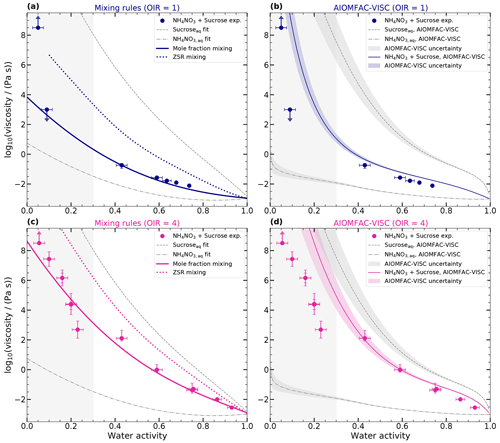
Figure 5Predictions of ternary mixture log 10(viscosity (Pa s)−1) as a function of water activity of sucrose–NH4NO3–H2O with mixing rules and AIOMFAC-VISC at 293 K. Panels (a) and (b) show the results of OIR = 1 (blue), and panels (c) and (d) show the results of OIR = 4 (pink). Panels (a) and (c) show the log 10(viscosity (Pa s)−1) calculated with the mole-fraction-based mixing (solid pink line) and the ZSR-based mixing approach (dotted pink line). Panels (b) and (d) show the predicted log 10(viscosities) of AIOMFAC-VISC for binary and ternary systems. The log 10(viscosities) obtained from the measurements (circles) are the same as those in Fig. 4. Panels (a) and (c) show the fitted curves for binary aqueous sucrose and aqueous NH4NO3 solutions as the dashed gray and dash-dotted gray lines, respectively. Panels (b) and (d) show the predictions of AIOMFAC-VISC (a dashed gray line for aqueous sucrose, a dash-dotted gray line for aqueous NH4NO3, and solid lines for mixed systems). Shaded areas indicate the AIOMFAC-VISC uncertainty. The area for aw ≤ 0.3 is shaded gray to indicate that the results of the mixing rule and the AIOMFAC-VISC model in this area are more uncertain since no experimental data for aqueous NH4NO3 and aqueous sucrose are available in this range.
To quantitatively compare the mixing rules and AIOMFAC-VISC, we calculated the mean absolute error (MAE) between the measured data and the mixing rules and AIOMFAC-VISC:
where N is the number of data points, y are the viscosity predictions of the mixing model, and x are the experimental mixture viscosity data. The results are shown in Table 2. We divided them into two regimes, above water activity of 0.3 and below water activity of 0.3 where binary aqueous viscosity data of NH4NO3 and sucrose are not available.
Table 2Mean absolute error (MAE) for molar mixing, ZSR-based mixing, and AIOMFAC-VISC for inorganic salts mixed with sucrose for water activities smaller than and larger than or equal to 0.3. Upper and lower limits of the poke-flow measurements (indicated with an upward- or downward-facing arrow) were not considered for the MAE.
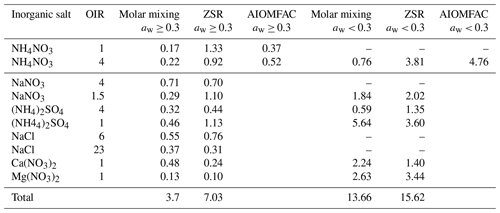
The molar mixing and AIOMFAC-VISC predictions for water activities greater than 0.3 show good agreement with the measured viscosities. The MAE for all scenarios is half an order of magnitude or less. However, the ZSR approach does not capture the data as well, with an MAE larger than 1 order of magnitude. For water activities below 0.3 and OIR = 4, molar mixing predictions have an MAE below 1 order of magnitude, while both ZSR and AIOMFAC-VISC exhibit deviations of several orders of magnitude. For OIR = 1, a quantitative evaluation is not possible, as we only could determine the upper and lower limits of the viscosities. However, at a water activity of 0.1, AIOMFAC-VISC predicts viscosities several orders of magnitude higher than those indicated by our poke-flow measurements. The molar mixing rule may better predict this data point. However, with a water activity of 0.05, AIOMFAC-VISC better predicts the sharp increase compared to the mixing rule.
Since the mole-fraction-based mixing rule can predict the viscosity of NH4NO3–sucrose–H2O reasonably well, we tested whether this also holds for mixtures of sucrose with other inorganic salts from prior studies. The results are shown in Fig. 6. It can be seen that here also the viscosity prediction of the simple mole-fraction-based mixing of the aqueous binary systems is consistent with published data on ternary mixtures, at least for the water activities above 30 % (MAE < 1). The predictions fit better to the viscosity data of monovalent ions than to those of divalent ions, where the predictions of the ZSR approach fit the best. Mixtures with divalent ions can undergo gel formation, as shown by Richards et al. (2020), which may be an explanation for the difference.
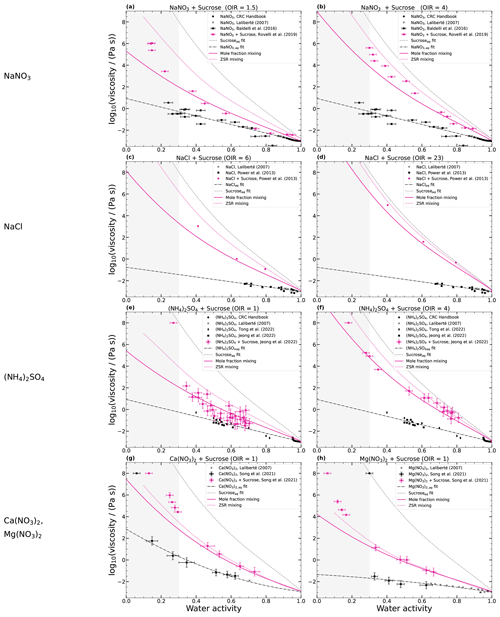
Figure 6log 10(viscosity (Pa s)−1) as a function of water activity for ternary aqueous sucrose–inorganic mixtures at 293 K. Panels (a) and (b) show the viscosities of NaNO3–sucrose–H2O, panels (c) and (d) NaCl–sucrose–H2O, panels (e) and (f) (NH4)2SO4–sucrose–H2O, and panels (g) and (h) Ca(NO3)2–sucrose–H2O and Mg(NO3)2–sucrose–H2O. Linear or quadratic fits of the aqueous inorganic salts are shown with dash-dotted black lines and the fit of aqueous sucrose with a dashed gray line. The solid pink line is simple mole-fraction-based mixing, and the dotted pink line is ZSR-based mixing. In the gray area, the estimation of the mixing rule is uncertain due to the limited availability of binary data.
Overall, from the modest dataset that we analyzed, we conclude that if the data of the aqueous binary systems are available, they can be used to predict the viscosity of the ternary mixtures in a simple and computationally efficient manner. However, if binary data are not available, AIOMFAC-VISC can give predictions of the viscosity, and the model extends naturally beyond ternary systems, as demonstrated for surrogate systems of secondary organic aerosols (SOAs) by Gervasi et al. (2020) and Lilek and Zuend (2022). The mole-fraction-weighted mixing rule may also apply to multicomponent mixtures beyond ternary mixtures, but it has not yet been evaluated for such cases.
3.3 Atmospheric implications
Our findings allow us to estimate the range of relative humidities for which NH4NO3 partitioning under typical atmospheric conditions is limited by condensed-phase ion transport. With this goal, we estimate the internal mixing times (Eq. 2) for NH4NO3-containing aqueous organic aerosol particles and compare these with the mixing times for aqueous binary organic particles. Global models often assume equilibrium partitioning is achieved for fine particulate matter within the typical model time steps used for periodic output (tens of minutes to ca. 1 h; e.g., Bian et al., 2017). If the condensed-phase mixing times exceed the chemical time step in global models, it makes the quasi-instantaneous equilibrium assumption questionable.
For our estimates, we use the following assumptions and simplifications. We consider two cases for organic compounds: (i) for a high-viscosity example, sucrose as a single compound, and (ii) for a more moderate example, SOA derived from toluene oxidation, for which viscosity data are available (Song et al., 2016a). This SOA viscosity as a function of water activity was taken from Maclean et al. (2021). The mixing times are calculated for a temperature of 293 K, which is a representative temperature for the summer months in the PBL. Since the characteristic mixing time scales with the square of the particle radius for a fixed composition, we consider only a single size, with the radius of the particles set to 100 nm. The diffusion coefficients are determined from the viscosities via the Stokes–Einstein relation (Eq. 1), assuming an unhydrated hydrodynamic radius for ammonium ions of 161 pm (Zuend et al., 2008). We assume that the ammonium ion and not the nitrate ion primarily limits the diffusivity because the hydrodynamic radius of the latter is smaller (Zuend et al., 2008). The Stokes–Einstein relation provides a lower limit for the estimated diffusion coefficient in cases for which the effective sizes of the diffusing molecules or ions are lower than the size of the matrix molecules (Evoy et al., 2020; Bastelberger et al., 2017). Therefore, the mixing times calculated using these derived diffusivities represent an upper limit.
Based on the O:C ratio of the organic component, we assume that neither of the ternary systems NH4NO3–sucrose–H2O (O:C = 0.92) and NH4NO3–toluene-derived SOA–H2O (O:C on average 1.1; Li et al., 2015) are phase separated. To determine the viscosities of the mixed systems, we used the mole-fraction-based mixing approach. To determine the dry OIR, we used the compositions provided by Zhang et al. (2011) for Zurich summer (OIR = 2), Beijing (OIR = 0.53), and Mexico City (OIR = 1.7), assuming for simplicity that all inorganics are NH4NO3 and all organics are sucrose or toluene-derived SOA (average molar mass 350 g mol−1; Hinks et al., 2018), respectively. Note that the OIRs observed in Zurich summer are similar to rural/remote regions reported in the same study (Zhang et al., 2011).
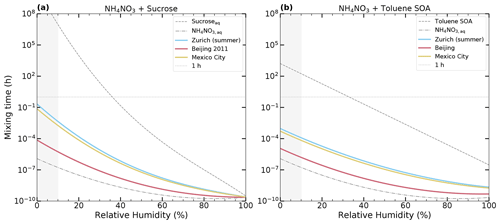
Figure 7Characteristic internal mixing times of ions as a function of RH in 100 nm radius particles at 293 K for the ternary system NH4NO3–organics–H2O: (a) NH4NO3–sucrose–H2O and (b) NH4NO3–toluene-derived SOA–H2O. The mixing times of the ternary inorganic–organic mixtures determined by mole-fraction-based mixing of the aqueous binary compounds are shown as solid-colored lines. The mixing time of the aqueous NH4NO3 particle is shown as a dash-dotted gray line. The mixing times of the aqueous sucrose and aqueous toluene-derived SOA (Maclean et al., 2021) particles are shown as dashed gray lines. We consider the compositions of three cities as reported by Zhang et al. (2011), assuming that all organics are sucrose and toluene-derived SOA and all inorganics are NH4NO3: Zurich summer (cyan; OIR = 2), Beijing (rose; OIR = 0.53), and Mexico City (sand; OIR = 1.7). A 1 h characteristic internal mixing time is indicated by a horizontal dotted gray line. The gray-shaded area indicates uncertain results due to unavailable aqueous binary data.
The estimated internal mixing times are shown in Fig. 7. Panel (a) shows NH4NO3 mixed with sucrose, and panel (b) shows NH4NO3 mixed with toluene-derived SOA. In all cases, the mixing times of the inorganic–organic mixed systems, assumed to form a single condensed phase, are orders of magnitude lower than the mixing times of the aqueous organic particles. Most importantly, the mixing times for inorganic–organic particles with radii of 100 nm stay orders of magnitude below 1 h even for RH below 30 %. Note that the RH of the PBL is often above 25 % (Maclean et al., 2017). Hence, our findings support the assumption that for these particles the equilibrium partitioning is fulfilled, at least for boundary layer temperatures. To be more specific, while the mixing times for aqueous organic particles exceed the mixing times of 1 h at RH lower than approximately 35 %, the corresponding time for particles containing inorganic compounds decreases to less than a second. While the estimations for the mixing times are done for the ammonium ion, the same conclusion holds true for semi-volatile organic compounds (SOVCs), as long as the particles are single phase and well mixed. They do not apply to the case of two-phase particles with an organic-rich phase.
Zurich (summer) and Mexico City have similar compositions and therefore similar mixing times. Beijing has a smaller organic fraction, resulting in differences of up to 2 orders of magnitude in mixing times compared to Zurich (summer) and Mexico City.
There are several factors that influence these mixing times, most importantly the temperature and possibly also the morphology of the aerosol particles. For a discussion of the influence of morphology, in particular liquid–liquid phase separation, see Lilek and Zuend (2022). Briefly, liquid–liquid phase separation can result in a thin but highly viscous, organic-rich outer-shell phase for an aqueous particle containing inorganic ions. This leads to long characteristic mixing times, even if this shell is thin and the viscosity of the inner aqueous inorganic core low.
Since the temperature in the troposphere typically decreases with altitude and the viscosity increases with decreasing temperature, we expect the mixing times to increase at altitudes above the PBL. For a quantitative estimate of the effect of temperature on the mixing times, we need to estimate the viscosities of the ternary mixtures. An attempt to parameterize the temperature dependence for the system shown in Fig. 7b is detailed in Appendix B. It is based on known temperature-dependent viscosity data for water and subcooled NH4NO3 melt data, as well as the prediction of temperature-dependent viscosity of aqueous toluene-derived SOA by Gervasi et al. (2020). In addition to these estimates for the lower temperatures of the binary systems, we assume that the mole-fraction-based viscosity mixing rule that has been shown to yield reasonable data at elevated temperatures also holds at lower temperatures. Calculated characteristic mixing times for 100 nm radius particles of the ternary NH4NO3–toluene-derived SOA system (OIR = 2) remain below 1 h over almost the entire tropospheric temperature range (down to colder than 230 K for relative humidities larger than 30 %). This would indicate that the assumption of equilibrium partitioning for NH4NO3 in such an aerosol is a good approximation. We would like to emphasize, however, that these estimates are not yet supported by low-temperature measurements and have been derived by considerable extrapolation from existing data. They should therefore be treated with an appreciation for increasing uncertainties toward lower temperatures accompanying these extrapolations and the potential need for revisions in future. In any case, this finding highlights the need to extend experimental studies like ours to lower temperatures to gain a better understanding of whether equilibrium holds for tropospheric inorganic–organic aerosol particles.
In this study, we investigated the viscosity of inorganic–organic ternary systems of NH4NO3, sucrose, and water over the full range of RH at room temperature for OIRs of 1 and 4. The viscosity of sucrose mixed with NH4NO3 was shown to remain liquid (< 102 Pa s) at an RH greater than 45 % and is up to 2 orders of magnitude lower than previously reported (Tong et al., 2022). Only under low-humidity conditions (RH < 10 %) the ternary mixture becomes glassy, in contrast to binary aqueous sucrose, which becomes glassy at a higher humidity (RH < 28 %).
We conclude that if binary viscosity data of the aqueous organic solution and aqueous inorganic solution are available, a simple mole-fraction-based mixing rule of the logarithms of pure-component viscosities seems to be sufficient to predict the viscosity of the ternary system when the system remains in a homogeneous single-phase state. However, if these data are not available, AIOMFAC-VISC can provide a reasonable estimate. Measuring additional mixed inorganic–organic systems could allow us to obtain a more complete database to validate AIOMFAC-VISC, to thoroughly evaluate its different viscosity mixing approaches, and to inform us about the optimal approach for a range of compound classes and mixtures covering different electrolyte components.
The available experimental techniques are limited in their applicable viscosity range, particularly at viscosities above 108 Pa s, and carry uncertainties measured in orders of magnitude in this range (see Fig. 4). Hence, aqueous-phase viscosities of some organic compounds or related mixtures at low RH cannot be measured precisely. Our results here suggest that a strategy to obtain the much-needed data to further validate predictive models such as AIOMFAC-VISC at low water activities is to mix organics with monovalent inorganic salts. The viscosities of these mixed systems at low RH will carry sufficiently low uncertainties with the techniques presently available (see Fig. 4) to constrain mixing rules. Such measurement data may further the development of predictive models for the viscosity of complex atmospherically relevant aerosol.
With respect to characteristic internal mixing times for aerosol particles, we show that those of internally mixed single-phase inorganic–organic aerosol particles can be orders of magnitude lower than those of electrolyte-free aqueous SOA. Assuming instantaneous equilibrium partitioning is justifiable in the PBL for these particles if the temperature is near 293 K, even if the SOA on its own would be highly viscous or glassy under the same conditions.
Interestingly, our estimates indicate that mixing times do not exceed 1 h even for midlatitude tropospheric temperatures if the relative humidity is larger than 40 %. However, this finding is based on a number of assumptions and extrapolations and calls for additional viscosity measurements at lower temperatures. In addition, gas–particle partitioning experiments with NH4NO3, which can be performed at low temperatures, can be used to derive diffusivities in organic mixtures and to directly test the mass transport limitations.
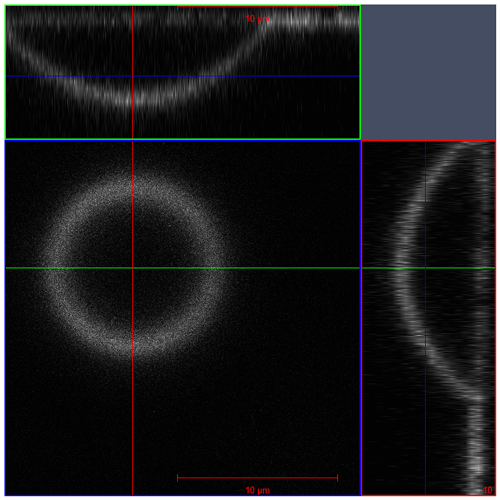
Figure A1Microscopy image taken with a laser scanning microscope (z stack) to determine the contact angle of sucrose–NH4NO3–H2O (OIR = 4) solution droplets under room conditions (Rhodamine 6G as dye). The middle shows the top view of the droplet. The right and upper panels show the cross-section.
Table A1Parameters of the fits for the viscosity of binary aqueous inorganic compounds at 293 K in the form of log 10(η (Pa s)−1) = .
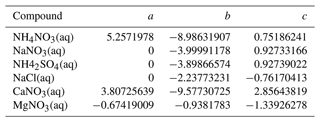
For sucrose, a quartic polynomial equation is fitted (log 10(η (Pa s)−1) = , with a = −2.63720583, b = −5.66469305, c = 26.11320604, d = −37.8954176, and e = 17.25426411).
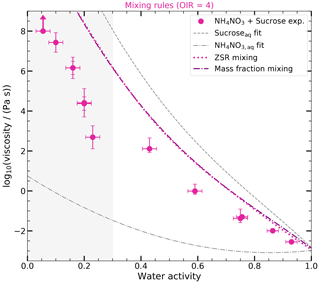
Figure A2Predictions of ternary mixture log 10(viscosity (Pa s)−1) as a function of water activity of sucrose–NH4NO3–H2O with the ZSR approach and mass-fraction-based mixing at 293 K. The log 10(viscosity (Pa s)−1) (OIR = 4) calculated with the ZSR approach and the mass-fraction-based mixing are shown as a dotted pink line and a dash-dotted purple line. The log(viscosities) obtained from the measurements (circles) are the same as those in Fig. 4. The fitted curves for the log 10(viscosity (Pa s)−1) of the binary aqueous sucrose and aqueous NH4NO3 solutions are shown as the dashed gray and dash-dotted gray lines, respectively. The area of aw ≤ 0.3 is shaded gray to indicate that the results of the mixing rule and the AIOMFAC-VISC model in this area are more uncertain since no experimental data for aqueous NH4NO3 and aqueous sucrose are available in this range.
To estimate the viscosity of the subcooled NH4NO3 melt at atmospheric temperatures, we fit the melt viscosity data from Booth and Vinyard (1967) to the modified Vogel–Tamman–Fulcher (VTF) equation (Angell, 1991) and set the viscosity at the glass transition temperature (Tg = 207.5 K; Angell and Helphrey, 1971) to 1012 Pa s (Angell, 1991). This results in the following parameterization:
with the fragility parameter D = 10.57. This results in a viscosity of 6.0 Pa s for the pure subcooled NH4NO3 melt at 293 K.
We combine the estimation for the temperature-dependent viscosity of the subcooled melt of NH4NO3 (Eq. A1) with an equivalent fit to the known temperature dependence of the viscosity for pure water (Dehaoui et al., 2015). Applying mol-fraction-based mixing to these two parameterizations yields temperature- and water-activity-dependent viscosity predictions for aqueous NH4NO3, shown as the solid lines in Fig. B1. A comparison of these predictions at 290 K with the data and fit of Fig. 3a shows that these predictions tend to overestimate the viscosity at intermediate water activities – at least at typical PBL temperatures.
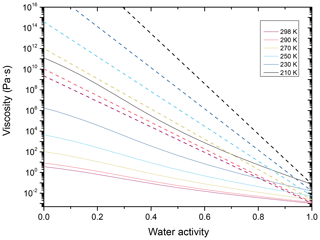
Figure B1Viscosity estimates as a function of water activity for binary, aqueous NH4NO3 (solid lines) and aqueous toluene-derived SOA (dashed lines), color-coded for temperatures ranging from 298 to 230 K.
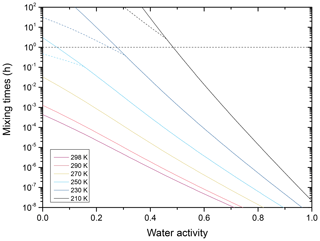
Figure B2Mixing times (τ) as a function of water activity for aqueous toluene-derived SOA mixed with aqueous NH4NO3 for a dry mass ratio of 2:1 and temperatures ranging from 298 to 210 K. These times were calculated for a 100 nm radius particle assuming an unhydrated hydrodynamic radius for the ammonium ion of 1.61 Å. The dashed horizontal line marks 1 h mixing time. The dashed lines for 250, 230, and 210 K are calculated assuming that the viscosity of the binary systems cannot exceed 1012 Pa s.
For aqueous toluene-derived SOA, we again fit a VTF-type equation to the available data (Song et al., 2016b) and to the AIOMFAC-VISC predictions (Gervasi et al., 2020). These fits (shown in Fig. B1 as dashed lines) are in close agreement (within 1 order of magnitude) with both the data of Song et al. (2016b) and the temperature-dependent predictions by Gervasi et al. (2020), as well as the fit given in Maclean et al. (2021).
In order to calculate the characteristic mixing times for toluene–derived SOA mixed with NH4NO3, we take the viscosities for the binary aqueous systems of Fig. B1 and assume for the entire temperature range that the mole-fraction-based mixing rule for the viscosity of a pseudo-ternary mixture (approximating this multicomponent system) holds based on the binary subsystems. With these assumptions, we predict the characteristic mixing times shown in Fig. B2. These predicted mixing times are faster than 1 h for almost the entire temperature range of the troposphere if the relative humidity exceeds 40 %. It should be noted, however, that the predicted mixing times are based on numerous assumptions and extrapolations, as outlined, and need to be supported by experiments before drawing firm conclusions.
Table C1Experimental and calculated equilibration times for the poke-flow experiments at all tested conditions, as well as results for the obtained viscosities at 293 K.
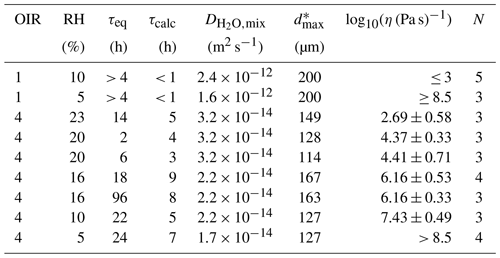
* Maximum outer diameter of the droplets for estimating the equilibration time with respect to water content.
To estimate the equilibration time for the water in the droplets to reach equilibrium with the gas-phase RH in the poke-flow and rFRAP experiments, we need to estimate the diffusivity of water in the NH4NO3–sucrose–H2O mixtures. For these large particles, mixing timescales should be equal to the equilibrium timescales due to the fast diffusion rate of water in the gas phase and the high vapor pressure of water. Assuming a Vinges-type equation (Vignes, 1966), we can estimate the diffusivity of water in the ternary mixture based on the diffusivities in the two binary solutions:
where is the diffusivity of water in aqueous sucrose, is the diffusivity of water in aqueous NH4NO3, and x is the dry mole fraction of NH4NO3. at water activities below 0.1 is approximately 10−17 m2 s−1 (Zobrist et al., 2011). (aw = 0.1) is approximately m2 s−1, and (aw = 0.2) is approximately m2 s−1 using the prediction of the viscosity for aqueous NH4NO3 by AIOMFAC-VISC, which can be related to the diffusivity using the Stokes–Einstein relation (η(aw = 0.1) ≈ 0.04 Pa s, η(aw = 0.2) ≈ 0.02 Pa s, r = m, and T = 293.15 K). The dry mass fractions of 1 and 4 converted into mole fractions are x = 0.81 and 0.52, respectively. Substituting these values into Eq. (C1), the diffusivities of water in the NH4NO3–sucrose–H2O mixture can be calculated (see results in Table C1). With these diffusion coefficients, we can estimate the required equilibration times τcalc using Eq. (2) (refer to Table C1). To verify the accuracy of our estimated equilibration times experimentally, we performed poke-flow experiments after two different sample equilibration times τeq at 20 % RH (τeq,1 = 2 h and τeq,2 = 6 h) and 16 % RH (τeq,1 = 18 h and τeq,2 = 96 h). The results of these experiments were similar, indicating that the equilibration times are satisfactory (see Table C1).
Table C2rFRAP experimental parameters and calculated diffusion coefficients of Rhodamine B isothiocyanate-Dextran in NH4NO3–sucrose–H2O and the corresponding viscosities at 293 K.

An online version of AIOMFAC-VISC is available at https://aiomfac.lab.mcgill.ca/ (Zuend et al., 2012). The source code of AIOMFAC-VISC is available on GitHub at https://github.com/andizuend/AIOMFAC (Zuend et al., 2021) and on Zenodo at https://doi.org/10.5281/zenodo.6049217 (Zuend, 2022).
The data are available on Zenodo (https://doi.org/10.5281/zenodo.13645524, Klein et al., 2024).
LKK, AKB, and UKK conceptualized this work. All co-authors contributed to writing this paper. AKB, AZ, FG, and UKK edited the manuscript. LKK performed the experiments and analyzed the data with contributions from FG. AZ performed the AIOMFAC-VISC modeling.
At least one of the (co-)authors is a member of the editorial board of Atmospheric Chemistry and Physics. The peer-review process was guided by an independent editor, and the authors also have no other competing interests to declare.
Publisher’s note: Copernicus Publications remains neutral with regard to jurisdictional claims made in the text, published maps, institutional affiliations, or any other geographical representation in this paper. While Copernicus Publications makes every effort to include appropriate place names, the final responsibility lies with the authors.
The authors acknowledge the assistance of personnel from the UBC BioProducts Institute and the Canada Foundation for Innovation (project number 38623) for the bulk viscosity measurements and acknowledge the viscosity data provided by Mijung Song. We acknowledge Thomas Peter and Nir Bluvshtein for fruitful discussions and feedback on the manuscript. In addition, we acknowledge deepL.com and Writefull, which were used to improve the language and grammar of an earlier version of the manuscript.
This research has been supported by the Swiss National Science Foundation (grant no. 189939), the Natural Sciences and Engineering Research Council of Canada (grant no. RGPIN-2023-05333), the Alfred P. Sloan Foundation (grant no. G-2020-13912), and the Natural Sciences and Engineering Research Council of Canada (grant no. RGPIN-2021-02688).
This paper was edited by Guangjie Zheng and reviewed by two anonymous referees.
Angell, C.: Relaxation in liquids, polymers and plastic crystals – strong/fragile patterns and problems, J. Non-Cryst. Solids, 131, 13–31, 1991. a, b
Angell, C. and Helphrey, D.: Corresponding states and the glass transition for alkali metal nitrates, J. Phys. Chem., 75, 2306–2312, 1971. a
Armeli, G., Peters, J.-H., and Koop, T.: Machine-Learning-Based Prediction of the Glass Transition Temperature of Organic Compounds Using Experimental Data, ACS Omega, 8, 12298–12309, https://doi.org/10.1021/acsomega.2c08146, 2023. a
Arrhenius, S.: Über die innere Reibung verdünnter wässeriger Lösungen, Z. Phys. Chem., 1U, 285–298, https://doi.org/10.1515/ZPCH-1887-0133, 1887. a
Baldelli, A., Power, R. M., Miles, R. E., Reid, J. P., and Vehring, R.: Effect of crystallization kinetics on the properties of spray dried microparticles, Aerosol Sci. Tech., 50, 693–704, https://doi.org/10.1080/02786826.2016.1177163, 2016. a
Bastelberger, S., Krieger, U. K., Luo, B., and Peter, T.: Diffusivity measurements of volatile organics in levitated viscous aerosol particles, Atmos. Chem. Phys., 17, 8453–8471, https://doi.org/10.5194/acp-17-8453-2017, 2017. a, b
Bian, H., Chin, M., Hauglustaine, D. A., Schulz, M., Myhre, G., Bauer, S. E., Lund, M. T., Karydis, V. A., Kucsera, T. L., Pan, X., Pozzer, A., Skeie, R. B., Steenrod, S. D., Sudo, K., Tsigaridis, K., Tsimpidi, A. P., and Tsyro, S. G.: Investigation of global particulate nitrate from the AeroCom phase III experiment, Atmos. Chem. Phys., 17, 12911–12940, https://doi.org/10.5194/acp-17-12911-2017, 2017. a, b
Booth, D. H. and Vinyard, V. C.: Density and viscosity of ammonium nitrate, ammonium nitrate-potassium chloride and ammonium nitrate-ammonium phosphate melts, J. Appl. Chem., 17, 86–88, https://doi.org/10.1002/jctb.5010170307, 1967. a, b, c
Chenyakin, Y., Ullmann, D. A., Evoy, E., Renbaum-Wolff, L., Kamal, S., and Bertram, A. K.: Diffusion coefficients of organic molecules in sucrose–water solutions and comparison with Stokes–Einstein predictions, Atmos. Chem. Phys., 17, 2423–2435, https://doi.org/10.5194/acp-17-2423-2017, 2017. a, b
Clegg, S. L., Brimblecombe, P., and Wexler, A. S.: Thermodynamic model of the system at 298.15 K, J. Phys. Chem. A, 102, 2155–2171, https://doi.org/10.1021/jp973043j, 1998. a
Collins, T. J.: ImageJ for microscopy, BioTechniques, 43, S25–S30, https://doi.org/10.2144/000112517, 2007. a, b
Dassios, K. G. and Pandis, S. N.: The mass accommodation coefficient of ammonium nitrate aerosol, Atmos. Environ., 33, 2993–3003, https://doi.org/10.1016/S1352-2310(99)00079-5, 1999. a
Dehaoui, A., Issenmann, B., and Caupin, F.: Viscosity of deeply supercooled water and its coupling to molecular diffusion, P. Natl. Acad. Sci. USA, 112, 12020–12025, 2015. a
DeRieux, W.-S. W., Li, Y., Lin, P., Laskin, J., Laskin, A., Bertram, A. K., Nizkorodov, S. A., and Shiraiwa, M.: Predicting the glass transition temperature and viscosity of secondary organic material using molecular composition, Atmos. Chem. Phys., 18, 6331–6351, https://doi.org/10.5194/acp-18-6331-2018, 2018. a
Deschout, H., Fransson, S., Jonasson, J., Rudemo, M., Lorén, N., Hagman, J., and Braeckmans, K.: Straightforward FRAP for quantitative diffusion measurements with a laser scanning microscope, Opt. Express, 18, 22886–22905, https://doi.org/10.1364/OE.18.022886, 2010. a, b
Evoy, E., Maclean, A. M., Rovelli, G., Li, Y., Tsimpidi, A. P., Karydis, V. A., Kamal, S., Lelieveld, J., Shiraiwa, M., Reid, J. P., and Bertram, A. K.: Predictions of diffusion rates of large organic molecules in secondary organic aerosols using the Stokes–Einstein and fractional Stokes–Einstein relations, Atmos. Chem. Phys., 19, 10073–10085, https://doi.org/10.5194/acp-19-10073-2019, 2019. a
Evoy, E., Kamal, S., Patey, G. N., Martin, S. T., and Bertram, A. K.: Unified Description of Diffusion Coefficients from Small to Large Molecules in Organic-Water Mixtures, J. Phys. Chem. A, 124, 2301–2308, https://doi.org/10.1021/acs.jpca.9b11271, 2020. a, b
Evoy, E., Kiland, K. J., Huang, Y., Schnitzler, E. G., Maclean, A. M., Kamal, S., Abbatt, J. P., and Bertram, A. K.: Diffusion Coefficients and Mixing Times of Organic Molecules in β-Caryophyllene Secondary Organic Aerosol (SOA) and Biomass Burning Organic Aerosol (BBOA), ACS Earth Space Chem., 5, 3268–3278, https://doi.org/10.1021/acsearthspacechem.1c00317, 2021. a
Friese, E. and Ebel, A.: Temperature dependent thermodynamic model of the system , J. Phys. Chem. A, 114, 11595–11631, https://doi.org/10.1021/jp101041j, 2010. a
Fuzzi, S., Andreae, M. O., Huebert, B. J., Kulmala, M., Bond, T. C., Boy, M., Doherty, S. J., Guenther, A., Kanakidou, M., Kawamura, K., Kerminen, V.-M., Lohmann, U., Russell, L. M., and Pöschl, U.: Critical assessment of the current state of scientific knowledge, terminology, and research needs concerning the role of organic aerosols in the atmosphere, climate, and global change, Atmos. Chem. Phys., 6, 2017–2038, https://doi.org/10.5194/acp-6-2017-2006, 2006. a
Gervasi, N. R., Topping, D. O., and Zuend, A.: A predictive group-contribution model for the viscosity of aqueous organic aerosol, Atmos. Chem. Phys., 20, 2987–3008, https://doi.org/10.5194/acp-20-2987-2020, 2020. a, b, c, d, e, f
Grayson, J. W., Song, M., Sellier, M., and Bertram, A. K.: Validation of the poke-flow technique combined with simulations of fluid flow for determining viscosities in samples with small volumes and high viscosities, Atmos. Meas. Tech., 8, 2463–2472, https://doi.org/10.5194/amt-8-2463-2015, 2015. a, b, c, d
Hinks, M. L., Montoya-Aguilera, J., Ellison, L., Lin, P., Laskin, A., Laskin, J., Shiraiwa, M., Dabdub, D., and Nizkorodov, S. A.: Effect of relative humidity on the composition of secondary organic aerosol from the oxidation of toluene, Atmos. Chem. Phys., 18, 1643–1652, https://doi.org/10.5194/acp-18-1643-2018, 2018. a
Jeong, R., Lilek, J., Zuend, A., Xu, R., Chan, M. N., Kim, D., Moon, H. G., and Song, M.: Viscosity and physical state of sucrose mixed with ammonium sulfate droplets, Atmos. Chem. Phys., 22, 8805–8817, https://doi.org/10.5194/acp-22-8805-2022, 2022. a, b, c, d, e, f
Kanakidou, M., Seinfeld, J. H., Pandis, S. N., Barnes, I., Dentener, F. J., Facchini, M. C., Van Dingenen, R., Ervens, B., Nenes, A., Nielsen, C. J., Swietlicki, E., Putaud, J. P., Balkanski, Y., Fuzzi, S., Horth, J., Moortgat, G. K., Winterhalter, R., Myhre, C. E. L., Tsigaridis, K., Vignati, E., Stephanou, E. G., and Wilson, J.: Organic aerosol and global climate modelling: a review, Atmos. Chem. Phys., 5, 1053–1123, https://doi.org/10.5194/acp-5-1053-2005, 2005. a
Kiland, K. J., MacLean, A. M., Kamal, S., and Bertram, A. K.: Diffusion of Organic Molecules as a Function of Temperature in a Sucrose Matrix (a Proxy for Secondary Organic Aerosol), J. Phys. Chem. Lett., 10, 5902–5908, https://doi.org/10.1021/acs.jpclett.9b02182, 2019. a
Klein, L., Bertram, A. K., Zuend, A., Gregson, F., and Krieger, U.: Data for: Klein et al., Viscosity of aqueous ammonium nitrate–organic particles: Equilibrium partitioning may be a reasonable assumption for most tropospheric conditions, egusphere-2024-1459, Version 1.0, Zenodo [data set], https://doi.org/10.5281/zenodo.13645524, 2024. a
Koop, T., Bookhold, J., Shiraiwa, M., and Pöschl, U.: Glass transition and phase state of organic compounds: Dependency on molecular properties and implications for secondary organic aerosols in the atmosphere, Phys. Chem. Chem. Phys., 13, 19238–19255, https://doi.org/10.1039/c1cp22617g, 2011. a, b, c
Laliberté, M.: Model for calculating the viscosity of aqueous solutions, J. Chem. Eng. Data, 52, 321–335, https://doi.org/10.1021/je0604075, 2007. a, b, c
Li, H., Cheng, J., Zhang, Q., Zheng, B., Zhang, Y., Zheng, G., and He, K.: Rapid transition in winter aerosol composition in Beijing from 2014 to 2017: response to clean air actions, Atmos. Chem. Phys., 19, 11485–11499, https://doi.org/10.5194/acp-19-11485-2019, 2019. a
Li, Y. J., Liu, P., Gong, Z., Wang, Y., Bateman, A. P., Bergoend, C., Bertram, A. K., and Martin, S. T.: Chemical Reactivity and Liquid/Nonliquid States of Secondary Organic Material, Environ. Sci. Technol., 49, 13264–13274, https://doi.org/10.1021/acs.est.5b03392, 2015. a
Lilek, J. and Zuend, A.: A predictive viscosity model for aqueous electrolytes and mixed organic–inorganic aerosol phases, Atmos. Chem. Phys., 22, 3203–3233, https://doi.org/10.5194/acp-22-3203-2022, 2022. a, b, c, d, e, f, g, h, i
Liu, Y., Wu, Z., Qiu, Y., Tian, P., Liu, Q., Chen, Y., Song, M., and Hu, M.: Enhanced nitrate fraction: Enabling urban aerosol particles to remain in a liquid state at reduced relative humidity, Geophys. Res. Lett., 50, e2023GL105505, https://doi.org/10.1029/2023GL105505, 2023. a
MacDonald, G. A., Lanier, T. C., Swaisgood, H. E., and Hamann, D. D.: Mechanism for Stabilization of Fish Actomyosin by Sodium Lactate, J. Agr. Food Chem., 44, 106–112, https://doi.org/10.1021/jf940698y, 1996. a
Maclean, A. M., Butenhoff, C. L., Grayson, J. W., Barsanti, K., Jimenez, J. L., and Bertram, A. K.: Mixing times of organic molecules within secondary organic aerosol particles: a global planetary boundary layer perspective, Atmos. Chem. Phys., 17, 13037–13048, https://doi.org/10.5194/acp-17-13037-2017, 2017. a
Maclean, A. M., Li, Y., Crescenzo, G. V., Smith, N. R., Karydis, V. A., Tsimpidi, A. P., Butenhoff, C. L., Faiola, C. L., Lelieveld, J., Nizkorodov, S. A., Shiraiwa, M., and Bertram, A. K.: Global Distribution of the Phase State and Mixing Times within Secondary Organic Aerosol Particles in the Troposphere Based on Room-Temperature Viscosity Measurements, ACS Earth Space Chem., 5, 3458–3473, https://doi.org/10.1021/acsearthspacechem.1c00296, 2021. a, b, c
Mahant, S., Iversen, E. M., Kasparoglu, S., Bilde, M., and Petters, M. D.: Direct measurement of the viscosity of ternary aerosol mixtures, Environmental Science: Atmospheres, 3, 595–607, https://doi.org/10.1039/D2EA00160H, 2023. a
Marcolli, C., Luo, B., and Peter, T.: Mixing of the Organic Aerosol Fractions: Liquids as the Thermodynamically Stable Phases, J. Phys. Chem. A, 108, 2216–2224, https://doi.org/10.1021/jp036080l, 2004. a
Mu, Q., Shiraiwa, M., Octaviani, M., Ma, N., Ding, A., Su, H., Lammel, G., Pöschl, U., and Cheng, Y.: Temperature effect on phase state and reactivity controls atmospheric multiphase chemistry and transport of PAHs, Science Advances, 4, eaap7314, https://doi.org/10.1126/SCIADV.AAP7314, 2018. a
Murray, B. J., Haddrell, A. E., Peppe, S., Davies, J. F., Reid, J. P., O'Sullivan, D., Price, H. C., Kumar, R., Saunders, R. W., Plane, J. M. C., Umo, N. S., and Wilson, T. W.: Glass formation and unusual hygroscopic growth of iodic acid solution droplets with relevance for iodine mediated particle formation in the marine boundary layer, Atmos. Chem. Phys., 12, 8575–8587, https://doi.org/10.5194/acp-12-8575-2012, 2012. a
Paës, G., Habrant, A., Ossemond, J., and Chabbert, B.: Exploring accessibility of pretreated poplar cell walls by measuring dynamics of fluorescent probes, Biotechnol. Biofuels, 10, 1–10, https://doi.org/10.1186/S13068-017-0704-5, 2017. a
Power, R. M.: Applications of Holographic Optical Tweezers to the Manipulation and Coalescence of Airborne Microparticles, PhD thesis, University of Bristol, https://bris.on.worldcat.org/oclc/931568185 (last access: 21 November 2024), 2014. a
Power, R. M., Simpson, S. H., Reid, J. P., and Hudson, A. J.: The transition from liquid to solid-like behaviour in ultrahigh viscosity aerosol particles, Chemical Science, 4, 2597–2604, https://doi.org/10.1039/C3SC50682G, 2013. a, b, c
Preston, T. C.: Non-Fickian diffusion in viscous aerosol particles, Can. J. Chem., 100, 168–174, https://doi.org/10.1139/cjc-2021-0187, 2022. a
Renbaum-Wolff, L., Grayson, J. W., Bateman, A. P., Kuwata, M., Sellier, M., Murray, B. J., Shilling, J. E., Martin, S. T., and Bertram, A. K.: Viscosity of α-pinene secondary organic material and implications for particle growth and reactivity, P. Natl. Acad. Sci. USA, 110, 8014–8019, https://doi.org/10.1073/PNAS.1219548110, 2013. a
Richards, D. S., Trobaugh, K. L., Hajek-Herrera, J., Price, C. L., Sheldon, C. S., Davies, J. F., and Davi, R. D.: Ion-molecule interactions enable unexpected phase transitions in organic-inorganic aerosol, Science Advances, 6, 5643–5661, https://doi.org/10.1126/sciadv.abb5643, 2020. a, b, c, d
Riemer, N., Ault, A. P., West, M., Craig, R. L., and Curtis, J. H.: Aerosol Mixing State: Measurements, Modeling, and Impacts, Rev. Geophys., 57, 187–249, https://doi.org/10.1029/2018RG000615, 2019. a
Rovelli, G., Song, Y. C., MacLean, A. M., Topping, D. O., Bertram, A. K., and Reid, J. P.: Comparison of Approaches for Measuring and Predicting the Viscosity of Ternary Component Aerosol Particles, Anal. Chem., 91, 5074–5082, https://doi.org/10.1021/ACS.ANALCHEM.8B05353, 2019. a, b, c, d, e, f, g, h, i
Rumble, J.: CRC Handbook of Chemistry and Physics, CRC Press, 10th4 edn., https://hbcp.chemnetbase.com/contents/ContentsSearch.xhtml?dswid=8271 (last access: 15 November 2024), 2023. a
Sheldon, C. S., Choczynski, J. M., Morton, K., Palacios Diaz, T., Davis, R. D., and Davies, J. F.: Exploring the hygroscopicity, water diffusivity, and viscosity of organic–inorganic aerosols – a case study on internally-mixed citric acid and ammonium sulfate particles, Environmental Science: Atmospheres, 3, 24–34, https://doi.org/10.1039/D2EA00116K, 2023. a, b
Shrivastava, M., Lou, S., Zelenyuk, A., Easter, R. C., Corley, R. A., Thrall, B. D., Rasch, P. J., Fast, J. D., Simonich, S. L., Shen, H., and Tao, S.: Global long-range transport and lung cancer risk from polycyclic aromatic hydrocarbons shielded by coatings of organic aerosol, P. Natl. Acad. Sci. USA, 114, 1246–1251, https://doi.org/10.1073/PNAS.1618475114, 2017. a
Singh, M., Jones, S. H., Kiselev, A., Duft, D., and Leisner, T.: The viscosity and surface tension of supercooled levitated droplets determined by excitation of shape oscillations, Atmos. Meas. Tech., 16, 5205–5215, https://doi.org/10.5194/amt-16-5205-2023, 2023. a
Song, M., Liu, P. F., Hanna, S. J., Zaveri, R. A., Potter, K., You, Y., Martin, S. T., and Bertram, A. K.: Relative humidity-dependent viscosity of secondary organic material from toluene photo-oxidation and possible implications for organic particulate matter over megacities, Atmos. Chem. Phys., 16, 8817–8830, https://doi.org/10.5194/acp-16-8817-2016, 2016a. a
Song, Y. C., Haddrell, A. E., Bzdek, B. R., Reid, J. P., Bannan, T., Topping, D. O., Percival, C., and Cai, C.: Measurements and Predictions of Binary Component Aerosol Particle Viscosity, J. Phys. Chem. A, 120, 8123–8137, https://doi.org/10.1021/ACS.JPCA.6B07835, 2016b. a, b, c
Song, Y.-C., Lilek, J., Lee, J. B., Chan, M. N., Wu, Z., Zuend, A., and Song, M.: Viscosity and phase state of aerosol particles consisting of sucrose mixed with inorganic salts, Atmos. Chem. Phys., 21, 10215–10228, https://doi.org/10.5194/acp-21-10215-2021, 2021. a, b, c, d, e, f, g
Stokes, R. and Robinson, R.: Interactions in aqueous nonelectrolyte solutions. I. Solute-solvent equilibria, J. Phys. Chem., 70, 2126–2131, 1966. a
Tong, Y.-K., Liu, Y., Meng, X., Wang, J., Zhao, D., Wu, Z., and Ye, A.: The relative humidity-dependent viscosity of single quasi aerosol particles and possible implications for atmospheric aerosol chemistry, Phys. Chem. Chem. Phys, 24, 10514, https://doi.org/10.1039/d2cp00740a, 2022. a, b, c, d, e, f, g, h, i, j
Vignes, A.: Variation in Diffusion Coefficient with Composition, Ind. Eng. Chem. Fund., 5, 189–199, 1966. a
Weber, R. J., Guo, H., Russell, A. G., and Nenes, A.: High aerosol acidity despite declining atmospheric sulfate concentrations over the past 15 years, Nat. Geosci., 9, 282–285, https://doi.org/10.1038/ngeo2665, 2016. a
Zdanovskii, A.: New methods for calculating solubilities of electrolytes in multicomponent systems, Zh. Fiz. Khim, 22, 1478–1485, 1948. a
Zhang, Q., Jimenez, J. L., Canagaratna, M. R., Ulbrich, I. M., Ng, N. L., Worsnop, D. R., and Sun, Y.: Understanding atmospheric organic aerosols via factor analysis of aerosol mass spectrometry: A review, Anal. Bioanal. Chem., 401, 3045–3067, https://doi.org/10.1007/S00216-011-5355-y, 2011. a, b, c, d, e
Zobrist, B., Marcolli, C., Pedernera, D. A., and Koop, T.: Do atmospheric aerosols form glasses?, Atmos. Chem. Phys., 8, 5221–5244, https://doi.org/10.5194/acp-8-5221-2008, 2008. a, b
Zobrist, B., Soonsin, V., Luo, B. P., Krieger, U. K., Marcolli, C., Peter, T., and Koop, T.: Ultra-slow water diffusion in aqueous sucrose glasses, Phys. Chem. Chem. Phys., 13, 3514–3526, https://doi.org/10.1039/c0cp01273d, 2011. a
Zuend, A.: andizuend/AIOMFAC: AIOMFAC-web v3.03, Version v3.03, Zenodo [code], https://doi.org/10.5281/zenodo.6049217, 2022. a
Zuend, A., Marcolli, C., Luo, B. P., and Peter, T.: A thermodynamic model of mixed organic-inorganic aerosols to predict activity coefficients, Atmos. Chem. Phys., 8, 4559–4593, https://doi.org/10.5194/acp-8-4559-2008, 2008. a, b, c, d
Zuend, A., Marcolli, C., Booth, A. M., Lienhard, D. M., Soonsin, V., Krieger, U. K., Topping, D. O., McFiggans, G., Peter, T., and Seinfeld, J. H.: New and extended parameterization of the thermodynamic model AIOMFAC: calculation of activity coefficients for organic-inorganic mixtures containing carboxyl, hydroxyl, carbonyl, ether, ester, alkenyl, alkyl, and aromatic functional groups, Atmos. Chem. Phys., 11, 9155–9206, https://doi.org/10.5194/acp-11-9155-2011, 2011. a, b
Zuend, A., Levac, N., and Seinfeld, J. H.: AIOMFAC-web website and online model, McGill University, Montreal, Canada, https://aiomfac.lab.mcgill.ca (last access: 15 November 2024), 2012. a
Zuend, A., Yin, H., and Lilek, J.: AIOMFAC-web v3.03 – Public model code repository, https://github.com/andizuend/AIOMFAC (last access: 2 May 2024), 2021. a
- Abstract
- Introduction
- Methods
- Results and discussion
- Conclusion
- Appendix A: Aqueous binary mixture fit coefficients
- Appendix B: Estimation of temperature-dependent atmospheric mixing times for NH4NO3–toluene-derived SOA mixtures
- Appendix C: Calculation of equilibration times for the laboratory experiments and tabulated results
- Code availability
- Data availability
- Author contributions
- Competing interests
- Disclaimer
- Acknowledgements
- Financial support
- Review statement
- References


