the Creative Commons Attribution 4.0 License.
the Creative Commons Attribution 4.0 License.
 | 30 Jan 2024
Real-world observations of reduced nitrogen and ultrafine particles in commercial cooking organic aerosol emissions
Sunhye Kim
Jo Machesky
Drew R. Gentner
Cooking is an important but understudied source of urban anthropogenic fine particulate matter (PM2.5). Using a mobile laboratory, we measured PM size and composition in urban restaurant plumes. Size distribution measurements indicate that restaurants are a source of urban ultrafine particles (UFPs, particles <100 nm mobility diameter), with a mode diameter <50 nm across sampled restaurants and particle number concentrations (PNCs, a proxy for UFPs) that were substantially elevated relative to the urban background. In our observations, PM mass emitted from restaurants was almost entirely organic aerosol (OA). Aerosol mass spectra show that while emissions from most restaurants were similar, there were key mass spectral differences. All restaurants emit OA at 41, 43, and 55, though the composition (e.g., the ratio of oxygenated to reduced ions at specific ) varied across locations. All restaurant emissions included reduced-nitrogen species detected as CxHyN+ fragments, making up ∼15 % of OA mass measured in plumes, with reduced molecular functionalities (e.g., amines, imides) that were often accompanied by oxygen-containing functional groups. The largest reduced-nitrogen emissions were observed from a commercial bread bakery (i.e., 30 %–50 % of OA mass), highlighting the marked differences between restaurants and their importance for emissions of both urban UFPs and reduced nitrogen.
- Article
(5221 KB) - Full-text XML
-
Supplement
(3843 KB) - BibTeX
- EndNote


Concentrations of most air pollutants, including fine particulate matter (PM2.5) and ultrafine particles (UFPs; particles with diameter <100 nm), are typically higher in urban areas compared to rural or suburban areas (Cheng et al., 2019; Chow et al., 2006; Lenschow et al., 2001; Louie et al., 2005; Renzi et al., 2021; Wang et al., 2020). Elevated urban concentrations lead to higher human exposure and, in turn, contribute to the health impacts of air pollution. PM2.5 exposures are associated with cardiovascular disease, lung cancer, and asthma and contribute to up to 100 000 deaths annually in the US (Castillo et al., 2021). Although health effects of UFP exposure are less extensively studied compared to PM2.5 (Schraufnagel, 2020) and are an area of ongoing research, there is growing evidence that UFPs can enhance acute health effects because of their small size and high surface area (Ali et al., 2022; Ibald-Mulli et al., 2002; Kwon et al., 2020).
The PM2.5 and UFP concentration enhancements in many urban areas are strongly influenced by anthropogenic emissions (Apte et al., 2017; Li et al., 2018; Mohr et al., 2011; Saha et al., 2019). Among a wide variety of contributing sources to air quality in the US, two notable urban sources are mobile sources (e.g., motor vehicles) and cooking. These two sources contribute to urban enhancements relative to the non-urban areas and to intra-urban spatial variations in PM2.5 and UFP concentrations (Klompmaker et al., 2015). In prior work, mobile sources and cooking emissions have led to neighborhood-scale enhancements of ∼0.5–1 µg m−3 of PM2.5 in North American cities and a factor-of-2 enhancement in UFPs (Eilenberg et al., 2020; Song et al., 2021).
Motor vehicle emissions are well studied and have seen dramatic reductions as a result of effective regulations on PM emissions across Europe and the US (Font et al., 2019; Keuken et al., 2012). In contrast, there has been less attention to cooking sources as contributors of PM and UFP emissions. As such, there have been fewer direct measurements and regulations dedicated to cooking-related emissions, including everyday sources such as restaurants and home kitchens. For comparison, two studies conducted in Pasadena, California revealed that organic PM2.5 attributed to cooking decreased from approximately 2.4 to 1.2 µg m−3 between 1982 and 2010, while the contribution from traffic sources dropped from about 6.8 to 0.82 µg m−3 (Hayes et al., 2013; Schauer et al., 1996). This means that while total PM2.5 and vehicular-related primary PM2.5 have decreased, the fraction of urban PM2.5 attributed to cooking has increased.
Aerosol mass spectrometry (AMS) measurements worldwide further indicate the importance of cooking PM. Factor analysis utilizing PMF (positive matrix factorization) on AMS data routinely identifies a cooking organic aerosol (COA) factor that represents between 6 %–25 % of the total organic aerosol (OA) within PM1 in urban settings. Specifically, a study in Athens and Patras, Greece, showed that the COA contribution increased to 75 % of organic PM1 during mealtime in Patras (Florou et al., 2017). While the COA factor is routinely identified, there can be significant variation in its composition from city to city (Bozzetti et al., 2017; Crippa et al., 2013b; Hu et al., 2021; Huang et al., 2010; Lee et al., 2015; Pandis et al., 2016; Sun et al., 2012).
Many potential factors could produce variability in the composition and size distribution of cooking PM. While the UFPs from cooking can contribute to ∼80 % of the total particle number concentrations indoors (Wan et al., 2011), there are multiple of factors – such as indoor–outdoor air exchange rates (Wallace et al., 2004) and types of cooking oils used (Torkmahalleh et al., 2012) – that can determine the size distribution of particles as well as the PM2.5 concentrations from cooking activities. There is some evidence that the chemical composition of cooking emissions may vary with the cooking style and the food cooked (Omelekhina et al., 2020; Reyes-Villegas et al., 2018; Takhar et al., 2019). For example, the cooking temperature, ingredients, and methods used can alter chemical pathways that lead to the generation of nitrogen-containing functional groups, including amides, within COA (Ditto et al., 2022). Multiple studies found that nitrogen-containing components have been observed while charbroiling (Rogge et al., 1991) or deep-frying hamburgers (Reyes-Villegas et al., 2018; Rogge et al., 1991). Masoud et al. (2022) found that nitrogen-containing compounds contributed 12 %–19 % of the signal measured by a chemical ionization mass spectrometer for emissions from typical in-home cooking. Overall, this variability across diverse cooking styles and conditions is relevant but poorly understood. This implies a significant need for real-world measurements to characterize and understand particle size and composition of cooking emissions in urban environments.
This study aimed to characterize cooking emissions from real-world restaurant sources in the US. We used a mobile laboratory to measure cooking emissions from nine restaurants in Pittsburgh, PA and Baltimore, MD. Four of these restaurants were visited twice, making for a total of 13 cooking sites. Several analytical instruments, including an AMS and FMPS (fast mobility particle sizer), were used at each site for online measurements, with supplemental PM collection on Teflon filters for offline analysis. The measurements are used to examine variations in UFP concentrations and cooking OA composition measured outside of restaurants with a focus on contributions from reduced-nitrogen components across restaurant sites visited during the field campaign.
2.1 Measurement locations
Field samples were collected from 13 visits to nine urban cooking sites in Pittsburgh and Baltimore during July and August 2019 (Table 1). Candidate restaurants were identified using Google Maps. We first identified an initial list of candidate restaurants by searching Google Maps for restaurants located adjacent to a public road that seemed to have a horizontal exhaust vent pointed towards the road (Fig. S1 in the Supplement). We then visited each candidate restaurant location in person to determine whether our mobile laboratory could be parked near the restaurant exhaust for emissions sampling.
Table 1Summary of restaurant locations and average concentration enhancements measured in the cooking emission plumes over the entire sampling duration. Several restaurants were sampled on two separate days, as indicated by the number following the restaurant identifier. AMS high-resolution analysis of mean OA enhancement (CE=1), mean BC enhancement from aethalometer, O:C ratio, mode Dp (nm) measured by the FMPS, mean f41 (the fraction of mass-to-charge ratio at 41 to the total organic mass signal), f43, and f55.
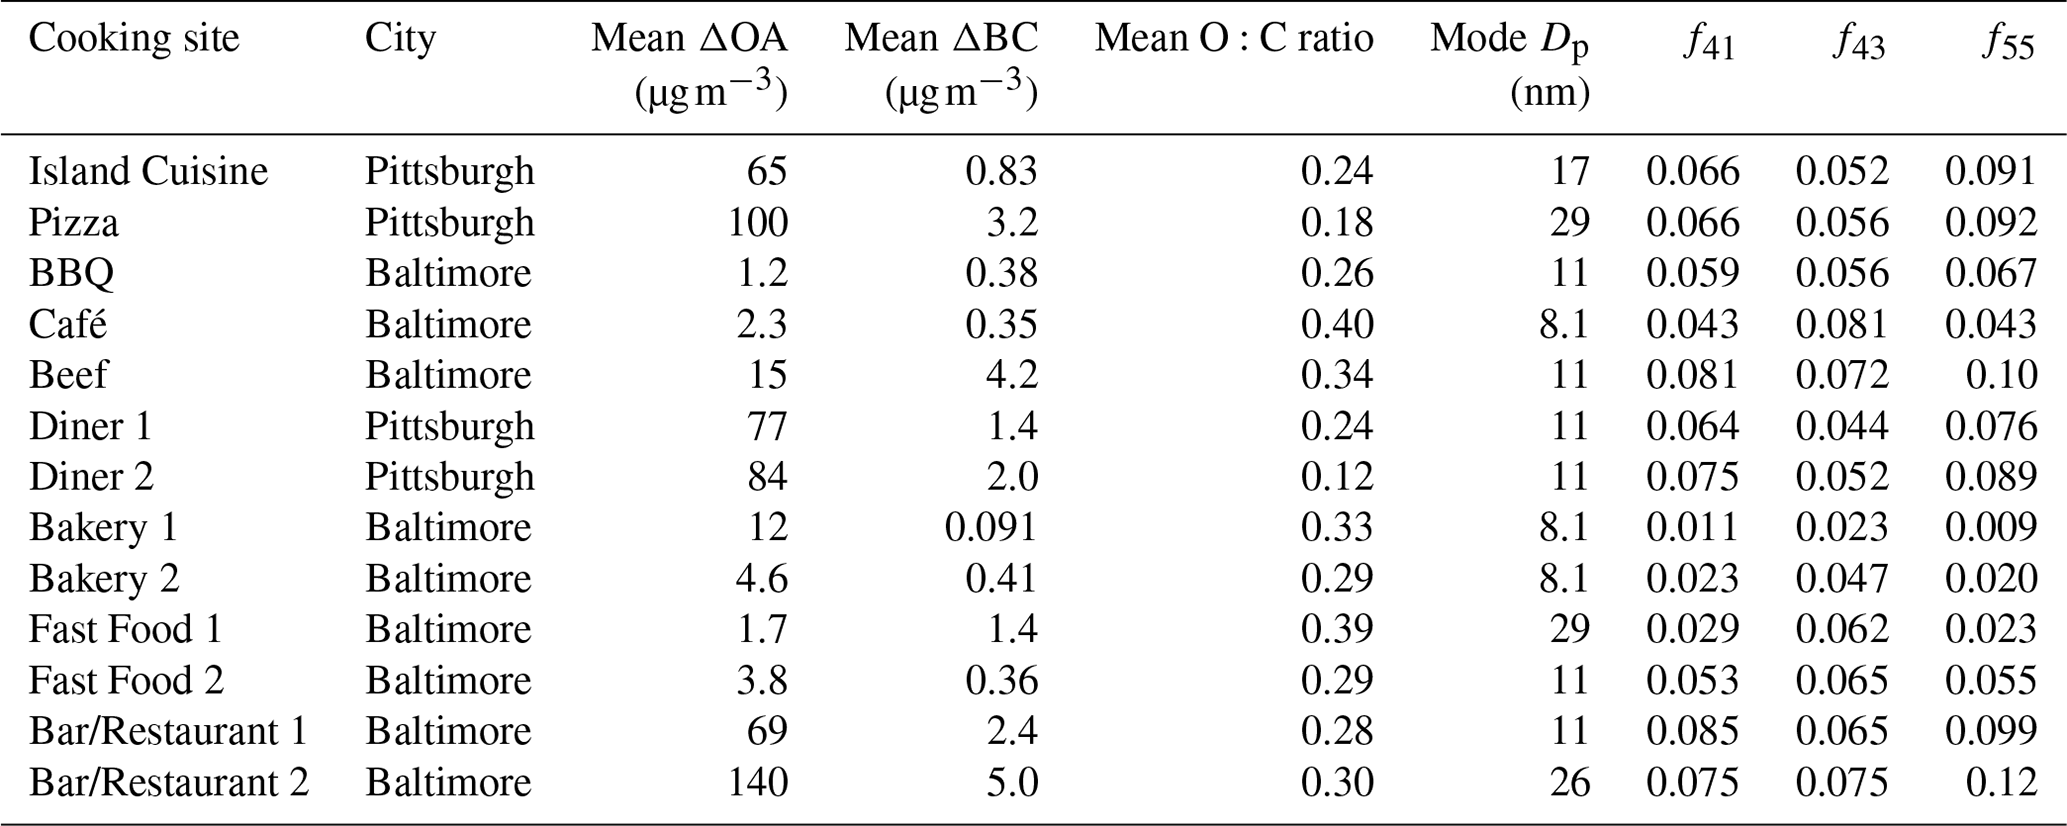
Table 1 indicates the type of cuisine prepared at each restaurant. We tried to sample across a range of cuisines and price points. For example, one sampling location was a major fast-food chain that primarily serves hamburgers (Fast Food 1 and 2). Another location (Bar/Restaurant 1 and 2) was a more expensive restaurant where many entrees cost more than USD 30. Lastly, we sampled twice outside of a large commercial bread bakery (Bakery 1 and 2).
Our procedure for identifying candidate restaurants has two important implications for our results. First, it means that the set of sampled restaurants represents a convenience sample and may therefore not be completely representative of the types of restaurants found in Pittsburgh or Baltimore. Second, since we did not coordinate with restaurant owners or operators during our sampling, we do not have detailed information about cooking fuel (though we assume that most restaurants used either gas or electricity), the specific cooking methods used, or the volume of food cooked during our sampling periods.
At each location, we parked a mobile laboratory near the restaurant's exhaust plume (Fig. S1). The selected restaurants represent a mix of accessible locations with visible emission plumes or exhaust vents. The sampling inlet on the mobile laboratory was typically within a few meters of the exhaust vent. However, this distance varied due to several uncontrollable external factors, such as the availability of parking and the height of the restaurants' exhaust vents. As a result, the measured emission plumes went through varying degrees of dilution before reaching our sampling inlet. At all locations we measured a mixture of fresh emissions and the ambient background air, though the fresh emissions were dominant. Nonetheless, it is important to recognize that some of the variability we observe between restaurants could be the result of dilution-driven changes in UFP and OA concentrations.
Several of the restaurants were sampled on multiple visits to examine day-to-day variations in emissions. These variations could be due to differences in activity (e.g., how many customers ordered food), the type of food ordered, and differences in dilution conditions. Each visit to a restaurant site lasted approximately 30–60 min. The sampling periods targeted expected times for lunch (∼11:00–13:00 LT) and dinner (∼18:00–20:00 LT).
2.2 Mobile laboratory and measurements
Instruments were loaded into a gasoline-powered mobile laboratory. At each location, we oriented the mobile laboratory so that the vehicle tailpipe was located downwind of the sample inlet to minimize self-contamination from the vehicle exhaust.
We use total particle number concentration (PNC) as our proxy for UFPs. Particle number counts were measured by a MAGIC™ water CPC (Moderated Aerosol Growth with Internal water Cycling Condensation Particle Counter, Aerosol Devices Inc., model MAGIC200P). MAGIC CPC uses water condensation to enlarge particles through a three-temperature stage growth tube. The enlarged particles are counted with a laser sensor up to 400 000 particles cm−3 with a particle size range between 5 nm and 2.5 µm in diameter (Hering et al., 2019). Saha et al. (2019) previously observed that the MAGIC CPC undercounts relative to a butanol CPC. Thus, the raw CPC output was adjusted using a correction factor determined from the co-location of the MAGIC CPC with a TSI 3772 butanol CPC.
Particle size distributions and total number concentrations were measured with FMPS (fast mobility particle sizer, TSI Inc., model 3091) for particles with diameters from 6.04 to 523.3 nm. The FMPS reported systematically lower particle counts than the MAGIC CPC (factor of 3.5, Sect. S2 and Fig. S2 in the Supplement). FMPS data were utilized in lieu of the CPC data due to high particle number concentrations in restaurant plumes that exceeded the upper counting limit of the CPC (400 000 particles cm−3), resulting in error flags. To ensure consistency with the MAGIC CPC, all FMPS data were corrected by integrating the FMPS size distribution, which was scaled by the FMPS : CPC ratio.
A high-resolution AMS (HR-AMS, Aerodyne), which measures non-refractory particles with a diameter less than 1 µm (NR-PM1), was used to identify mass spectra of PM components (organics, , , , and Cl−) in real time. Squirrel (SeQUential Igor data RetRiEvaL) toolkit 1.62G and Pika (Peak Integration by Key Analysis) toolkit 1.22G in Igor Pro (WaveMetrics, Lake Oswego) were used for the HR-AMS data analysis. For the baseline and peak fitting correction procedures of the HR-AMS data, the high-resolution range of (mass-to-charge ratios) 12 to 140 was selected. All AMS analysis presented here assumes a collection efficiency (CE) of one.
An aethalometer (Magee Scientific, model AE33), CO analyzer (Teledyne API T300), and CO2 analyzer (LI-820, LI-COR Biosciences) measured black carbon (BC), CO, and CO2 concentration, respectively.
PM2.5 samples were collected at ∼70 L min−1 on 47 mm PTFE membrane filters (47 mm, 2.0 µm pores, Tisch Scientific) through a separate inlet mounted close to the online instrumentation inlet outfitted with a cyclone (2.5 µm cut point with a flow rate of 92 L min−1, URG-2000-30EH, URG cyclone). At each restaurant site where plumes were observed via AMS, a filter sample was collected for at least 30 min, and Table S3 in the Supplement shows details for each filter sample. Filter samples were transported on ice packs from the mobile lab and kept in sample storage freezers. Additional filter collection details can be found in the Supplement. All samples were analyzed via liquid chromatography (LC) using an Agilent Infinity LC and an Agilent Poroshell 120 SB-Aq reverse-phase column (2.1×50 mm, 2.7 µm particle size). The LC was coupled to an electrospray ionization (ESI) source, operated in positive and negative modes for each sample, and connected to a high-resolution mass spectrometer (Agilent 6550 Q-TOF). These instruments were operated following previously described methods (Ditto et al., 2018, 2020).
Selected samples showing unique AMS spectra with nitrogen-containing compounds underwent further analysis via MS/MS (tandem mass spectrometry) with the objective of identifying the distribution of functional groups within the reduced-nitrogen species that were observed via LC-TOF, similar to prior work (Ditto et al., 2020, 2022). LC-TOF mode data processing and QC/QA have previously been described (Ditto et al., 2018), and details of compound selection for MS/MS analysis in this study can be found in the Supplement (Sect. S3). MS/MS spectra analysis used SIRIUS with CSI:FingerID for molecular structure prediction (Dührkop et al., 2015, 2019), and the APRL Substructure Search Program was used for functional group identification from the predicted SMILES formula for atmospherically relevant groups (Ruggeri and Takahama, 2016). Further details on LC-MS/MS analysis, processing, and associated limitations of ESI and MS/MS spectra analysis can be found in Ditto et al. (2020), with brief comments on relevant SIRIUS updates in the Supplement (Sect. S3).
3.1 Typical measurements of restaurant emission
Figure 1 demonstrates observations collected during a typical sampling day via the mobile lab in Baltimore. On this day, the mobile laboratory was initially (∼15:36–16:49 LT) parked in an urban park, here noted as background. Sampling was then conducted on-road, driving on various streets in urban Baltimore, from 16:49 to 18:20 LT. At 18:20 LT the mobile laboratory was parked outside a restaurant (Bar/Restaurant 2).
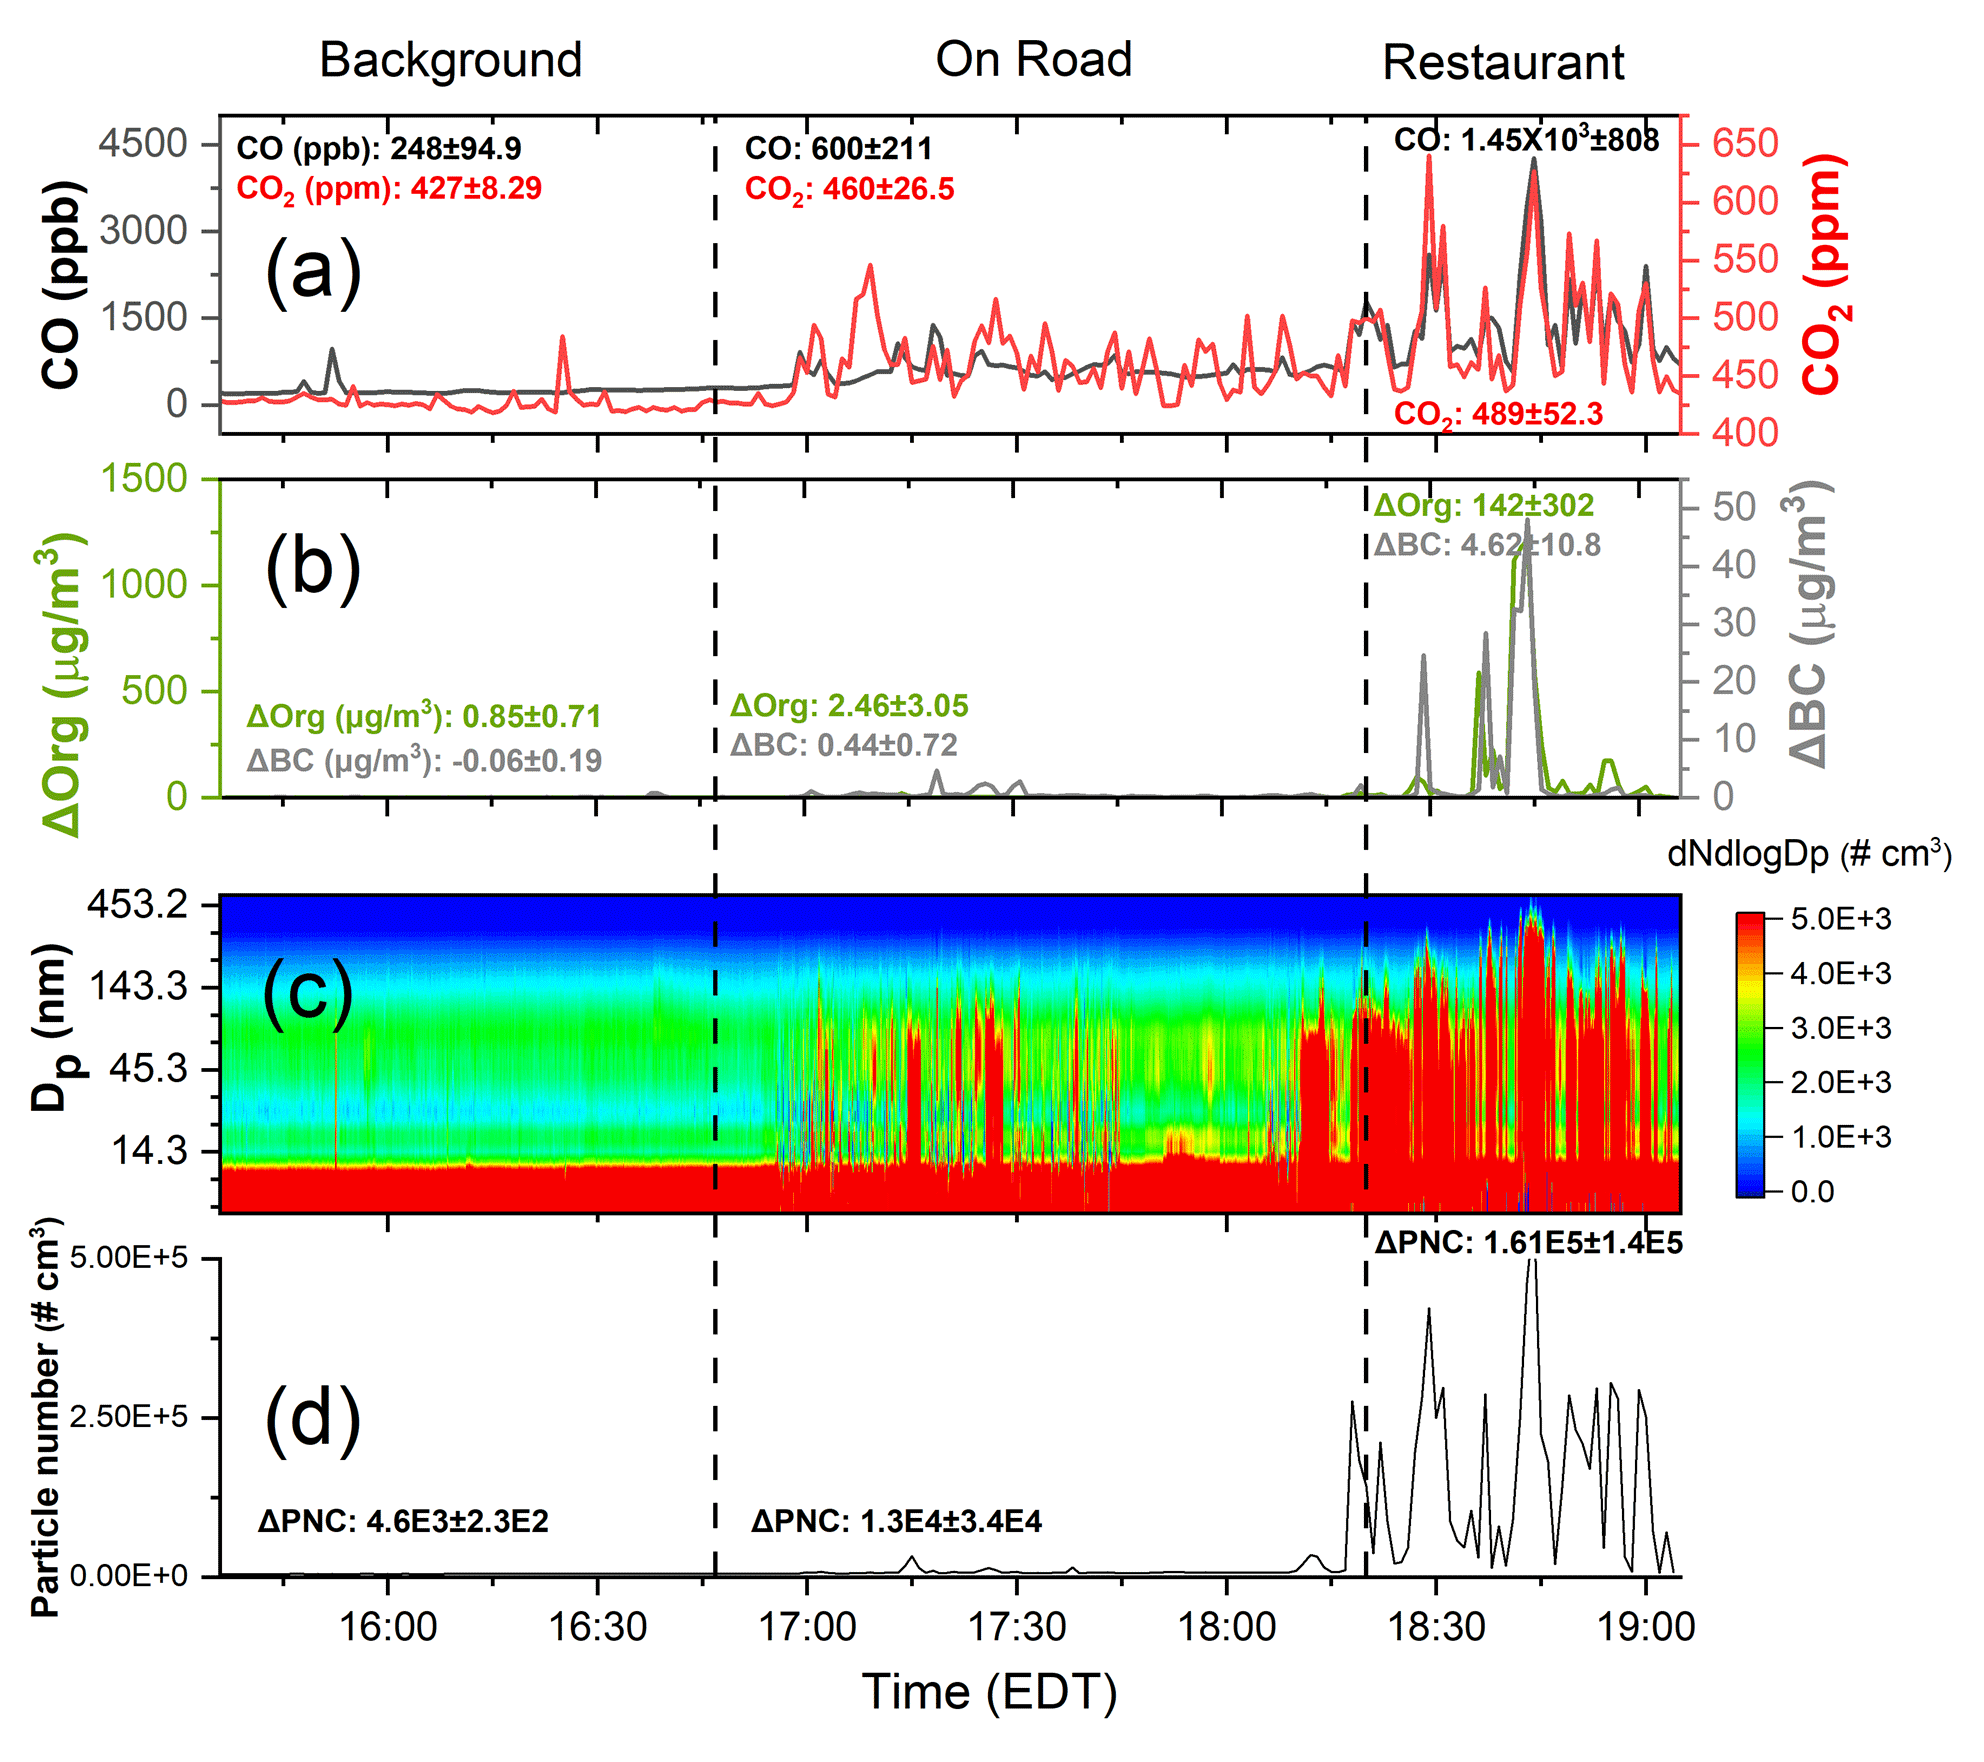
Figure 1Urban background, on-road, and restaurant plumes observed during a typical sampling day (Bar/Restaurant 2) in Baltimore, showing (a) CO and CO2, (b) background-corrected organic aerosol (ΔOA) and black carbon (ΔBC) concentrations, (c) particle size distribution from FMPS, and (d) background-corrected total particle number concentrations. All concentrations were significantly higher and more variable in the restaurant emissions plume than in the urban background or on-road period. Numbers in panels (a), (b), and (d) indicate the mean ± standard deviation for each sampling period.
The data in Fig. 1 show clear variations in pollutant concentrations between the background, on-road, and restaurant portions of sampling. In general, concentrations were the lowest and least variable in urban background locations and the highest and most variable for the restaurant sampling periods.
Nearby vehicles significantly impacted the measured concentrations during the on-road sampling period, thus differentiating it from the background period, where direct observations of on-road emissions were minimal. Concentrations of CO, CO2 (Fig. 1a), organic aerosol (OA), black carbon (BC, Fig. 1b), and particle number (Fig. 1d) were all elevated in the on-road samples compared to the urban background.
In order to quantify concentration differences between microenvironments (e.g., on-road versus background), we compute the enhancement of all species above the urban background (e.g., ΔOA). We did this by defining the background concentration as the 5th percentile of measurements made in the background location on each sampling day. This background concentration is then subtracted from the measurements to determine local concentration enhancements. Background concentrations for BC and OA are listed in Table S1 in the Supplement. While many other background correction methods have been proposed in the literature (Actkinson et al., 2021), the overall results presented in Fig. 1 are not sensitive to our specific choice of background correction method.
The mean organic aerosol concentrations are 5.8 µg m−3 (ΔOA: 2.46 µg m−3) during on-road sampling versus 4.2 µg m−3 (ΔOA: 0.85 µg m−3) in the urban background (Fig. 1b). Similarly, the BC concentration was 0.5 µg m−3 higher on-road than in the urban background, and PNC was approximately a factor of 3 higher on-road than in the urban background. These enhancements in organic aerosol, black carbon, and PNC are broadly consistent with enhancements seen in high-traffic areas by our previous sampling in Pittsburgh and Oakland (Saha et al., 2020; Shah et al., 2018).
In addition to the overall increase in pollutant concentrations on-road, there are occasional, coincident spikes in CO, BC, OA, and PNC during the on-road sampling. The particle size distribution also changes during these spikes (Fig. 1c), with higher concentrations of particles in the 20–100 nm size range. These are likely plumes from nearby high-emitting vehicles, potentially diesel trucks and buses (Dallmann et al., 2013; Tan et al., 2016).
The highest and most variable concentrations are observed in the restaurant plume. In this near-source environment, organic aerosol concentrations averaged 146 µg m−3. This is 35 times higher than the urban OA background. Particle number counts were also 35 times higher in concentration than background levels. CO, CO2, and BC enhancements were also observed when the mobile lab was parked near the restaurant. The enhancement of CO was 5.9 times the background, and CO2 and BC were 1.15 and 5.42 times higher, respectively.
During the restaurant sampling period, there are several clear and concurrent spikes in OA (Fig. 1b) and particle number count (Fig. 1d). These seem to be associated with specific events, such as preparing a customer's new order (restaurant kitchens had varying activity levels during the sampling periods). The size distributions in Fig. 1c show that these emissions span a wide range in particle size, from <10 nm up to a few hundred nanometers, demonstrating that restaurants may be a source of urban ultrafine particles.
While average BC concentrations were about a factor of 5 higher than background during the restaurant sampling period, BC seems to be a relatively smaller component of PM emissions from the restaurant. The OA BC ratio in the urban background and on-road sampling periods was ∼4. In the restaurant plume, the mean OA BC ratio was 28. Despite occasional periods of very high BC concentrations reaching up to 58 µg m−3, the OA BC ratio during the spike was 230 (Fig. S3 in the Supplement). Other PM components (e.g., sulfate and nitrate) show no discernable enhancement during the restaurant sampling period (Fig. S4 in the Supplement). This indicates that the PM emissions from the restaurant were dominated by organic aerosol.
We also observed elevated concentrations of CO and CO2 in the restaurant exhaust. We do not have information about each restaurant's cooking practices or fuels (i.e., whether the restaurants used natural gas or electricity). Jung and Su (2020) showed that food cooking emits CO, so the CO spikes observed here may also be from the food rather than fuel combustion. Other recent measurements in Pittsburgh by Song et al. (2021) also showed enhancements in CO during mealtimes in a restaurant-rich area.
3.2 Summary of organic aerosol enhancements at restaurant sites
Figure 1 shows the OA enhancement at a single restaurant. Enhancements in OA because of emissions from restaurants were similarly observed across all other sampling sites that we visited. Figure 2 is a box-plot visualization of the OA enhancement (ΔOA) for each restaurant visit. The data are split into two main groups for visual clarity: high concentration (mean ΔOA>50 µg m−3, Fig. 2a) and low concentration (mean ΔOA<30 µg m−3, Fig. 2b). Because of the variation in distance from the exhaust of each restaurant and our sampling inlet, the concentration enhancements shown in Fig. 2 are the result of both the emissions from each restaurant and dilution of the emission plume before sampling.
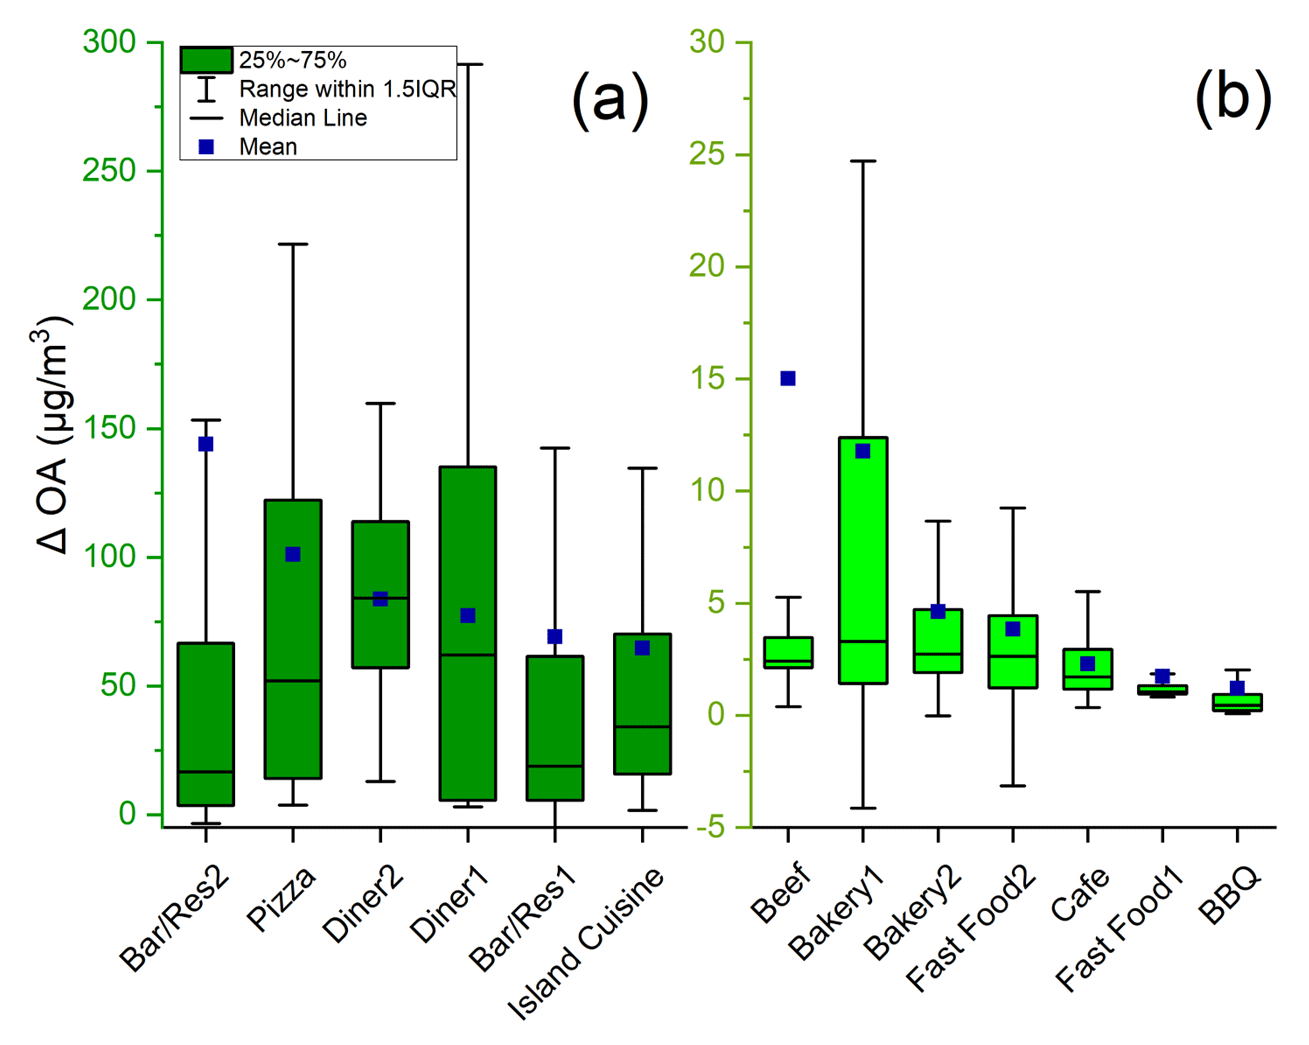
Figure 2Organic aerosol enhancement (ΔOA) at each restaurant site with (a) high (mean ΔOA>50 µg m−3) and (b) low (mean ΔOA<30 µg m−3) enhancements grouped in each for comparison. The sample names in panels (a) and (b) are ordered by decreasing mean concentration.
There is significant variability in measured ΔOA between and within each restaurant (Figs. 2 and S4). For nearly every location sampled, the emissions varied over time, as shown in Fig. 1, and this contributes to wide interquartile ranges (IQRs) in Fig. 2. It also means that at nearly every restaurant, there were periods when the concentration was near the urban background level, as indicated by the whiskers reaching (or even going slightly below) zero.
The temporal variability of the concentrations measured at each restaurant contributed to an upward skew in ΔOA, with a mean concentration greater than the 75th percentile at many locations. This suggests that the measurements were dominated by short, intense bursts of emissions rather than sustained high concentrations. Visualizations of this trend are noticeable in Fig. 1b, where there is a large spike in emissions so that OA goes above 1000 µg m−3 for several minutes. The temporal variability seems to be associated with the quantity of cooking that spikes amid busy mealtimes.
Four restaurants were sampled on multiple days (Bar/Restaurant, Fast Food, Bakery, and Diner). While there were day-to-day differences in the mean ΔOA at each location, each of these locations fell into the same group (i.e., ΔOA<30 µg m−3 or ΔOA>50 µg m−3) on both sampling days. This suggests that the day-to-day variations in emissions are smaller than within-day emissions for each location and that high-emitting restaurants are consistently high emitters. However, due to the limitation of a single visit to each sampling location during the campaign, it may be challenging to conclusively ascertain that the classification assigned to the sampled restaurants is not indicative of all similar cooking operations.
3.3 OA composition across restaurants
In this section, we compare the composition of cooking OA across the restaurants and to previous laboratory measurements and ambient factor analysis. Figure 3 shows the mean mass spectrum of OA measured at Bar/Restaurant 1 in Baltimore; mass spectra from other restaurants are shown in Fig. S5 in the Supplement. The mass spectrum contains a mixture of hydrocarbon (CxHy) and oxygenated (CxHyO) ions. This is consistent with the composition of cooking OA, which is often dominated by long-chain fatty acids from heated cooking oils and from meat cooking (Crippa et al., 2013a; Huang et al., 2021; Liu et al., 2017; Mohr et al., 2009; Takhar et al., 2019; Zhang et al., 2021). Several lab experiments from seed oil cooking detected fatty acids or degradation fragments such as n-alkanoic acid, n-alkenoic acid, oleic acid, and carbonyls (Allan et al., 2010; Liu et al., 2018; Schauer et al., 2002). Unlike oils, which are entirely comprised of fats, meats contain proteins and fats, although the composition can vary depending on the type of meat. Cooking meat generally emits cholesterol and fatty acids like palmitic acid, stearic acid, and oleic acid (Rogge et al., 1991; Schauer et al., 1996), which have all been used as chemical markers of meat cooking emissions. This mixture of hydrocarbon and oxygenated ions is also identified in PMF factor analysis of ambient datasets, as indicated by the mass spectrum from Crippa et al. (2013a) shown in Fig. 3.
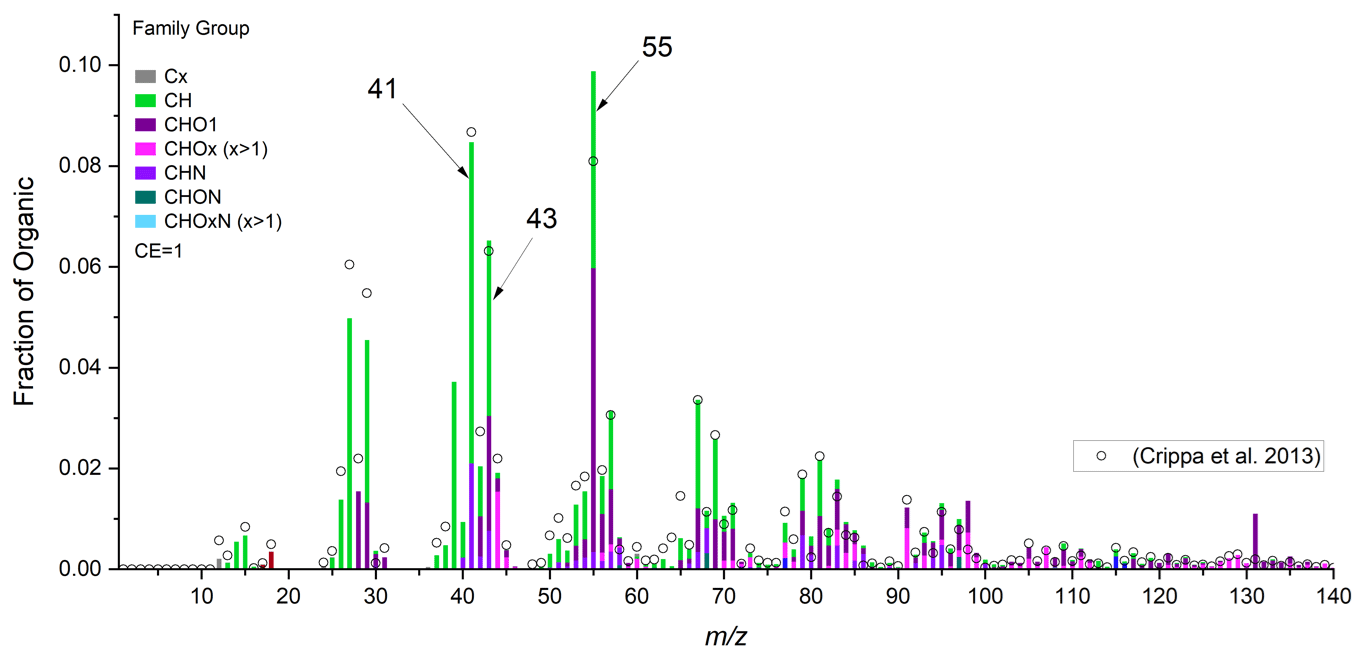
Figure 3Mass spectrum from the entire sampling period at Bar/Restaurant 2 and comparison with the COA mass spectrum for Paris determined from PMF by Crippa et al. (2013a). High-resolution mass spectra are grouped into sticks of the unit mass resolution, with colors indicating the mass fraction of chemical families.
The most abundant peaks in the mass spectrum were at 41 (mostly ), 43 (C2H3O+ and ), and 55 (C3H3O+ and ). These peaks have been used as COA markers for tracing cooking sources in previous studies (Allan et al., 2010; Dall'Osto et al., 2015; Kaltsonoudis et al., 2017; Mohr et al., 2009). Table 1 summarizes the mean contribution (f41, f43, and f55) at these values to each restaurant's overall OA mass spectrum.
Figure 4 compares f41 (OA mass fraction at 41), f43, and f55 across the restaurants sampled here to previously published COA mass spectra. We compared two types of previous studies: COA mass spectra derived from factor analysis of ambient data using PMF and laboratory measurements of cooking emissions. The laboratory measurements shown here include a combination of heating palm and olive oils (Liu et al., 2018) and various cooking experiments using meats (chicken and pork), vegetables, beans, and Asian cuisine (Kaltsonoudis et al., 2017; Zhang et al., 2021).
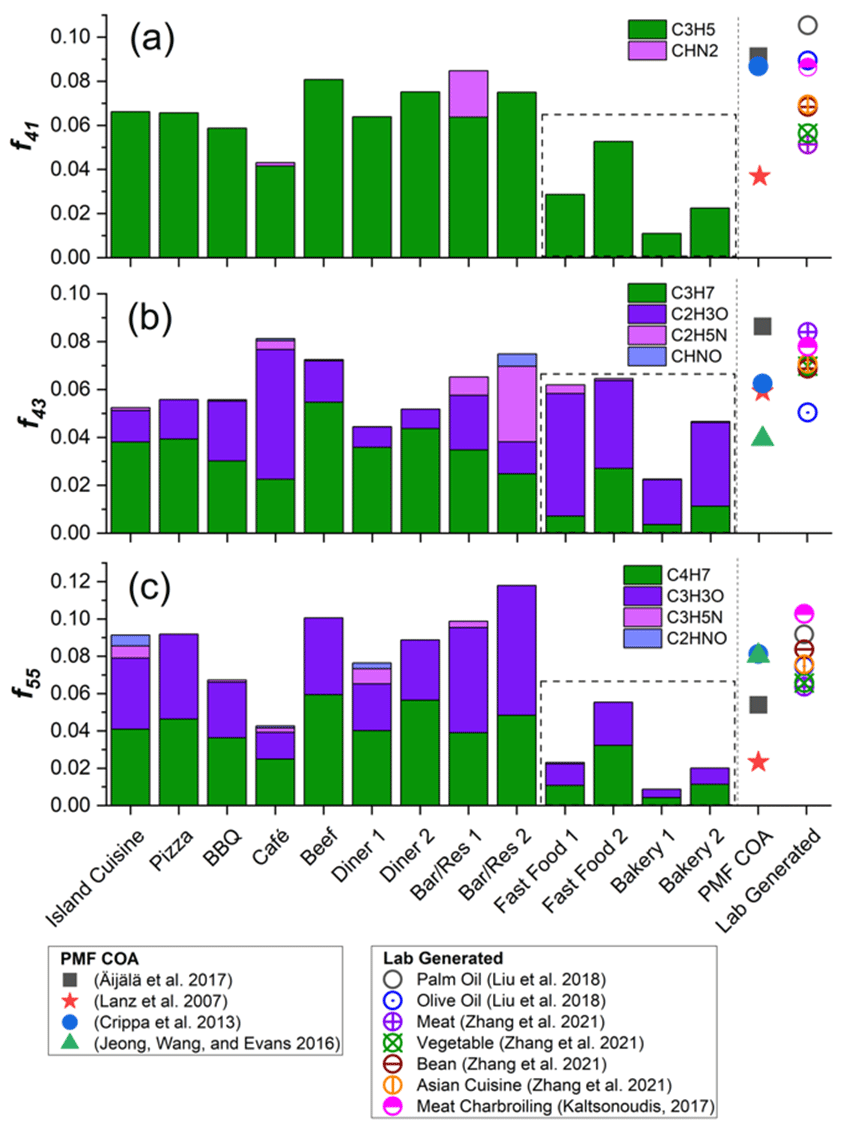
Figure 4Fraction of (a) 41, (b) 43, and (c) 55 to the total organic aerosol mass concentrations and comparison to COA mass spectra from prior PMF studies (Äijälä et al., 2017; Crippa et al., 2013a; Jeong et al., 2016; Lanz et al., 2007) and laboratory-generated cooking emissions (Kaltsonoudis et al., 2017; Liu et al., 2018; Zhang et al., 2021). Only f43 and f55 were shown in Jeong et al. (2016) (f41 was not provided in the paper). Fast Food and Bakery samples are grouped in a box as they showed lower abundances of f41 and f55.
For 41, our data were dominated by the hydrocarbon ion (), which was approximately 4 %–8 % of OA mass for most of the restaurants. The exceptions were Fast Food 1 and the two samples collected at the Bakery location. These had lower f41 (1 %–5 %) and are shown inside the dashed box. f41 fractions from our study were generally lower than from the PMF COA factors. Three of the four COA factors have f41 of ∼9 % (Äijälä et al., 2017; Crippa et al., 2013a; Jeong et al., 2016). The COA factor from Lanz et al. (2007) has f41∼4 % and is lower than most of the restaurants we sampled here. There is a wide range in f41 from the laboratory experiments. The two oil heating experiments (palm and olive oil, Liu et al., 2018) generated higher f41 than most of our measurements (8 %–10 %). There was a wider range in f41 for food cooking experiments (5 %–8 %), and there is a strong overlap with our measurements.
For f43 and f55, both oxidized (e.g., C2H3O+ and C3H3O+) and hydrocarbon (e.g., and ) ion fragments showed significant contributions across the urban cooking sites. There were also minor contributions from nitrogen-containing ions (e.g., C2H5N+ and C2HNO+). Except for Bakery 1, f43 was ∼5 %–8 % in our measurements. However, there was variation in the relative abundance of the hydrocarbon and oxygenated ions. For most sites, the contribution of the hydrocarbon ion () was larger than the oxygenated ion (C2H3O+). However, the sites with low f41, Bakery and Fast Food 1, 43 fragments were mostly oxygenated (mean = 3.5 %).
The mean f43 in the PMF profiles was 6.3 % with a range of 4 %–8.7 %, which is similar to the mean and range observed in our dataset. Similarly, the laboratory emissions data cluster around f43 of 8 %, with slightly lower f43 in the heated oil experiments. This is slightly higher than the f43 measured in the restaurant emissions.
The pattern in f55 is similar to f43; contributions are dominated by the hydrocarbon and oxygenated ion, with minor contributions from N-containing ions. For most sites, including the Bakery and Fast Food sites, the contributions of hydrocarbon and oxygenated ions at 55 are similar. The largest difference is that the Bakery and Fast Food sites have significantly lower f55 (1 %–6 %) than the other sites (4 %–12 %). Additionally, for many of the sites, f55 is larger than the PMF factors and the laboratory experiments.
The variations in f41, f43, and f55, as well as variations in the ratios between these 's, may indicate the food cooked at the different restaurants. For example, f41 appears to be larger than f43 for cooking emissions from oil, as observed in the oil heating experiments by Liu et al. (2018) and in laboratory oil cooking emissions by Allan et al. (2010). Meat cooking emissions seem to have the opposite relationship, with f43>f41. Both oil cooking and meat cooking have high f55, and meat cooking may have f55>f43 (Mohr et al., 2009).
For most restaurants sampled here (except for both Bakery and Fast Food), 55 is the most abundant signal in the aerosol mass spectrum. Additionally, f41 is slightly higher than f43 for these sites. This suggests a mixture of meat and oil cooking at these locations. For Bakery and Fast Food, f43 is typically the most abundant ion, with f41>f55. This may suggest a different mix of food being cooked or a difference in the cooking style. However, there is insufficient evidence in the mass spectra to conclusively explain the differences.
Figure 4 compares the cooking OA mass spectra for specific marker ions. Figure 5 compares the full cooking OA mass spectra. We use two metrics: the Pearson correlation (R) and cosine similarity. The statistical approach, correlation coefficient R, has been widely used in many studies, such as the analysis of air quality, to show an association between any two variables (Devarakonda et al., 2013; Giorio et al., 2012; Kiendler-Scharr et al., 2009; Raatikainen et al., 2010). Cosine similarity treats pairs of mass spectra as vectors and computes the angle (θ) between them (Kaltsonoudis et al., 2017; Kostenidou et al., 2009). θ is a measure of the similarities between two mass spectra, with a value of 0∘ meaning that both spectra are identical and indicating considerable differences between the spectra. Cosine similarity is more sensitive to smaller differences in mass spectra than R, as the correlation coefficient can be dominated by ions with large abundance (Kaltsonoudis et al., 2017). Figure 5 also compares the cooking emissions to PMF factors retrieved from Paris during winter (Crippa et al., 2013a) for biomass burning (BBOA), combustion emissions (HOA), and secondary OA (LVOOA) obtained from the Jimenez Research Group website (http://cires1.colorado.edu/jimenez-group/AMSsd/, last access: 16 June 2022).
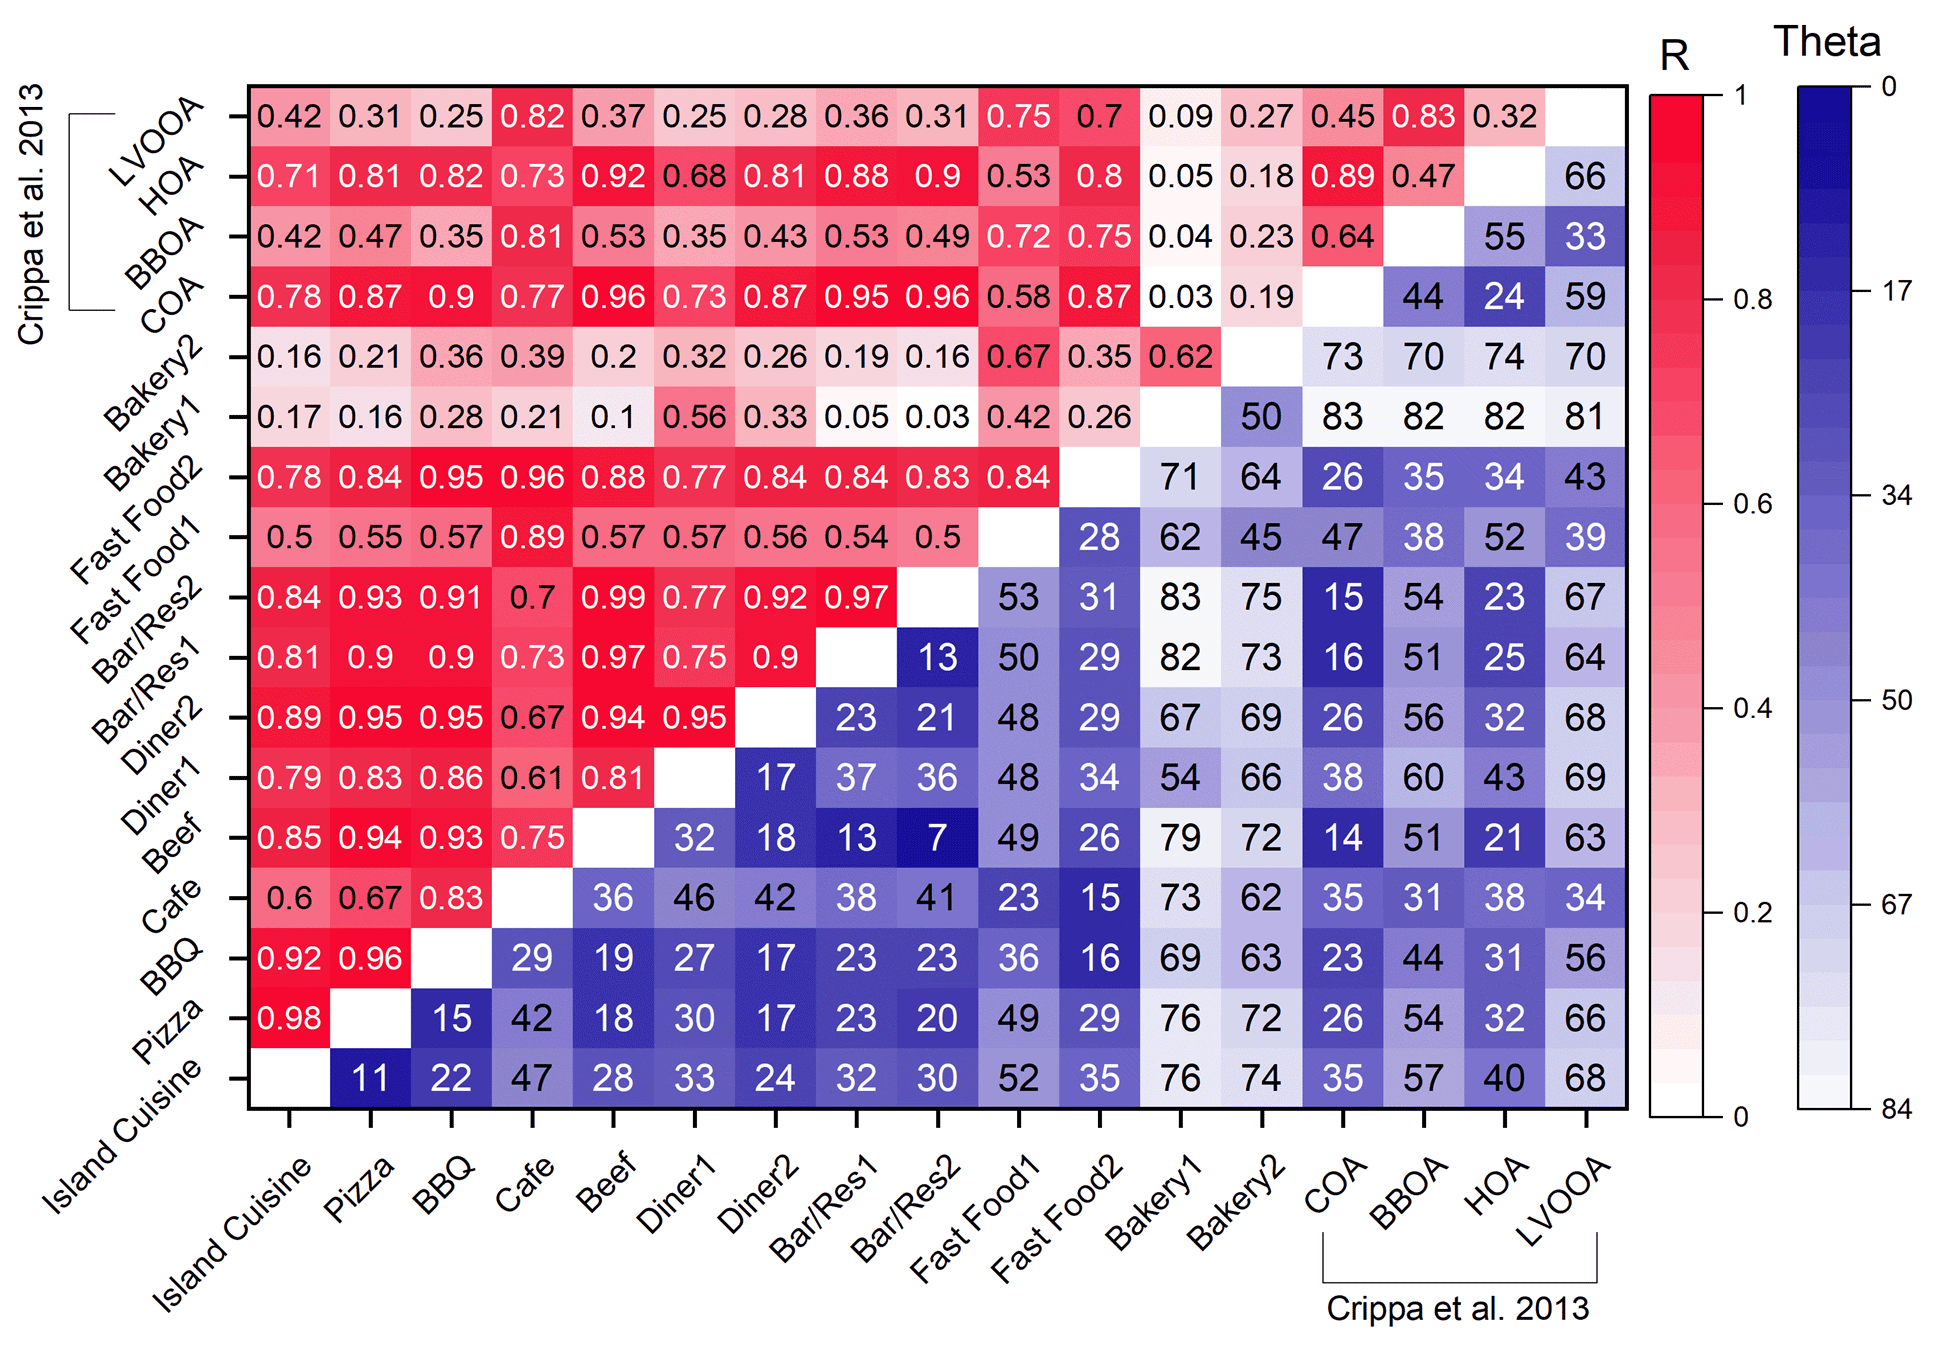
Figure 5Comparison of the AMS UMR (unit mass resolution spectra) in two urban areas using correlation coefficients (R) and cosine similarity (θ, in degrees). R values close to 1 and θ values close to 0 mean strong correlations of mass spectra. Both R and θ values are presented such that darker colors correspond to higher similarity.
Overall, the COA measured from most of the restaurants is similar. Of the 78 restaurant–restaurant pairs, 33 have R>0.8 and 49 have . These metrics underscore a notable similarity in mass spectra across a significant proportion of the sampling sites. The exceptions are the Bakery samples and, to a lesser extent, the Fast Food samples. These sites contribute the majority of the cases where R<0.8 and .
Bakery samples had R<0.3 and when compared to most of the other restaurants. This suggests that the emissions from the bakery site were fundamentally different than emissions from the other restaurants. While we do not have details on the specific activities at the bakery on the two days when we sampled, the bakery clearly prepares different food than many of the restaurants. For example, the bakery does not cook meat. The following section discusses key mass spectral differences in more detail.
The other location where the mass spectrum was different from other restaurants was Fast Food. There were day-to-day differences in the Fast Food mass spectrum, with one day (Fast Food 1) being similar to other restaurants (R=0.7–0.8, ) and the other day (Fast Food 2) having lower R and higher θ.
There is also a high correlation of most restaurants with the COA PMF factor from Crippa et al. (2013a) (, ). This suggests that PMF analysis of ambient datasets yields a COA factor that is similar to fresh cooking emissions from many restaurants. There is a high R between our COA and the PMF HOA (hydrocarbon-like OA) factor, which is representative of primary combustion-related emissions. Even though 41, 43, and 55 are useful COA markers to resolve cooking-related factors, there are diverse sources of 41, 43, and 55. In general, there is a high correlation between HOA and COA because the major HOA peaks like 55 and 57 are prominent in both factors (Milic et al., 2016; Sun et al., 2013; Yao et al., 2021).
One key difference between HOA and COA is that the HOA mass spectrum is dominated by hydrocarbons (CxHy), whereas the cooking OA has a mixture of hydrocarbon and oxygenated ions, as shown in Fig. 4. For example, 43 in HOA is almost entirely due to (Ng et al., 2010), whereas cooking OA contains both and C2H3O+ (Fig. 4). Similarly, for 55, COA has contributions from both hydrocarbon () and oxidized (C3H3O+) fragments (Canonaco et al., 2013; Lalchandani et al., 2021), whereas the reduced ion dominates HOA. Lastly, while 55 and 57 are important signals for both COA and HOA, COA typically has f55>f57, whereas HOA has the reverse (Hu et al., 2016; Huang et al., 2021; Mohr et al., 2009; Shah et al., 2018; Zhang et al., 2015; Zhu et al., 2018).
Figure 5 also compares our cooking emissions measurements to PMF factors for biomass burning (BBOA) and secondary organic aerosol (LVOOA). The majority of restaurant sites exhibited weak correlations with BBOA and LVOOA. BBOA has prominent peaks at 60 and 73, and the largest peak in the LVOOA mass spectrum is 44; none of these peaks are particularly large in the cooking mass spectra from the restaurant sites sampled here.
3.4 Cooking as a source of urban reduced nitrogen
Cooking OA from all of the restaurant sites had a significant contribution from AMS ions containing reduced nitrogen. The mean contribution of nitrogen-containing fragments to the total cooking OA mass was 15.8 % (median = 10.7 %; Table S2 in the Supplement). The bulk of these N-containing ions (95 % by mass) did not contain oxygen (Fig. S6 in the Supplement), though oxygen could still be present on the parent molecule prior to fragmentation. These CxHyN+ fragments include C2H5N+ ( 43) and C3H5N+ ( 55), shown in Fig. 4. For example, in the mass spectrum presented for Bar/Restaurant 1 (Fig. 3), the collective contribution of the CHN family peaks is 9.2 % of the total signal mass. The nitrogen-containing fragment at 41, denoted as , has a 2.1 % contribution. Other significant peaks include 43 (C2H5N+) at 0.77 %, 79 (C5H5N+) at 0.68 %, and 68 (C4H6N+) at 0.49 %. For nearly all restaurants sampled here, the most abundant CHN group ion was C3H8N+, with typically >1 %.
We took several steps to verify the presence of these reduced nitrogen peaks in our mass spectra. These quality assurance checks, including examples of peak fitting, are shown in Sect. S3. For example, Fig. S8 in the Supplement shows the fitting of C3H8N+ for the Bakery samples. Figure S8 shows that the CHN family peaks are not present when the AMS chopper is closed. This indicates that these signals arise from particles and are not instrument artifacts. One potential source of reduced-N peaks is surface ionization, where atoms are ejected from a heated surface and subsequently ionized. Figure S9 in the Supplement shows that our peak shapes remain Gaussian and are therefore unlikely to be influenced by surface ionization.
Previous studies have reported the existence of nitrogen compounds or fragments from cooking experiments. These nitrogen-containing compounds can originate from the food itself or reactions with the types of gas used during cooking (Abdullahi et al., 2013). Reyes-Villegas et al. (2018) measured gas- and particle-phase emissions and found 14 different nitrogen-containing compounds using chemical ionization mass spectrometry. Rogge et al. (1991) measured amides in cooking emissions, including palmitamide and stearamide. Amides were also identified from both Chinese cooking (Zhao et al., 2007a) and Western-style cooking (Zhao et al., 2007b) using GC-MS. Ditto et al. (2022) recently demonstrated that amides can be formed from the reaction of ammonia formed by amino acid thermal degradation with triglyceride ester linkages. In contrast to the reduced nitrogen in our samples, these nitrogen-containing compounds, including amides, have at least one oxygen in their formula.
The Bakery 1 and Bakery 2 samples had the largest contributions from reduced N. Figure 6 shows the aerosol mass spectrum from Bakery 1. The two most abundant ions in the mass spectrum are C3H8N+ ( 58) and C5H12N+ ( 86); together these two ions make up ∼48 % of the AMS-measured OA mass spectra. There is also a large contribution from C6H14N+ at 100. The large abundance of these reduced-N-containing peaks contributes to the low correlation between the Bakery samples and other sites in Fig. 5.
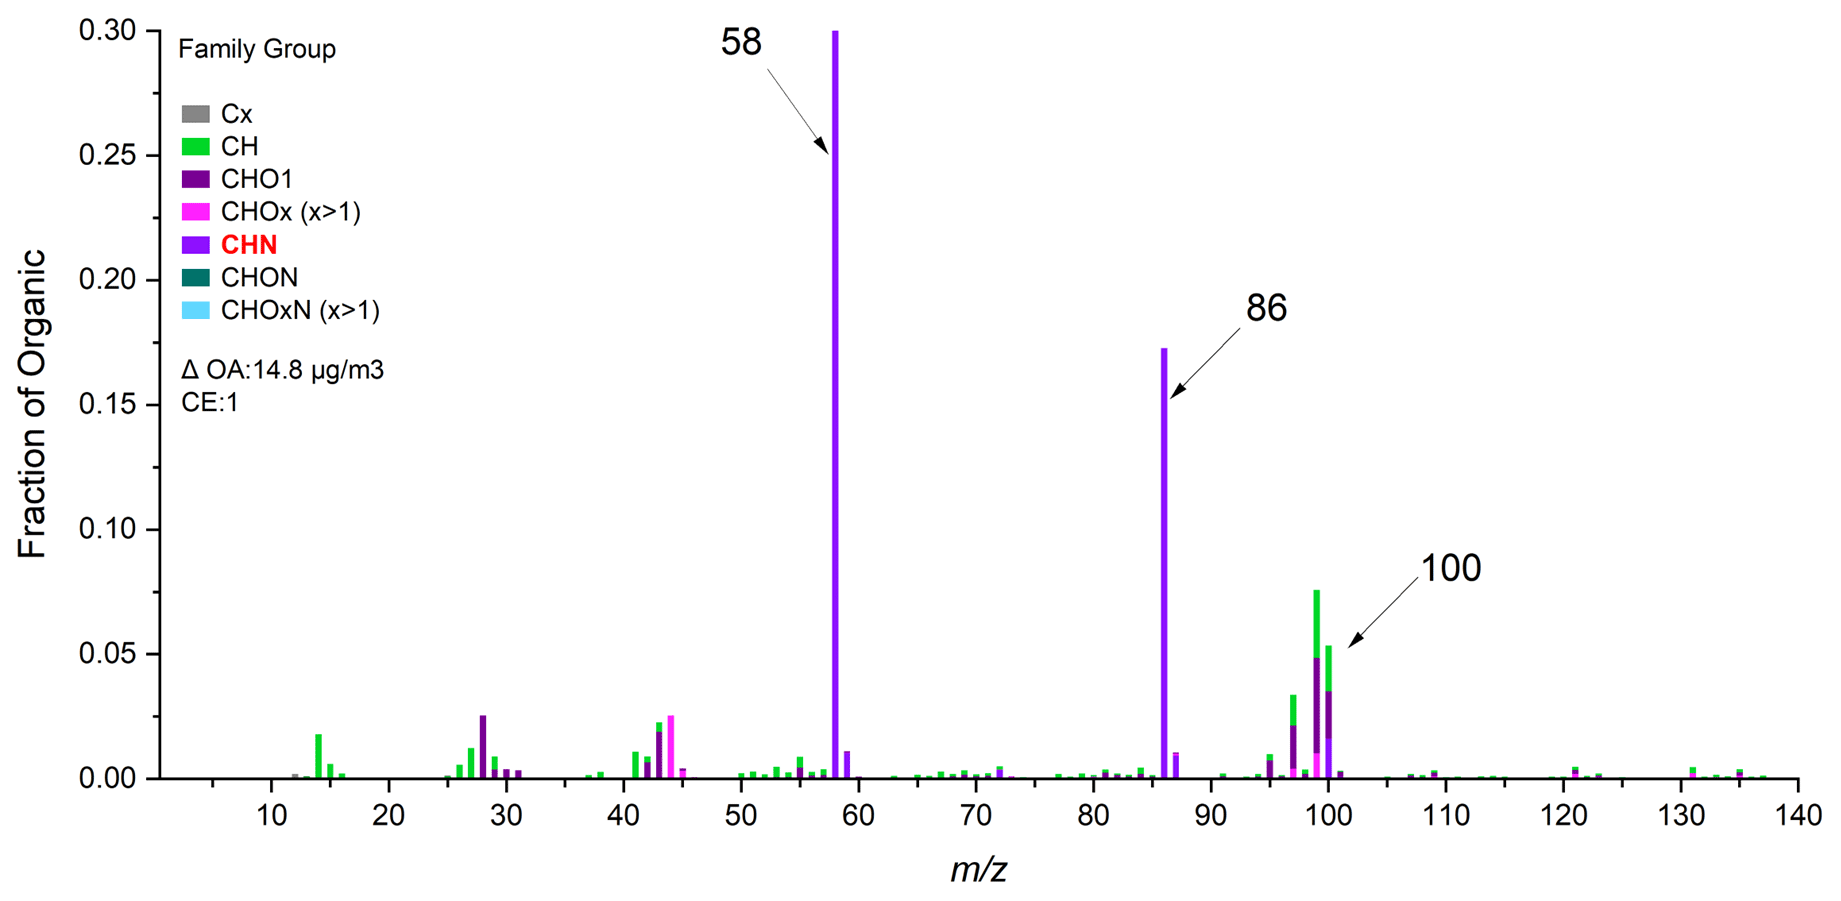
Figure 6The aerosol mass spectrum from Bakery 1 with prominent peaks at 58, 86, and 100 that are in the CHN family.
Though fast food sites have a lower correlation with other cooking sites in Fig. 5, it is not primarily due to higher CHN levels like the bakery samples. The most abundant signals of Fast Food 1 and Fast Food 2 were in the category of CHO and CH groups, where their sum accounts for 73.3 % and 82.0 % of the total mass, respectively. Two samples from Fast Food sites show moderate to slightly large proportions of CHN family peaks (14 % and 7 %) and (2.15 and 2.33).
While the C3H8N+ fragment has been observed in all of our cooking site data, there is almost no contribution of 86 (C5H12N+) and 100 (C6H14N+) in our samples except for the two bakery visits (Table S2), which were collected adjacent to a large commercial bread bakery. It is thus possible that 86 and 100 are more associated with commercial bakeries than restaurant cooking. The underlying source of the reduced nitrogen ions, especially 86 and 100 observed at the bakery, is unknown. One potential source could be the use of azodicarbonamide (C2H4N4O2, ADA), which is used as an aging and bleaching ingredient in bread baking. To test whether ADA contributed to nitrogen-containing emissions from bread baking, we baked bread with and without ADA addition. We used the AMS to measure the composition of PM emissions during fermentation (i.e., while the bread dough rose) and baking. While we observed OA emissions during baking, none of our experiments showed the CHN signals with C3H8N+, C5H12N+, and C6H14N+. As a result, we cannot conclude that the presence of ADA leads to high proportions of CHN ions (Fig. S7 in the Supplement).
Abundant reduced nitrogen was also observed in the particle phase via LC-TOF and LC-MS/MS measurements. To supplement the online measurements of functionalized aerosol-phase compounds, especially those containing nitrogen, offline analysis using LC-TOF was employed for organic compound speciation for each restaurant site with sufficient mass loading, with soft ionization allowing for the molecular formula-level speciation of observed organic species. Based on the online AMS data showing differences in OA enhancement (Fig. 2), the samples were split into three sample groups, the six high-emitting restaurants (Bar/Restaurant 1, Diner 2, Pizza, Bar/Restaurant 2, Diner 1, Island Cuisine), the lower enhancement near-source cooking samples (Bakery 1, Bakery 2, Fast Food 1, Fast Food 2, Cafe), and urban samples excluding near-source cooking samples (i.e., samples taken in different neighborhoods and parks), though this likely includes cooking-related contributions to the urban background.
Figure 7a shows the ion abundance volatility distribution of the different functionalized compound classes in the six samples with the highest PM concentrations (Fig. 2; see Fig. S10 in the Supplement for other samples). Compound volatilities were estimated from the generated formulas, assuming all species were at 300 K (Li et al., 2016) from each sample and all ion abundances were normalized by the sample volume for comparison across samples. Figure 7b shows the volatility distributions of ion abundances from the three sample groups, with the six more enhanced near-source cooking samples demonstrating high ion abundance consistent with the higher mass concentrations of PM2.5 sampled. The six enhanced cooking samples in Fig. 7a show a greater abundance of I/SVOCs compared to the other two sample groups, suggestive of fresh emissions. The observed mixtures are highly functionalized, with observed species containing nitrogen, oxygen, and sulfur, but we note that the LC-TOF employed here has poor ionization efficiencies for CH and CHS compounds, which are thus not considered for this analysis of functionalized compounds.
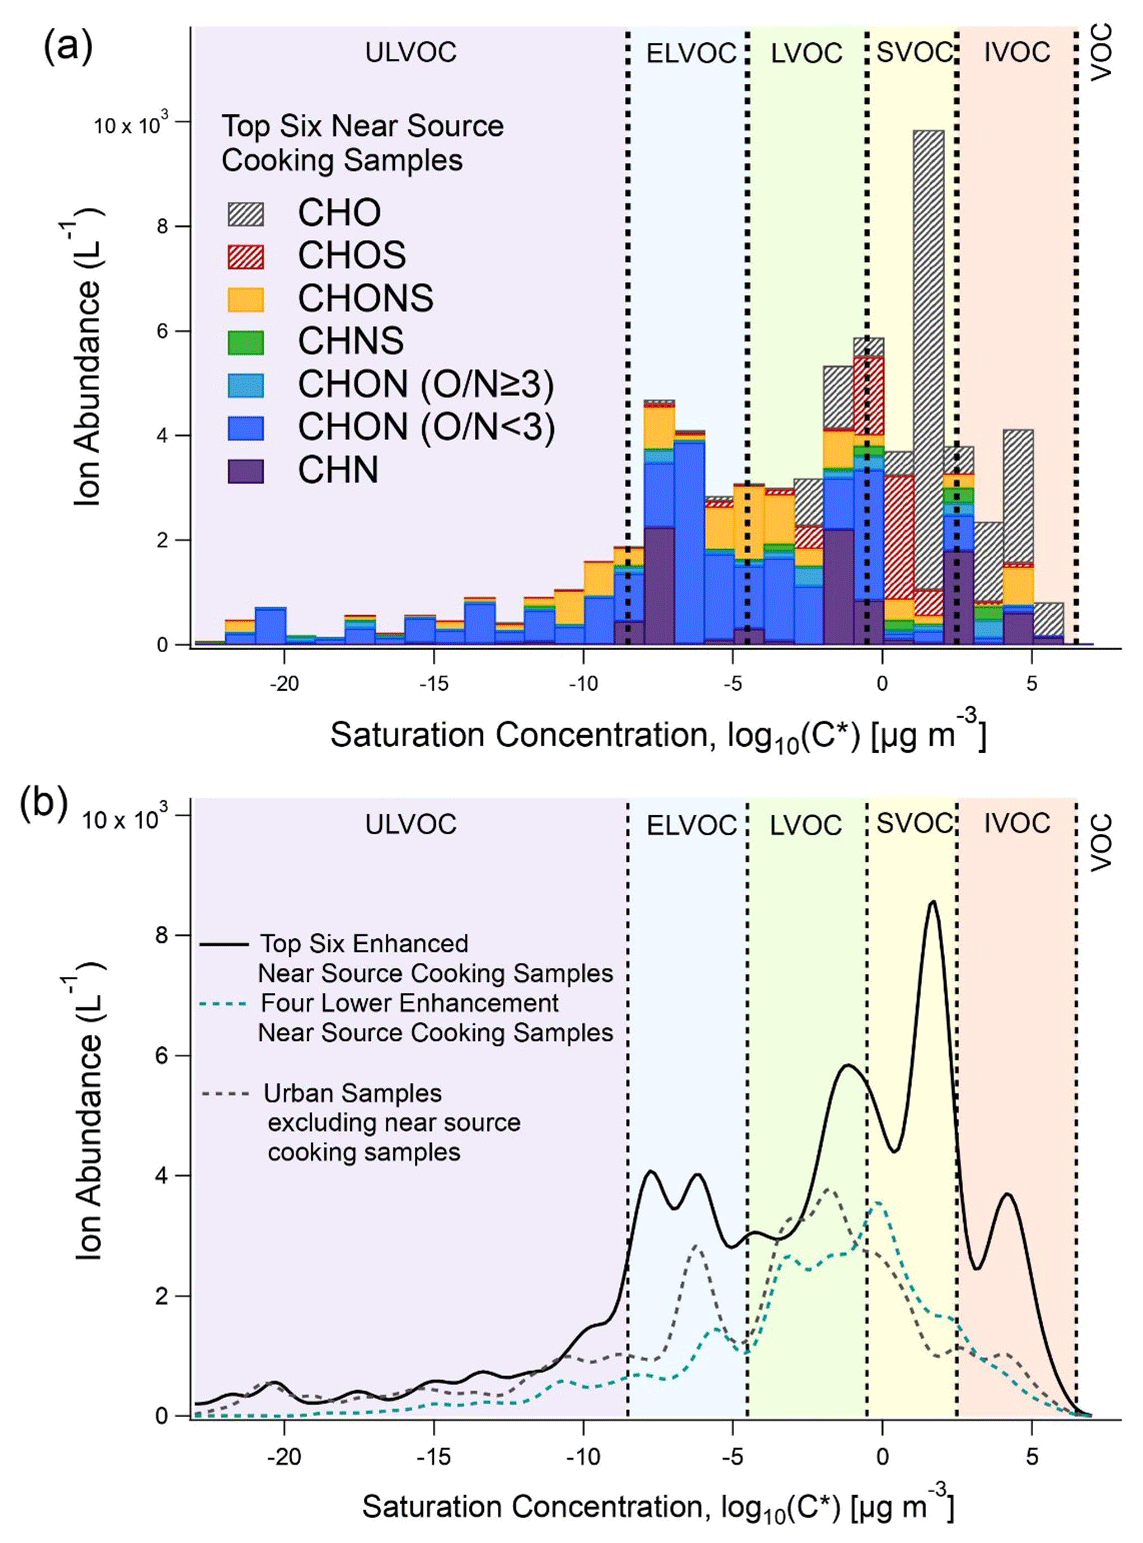
Figure 7Averaged chemical composition of functionalized particle-phase organic compounds from (a) filters collected from the top-six near-source cooking samples showing the highest enhancement in OA from the AMS measurements and (b) average ion abundance volatility distributions for the three sample groups, top-six enhanced cooking samples, lower-five near-source cooking samples, and the urban samples excluding near-source cooking samples. Volatility bins were defined for the same reference temperature in panels (a) and (b) (i.e., 300 K, as all samples were collected during summertime).
While urban particulate matter has been shown to contain many functionalized species (Ditto et al., 2018; Ye et al., 2021), recent work has also shown cooking to be a source of nitrogen and sulfur-containing species, which can be emitted in the gas phase from foods such as vegetables (Marcinkowska and Jeleń, 2022) or formed through cooking (Ditto et al., 2022; Takhar et al., 2019). The urban background samples excluding cooking samples and the five lower enhanced near-source cooking samples have similar volatility distributions with nitrogen-containing compounds (Figs. 7b and S11 in the Supplement), which suggests a role for cooking emissions in the background functionalized OA composition in urban areas.
While all samples contained nitrogen-containing compounds, LC-MS/MS was used on select samples (Bakery 1, Pizza, background sample 5) from each sample group to compare the functionalities of observed nitrogen. After compounds observed via LC-TOF (i.e., Fig. 7a) underwent QC/QA, those compounds were selected for MS/MS analysis in a targeted mode similar to prior work (Ditto et al., 2020).
Most nitrogen-containing compounds observed had an oxygen-to-nitrogen ratio (O N) of less than 3, but other nitrogen-containing compound classes were present (Figs. 7 and S11). Figure 8 shows the observed nitrogen-containing functional groups for the three samples run on MS/MS, split by O N ratio less than 3 or greater than or equal to 3. Here, the Bakery 1 compounds analyzed by MS/MS were dominated by reduced-nitrogen features, with prominent amine and amide functional groups, especially for compounds with O N ratios lower than 3, which in itself is indicative of the presence of reduced-nitrogen structural features.
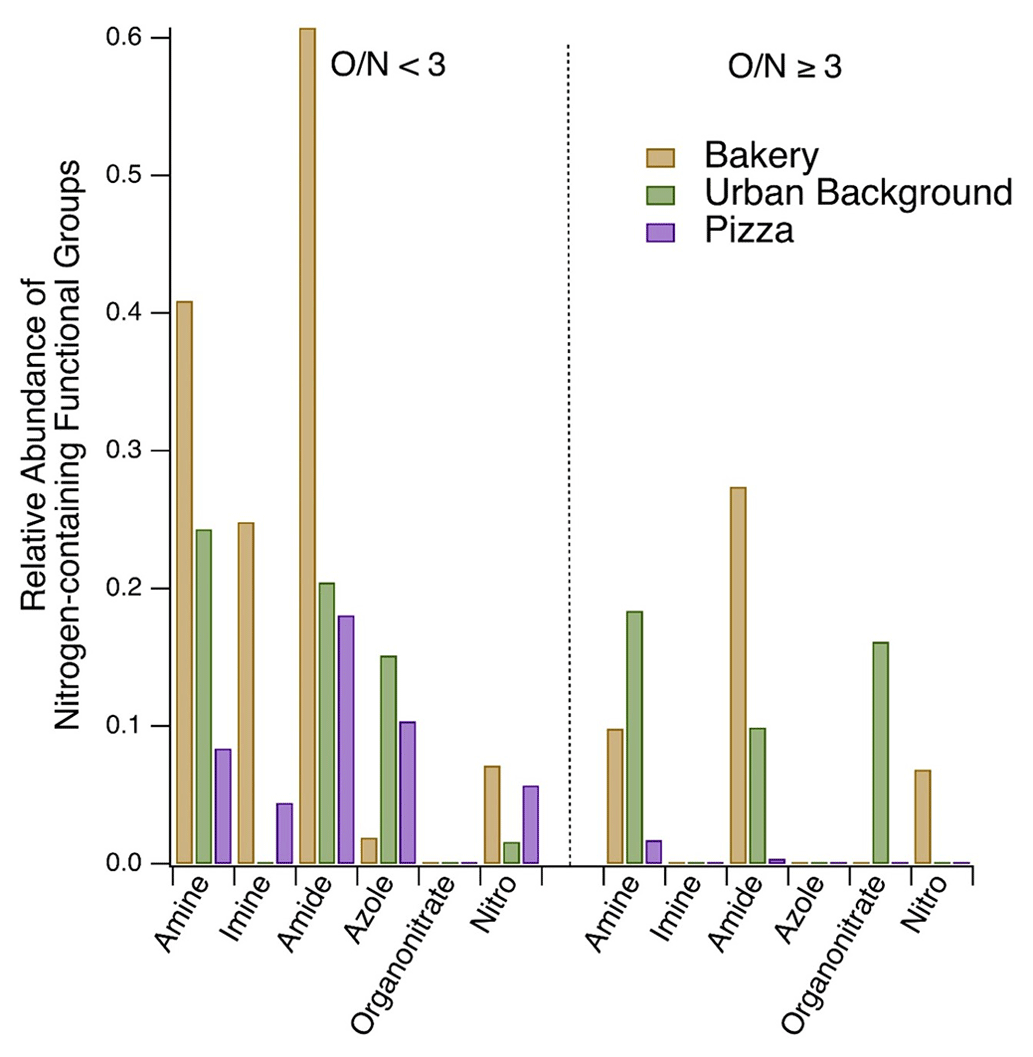
Figure 8The relative abundances of nitrogen-containing functionalities in the Bakery 1, background sample 5, and Pizza MS/MS compounds are shown, separated by O N ratio <3 on the left and ≧3 on the right, with prominently reduced-nitrogen functionalities in the bakery sample. See Fig. S13 in the Supplement for the complete range of functional groups and structural features observed in these samples. Enamine, nitrophenol, and nitrile functionalities were also searched for but were not detected in these three samples.
3.5 Particle size distributions and UFP enhancements in restaurant plumes
To expand upon Fig. 1's observations of UFPs in an example restaurant plume, we examined UFP enhancements across the sampled restaurants and the size distribution of those emissions.
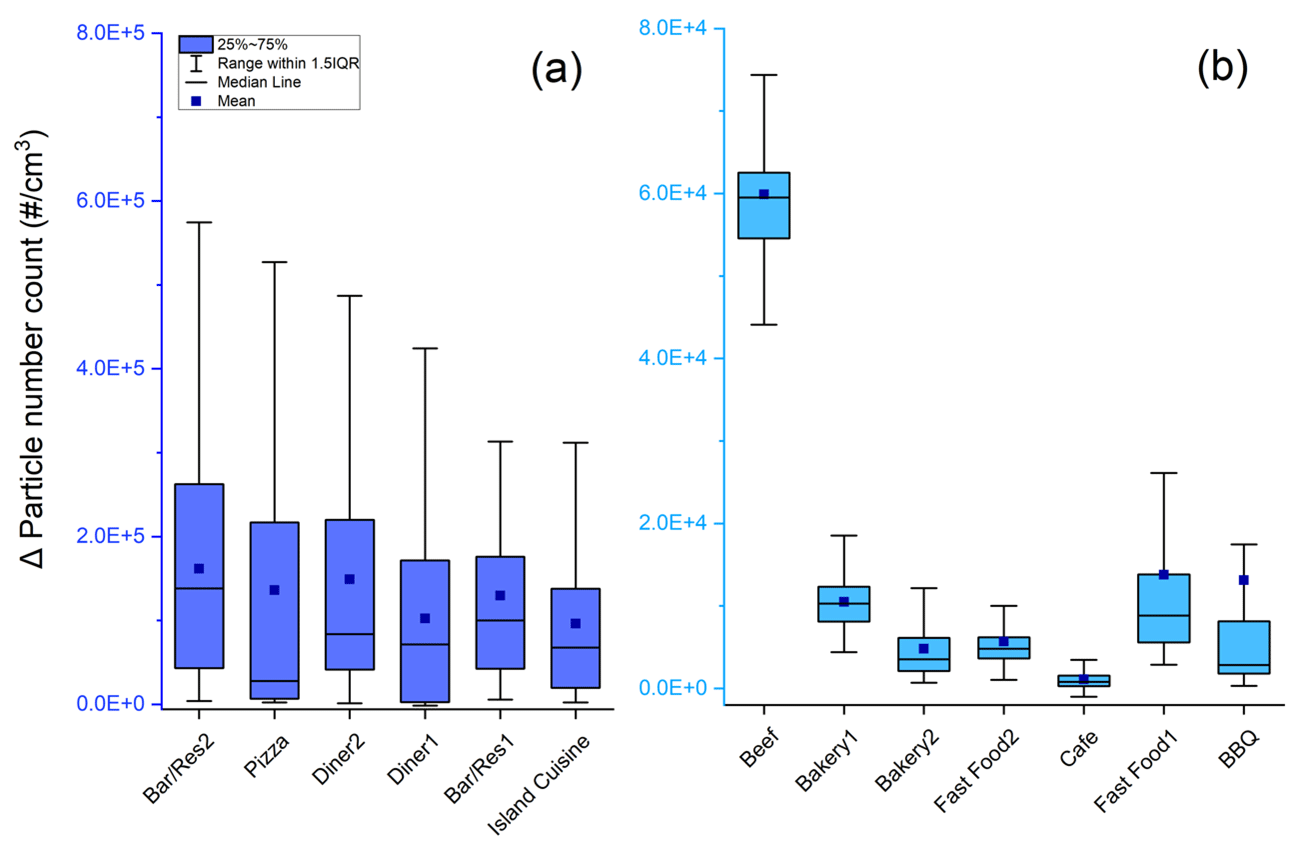
Figure 9Particle number enhancement (ΔPNC) at each restaurant site (with IQR). The sample names in panels (a) and (b) are placed in the same order as in Fig. 2.
Figure 9 summarizes the particle number concentrations above the background (ΔPNC) measured by the FMPS and scaled to the CPC. Similar to our ΔOA distribution in Fig. 2, there are notable site-to-site differences in particle number concentrations with the sites breaking down into the higher and lower-emitting groups (high-ΔPNC group mean ΔPNC>105 particles cm−3, low-ΔPNC group mean ΔPNC<105 particles cm−3).
All of the high-ΔPNC sites were also high-ΔOA sites, but most sites do not have a strong correlation between mean ΔOA and mean ΔPNC (Fig. S8). A moderate positive correlation was observed in the time series of PNC and OA at Diner 1 (R2=0.64), Beef (0.63), Bar/Restaurant 2 (0.60), and Bakery 1 (0.57); most other sites had poor correlations between ΔOA and ΔPNC (R2<0.4). This poor correlation may indicate that the emissions of OA and PNC are decoupled during cooking so that different activities boost emissions of OA mass versus particle number. For example, the PNC time series in Fig. 1 has several spikes that do not have associated spikes in OA.
The PNC enhancements are less skewed than the OA enhancements. For ΔPNC, the mean is always inside the IQR except for the BBQ sample, unlike several sites that had mean ΔOA>75th percentile. This implies that PNC emissions are less dominated by intense spikes than OA emissions. Figures 2 and S4 show that OA concentrations often fell close to the background between spikes. PNC, on the other hand, was consistently elevated during the restaurant sampling. One possible explanation is that OA spikes are associated with cooking, whereas the consistently high PNC is associated with the heating of the cooking surface by either a natural gas flame or electricity (Amouei Torkmahalleh et al., 2018; Dennekamp et al., 2001; Wu et al., 2012).
Figure 10 shows the mean particle size distributions for the high-ΔPNC restaurants from Fig. 7a and the mean on-road and background particle size distributions from the period shown in Fig. 1. All the restaurants emitted UFPs. The mode particle diameter from all sampled restaurants was less than 50 nm (Table 1), and the size distributions in Fig. 10 clearly peak in the ultrafine size range. However, there is variability across the restaurants as some sites had bimodal size distributions, while others are closer to unimodal. For example, Bar/Restaurant 1 has distinct modes at ∼10 and 40 nm, whereas Island Cuisine has a single broad mode centered around 20 nm. There is also variability within sites. For example, Bar/Restaurant 2 has a unimodal distribution with a mode around 40 nm, and the size distribution differs from the other sample at the same location, while the two samples at the Diner have nearly identical size distributions.
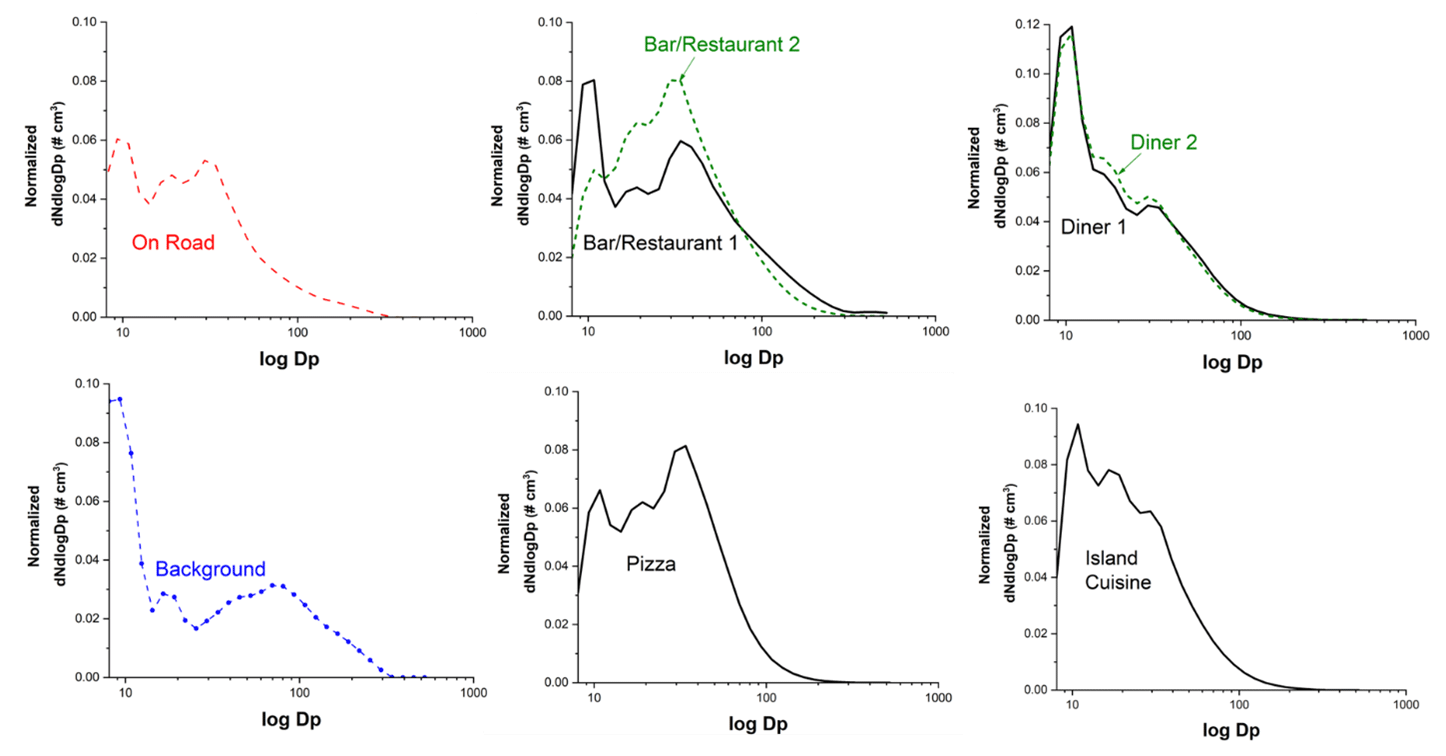
Figure 10Mean particle size distribution comparison of on-road, background, and high-ΔPNC restaurants observed at Bar/Restaurant, Diner, Pizza, and Island Cuisine measured from the FMPS (fast mobility particle sizer). To fit the size distributions onto the same scale, all are normalized to the total particle number of each sampling period. Thus the integral over each of the normalized size distributions is 1.
In addition to being enhanced in terms of concentrations, the size distributions in the restaurant plumes are distinct from the average background size distributions, which have a bimodal distribution with a nucleation mode peak around 10 nm and an accumulation mode peak around 100 nm. Emissions from nearby vehicles dominate the on-road periods, with a bimodal size distribution around 10 nm and 20–40 nm, which is similarly observed in previous studies (Sturm et al., 2003; Wang et al., 2008; Yao et al., 2005).
Using mobile measurements across a range of commercial cooking operations in two cities, our real-world sampling of cooking plumes from restaurants demonstrates substantial cooking-associated aerosol emissions with variability in the concentrations, chemical composition, and size distribution of PM and UFP emissions. Overall, emissions from most restaurants had similar mass spectra both to each other and to COA factors determined from factor analysis of ambient datasets. Aerosol mass spectra of cooking emissions were generally dominated by a mix of reduced () and oxygenated (CxHyO+) ions.
There were significant site-to-site differences in the OA enhancement attributable to restaurant emissions. This variability is due to a combination of differences in the emission rate from each restaurant and in dilution between the restaurant exhaust and our sampling inlet, though we cannot quantify the importance of each process. Since at all locations our inlet was only a few meters from the restaurant exhaust, it is likely that differences in the emission rate dominate site-to-site variability. Previous research by Louvaris et al. (2017) investigated meat charbroiling emissions diluted within a chamber and reported that approximately 80 % of the COA persisted following isothermal dilution at ambient temperature (25 ∘C) by a factor of 10. This is consistent with much of the cooking OA being in the LVOC or ELVOC volatility range.
Reduced nitrogen (N) was prevalent across all restaurant samples, contributing approximately 15 % of the cooking organic aerosol (OA) mass at the sampled sites, with a diversity of reduced-N functional groups observed. The presence of these reduced-nitrogen species is confirmed with offline analysis of filter samples, which identified multiple N-containing species with O N < 3, indicating that these nitrogen-containing species were unlikely to be organic nitrates. A notable finding of this study was the distinct composition of emissions collected from a commercial bakery, marked by the elevated presence of reduced nitrogen. Numerous studies have investigated cooking aerosol compositions, demonstrating that different cooking techniques and ingredients can elevate nitrogen content levels in cooking PM (Ditto et al., 2022; Masoud et al., 2022; Reyes-Villegas et al., 2018; Rogge et al., 1991). Nitrogen found in cooking emissions has diverse origins, including from the food itself with both natural (e.g., protein-rich and plant-based products) (Bak et al., 2019; Han et al., 2020) and anthropogenic sources (e.g., fertilizers and food additives like nitrates and nitrites) (Dimkpa et al., 2020; Karwowska and Kononiuk, 2020). Nitrogen in cooking PM can also be formed from heterogenous reactions with thermal degradation products formed during cooking (Ditto et al., 2022).
To further examine potential sources of the nitrogen features identified from the bakery emissions, we conducted an experiment with the AMS measuring bread baking emissions both with and without the dough stabilizer azodicarbonamide (C2H4N4O2) as a potential source of N-containing peaks. While the reduced-nitrogen peaks were not observed, this result implies the challenge in determining specific sources of nitrogen-containing species, particularly in real-world cooking environments, emphasizing the need for further investigation.
This study also highlights that cooking emissions are substantial contributors to urban UFPs. Variability between sites was observed, with some sites displaying unimodal and others displaying bimodal size distributions. There are uncertainties in identifying the characteristics of UFPs from cooking emissions, such as their origin from cooking processes or natural gas usage, and potential changes in particle size distributions during dilution due to the evaporation of semi-volatile components. Uncontrolled dilution in this study may have contributed to differences in UFP concentration and size distribution between sites (Lipsky and Robinson, 2006).
In order to gain a deeper understanding of the factors influencing UFP size distribution from real-world cooking sources, further investigation is warranted, taking into account aspects such as restaurant proximity, food type, and order frequency. Consequently, subsequent research can identify the prevalent molecular features of reduced nitrogen in cooking emissions by setting constraints on specific parameters, providing a more comprehensive analysis.
Overall, this study underscores the importance of comprehensively understanding cooking emissions, including their contribution to the PM2.5 mass, composition, and exposure variability across urban areas, in order to develop effective strategies for mitigating their impact on air quality and human health. Specifically, further research is needed to better understand the role of reduced nitrogen in atmospheric emissions from cooking activities.
All data presented in this work can be obtained by directly contacting the corresponding author at apresto@andrew.cmu.edu upon request.
The supplement related to this article is available online at: https://doi.org/10.5194/acp-24-1281-2024-supplement.
The experimental design was done by AAP and DRG. Data collection was carried out by AAP and JM. SK performed the data analysis and compiled the instrumental data. SK and AAP wrote the paper, with all authors contributing significantly to the interpretation of the results, discussions, and finalization of the paper.
At least one of the (co-)authors is a member of the editorial board of Atmospheric Chemistry and Physics. The peer-review process was guided by an independent editor, and the authors also have no other competing interests to declare.
This study has not been formally reviewed by the EPA. The views expressed in this document are solely those of the authors and do not necessarily reflect those of the agency. The EPA does not endorse any products or commercial services mentioned in this publication.
Publisher's note: Copernicus Publications remains neutral with regard to jurisdictional claims made in the text, published maps, institutional affiliations, or any other geographical representation in this paper. While Copernicus Publications makes every effort to include appropriate place names, the final responsibility lies with the authors.
This research was conducted as part of the Center for Air, Climate, and Energy Solutions (CACES), which was supported by the Environmental Protection Agency (assistance agreement no. RD83587301) to Carnegie Mellon University. We acknowledge support from assistance agreement no. RD835871 awarded by the US Environmental Protection Agency to Yale University. Drew R. Gentner and Jo Machesky acknowledge financial support from the US NSF (CBET-2011362). Sunhye Kim and Albert A. Presto acknowledge funding support from the US NSF (CBET 1907446).
This research has been supported by the Environmental Protection Agency (assistance agreement nos. RD83587301 and RD835871) and the US NSF (grant nos. CBET-2011362 and CBET 1907446).
This paper was edited by Anne Perring and reviewed by two anonymous referees.
Abdullahi, K. L., Delgado-Saborit, J. M., and Harrison, R. M.: Emissions and indoor concentrations of particulate matter and its specific chemical components from cooking: A review, Atmos. Environ., 71, 260–294, https://doi.org/10.1016/j.atmosenv.2013.01.061, 2013.
Actkinson, B., Ensor, K., and Griffin, R. J.: SIBaR: a new method for background quantification and removal from mobile air pollution measurements, Atmos. Meas. Tech., 14, 5809–5821, https://doi.org/10.5194/amt-14-5809-2021, 2021.
Äijälä, M., Heikkinen, L., Fröhlich, R., Canonaco, F., Prévôt, A. S. H., Junninen, H., Petäjä, T., Kulmala, M., Worsnop, D., and Ehn, M.: Resolving anthropogenic aerosol pollution types – deconvolution and exploratory classification of pollution events, Atmos. Chem. Phys., 17, 3165–3197, https://doi.org/10.5194/acp-17-3165-2017, 2017.
Ali, M. U., Lin, S., Yousaf, B., Abbas, Q., Munir, M. A. M., Rashid, A., Zheng, C., Kuang, X., and Wong, M. H.: Pollution characteristics, mechanism of toxicity and health effects of the ultrafine particles in the indoor environment: Current status and future perspectives, Crit. Rev. Env. Sci. Tec., 52, 436–473, https://doi.org/10.1080/10643389.2020.1831359, 2022.
Allan, J. D., Williams, P. I., Morgan, W. T., Martin, C. L., Flynn, M. J., Lee, J., Nemitz, E., Phillips, G. J., Gallagher, M. W., and Coe, H.: Contributions from transport, solid fuel burning and cooking to primary organic aerosols in two UK cities, Atmos. Chem. Phys., 10, 647–668, https://doi.org/10.5194/acp-10-647-2010, 2010.
Amouei Torkmahalleh, M., Ospanova, S., Baibatyrova, A., Nurbay, S., Zhanakhmet, G., and Shah, D.: Contributions of burner, pan, meat and salt to PM emission during grilling, Environ. Res., 164, 11–17, https://doi.org/10.1016/j.envres.2018.01.044, 2018.
Apte, J. S., Messier, K. P., Gani, S., Brauer, M., Kirchstetter, T. W., Lunden, M. M., Marshall, J. D., Portier, C. J., Vermeulen, R. C. H., and Hamburg, S. P.: High-Resolution Air Pollution Mapping with Google Street View Cars: Exploiting Big Data, Environ. Sci. Technol., 51, 6999–7008, https://doi.org/10.1021/acs.est.7b00891, 2017.
Bak, U. G., Nielsen, C. W., Marinho, G. S., Gregersen, Ó., Jónsdóttir, R., and Holdt, S. L.: The seasonal variation in nitrogen, amino acid, protein and nitrogen-to-protein conversion factors of commercially cultivated Faroese Saccharina latissima, Algal Res., 42, 101576, https://doi.org/10.1016/j.algal.2019.101576, 2019.
Bozzetti, C., El Haddad, I., Salameh, D., Daellenbach, K. R., Fermo, P., Gonzalez, R., Minguillón, M. C., Iinuma, Y., Poulain, L., Elser, M., Müller, E., Slowik, J. G., Jaffrezo, J.-L., Baltensperger, U., Marchand, N., and Prévôt, A. S. H.: Organic aerosol source apportionment by offline-AMS over a full year in Marseille, Atmos. Chem. Phys., 17, 8247–8268, https://doi.org/10.5194/acp-17-8247-2017, 2017.
Canonaco, F., Crippa, M., Slowik, J. G., Baltensperger, U., and Prévôt, A. S. H.: SoFi, an IGOR-based interface for the efficient use of the generalized multilinear engine (ME-2) for the source apportionment: ME-2 application to aerosol mass spectrometer data, Atmos. Meas. Tech., 6, 3649–3661, https://doi.org/10.5194/amt-6-3649-2013, 2013.
Castillo, M. D., Kinney, P. L., Southerland, V., Arno, C. A., Crawford, K., van Donkelaar, A., Hammer, M., Martin, R. V., and Anenberg, S. C.: Estimating Intra-Urban Inequities in PM2.5-Attributable Health Impacts: A Case Study for Washington, DC, GeoHealth, 5, e2021GH000431, https://doi.org/10.1029/2021GH000431, 2021.
Cheng, B., Wang-Li, L., Meskhidze, N., Classen, J., and Bloomfield, P.: Spatial and temporal variations of PM2.5 mass closure and inorganic PM2.5 in the Southeastern U. S., Environ. Pollut., 26, 33181–33191, https://doi.org/10.1007/s11356-019-06437-8, 2019.
Chow, J. C., Chen, L.-W. A., Watson, J. G., Lowenthal, D. H., Magliano, K. A., Turkiewicz, K., and Lehrman, D. E.: PM2.5 chemical composition and spatiotemporal variability during the California Regional PM10/PM2.5 Air Quality Study (CRPAQS), J. Geophys. Res.-Atmos., 111, D10S04, https://doi.org/10.1029/2005JD006457, 2006.
Crippa, M., DeCarlo, P. F., Slowik, J. G., Mohr, C., Heringa, M. F., Chirico, R., Poulain, L., Freutel, F., Sciare, J., Cozic, J., Di Marco, C. F., Elsasser, M., Nicolas, J. B., Marchand, N., Abidi, E., Wiedensohler, A., Drewnick, F., Schneider, J., Borrmann, S., Nemitz, E., Zimmermann, R., Jaffrezo, J.-L., Prévôt, A. S. H., and Baltensperger, U.: Wintertime aerosol chemical composition and source apportionment of the organic fraction in the metropolitan area of Paris, Atmos. Chem. Phys., 13, 961–981, https://doi.org/10.5194/acp-13-961-2013, 2013a.
Crippa, M., El Haddad, I., Slowik, J. G., DeCarlo, P. F., Mohr, C., Heringa, M. F., Chirico, R., Marchand, N., Sciare, J., Baltensperger, U., and Prévôt, A. S. H.: Identification of marine and continental aerosol sources in Paris using high resolution aerosol mass spectrometry, J. Geophys. Res.-Atmos., 118, 1950–1963, https://doi.org/10.1002/jgrd.50151, 2013b.
Dallmann, T. R., Kirchstetter, T. W., DeMartini, S. J., and Harley, R. A.: Quantifying On-Road Emissions from Gasoline-Powered Motor Vehicles: Accounting for the Presence of Medium- and Heavy-Duty Diesel Trucks, Environ. Sci. Technol., 47, 13873–13881, https://doi.org/10.1021/es402875u, 2013.
Dall'Osto, M., Paglione, M., Decesari, S., Facchini, M. C., O'Dowd, C., Plass-Duellmer, C., and Harrison, R. M.: On the Origin of AMS “Cooking Organic Aerosol” at a Rural Site, Environ. Sci. Technol., 49, 13964–13972, https://doi.org/10.1021/acs.est.5b02922, 2015.
Dennekamp, M., Howarth, S., Dick, C. A. J., Cherrie, J. W., Donaldson, K., and Seaton, A.: Ultrafine particles and nitrogen oxides generated by gas and electric cooking, OEM, 58, 511–516, https://doi.org/10.1136/oem.58.8.511, 2001.
Devarakonda, S., Sevusu, P., Liu, H., Liu, R., Iftode, L., and Nath, B.: Real-time air quality monitoring through mobile sensing in metropolitan areas, Proceedings of the 2nd ACM SIGKDD International Workshop on UrbComp, ACM 2013, 11 August 2013, Chicago, USA, 1–8, https://doi.org/10.1145/2505821.2505834, 2013.
Dimkpa, C. O., Fugice, J., Singh, U., and Lewis, T. D.: Development of fertilizers for enhanced nitrogen use efficiency – Trends and perspectives, Sci. Total Environ., 731, 139113, https://doi.org/10.1016/j.scitotenv.2020.139113, 2020.
Ditto, J. C., Barnes, E. B., Khare, P., Takeuchi, M., Joo, T., Bui, A. A. T., Lee-Taylor, J., Eris, G., Chen, Y., Aumont, B., Jimenez, J. L., Ng, N. L., Griffin, R. J., and Gentner, D. R.: An omnipresent diversity and variability in the chemical composition of atmospheric functionalized organic aerosol, Commun. Chem., 1, 75, https://doi.org/10.1038/s42004-018-0074-3, 2018.
Ditto, J. C., Joo, T., Slade, J. H., Shepson, P. B., Ng, N. L., and Gentner, D. R.: Nontargeted Tandem Mass Spectrometry Analysis Reveals Diversity and Variability in Aerosol Functional Groups across Multiple Sites, Seasons, and Times of Day, Environ. Sci. Tech. Let., 7, 60–69, https://doi.org/10.1021/acs.estlett.9b00702, 2020.
Ditto, J. C., Abbatt, J. P. D., and Chan, A. W. H.: Gas- and Particle-Phase Amide Emissions from Cooking: Mechanisms and Air Quality Impacts, Environ. Sci. Technol., 56, 7741–7750, https://doi.org/10.1021/acs.est.2c01409, 2022.
Dührkop, K., Shen, H., Meusel, M., Rousu, J., and Böcker, S.: Searching molecular structure databases with tandem mass spectra using CSI:FingerID, P. Natl. Acad. Sci. USA, 112, 12580–12585, https://doi.org/10.1073/pnas.1509788112, 2015.
Dührkop, K., Fleischauer, M., Ludwig, M., Aksenov, A. A., Melnik, A. V., Meusel, M., Dorrestein, P. C., Rousu, J., and Böcker, S.: SIRIUS 4: A rapid tool for turning tandem mass spectra into metabolite structure information, Nat. Methods, 16, 299–302, https://doi.org/10.1038/s41592-019-0344-8, 2019.
Eilenberg, S. R., Subramanian, R., Malings, C., Hauryliuk, A., Presto, A. A., and Robinson, A. L.: Using a network of lower-cost monitors to identify the influence of modifiable factors driving spatial patterns in fine particulate matter concentrations in an urban environment, J. Expo. Sci. Env. Epid., 30, 949–961, https://doi.org/10.1038/s41370-020-0255-x, 2020.
Florou, K., Papanastasiou, D. K., Pikridas, M., Kaltsonoudis, C., Louvaris, E., Gkatzelis, G. I., Patoulias, D., Mihalopoulos, N., and Pandis, S. N.: The contribution of wood burning and other pollution sources to wintertime organic aerosol levels in two Greek cities, Atmos. Chem. Phys., 17, 3145–3163, https://doi.org/10.5194/acp-17-3145-2017, 2017.
Font, A., Guiseppin, L., Blangiardo, M., Ghersi, V., and Fuller, G. W.: A tale of two cities: Is air pollution improving in Paris and London?, Environ. Pollut., 249, 1–12, https://doi.org/10.1016/j.envpol.2019.01.040, 2019.
Giorio, C., Tapparo, A., Dall'Osto, M., Harrison, R. M., Beddows, D. C. S., Di Marco, C., and Nemitz, E.: Comparison of three techniques for analysis of data from an Aerosol Time-of-Flight Mass Spectrometer, Atmos. Environ., 61, 316–326, https://doi.org/10.1016/j.atmosenv.2012.07.054, 2012.
Han, Y., Feng, G., Swaney, D. P., Dentener, F., Koeble, R., Ouyang, Y., and Gao, W.: Global and regional estimation of net anthropogenic nitrogen inputs (NANI), Geoderma, 361, 114066, https://doi.org/10.1016/j.geoderma.2019.114066, 2020.
Hayes, P. L., Ortega, A. M., Cubison, M. J., Froyd, K. D., Zhao, Y., Cliff, S. S., Hu, W. W., Toohey, D. W., Flynn, J. H., Lefer, B. L., Grossberg, N., Alvarez, S., Rappenglück, B., Taylor, J. W., Allan, J. D., Holloway, J. S., Gilman, J. B., Kuster, W. C., de Gouw, J. A., Massoli, P., Zhang, X., Liu, J., Weber, R. J., Corrigan, A. L., Russell, L. M., Isaacman, G., Worton, D. R., Kreisberg, N. M., Goldstein, A. H., Thalman, R., Waxman, E. M., Volkamer, R., Lin, Y. H., Surratt, J. D., Kleindienst, T. E., Offenberg, J. H., Dusanter, S., Griffith, S., Stevens, P. S., Brioude, J., Angevine, W. M., and Jimenez., J. L.: Organic aerosol composition and sources in Pasadena, California, during the 2010 CalNex campaign, J. Geophys. Res.-Atmos., 118, 9233–9257, https://doi.org/10.1002/jgrd.50530, 2013.
Hering, S. V., Lewis, G. S., Spielman, S. R., and Eiguren-Fernandez, A.: A MAGIC concept for self-sustained, water-based, ultrafine particle counting, Aerosol Sci. Tech., 53, 63–72, https://doi.org/10.1080/02786826.2018.1538549, 2019.
Hu, R., Wang, S., Zheng, H., Zhao, B., Liang, C., Chang, X., Jiang, Y., Yin, R., Jiang, J., and Hao, J.: Variations and Sources of Organic Aerosol in Winter Beijing under Markedly Reduced Anthropogenic Activities During COVID-2019, Environ. Sci. Technol., 56, 6956–6967, https://doi.org/10.1021/acs.est.1c05125, 2021.
Hu, W., Hu, M., Hu, W., Jimenez, J. L., Yuan, B., Chen, W., Wang, M., Wu, Y., Chen, C., Wang, Z., Peng, J., Zeng, L., and Shao, M.: Chemical composition, sources, and aging process of submicron aerosols in Beijing: Contrast between summer and winter, J. Geophys. Res.-Atmos., 121, 1955–1977, https://doi.org/10.1002/2015JD024020, 2016.
Huang, D. D., Zhu, S., An, J., Wang, Q., Qiao, L., Zhou, M., He, X., Ma, Y., Sun, Y., Huang, C., Yu, J. Z., and Zhang, Q.: Comparative Assessment of Cooking Emission Contributions to Urban Organic Aerosol Using Online Molecular Tracers and Aerosol Mass Spectrometry Measurements, Environ. Sci. Technol., 55, 14526–14535, https://doi.org/10.1021/acs.est.1c03280, 2021.
Huang, X.-F., He, L.-Y., Hu, M., Canagaratna, M. R., Sun, Y., Zhang, Q., Zhu, T., Xue, L., Zeng, L.-W., Liu, X.-G., Zhang, Y.-H., Jayne, J. T., Ng, N. L., and Worsnop, D. R.: Highly time-resolved chemical characterization of atmospheric submicron particles during 2008 Beijing Olympic Games using an Aerodyne High-Resolution Aerosol Mass Spectrometer, Atmos. Chem. Phys., 10, 8933–8945, https://doi.org/10.5194/acp-10-8933-2010, 2010.
Ibald-Mulli, A., Wichmann, H.-E., Kreyling, W., and Peters, A.: Epidemiological Evidence on Health Effects of Ultrafine Particles, J. Aerosol Med., 15, 189–201, https://doi.org/10.1089/089426802320282310, 2002.
Jeong, C.-H., Wang, J. M., and Evans, G. J.: Source Apportionment of Urban Particulate Matter using Hourly Resolved Trace Metals, Organics, and Inorganic Aerosol Components, Atmos. Chem. Phys. Discuss. [preprint], https://doi.org/10.5194/acp-2016-189, 2016.
Jung, C.-C. and Su, H.-J.: Chemical and stable isotopic characteristics of PM2.5 emitted from Chinese cooking, Environ. Pollut., 267, 115577, https://doi.org/10.1016/j.envpol.2020.115577, 2020.
Kaltsonoudis, C., Kostenidou, E., Louvaris, E., Psichoudaki, M., Tsiligiannis, E., Florou, K., Liangou, A., and Pandis, S. N.: Characterization of fresh and aged organic aerosol emissions from meat charbroiling, Atmos. Chem. Phys., 17, 7143–7155, https://doi.org/10.5194/acp-17-7143-2017, 2017.
Karwowska, M. and Kononiuk, A.: Nitrates/Nitrites in Food – Risk for Nitrosative Stress and Benefits, Antioxidants, 9, 241, https://doi.org/10.3390/antiox9030241, 2020.
Keuken, M. P., Roemer, M. G. M., Zandveld, P., Verbeek, R. P., and Velders, G. J. M.: Trends in primary NO2 and exhaust PM emissions from road traffic for the period 2000–2020 and implications for air quality and health in the Netherlands, Atmos. Environ., 54, 313–319, https://doi.org/10.1016/j.atmosenv.2012.02.009, 2012.
Kiendler-Scharr, A., Zhang, Q., Hohaus, T., Kleist, E., Mensah, A., Mentel, T. F., Spindler, C., Uerlings, R., Tillmann, R., and Wildt, J.: Aerosol Mass Spectrometric Features of Biogenic SOA: Observations from a Plant Chamber and in Rural Atmospheric Environments, Environ. Sci. Technol., 43, 8166–8172, https://doi.org/10.1021/es901420b, 2009.
Klompmaker, J. O., Montagne, D. R., Meliefste, K., Hoek, G., and Brunekreef, B.: Spatial variation of ultrafine particles and black carbon in two cities: Results from a short-term measurement campaign, Sci. Total Environ., 508, 266–275, https://doi.org/10.1016/j.scitotenv.2014.11.088, 2015.
Kostenidou, E., Lee, B.-H., Engelhart, G. J., Pierce, J. R., and Pandis, S. N.: Mass Spectra Deconvolution of Low, Medium, and High Volatility Biogenic Secondary Organic Aerosol, Environ. Sci. Technol., 43, 4884–4889, https://doi.org/10.1021/es803676g, 2009.
Kwon, H.-S., Ryu, M. H., and Carlsten, C.: Ultrafine particles: Unique physicochemical properties relevant to health and disease, Exp. Mol. Med., 52, 318–328, https://doi.org/10.1038/s12276-020-0405-1, 2020.
Lalchandani, V., Kumar, V., Tobler, A., M. Thamban, N., Mishra, S., Slowik, J. G., Bhattu, D., Rai, P., Satish, R., Ganguly, D., Tiwari, S., Rastogi, N., Tiwari, S., Močnik, G., Prévôt, A. S. H., and Tripathi, S. N.: Real-time characterization and source apportionment of fine particulate matter in the Delhi megacity area during late winter, Sci. Total Environ., 770, 145324, https://doi.org/10.1016/j.scitotenv.2021.145324, 2021.
Lanz, V. A., Alfarra, M. R., Baltensperger, U., Buchmann, B., Hueglin, C., and Prévôt, A. S. H.: Source apportionment of submicron organic aerosols at an urban site by factor analytical modelling of aerosol mass spectra, Atmos. Chem. Phys., 7, 1503–1522, https://doi.org/10.5194/acp-7-1503-2007, 2007.
Lee, B. P., Li, Y. J., Yu, J. Z., Louie, P. K. K., and Chan, C. K.: Characteristics of submicron particulate matter at the urban roadside in downtown Hong Kong – Overview of 4 months of continuous high-resolution aerosol mass spectrometer measurements, J. Geophys. Res.-Atmos., 120, 7040–7058, https://doi.org/10.1002/2015JD023311, 2015.
Lenschow, P., Abraham, H.-J., Kutzner, K., Lutz, M., Preuß, J.-D., and Reichenbächer, W.: Some ideas about the sources of PM10, Atmos. Environ., 35, S23–S33, https://doi.org/10.1016/S1352-2310(01)00122-4, 2001.
Li, Y., Pöschl, U., and Shiraiwa, M.: Molecular corridors and parameterizations of volatility in the chemical evolution of organic aerosols, Atmos. Chem. Phys., 16, 3327–3344, https://doi.org/10.5194/acp-16-3327-2016, 2016.
Li, Z., Fung, J. C. H., and Lau, A. K. H.: High spatiotemporal characterization of on-road PM2.5 concentrations in high-density urban areas using mobile monitoring, Build. Environ., 143, 196–205, https://doi.org/10.1016/j.buildenv.2018.07.014, 2018.
Lipsky, E. M. and Robinson, A. L.: Effects of Dilution on Fine Particle Mass and Partitioning of Semivolatile Organics in Diesel Exhaust and Wood Smoke, Environ. Sci. Technol., 40, 155–162, https://doi.org/10.1021/es050319p, 2006.
Liu, T., Li, Z., Chan, M., and Chan, C. K.: Formation of secondary organic aerosols from gas-phase emissions of heated cooking oils, Atmos. Chem. Phys., 17, 7333–7344, https://doi.org/10.5194/acp-17-7333-2017, 2017.
Liu, T., Wang, Z., Wang, X., and Chan, C. K.: Primary and secondary organic aerosol from heated cooking oil emissions, Atmos. Chem. Phys., 18, 11363–11374, https://doi.org/10.5194/acp-18-11363-2018, 2018.
Louie, P. K. K., Chow, J. C., Chen, L.-W. A., Watson, J. G., Leung, G., and Sin, D. W. M.: PM2.5 chemical composition in Hong Kong: Urban and regional variations, Sci. Total Environ., 338, 267–281, https://doi.org/10.1016/j.scitotenv.2004.07.021, 2005.
Louvaris, E. E., Karnezi, E., Kostenidou, E., Kaltsonoudis, C., and Pandis, S. N.: Estimation of the volatility distribution of organic aerosol combining thermodenuder and isothermal dilution measurements, Atmos. Meas. Tech., 10, 3909–3918, https://doi.org/10.5194/amt-10-3909-2017, 2017.
Marcinkowska, M. A. and Jeleń, H. H.: Role of Sulfur Compounds in Vegetable and Mushroom Aroma, Molecules, 27, 6116, https://doi.org/10.3390/molecules27186116, 2022.
Masoud, C. G., Li, Y., Wang, D. S., Katz, E. F., DeCarlo, P. F., Farmer, D. K., Vance, M. E., Shiraiwa, M., and Hildebrandt Ruiz, L.: Molecular composition and gas-particle partitioning of indoor cooking aerosol: Insights from a FIGAERO-CIMS and kinetic aerosol modeling, Aerosol Sci. Tech., 56, 1156–1173, https://doi.org/10.1080/02786826.2022.2133593, 2022.
Milic, A., Miljevic, B., Alroe, J., Mallet, M., Canonaco, F., Prevot, A. S. H., and Ristovski, Z. D.: The ambient aerosol characterization during the prescribed bushfire season in Brisbane 2013, Sci. Total Environ., 560–561, 225–232, https://doi.org/10.1016/j.scitotenv.2016.04.036, 2016.
Mohr, C., Huffman, J. A., Cubison, M. J., Aiken, A. C., Docherty, K. S., Kimmel, J. R., Ulbrich, I. M., Hannigan, M., and Jimenez, J. L.: Characterization of Primary Organic Aerosol Emissions from Meat Cooking, Trash Burning, and Motor Vehicles with High-Resolution Aerosol Mass Spectrometry and Comparison with Ambient and Chamber Observations, Environ. Sci. Technol., 43, 2443–2449, https://doi.org/10.1021/es8011518, 2009.
Mohr, C., Richter, R., DeCarlo, P. F., Prévôt, A. S. H., and Baltensperger, U.: Spatial variation of chemical composition and sources of submicron aerosol in Zurich during wintertime using mobile aerosol mass spectrometer data, Atmos. Chem. Phys., 11, 7465–7482, https://doi.org/10.5194/acp-11-7465-2011, 2011.
Ng, N. L., Canagaratna, M. R., Zhang, Q., Jimenez, J. L., Tian, J., Ulbrich, I. M., Kroll, J. H., Docherty, K. S., Chhabra, P. S., Bahreini, R., Murphy, S. M., Seinfeld, J. H., Hildebrandt, L., Donahue, N. M., DeCarlo, P. F., Lanz, V. A., Prévôt, A. S. H., Dinar, E., Rudich, Y., and Worsnop, D. R.: Organic aerosol components observed in Northern Hemispheric datasets from Aerosol Mass Spectrometry, Atmos. Chem. Phys., 10, 4625–4641, https://doi.org/10.5194/acp-10-4625-2010, 2010.
Omelekhina, Y., Eriksson, A., Canonaco, F., Prevot, A. S. H., Nilsson, P., Isaxon, C., Pagels, J., and Wierzbicka, A.: Cooking and electronic cigarettes leading to large differences between indoor and outdoor particle composition and concentration measured by aerosol mass spectrometry, Environ. Sci.-Proc. Imp., 22, 1382–1396, https://doi.org/10.1039/D0EM00061B, 2020.
Pandis, S. N., Skyllakou, K., Florou, K., Kostenidou, E., Kaltsonoudis, C., Hasa, E., and Presto, A. A.: Urban particulate matter pollution: A tale of five cities, Faraday Discuss., 189, 277–290, https://doi.org/10.1039/C5FD00212E, 2016.
Raatikainen, T., Vaattovaara, P., Tiitta, P., Miettinen, P., Rautiainen, J., Ehn, M., Kulmala, M., Laaksonen, A., and Worsnop, D. R.: Physicochemical properties and origin of organic groups detected in boreal forest using an aerosol mass spectrometer, Atmos. Chem. Phys., 10, 2063–2077, https://doi.org/10.5194/acp-10-2063-2010, 2010.
Renzi, M., Marchetti, S., de' Donato, F., Pappagallo, M., Scortichini, M., Davoli, M., Frova, L., Michelozzi, P., and Stafoggia, M.: Acute Effects of Particulate Matter on All-Cause Mortality in Urban, Rural, and Suburban Areas, Italy, Int. J. Env. Res. Pub. He., 18, 12895, https://doi.org/10.3390/ijerph182412895, 2021.
Reyes-Villegas, E., Bannan, T., Le Breton, M., Mehra, A., Priestley, M., Percival, C., Coe, H., and Allan, J. D.: Online Chemical Characterization of Food-Cooking Organic Aerosols: Implications for Source Apportionment, Environ. Sci. Technol., 52, 5308–5318, https://doi.org/10.1021/acs.est.7b06278, 2018.
Rogge, W. F., Hildemann, L. M., Mazurek, M. A., Cass, G. R., and Simoneit, B. R. T.: Sources of fine organic aerosol. 1. Charbroilers and meat cooking operations, Environ. Sci. Technol., 25, 1112–1125, https://doi.org/10.1021/es00018a015, 1991.
Ruggeri, G. and Takahama, S.: Technical Note: Development of chemoinformatic tools to enumerate functional groups in molecules for organic aerosol characterization, Atmos. Chem. Phys., 16, 4401–4422, https://doi.org/10.5194/acp-16-4401-2016, 2016.
Saha, P. K., Zimmerman, N., Malings, C., Hauryliuk, A., Li, Z., Snell, L., Subramanian, R., Lipsky, E., Apte, J. S., Robinson, A. L., and Presto, A. A.: Quantifying high-resolution spatial variations and local source impacts of urban ultrafine particle concentrations, Sci. Total Environ., 655, 473–481, https://doi.org/10.1016/j.scitotenv.2018.11.197, 2019.
Saha, P. K., Sengupta, S., Adams, P., Robinson, A. L., and Presto, A. A.: Spatial Correlation of Ultrafine Particle Number and Fine Particle Mass at Urban Scales: Implications for Health Assessment, Environ. Sci. Technol., 54, 9295–9304, https://doi.org/10.1021/acs.est.0c02763, 2020.
Schauer, J. J., Rogge, W. F., Hildemann, L. M., Mazurek, M. A., Cass, G. R., and Simoneit, B. R. T.: Source apportionment of airborne particulate matter using organic compounds as tracers, Atmos. Environ., 30, 3837–3855, https://doi.org/10.1016/1352-2310(96)00085-4, 1996.
Schauer, J. J., Kleeman, M. J., Cass, G. R., and Simoneit, B. R. T.: Measurement of Emissions from Air Pollution Sources. 4. C1-C27 Organic Compounds from Cooking with Seed Oils, Environ. Sci. Technol., 36, 567–575, https://doi.org/10.1021/es002053m, 2002.
Schraufnagel, D. E.: The health effects of ultrafine particles, Exp. Mol. Med., 52, 311–317, https://doi.org/10.1038/s12276-020-0403-3, 2020.
Shah, R. U., Robinson, E. S., Gu, P., Robinson, A. L., Apte, J. S., and Presto, A. A.: High-spatial-resolution mapping and source apportionment of aerosol composition in Oakland, California, using mobile aerosol mass spectrometry, Atmos. Chem. Phys., 18, 16325–16344, https://doi.org/10.5194/acp-18-16325-2018, 2018.
Song, R., Presto, A. A., Saha, P., Zimmerman, N., Ellis, A., and Subramanian, R.: Spatial variations in urban air pollution: Impacts of diesel bus traffic and restaurant cooking at small scales, Air Qual. Atmos. Hlth., 14, 2059–2072, https://doi.org/10.1007/s11869-021-01078-8, 2021.
Sturm, P. J., Baltensperger, U., Bacher, M., Lechner, B., Hausberger, S., Heiden, B., Imhof, D., Weingartner, E., Prevot, A. S. H., Kurtenbach, R., and Wiesen, P.: Roadside measurements of particulate matter size distribution, Atmos. Environ., 37, 5273–5281, https://doi.org/10.1016/j.atmosenv.2003.05.006, 2003.
Sun, Y. L., Zhang, Q., Schwab, J. J., Yang, T., Ng, N. L., and Demerjian, K. L.: Factor analysis of combined organic and inorganic aerosol mass spectra from high resolution aerosol mass spectrometer measurements, Atmos. Chem. Phys., 12, 8537–8551, https://doi.org/10.5194/acp-12-8537-2012, 2012.
Sun, Y. L., Wang, Z. F., Fu, P. Q., Yang, T., Jiang, Q., Dong, H. B., Li, J., and Jia, J. J.: Aerosol composition, sources and processes during wintertime in Beijing, China, Atmos. Chem. Phys., 13, 4577–4592, https://doi.org/10.5194/acp-13-4577-2013, 2013.
Takhar, M., Stroud, C. A., and Chan, A. W. H.: Volatility Distribution and Evaporation Rates of Organic Aerosol from Cooking Oils and their Evolution upon Heterogeneous Oxidation, ACS Earth Space Chem., 3, 1717–1728, https://doi.org/10.1021/acsearthspacechem.9b00110, 2019.
Tan, Y., Dallmann, T. R., Robinson, A. L., and Presto, A. A.: Application of plume analysis to build land use regression models from mobile sampling to improve model transferability, Atmos. Environ., 134, 51–60, https://doi.org/10.1016/j.atmosenv.2016.03.032, 2016.
Torkmahalleh, M. A., Goldasteh, I., Zhao, Y., Udochu, N. M., Rossner, A., Hopke, P. K., and Ferro, A. R.: PM2.5 and ultrafine particles emitted during heating of commercial cooking oils, Indoor Air, 22, 483–491, https://doi.org/10.1111/j.1600-0668.2012.00783.x, 2012.
Wallace, L. A., Emmerich, S. J., and Howard-Reed, C.: Source Strengths of Ultrafine and Fine Particles Due to Cooking with a Gas Stove, Environ. Sci. Technol., 38, 2304–2311, https://doi.org/10.1021/es0306260, 2004.
Wan, M.-P., Wu, C.-L., Sze To, G.-N., Chan, T.-C., and Chao, C. Y. H.: Ultrafine particles, and PM2.5 generated from cooking in homes, Atmos. Environ., 45, 6141–6148, https://doi.org/10.1016/j.atmosenv.2011.08.036, 2011.
Wang, Y., Zhu, Y., Salinas, R., Ramirez, D., Karnae, S., and John, K.: Roadside Measurements of Ultrafine Particles at a Busy Urban Intersection, J. Air Waste Manage., 58, 1449–1457, https://doi.org/10.3155/1047-3289.58.11.1449, 2008.
Wang, Y., Bechle, M. J., Kim, S.-Y., Adams, P. J., Pandis, S. N., Pope, C. A., Robinson, A. L., Sheppard, L., Szpiro, A. A., and Marshall, J. D.: Spatial decomposition analysis of NO2 and PM2.5 air pollution in the United States, Atmos. Environ., 241, 117470, https://doi.org/10.1016/j.atmosenv.2020.117470, 2020.
Wu, C. L., Chao, C. Y. H., Sze-To, G. N., Wan, M. P., and Chan, T. C.: Ultrafine Particle Emissions from Cigarette Smouldering, Incense Burning, Vacuum Cleaner Motor Operation and Cooking, Indoor Built Environ., 21, 782–796, https://doi.org/10.1177/1420326X11421356, 2012.
Yao, D., Lyu, X., Lu, H., Zeng, L., Liu, T., Chan, C. K., and Guo, H.: Characteristics, sources and evolution processes of atmospheric organic aerosols at a roadside site in Hong Kong, Atmos. Environ., 252, 118298, https://doi.org/10.1016/j.atmosenv.2021.118298, 2021.
Yao, X., Lau, N. T., Fang, M., and Chan, C. K.: Real-Time Observation of the Transformation of Ultrafine Atmospheric Particle Modes, Aerosol Sci. Tech., 39, 831–841, https://doi.org/10.1080/02786820500295248, 2005.
Ye, C., Yuan, B., Lin, Y., Wang, Z., Hu, W., Li, T., Chen, W., Wu, C., Wang, C., Huang, S., Qi, J., Wang, B., Wang, C., Song, W., Wang, X., Zheng, E., Krechmer, J. E., Ye, P., Zhang, Z., Wang, X., Worsnop, D. R., and Shao, M.: Chemical characterization of oxygenated organic compounds in the gas phase and particle phase using iodide CIMS with FIGAERO in urban air, Atmos. Chem. Phys., 21, 8455–8478, https://doi.org/10.5194/acp-21-8455-2021, 2021.
Zhang, Y., Tang, L., Yu, H., Wang, Z., Sun, Y., Qin, W., Chen, W., Chen, C., Ding, A., Wu, J., Ge, S., Chen, C., and Zhou, H.: Chemical composition, sources and evolution processes of aerosol at an urban site in Yangtze River Delta, China during wintertime, Atmos. Environ., 123, 339–349, https://doi.org/10.1016/j.atmosenv.2015.08.017, 2015.
Zhang, Z., Zhu, W., Hu, M., Wang, H., Chen, Z., Shen, R., Yu, Y., Tan, R., and Guo, S.: Secondary Organic Aerosol from Typical Chinese Domestic Cooking Emissions, Environ. Sci. Tech. Let., 8, 24–31, https://doi.org/10.1021/acs.estlett.0c00754, 2021.
Zhao, Y., Hu, M., Slanina, S., and Zhang, Y.: Chemical Compositions of Fine Particulate Organic Matter Emitted from Chinese Cooking, Environ. Sci. Technol., 41, 99–105, https://doi.org/10.1021/es0614518, 2007a.
Zhao, Y., Hu, M., Slanina, S., and Zhang, Y.: The molecular distribution of fine particulate organic matter emitted from Western-style fast food cooking, Atmos. Environ., 41, 8163–8171, https://doi.org/10.1016/j.atmosenv.2007.06.029, 2007b.
Zhu, Q., Huang, X.-F., Cao, L.-M., Wei, L.-T., Zhang, B., He, L.-Y., Elser, M., Canonaco, F., Slowik, J. G., Bozzetti, C., El-Haddad, I., and Prévôt, A. S. H.: Improved source apportionment of organic aerosols in complex urban air pollution using the multilinear engine (ME-2), Atmos. Meas. Tech., 11, 1049–1060, https://doi.org/10.5194/amt-11-1049-2018, 2018.