the Creative Commons Attribution 4.0 License.
the Creative Commons Attribution 4.0 License.
Improving estimation of a record-breaking east Asian dust storm emission with lagged aerosol Ångström exponent observations
Yueming Cheng
Junji Cao
Daisuke Goto
Jianbing Jin
Teruyuki Nakajima
Guangyu Shi
A record-breaking east Asian dust storm over recent years occurred in March 2021. The Ångström exponent (AE), which measures the wavelength dependence of aerosol optical thickness (AOT), is significantly sensitive to large aerosols such as dust. Due to the lack of observations during dust storms and the accuracy of the satellite-retrieved AE depending on the instrument and retrieval algorithm, it is possible to estimate the dust storm emission using the time-lagged ground-based AE observations. In this study, the hourly AEs observed by the Aerosol Robotic Network (AERONET) are assimilated with the ensemble Kalman smoother (EnKS) and Weather Research and Forecasting model coupled with Chemistry (WRF-Chem) to optimize simulated dust emissions from 14 to 23 March 2021. The results demonstrate that the additional inclusion of AE can optimize the size distribution of dust emissions and the associated total flux depending on the covariance between time-lagged AE observations and simulated dust emissions in each size bin. Compared to the experiment only assimilating AOT, validation by independent observations from the Skynet Observation NETwork (SONET) shows that assimilating additional AE information reduces the root mean square error (RMSE) of simulated AOT and AE by approximately 17 % and 61 %, respectively. The temporal variation in both simulated AOT and AE is improved through assimilating additional AE information. The assimilation of AOT and AE also makes the magnitude and variations in aerosol vertical extinctions more comparable to the independent Cloud-Aerosol Lidar with Orthogonal Polarization (CALIOP) observations in both westward and eastward pathways of dust transport. The optimized dust emissions in the Gobi Desert during this period is estimated to be 52.63 Tg and reached a peak value of 3837 kt h−1 at 07:00 UTC on 14 March.
- Article
(13136 KB) - Full-text XML
-
Supplement
(12515 KB) - BibTeX
- EndNote
Mineral dust is the most abundant atmospheric aerosol component in terms of aerosol dry mass. It affects the climate system by scattering and absorbing longwave and shortwave radiation and also contributes to the formation of cloud condensation nuclei (CCN) and ice-nucleating particles (INP) (Huang et al., 2006; Kok et al., 2018; Liu et al., 2020). Dust also carries organic matter and transports iron to the ocean, which is vital to ocean productivity and ocean–atmosphere CO2 exchange, thus inducing impacts on the cycles of dust and carbon (Shao et al., 2011). Dust deposition on snow surfaces can influence the snow albedo and modify the water cycle and energy budget (Wu et al., 2018; Kang et al., 2019; Wang et al., 2020). Moreover, severe dust storms can induce air pollution and affect human health (Chen et al., 2020).
East Asia, including the Taklamakan and Gobi deserts, is the world's second-largest dust source, accounting for approximately 40 % of the global dust emissions (Satake et al., 2004; Kok et al., 2021) and 88 % of the dust in China and neighboring seas (Han et al., 2022). Although the dust activities in east Asia have declined recently (Wu et al., 2022), the unexpected extreme dust storm event that occurred from 14 to 23 March 2021 has raised widespread concern. Numerical models are important tools for studying severe dust storms, and dust emissions is a significant parameter for characterizing dust activity. However, due to differences in the parameterizations of dust source fluxes, dust particle sizes, and model resolutions, simulated east Asian dust emissions vary by more than an order of magnitude among different models (Textor et al., 2006; Uno et al., 2006; Gliß et al., 2021; Kok et al., 2021), indicating that dust emission is a highly uncertain process in dust simulation. Data assimilation, which incorporates observation information into numerical models, provides a top-down method for optimizing estimates of dust emissions. Yumimoto et al. (2008) assimilated the dust extinction coefficients derived from ground-based lidar networks using a four-dimensional variational (4D-Var) method, increasing east Asian dust emissions approximately 10-fold. Sekiyama et al. (2010) developed an ensemble Kalman filter (EnKF) data assimilation system to jointly correct the global dust emissions and aerosol mixing ratios by assimilating vertical observations from the Cloud-Aerosol Lidar and Infrared Pathfinder Satellite Observations (CALIPSO) satellite. Wang et al. (2012) constrained the amount and location of dust emissions in the Taklamakan and Gobi deserts using the Goddard Earth Observing System with Chemistry (GEOS-Chem) adjoint model by assimilating aerosol optical thicknesses (AOTs) from the Moderate Resolution Imaging Spectroradiometer (MODIS). Schutgens et al. (2012) assimilated observations from the Aerosol Robotic Network (AERONET) and MODIS to estimate emissions for dust, sea salt, and carbonaceous aerosols using an ensemble Kalman smoother technique. Yumimoto and Takemura (2015) performed inverse modeling of Asian dust with four-dimensional variational (4D-Var) data assimilation system and MODIS-retrieved AOT over ocean. Escribano et al. (2016) estimated dust emissions and reduced their uncertainty over the Sahara desert and the Arabian Peninsula by assimilating MODIS AOT retrievals. Di Tomaso et al. (2017) used the four-dimensional (4D) local ensemble transform Kalman filter (LETKF) to assimilate MODIS Dark Target and Deep Blue AOTs for improving dust analyses and forecasts on a global scale. More recently, high-frequency AOTs from the Himawari-8 geostationary satellite have been used for the optimization of dust storm emissions with a reduced tangent linearization 4D-Var technique (Jin et al., 2019).
In addition to AOT, the Ångström exponent (AE), which measures the wavelength dependence of AOT and is sensitive to the size of aerosol particles, may have a positive impact on data assimilation (Tsikerdekis et al., 2022, 2023). The estimated emission may be misrepresented by not including observations related to size (Chen et al., 2018, 2019; Tsikerdekis et al., 2021). However, most of the previous studies have focused on assimilating AOT to estimate new dust emissions, while few studies have explored the potential benefits of incorporating aerosol size information such as AE observations.
Therefore, how will the assimilation of the AE observations affect the optimization of dust emissions? It becomes an important scientific question. Due to the fact that accuracy of satellite-retrieved AE depends on the instrument and retrieval algorithm, the ground-based AE is better than satellite-based AE and can be more useful for optimizing dust emissions.
Therefore, the AOT and AE observations from the ground-based Aerosol Robotic Network (AERONET) are assimilated to investigate the sensitivity of dust emissions to observed size information in this study. The additional benefit of aerosol size information in estimating dust emissions is explored by only assimilating AOT and simultaneously assimilating AOT and AE. The experiments are performed using the ensemble Kalman smoother (EnKS) assimilation framework (Dai et al., 2019) to constrain the extreme dust storm emission over east Asia from 14 to 23 March 2021. The Sun–Sky Radiometer Observation Network (SONET) and CALIPSO observations are used for independent validation.
Section 2 describes the assimilated and independent validation observations. Our dust emission optimization system and experimental design are presented in Sect. 3. Section 4 presents the optimized emission results and the validations using multi-sensor independent observations. The conclusions are given in Sect. 5.
2.1 Assimilated AERONET observations
The Aerosol Robotic Network (AERONET) is a federation of ground-based remote sensing aerosol network that collects aerosol optical observations with Sun photometers from various stations globally (https://aeronet.gsfc.nasa.gov/, last access: 8 July 2024) (Holben et al., 1998; Giles et al., 2019). Version-3 AOT data are divided into three levels according to the data quality procedures: Level 1 (unscreened), Level 1.5 (cloud-screened and quality-controlled), and Level 2 (quality-assured). In this study, the version-3 Level-2 AOT at 550 nm and AE at 440–870 nm from AERONET are assimilated. AOT (τ) at 550 nm is obtained by logarithmic interpolation of the AOTs at 440 and 675 nm. AE (α) at 440–870 nm is calculated with the AOT at 440 and 870 nm using the following equation: . To ensure accuracy, the AE value is considered valid only when the AOTs at 440 and 870 nm both exceed 0.05 (Giles et al., 2019). The instantaneous observations are averaged every 1 h, centering on the assimilation time slot. The observation error (ϵ) attributed to this averaged observation is calculated by a representation error (ϵr) and an instrument error (ϵo) as . Due to the representation error being related to the WRF-Chem grid resolution, the representation error in AERONET AOT and AE is calculated depending on the AOT and AE temporal variability in AERONET and WRF-Chem at 45 km horizontal resolution (Schutgens et al., 2010). By averaging results at all AERONET sites in March 2021, the relative AOT temporal variations in AERONET and WRF-Chem in the 1 h interval are 0.11τ and 0.1τ, while the AE temporal variations in AERONET and WRF-Chem in the 1 h interval are 0.05 and 0.02, respectively. Therefore, the representation errors in AERONET AOT (τ) and AE in the 1 h interval are ϵAOTr=0.01τ and ϵAEr=0.03, respectively. The instrument error in AOT (ϵAOTi) is defined as 0.015, and the instrument error in AE (ϵAEi) is estimated by propagating the instrument error in AOT at 440 and 870 nm as follows: (Schutgens et al., 2010).
To minimize the influences of anthropogenic emissions, only the AERONET AOT and AE dominated by dust are assimilated to optimize the dust emissions, which are chosen with an AE at 440–870 nm of less than 0.4 (Huneeus et al., 2011). In addition, due to the uncertainties in modeled covariance between dust emission and aerosol optical properties increasing with the distance from the source region, only the observations within 2190 km (3.65 times of the localization length) of the east Asian dust source region are used for data assimilation. As shown in Fig. 1a, there are five AERONET sites with available observations from 14 to 23 March 2021 for data assimilation, including four sites, named Beijing-CAMS (39.93° N, 116.32° E), Beijing (39.98° N, 116.38° E), Beijing_PKU (39.99° N, 116.31° E), and Beijing_RADI (40.00° N, 116.38° E) in the downwind area and a site near the dust source region named as Dalanzadgad (43.58° N, 104.42° E). The assimilated AOT and AE values at the AERONET sites are also given in Fig. 1b, d. For the Dalanzadgad site, the AOT values from 14 to 17 March 2021 are significantly higher than those from 18 to 23 March, while the AE values show the opposite features.
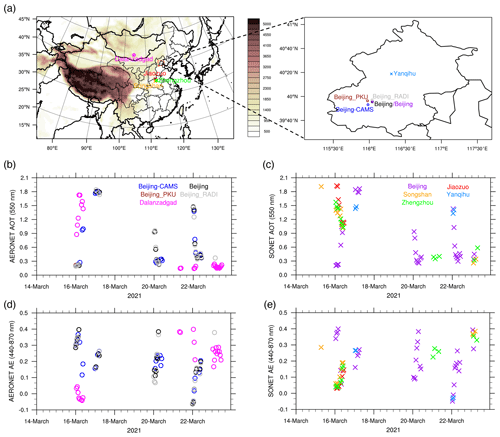
Figure 1Locations of selected Aerosol Robotic Network (AERONET) sites for data assimilation and Skynet Observation NETwork (SONET) sites for independent validation in this study (a). The color-filled contours represent the altitude (in meters). AERONET sites are illustrated by a circle and SONET sites are illustrated by a cross. The hourly values of aerosol optical thickness (AOT) at 550 nm and Ångström exponent (AE) at 440–870 nm at AERONET (b, d) and SONET sites (c, e) during 14–23 March 2021.
2.2 Independent SONET and CALIOP observations
The Sun–Sky Radiometer Observation Network (SONET) is a ground-based aerosol network employing a Cimel radiometer and multiwavelength polarization measurement to provide long-term columnar atmospheric aerosol properties over China (http://www.sonet.ac.cn/, last access: 8 July 2024) (Li et al., 2018). The aerosol optical-related products including AOT, AE, and fine-mode fraction (FMF) are graded into three levels: Level 1 (no triplet), Level 1.5 (cloudy), and Level 2 (no cloud). In this study, the Level-2 AOT at 550 nm and AE at 440–870 nm from SONET are used for independent validation, and the instantaneous observations are also averaged every hour to generate hourly AOT and AE datasets. As shown in Fig. 1a, there are five SONET sites with available observations from 14 to 23 March 2021, including Yanqihu (40.40° N, 116.67° E), Beijing (40.00° N, 116.37° E), Jiaozuo (35.18° N, 113.20° E), Songshan (34.53° N, 113.09° E), and Zhengzhou (34.70° N, 113.66° E). The AOT and AE values at the SONET sites are also given in Fig. 1c, e. Similar to the Dalanzadgad site, the Jiaozuo, Songshan, and Zhengzhou sites experience a stronger dust process from 14 to 17 March 2021, with higher AOTs and lower AEs.
Cloud-Aerosol Lidar with Orthogonal Polarization (CALIOP) aboard the CALIPSO satellite is a dual-wavelength polarization lidar that performs observations of vertical structures of aerosols and clouds on a global scale (https://www-calipso.larc.nasa.gov/, last access: 8 July 2024) (Winker et al., 2007). In this study, the aerosol extinction coefficients at 532 nm in the CALIPSO lidar version-4.20 Level-2 aerosol profile products over the altitude range below 12 km are also used for evaluation. The CALIPSO lidar version-4.20 Level-2 vertical feature mask (VFM) products, which include the feature types and subtype information, are used for aerosol discrimination (Omar et al., 2009; Cheng et al., 2019).
3.1 Forward model
The Weather Research and Forecasting model coupled with Chemistry (WRF-Chem) version 4.4 is served as the forward model. The model domain covers China with a 45 km horizontal resolution and 28 vertical levels. The Goddard Chemistry Aerosol Radiation and Transport (GOCART) aerosol scheme (chem_opt = 300) is adopted to simulate both dust and non-dust aerosol species (Chin et al., 2000, 2002). The Air Force Weather Agency (AFWA) dust emission scheme (dust_opt = 3) is chosen for dust simulation. The mass mixing ratio of the main aerosol components, including dust, sea salt, organic carbon, black carbon, and sulfate, is predicted. Other main selected physics are identical to those of Dai et al. (2019). To better represent the characteristics of east Asian dust, the fractions of dust emissions in the AFWA scheme are modified to 0.034, 0.187, 0.327, 0.163, and 0.309 for the 0.2–2 µm (bin 1), 2–3.6 µm (bin 2), 3.6–6 µm (bin 3), 6–12 µm (bin 4), and 12–20 µm (bin 5) dust size bins in diameter, respectively (Su and Fung, 2015). To reduce the underestimation of dust emissions in the AFWA scheme and start from a relatively unbiased simulation, the adjustable dust emission factor is calibrated and selected as 21 based on the AERONET-observed AOT and AE. This rescaling of dust emissions can benefit the data assimilation since the Kalman filter assumes that the model is unbiased (Tsikerdekis et al., 2021). The aerosol optical properties are calculated with the Mie parameterization using the Aerosol Chemical to Aerosol Optical Properties module (Ghan and Zaveri, 2007; Barnard et al., 2010), which is based on the sectional approach. The eight dust size bins in the Mie subroutine are the in the Model for Simulating Aerosol Interactions and Chemistry (MOSAIC) module. The calculation of the dust optical properties is improved by three corrections: (1) remapping the fractions of AFWA bin-1 dust in 0.2–2 µm into Mie calculation bins as in Ukhov et al. (2021); (2) redistributing fractions of the dust mass based on the assumption that bin concentration is a function of the natural logarithm radius as in Ukhov et al. (2021); and (3) increasing the eight dust size bins in Mie the subroutine to nine, of 0.039–0.078, 0.078–0.156, 0.156–0.312, 0.312–0.625, 0.625–1.25, 1.25–2.5, 2.5–5.0, 5.0–10.0, and 10–20 µm in size, to distribute the AFWA bin-5 dust in 12–20 µm into bins for the Mie calculation. To compare with AERONET-observed aerosol optical properties, the simulated ones are calculated assuming that the particles are spherical and internally mixed with all the simulated aerosol components (Barnard et al., 2010). The initial and lateral boundary meteorological conditions are from the NCEP Final (FNL) analysis. To reduce the uncertainties associated with the meteorological fields, the predicted wind (u, v), temperature (t), and specific humidity (q) by the WRF dynamical core are also nudged to perform the NCEP FNL analysis every 6 h for all layers (Dai et al., 2018).
3.2 Data assimilation framework
The adopted assimilation system, integrating measurements with model simulations, is based on the ensemble Kalman smoother (EnKS) with WRF-Chem (Dai et al., 2019). The Kalman smoother is in essence a Kalman filter that iteratively estimates emissions (Schutgens et al., 2012). As shown in Fig. S1 in the Supplement, based on the EnKS, the dust emission of the WRF-Chem ensemble is optimized every 12 h, which corresponds to the assimilation time window of 12 h. Each assimilation cycle advances a time step of 12 h, and the dust emissions for six time steps are optimized using the observations in the sixth time step. After each assimilation cycle, the dust emission for the first time step is the final optimized result, which has been optimized six times and will no longer be optimized in the next cycle. The finally optimized dust emissions therefore serve as the forcing dust emissions for advancing the system by one time step, and they provide the initial conditions for the next assimilation cycle.
The posterior dust emission, , is obtained from the solution to the Kalman equations using the following formula:
where and Xb represent the ensemble mean of prior dust emissions and the first-guess ensemble perturbation, respectively. The weight matrix, , determines the increment between the analysis and first guess as follows:
where the matrix is called the Kalman gain; R is the observation error covariance matrix; yo and represent the assimilated hourly AOT and AE observations from AERONET and the first guess of the simulated AOT and AE observations averaged over the ensemble members; and WRF-Chem serves as the observation operator, H, to relate the prior dust emission to the first guess of the simulated observations, . The first guess ensemble perturbation matrix in observation space Yb is calculated as , with , with k ensemble members. The analysis error covariance is obtained by
where I is the identity matrix. The analysis ensemble perturbation, Xa, is obtained by
whose ith column is , . In this study, the analysis ensemble obtained by adding to each of the columns of Xa forms the optimal dust emission for the ensemble forecast to produce the initial conditions for the next analysis. Wa is calculated as follows:
This assimilation scheme offers the advantage of selectively assimilating observations for a given grid point by employing localization on the horizontal, vertical, and temporal scales (Hunt et al., 2007; Gaspari and Cohn, 1999; Miyoshi et al., 2007). The horizontal localization factor is calculated as , the factor is truncated at 3.65 times the localization length, σ = 600 km, in this study, and r is the distance between the observation and the grid centroid. The vertical and time localization are not applied in this study.
3.3 Experimental design
To investigate the influences of AERONET AOT and AE assimilation on the dust emission optimization, three assimilation experiments are conducted from 12:00 UTC on 11 March 2021 to 00:00 UTC on 24 March 2021. The initial condition at 12:00 UTC on 11 March 2021 is prepared by an 11 d simulation executed by WRF-Chem without any aerosol data assimilation as a spin-up. Due to WRF-Chem model uncertainties in not only dust emissions but also dust deposition (Huang et al., 2020) and dust optical properties (Di Biagio et al., 2019), two assimilation experiments with the perturbation of dust emissions and size distribution are conducted. One assimilation experiment named AOT DA-SZD assimilates only AERONET AOT observations, and the other assimilation experiment named AOT+AE DA-SZD assimilates both AERONET AOT and AE observations. In total, 20 ensemble members are generated by perturbing the emission fluxes in each of the five dust bins. The same perturbation factor is used across the whole domain. The random perturbation factor is drawn from a lognormal distribution with a mean of 1 and a standard deviation of 0.6. Referring to Dai et al. (2019), the standard deviation of 0.6 corresponds to the uncertainty in the dust emissions for 14 global models (Huneeus et al., 2011). Correlated noise is used across the dust size bins in the perturbation, and the noise correlation decreases with the increased difference in the diameter among the bins (Di Tomaso et al., 2017). The ensemble prediction dynamically estimates the covariance between the dust emissions in each bin and the aerosol optical properties. The comparison between AOT DA-SZD and AOT+AE DA-SZD experiments shows the effects of the additional AE information on dust emission optimization. The effects of dust emission size distribution perturbation are investigated by one additional assimilation experiment named AOT+AE DA, which is conducted in the same way as the AOT+AE DA-SZD experiment except that the 20 ensemble members are generated by perturbing the dust emissions in each bin with the same perturbation factor. The results from 12:00 UTC on 11 March 2021 to 23:59 UTC on 13 March 2021 are excluded from the analysis. The baseline experiment, named FR, is a single run. It does not assimilate any observations but otherwise shares the same configuration with the assimilation experiments.
4.1 Dust emissions and simulated dust field
Figure 2 shows the temporal variations in hourly accumulated dust emissions in the Taklamakan Desert and Gobi Desert simulated by FR, AOT DA-SZD, AOT+AE DA-SZD, and AOT+AE DA experiments. The first dust storm in the Taklamakan Desert mainly emits from 00:00 UTC on 14 March to 12:00 UTC on 16 March and reaches the peak values of 420, 887, 952, and 933 kt h−1 at 01:00 UTC on 16 March for the FR, AOT DA-SZD, AOT+AE DA-SZD, and AOT+AE DA experiments, respectively. The second dust storm in the Taklamakan Desert mainly emits from 00:00 UTC on 17 March to 20:00 UTC on 18 March and reaches the peak values of 1033, 1914, 1272, and 1338 kt h−1 at 07:00 UTC on 18 March for the FR, AOT DA-SZD, AOT+AE DA-SZD, and AOT+AE DA experiments. There are almost no dust emissions in Taklamakan Desert after 20:00 UTC on 18 March. Regarding the Gobi Desert, the strongest dust storm generally emit from 00:00 UTC on 14 March to 18:00 UTC on 15 March and reach the peak values of 1735, 3253, 3837, and 2791 kt h−1 at 07:00 UTC on 14 March for the FR, AOT DA-SZD, AOT+AE DA-SZD, and AOT+AE DA experiments. After 18 March, there are five relatively weak dust processes in the Gobi Desert. Depend on the temporal variations in dust emissions in the Gobi Desert, the whole period is divided into two dust processes: the strong dust storm from 14 to 17 March 2021 and the weak dust storm from 18 to 23 March 2021. In general, the total dust emissions during 14–17 (18–23) March 2021 in the Gobi Desert are 21.45 (13.03), 32.03 (18.84), 44.41 (8.22), and 33.10 Tg (8.57 Tg) for the FR, AOT DA-SZD, AOT+AE DA-SZD, and AOT+AE DA experiments. The dust emissions in each dust bin are given in Table S1 in the Supplement.
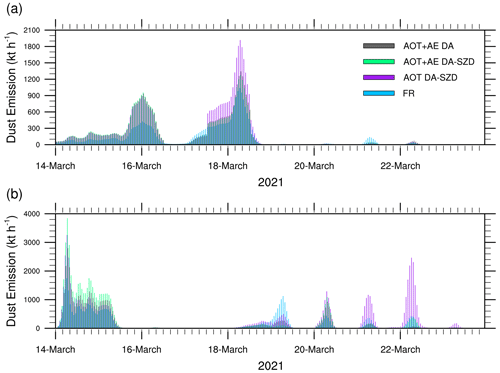
Figure 2Time series of hourly accumulated dust emissions (in kt h−1) for FR, AOT DA-SZD, AOT+AE DA-SZD, and AOT+AE DA experiments during 14–23 March 2021 summed across the Taklamakan Desert (a) and Gobi Desert (b) (marked in Fig. 3).
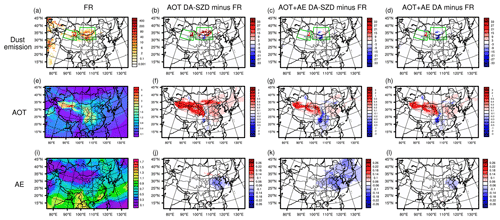
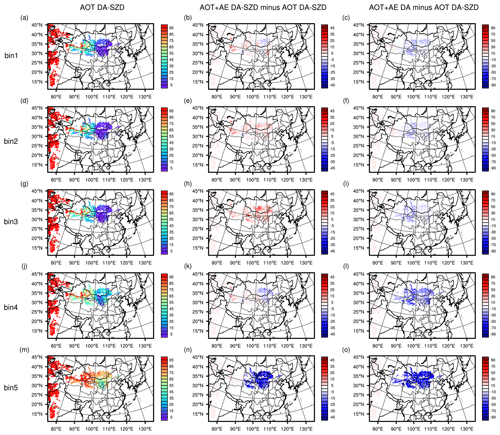
The simulated accumulated dust emissions and averaged AOT and AE for the four experiments during 14–17 March 2021 are given in Fig. 3. During 14–17 March 2021, the dust storms in the Taklamakan Desert and Gobi Desert both transports eastward, mainly affecting northern China. The dust emissions in the three assimilation experiments are significantly higher than that in FR experiment, especially those in AOT+AE DA-SZD experiment. The differences in dust emissions between the FR and assimilation experiments are mainly concentrated in the Taklamakan Desert and Gobi Desert, while there is generally no difference in India due to the distance truncation of horizontal localization. The increased dust emissions in all the assimilation experiments induce higher AOTs over the deserts and the associated downwind regions, whereas only the AEs over the Gobi Desert and its downwind region in the AOT+AE DA-SZD experiment are significantly reduced. The ratios between the posterior error in dust emissions and the prior ones in each dust bin for the three assimilation experiments during 14–17 March 2021 are shown in Fig. 4. This helps visualize how adding AOT and AE for the data assimilation reduces the posterior errors in simulated dust emissions. Due to the same prior error in the dust emission, the difference in ratio represents the difference in posterior error. A ratio with a value lower than 100 % indicates the assimilation decreasing the uncertainties in the dust emission, and a lower value represents higher constraint. The posterior error increase with the dust size bin increased in the AOT DA-SZD experiment, which is due to the fact that time-lagged AOT observations in the downwind areas are more relevant for the fine-mode dust emissions because of the stronger gravity settling of coarse-mode dust and the higher extinction efficiency of fine-mode dust (Figs. S2 and S3). The additional AE observations in the AOT+AE DA-SZD experiment further adjust the dust emission size distribution over the Gobi Desert by the decreasing dust emission in bin 1 and the increasing dust emission in bin 3 (Figs. S4 and S5), inducing significant reductions in the posterior error in bin 1 and bin 3 in the Gobi Desert. The significant decrease in bin 1 is due to bin 1 having the highest dust extinction efficiency, and the significant increase in bin 3 is due to bin 3 having the largest proportion in the fine-mode dust emissions. This induces the significant decrease in the AE over the Gobi Desert and its downwind region due to the fact that the assimilation of additional AE observations can obviously modify the normalized atmospheric dust volume distribution (Fig. S6). Although the AOT+AE DA experiment includes the AE observations, there are no changes in the dust emission size distribution due to the same perturbation parameter (Figs. S4 and S5). This leads to the fact that simulated AEs are similar to the FR experiment. It is found that the dust emission in bin 3 over the Gobi Desert in the AOT+AE DA-SZD experiment is obviously higher than that in the other assimilation experiments (Table S1); however, there is no significant difference in AOT among the three assimilation experiments. This is due to the effect of increased emission in bin 3 on AOT being offset by the effect of decreased emission in bin 1 since the coarse-mode dust is generally removed by gravitational sedimentation (Fig. S2) and the coarse-mode dust has lower extinction efficiency (Fig. S3).
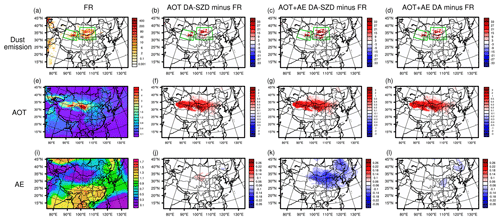
Figure 3Spatial distributions of accumulated dust emissions, aerosol optical thickness (AOT), and Ångström exponent (AE) for the FR experiment during 14–17 March 2021 (a, e, i). Differences in accumulated dust emissions (b, c, d), AOT (f, g, h), and AE (j, k, l) between AOT DA-SZD, AOT+AE DA-SZD, and AOT+AE DA experiments with the FR experiment subtracted. The unit of dust emission is g m−2. The green boxes represent the Gobi Desert (GD) and Taklamakan Desert (TD).
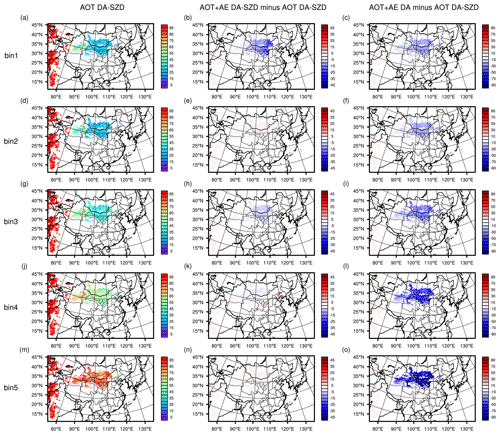
Figure 4The ratio between posterior error in FR simulated dust emissions and prior error in optimized dust emissions in the five dust size bins for AOT DA-SZD experiment (a, d, g, j, m) during 14–17 March 2021. Differences in the ratios between AOT+AE DA-SZD (b, e, h, k, n) and AOT+AE DA (c, f, i, l, o) experiments with the AOT DA-SZD experiment subtracted.
The simulated accumulated dust emissions, averaged AOT, and AE for the four experiments during 18–23 March 2021 are given in Fig. 5. Compared with the FR experiment, the dust emissions in the AOT DA-SZD experiment are increased in the Gobi Desert in Mongolia and decreased in the Gobi Desert in China, while the dust emissions in the AOT+AE DA-SZD and AOT+AE DA experiments are decreased in most part of Gobi Desert. Compared with the FR experiment, the dust emission in the AOT+AE DA-SZD experiment is increased over the Taklamakan Desert and some regions of the Gobi Desert but decreased over the majority of the Gobi Desert. This is because the dust emission periods vary across different grids, leading to the opposite trends among different dust source regions. Due to the southward transport of part of the dust emitted from the Gobi Desert, the decreased dust emission induces lower AOTs in southern China. It is also found that only the AEs over the downwind region of the Gobi Desert in the AOT+AE DA-SZD experiment are significantly reduced. As given in Table S1, the AOT DA-SZD experiment significantly increases the dust emission in bin 5 and slightly decreases the dust emissions in bin 1, bin 2, bin 3, and bin 4 over the Gobi Desert, whereas the AOT+AE DA-SZD and AOT+AE DA experiments with the additional AE observations decrease dust emissions in each bin over the Gobi Desert. The ratios between the posterior error in dust emissions and the prior one in each dust size bin for the three assimilation experiments during 18–23 March 2021 are shown in Fig. 6. It is interesting that the ratios in the AOT DA-SZD and AOT+AE DA-SZD experiments during 18–23 March 2021 are lower than those during 14–17 March 2021. This is due to the face that lower AOT observations and associated observation errors at the dust source site Dalanzadgad during 18–23 March 2021 generate more constraints on dust emissions than those during 14–17 March 2021. AOT DA-SZD experiment significantly increases the dust emission in bin 5 and leads to its emission fraction to exceed 70 % (Fig. S4); however, this phenomenon is not found in AOT+AE DA-SZD experiment. The obviously lower posterior error in bin 5 in the AOT+AE DA-SZD experiment indicates that the additional AE observations can eliminate the sharp increase in the dust emission in bin 5 and constrain the dust emission size distribution with higher confidence.
4.2 Evaluation of simulated AOTs and AEs
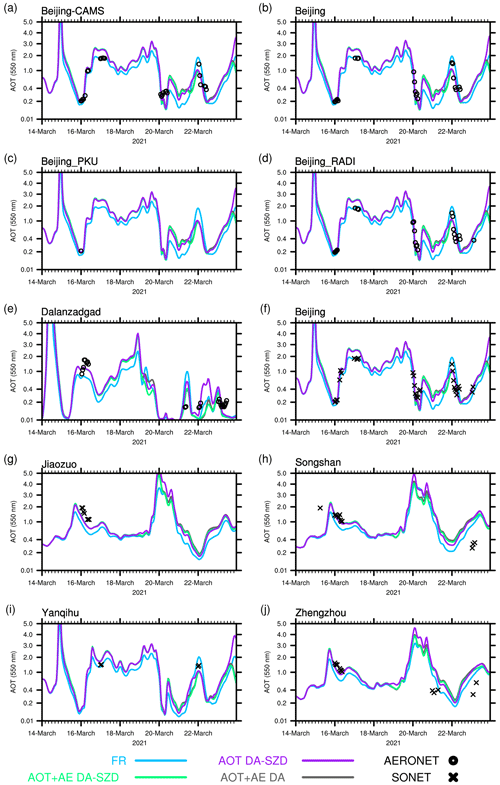
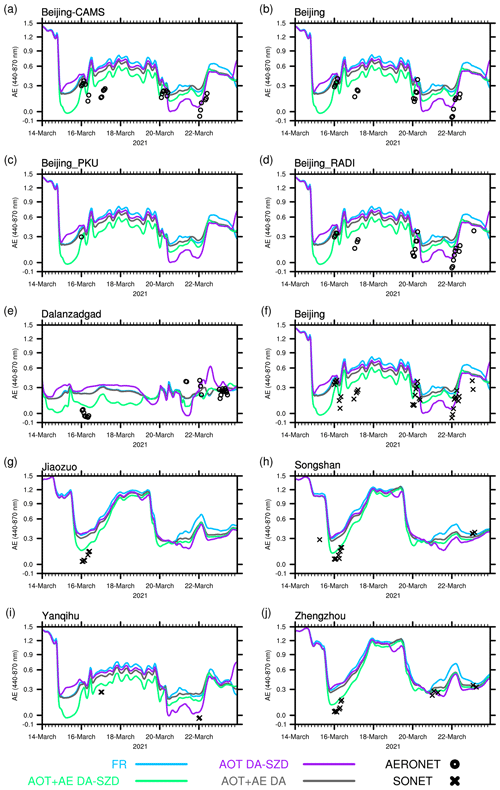
To validate the posterior dust emission, the simulated hourly AOTs and AEs with the prior and posterior dust emissions are compared with the assimilated AERONET observations as the sanity check in Fig. 7. The comparisons with independent SONET observations are further given in Fig. 8. To quantify the model performances, statistical criteria (Boylan and Russell, 2006; Willmott et al., 2012; Yumimoto et al., 2017), including the mean bias (BIAS), the mean fractional error (MFE), the root mean square error (RMSE), and the index of agreement (IOA) are calculated between the simulated results and observations. It is apparent that all the three assimilation experiments can optimize the dust emissions to better simulate AOTs and AEs closer to the assimilated AERONET and independent SONET observations. Compared to the independent SONET observations, the AOT DA-SZD experiment reduces the AOT BIAS and RMSE of the FR experiment by 85 % and 14 %; however, it can only reduce the AE BIAS and RMSE of the FR experiment by 4 % and 1 %. This indicates the assimilation of AERONET AOT observations can only optimize the dust emission and not the dust emission size distribution. The AOT+AE DA-SZD experiment reduces the AOT BIAS and RMSE of the FR experiment by 92 % and 17 %, and it can also reduce the AE BIAS and RMSE of the FR experiment by 68 % and 62 %. Although the AOT+AE DA experiment assimilates the AE observations, it sees limited improvement in AE since the uncertainty in dust emission size distribution is not considered. These results indicate the additional assimilation of AE observations with consideration of the dust emission size distribution uncertainty are helpful for the optimization of dust emissions through the adjustment of the dust size distribution. Similar conclusions are also found in the comparison with the assimilated AERONET observations.
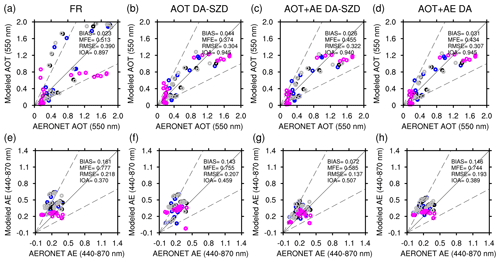
Figure 7Scatter plots of assimilated Aerosol Robotic Network (AERONET) hourly aerosol optical thicknesses (AOTs) versus the simulated ones at 550 nm for FR (a), AOT DA-SZD (b), AOT+AE DA-SZD (c), and AOT+AE DA (d) experiments from 14 to 23 March 2021. The circles with different colors represent different AERONET sites: Beijing-CAMS (dark blue), Beijing (black), Beijing_PKU (brown), Beijing_RADI (grey), and Dalanzadgad (violet). The solid black line is the 1:1 line and the dashed black lines correspond to the 1:2 and 2:1 lines. BIAS, MFE, RMSE, and IOA represent the mean bias, the mean fractional error, the root mean square error, and the index of agreement. Panels (e), (f), (g), and (h) are the same as panels (a), (b), (c), and (d) but for Ångström exponents (AEs) in the wavelength 440–870 nm.
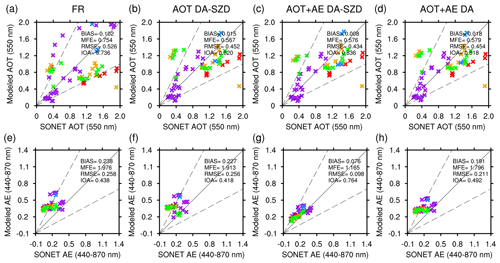
Figure 8Same as Fig. 7 but for Skynet Observation NETwork (SONET) hourly observations for independent validation. The crosses with different colors represent different SONET sites: Yanqihu (light blue), Beijing (purple), Jiaozuo (red), Songshan (orange), and Zhengzhou (green).
Time series of the simulated AOT and AE at AERONET and SONET sites for the four experiments are further given in Figs. 9 and 10, respectively. The BIAS and RMSE of simulated and observed AOT and AE over each site are given in Tables S2 and S3. It is found that the FR experiment can generally reproduce the temporal variations in the observed aerosol optical properties (especially AOT) over all sites, indicating the dust processes simulated by WRF-Chem are reasonable. The reasonable simulated dust processes demonstrate the covariance between the simulated dust emissions and aerosol optical properties is reliable for optimizing the dust emissions. Due to the FR experiment underestimating AOTs and overestimating AEs over both the dust source and downwind sites during 16–17 March 2021, the assimilation of only AOT observation leads to an increase in dust emissions in each bin except bin 4 over the Gobi Desert during 14–15 March 2021 (Table S1), and the additional AE observation leads to a significant decrease in the dust emission in bin 1 and an increase in the dust emission in bin 3. The latter induces the simulated AEs on 16 March to be comparable to the observed ones especially over the independent SONET sites named Songshan and Zhengzhou, and this proves that not only the simulated dust emissions but also their size distributions over the Gobi Desert in the AOT+AE DA-SZD experiment are optimized. The superiority of the adjustment of dust emission size distribution is further demonstrated by the limited effects of AE observation on the model in the AOT+AE DA experiment due to the uncertainty in dust size distribution not being considered. Due to the simulated AOTs during 20–23 March 2021 in the FR experiment being underestimated except on 21 March at the dust source site and overestimated at downwind sites, the assimilation of AOT leads to slightly decreasing dust emissions in bin 1, bin 2, bin 3, and bin 4 and significantly increasing the one in bin 5 (Table S1). This induces the increase in the total dust emissions in the Gobi Desert in Mongolia and decrease in the total dust emissions in the Gobi Desert in China (Fig. 5). Due to the simulated AEs during 20–23 March 2021 in the FR experiment being slightly underestimated except on 23 March in the dust source site and significantly overestimated in the downwind sites, the assimilation of additional AE induces the decrease in dust emissions in each bin.
4.3 Evaluation of simulated aerosol vertical extinctions
To further evaluate the dust emission optimization, the simulated aerosol extinction coefficients are compared with the independent CALIOP-observed ones in the three CALIPSO orbit paths (Fig. 11). Due to the AOT+AE DA-SZD experiment having the best performance among the three assimilation experiments, the results for the FR and AOT+AE DA-SZD experiments in the three CALIPSO orbit paths are given in Fig. 12. Two paths near the dust source region cross the westward pathway of dust transport at 19:18:09 UTC on 15 March (path A) and the eastward pathway of dust transport at 05:55:25 UTC on 16 March (path B), and one path is far away from the dust source region at 18:17:32 UTC on 16 March (path C) (Fig. S9). As shown in Fig. 12, the vertical aerosols in path A are dominated by dust from 1 to 12 km in altitude. The FR experiment can capture the observed aerosol vertical patterns, whereas it significantly underestimates the aerosol extinction coefficients near the surface. The AOT+AE DA-SZD experiment reduces the underestimation and presents a more reasonable magnitude of aerosol extinction coefficients with values higher than 1 km−1 around the surface from 35 to 41° N and 0.1 km−1 from 2 to 4 km around 40° N. This indicates that the assimilation of AOT and AE observations can better reproduce the features of aerosol vertical variations during dust transportation near the dust source region. In addition, it should be noted that the improvements in the aerosol extinctions with posterior dust emissions on 15 March benefit from assimilating the time-lagged observations from downwind areas. In path B, the dust transported from west to east is mainly concentrated at 4 km and the FR experiment generally reproduces this dust vertical structure with significant underestimations. The AOT+AE DA-SZD experiment can improve the underestimations, and the simulated aerosol extinctions are further consistent with the observed ones. CALIOP-observed aerosol extinctions from 6 to 7 km around 41° N are higher than 1 km−1, while the simulated aerosol extinctions for the FR experiment are around 0.3 km−1. The AOT+AE DA-SZD experiment successfully reproduces the magnitude and variations in aerosol extinctions around 41° N. The vertical aerosols in path C are also dominated by dust in all heights. Although the FR experiment successfully reproduces the vertical structure of double dust layers observed by CALIOP between 33 and 43° N, the aerosol extinction coefficients are significantly underestimated around 4 km. The AOT+AE DA-SZD experiment increases the transported dust, diminishing the underestimation of aerosol extinction coefficients. The aerosol extinction coefficients in the AOT+AE DA-SZD experiment are more comparable to the CALIOP observations. This proves that the assimilation of AOT and AE observations can also better reproduce the features of dust vertical distributions in areas far away from the dust source region.
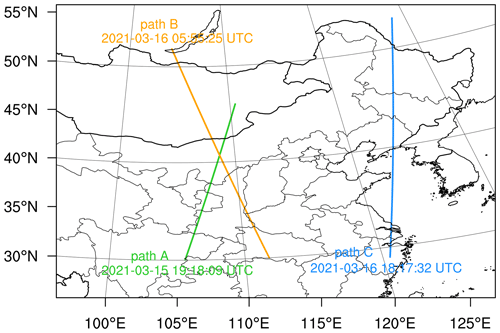
Figure 11The Cloud-Aerosol Lidar and Infrared Pathfinder Satellite Observations (CALIPSO) three orbit paths during 14–23 March 2021.
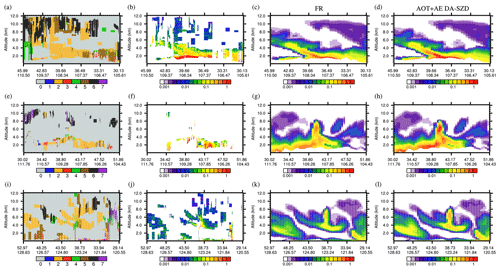
Figure 12(a) Time–height cross section of CALIPSO-derived vertical aerosol subtypes in path A. The Cloud-Aerosol Lidar with Orthogonal Polarization (CALIOP)-observed aerosol extinction coefficients at 532 nm (km−1) (b) and the simulated ones at 550 nm in the FR (c) and AOT+AE DA-SZD (d) experiments. (e–h) Same as (a)–(d) but for path B. (i–l) Same as panels (a)–(d) but for path C.
To investigate the additional benefit of aerosol size information in dust emission optimization, the Aerosol Robotic Network (AERONET) ground-based aerosol optical thickness (AOT) and Ångström exponent (AE) time-lagged observations are assimilated during the severe east Asian dust storm outbreak in March 2021 in this study. The ensemble Kalman smoother (EnKS) assimilation framework (Dai et al., 2019) with the Weather Research and Forecasting model coupled with Chemistry (WRF-Chem) version 4.4 is applied for dust emission optimization.
Three assimilation experiments are conducted during 14–23 March 2021. The first one, named AOT DA-SZD, only assimilates AERONET AOT observations with perturbation of the dust emission and size distribution; the second one, named AOT+AE DA-SZD, conducts assimilation in the same way as the first one, except that it assimilates both AERONET AOT and AE observations; and the third one, named AOT+AE DA, is conducted in the same way as the second one, except that its ensemble members are generated by perturbing the dust emissions in each bin with same perturbation factor. The baseline experiment, FR, without assimilation is used for comparison.
Our results demonstrate that the additional assimilation of AE observations with consideration of the dust emission size distribution uncertainty is helpful to the optimization of dust emissions through better adjustment of dust size distribution. AOT assimilation can only optimize the dust emission flux depending on the covariance between time-lagged AOT observations and the simulated total dust emissions, while the additional inclusion of AE assimilation can optimize the size distribution of dust emissions and the associated total flux depending on the covariance between time-lagged AE observations and the simulated dust emissions in each bin.
All three assimilation experiments can optimize the dust emissions to better reproduce the assimilated AERONET and independent SONET AOT and AE observations. Although the assimilation of AOT observations can only optimize the dust emission but not the dust emission size distribution, the assimilation with the additional of AE observations can reduce not only the AOT BIAS and RMSE of the FR experiment by 92 % and 17 % but also the AE BIAS and RMSE of the FR experiment by 68 % and 62 % through optimizing both the dust emission size distribution and the associated total flux. The temporal variation in simulated AOT and AE can also be improved through assimilating additional AE information. The assimilation of AOT and AE also makes the magnitude and variations in aerosol vertical extinctions more comparable to independent Cloud-Aerosol Lidar with Orthogonal Polarization (CALIOP) observations in both westward and eastward pathways of dust transport.
This study emphasizes the additional AE assimilation is useful in dust emission optimization. To further explore the roles of the assimilated observations in dust emission optimization and the accurate simulation of the dust life cycle, sensitivity experiments should be conducted to quantify the influences of observation uncertainties and frequencies on the assimilation efficiency. The assimilation parameters, such as spatial and temporal localization length, are also important for dust emission optimization. In addition, the coarse-mode AERONET AOT from the spectral deconvolution algorithm (SDA) is also useful for dust emission optimization since all fine-mode aerosols are truncated and only dust/sea salt remains.
All data used in this study are freely available from public data repositories. AERONET products are available from the AERONET website https://aeronet.gsfc.nasa.gov/new_web/download_all_v3_aod.html (AERONET, 2024). SONET products are available at http://www.sonet.ac.cn/en/index.php?m=content&c=index&a=show&catid=356&id=1443 (SONET, 2024). CALIOP products are available from the Atmospheric Science Data Center at NASA LaRC https://asdc.larc.nasa.gov/project/CALIPSO (NASA, 2024). The WRF-Chem and LETKF source codes are available with the terms and conditions at https://www2.mmm.ucar.edu/wrf/users/download/get_source.html (WRF Development and Support Team, 2021) and https://github.com/takemasa-miyoshi/letkf (Miyoshi, 2021).
The supplement related to this article is available online at: https://doi.org/10.5194/acp-24-12643-2024-supplement.
YC conceived the study and designed the dust storm data assimilation. YC and TD performed the control and assimilation tests and carried out the data analysis. JC, DG, JJ, TN, and GS provided useful comments on the paper. YC prepared the manuscript with contributions from TD and all others co-authors.
The contact author has declared that none of the authors has any competing interests.
Publisher’s note: Copernicus Publications remains neutral with regard to jurisdictional claims made in the text, published maps, institutional affiliations, or any other geographical representation in this paper. While Copernicus Publications makes every effort to include appropriate place names, the final responsibility lies with the authors. Regarding the maps used in this paper, please note that Figs. 1 and 3–6 contain disputed territories.
Model simulations were performed using EarthLab supercomputers at the Institute of Atmospheric Physics (IAP), China, and NEC SX-Aurora TSUBASA supercomputers at the National Institute for Environmental Studies (NIES), Japan. We extend our thanks to the relevant researchers who provided AERONET, SONET, and CALIPSO observations. We would also like to thank the anonymous reviewers for their valuable comments and suggestions that improved the manuscript.
This research has been supported by the National Natural Science Foundation of China (grant nos. 42175186, 42305088, and 42375190); the China Postdoctoral Science Foundation (grant no. 2022M723091); the Jiangsu Provincial Key Laboratory of Atmospheric Environment Monitoring and Pollution Control, Jiangsu Provincial Department of Science and Technology (grant no. KHK2206); the China Meteorological Administration (grant no. 2022B05); the Youth Innovation Promotion Association of the Chinese Academy of Sciences (grant no. 2020078); the Chinese Academy of Sciences (grant no. 134111KYSB20200006); and the National Key Scientific and Technological Infrastructure project “Earth System Numerical Simulation Facility” (EarthLab).
This paper was edited by Pablo Saide and reviewed by Athanasios Tsikerdekis and two anonymous referees.
AERONET: AERONET ground-based Level 2.0 Version 3, AERONET [data set], https://aeronet.gsfc.nasa.gov/new_web/download_all_v3_aod.html, last access: 8 July 2024.
Barnard, J. C., Fast, J. D., Paredes-Miranda, G., Arnott, W. P., and Laskin, A.: Technical Note: Evaluation of the WRF-Chem “Aerosol Chemical to Aerosol Optical Properties” Module using data from the MILAGRO campaign, Atmos. Chem. Phys., 10, 7325–7340, https://doi.org/10.5194/acp-10-7325-2010, 2010.
Boylan, J. W. and Russell, A. G.: PM and light extinction model performance metrics, goals, and criteria for threedimensional air quality models, Atmos. Environ., 40, 4946–4959, https://doi.org/10.1016/j.atmosenv.2005.09.087, 2006.
Chen, C., Dubovik, O., Henze, D. K., Lapyonak, T., Chin, M., Ducos, F., Litvinov, P., Huang, X., and Li, L.: Retrieval of desert dust and carbonaceous aerosol emissions over Africa from POLDER/PARASOL products generated by the GRASP algorithm, Atmos. Chem. Phys., 18, 12551–12580, https://doi.org/10.5194/acp-18-12551-2018, 2018.
Chen, C., Dubovik, O., Henze, D. K., Chin, M., Lapyonok, T., Schuster, G. L., Ducos, F., Fuertes, D., Litvinov, P., Li, L., Lopatin, A., Hu, Q., and Torres, B.: Constraining global aerosol emissions using POLDER/PARASOL satellite remote sensing observations, Atmos. Chem. Phys., 19, 14585–14606, https://doi.org/10.5194/acp-19-14585-2019, 2019.
Chen, F., Chen, S., Zhang, X., Chen, J., Wang, X., Gowan, E. J., Qiang, M., Dong, G., Wang, Z., Li, Y., Xu, Q., Xu, Y., Smol, J. P., and Liu, J.: Asian dust-storm activity dominated by Chinese dynasty changes since 2000 BP, Nat. Commun., 11, 992, https://doi.org/10.1038/s41467-020-14765-4, 2020.
Cheng, Y., Dai, T., Goto, D., Schutgens, N. A. J., Shi, G., and Nakajima, T.: Investigating the assimilation of CALIPSO global aerosol vertical observations using a four-dimensional ensemble Kalman filter, Atmos. Chem. Phys., 19, 13445–13467, https://doi.org/10.5194/acp-19-13445-2019, 2019.
Dai, T., Cheng, Y., Zhang, P., Shi, G., Sekiguchi, M., Suzuki, K., Goto, D., and Nakajima, T.: Impacts of meteorological nudging on the global dust cycle simulated by NICAM coupled with an aerosol model, Atmos. Environ., 190, 99–115, https://doi.org/10.1016/j.atmosenv.2018.07.016, 2018.
Dai, T., Cheng, Y., Goto, D., Schutgens, N. A. J., Kikuchi, M., Yoshida, Y., Shi, G., and Nakajima, T.: Inverting the East Asian dust emission fluxes using the ensemble Kalman smoother and Himawari-8 AODs: A Case Study with WRF-Chem v3.5.1, Atmosphere, 10, 543, https://doi.org/10.3390/atmos10090543, 2019.
Di Biagio, C., Formenti, P., Balkanski, Y., Caponi, L., Cazaunau, M., Pangui, E., Journet, E., Nowak, S., Andreae, M. O., Kandler, K., Saeed, T., Piketh, S., Seibert, D., Williams, E., and Doussin, J.-F.: Complex refractive indices and single-scattering albedo of global dust aerosols in the shortwave spectrum and relationship to size and iron content, Atmos. Chem. Phys., 19, 15503–15531, https://doi.org/10.5194/acp-19-15503-2019, 2019.
Di Tomaso, E., Schutgens, N. A. J., Jorba, O., and Pérez García-Pando, C.: Assimilation of MODIS Dark Target and Deep Blue observations in the dust aerosol component of NMMB-MONARCH version 1.0, Geosci. Model Dev., 10, 1107–1129, https://doi.org/10.5194/gmd-10-1107-2017, 2017.
Escribano, J., Boucher, O., Chevallier, F., and Huneeus, N.: Subregional inversion of North African dust sources, J. Geophys. Res., 121, 8549–8566, https://doi.org/10.1002/2016JD025020, 2016.
Gaspari, G. and Cohn, S. E. Construction of correlation functions in two and three dimensions, Q. J. Roy. Meteor. Soc., 125, 723–757, https://doi.org/10.1002/qj.49712555417, 1999.
Ghan, S. J. and Zaveri, R. A.: Parameterization of optical properties for hydrated internally mixed aerosol, J. Geophys. Res., 112, D10201, https://doi.org/10.1029/2006JD007927, 2007.
Gliß, J., Mortier, A., Schulz, M., Andrews, E., Balkanski, Y., Bauer, S. E., Benedictow, A. M. K., Bian, H., Checa-Garcia, R., Chin, M., Ginoux, P., Griesfeller, J. J., Heckel, A., Kipling, Z., Kirkevåg, A., Kokkola, H., Laj, P., Le Sager, P., Lund, M. T., Lund Myhre, C., Matsui, H., Myhre, G., Neubauer, D., van Noije, T., North, P., Olivié, D. J. L., Rémy, S., Sogacheva, L., Takemura, T., Tsigaridis, K., and Tsyro, S. G.: AeroCom phase III multi-model evaluation of the aerosol life cycle and optical properties using ground- and space-based remote sensing as well as surface in situ observations, Atmos. Chem. Phys., 21, 87–128, https://doi.org/10.5194/acp-21-87-2021, 2021.
Giles, D. M., Sinyuk, A., Sorokin, M. G., Schafer, J. S., Smirnov, A., Slutsker, I., Eck, T. F., Holben, B. N., Lewis, J. R., Campbell, J. R., Welton, E. J., Korkin, S. V., and Lyapustin, A. I.: Advancements in the Aerosol Robotic Network (AERONET) Version 3 database – automated near-real-time quality control algorithm with improved cloud screening for Sun photometer aerosol optical depth (AOD) measurements, Atmos. Meas. Tech., 12, 169–209, https://doi.org/10.5194/amt-12-169-2019, 2019.
Han, Y., Wang, T., Tang, J., Wang, C., Jian, B., Huang, Z., and Huang, J.: New insights into the Asian dust cycle derived from CALIPSO lidar measurements, Remote Sens. Environ., 272, 112906, https://doi.org/10.1016/j.rse.2022.112906, 2022.
Holben, B. N., Eck, T. F., Slutsker, I., Tanré, D., Buis, J. P., Setzer, A., Vermote, E., Reagan, J. A., Kaufman, Y. J., Nakajima, T., Lavenu, F., Jankowiak, I., and Smirnov, A.: AERONET – A Federated Instrument Network and Data Archive for Aerosol Characterization, Remote Sens. Environ., 66, 1–16, https://doi.org/10.1016/S0034-4257(98)00031-5, 1998.
Huang, J., Lin, B., Minnis, P., Wang, T., Wang, X., Hu, Y., Yi, Y., and Ayers, J. K.: Satellite-based assessment of possible dust aerosols semi-direct effect on cloud water path over East Asia, Geophys. Res. Lett., 33, L19802, https://doi.org/10.1029/2006GL026561, 2006.
Huang, Y., Kok, J. F., Kandler, K., Lindqvist, H., Nousiainen, T., Sakai, T., Adebiyi, A., and Jokinen, O.: Climate Models and Remote Sensing Retrievals Neglect Substantial Desert Dust Asphericity, Geophys. Res. Lett., 47, e2019GL086592, https://doi.org/10.1029/2019GL086592, 2020.
Huneeus, N., Schulz, M., Balkanski, Y., Griesfeller, J., Prospero, J., Kinne, S., Bauer, S., Boucher, O., Chin, M., Dentener, F., Diehl, T., Easter, R., Fillmore, D., Ghan, S., Ginoux, P., Grini, A., Horowitz, L., Koch, D., Krol, M. C., Landing, W., Liu, X., Mahowald, N., Miller, R., Morcrette, J.-J., Myhre, G., Penner, J., Perlwitz, J., Stier, P., Takemura, T., and Zender, C. S.: Global dust model intercomparison in AeroCom phase I, Atmos. Chem. Phys., 11, 7781–7816, https://doi.org/10.5194/acp-11-7781-2011, 2011.
Hunt, B. R., Kostelich, E. J., and Szunyogh, I.: Efficient data assimilation for spatiotemporal chaos: A local ensemble transform Kalman filter, Physica D, 230, 112–126, https://doi.org/10.1016/j.physd.2006.11.008, 2007.
Jin, J., Segers, A., Heemink, A., Yoshida, M., Han, W., and Lin, H.: Dust Emission Inversion Using Himawari-8 AODs Over East Asia: An Extreme Dust Event in May 2017, J. Adv. Model. Earth Sy., 11, 446–467, https://doi.org/10.1029/2018MS001491, 2019.
Kang, S., Zhang, Q., Qian, Y., Ji, Z., Li, C., Cong, Z., Zhang, Y., Guo, J., Du, W., Huang, J., You, Q., Panday, A. K., Rupakheti, M., Chen, D., Gustafsson, Ö., Thiemens, M. H., and Qin, D.: Linking atmospheric pollution to cryospheric change in the Third Pole region: current progress and future prospects, Natl. Sci. Rev., 6, 796–809, https://doi.org/10.1093/nsr/nwz031, 2019.
Kok, J. F., Ward, D. S., Mahowald, N. M., and Evan, A. T.: Global and regional importance of the direct dust-climate feedback, Nat. Commun., 9, 241, https://doi.org/10.1038/s41467-017-02620-y, 2018.
Kok, J. F., Adebiyi, A. A., Albani, S., Balkanski, Y., Checa-Garcia, R., Chin, M., Colarco, P. R., Hamilton, D. S., Huang, Y., Ito, A., Klose, M., Li, L., Mahowald, N. M., Miller, R. L., Obiso, V., Pérez García-Pando, C., Rocha-Lima, A., and Wan, J. S.: Contribution of the world's main dust source regions to the global cycle of desert dust, Atmos. Chem. Phys., 21, 8169–8193, https://doi.org/10.5194/acp-21-8169-2021, 2021.
Li, Z. Q., Xu, H., Li, K. T., Li, D. H., Xie, Y. S., Li, L., Zhang, Y., Gu, X. F., Zhao, W., Tian, Q. J., Deng, R. R., Su, X. L., Huang, B., Qiao, Y. L., Cui, W. Y., Hu, Y., Gong, C. L., Wang, Y. Q., Wang, X. F., Wang, J. P., Du, W. B., Pan, Z. Q., Li, Z. Z., and Bu, D.: Comprehensive Study of Optical, Physical, Chemical, and Radiative Properties of Total Columnar Atmospheric Aerosols over China: An Overview of Sun–Sky Radiometer Observation Network (SONET) Measurements, B. Am. Meteorol. Soc., 99, 739–755, https://doi.org/10.1175/BAMS-D-17-0133.1, 2018.
Liu, Y., Zhu, Q., Hua, S., Alam, K., Dai, T., and Cheng, Y.: Tibetan Plateau driven impact of Taklimakan dust on northern rainfall, Atmos. Environ., 234, 117583, https://doi.org/10.1016/j.atmosenv.2020.117583, 2020.
Miyoshi, T.: LETKF source codes, GitHub [code], https://github.com/takemasa-miyoshi/letkf (last access: 8 July 2024), 2021.
Miyoshi, T., Yamane, S., and Enomoto, T.: Localizing the Error Covariance by Physical Distances within a Local Ensemble Transform Kalman Filter (LETKF), SOLA, 3, 89–92, https://doi.org/10.2151/sola.2007-023, 2007.
NASA: CALIPSO Data Collection, NASA [data set], https://asdc.larc.nasa.gov/project/CALIPSO, last access: 8 July 2024.
Omar, A. H., Winker, D. M., Kittaka, C., Vaughan, M. A., Liu, Z., Hu, Y., Trepte, C. R., Rogers, R. R., Ferrare, R. A., Lee, K.-P., Kuehn, R. E., and Hostetler, C. A.: The CALIPSO Automated Aerosol Classi?cation and Lidar Ratio Selection Algorithm, J. Atmos. Ocean. Tech., 26, 1994–2014, https://doi.org/10.1175/2009JTECHA1231.1, 2009.
Satake, S., Uno, I., Takemura, T., Carmichael, G. R., Tang, Y., Streets, D., Sugimoto, N., Shimizu, A., Uematsu, M., Han, J., and Ohta, S.: Characteristics of Asian aerosol transport simulated with a regional-scale chemical transport model during the ACE-Asia observation, J. Geophys. Res., 109, D19S22, https://doi.org/10.1029/2003JD003997, 2004.
Schutgens, N., Nakata, M., and Nakajima, T.: Estimating Aerosol Emissions by Assimilating Remote Sensing Observations into a Global Transport Model, Remote Sens., 4, 3528–3543, https://doi.org/10.3390/rs4113528, 2012.
Schutgens, N. A. J., Miyoshi, T., Takemura, T., and Nakajima, T.: Applying an ensemble Kalman filter to the assimilation of AERONET observations in a global aerosol transport model, Atmos. Chem. Phys., 10, 2561–2576, https://doi.org/10.5194/acp-10-2561-2010, 2010.
Shao, Y., Wyrwoll, K.-H., Chappell, A., Huang, J., Lin, Z., McTainsh, G. H., Mikami, M., Tanaka, T. Y., Wang, X., and Yoon, S.: Dust cycle: An emerging core theme in Earth system science, Aeolian Res., 2, 181–204, https://doi.org/10.1016/j.aeolia.2011.02.001, 2011.
Sekiyama, T. T., Tanaka, T. Y., Shimizu, A., and Miyoshi, T.: Data assimilation of CALIPSO aerosol observations, Atmos. Chem. Phys., 10, 39–49, https://doi.org/10.5194/acp-10-39-2010, 2010.
SONET: SONET ground-based Level 2.0, SONET [data set], http://www.sonet.ac.cn/en/index.php?m=content&c=index&a=show&catid=356&id=1443, last access: 8 July 2024.
Su, L. and Fung, J. C. H.: Sensitivities of WRF-Chem to dust emission schemes and land surface properties in simulating dust cycles during springtime over East Asia, J. Geophys. Res., 120, 11215–11230, https://doi.org/10.1002/2015JD023446, 2015.
Textor, C., Schulz, M., Guibert, S., Kinne, S., Balkanski, Y., Bauer, S., Berntsen, T., Berglen, T., Boucher, O., Chin, M., Dentener, F., Diehl, T., Easter, R., Feichter, H., Fillmore, D., Ghan, S., Ginoux, P., Gong, S., Grini, A., Hendricks, J., Horowitz, L., Huang, P., Isaksen, I., Iversen, I., Kloster, S., Koch, D., Kirkevåg, A., Kristjansson, J. E., Krol, M., Lauer, A., Lamarque, J. F., Liu, X., Montanaro, V., Myhre, G., Penner, J., Pitari, G., Reddy, S., Seland, Ø., Stier, P., Takemura, T., and Tie, X.: Analysis and quantification of the diversities of aerosol life cycles within AeroCom, Atmos. Chem. Phys., 6, 1777–1813, https://doi.org/10.5194/acp-6-1777-2006, 2006.
Tsikerdekis, A., Schutgens, N. A. J., and Hasekamp, O. P.: Assimilating aerosol optical properties related to size and absorption from POLDER/PARASOL with an ensemble data assimilation system, Atmos. Chem. Phys., 21, 2637–2674, https://doi.org/10.5194/acp-21-2637-2021, 2021.
Tsikerdekis, A., Schutgens, N. A. J., Fu, G., and Hasekamp, O. P.: Estimating aerosol emission from SPEXone on the NASA PACE mission using an ensemble Kalman smoother: observing system simulation experiments (OSSEs), Geosci. Model Dev., 15, 3253–3279, https://doi.org/10.5194/gmd-15-3253-2022, 2022.
Tsikerdekis, A., Hasekamp, O. P., Schutgens, N. A. J., and Zhong, Q.: Assimilation of POLDER observations to estimate aerosol emissions, Atmos. Chem. Phys., 23, 9495–9524, https://doi.org/10.5194/acp-23-9495-2023, 2023.
Ukhov, A., Ahmadov, R., Grell, G., and Stenchikov, G.: Improving dust simulations in WRF-Chem v4.1.3 coupled with the GOCART aerosol module, Geosci. Model Dev., 14, 473–493, https://doi.org/10.5194/gmd-14-473-2021, 2021.
Uno, I., Wang, Z., Chiba, M., Chun, Y. S., Gong, S. L., Hara, Y., and Jung, E.: Dust model intercomparison (DMIP) study over Asia: Overview, J. Geophys. Res., 111, D12213, https://doi.org/10.1029/2005JD006575, 2006.
Wang, K. C., Dickinson, R. E., Wild, M., and Liang, S.: Atmospheric impacts on climatic variability of surface incident solar radiation, Atmos. Chem. Phys., 12, 9581–9592, https://doi.org/10.5194/acp-12-9581-2012, 2012.
Wang, T., Han, Y., Huang, J., Sun, M., Jian, B., Huang, Z., and Yan, H.: Climatology of dust-Forced radiative heating over the Tibetan Plateau and its surroundings, J. Geophys. Res.-Atmos., 125, e2020JD032942, https://doi.org/10.1029/2020JD032942, 2020.
Willmott, C. J., Robeson, S. M., and Matsuura, K.: A refined index of model performance, Int. J. Climatol., 32, 2088–2094, 10.1002/joc.2419, 2012.
Winker, D. M., Hunt, W. H., and McGill, M. J.: Initial performance assessment of CALIOP, Geophys. Res. Lett., 34, L19803, https://doi.org/10.1029/2007GL030135, 2007.
WRF Development and Support Team: WRF source codes, GitHub [code], https://www2.mmm.ucar.edu/wrf/users/download/get_source.html (last access: 8 July 2024), 2021.
Wu, C., Liu, X., Lin, Z., Rahimi-Esfarjani, S. R., and Lu, Z.: Impacts of absorbing aerosol deposition on snowpack and hydrologic cycle in the Rocky Mountain region based on variable-resolution CESM (VR-CESM) simulations, Atmos. Chem. Phys., 18, 511–533, https://doi.org/10.5194/acp-18-511-201810.5194/acp-18-511-2018, 2018.
Wu, C., Lin, Z., Shao, Y., Liu, X., and Li, Y.: Drivers of recent decline in dust activity over East Asia, Nat. Commun., 13, 7105, https://doi.org/10.1038/s41467-022-34823-3, 2022.
Yumimoto, K. and Takemura, T.: Long-term inverse modeling of Asian dust: Interannual variations of its emission, transport, deposition, and radiative forcing, J. Geophys. Res., 120, 1582–1607, https://doi.org/10.1002/2014JD022390, 2015.
Yumimoto, K., Uno, I., Sugimoto, N., Shimizu, A., Liu, Z., and Winker, D. M.: Adjoint inversion modeling of Asian dust emission using lidar observations, Atmos. Chem. Phys., 8, 2869–2884, https://doi.org/10.5194/acp-8-2869-2008, 2008.
Yumimoto, K., Tanaka, T. Y., Oshima, N., and Maki, T.: JRAero: the Japanese Reanalysis for Aerosol v1.0, Geosci. Model Dev., 10, 3225–3253, https://doi.org/10.5194/gmd-10-3225-2017, 2017.


