the Creative Commons Attribution 4.0 License.
the Creative Commons Attribution 4.0 License.
 | 29 Jan 2024
Radiative effect of thin cirrus clouds in the extratropical lowermost stratosphere and tropopause region
Rolf Müller
Alexandru Rap
Cirrus clouds play an important role in the radiation budget of the Earth; nonetheless, the radiative effect of ultra-thin cirrus clouds in the tropopause region and in the lowermost stratosphere remains poorly constrained. These clouds have a small vertical extent and optical depth and are frequently neither observed even by sensitive sensors nor considered in climate model simulations. In addition, their short-wave (cooling) and long-wave (warming) radiative effects are often in approximate balance, and their net effect strongly depends on the shape and size of the cirrus particles. However, the CRyogenic Infrared Spectrometers and Telescopes for the Atmosphere instrument (CRISTA-2) allows ultra-thin cirrus clouds to be detected. Here we use CRISTA-2 observations in summer 1997 in the Northern Hemisphere midlatitudes together with the Suite Of Community RAdiative Transfer codes based on Edwards and Slingo (SOCRATES) radiative transfer model to calculate the radiative effect of observed ultra-thin cirrus. Using sensitivity simulations with different ice effective particle size and shape, we provide an estimate of the uncertainty in the radiative effect of ultra-thin cirrus in the extratropical lowermost stratosphere and tropopause region during summer and – by extrapolation of the summer results – for winter. Cloud top height and ice water content are based on CRISTA-2 measurements, while the cloud vertical thickness was predefined to be 0.5 or 2 km. Our results indicate that if the ice crystals of these thin cirrus clouds are assumed to be spherical, their net cloud radiative effect is generally positive (warming). In contrast, assuming aggregates or a hexagonal shape, their net radiative effect is generally negative (cooling) during summer months and very likely positive (warming) during winter. The radiative effect is in the order of ±(0.1–0.01) W m−2 for a realistic global cloud coverage of 10 %, similar to the magnitude of the contrail cirrus radiative forcing (of ∼ 0.1 W m−2). The radiative effect is also dependent on the cloud vertical extent and consequently the optically thickness and effective radius of the particle size distribution (e.g. effective radius increase from 5 to 30 µm results in a factor ∼ 6 smaller long- and short-wave effects, respectively). The properties of ultra-thin cirrus clouds in the lowermost stratosphere and tropopause region need to be better observed, and ultra-thin cirrus clouds need to be evaluated in climate model simulations.
- Article
(4010 KB) - Full-text XML
- BibTeX
- EndNote


Cirrus clouds are an important contributor to the radiation budget of the Earth (e.g. Liou, 1986; Heymsfield et al., 2017). Despite recent progress in understanding cloud formation processes, aerosol–cloud interactions, and cirrus cloud radiative effects (Forster et al., 2021), uncertainties for climate predictions are still large. From several positive feedbacks induced by doubling of CO2, the cloud feedback has the largest spread between different general circulation models (GCMs) and thus is the most uncertain (Vial et al., 2013; Boucher et al., 2013; Sherwood et al., 2020).
The classification of different cirrus cloud classes with respect to optical thickness (τ) has been defined by Sassen and Cho (1992) and is based on lidar observations at visible wavelengths, where an optically thick cloud is defined for τ>3, opaque cirrostratus for , transparent or thin cirrus for , and subvisible cirrus (SVC) for τ<0.03. More recent observations with infrared limb sounders found optically even thinner cirrus clouds in the range in the tropopause region and partly significantly above the tropopause (Spang et al., 2002, 2008, 2015; Zou et al., 2020; Bartolome Garcia et al., 2021). These observations were obtained by space and airborne limb sounders. These clouds have been also detected by in situ particle measurements (Krämer et al., 2016) but are only observable to a moderate extent by space-borne lidars (Davis et al., 2010; Spang et al., 2015; Balmes and Fu, 2018). To better discriminate the optically extremely thin clouds from most of the cirrus defined above, these clouds are referred to in the following as ultra-thin cirrus (UTC), which is in line with the optical thickness definition (τ = 10−3 to 10−4) of the ultra-thin tropical tropopause cirrus (UTTC) (Peter et al., 2003) detected with airborne lidar and in situ particle measurements. The dehydration potential of UTTCs in the tropics was shown by Luo et al. (2003). Cirrus clouds in the tropopause region may have a general and significant imprint on the water vapour amount in the stratosphere and consequently via radiation effects of the stratospheric water vapour on the surface temperature (Riese et al., 2012).
Assuming UTCs at the tropopause (TP) to be a common cloud type, the question arises about the radiative effect of these clouds – cooling or warming. The imprint of UTCs on the radiative net effect of cirrus is not well constrained due to the difficulties of characterising microphysical as well as macrophysical quantities of UTCs. Hong et al. (2016) reported a detailed analysis of the ice cloud radiative effect over a wide range of optical thickness based on space-borne Cloud–Aerosol Lidar and Infrared Pathfinder Satellite Observations (CALIPSO) lidar and CloudSAT radar data. They computed the cloud radiative effect (CRE) of ice clouds for a global multiyear climatology of retrieved ice water content, effective radius, and extinction covering low-level optically thick to high-level thin cirrus clouds. For the 2008 period, they found that the warming effect (21.8 W m−2) induced by ice clouds trapping long-wave radiation exceeds their cooling effect (16.7 W m−2) caused by short-wave reflection, resulting in a net warming effect (5.1 W m−2) globally on the Earth–atmosphere system. The study does not include the optically thinnest cirrus clouds like the lower end of optical thickness of UTCs. These are hard to detect for the Cloud-Aerosol Lidar with Orthogonal Polarization (CALIOP) on CALIPSO and may be underestimated in the dataset.
Davis et al. (2010) showed the difficulties of observing optically very thin cirrus clouds around the tropopause with the CALIOPSO lidar in comparison to in situ particle measurements. The analysis suggests that a majority (> 50 %) of SVCs around the tropopause (τ<0.01) could be unaccounted for in studies using CALIPSO data. Consequently, Hong et al. (2016) show only data for τ>0.01.
A similar study by Matus and L'Ecuyer (2017) focuses not only on ice clouds but also on liquid, ice, multi-layer, and mixed-type clouds. Results of the global mean cloud radiative effects show a cooling effect only for ice, which is of comparable size to Hong et al. (2016) (3.4 W m−2). Balmes and Fu (2018) show that the difficulties for the detection of very thin cirrus clouds still exist in newer versions of the CALIOP cloud data products. They used ground-based Raman lidar measurements and found significant deficiencies in the occurrence frequency compared to CALIOP (global estimates +0.13 to +0.17).
A more recent analysis of stratospheric ice clouds (SICs) based on the CALIOP cloud product shows rather high occurrence frequencies (2 %–20 %) nearly all over the globe (Zou et al., 2020, 2022), with maxima in the tropics but local maxima at midlatitudes in the storm track regions, with a preference for the tropics but reasonable occurrence frequencies at midlatitudes and high latitudes (2 %–10 %). In addition, the CALIOP shows less SICs at midlatitudes than the Michelson Interferometer for Passive Atmospheric Sounding (MIPAS) on the Envisat satellite (infrared (IR)-limb sounder) if both datasets are normalised in the tropics (Zou et al., 2020). Cirrus cloud occurrence frequencies retrieved with the CRyogenic Infrared Spectrometers and Telescopes for the Atmosphere (CRISTA) instrument showed for the first time on a global scale significant numbers of cirrus occurrence at and above the tropopause (Spang et al., 2002, 2015) and present the IR limb sounder as one of the most sensitive measurements for the detection of cirrus clouds. Due to their better vertical resolution than MIPAS these data allow a better and more sophisticated quantification of the radiative effect of the proven optically thinnest cirrus clouds.
So far it is unacknowledged whether climate models would need to consider UTCs as a separate cirrus type. Some of the models show the capability to form optically and vertically thin clouds around the tropopause for relatively coarse GCM resolutions (e.g. Gasparini et al., 2018), fine-resolution cloud models (Gasparini et al., 2022), and global storm-resolving models (Nugent et al., 2022; Turbeville et al., 2022). The global radiative effect of these clouds is an open question, and the validation of cloud occurrence frequencies and cloud fraction compared with global measurements is still needed.
The present study is structured in the following way: Sect. 2 describes the instrument data and corresponding analyses and retrievals for setting up the most realistic optically thin cloud profiles in the tropopause region at midlatitudes and high latitudes. Section 3 presents radiative transfer calculations with the SOCRATES model and the results in context of the warming and cooling potential of the corresponding macro- and microphysical cirrus characteristics, followed by a discussion regarding limitations and uncertainties in the statistics as well as the estimation of the overall cloud radiation effect of the specific cirrus types.
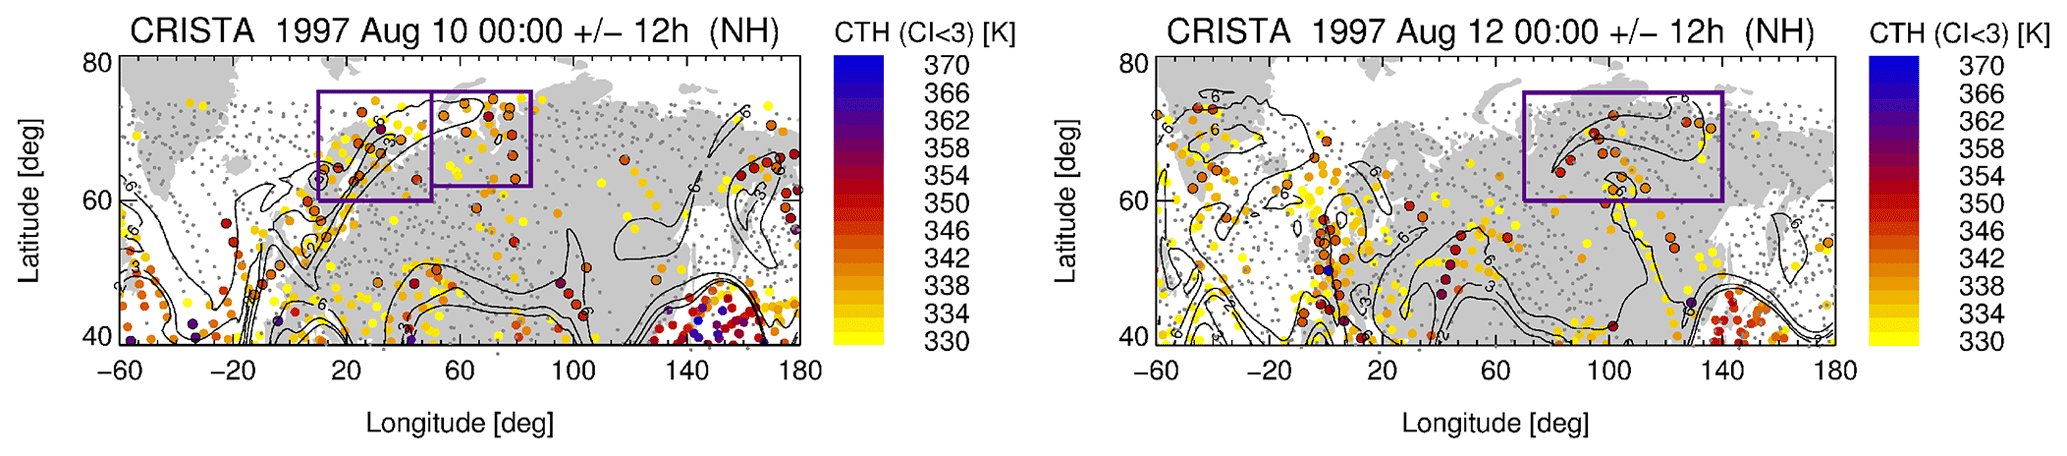
Figure 1Regions of interest with high-altitude cirrus cloud coverage for 10 and 12 August 1997 with high-altitude cirrus clouds highlighted in the purple boxes. Cloud top heights (CTHs) are given in potential temperature coordinates by coloured dotted symbols. Symbols with a black circle highlight CTHs above the lapse rate tropopause based on ERA5 reanalysis data. Grey dots represent non-cloudy observations. Black lines show contours of the potential vorticity (PV) at 350 K altitude for 2, 3, and 6 PV units, highlighting dynamical features like Rossby wave breaking events. The maps are adapted from Spang et al. (2015), where more details are presented.
2.1 CRISTA instrument
The CRISTA instrument was flown twice on space shuttle missions in 1994 and 1997 in a free-flyer configuration (Offermann et al., 1999; Grossmann et al., 2002). During both missions the instrument made around 8 d of nearly global measurements in the mid-IR (5–15 µm), with a still today unprecedented horizontal resolution for a limb sounder. This was possible by the implementation of three telescopes with crossing viewing directions, which results in a rather dense measurement net (Fig. 1) – even in the tropics (not presented). With an along-track sampling of 200/400 km and three viewing directions the typical gaps between the orbits in the Equator and midlatitude region are filled with measurements. Additionally, the pointing capability of the satellite allowed CRISTA-2 to extend the latitudinal coverage up to 74∘ N and S away from the more restricted coverage defined by the orbit inclination of 57∘ (fixed value for CRISTA-1 coverage). The rather good vertical resolution and sampling of 1.5 and 2.0 km helps cirrus clouds to be detected and the exact location with respect to the tropopause to be determined with quite a high accuracy (Spang et al., 2002, 2015).
The typical horizontal averaging along the line of sight of a limb sounder is in the order of 200–300 km, where the narrow field of view helps to keep this uncertainty in an adequate range, but this limits the accuracy of the retrieved limb ice water path (IWP) (see also Sect. 2.3 for details) from CRISTA.
The exact position of the cloud along the limb path (line of sight) remains unknown in limb measurements and is not retrievable. Simplified assumptions, e.g. a fixed horizontal cloud extent, are necessary to solve this issue in a retrieval process for target parameters like ice water content (IWC) or extinction (e.g. Wu et al., 2008; Spang et al., 2015; Bartolome Garcia et al., 2021).
Modified instruments like a limb imager allow substantial improvements in macroscopic cloud parameters with refined observation and retrieval techniques (e.g. 2D/3D and tomographic retrieval techniques, Ungermann et al., 2020). However, the CRISTA measurement capabilities are still unique for the limb IR technique. Extremely low cloud optical thicknesses are detectable, which results in a very high detection sensitivity for IWC (> 5 × 10⁻⁶ g m−3), vertical IWP (2 × 10⁻⁴ g m−2), and extinction (8 × 10⁻⁴–10−2 km−1) (Spang et al., 2012, 2015). The IWC value represents only of the CALIOP detection threshold (Avery et al., 2012), and the extinction threshold represents the upper limit of the measurement range of IR limb sounders. For extinctions > 10−2 km−1 the IR spectrum saturates and becomes optically thick in the limb, and the instrument loses sensitivity for optically thicker clouds.
2.2 SOCRATES radiation model
Radiative flux calculations have been performed using the offline version of the SOCRATES (Suite Of Community RAdiative Transfer codes based on Edwards and Slingo) radiative transfer model (Edwards and Slingo, 1996) with six bands in the short wave (SW), nine bands in the long wave (LW), and a delta-Eddington two-stream scattering solver at all wavelengths. This version has been used extensively in previous studies for calculating radiative effects from several atmospheric agents, including contrails (e.g. Myhre et al., 2009a; Rap et al., 2010), water vapour Myhre et al. (e.g. 2009b); Riese et al. (e.g. 2012); Kunz et al. (e.g. 2013), ozone Rap et al. (e.g. 2015a); Riese et al. (e.g. 2012), and aerosols (Rap et al., 2013, 2015b, 2018).
The model simulates ice cloud radiative effects using the Baran et al. (2014) parameterisation for ice cloud bulk optical properties. Radiative flux calculations are performed for specified ice cloud fraction, ice crystal effective radius, and mass mixing ratio. Our sensitivity simulations consider three different ice crystal shapes: spherical particles, hexagonal cylinders (Yang et al., 2000; Rodríguez De León et al., 2018), and aggregates based on 83 representative size distributions measured during the CEPEX campaign (Baran, 2003). The diurnal variations in the SW are simulated by calculating the daily average SW radiative effects based on 24 instantaneous values (i.e. model runs with a 1 h time resolution) using pre-calculated solar zenith angles (SZAs) at the profile location. Clear-sky conditions below the cloud base are assumed in the radiative calculations. For the sake of a simplified setup we ignored multi-layer clouds. This disregards a potentially reduced radiative input in the long wave from underlying cold cloud tops with lower temperatures than the surface. Changes in the albedo with time or geographical location are considered by an incorporated time-dependent 2D model of global albedo values.
2.3 Data preparation and model setup
In order to guide the model in a realistic cloud parameter space, the simulations were set up based on the CRISTA-2 measurements. IWC and extinction estimates as well as accurate cloud top heights with respect to the tropopause height are retrieved from the satellite and meteorological reanalysis datasets. ECMWF's fifth-generation reanalysis, ERA5 (Hersbach et al., 2020), is used for temperature, ozone, and specific humidity information at the profile location of CRISTA-2. Additionally, ERA5 pressure and geopotential height are applied to transform the vertical coordinate altitude for the satellite into pressure levels for the model. The derivation of lapse rate tropopause height and pressure from ERA5 follows the method of Hoffmann and Spang (2022).
The cloud detection capabilities and the high detection sensitivity for cirrus clouds by IR limb sounders have been demonstrated in various studies (Spang et al., 2002; Massie et al., 2010; Spang et al., 2015; Zou et al., 2020) and for various instruments. The detection method is based on a colour ratio of the emissions in a CO2 and minor ozone band at a wavenumber region around 792 cm−1 and an atmospheric window region at 830 cm−1. The so-called cloud index (Spang et al., 2004) is high (CI > 4) for optically thin and cloud-free conditions and shrinks to values close to 1 when becoming optically thick in the limb direction. We applied a cloud index threshold of 3 for cloud top height detection, a robust threshold, applied and evaluated in various studies (e.g. Spang et al., 2004, 2012). The method was developed originally for the CRISTA satellite instrument but has been successfully adopted due to its high efficiency to other IR limb sounders, like the Michelson Interferometer for Passive Atmospheric Sounding (MIPAS) instrument (Fischer et al., 2008) on the Envisat satellite (Spang et al., 2004, 2012; Zou et al., 2020) or more recently on airborne instruments (Spang et al., 2008; Bartolome Garcia et al., 2021).
The CRISTA observations were used to define the macro- and microphysical cloud parameter required for the SOCRATES run. In total 161 profiles with cirrus clouds around the tropopause were selected from the CRISTA-2 dataset in the regions highlighted in Fig. 1. These regions are restricted to latitudes > 60∘ N, which are not well covered by in situ instruments. The clouds formed under a specific dynamical situation where a Rossby wave breaking event over the Atlantic transported a high water vapour amount to high latitudes over Europe and triggered the ice cloud formation in regions with sufficiently cold temperatures, although the temperatures were usually too warm and additional temperature fluctuation by gravity waves would be necessary but were not resolved in the applied reanalysis data (Spang et al., 2015). To keep the number of modelled profiles for our study at a reasonable size as well as to choose well-characterised UTC events, we limited our analysis to 2 d and defined regions as highlighted in Fig. 1. This restriction allows sensitivity studies over various micro- and macrophysical parameters with the SOCRATES model.
Spang et al. (2012) showed that the cloud index value in the optically thin part of cloud measurement correlates well with the limb-integrated surface area density along the limb path (ADP) (equivalent to a limb IWP), and they generated lookup tables for various altitudes and latitudes. In addition, taking the effective radius of the particles into account (predefined for the model runs with 5, 10, and 30 µm), it is possible to estimate the mean IWC along the line of sight under the assumption of a tangent height layer homogeneously covered by the cirrus cloud. A constant path length through the cloud of 200 km has been applied. Usually, the path length depends on the tangent point altitude with respect to the real cloud top (not the detected instrument-based cloud top height; because of the limited vertical resolution and sampling of the instrument, the real cloud top height (CTH) can be lower or higher than the detected CTH). In addition, the cloud path length depends on the size of the field of view. Consequently, for a horizontally and/or vertically large cloud extent the limb cloud path can become extremely long (150 to 400 km for 1 to 3 km, respectively, at vertical resolution). In the current analysis, we are mainly interested in the cloud top region, up to 1–2 km below the cloud top, where the cloud is usually still optically thin, and an effective cloud path of ≃ 200 km is a reasonable assumption for the rather small field of view of 1.5 km of CRISTA (Spang et al., 2012, 2015). Finally, it needs to be highlighted that the cloud base height is difficult to retrieve for limb measurements. Obviously, for optically thick clouds in the limb (and nadir) direction, the cloud bottom is not visible. In addition, for optically thinner clouds, limited altitude coverage (hmin > cloud base height, CBH) makes it impossible to determine a CBH for many limb sounders (e.g. MIPAS, CRISTA) especially for vertically thick clouds. Consequently, for the sensitivity study with SOCRATES we decided to use predefined cloud thicknesses (Δz) of 0.5 and 2 km.
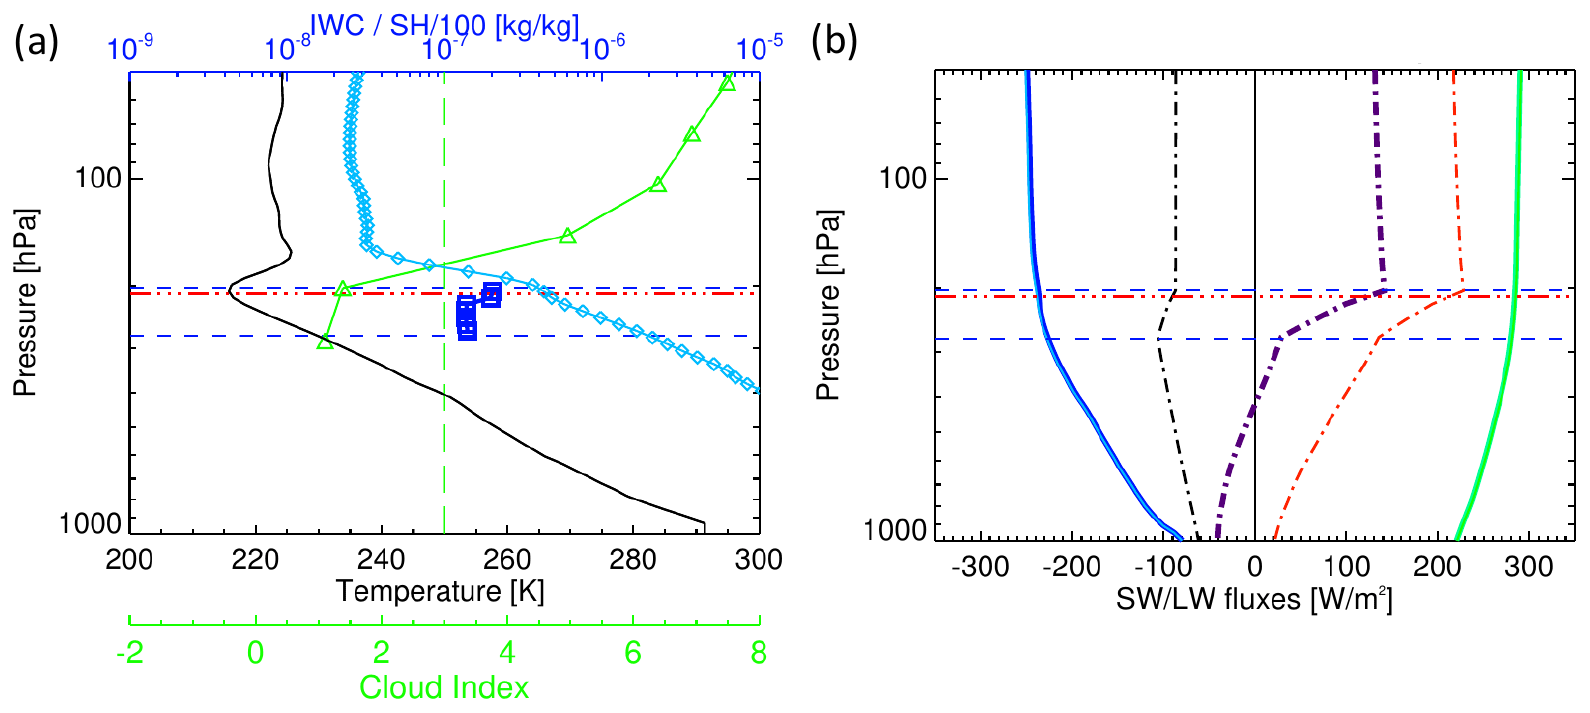
Figure 2(a) Input profiles for the SOCRATES model runs for 9 August 1997 13:47:13 GMT, 68.6∘ N and 23.2∘ E with temperature (black) and SH (light blue) from ERA5, IWC (blue) retrieved for CRISTA-2 (like SH presented in kg/kg), and additional information like the cloud index profile for cloud detection (CI, in green – dimensionless – and threshold value CI = 3 indicated by a dashed green line) as well as cloud top and base height (blue dashed line) and ERA5-based lapse rate tropopause (red dash–dotted line) (following Hoffmann and Spang, 2022). All information is interpolated on the SOCRATES pressure grid. (b) Output profiles for spherical particles of SW (blue) and LW (green) all-sky and clear-sky fluxes by the model. The difference between all-sky and clear-sky (SW in black and LW in red) and the sum of SW and LW (purple) are shown by dash–dotted lines and are scaled by a factor of 100. Top of atmosphere total radiative effect results for CRESW + CRELW = −0.86 + 2.14 = 1.28 W m−2.
For a newer and airborne-based IR limb sounder, Bartolome Garcia et al. (2021) showed the ability to retrieve CTH and CBH. The predefined thicknesses for the SOCRATES study are in the range of the maximum of the Δz probability density (∼ 600 m), and Δz = 2 km is in the maximum range of the UTC thickness detected by the airborne instrument, where roughly 5 %–6 % of the events show a Δz > 2 km.
The following procedure is applied for the interpolation of the CRISTA IWC to the SOCRATES grid. If more than one tangent height in a single profile is affected by clouds, then the values (IWC) are used for the linear interpolation on the vertical grid down to cloud bottom altitude. If the predefined cloud thickness overlaps the minimum altitude of the measurement with IWC > 0, then the model levels of the cloud are kept constant with the IWC of the lowest altitude.
In summary, IWC is estimated from the retrieved CTH and ADP or the ADP-equivalent limb IWP, where the effective radius and cloud thickness are predefined (0.5 and 2 km). The CRISTA measurements were taken in August 1997, which means under rather high solar zenith angle conditions with many hours of sunlight. For contrast we mirrored the CRISTA observation to February conditions to simulate contrapuntal winter-like events with respect to meteorological (ERA5) and solar conditions and used these for a rough estimate of the seasonal dependence of the CRE of UTCs (see Sect. 4).
Particle shape and roughness are very important parameters for correctly modelling the radiative effect of cirrus clouds (Yi et al., 2013, and references therein). Cirrus particles can have very complex particle shapes (for a review see Lawson et al., 2019). Various studies show less complexity for the cold cloud top regions, especially in the tropical tropopause region, where quasi-spherical particles with radii smaller than 50 µm seem to dominate the particle size distribution and where complex ice aggregates are less frequently observed (Woods et al., 2018). It is reasonable that cirrus at the tropopause and in the lower stratosphere (cloud top) at midlatitudes and high latitude also have less complex shapes than optically thick ice clouds in the free troposphere.
In this study we use the properties of three particle shapes: (a) aggregates, a specific composition of ice crystal habits (Baran, 2003; Baran et al., 2014, 2016; Yang et al., 2005); (b) spherical ice particles as a simplification for the in situ observed quasi-spherical particles in the cloud top region, which are typically best described by droxtals (Yang et al., 2003; Zhang et al., 2004) or Chebyshev particles (Rother et al., 2006; McFarquhar et al., 2002); and (c) hexagonal cylinders (or columns or prisms). Heymsfield and Platt (1984) reported that the ice crystals observed in high cirrus clouds (with cloud temperature < −50 ∘C) were predominantly hollow or solid hexagonal columns. As described for example by Rodríguez De León et al. (2018) the parameterised optical properties for the hexagonal ice particle are based on Baran et al. (2001) and Yang et al. (2000) over a parameterised bimodal particle size distribution from McFarquhar and Heymsfield (1997).
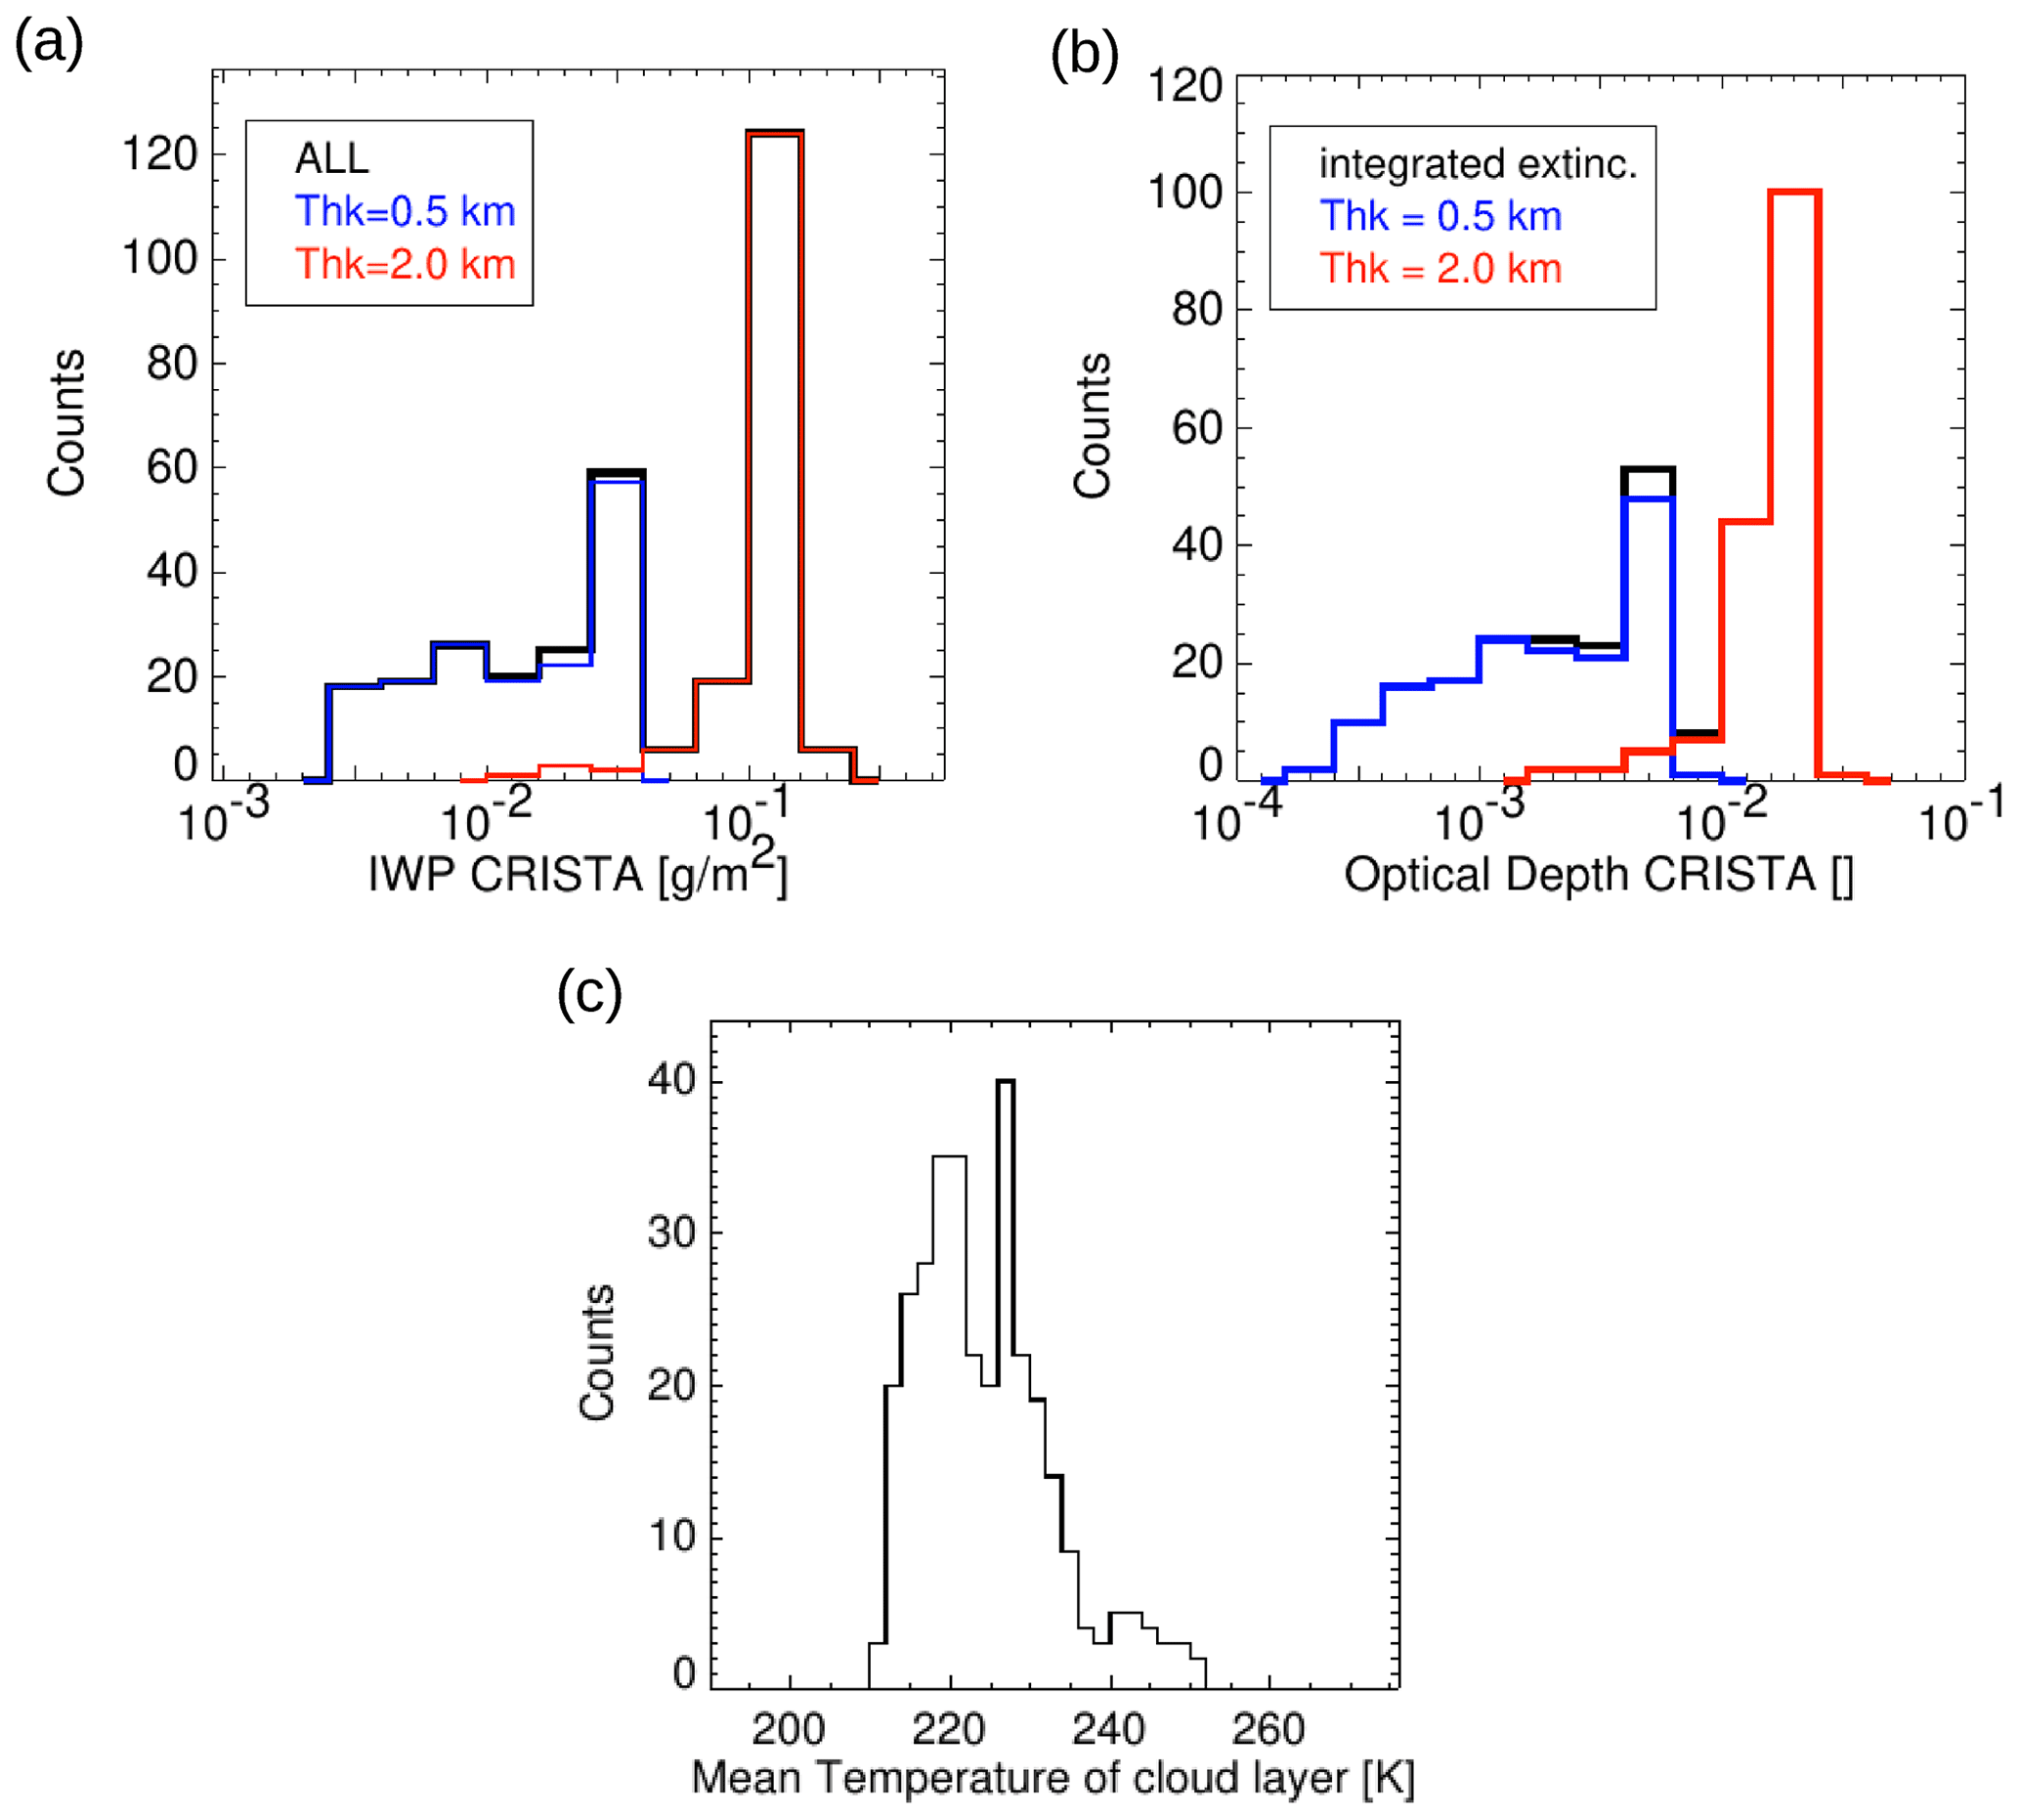
Figure 3CRISTA-based ice water path (a) and optical depth (b) distribution applied to the SOCRATES runs for Δz =0.5 km (blue) and Δz = 2.0 km (red) and all together (black). (c) PDF of the mean cloud temperature used in the study for August conditions (ERA5 1997 data).
Cloud optical depth (τ) is an important parameter when investigating the cooling or warming potential of cirrus clouds (e.g. Hong et al., 2016). We computed τ from the CRISTA cirrus cloud detection by the CI–IWC relation prepared in lookup tables of ADP or limb IWP versus CI with respect to cloud altitude and a further correlation between extinction ke and IWC/Reff with ke = const ⋅ , with const = 1.4 × 10³, IWC in g m−3, Reff in micrometres, and ke in km−1 (Spang et al., 2012). Finally, a simple integration of ke over the cloud layer thickness (Δz) results in the vertical optical depth τ = ∫kedz, which is used for the SOCRATES input (Fig. 3).
The vertical information content of the ice parameters measured by CRISTA is limited. If more than one tangent height is affected by clouds in a single profile, then the values (IWC and consequently ke and τ) are used for the interpolation on the vertical grid of SOCRATES. If the predefined cloud thickness Δz overlaps the minimum altitude of CRISTA, then the model levels of the cloud are kept constant with the IWC of the lowest altitude. The CRISTA-based optical depth (Fig. 3b) covers the full range of UTCs from extremely low τ<0.0005 up to a maximum of τ≃0.05, where the maximum is still in the range of SVCs.
For a crosscheck of the τ approach we also followed an estimation method for the optical depth by (e.g. Baran and Francis, 2004) with Reff in micrometres and ρICE the mass density of ice in g cm−3. Probability density functions (PDFs) of retrieved (Fig. 3a) and estimated (not shown) τ look very similar, which gives us confidence that the retrieved IWC, IWP, and extinctions retrieved from CRISTA are in a reasonable range. Figure 3a and b show the distribution of IWP and optical thickness retrieved from the CRISTA data. The similarities in the PDFs highlight the close link between both parameters.
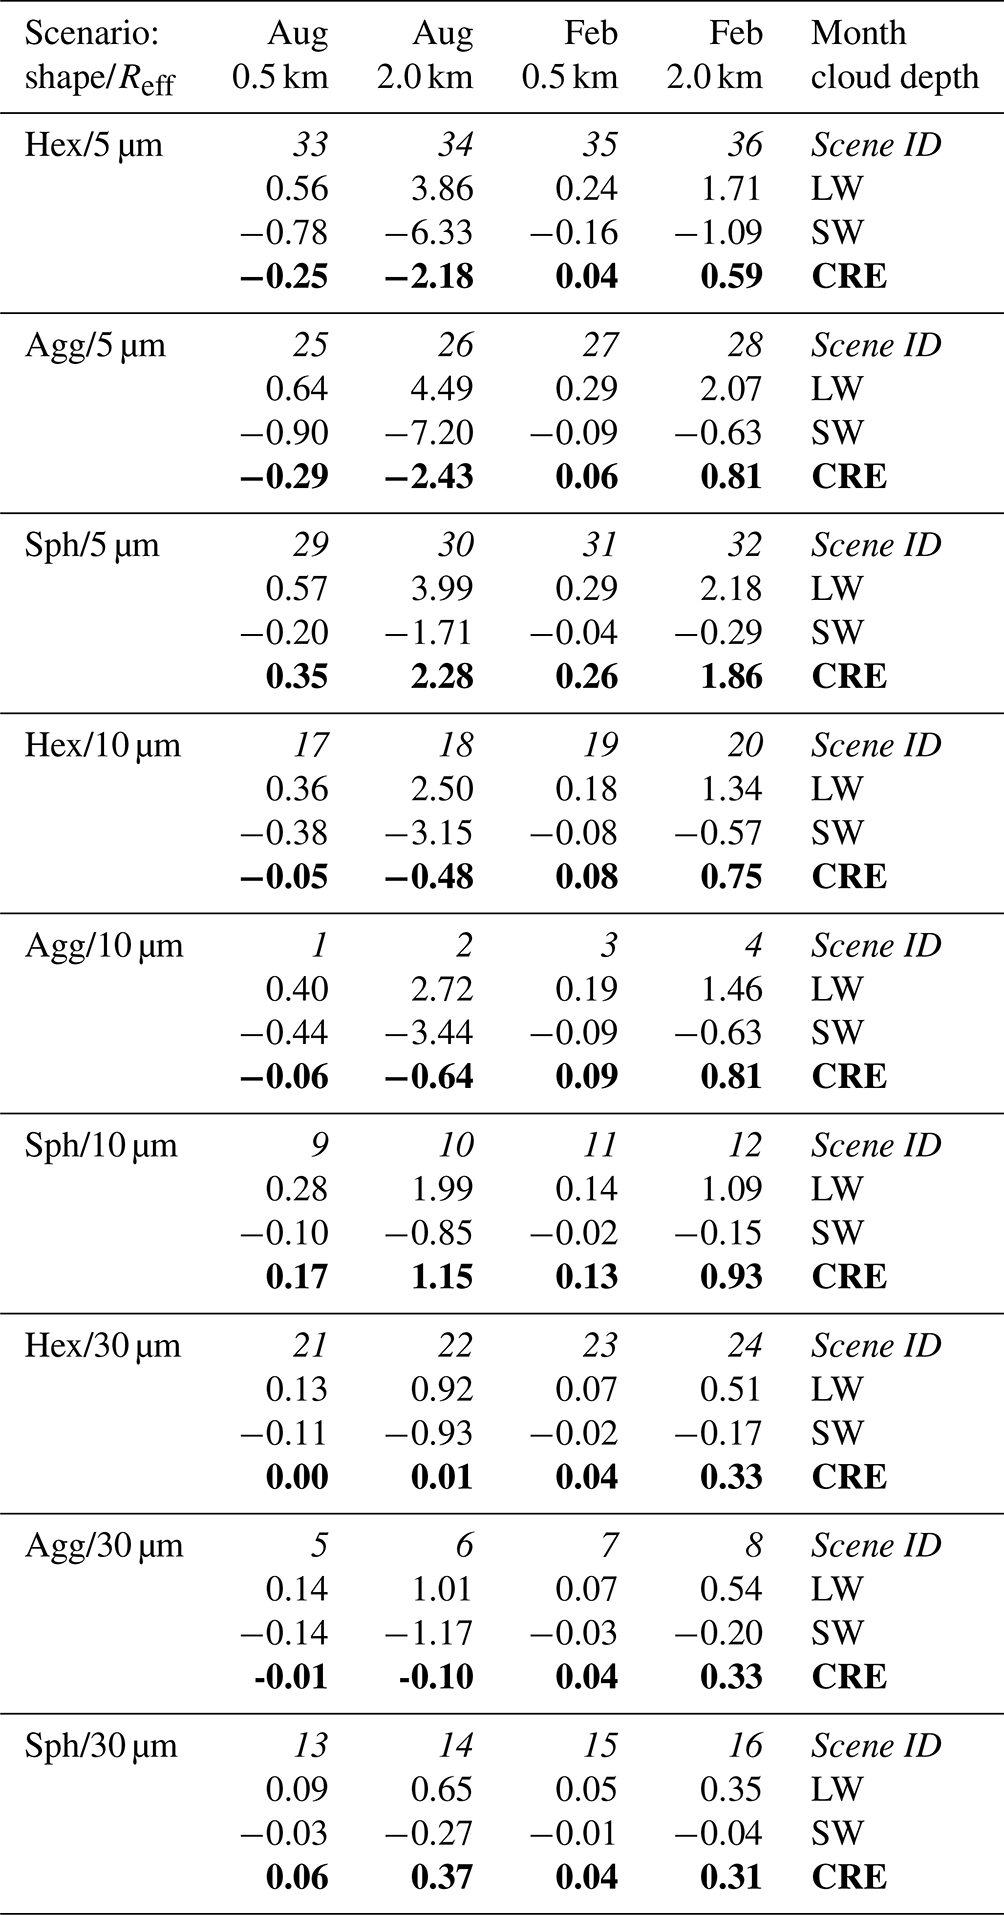
A summary of all different model scenarios (36 in total) for SOCRATES is presented in Table 1 together with the mean model results of the cloud radiative effect of all CRISTA profiles with cirrus clouds in the regions of interest (see Fig. 1) accounted for in the simulations. An example of the model input profiles (cloud index, temperature, specific humidity, and IWC) and the output profiles of SW and LW flux profiles for all-sky (as) cloudy and clear-sky (cs) non-cloudy conditions is presented in Fig. 2. The CRE is defined as the sum of SW and LW effect of the all-sky minus clear-sky fluxes (F) at the top of the atmosphere in W m−2:
Table 1Median cloud radiative effect (bold letters) of 161 cirrus cloud profiles, as well as separated LW and SW effects at W m2 for various scenarios of the SOCRATES runs. An identifier for the corresponding model setup is given in italic (scene ID).
LW, SW, and total flux (CRE) are saturating above the cloud top (< 100 hPa) with virtually constant values (Fig. 2b), and a simple definition of the top of atmosphere (ToA) radiative effect is applicable by means of the pressure levels 20 to 0.6 hPa. The latter pressure value is the minimum pressure level in the model run.
Figure 3a gives an overview of the range and occurrence in the vertical IWP from the CRISTA estimates. The obviously very different vertical cloud thicknesses of 0.5 and 2.0 km result in a separation in the PDF of IWP with very small IWPs between 3 × 10⁻³ and 5 × 10⁻² g m−2 for the 0.5 km cloud layers and an IWP ≃ 10−1 g m−2 for the 2 km extended cirrus. All modelled and observed cirrus clouds are optically thin in the limb and nadir direction and will be invisible for most passive nadir instruments. The lowest IWP values are equivalent to an IWC of 10−5 g m−3, which is 1 order of magnitude larger than the detection sensitivity of IR limb sounders (Spang et al., 2015) and close to the so far lowest IWC values observed in in situ measurements (10−6 g m−3, Krämer et al., 2020).
The mean temperature of the modelled cloud layers is in the range of 210 to 250 K for August (Fig. 3c), peaking around 220 K, which is a typical tropopause temperature at this time of the season (see Fig. 2 or Hoffmann and Spang, 2022). We applied no pre-selection based on temperature for the CRISTA cloud detection; consequently a few (11 out of 162) lower-altitude and warm cirrus are part of the SOCRATES calculations and are visible in the presented PDF at T > 240 K. These events have been detected 2 to 4 km below the tropopause but at cloud top heights of 8 to 9 km, which is relatively close to the typical tropopause height at the relatively high latitudes (60–70∘ N) of the measurements.
February temperature profiles have been selected from ERA5 and are not observationally based (longitude and latitude of the August cloud observations). The corresponding estimated cloud temperatures are lower than in August (the maximum of the probability distribution peaks at 210 K; not shown). Although the selected temperature profiles for February may not be realistic for the microphysical formation of cirrus (e.g. frequent CTHs are modelled in February significantly above the tropopause), it seams reasonable to use the profiles for T, specific humidity (SH), and O3 to define the background atmosphere conditions for the February scenarios in SOCRATES. However, these February simulations are only intended to provide rough CRE estimates for the discussion on the overall differences between summer and winter conditions.
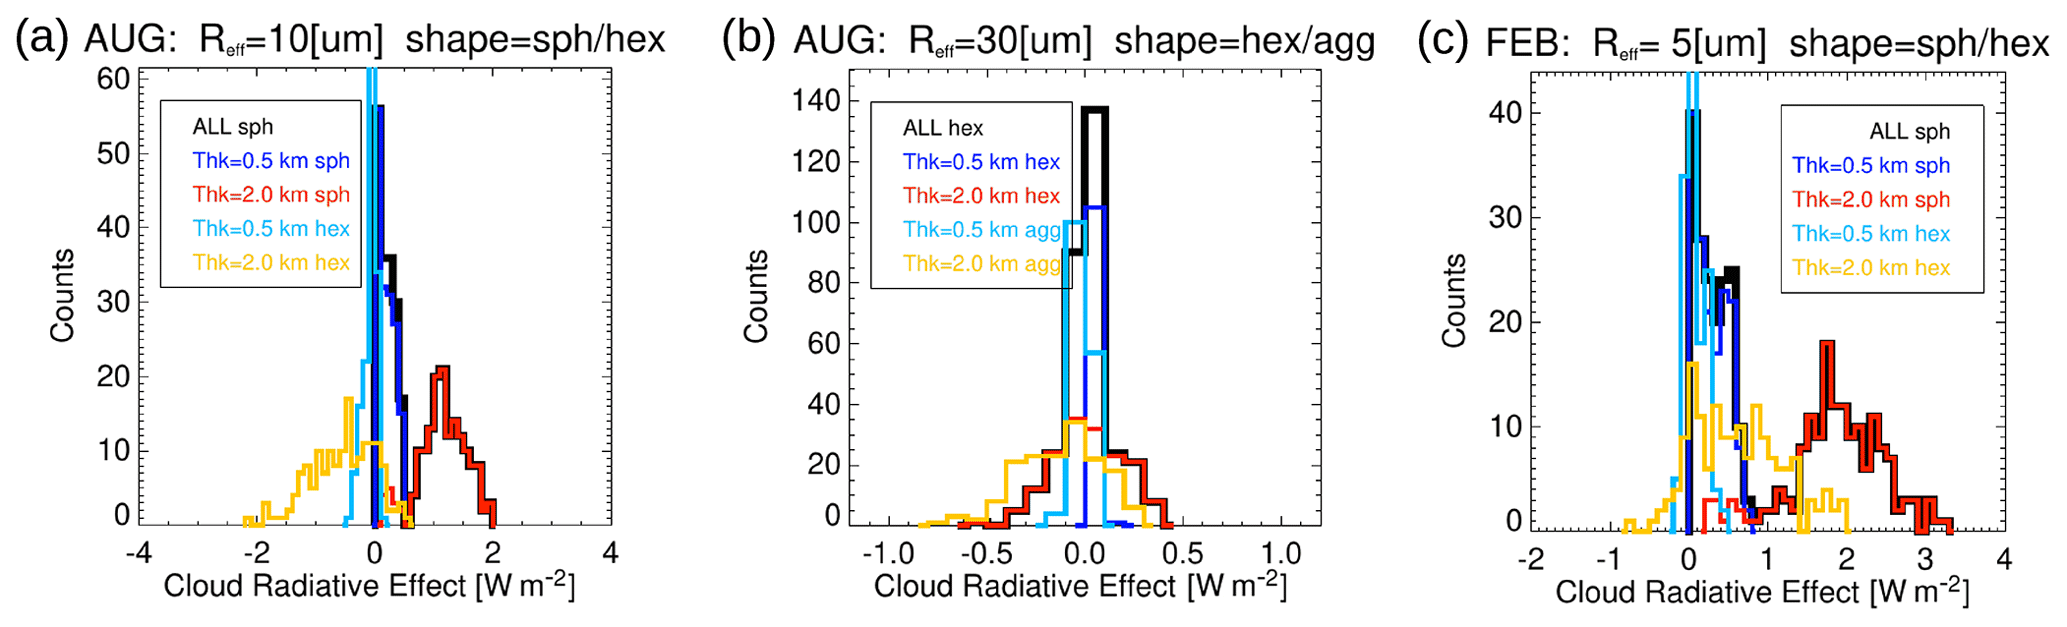
Figure 4PDFs of the CRE for various setups of the SOCRATES runs (a) for 10 µm effective radius of the particles for spherical and hexagonal particle shapes (see colour code) and (b) with effective radius of 30 µm for hexagonal and spherical particles, both for August conditions and (c) February background atmosphere for spherical and hexagonal particles. Separation in cloud thickness Δz = 0.5 km and Δz = 2 km in blue and red for spherical/hexagonal/spherical (a–c) (the total of Δz = 0.5 and 2.0 km is highlighted in black and labelled ALL) in comparison to hexagonal/aggregates/hexagonal particles (0.5 and 2 km in light blue and orange).
3.1 Model results for selected setups
An overview of the CRE of the individual profiles is presented for selected model setups in Fig. 4 by probability density functions (PDFs) for various Δz and particle shapes (colour-coded) and effective radius as well as for August (a, b) and February (c) background conditions. Relatively broad distributions of a negative CRE for hexagonal particles from −2 to 0.5 W m−2 were found for Δz = 2 km, changing to a positive CRE for spherical particles (+0.5 to 2 W m−2, Fig. 4a) for an effective radius of 10 µm. Overall, our simulations indicate contrasting behaviours between spherical and hexagonal particle shapes and between August and February conditions. Very similar distribution were found between hexagonal shapes and aggregates as shown for the large mode (Reff = 30 µm) but with similar agreement for both other size modes (Fig. 4b). Finally, for the small mode (Reff = 5 µm) and February conditions, the PDFs of spherical and hexagonal particles are shifted to positive CREs; only a minor contribution of the scenarios with hexagonal particles is able to produce a net cooling effect. The results are discussed in more detail in the discussion of Sect. 4.
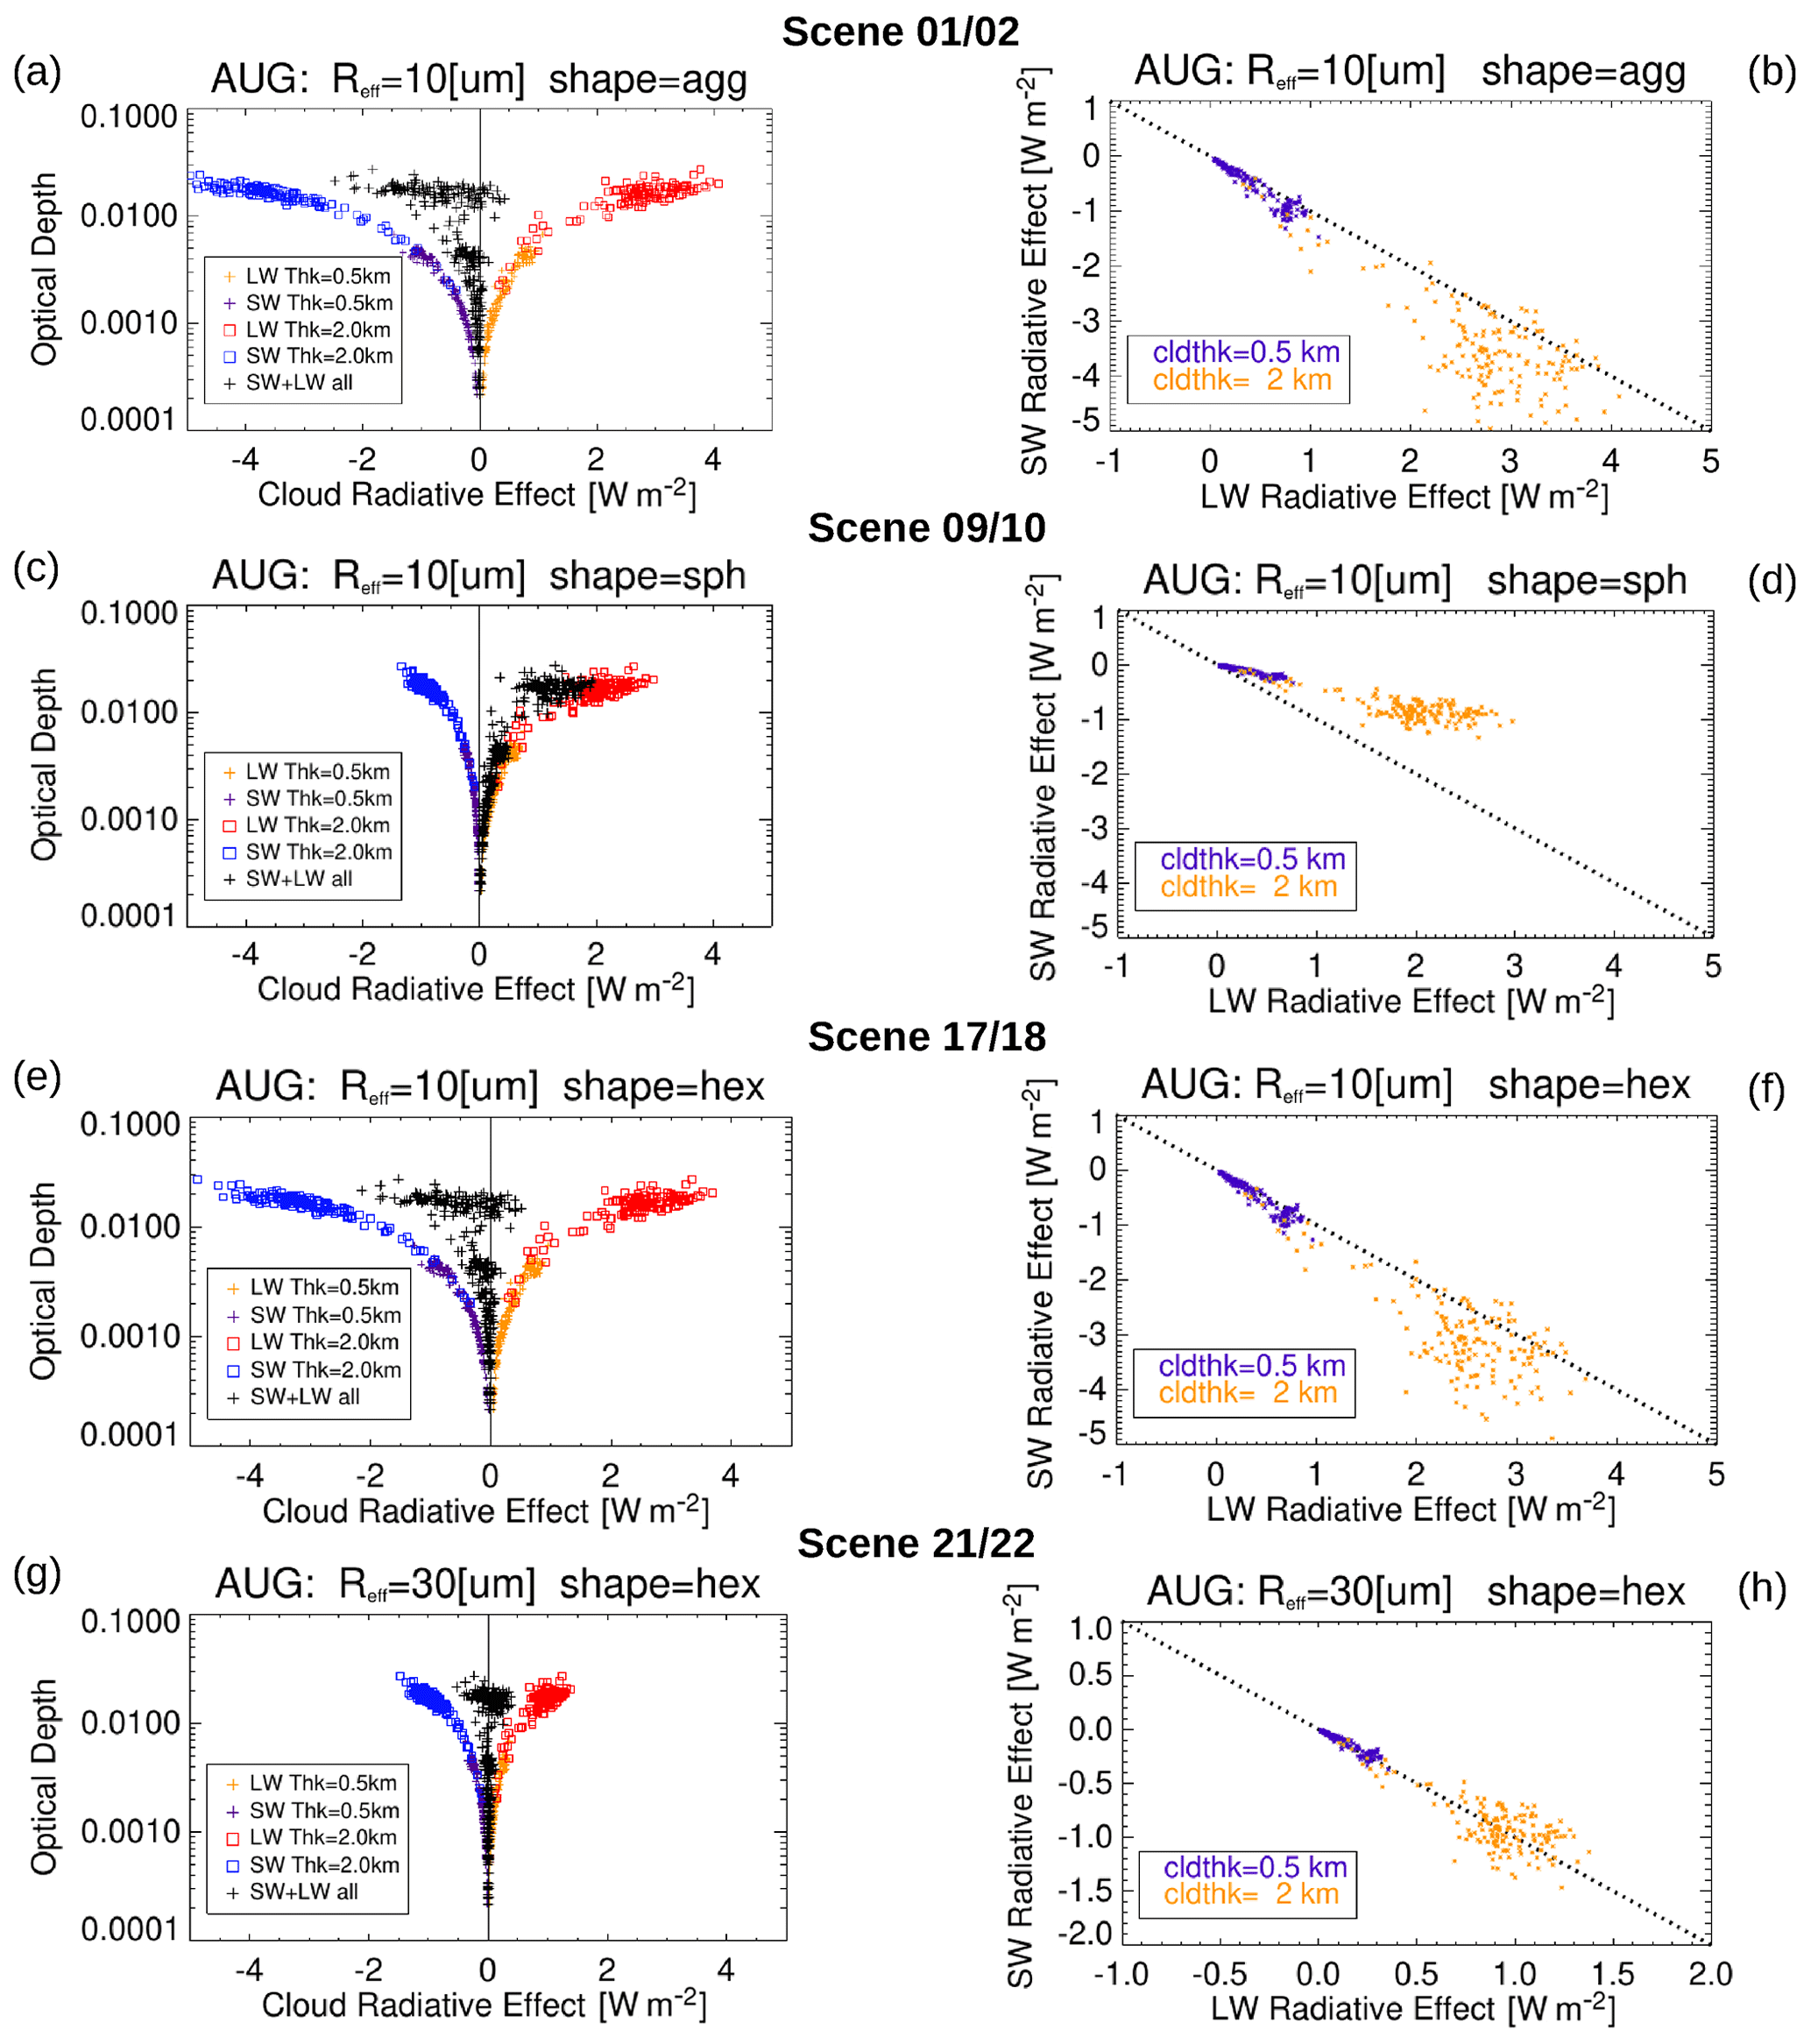
Figure 5Cloud radiative effect for cirrus (LW and SW colour-coded as blue/purple and red/orange (Δz = 2 and 0.5 km) and total as black) with respect to optical depth (a, c, e, and g) and LW versus SW radiative effect (b, d, f, and h). (a, b) Aggregates, (c, d) spherical, and (e, f) hexagonal particle shape with Reff = 10 µm for August conditions as well as (g, h) hexagonal particles with Reff = 30 µm. The black vertical line in the panels of the left column highlights CRE = 0 W m−2. Attention: the y-axis range is changed for (h).
Figure 5 gives a better representation of the SW, LW, and net effect with respect to the optical depth (Sect. 2.3) of the modelled clouds. Figure 5a, c, e, and g show the CRE versus optical depth for four and eight model scenes – always for Δz = 0.5 and 2 km and August conditions with Reff = 10 µm and aggregate (Fig. 5a and b), spherical (Fig. 5c and d), and hexagonal particle shapes (Fig. 5e and f) – and finally for the large particle mode 30 µm and hexagonal particle shape. The exponential growth of SW and LW effects with increasing log (τ) is obvious for all setups and especially well pronounced for the combination of Reff = 10 µm and aggregates as well as hexagonal particles. SW and LW effects are nearly in balance and changes in shape or radius can significantly change the net effect (black symbols in Fig. 5a, c, e, and g) from cooling to warming and vice versa. The interplay of SW and LW effects is visualised in more detail in Fig. 5b, d, f, and h. Deviations from the one-to-one line highlight the warming (above) and cooling (below) of the net cirrus CRE for each single cloud event modelled with SOCRATES. Smaller Δz induces a very similar ratio between LW and SW effects, illustrated by rather similar gradients and only smaller amplitudes in the LW–SW correlation. For summer conditions and particle shapes of aggregates the short-wave scattering effect can reach a very large cooling (extended day length), especially for larger optical depth values (τ > 0.01). This results in 10 scenarios (Table 1: scenes 01, 02, 05, 06, 17, 18, 25, 26, 33, 34) with an overall mean cooling potential (aggregates for 5, 10, and 30 µm; hexagonal shape only for 5 and 10 µm) presented in Fig. 5a–d. However, even smaller effective radii (< 10 µm) will result in even larger cooling effects for aggregates or similar complex particle shapes. For optically thin cirrus clouds (SVC and/or UTC), in situ measurements show typically Reff 100 µm and quasi-spherical shapes with some plates and rare trigonal shapes (Lawson et al., 2019). Thus, aggregates are not a very plausible particle shape for the optically thinnest cirrus clouds observed by CRISTA.
For spheres (Fig. 5c and d) compared to aggregates (Fig. 5a and b) or hexagonal particles (Fig. 5e and f) the SW scattering efficiency is less pronounced and the cooling effect is generally smaller in amplitude and usually smaller than the LW warming for spheres. Hexagonally shaped particles are more realistic for high-altitude cirrus cloud particles (Heymsfield and Platt, 1984), although they are usually observed at colder temperatures and not necessarily generally representative of UTCs at midlatitudes and high latitudes. Figure 5e represents an example of the optical depth versus CRE and the LW versus the SW effect for 10 µm. The results are very similar to the aggregates, although the amplitude for SW, LW, and total CRE are slightly larger for aggregates than for hexagonal particles. As a consequence, for hexagonal ice crystal shapes a few more profiles with LW > SW are present (Fig. 5f and h). The larger effective radius (Reff = 30 µm; Fig. 5h and f) results in significantly smaller surface area densities, which reduces the SW effect. The LW can now dominate the SW more frequently and results for nearly 50 % of the profiles in a net warming effect (Fig. 5h) compared to the 10 µm runs (Fig. 5f) with cooling for most of the profiles.
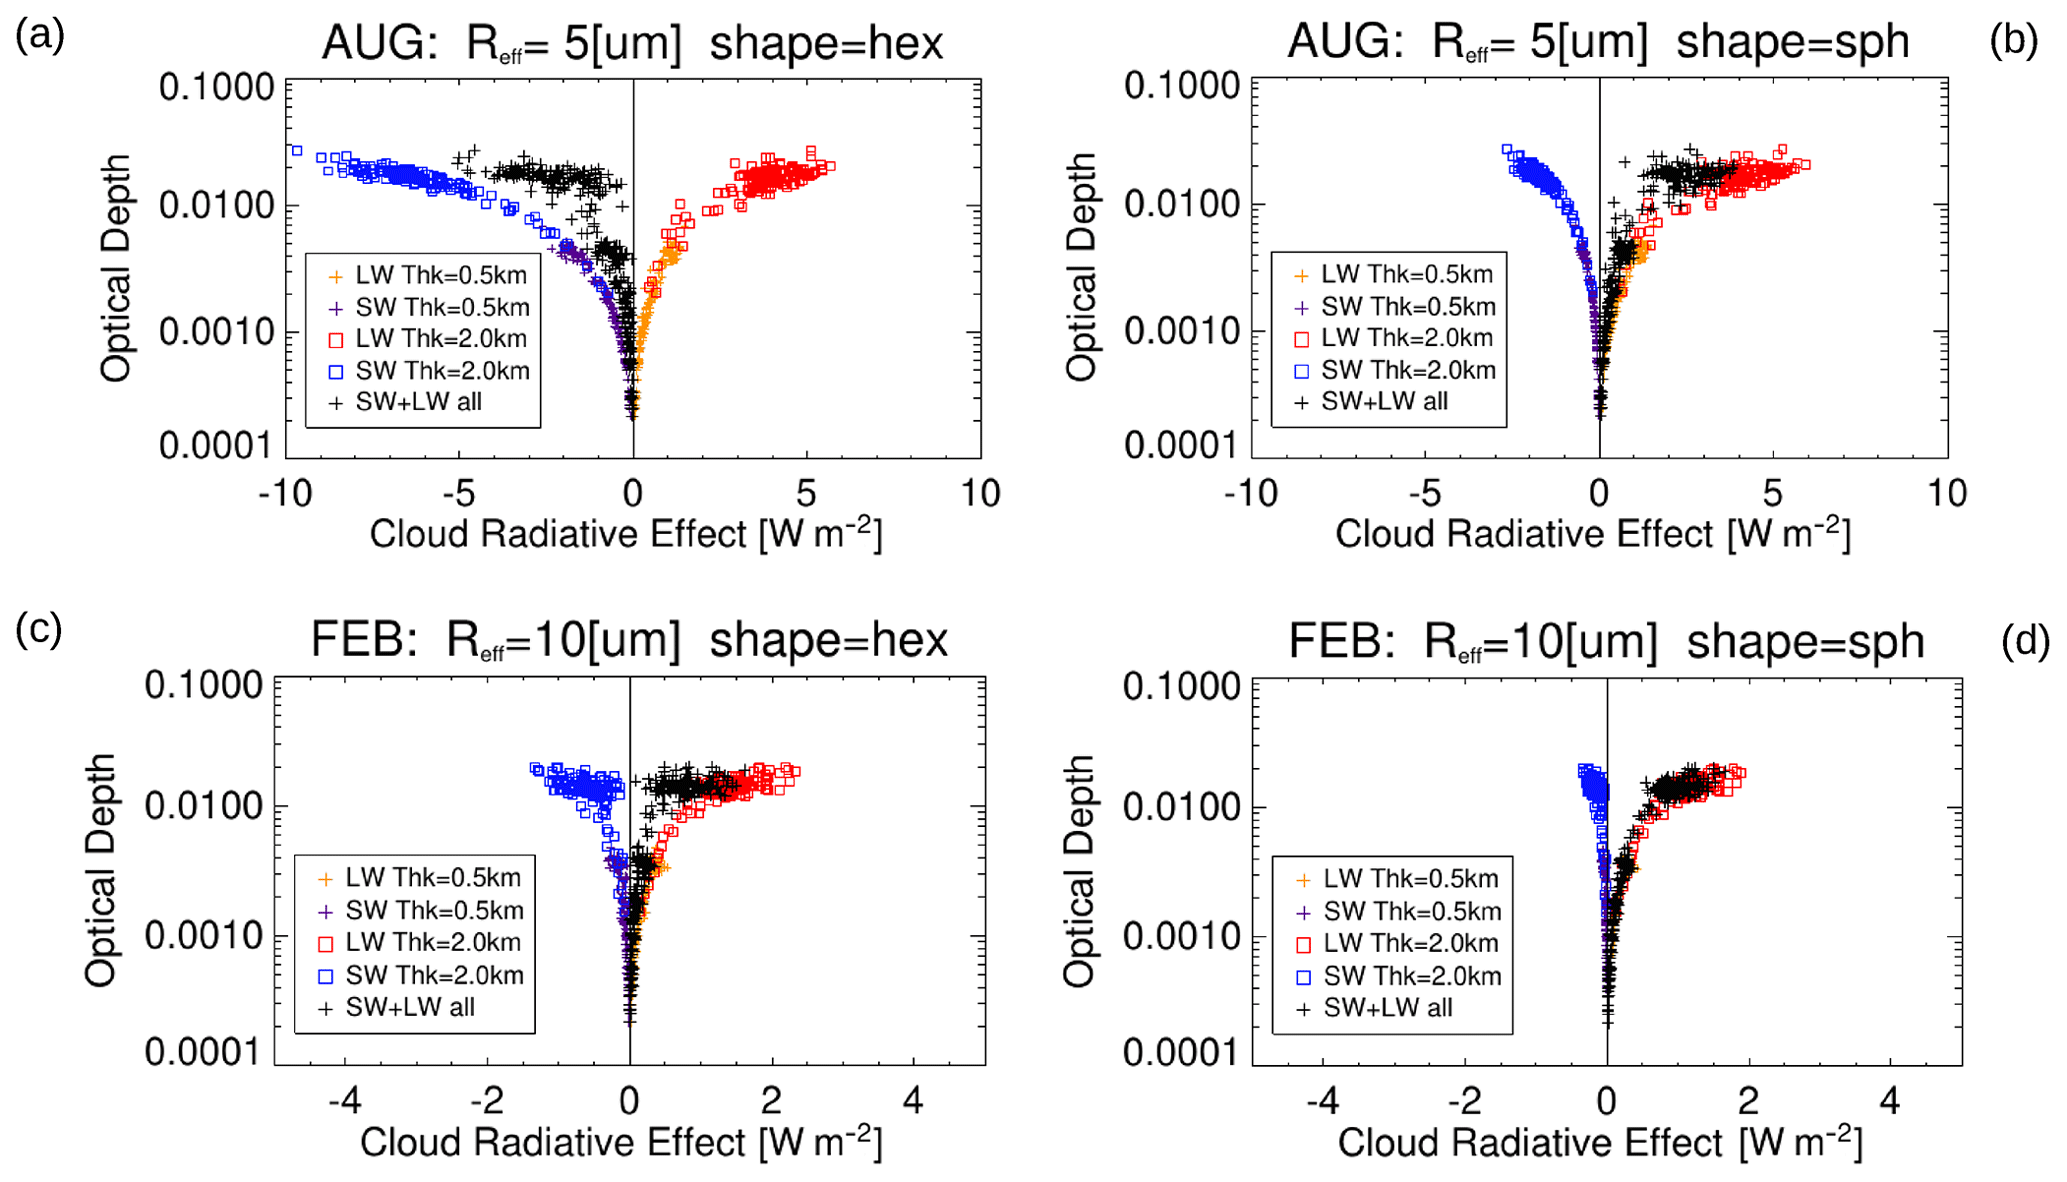
Figure 6Cloud radiative effect for cirrus (LW and SW colour-coded as blue/purple and red/orange (Δz = 2/0.5 km) and total as black) with respect to optical depth in August with Reff = 5 µm for hexagonal (a) and spherical particles (b). Panels (c) and (d) also show hexagonal and spherical particles for Reff = 10 µm but for February conditions (for details see text). The black vertical line in the figures highlights CRE = 0 W m−2. Note the factor 2 expanded CRE range in (a) and (b).
In addition, we present in Fig. 6 the CRE versus optical depth relation for Reff = 5 µm and 10 µm of hexagonal and spherical particles for August and February conditions. The small mode again shows opposing effects for hexagonal and spherical particles, here with an extremely high SW cooling (up to 10 W m−2) for hexagonal particles. The latter results in a net cooling for all profiles, and the situation is the opposite for spheres, where the majority creates a net warming effect.
There is a strong Reff dependency on the SW effect, where larger particles correspond to smaller surface area densities for constant IWC and consequently smaller SW scattering. Generally, 0.5 and 2 km cloud layers behave very similarly to changes in the parameter settings (LW is orange and red and SW lilac and blue in Fig. 5, Fig. 6), whereby τ is a significant factor of ∼ 4 smaller in the CRE for Δz = 0.5 than for the Δz = 2 km cloud layers.
In addition, we tried to find a relation between the CRE and macrophysical parameters like the distance to the tropopause as well the temperature difference between cloud top and surface temperature. Figure 7 presents only results for Reff = 10 µm (5 and 30 µm differ only by an enhancement and reduction in magnitude, respectively, and no change in sign) for spherical (Fig. 7a) and hexagonal (Fig. 7b) particles for cloud top pressure minus tropopause pressure in pressure altitudes.
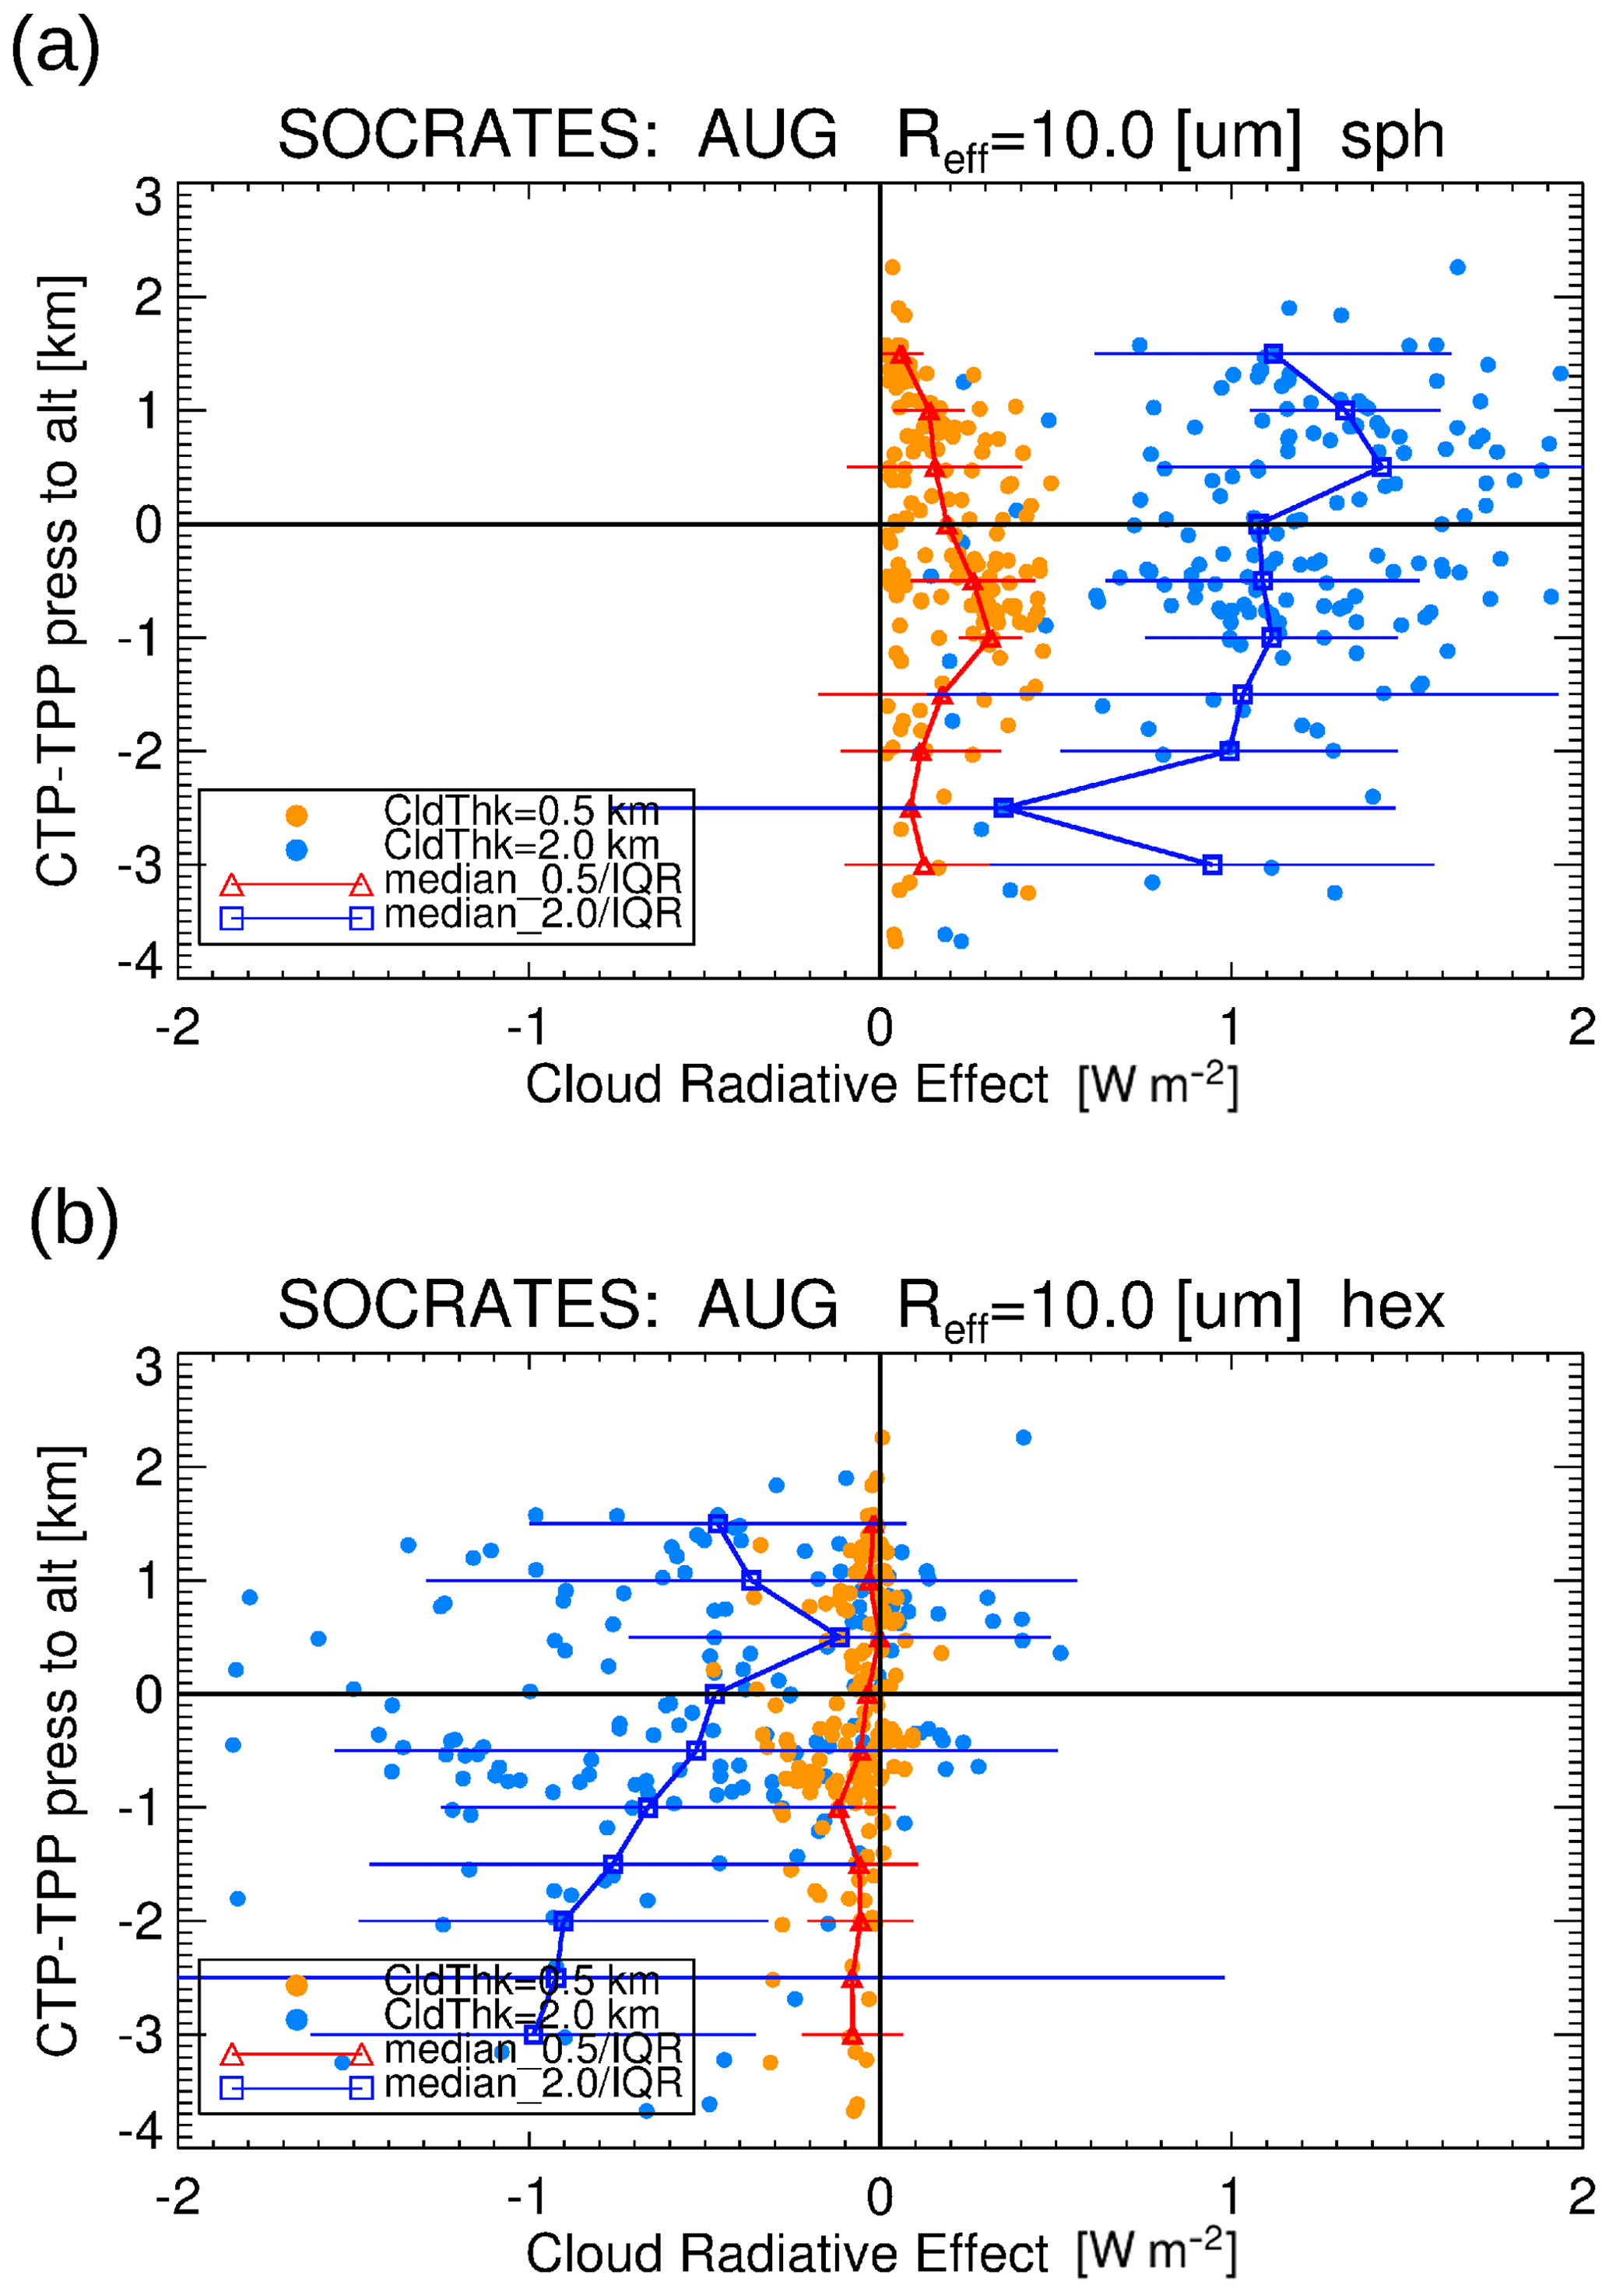
Figure 7Cloud radiative effect with respect to the distance to the tropopause cloud top pressure minus tropopause pressure (CTP − TPP) for Reff = 10 µm spherical (a) and hexagonal (b) particle shape. Vertical line in middle highlights CRE = 0.
Although the interquartile range of the median values of the CRE are rather large (error bars), for Δz = 2 km there is a distinctive correlation starting a few kilometres (2–3 km) below the TP up to 0.5 km above the tropopause. In addition, for spherical as well for hexagonal particle shapes, the median indicates a weak negative gradient with cooling in the CRE with larger distances above the tropopause (> 0.5 to 2 km). Δz = 0.5 km events show a negative gradient but with smaller tendencies in the range of −1 to 3 km with respect to the tropopause. The gradient looks for aggregates and hexagonal particle shapes as opposed to spheres. Below the tropopause (≃ −1.5 km) the gradient is negative for most of the scenarios.
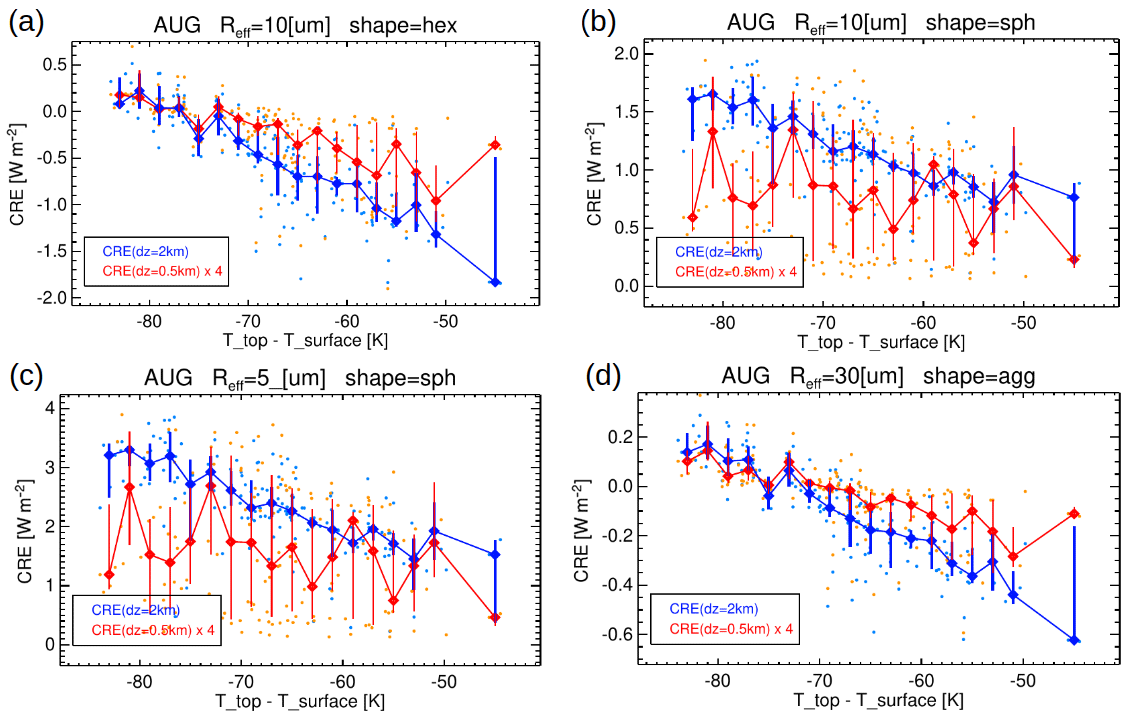
Figure 8Cloud radiative effect with respect to cloud top temperature minus surface temperature (based on ERA5) for August and Reff = 10 µm hexagonal (a) and spherical (b) particle shapes as well as for 5 µm spheres (c) and 30 µm aggregates (d). Cloud thickness is highlighted in blue for Δz = 2 km and red for Δz = 0.5 km. All numbers for Δz = 0.5 km events are scaled by a factor 4 in the CRE domain for simpler comparison. Median CREs for a temperature grid with a width of 2 K are superimposed by large symbols and error bars for the interquartile range.
Mean cloud temperature should have an imprint on the CRE, because the emitted radiation of the cloud is directly related to the temperature. One of the major radiation effects by high cold clouds is a warming potential due to the emission at lower temperatures around the tropopause (e.g. Heymsfield et al., 2017). The cloud radiative effect with respect to the cloud top temperature (CTT) minus surface temperature at the profile location is presented in Fig. 8. CTT is not directly related to the LW effect of clouds; it is the temperature difference between the cloud top and the LW-emitting layer in the atmosphere, an underlying cloud layer, or the surface temperature under clear-sky conditions (e.g. Gettelman and Sherwood, 2016). In addition, the optical thickness of the cloud layer is also an important parameter in this representation; the smaller the optical thickness, the smaller the LW effect and consequently the smaller and less significant the sensitivity to the temperature difference. A completely transparent cloud (τ=0) has a negligible LW effect. This appears nicely in the different behaviour of the Δz = 2 km and dz = 0.5 km scenarios in Fig. 8, where the vertically thin clouds (red, scaled by a factor 4) show no or only weak trends in the CRE with respect to the temperature difference. For all particle sizes and shapes for the vertically thick and consequently optically thicker cloud layers (blue) a linear relation becomes obvious; the smaller the negative temperature difference, the smaller CRE. Although the scatter – the error bars represent the interquartile range – is sometimes even large for the 2 km cloud cases, this appears only for temperature bins with small event numbers (N<5). In contrast, the Δz = 0.5 km scenes always show a relatively large interquartile range with respect to the median and only a weak indication of similar trends (significantly smaller gradients) like in the Δz = 2 km scenes (Fig. 8a and d).
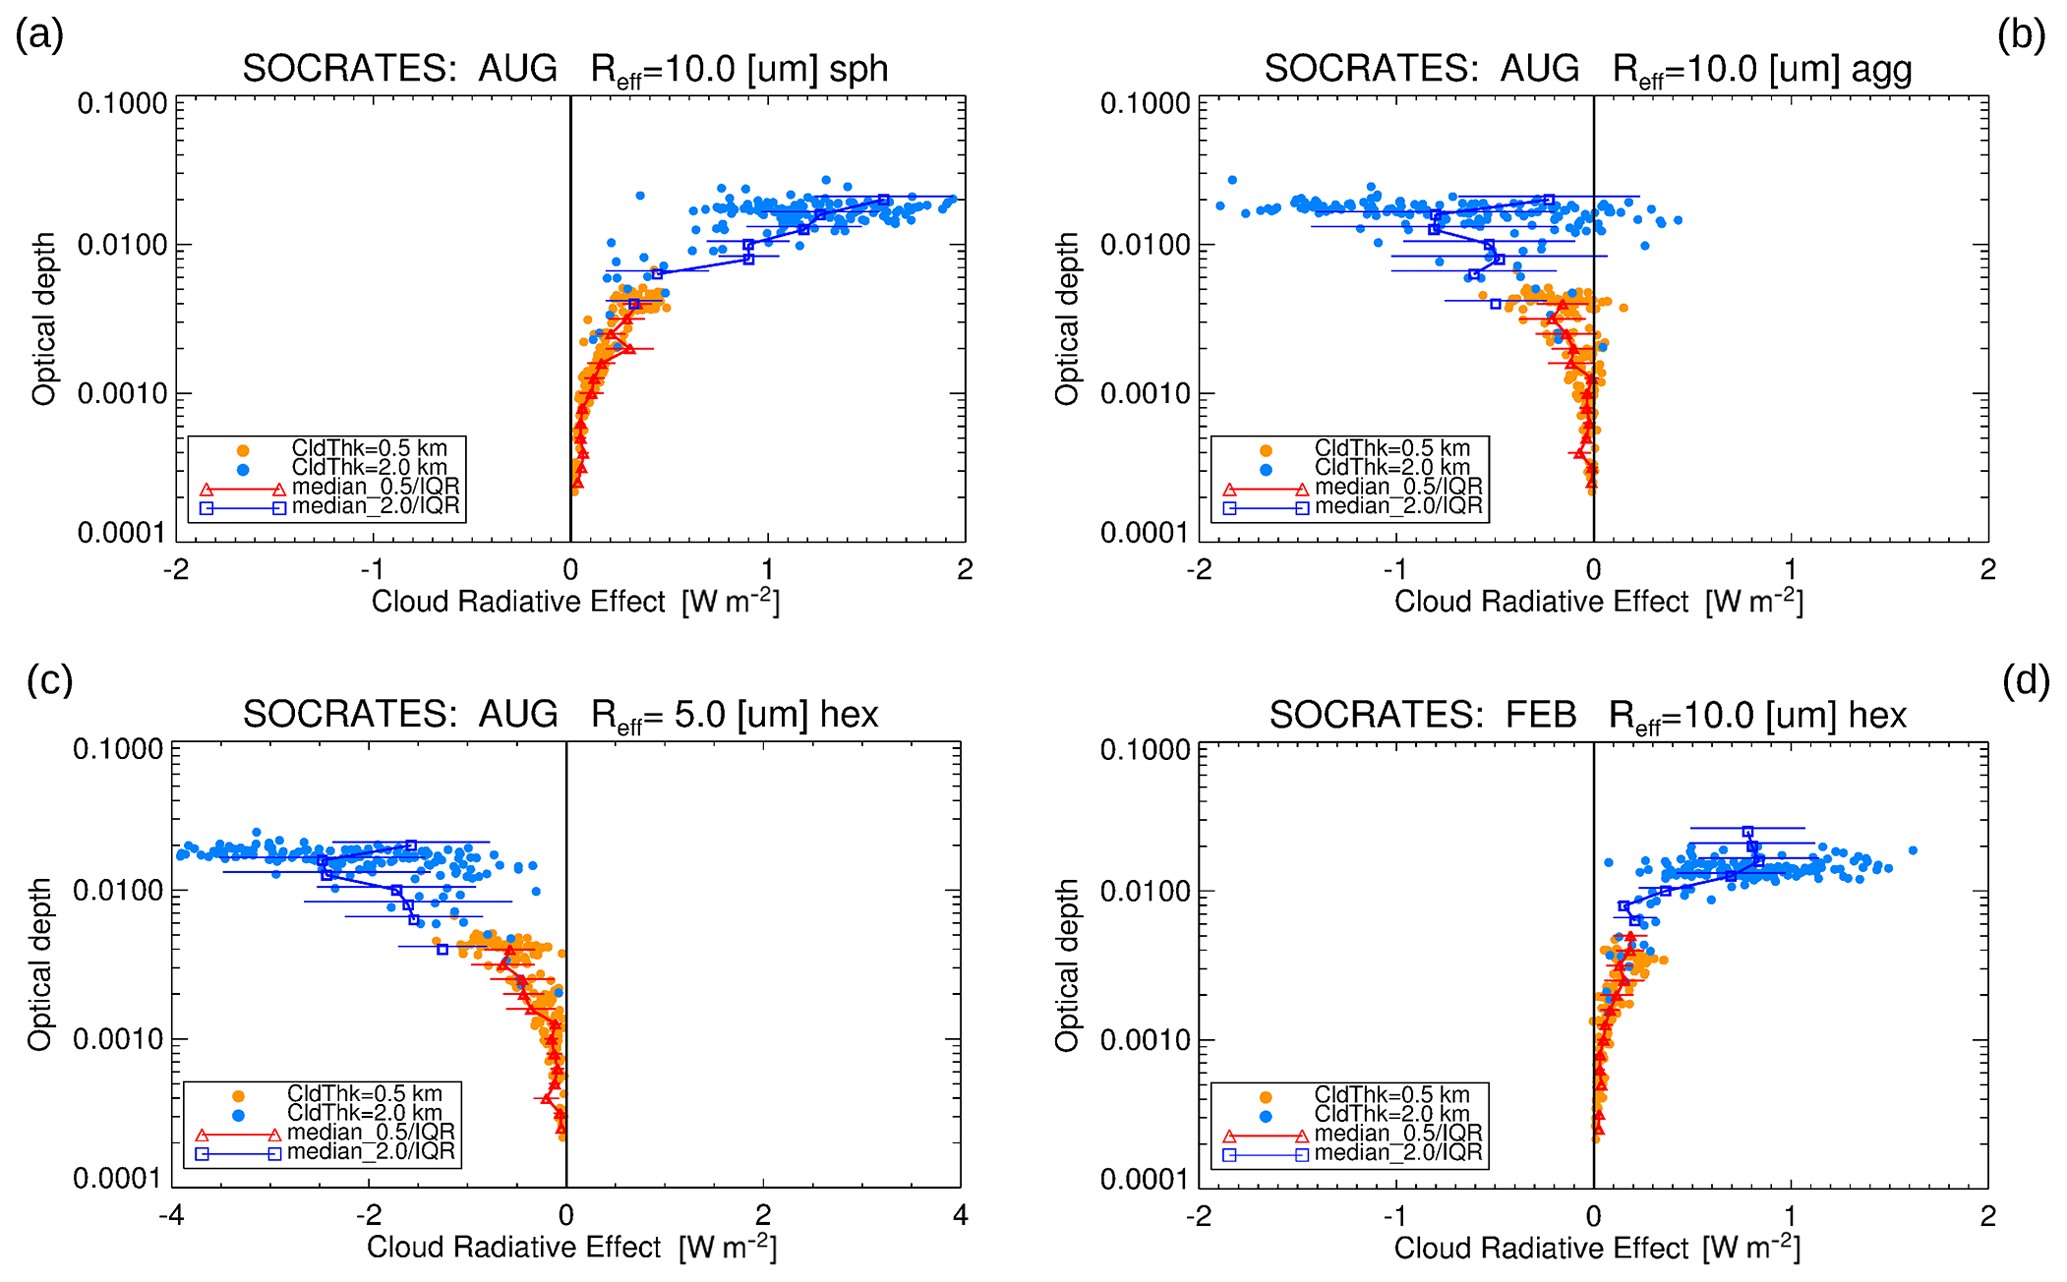
Figure 9Cloud radiative effect with respect to optical depth (a, b) for August and Reff = 10 µm spherical and aggregate particle shapes on the left and right and (c, d) with hexagonal particle shapes for Reff = 5 µm and August conditions as well as February for Reff = 10 µm. The error bars represent the interquartile range of the corresponding vertical grid box.
The CRE versus optical depth similar to Fig. 5 is presented in Fig. 9 with an additional binning along the corresponding y axis and the computation of median and percentiles per bin for the CRE. The median and the interquartile range are presented, with the interquartile range as an error measure to better visualise the variability for constant optical depth. The median and interquartile range are better suited than the mean and standard deviation to characterise data with high internal variability, extreme outliers, or skewed distributions. For spherical particles, the median follows the exponential increase in the CRE from the 0.5 and relatively small τ over the 2 km scenarios up to τ≃0.02 and the CRE up to 2 W m−2, whereby the aggregates show nearly the opposite behaviour in the CRE, with a smaller amplitude and larger scatter (interquartile range error bars).
Statistics of modelled cloud radiative effect
Table 1 summarises all SOCRATES setups and mean results on LW, SW and net radiative effect. The median values of the selected areas (Sect. 2.3) give distinctive tendencies of the overall cloud warming or cooling effect for the UTCs. In total 161 cloud profiles have been selected from the CRISTA-2 data and represent variable conditions where optical thin cirrus clouds were formed at and above the tropopause north of 60∘ N. Using more realistic cloud occurrence frequencies would allow a more realistic assessment of the CRE of the UTCs.
The LW effect of scattering and trapping the IR radiation back into the direction of the ground dominates the SW cooling effect for most of the model scenes. For spherical particle shapes, both scenarios, winter and summer, result in a net warming effect in the range of 0.17 to 1.15 W m−2 (August) and 0.13 to 0.93 W m−2 (February) for Reff = 10 µm. These are generally larger values than the mean effects for aggregates or hexagonal particles, especially for summer conditions.
The LW warming is even more effective for larger particles where the resulting smaller surface area densities reduce the SW cooling. However, the SW cooling is also more effective for larger particles. Table 1 shows this fact for all simulations of spherical particles: for example, a between 10 and 30 µm effective radius has a ∼ 3 times higher SW and LW effect for the 10 µm effective radius (e.g. factor 6 higher for 30 to 5 µm).
The short-wave scattering effect depends strongly on the solar zenith angle and the duration of sunlit hours. For winter conditions the mean SW effect cannot compensate for the LW effect for aggregates and spheres, whereas for summer conditions the aggregates can change the sign for the CRE from warming to cooling. SW is enlarged from −0.63 to −3.44 W m−2 and results in a mean CRE of +0.81 (February) to −0.64 W m−2 (August). This change in sign – from warming to cooling – does not appear for spherical particles. In contrast to aggregates the CRE stays positive from winter to summer and even shows a slightly enhanced CRE (e.g. 0.93 to 1.15 W m−2 for 10 µm and Δz = 2 km). The SW effect of spherical particles is by far smaller than the one for aggregates.
4.1 Winter condition experiments
As mentioned in Sect. 2, we used the profiles for T, SH, and O3 to define the background atmosphere conditions for February scenarios in SOCRATES. The CRISTA-based input (CTH and IWC, indirectly IWP, extinction, optical depth) are simply mirrored into these February conditions. While these simulations do not represent actual February UTC CRE simulations, they are intended to provide a basis for discussions on the more general differences between summer and winter conditions.
For winter (February) conditions the short-wave cooling becomes smaller due to reduced daylight hours (taking also into account the rather high geographical latitudes), which results in a general warming effect for all particle shapes and effective radii. The change from cooling to warming for aggregates and hexagonal particles with Reff = 10 µm is illustrated in Fig. 6c and d. In addition, the albedo varies for this change from a mean α = 0.15 to 0.5, which has a drastic effect on the LW radiance input coming from below the cloud. Similar to an underlying cloud, this can have a significant effect on the net SW or LW effect.
The change from net cooling to warming simulated for February conditions has been compared with the long time record analysis of CALIPSO by Hong et al. (2016). It should be recapped that the cloud optical thicknesses < 0.01 (mainly UTCs) only play a minor role for the total CALIPSO-based CRE. Hong et al. (2016) showed the zonal mean seasonal variation in the total SW, LW, and net effect of ice cloud radiative effect, latitudinally resolved (Fig. 4). For ∼ 50 to 75∘ N significant changes over the seasonal cycle, from cooling in summer (March to August) to warming in winter (September to February), are observable. A net warming effect of 10–20 W m−2 is observed during winter, and the net cooling effect can exceed 30 W m−2 in southern midlatitudes to high latitudes and 20 W m−2 in the northern midlatitudes to high latitudes. In the tropics, a strong net warming effect (10–20 W m−2) persists over the whole year, mainly caused by high ice clouds with negligible seasonal variation in the zonal mean (Hong et al., 2016). Consequently, the CALIPSO results are in line with the simplified mirroring of the CRISTA measurements from summer to winter conditions for UTCs, while the amplitudes for UTCs are obviously much smaller, which is mainly a result of the different optical thicknesses of UTCs compared to ice clouds observed by CALIPSO. The tendency towards a change from cooling to warming is identical.
4.2 Uncertainty in cloud thickness
Various settings of UTC clouds have been modelled with SOCRATES for a first quantification of the cloud radiative effect of UTCs at midlatitudes and high latitudes. The original CRISTA-2 data have already been analysed regarding the cloud occurrence with respect to the tropopause by Spang et al. (2015). However, the CRE was not analysed for these unexpected observations of UTCs well above the tropopause and with unprecedented high occurrence rates at high northern latitudes. A comprehensive study was missing where the cooling or warming potential of these clouds is investigated.
For larger effective radii as well for vertical thinner cloud layers (0.5 km) we observe smaller cooling and warming effects in the mean SOCRATES results (Table 1 and Sect. 3.2). The determination of Δz would be an important parameter for a better future quantification of the CRE of UTCs. So far, there is no validated statistical information of the cloud thickness of UTCs available. Although the CALIOP data may miss a rather large part of the optically thinnest UTCs (Davis et al., 2010; Balmes and Fu, 2018), the dataset is still the best set available for such an analysis. Zou et al. (2020, 2021, 2022) have analysed the cloud occurrence of stratospheric ice clouds (SICs) based on CALIOP data products. The studies by Zou and colleagues have not focused on the vertical extent of these clouds. Zou et al. (2020) showed for midlatitudes that the IR limb measurements by MIPAS give higher occurrence rates on SICs than CALIOP if both cloud occurrence frequencies are normalised in the tropics. This supports the notion that IR limb sounders are under specific conditions more sensitive in the detection of cirrus cloud than recent lidar in-space instruments. This circumstance was already discussed in earlier studies (Spang et al., 2012, 2015; Bartolome Garcia et al., 2021).
The best information on the Δz of UTCs retrieved from IR limb measurements is the more recent analysis of Bartolome Garcia et al. (2021) with data from the airborne GLORIA (Gimballed Limb Observer for Radiance Imaging of the Atmosphere) instrument (Riese et al., 2014) during the airborne campaign WISE (Wave-driven ISentropic Exchange) in the North Atlantic in September and October 2017. Due to the excellent vertical resolution and fine sampling using a 2D infrared imaging detector, the data achieve a vertical sampling and resolution of 140 m. For the first time cloud bottom information was retrieved from extinction profiles.
The analysis shows that in the region investigated by WISE there is a maximum likelihood in cloud extent Δz of 500–625 m with likelihoods for Δz > 1.5 km of less than 25 % of the peak likelihood and in total only 10 % of all measured cloud events (Bartolome Garcia et al., 2021, Fig. 8a). Note that for a typical Δz of 0.5 to 1 km a lower CRE is calculated than for Δz = 2 km (Fig. 5). Generally, optical depth is a good estimator for the strength of the CRE even at very low optical depth, but the cloud vertical extent is obviously a critical parameter for τ and the CRE, and there seams a functional relation between the CRE, Δz, and τ (Fig. 5).
4.3 Estimates of UTC fraction and global CRE
Cloud top heights with respect to the tropopause show a week correlation with the CRE in the SOCRATES results especially below the tropopause with a decrease in mean CRE with warmer cloud temperatures (Fig. 7). The variability in the net effect is very large (profile-to-profile variability), which makes it difficult to draw a final conclusion on a mean effect with the cloud top position with respect to the tropopause, but we found clear indications of an enhanced warming effect for optically thicker events at higher altitudes with respect to the tropopause.
The CRE is not only affected by τ, but the atmospheric background conditions (temperature profile, CTH location, surface albedo, microphysical quantities) can also result in situations where even similar background conditions and constant τ result in a very different CRE. This makes the prediction of a net cooling or warming difficult. Even LW and SW effects turn out to be very different depending on the optical depth (Fig. 5). Global measurements with a sophisticated occurrence frequency statistic, where the cloud detection is weighted with the area covered by clouds, are necessary. The subsequent radiation model runs would then allow the overall CRE of UTCs in the tropopause region to be better quantified.
Hong et al. (2016) followed a very similar procedure with the combined CALIPSO–CloudSAT ice cloud data products (DARDAR: Delanoë and Hogan, 2008; 2C-ICE: Deng et al., 2010). These data may not include the correct number of UTCs due to a lack of detection sensitivity (see Sect. 1) and will consequently to some extent underestimate the total cloud coverage and occurrence of cirrus clouds. The results achieved by Hong and colleagues are presented for ice cloud optical depths τ > 10−2, a value where the limb measurements are starting to saturate. The analysis of Hong and colleagues lacks the optically thinnest range of τ = 10−4–10−2, where IR limb sounders are most sensitive. A combination of IR limb and space lidar measurements would be an excellent combination to cover the full range of the optical depth of cirrus clouds (τ = 10−4 to > 20) for a comprehensive view on the radiative effect of cirrus clouds. Hong et al. (2016) argue that subvisual cirrus (τ<0.03) display only weak SW and LW radiative effects because of their infrequent occurrence (global mean < 5 %; Hong and Liu, 2015), and this results in a global mean value of CRE = 0.05 W m−2 (Hong et al., 2016, Table 4,). However, as already argued above, the applied cloud dataset misses a significant number of UTCs and the overall radiative effect for SVCs and UTCs is underestimated. Our study shows that the radiative effect of these additional UTCs will be small but relevant, in the range of the CRE median of −2.43 to 2.28 W m−2 (Reff = 5 µm) assuming a 100 % occurrence rate (with a single profile maximum of net cooling of −9 W m−2 and net warming of ∼ 6 W m−2; Fig. 6). For summer conditions only aggregates and hexagonal particles have the potential for a net cooling effect. If a more realistic UTC coverage of 10 (20) % is assumed (Zou et al., 2020), the CRE is reduced to a still not irrelevant range of −0.24 (−0.48) to 0.22 (0.45) W m−2.
The numbers of the radiative forcing caused by UTC calculated here can be put into perspective by the radiative forcing determined for CO2 and other greenhouse gases. In a similarly designed study, Myhre et al. (2009b) analysed SW, LW, and the net radiative effect of a stratospheric water vapour (SWV) enhancement as well as the effects of contrail cirrus in a comparison of various radiative transport models. An overall global change in SWV from 3.0 to 3.7 ppmv resulted in a net radiative forcing (LW + SW) of 0.22 to 0.49 W m−2 depending on the specific model. This is a similar value and range as for the 10 µm particle size in the CRE results for UTCs presented above (Table 1), with a mean 100 % cloud-cover – clearly an overestimate of the real atmosphere. A typical contrail cirrus with an optical depth of 0.3 and a 100 % coverage resulted in a CRE of −14 to −7 W m−2 for a high SZA (75∘) and a positive CRE of 12–23 W m−2 for a low SZA (30∘). Similar to the UTCs focused on for this study, the CRE of optically thin contrails is very sensitive to the SZA; depending on the sunlight hours and the maximum SZA, the overall CRE can change from negative to positive effects. Finally, Myhre and colleagues made a more realistic estimate of the global coverage of contrails and the resulting CRE. Four models deliver a rather good consistency in the range of 9.3 to 15 mW m−2 (warming), which is significantly smaller than the estimates found above for 10 % and 20 % coverage of global UTCs with Reff = 10 µm. Only if we further reduce the global coverage to 1 % (to be consistent with the contrails coverage), is the CRE of UTCs in the range of −22 to 18 mW m−2 for Reff = 5 µm and −5 to 9 mW m−2 for 10 µm, where the warming of hexagonal shapes and aggregates fits well with the contrails. However, these estimates indicate a significantly larger CRE for UTCs than contrails.
Although the presented study specifies only first estimates of the CRE under various conditions, the results presented here show the priority to better constrain the number (coverage) and vertical thickness of UTCs in the lower stratosphere and tropopause region. This would help to determine how important it is to consider UTCs in future climate model simulations. This would also help to prove whether UTCs are at least to some extent considered in the current very common cloud dataset composed of radar and lidar space measurements (e.g. Delanoë and Hogan, 2008; Deng et al., 2010).
4.4 Possible impact on circulation patterns
Such optically thin clouds, like those reported above, may be important for the radiation budget of the upper troposphere and lower stratosphere and thus for modifying the mean tropopause temperature. They may thus indirectly control the amount of water vapour entering the stratosphere and influence circulation pattern. Radiative vertical flux profiles could be converted to heating rates (e.g. Kato et al., 2019), and a large cloud heating rate was shown to strongly modulate circulation patterns (e.g. Voigt et al., 2021; Gasparini et al., 2023). This activity could be the topic of follow-up work of the present study.
The present study reports the radiative effect of optically ultra-thin cirrus clouds. Our sensitivity simulations with different ice particle sizes and shapes for those clouds provide an uncertainty range for their CRE during both summer and winter months. Cloud top height and ice water content are based on CRISTA-2 retrievals, while the cloud vertical thicknesses were assumed to be 0.5 or 2 km. Most of the model scenarios (August and February) result in a positive cloud radiative effect (warming) in the mean range of −2.43 to 2.28 W m−2 for August conditions (Table 1) and 100 % cloud coverage. Reff is the leading parameter for maximum cooling and warming; the smaller the particles, the larger the amplitude of the CRE. Ice aggregates and hexagonal particles showed the ability to change the sign of the CRE from cooling to warming when estimating February conditions with a simplified approach by mirroring the CRISTA observation onto the winter atmosphere and considering albedo changes. Summer conditions with extended sunlit hours produce large cooling rates over the day so that the SW cooling effect can dominate the LW warming effect, although spherical particles always show a mean net warming effect.
Overall, the cooling and warming effects are nearly in balance for UTCs and the typical uncertainties in the various input parameters of the radiative transport calculation (e.g. particle type, effective radius, or cloud layer thickness) makes it problematic to reliably quantify the net radiative effect. So far UTCs are an unnoticed cirrus cloud type in many fields, from cloud microphysical modelling to the parameterisation of the formation processes for various types in global models. Further investigations on the particle shape, effective radius, cloud coverage, and vertical thickness of UTCs are suggested here to minimise the uncertainties in the radiative transport calculations. Finally, such work should allow a more accurate quantification of the cooling or warming potential of UTCs.
SOCRATES is a model hosted by the UK Meteorological Office and is accessible after registration at https://code.metoffice.gov.uk/trac/socrates/wiki (last access: 30 November 2022). Model input (CRISTA-2 and meteorological reanalysis data) and output data by SOCRATES used in this study are available on request from the first author. In addition, all program codes in IDL used for the data analysis are available from the first author.
All authors designed the study. RS analysed and prepared the CRISTA data for the model runs. AR performed the SOCRATES runs and prepared the output files for radiative effect calculations. RS together with AR analysed the model output. All authors contributed to data interpretation and the writing of the paper.
At least one of the (co-)authors is a member of the editorial board of Atmospheric Chemistry and Physics.
Publisher's note: Copernicus Publications remains neutral with regard to jurisdictional claims made in the text, published maps, institutional affiliations, or any other geographical representation in this paper. While Copernicus Publications makes every effort to include appropriate place names, the final responsibility lies with the authors.
The authors would like to thank Dirk Offermann and the former CRISTA team at the University of Wuppertal, Germany, for the realisation of two successful instrument missions and the subsequent data processing. Thanks to the UK Meteorological Office for providing and supporting the SOCRATES radiative transport model. The authors are grateful to the European Centre for Medium-Range Weather Forecasts (ECMWF) for providing reanalysis data.
The article processing charges for this open-access publication were covered by the Forschungszentrum Jülich.
This paper was edited by Jianzhong Ma and reviewed by Blaž Gasparini and Andrew Heymsfield.
Avery, M., Winker, D., Heymsfield, A., Vaughan, M., Young, S., Hu, Y., and Trepte, C.: Cloud ice water content retrieved from the CALIOP space-based lidar, Geophys. Res. Lett., 39, L05808, https://doi.org/10.1029/2011GL050545, 2012. a
Balmes, K. A. and Fu, Q.: An Investigation of Optically Very Thin Ice Clouds from Ground-Based ARM Raman Lidars, Atmosphere, 9, 445, https://doi.org/10.3390/atmos9110445, 2018. a, b, c
Baran, A. J.: Simulation of infrared scattering from ice aggregates by use of a size-shape distribution of circular ice cylinders, Appl. Optics, 42, 2811–2818, https://doi.org/10.1364/AO.42.002811, 2003. a, b
Baran, A. J. and Francis, P. N.: On the radiative properties of cirrus cloud at solar and thermal wavelengths: A test of model consistency using high-resolution airborne radiance measurements, Q. J. Roy. Meteor. Soc., 130, 763–778, https://doi.org/10.1256/qj.03.151, 2004. a
Baran, A. J., Havemann, S., and Mackowski, D.: A database of hexagonal column optical properties for wavelengths ranging between 0.2 microns to 30 microns, produced for ANNEX 7. Contract No. 4b/3/02, DEFRA, UK, 2001. a
Baran, A. J., Hill, P., Furtado, K., Field, P., and Manners, J.: A Coupled Cloud Physics–Radiation Parameterization of the Bulk Optical Properties of Cirrus and Its Impact on the Met Office Unified Model Global Atmosphere 5.0 Configuration, J. Climate, 27, 7725–7752, https://doi.org/10.1175/JCLI-D-13-00700.1, 2014. a, b
Baran, A. J., Hill, P., Walters, D., Hardiman, S. C., Furtado, K., Field, P. R., and Manners, J.: The Impact of Two Coupled Cirrus Microphysics–Radiation Parameterizations on the Temperature and Specific Humidity Biases in the Tropical Tropopause Layer in a Climate Model, J. Climate, 29, 5299–5316, https://doi.org/10.1175/JCLI-D-15-0821.1, 2016. a
Bartolome Garcia, I., Spang, R., Ungermann, J., Griessbach, S., Krämer, M., Höpfner, M., and Riese, M.: Observation of cirrus clouds with GLORIA during the WISE campaign: detection methods and cirrus characterization, Atmos. Meas. Tech., 14, 3153–3168, https://doi.org/10.5194/amt-14-3153-2021, 2021. a, b, c, d, e, f, g
Boucher, O., Randall, D., Artaxo, P., Bretherton, C., Feingold, G., Forster, P., Kerminen, V.-M., Kondo, Y., Liao, H., Lohmann, U., Rasch, P., Satheesh, S. K., Sherwood, S., Stevens, B., and Zhang, X. Y.: Clouds and aerosols, in: Climate Change 2013: The Physical Science Basis, Contribution of Working Group I to the Fifth Assessment Report of the Intergovernmental Panel on Climate Change, edited by: Stocker, T. F., Qin, D., Plattner, G.-K., Tignor, M., Allen, S. K., Boschung, J., Nauels, A., Xia, Y., Bex, V., and Midgley, P. M., Cambridge University Press, 571–657, doi:10.1017/CBO9781107415324.016., 2013. a
Davis, S., Hlavka, D., Jensen, E., Rosenlof, K., Yang, Q., Schmidt, S., Borrmann, S., Frey, W., Lawson, P., Voemel, H., and Bui, T. P.: In situ and lidar observations of tropopause subvisible cirrus clouds during TC4, J. Geophys. Res.-Atmos., 115, D00J17, https://doi.org/10.1029/2009JD013093, 2010. a, b, c
Delanoë, J. and Hogan, R. J.: A variational scheme for retrieving ice cloud properties from combined radar, lidar, and infrared radiometer, J. Geophys. Res.-Atmos., 113, D07204, https://doi.org/10.1029/2007JD009000, 2008. a, b
Deng, M., Mace, G. G., Wang, Z., and Okamoto, H.: Tropical Composition, Cloud and Climate Coupling Experiment validation for cirrus cloud profiling retrieval using CloudSat radar and CALIPSO lidar, J. Geophys. Res.-Atmos., 115, D00J15, https://doi.org/10.1029/2009JD013104, 2010. a, b
Edwards, J. M. and Slingo, A.: Studies with a flexible new radiation code. I: Choosing a configuration for a large-scale model, Q. J. Roy. Meteor. Soc., 122, 689–719, https://doi.org/10.1002/qj.49712253107, 1996. a
Fischer, H., Birk, M., Blom, C., Carli, B., Carlotti, M., von Clarmann, T., Delbouille, L., Dudhia, A., Ehhalt, D., Endemann, M., Flaud, J. M., Gessner, R., Kleinert, A., Koopman, R., Langen, J., López-Puertas, M., Mosner, P., Nett, H., Oelhaf, H., Perron, G., Remedios, J., Ridolfi, M., Stiller, G., and Zander, R.: MIPAS: an instrument for atmospheric and climate research, Atmos. Chem. Phys., 8, 2151–2188, https://doi.org/10.5194/acp-8-2151-2008, 2008. a
Forster, P., Storelvmo, T., Armour, K., Collins, W., Dufresne, J.-L., Frame, D., Lunt, D., Mauritsen, T., Palmer, M., Watanabe, M., Wild, M., and Zhang, H.: The Earth's Energy Budget, Climate Feedbacks, and Climate Sensitivity, in: Climate Change 2021: The Physical Science Basis. Contribution of Working Group I to the Sixth Assessment Report of the Intergovernmental Panel on Climate Change, Cambridge University Press, Cambridge, United Kingdom and New York, NY, USA, https://doi.org/10.1017/9781009157896.009, p. 923–1054, 2021. a
Gasparini, B., Meyer, A., Neubauer, D., Münch, S., and Lohmann, U.: Cirrus Cloud Properties as Seen by the CALIPSO Satellite and ECHAM-HAM Global Climate Model, J. Climate, 31, 1983–2003, https://doi.org/10.1175/JCLI-D-16-0608.1, 2018. a
Gasparini, B., Sokol, A. B., Wall, C. J., Hartmann, D. L., and Blossey, P. N.: Diurnal Differences in Tropical Maritime Anvil Cloud Evolution, J. Climate, 35, 1655–1677, https://doi.org/10.1175/JCLI-D-21-0211.1, 2022. a
Gasparini, B., Sullivan, S. C., Sokol, A. B., Kärcher, B., Jensen, E., and Hartmann, D. L.: Opinion: Tropical cirrus – From micro-scale processes to climate-scale impacts, EGUsphere [preprint], https://doi.org/10.5194/egusphere-2023-1214, 2023. a
Gettelman, A. and Sherwood, S.: Processes Responsible for Cloud Feedback, Current Climate Change Reports, 2, 179–189, https://doi.org/10.1007/s40641-016-0052-8, 2016. a
Grossmann, K. U., Offermann, D., Gusev, O., Oberheide, J., Riese, M., and Spang, R.: The CRISTA-2 Mission, J. Geophys. Res., 107, 8173,, https://doi.org/10.1029/2001JD000667, 2002. a
Hersbach, H., Bell, B., Berrisford, P., Hirahara, S., Horányi, A., Muñoz-Sabater, J., Nicolas, J., Peubey, C., Radu, R., Schepers, D., Simmons, A., Soci, C., Abdalla, S., Abellan, X., Balsamo, G., Bechtold, P., Biavati, G., Bidlot, J., Bonavita, M., De Chiara, G., Dahlgren, P., Dee, D., Diamantakis, M., Dragani, R., Flemming, J., Forbes, R., Fuentes, M., Geer, A., Haimberger, L., Healy, S., Hogan, R. J., Hólm, E., Janisková, M., Keeley, S., Laloyaux, P., Lopez, P., Lupu, C., Radnoti, G., de Rosnay, P., Rozum, I., Vamborg, F., Villaume, S., and Thépaut, J.-N.: The ERA5 global reanalysis, Q. J. Roy. Meteor. Soc., 146, 1999–2049, https://doi.org/10.1002/qj.3803, 2020. a
Heymsfield, A. J. and Platt, C. M. R.: A Parameterization of the Particle Size Spectrum of Ice Clouds in Terms of the Ambient Temperature and the Ice Water Content, J. Atmos. Sci., 41, 846–855, https://doi.org/10.1175/1520-0469(1984)041<0846:APOTPS>2.0.CO;2, 1984. a, b
Heymsfield, A. J., Krämer, M., Luebke, A., Brown, P., Cziczo, D. J., Franklin, C., Lawson, P., Lohmann, U., McFarquhar, G., Ulanowski, Z., and Tricht, K. V.: Cirrus Clouds, Meteor. Mon., 58, 2.1 – 2.26, https://doi.org/10.1175/AMSMONOGRAPHS-D-16-0010.1, 2017. a, b
Hoffmann, L. and Spang, R.: An assessment of tropopause characteristics of the ERA5 and ERA-Interim meteorological reanalyses, Atmos. Chem. Phys., 22, 4019–4046, https://doi.org/10.5194/acp-22-4019-2022, 2022. a, b, c
Hong, Y. and Liu, G.: The Characteristics of Ice Cloud Properties Derived from CloudSat and CALIPSO Measurements, J. Climate, 28, 3880–3901, https://doi.org/10.1175/JCLI-D-14-00666.1, 2015. a
Hong, Y., Liu, G., and Li, J.-L. F.: Assessing the Radiative Effects of Global Ice Clouds Based on CloudSat and CALIPSO Measurements, J. Climate, 29, 7651–7674, https://doi.org/10.1175/JCLI-D-15-0799.1, 2016. a, b, c, d, e, f, g, h, i, j
Kato, S., Rose, F. G., Ham, S. H., Rutan, D. A., Radkevich, A., Caldwell, T. E., Sun-Mack, S., Miller, W. F., and Chen, Y.: Radiative Heating Rates Computed With Clouds Derived From Satellite-Based Passive and Active Sensors and their Effects on Generation of Available Potential Energy, J. Geophys. Res.-Atmos., 124, 1720–1740, https://doi.org/10.1029/2018JD028878, 2019. a
Krämer, M., Rolf, C., Luebke, A., Afchine, A., Spelten, N., Costa, A., Meyer, J., Zöger, M., Smith, J., Herman, R. L., Buchholz, B., Ebert, V., Baumgardner, D., Borrmann, S., Klingebiel, M., and Avallone, L.: A microphysics guide to cirrus clouds – Part 1: Cirrus types, Atmos. Chem. Phys., 16, 3463–3483, https://doi.org/10.5194/acp-16-3463-2016, 2016. a
Krämer, M., Rolf, C., Spelten, N., Afchine, A., Fahey, D., Jensen, E., Khaykin, S., Kuhn, T., Lawson, P., Lykov, A., Pan, L. L., Riese, M., Rollins, A., Stroh, F., Thornberry, T., Wolf, V., Woods, S., Spichtinger, P., Quaas, J., and Sourdeval, O.: A microphysics guide to cirrus – Part 2: Climatologies of clouds and humidity from observations, Atmos. Chem. Phys., 20, 12569–12608, https://doi.org/10.5194/acp-20-12569-2020, 2020. a
Kunz, A., Müller, R., Homonnai, V., Jánosi, I., Hurst, D., Rap, A., Forster, P., Rohrer, F., Spelten, N., and Riese, M.: Extending water vapor trend observations over Boulder into the tropopause region: trend uncertainties and resulting radiative forcing, J. Geophys. Res., 118, 11269–11284, https://doi.org/10.1002/jgrd.50831, 2013. a
Lawson, R. P., Woods, S., Jensen, E., Erfani, E., Gurganus, C., Gallagher, M., Connolly, P., Whiteway, J., Baran, A. J., May, P., Heymsfield, A., Schmitt, C. G., McFarquhar, G., Um, J., Protat, A., Bailey, M., Lance, S., Muehlbauer, A., Stith, J., Korolev, A., Toon, O. B., and Krämer, M.: A Review of Ice Particle Shapes in Cirrus formed In Situ and in Anvils, J. Geophys. Res.-Atmos., 124, 10049–10090, https://doi.org/10.1029/2018JD030122, 2019. a, b
Liou, K.-N.: Influence of Cirrus Clouds on Weather and Climate Processes: A Global Perspective, Mon. Weather Rev., 114, 1167–1199, https://doi.org/10.1175/1520-0493(1986)114<1167:IOCCOW>2.0.CO;2, 1986. a
Luo, B. P., Peter, T., Fueglistaler, S., Wernli, H., Wirth, M., Kiemle, C., Flentje, H., Yushkov, V. A., Khattatov, V., Rudakov, V., Thomas, A., Borrmann, S., Toci, G., Mazzinghi, P., Beuermann, J., Schiller, C., Cairo, F., Di Donfrancesco, G., Adriani, A., Volk, C. M., Strom, J., Noone, K., Mitev, V., MacKenzie, R. A., Carslaw, K. S., Trautmann, T., Santacesaria, V., and Stefanutti, L.: Dehydration potential of ultrathin clouds at the tropical tropopause, Geophys. Res. Lett., 30, 1557, https://doi.org/10.1029/2002GL016737, 2003. a
Massie, S. T., Gille, J., Craig, C., Khosravi, R., Barnett, J., Read, W., and Winker, D.: HIRDLS and CALIPSO observations of tropical cirrus, J. Geophys. Res.-Atmos., 115, D00H11, https://doi.org/10.1029/2009JD012100, 2010. a
Matus, A. V. and L'Ecuyer, T. S.: The role of cloud phase in Earth's radiation budget, J. Geophys. Res.-Atmos., 122, 2559–2578, https://doi.org/10.1002/2016JD025951, 2017. a
McFarquhar, G. M. and Heymsfield, A. J.: Parameterization of Tropical Cirrus Ice Crystal Size Distributions and Implications for Radiative Transfer: Results from CEPEX, J. Atmos. Sci., 54, 2187–2200, https://doi.org/10.1175/1520-0469(1997)054<2187:POTCIC>2.0.CO;2, 1997. a
McFarquhar, G. M., Yang, P., Macke, A., and Baran, A. J.: A New Parameterization of Single Scattering Solar Radiative Properties for Tropical Anvils Using Observed Ice Crystal Size and Shape Distributions, J. Atmos. Sci., 59, 2458–2478, https://doi.org/10.1175/1520-0469(2002)059<2458:ANPOSS>2.0.CO;2, 2002. a
Myhre, G., Berglen, T. F., Johnsrud, M., Hoyle, C. R., Berntsen, T. K., Christopher, S. A., Fahey, D. W., Isaksen, I. S. A., Jones, T. A., Kahn, R. A., Loeb, N., Quinn, P., Remer, L., Schwarz, J. P., and Yttri, K. E.: Modelled radiative forcing of the direct aerosol effect with multi-observation evaluation, Atmos. Chem. Phys., 9, 1365–1392, https://doi.org/10.5194/acp-9-1365-2009, 2009a. a
Myhre, G., Kvalevg, M., Rädel, G., Cook, J., Shine, K. P., Clark, H., Karcher, F., Markowicz, K., Kardas, A., Wolkenberg, P., Balkanski, Y., Ponater, M., Forster, P., Rap, A., and Leon, R. R.: Intercomparison of radiative forcing calculations of stratospheric water vapour and contrails, Meteorol. Z., 18, 585–596, https://doi.org/10.1127/0941-2948/2009/0411, 2009b. a, b
Nugent, J. M., Turbeville, S. M., Bretherton, C. S., Blossey, P. N., and Ackerman, T. P.: Tropical Cirrus in Global Storm-Resolving Models: 1. Role of Deep Convection, Earth Space Sci., 9, e2021EA001965, https://doi.org/10.1029/2021EA001965, 2022. a
Offermann, D., Grossmann, K.-U., Barthol, P., Knieling, P., Riese, M., and Trant, R.: Cryogenic Infrared Spectrometers and Telescopes for the Atmosphere (CRISTA) experiment and middle atmosphere variability, J. Geophys. Res., 104, 16311–16325, 1999. a
Peter, Th., Luo, B. P., Wirth, M., Kiemle, C., Flentje, H., Yushkov, V. A., Khattatov, V., Rudakov, V., Thomas, A., Borrmann, S., Toci, G., Mazzinghi, P., Beuermann, J., Schiller, C., Cairo, F., Di Donfrancesco, G., Adriani, A., Volk, C. M., Strom, J., Noone, K., Mitev, V., MacKenzie, R. A., Carslaw, K. S., Trautmann, T., Santacesaria, V., and Stefanutti, L.: Ultrathin Tropical Tropopause Clouds (UTTCs): I. Cloud morphology and occurrence, Atmos. Chem. Phys., 3, 1083–1091, https://doi.org/10.5194/acp-3-1083-2003, 2003. a
Rap, A., Forster, P. M., Jones, A., Boucher, O., Haywood, J. M., Bellouin, N., and De Leon, R. R.: Parameterization of contrails in the UK Met Office Climate Model, J. Geophys. Res.-Atmos., 115, D10205, https://doi.org/10.1029/2009JD012443, 2010. a
Rap, A., Scott, C. E., Spracklen, D. V., Bellouin, N., Forster, P. M., Carslaw, K. S., Schmidt, A., and Mann, G.: Natural aerosol direct and indirect radiative effects, Geophys. Res. Lett., 40, 3297–3301, https://doi.org/10.1002/grl.50441, 2013. a
Rap, A., Richards, N. A. D., Forster, P. M., Monks, S. A., Arnold, S. R., and Chipperfield, M. P.: Satellite constraint on the tropospheric ozone radiative effect, Geophys. Res. Lett., 42, 5074–5081, https://doi.org/10.1002/2015GL064037, 2015a. a
Rap, A., Spracklen, D. V., Mercado, L., Reddington, C. L., Haywood, J. M., Ellis, R. J., Phillips, O. L., Artaxo, P., Bonal, D., Restrepo Coupe, N., and Butt, N.: Fires increase Amazon forest productivity through increases in diffuse radiation, Geophys. Res. Lett., 42, 4654–4662, https://doi.org/10.1002/2015GL063719, 2015b. a
Rap, A., Scott, C., Reddington, C., Mercado, L., Ellis, R., Garraway, S., Evans, M., Beerling, D., MacKenzie, A., Hewitt, C., and Spracklen, D.: Enhanced global primary production by biogenic aerosol via diffuse radiation fertilization, Nat. Geosci., 11, 640–644, https://doi.org/10.1038/s41561-018-0208-3, 2018. a
Riese, M., Ploeger, F., Rap, A., Vogel, B., Konopka, P., Dameris, M., and Forster, P.: Impact of uncertainties in atmospheric mixing on simulated UTLS composition and related radiative effects, J. Geophys. Res., 117, D16305, https://doi.org/10.1029/2012JD017751, 2012. a, b, c
Riese, M., Oelhaf, H., Preusse, P., Blank, J., Ern, M., Friedl-Vallon, F., Fischer, H., Guggenmoser, T., Höpfner, M., Hoor, P., Kaufmann, M., Orphal, J., Plöger, F., Spang, R., Suminska-Ebersoldt, O., Ungermann, J., Vogel, B., and Woiwode, W.: Gimballed Limb Observer for Radiance Imaging of the Atmosphere (GLORIA) scientific objectives, Atmos. Meas. Tech., 7, 1915–1928, https://doi.org/10.5194/amt-7-1915-2014, 2014. a
Rodríguez De León, R., Lim, L. L., Lee, D. S., Bennett, M., and Krämer, M.: Simple Versus Complex Physical Representation of the Radiative Forcing From Linear Contrails: A Sensitivity Analysis, J. Geophys. Res.-Atmos., 123, 2831–2840, https://doi.org/10.1002/2017JD027861, 2018. a, b
Rother, T., Schmidt, K., Wauer, J., Shcherbakov, V., and Gayet, J.-F.: Light scattering on Chebyshev particles of higher order, Appl. Optics, 45, 6030–6037, https://doi.org/10.1364/AO.45.006030, 2006. a
Sassen, K. and Cho, B. S.: Subvisual-thin cirrus lidar data set for satellite verification and climatological research, J. Appl. Meteorol., 31, 1275–1285, https://doi.org/10.1175/1520-0450(1992)031<1275:STCLDF>2.0.CO;2, 1992. a
Sherwood, S. C., Webb, M. J., Annan, J. D., Armour, K. C., Forster, P. M., Hargreaves, J. C., Hegerl, G., Klein, S. A., Marvel, K. D., Rohling, E. J., Watanabe, M., Andrews, T., Braconnot, P., Bretherton, C. S., Foster, G. L., Hausfather, Z., von der Heydt, A. S., Knutti, R., Mauritsen, T., Norris, J. R., Proistosescu, C., Rugenstein, M., Schmidt, G. A., Tokarska, K. B., and Zelinka, M. D.: An Assessment of Earth's Climate Sensitivity Using Multiple Lines of Evidence, Rev. Geophys., 58, e2019RG000678, https://doi.org/10.1029/2019RG000678, 2020. a
Spang, R., Eidmann, G., Riese, M., Offermann, D., Preusse, P., Pfister, L., and Wang, P.-H.: CRISTA observations of cirrus clouds around the tropopause, J. Geophys. Res.-Atmos., 107, CRI 2-1–CRI 2-18, https://doi.org/10.1029/2001JD000698, 2002. a, b, c, d
Spang, R., Remedios, J., and Barkley, M.: Colour indices for the detection and differentiation of cloud types in infra-red limb emission spectra, Adv. Space Res., 33, 1041–1047, https://doi.org/10.1016/S0273-1177(03)00585-4, 2004. a, b, c
Spang, R., Hoffmann, L., Kullmann, A., Olschewski, F., Preusse, P., Knieling, P., Schroeder, S., Stroh, F., Weigel, K., and Riese, M.: High resolution limb observations of clouds by the CRISTA-NF experiment during the SCOUT-O3 tropical aircraft campaign, Adv. Space Res., 42, 1765–1775, https://doi.org/10.1016/j.asr.2007.09.036, 2008. a, b
Spang, R., Arndt, K., Dudhia, A., Höpfner, M., Hoffmann, L., Hurley, J., Grainger, R. G., Griessbach, S., Poulsen, C., Remedios, J. J., Riese, M., Sembhi, H., Siddans, R., Waterfall, A., and Zehner, C.: Fast cloud parameter retrievals of MIPAS/Envisat, Atmos. Chem. Phys., 12, 7135–7164, https://doi.org/10.5194/acp-12-7135-2012, 2012. a, b, c, d, e, f, g
Spang, R., Günther, G., Riese, M., Hoffmann, L., Müller, R., and Griessbach, S.: Satellite observations of cirrus clouds in the Northern Hemisphere lowermost stratosphere, Atmos. Chem. Phys., 15, 927–950, https://doi.org/10.5194/acp-15-927-2015, 2015. a, b, c, d, e, f, g, h, i, j, k, l, m
Turbeville, S. M., Nugent, J. M., Ackerman, T. P., Bretherton, C. S., and Blossey, P. N.: Tropical Cirrus in Global Storm-Resolving Models: 2. Cirrus Life Cycle and Top-of-Atmosphere Radiative Fluxes, Earth Space Sci., 9, e2021EA001978, https://doi.org/10.1029/2021EA001978, e2021EA001978 2021EA001978, 2022. a
Ungermann, J., Bartolome, I., Griessbach, S., Spang, R., Rolf, C., Krämer, M., Höpfner, M., and Riese, M.: Cirrus cloud shape detection by tomographic extinction retrievals from infrared limb emission sounder measurements, Atmos. Meas. Tech., 13, 7025–7045, https://doi.org/10.5194/amt-13-7025-2020, 2020. a
Vial, J., Dufresne, J.-L., and Bony, S.: On the interpretation of inter-model spread in CMIP5 climate sensitivity estimates, Clim. Dynam., 41, 3339–3362, https://doi.org/doi:10.1007/s00382-013-1725-9, 2013. a
Voigt, A., Albern, N., Ceppi, P., Grise, K., Li, Y., and Medeiros, B.: Clouds, radiation, and atmospheric circulation in the present-day climate and under climate change, WIREs Clim. Change, 12, e694, https://doi.org/10.1002/wcc.694, 2021. a
Woods, S., Lawson, R. P., Jensen, E., Bui, T. P., Thornberry, T., Rollins, A., Pfister, L., and Avery, M.: Microphysical Properties of Tropical Tropopause Layer Cirrus, J. Geophys. Res.-Atmos., 123, 6053–6069, https://doi.org/10.1029/2017JD028068, 2018. a
Wu, D. L., Jiang, J. H., Read, W. G., Austin, R. T., Davis, C. P., Lambert, A., Stephens, G. L., Vane, D. G., and Waters, J. W.: Validation of the Aura MLS cloud ice water content measurements, J. Geophys. Res.-Atmos., 113, D00A24, https://doi.org/10.1029/2007JD008931, 2008. a
Yang, P., Liou, K. N., Wyser, K., and Mitchell, D.: Parameterization of the scattering and absorption properties of individual ice crystals, J. Geophys. Res.-Atmos., 105, 4699–4718, https://doi.org/10.1029/1999JD900755, 2000. a, b
Yang, P., Baum, B. A., Heymsfield, A. J., Hu, Y. X., Huang, H.-L., Tsay, S.-C., and Ackerman, S.: Single-scattering properties of droxtals, J. Quant. Spectrosc. Ra., 79–80, 1159–1169, https://doi.org/10.1016/S0022-4073(02)00347-3, 2003. a
Yang, P., Wei, H., Huang, H.-L., Baum, B. A., Hu, Y. X., Kattawar, G. W., Mishchenko, M. I., and Fu, Q.: Scattering and absorption property database for nonspherical ice particles in the near- through far-infrared spectral region, Appl. Optics, 44, 5512–5523, https://doi.org/10.1364/AO.44.005512, 2005. a
Yi, B., Yang, P., Baum, B. A., L'Ecuyer, T., Oreopoulos, L., Mlawer, E. J., Heymsfield, A. J., and Liou, K.-N.: Influence of Ice Particle Surface Roughening on the Global Cloud Radiative Effect, J. Atmos. Sci., 70, 2794–2807, https://doi.org/10.1175/JAS-D-13-020.1, 2013. a
Zhang, Z., Yang, P., Kattawar, G. W., Tsay, S.-C., Baum, B. A., Hu, Y., Heymsfield, A. J., and Reichardt, J.: Geometrical-optics solution to light scattering by droxtal ice crystals, Appl. Optics, 43, 2490–2499, https://doi.org/10.1364/AO.43.002490, 2004. a
Zou, L., Griessbach, S., Hoffmann, L., Gong, B., and Wang, L.: Revisiting global satellite observations of stratospheric cirrus clouds, Atmos. Chem. Phys., 20, 9939–9959, https://doi.org/10.5194/acp-20-9939-2020, 2020. a, b, c, d, e, f, g, h
Zou, L., Hoffmann, L., Griessbach, S., Spang, R., and Wang, L.: Empirical evidence for deep convection being a major source of stratospheric ice clouds over North America, Atmos. Chem. Phys., 21, 10457–10475, https://doi.org/10.5194/acp-21-10457-2021, 2021. a
Zou, L., Griessbach, S., Hoffmann, L., and Spang, R.: A global view on stratospheric ice clouds: assessment of processes related to their occurrence based on satellite observations, Atmos. Chem. Phys., 22, 6677–6702, https://doi.org/10.5194/acp-22-6677-2022, 2022. a, b