the Creative Commons Attribution 4.0 License.
the Creative Commons Attribution 4.0 License.
Extreme Saharan dust events expand northward over the Atlantic and Europe, prompting record-breaking PM10 and PM2.5 episodes
Sergio Rodríguez
Jessica López-Darias
Unprecedented extreme Saharan dust (duxt) events have recently expanded northward from subtropical NW Africa to the Atlantic and Europe, with severe impacts on the Canary Islands, mainland Spain and continental Portugal. These six historic duxt episodes occurred on 3–5 and 22–29 February 2020, 15–21 February 2021, 14–17 January 2022, 29 January–1 February 2022, and 14–20 March 2022. We analyzed data of 341 governmental air quality monitoring stations (AQMSs) in Spain (330) and Portugal (11), where PM10 and PM2.5 are measured with European norm (EN) standards, and found that during duxt events PM10 concentrations are underestimated due to technical limitations of some PM10 monitors meaning that they can not properly measure extremely high concentrations. We assessed the consistency of PM10 and PM2.5 data and reconstructed 1690 PM10 (1 h average) data points of 48 and 7 AQMSs in Spain and Portugal, respectively, by using our novel “duxt-r” method. During duxt events, 1 h average PM10 and PM2.5 concentrations were within the range 1000–6000 µg m−3 and 400–1200 µg m−3, respectively. The intense winds leading to massive dust plumes occurred within meteorological dipoles formed by a blocking anticyclone over western Europe and a cutoff low located to the southwest, near the Canary Islands and Cape Verde, or into the Sahara. These cyclones reached this region via two main paths: by deviating southward from the Atlantic mid-latitude westerly circulation or northward from the tropical belt. The analysis of the 2000–2022 PM10 and PM2.5 time series shows that these events have no precedent in this region. The 22–29 February 2020 event led to (24 h average) PM10 and PM2.5 concentrations within the range 600–1840 and 200–404 µg m−3, respectively, being the most intense dust episode ever recorded on the Canary Islands. The 14–20 March 2022 event led to (24 h average) PM10 and PM2.5 values within the range 500–3070 and 100–690 µg m−3 in southeastern Spain, 200–1000 and 60–260 µg m−3 in central Spain, 150–500 and 75–130 µg m−3 in the northern regions of mainland Spain, and within the ranges 200–650 and 30–70 µg m−3 in continental Portugal, respectively, being the most intense dust episode ever recorded in these regions. All duxt events occurred during meteorological anomalies in the Northern Hemisphere characterized by subtropical anticyclones shifting to higher latitudes, anomalous low pressure expanding beyond the tropical belt and amplified mid-latitude Rossby waves. New studies have reported on recent record-breaking PM10 and PM2.5 episodes linked to dipole-induced extreme dust events from North Africa and Asia in a paradoxical context of a multidecadal decrease in dust emissions, a topic that requires further investigation.
- Article
(10261 KB) - Full-text XML
-
Supplement
(729 KB) - BibTeX
- EndNote
Airborne dust aerosol particles are a key component of the Earth system's influence on climate (Kok et al., 2023), ecosystems (Yu et al., 2015), fisheries (Rodríguez et al., 2023) and human health (Domínguez-Rodríguez et al., 2021; Tong et al., 2023). Major dust sources are located in North Africa, the Middle East and inner Asia (Prospero et al., 2002), accounting for ≈ 75 % of global emissions; secondary sources are located in North America and South America, southern Africa, Australia, and at high latitudes (Kok et al., 2023). Because these sources are located in arid regions, they have usually been considered “natural dust sources” (e.g., the bed of naturally dried ancient lakes; Ginoux et al., 2012; Prospero et al., 2002); however, a growing body of evidence is showing that human actions, such as the soil disruption by traditional grazing and agriculture (Katra, 2020; Mulitza et al., 2010; Vukovic et al., 2021), mining (Rodríguez et al., 2011; Zafra-Pérez et al., 2023), drying of water courses and lakes (Ginoux et al., 2012; Govarchin-Ghale et al., 2021), the expansion of intensive agriculture (Lambert et al., 2020), and wildfires (Yu and Ginoux, 2022), are contributing to increasing dust emissions.
Dust storms cause huge socio-economic impacts linked to loss of visibility, road traffic disruption and accidents, deviation of air travel or closure of maritime and air navigation space, cardiovascular and respiratory diseases, loss of soil, and decreases in solar energy production (Cañadillas-Ramallo et al., 2022; Domínguez-Rodríguez et al., 2021; Middleton et al., 2021; Miri and Middleton, 2022; Pi et al., 2020). For this reason, a set of operational “dust services” are available to forecast and monitor dust activity by modeling and satellite observations (Mona et al., 2023). In situ concentrations of PM10 and PM2.5 (respirable particulate matter, PM, smaller than 10 and 2.5 µm, respectively) regularly measured in air quality monitoring networks are commonly used to assess dust impacts and validate dust models (Mona et al., 2023). In southern Europe, Saharan dust events tend to increase PM10 concentrations up to typical values within the range 40–90 µg m−3 (24 h average values), while dust events with (24 h average) PM10>100 µg m−3 are unusual (Millán-Martínez et al., 2021; Pey et al., 2013).
Understanding how climate change is affecting dust emissions is a challenge as these emissions are also affected by the natural atmospheric variability (as traced by the El Niño–Southern Oscillation, North Atlantic Oscillation, Atlantic meridional overturning circulation and other climatic indexes; Evan et al., 2016) and by the changes in atmospheric circulation and soil properties (e.g., humidity and biological crust; Rodriguez-Caballero et al., 2022) as the atmosphere warms due to increasing concentrations of greenhouse gases.
Current climate models are unable to reproduce the historical increase in atmospheric dust loads observed in paleorecords (Kutuzov et al., 2019; Preunkert et al., 2019). Based on models constraining dust emissions, it has been estimated that the global dust mass load in the modern climate is ≈ 56 % higher than in pre-industrial times (Kok et al., 2023), with a maximum dust load in the mid-1980s and a subsequent decrease attributed to a decrease in North African and Asian dust emissions linked to a slowdown of the atmospheric circulation interconnected to global warming (Evan et al., 2016; Jiang et al., 2023; Liu et al., 2020; Middleton, 2019; Ridley et al., 2014; Xie et al., 2023). In this scenario of decreasing dust trends in North Africa and Asia, a series of unexpected extreme dust events has recently occurred.
In March 2018 a “record-breaking Saharan dust plume” crossed the eastern Mediterranean (Kaskaoutis et al., 2019), leading to PM10 values of up to (1 h average) 6000 µg m−3 (Solomos et al., 2018), a 3-fold increase in hospital admissions (Lorentzou et al., 2019; Monteiro et al., 2022) and accelerated snow melting in the Caucasus (Dumont et al., 2020). In June 2020 the so-called “Godzilla record-breaking trans-Atlantic African dust plume” (Bi et al., 2023; Francis et al., 2020, 2022; Pu and Jin, 2021) led to (24 h average) PM10 values of 453 µg m−3 in the Caribbean and PM10 and PM2.5 values of 135 and 74 µg m−3 in the southern United States (Yu et al., 2021), respectively. In March 2021, two “record-breaking dust events” in China (Gui et al., 2022) led to (1 h average) PM10 and PM2.5 values of up to 7525 and 685 µg m−3, respectively (Filonchyk and Peterson, 2022; Zhang et al., 2023). In November 2021, an “extreme dust storm” in Uzbekistan led to (1 h average) PM10 and PM2.5 concentrations of up to 4575 and 705 µg m−3 (Nishonov et al., 2023; Xi et al., 2023), respectively.
In this study we present a set of unprecedented extreme dust events that have recently (2020–2022) expanded northward from North Africa to the Atlantic and Europe, prompting record-breaking PM10 and PM2.5 episodes in Spain. The observed increase in dust activity in the western European and Mediterranean region has recently been studied based on meteorological modeling reanalysis and aerosol optical depth satellite measurements (Cuevas-Agulló et al., 2024). We also focused on the analysis of the consistency of PM10 and PM2.5 data using the governmental air quality monitoring networks during the extreme dust events due to the importance of having suitable data in the public databases used for health effect studies, model validation and constraints, and so on (Mona et al., 2023). Understanding these extreme dust events is crucial for this region, since climate projections forecast the expansion of the North African drylands toward the northwest, increasing the risk of desertification in Spain and Portugal as the subtropical anticyclones expand in a warming climate (Cresswell-Clay et al., 2022; Guiot and Cramer, 2016) with an associated increase in the desert dust load (Gomez et al., 2023; Liu et al., 2024).
2.1 Data of PM10 and PM2.5
We analyzed the 2000–2022 data of PM10 and PM2.5 recorded using the governmental air quality monitoring networks of Spain and Portugal. The data from Spain were recorded at 330 air quality stations distributed across the 17 autonomous communities and the autonomous city of Ceuta, whereas the data from Portugal were collected from 11 stations distributed across the Norte, Centro, Lisbon, Vale do Tejo, Alentejo, Algarve, Madeira and Azores regions.
These stations are integrated in the European air quality monitoring network, which is the largest European infrastructure for PM10 and PM2.5 monitoring and follows standardized methods for measurements, quality assurance (QA) and quality control (QC) (EN-16450:2017 and EN-12341:2015). At these stations, high-temporal-resolution (10 to 60 min) PM10 and PM2.5 data are obtained using automatic monitors based on different principles of measurement, such as beta attenuation, tapered element oscillating microbalance and optical particle sizers (Rodríguez et al., 2012), with technical specifications accomplishing the EN-16450:2017 standard. Data regarding the 24 h average PM10 and PM2.5 values are also obtained following the gravimetric reference method (EN-12341:2015) used for QA and QC assessments and for converting the PM10 and PM2.5 data obtained with the automatic devices to gravimetric equivalent data by using the European reference protocols (EN-16450:2017). The PM10 and PM2.5 data that we used were provided by the Ministry of Ecological Transition and Demographic Challenge and by the air quality departments of the autonomous communities of Spain and the Agência Portuguesa do Ambiente.
2.2 Complementary modeling and satellite data
For each specific study event, we also used data from the National Center for Environmental Prediction/National Center for Atmospheric Research (NCEP/NCAR) meteorological reanalysis (Kalnay et al., 1996); the Modern-Era Retrospective analysis for Research and Applications, Version 2 (MERRA-2), model dust reanalysis (Gelaro et al., 2017); and the satellite Visible Infrared Imaging Radiometer Suite (VIIRS) image sensor onboard the Suomi polar satellite.
The set of extreme dust events, which we refer as duxt or dx episodes, occurred on 3–5 February 2020 (dx-01), 22–29 February 2020 (dx-02), 15–21 February 2021 (dx-03), 14–17 January 2022 (dx-04), 29 January–1 February 2022 (dx-05) and 14–20 March 2022 (dx-06). These duxt events were characterized by dark and reddish “apocalyptic” skies (Figs. 1a, 2a and b). National Spanish and international media (Fig. 1), the European Copernicus platform (Fig. 2c), and the NASA Earth Observatory platform (Fig. 2d) reported on these historic events and their impacts on socio-economic activities. During the impact of the duxt-02 event on the Canary Islands, record-breaking temperatures occurred, wildfires were favored by the windy and dry conditions, solar production energy dropped by a 70 %, maritime and air navigation space was closed, and thousands of flights were canceled with huge economic implications linked to the transfer of tourists between the Canary Islands and Europe (Fig. 1) (Cuevas et al., 2021).
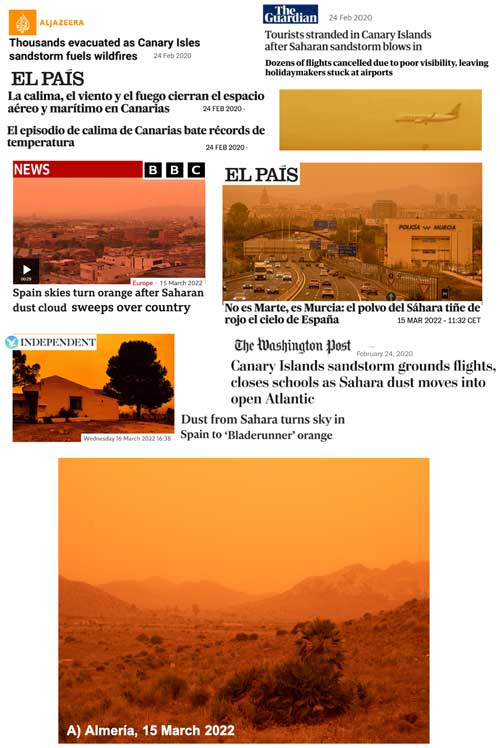
Figure 1News on the extreme dust events impacting mainland Spain and the Canary Islands published in international and Spanish national media. Picture of the Cabo de Gata in southeastern mainland Spain (Almería province) on 15 March 2022 (dx-06) (provided by Eva de Mas Castroverde and taken from Aljazeera on 24 February 2020, The Guardian on 24 February 2020, El País on 24 February 2020, the BBC on 15 March 2022, El País on 15 March 2022, The Independent on 16 March 2022 and The Washington Post on 24 February 2020).
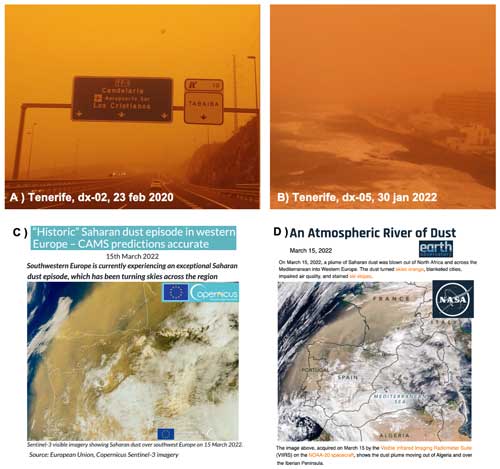
Figure 2Pictures of Tenerife (Canary Islands) on 23 February 2020 (dx-02) and 30 January 2022 (dx-05) (taken by the authors). Composite of the websites of the Copernicus (https://atmosphere.copernicus.eu/historical-saharan-dust-episode-western-europe-cams-predictions-accurate, last access: 16 September 2023) and Earth Observatory (https://earthobservatory.nasa.gov/images/149588/an-atmospheric-river-of-dust, last access: 16 September 2023) platforms reporting on the historic dust event on 15 March 2022.
3.1 Assessment and reconstruction of PMx data during the duxt events
We analyzed the data of PM10 and PM2.5 (PMx) of 330 air quality monitoring stations (AQMSs) in Spain and 11 AQMSs of Portugal. We found that during the duxt events the 0.5 and 1 h resolution data of PM10 increased to reach a rather constant “saturation” value that in most cases was somewhat lower than 1000 µg m−3 (in many cases between 900 and 1000 µg m−3); no values above this threshold appear in the data records. In these cases, PM10 concentrations remained constant during the period of extremely high dust concentrations (typically 5 to 30 h), a behavior that was not generally observed in PM2.5, which exhibited regular variability (with values <1000 µg m−3) and even increases in the periods when PM10 remained (un-consistently) constant. This behavior can be observed in the time series of PM10 (Fig. 3a1–a3) and PM2.5 (Fig. 3b1–b3) linked to the dx-01, dx-02, dx-04, dx-05 and dx-06 events (dx-03 is not included in Fig. 3 for the sake of brevity). This saturation threshold close to ≈ 1000 µg m−3 is the upper operation limit of some PM10 monitors and is also the top value of the validation data flag in some commercial data-recording software used in many governmental air quality monitoring networks, which assume that PM10 concentrations above this threshold may suffer underestimation due to the high load of particles (e.g., particles accumulated in the filter tape of the beta instrument or particle coincidence problems in the optical particle sizers leading to a loss of sensitivity) and consequently do not record values above this threshold. At some AQMSs the saturation threshold was found at 500 µg m−3 and even at 200 µg m−3. In fact, the EN-16450, EN-12341 and EN-14907 accreditations for PM10 and/or PM2.5 monitors available in the European market are obtained for specific ranges, whose most frequent upper limit is 1000 µg m−3 (e.g., Met One™ BAM-1020; Comde Derenda™ APM 2; and Thermo Fisher Scientific™ 5014i, 5030i SHARP, TEOM 1405-F, and 1405-DF), although it can be as low as 200 µg m−3 for some equipment (e.g., FAI™ Swam 5a) and in contrast can be as high as 10 000 µg m−3 for other devices (e.g., PALAS™ Fidas 200 and 200E) according to the certifications agencies (e.g., TÜV; see https://www.qal1.de/, last access: 19 December 2023). In all these cases of PM10 data affected by saturation, we reconstructed the PM10 concentrations with the method described in Fig. 4, which we have called PMx evaluation and reconstruction method based on ratios during extreme dust events or “duxt-r”.
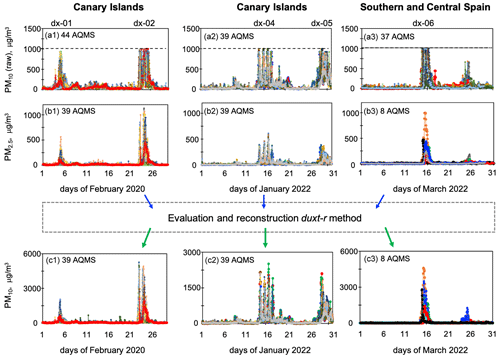
Figure 3Time series of 1 h average PM10 (raw) (a1–a3) and PM2.5 (b1–b3) and evaluated and reconstructed PM10 data (c1–c3) during February 2020, January 2022 and March 2022, indicating the duxt events. The number of AQMSs included in each plot is shown. PM10 (raw) means original raw (non-reconstructed) data (a1–a3). Data for PM2.5 are also raw (b1–b3). PM10 data in plots (c1)–(c3) combine measured valid and reconstructed data.
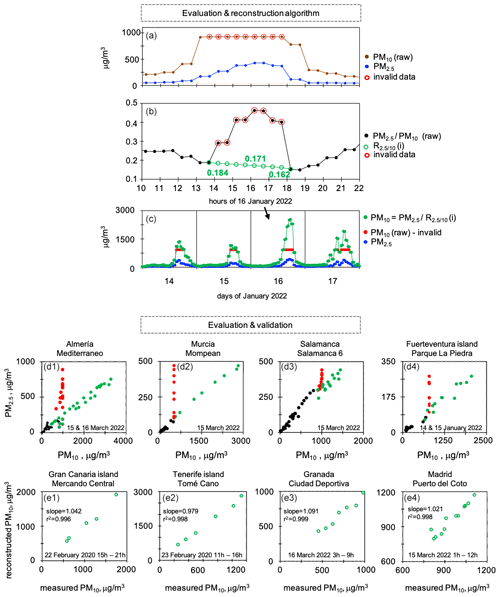
Figure 4Evaluation, reconstruction and validation of data with the duxt-r method. Panels (a)–(c) show data of the El Charco site (Fuerteventura) during the dx-04 event (14–17 January 2022): (a) data of PM10 (raw, i.e., including saturated values) and PM2.5; (b) the measured PM2.5 PM10 (raw) ratio and the interpolated PM2.5 PM10 ratio []; and (c) PM2.5, PM10 (raw), and PM10 reconstructed data. Invalid data due to PM10 underestimation are highlighted with a red circle (a, b) and red points (c, d). (d1–d4) Scatterplot of PM2.5 and PM10 data highlighting valid data (black circle), invalid PM10 data (red circle) and reconstructed PM10 data (green circle). (e1–e4) Reconstructed vs. measured PM10 data. The green numbers in (b) indicate some of the values of the PM2.5 PM10 interpolation.
In this duxt-r method we performed the following steps. (1) We first identified the invalid 1 h (or h or 10 min time resolution) PM10 data affected by saturation and the associated invalid PM2.5 PM10 ratios, highlighted with red circles in the example of the dx-04 event shown in Fig. 4a and b. (2) We second estimated the PM2.5 PM10 ratio during the PM10 saturation period by linear interpolation between the last valid PM2.5 PM10 data point before saturation and the first valid PM2.5 PM10 data point after saturation , highlighted with green points in Fig. 4b. As a result of this interpolation the PM2.5 PM10 ratios we used are not constant, changing hour by hour, e.g., from 0.184 to 0.162 in the example shown in Fig. 4b. (3) Finally, the 1 h (or h or 10 min) resolution PM10 concentrations were determined with Eq. (1). The method was validated using a comparison with data recorded at a few PM10 monitors not affected by saturation (described below).
We found that the PM2.5 PM10 ratios during the duxt events were within the range 0.16 to 0.22 at most of the AQMSs, a value lower than that observed during regular dust events (typically ≈ 0.3) and much lower than that observed in environments affected by secondary particle formation and vehicle exhaust and other combustion emissions (typically within 0.6–0.9) (Rodríguez and López-Darias, 2021).
In our database, we replaced the PM10 saturated data with the new PM10 reconstructed data; i.e., the red (saturated) points shown in Fig. 4c were replaced by the green reconstructed points. At each site (AQMS), the consistency of the reconstructed data was assessed by analyzing the scatter plot of the PM2.5 vs. PM10 data (Fig. 4d1–d4). As an example, the results obtained in AQMSs located in Almería province (Mediterraneo AQMS) and Murcia (Mompean AQMS) in southeastern Spain, Salamanca province (Salamanca-6 AQMS) in central northern Spain, and in Fuerteventura (Canary Islands) is shown (Fig. 4d1–d4). With this method, the red PM10-saturated data shown in Fig. 4d1–d4 were replaced by the green (reconstructed) data.
Because of the technical manufacturing specifications, the automatic PM10 and PM2.5 monitors of two AQMSs were able to record valid and consistent PM10 and PM2.5 data higher than 1000 µg m−3. We used these records to validate this methodology (Fig. 3e1–e4). At these sites, we reconstructed the PM10 concentrations above 1000 µg m−3 as if they had experienced saturation, and we then compared the reconstructed and measured PM10 concentrations. For this comparison we also included data between 500 and 1000 µg m−3 for the purpose of having a larger dataset (i.e., all PM10 data >500 µg m−3). We found that the difference between reconstructed and measured PM10 concentrations ranged between 2 % and 9 % (Fig. 4e1–e4). At a few other AQMSs using beta attenuation devices able to provide PM10>1000 µg m−3, we found a low PM10 variability above this threshold (indicating loss of sensitivity due to mass overload in the filter tape) that was inconsistent with the variability in PM2.5 and that resulted in PM2.5 PM10 ratios similar to those affected by the saturation as described above (red circles in Fig. 3a). At these sites we also reconstructed the PM10 with the duxt-r method (Fig. 4). Finally, the PM10 data measured with the automatic monitors (measured and reconstructed) were converted to gravimetric equivalent data by intercomparison with PM10 data obtained with the gravimetric reference method (EN-12341:2015; 24 h sampling, available during 7 to 25 d per month depending on the AQMS) using the standardized procedure (EN-16450:2017).
The new dataset obtained with this duxt-r method (PM10 measured and reconstructed and then converted to gravimetric equivalent) shows that 1 h average PM10 data that appeared as “saturated” at 1000 µg m−3 actually reached values close to 6000 µg m−3 in the dx-02 event; close to 1400 µg m−3 in the dx-03 event; close to 2000 µg m−3 in the dx-01, dx-04, and dx-05 events; and between 3000 and 4500 µg m−3 in the dx-06 event (Fig. 3c1–c3).
By applying this methodology, we reconstructed a total of 1690 hourly PM10 data points: 1537 hourly PM10 data points belonged to (i) 48 AQMSs in Spain, distributed between the regions Canary Islands (39), Andalusia (5), Murcia (1), Castile y León (2), and Madrid (2), while (ii) 153 hourly PM10 data belonged to 7 AQMSs in Portugal, distributed between the regions Lisbon and Vale do Tejo (6) and Alentejo (1). The data we reconstructed with this method are already available in public databases of the governmental air quality networks of Spain, the Ministry of Ecological Transition and the European Environment Agency. The PM10 data of the other 44 AQMSs that also experienced PM10 saturation could not be reconstructed due to the lack of simultaneous PM2.5 measurements, which included a total of 655 hourly data points; these AQMSs were located on the Canary Islands (14), Andalusia (10), Extremadura (2), Castile y León (11), and Murcia (7). Just to illustrate the huge importance of reconstructing the data, a brief comparison (for a few AQMSs) of the 24 h average PM10 concentrations calculated with saturated PM10 data vs. reconstructed PM10 data: (1) 948 vs. 3069 µg m−3 on 15 March 2022 in Almería province (Mediterraneo AQMS), (2) 740 vs. 1840 µg m−3 on 23 February 2020 on Gran Canaria (Playa del Inglés AQMS), (3) 1238 vs. 1684 µg m−3 on 23 February 2020 in Tenerife (Tomé Cano AQMS), (4) 577 vs. 1421 µg m−3 on 23 February 2020 in Tenerife (Piscina Municipal AQMS), and (5) 527 vs. 621 µg m−3 on 15 March 2022 in Granada province (Palacio de Congresos AQMS). The maximum 1 h average PM10 and PM2.5 recorded during dx-01 to dx-06 are in a selection of AQMSs shown in Figs. S1 and S2 in the Supplement.
3.2 Analysis of the extreme dust events
The first two events occurred in February 2020 (Fig. 5): 3–5 February 2020 (dx-01; Fig. 5a1) and 22–29 February 2020 (dx-02; Fig. 5a2). Throughout a period of 6 weeks (from mid-January to ending February) a blocking anticyclone established over Iberia, i.e., the Iberian Peninsula (Fig. 5f and h), resulting in anomalous easterly wind over central Algeria (wind anomaly not shown for the sake of brevity), a scenario favorable for dust events (Alonso-Pérez et al., 2011b). On 3–5 February 2020 a cyclone reached Cabo Verde, the low-to-high (low over Cabo Verde, high over Iberia) dipole configuration (Fig. 5f) resulted in a strong pressuregeopotential gradient and winds that prompted dust emissions and a dense plume of Saharan dust that expanded over the Atlantic to the Canary Islands and toward the Azores (Fig. 5g). Across the Canary Islands the dx-01 event resulted in (i) 1 h average PM10 and PM2.5 concentrations within the range 300–2100 µg m−3 (Fig. 3c1) and 100–400 µg m−3 (Figs. 3b1; S1a1 and a2), respectively, and (ii) 24 h average PM10 and PM2.5 concentrations within the range 100–535x µg m−3 (Figs. 5a1 and 6a1; x = maximum at Tenerife, San Miguel Tajao AQMS) and 50–165x µg m−3 (Figs. 5a2 and 6a2; x Tenerife, Tomé Cano AQMSs), respectively. For Madeira the dust impact was smoother, with 24 h average PM10 concentrations within the range 50–115 µg m−3 (Fig. 5c), due to the island remaining outside of the core of the dust plume (Fig. 5g). Dust events prompted by the summer North African Dipole Intensity (NAFDI) were originally introduced by Rodríguez et al. (2015). This concept of meteorological L-to-H dipoles has also been found to drive dust events in the Middle East (Kaskaoutis et al., 2015, 2017) and the June 2020 Godzilla duxt event (Francis et al., 2020).
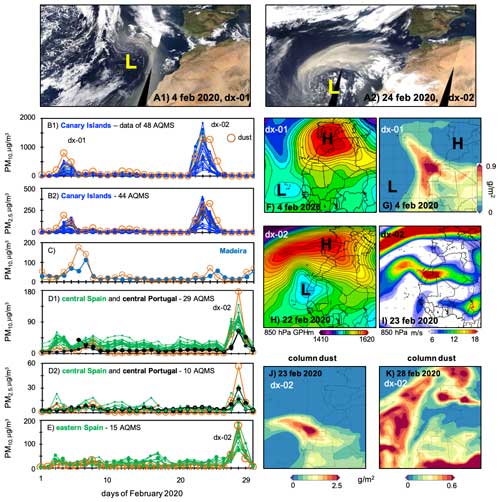
Figure 5Satellite view (NOAA-20 VIIRS) of the dust plume during the first day of the dx-01 (a1) and dx-02 (a2) events. Time series of (24 h average) PM10 and PM2.5 data recorded in AQMSs of the Canary Islands (b1, b2), Madeira (c), central Portugal and Spain (d1, d2), and eastern Spain (e), which include dust and dust2.5 concentrations (µg m−3) obtained with the MERRA-2 model (orange circle) in each region (27–29° N, 15–17.5° W domain for the Canary Islands; 32–34° N, 16–18° W for Madeira; 39–41° N, 9.2–4.3° W for central Portugal and Spain; and 37–41.5° N, 6.8° W–1.2° E for eastern Spain). The geopotential height (GPH) of 850 hPa is shown for the first day of the dx-01 (e) and dx-2 (g) events. Wind vector at 850 hPa for the dx-02 event on 23 February 2020 (e). MERRA-2 column dust load for 4 February 2020 (f), 23 February 2020 (i) and 28 February 2020 (j).
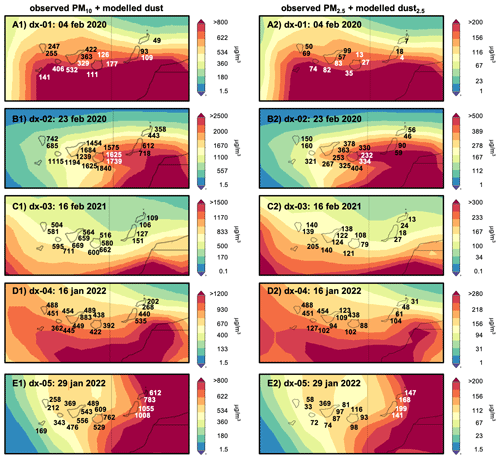
Figure 6Surface dust and dust2.5 concentrations for the MERRA-2 reanalysis (26.5–30.0° N, 19.3–12.0° W) and observed (24 h average) PM10 and PM2.5 measured at AQMSs during specific days of the dx-01, dx-02, dx-03, dx-04 and dx-05 events on the Canary Islands.
On 22 February 2020, a new cyclone reached again the region of Cabo Verde, resulting in a similar L-to-H dipole meteorology (Fig. 5h), which prompted a dusty jet stream in the subtropical North Atlantic, impacting the Canary Islands (Fig. 5a2, h and i). This scenario caused the dark orange skies, record-breaking temperatures, wildfires linked to strong dry winds, closure of maritime and air navigation space, and the widespread flight cancelations described above (Fig. 1) (Cuevas et al., 2021). During this dx-02 event, extreme PMx concentrations were recorded on the Canary Islands, with (i) 1 h average PM10 and PM2.5 concentrations within the range 2000–5254x µg m−3 (Figs. 3c1; S1b1 and b2) (x Gran Canaria, Arinaga AQMS) and 400–1129x µg m−3 (x Gran Canaria, Mercado Central AQMS) (Figs. 3b1 and S1), respectively, and (ii) 24 h average PM10 and PM2.5 concentrations within the range 600–1840x µg m−3 (Figs. 5b1 and 6b1) (x Gran Canaria, Playa del Inglés AQMS) and 200–404x µg m−3 (Figs. 5b2, 6b2) (x Gran Canaria, Playa del Inglés AQMS), respectively. Concentrations (24 h average) of PM10 during this dx-02 event were up to 6 times higher than the upper limit of PM10 during the regular dust events on the Canary Islands (≈ 300 µg m−3) and also much higher than the extraordinary 680 µg m−3 recorded during the dust event of 26 January 2000 (Viana et al., 2002). During this dx-02 episode, the highest 1 h PM10 (3500–5254 µg m−3) and PM2.5 (800–1129 µg m−3) and 24 h average PM10 (1200–1840 µg m−3) and PM2.5 (230–404 µg m−3) concentrations were recorded in the AQMSs located in the central part of the dust plume, on Gran Canaria and Tenerife (Fig. 6b1 and b2) (Fig. S1). After 24 February 2020, the Saharan dust plume shifted northward over the Atlantic, reaching mainland Spain (Fig. 5k) and resulting in (24 h average) PM10 concentrations within the range 70–155 µg m−3 (Fig. 5d1) in central Spain (Madrid, Extremadura and Castilla–La Mancha regions), 70–75 µg m−3 (Fig. 5d1) in central Portugal and 80–200 µg m−3 in eastern Spain (Comunidad Valenciana region) (Fig. 5e). PM2.5 concentrations within the range 20–33 µg m−3 in central Spain and central Portugal (Fig. 5d2). The reanalysis of MERRA-2 properly tracked these two dx-01 and dx-02 events, with dust and dust2.5 (i.e., dust in the PM2.5 fraction) within the range of the PM10 and PM2.5 concentrations recorded at the AQMSs (see orange circles in Fig. 5b–d).
The third duxt event (dx-03: 15–21 February 2021) (Fig. 7d) was also caused by the intense wind (Fig. 7c) linked to a L-to-H dipole meteorology (Fig. 7b), with the associated blocking anticyclone located over Iberia and a cyclone over the Sahel (Fig. 7b). The impact on the Canary Islands occurred during 15–19 February (Fig. 7a1 and a2) and on Madeira during 16–18 February 2021 (Fig. 7a3). On the Canaries, the highest 1 h average PM10 (1000–1352 µg m−3) and PM2.5 (200–326 µg m−3) were recorded on Gran Canaria, Tenerife, La Gomera and La Palma (Fig. S1c1 and c2). The event of 16 February 2021 resulted in 24 h average PM10 and PM2.5 concentrations within the range 400–711x µg m−3 (Figs. 6 and 7a1) (x Las Galletas AQMS, Tenerife) and 80–205x µg m−3 (Figs. 6 and 7a2) (x Las Galanas, La Gomera), respectively. Subsequently, the dusty air mass tracked the northward anticyclonic circulation, resulting in (24 h average) PM10 concentrations within 80–180 µg m−3 on Madeira (Fig. 7a3), reaching central mainland Portugal and Spain (18–21 February 2021; Fig. 7e) and resulting in 24 h average PM10 and PM2.5 concentrations within the range 75–150 µg m−3 (Fig. 7a4) and 20–55 µg m−3 (Fig. 7a4 and a5), respectively. The MERRA-2 reanalysis properly tracked the dx-03 event, except during 16–17 February on Madeira and 21 February in central mainland Spain, when it clearly overestimated dust concentrations (see orange circles in Fig. 7a1–a4). A few days later, 23–28 February 2021, another dust event impacted across central to northern and eastern Europe due to the eastward shift of the low-to-high dipole and the resulting northward dust transport across the central Mediterranean (Meinander et al., 2023; Peshev et al., 2023).
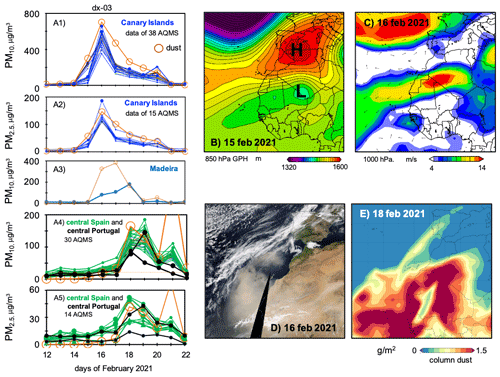
Figure 7Event dx-03. Time series (a1–a4) (1) of (24 h average) PM10 and PM2.5 in AQMSs of the Canary Islands, Madeira, central mainland Portugal and central mainland Spain and (2) of dust and dust2.5 concentrations (µg m−3) obtained with MERRA-2 on the Canary Islands (27–29° N, 15–17.5° W), on Madeira (32–34° N, 16–18° W), and in central mainland Portugal and Spain (39–41° N, 9.2–4.3° W). The geopotential height (GPH) at the 850 hPa level (b, 15 February 2021), wind at 1000 hPa (c, 16 February 2021), the satellite image (NOAA-20 VIIRS) (d, 16 February 2021) and the column dust load (e, 18 February 2021) are included.
Another two extreme dust events occurred in January 2022 (Fig. 8). The dx-04 event impacted the Canary Islands during 14–17 January 2022 (Fig. 8a1), resulting in (24 h average) PM10 and PM2.5 concentrations within the range 275–883x µg m−3 (Figs. 8a1 and 6d1) (x Tenerife, Casa Cuna AQMS) and 60–136x µg m−3 (Figs. 8a2 and 6d2) (x Tenerife, Caletillas AQMS) and 1 h average PM10 and PM2.5 concentrations reaching values within 1200–2170 and 240–550 µg m−3 across the Canaries (Fig. S1d1 and d2), respectively. A few days later, the dx-05 event occurred (29 January–1 February 2022; Fig. 8a2 and a3), again impacting the Canary Islands, resulting in (24 h average) PM10 and PM2.5 concentrations within the range 314–1055x µg m−3 (Figs. 7b1 and 5e1) (x Fuerteventura, El Charco AQMS) and 70–199x µg m−3 (Figs. 8b2 and 6e2) (x El Charco AQMS) and 1 h average PM10 and PM2.5 concentrations reaching values within 1000–2520 and 400–545 µg m−3 in the eastern islands (Fig. S1e1 and e2), respectively. On Madeira, PM10 concentrations ranged within 80–225 µg m−3 during dx-04 and dx-05 (Fig. 8b3). In both cases a massive dust plume was transported northward, approaching Spain and Portugal (Fig. 8d1 and d2). As in the previous cases, these duxt episodes were caused by a low-to-high dipole meteorology, with an anticyclonic core over Europe expanding to North Africa and a cyclone south of the Canary Islands (Fig. 8c1 and c2). In the two events, MERRA-2 clearly overestimated dust concentrations (Fig. 8b1 and b2), suggesting that the model may be transporting dust too low in the atmosphere (O'Sullivan et al., 2020).
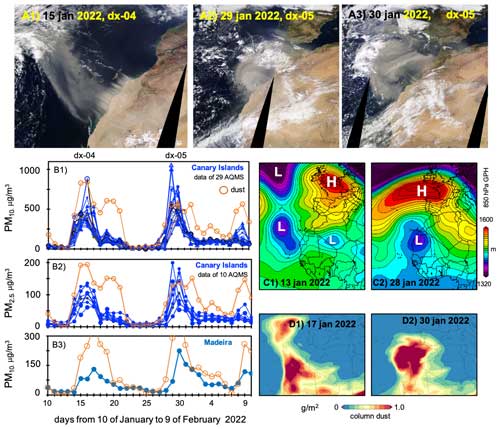
Figure 8Events dx-04 and dx-05. Satellite view (NOAA-20 VIIRS) of the dust plumes (a1–a3). Time series of (24 h average) PM10 and PM2.5 at AQMSs of the Canary Islands (b1, b2) and Madeira (b3) and MERRA-2 surface dust and dust2.5 concentrations on the Canary Islands (27–29° N, 15–17.5° W) and Madeira (32–34° N, 16–18° W). The geopotential height (GPH) at the 850 hPa level (c1, c2) and column dust load (d1, d2) are included.
Finally, the sixth duxt event (dx-06: 15–20 March 2022) first impacted mainland Spain and Portugal and subsequently impacted the Canary Islands (Fig. 9). The event was also prompted by a meteorological low-to-high dipole, linked to the location of Cyclone Celia over Morocco and an anticyclonic core over the central Mediterranean (Fig. 9b). The resulting dusty jet (Fig. 9c–e) expanded from southeastern to northwestern mainland Spain and Portugal on 15 and 16 March 2022. Once in northern Spain, the dust plume split in two branches, a branch that traveled eastward across central Europe tracking the anticyclonic circulation at the north of the high circulation (Qor-El-Aine et al., 2022) and another branch that traveled southward over mainland Portugal to the Canary Islands tracking the cyclonic low circulation (Fig. 9e and f).
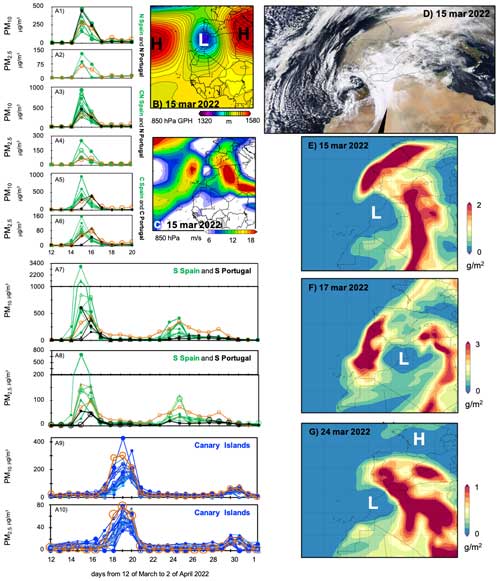
Figure 9Event dx-06. Time series of (24 h average) PM10 and PM2.5 in AQMSs of the Canary Islands (blue time series) and different regions of mainland Spain (green time series) and mainland Portugal (black time series): (a1, a2) northern (N) Spain (Cantabria and Galicia regions) and Portugal (Norte), (a3, a4) central northern (CN) Spain (Castile y León region) and Portugal (Norte), (a5, a6) central (C) Spain (Madrid, Extremadura and Castilla–La Mancha) and Portugal (Centro and northern Alentejo), (a7, a8) southern (S) Spain (Andalusia) and Portugal (southern Alentejo and Algarve), and (a9, a10) the Canary Islands. The plots also include surface dust concentrations in these regions obtained with MERRA-2 reanalysis (a1–a10, orange time series). The geopotential height (GPH) (b) and wind (c) at the 850 hPa level, the satellite NOAA-20 VIIRS image, and column dust load (e–g) are also included.
In Iberia, PMx concentrations experienced a sharp increase from their regular background levels (10–30 µg m−3) to 24 h average PM10 and PM2.5 values within the range (i) 500–3070 and 100–700 µg m−3 in the southern regions of Spain and Portugal (Murcia, Andalusia, Algarve and Alentejo) (Fig. 9a7, a8, and 10), (ii) 200–1000 and 60–160 µg m−3 in the central parts of Spain and Portugal (Castilla–La Mancha, Madrid, Extremadura, and Lisbon and Vale do Tejo) (Figs. 9a5, a6 and 10), (iii) 200–1000 and 60–260 µg m−3 in central northern Spain (Centro and Castile y León) (Figs. 9a3, a4 and 10), and (iv) 150–500 and 75–130 µg m−3 in northern Portugal and Spain (Norte, Cantabria and Galicia) (Figs. 9a1, a2 and 10) during 15–16 March 2022, respectively. In Lisbon, these extremely high PM10 and PM2.5 concentrations were even registered in an indoor environment (Gomes et al., 2022). After several days traveling across thousands of kilometers, the dust plume impacted the Canary Islands during 17–20 March 2022 (Fig. 9f), resulting in (24 h average) PM10 and PM2.5 values within the range 150–430 µg m−3 (Fig. 9a9) and 30–80 µg m−3 (Fig. 9a10), respectively. A regular to intense (no extreme) dust event impacted southern Spain on 24–25 March 2022 (PM10 and PM2.5 of 50–420 and 30–120 µg m−3, respectively) (Fig. 9a7 and a8) and the Canary Islands on 24–25 March 2022 (PM10 and PM2.5 of 40–80 and 20–35 µg m−3, respectively).
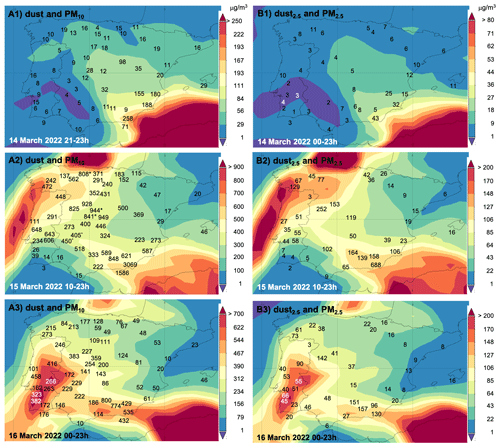
Figure 10Surface concentrations of dust (a1–a3) and dust particles smaller than 2.5 µm (dust2.5) (b1–b3) from 14 to 16 March 2022 in mainland Spain according to MERRA-2 reanalysis. Daily (24 h) average concentrations of PM10 (a1, a2) and PM2.5 (b1, b2) measured at AQMSs are shown with black numbers.
This historic dx-06 event (Fig. 1d and e) started on the evening of 14 March 2022 (>21 h) with a dust inflow in southeastern Spain that led to 24 h average PM10 and PM2.5 concentrations within the range 70–260 and 25–43 µg m−3 (Fig. 10a1 and b1). On 15 March 2022, the massive dust plume moved from southeastern Spain, where it led to 24 h average PM10 values within the range 580–3070 µg m−3 toward the west and northwest of Iberia, resulting in (24 h average) PM10 concentrations within the ranges 825–950 µg m−3 in central Spain, 600–650 µg m−3 in central Portugal, and 440–810 µg m−3 in northern Portugal and northwestern Spain (Fig. 10a2). Concentrations of PM2.5 (24 h average) were within the range 139–690 µg m−3 in southeastern Spain, 25–60 µg m−3 in central Portugal, 100–260 µg m−3 in central Spain, and 50–130 µg m−3 in central northern Portugal and northwestern Spain (Fig. 10b2). These extremely high PMx concentrations were also recorded indoors (Gomes et al., 2022). During 16 March 2022, high PM10 and PM2.5 values were still recorded (Fig. 10a3 and b3), with the highest PM10 concentrations linked to the still ongoing dust inflow in southeastern Spain (800 µg m−3) and the southward transport of dust in southern Portugal (300–330 µg m−3). Because of the massive dust load, solar energy production in Spain dropped by 50 % (Micheli et al., 2024). Details on this event, such as the maximum hourly PM10 and PM2.5 concentrations (Fig. S2) and the names of the AQMS, are provided in the Supplement.
3.3 Record-breaking events
The analysis of the 2000–2022 time series of (24 h average) PM10 (Fig. 11) and PM2.5 (Fig. 12) data show that the duxt events we report here are record-breaking episodes in mainland Spain, continental Portugal and the Canary Islands. The massive dusty air mass that blackened the Iberian Peninsula during 15 and 16 March 2022 (dx-06; Figs. 11 and 12) resulted in the highest PM10 and PM2.5 concentrations ever recorded on a regional scale across northern Spain (Cantabria region; Fig. 11a), central northern Spain (Castile y León region; Figs. 11c and 12a), central Spain (Castilla–La Mancha, Extremadura and Madrid region; Fig. 10d and a), southern Spain (Andalusia region; Figs. 11e, 10f and 12c) and continental Portugal (Fig. 11g). In central Spain (Castilla–La Mancha, Extremadura and Madrid), regular Saharan dust events typically induce (24 h average) PM10 concentrations within the range 40–140 µg m−3 (highlighted with black arrows in Fig. 11d) (Pey et al., 2013; Rodríguez et al., 2001). Anomalous intense dust events such as that which occurred on 22 February 2016 (Sorribas et al., 2017) resulted in PM10 concentrations 200–380 µg m−3, whereas during the dx-06 event AQMSs of this region recorded (24 h) PM10 concentrations within 300–949x µg m−3 (x Villa del Prado AQMS in the Madrid region) (white arrow in Fig. 11d). After analyzing the 2001–2011 time series, Pey et al. (2013) concluded that Saharan dust events inducing PM10>100 µg m−3 (24 h average) are actually rare in the western Mediterranean. The impact of the dx-06 event is not observed in Cataluña since it did not reach northeastern Spain (Fig. 11b).
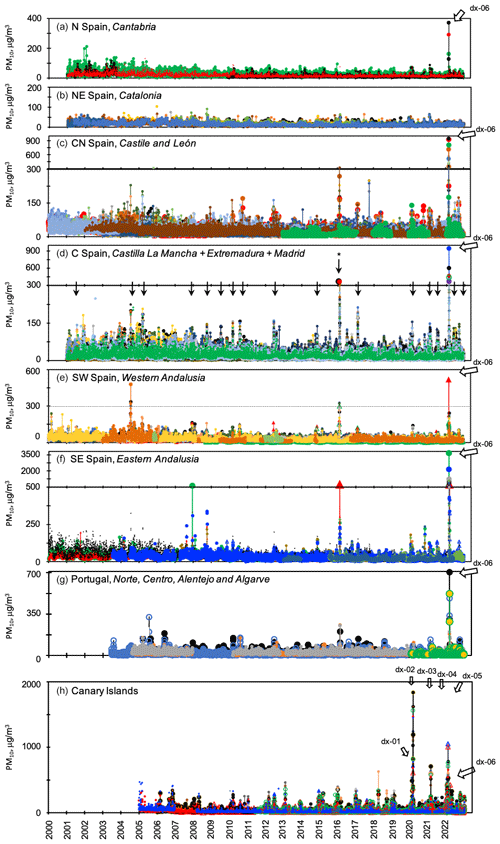
Figure 11Time series (2000–2022) of (24 h average) PM10 concentrations in 123 AQMSs distributed across Portugal (5 AQMSs); northern (N; 3 AQMSs), northeastern (NE; 8 AQMSs), central northern (CN; 30 AQMSs), central (C; 35 AQMSs), southwestern (SW; 16 AQMSs), and southeastern (SE; 11 AQMSs) mainland Spain; and the Canary Islands (15 AQMS). Black arrows indicate regular dust events. White arrows indicate the duxt events. The asterisk indicates the intense event that occurred on 22 February 2016.
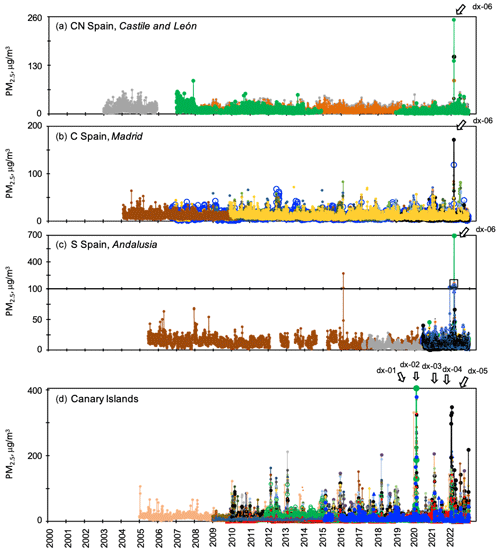
Figure 12Time series (2000–2022) of (24 h average) PM2.5 concentrations of in a total of 74 AQMSs distributed across central northern (CN; 4 AQMS), central (C; 16 AQMS) and southeastern (S; 10 AQMS) mainland Spain and the Canary Islands (44 stations). Black arrows indicate regular dust events. White arrows indicate the duxt events.
On the Canary Islands, the most intense Saharan dust events ever recorded occurred in the period 2020–2022 and were linked to the duxt events described in this study. Since 2005–2020, intense Saharan dust events have regularly been associated with (24 h average) PM10 and PM2.5 values with 200–400 µg m−3 (Fig. 11h) and 100–200 µg m−3 (Fig. 12d), respectively. This PM10 range is similar to (1) that of total suspended particles during Saharan dust events of the period 1998–2003, based on AQMS data not yet normalized to the European standards (Alonso-Pérez et al., 2007, 2012; Viana et al., 2002), and to (2) that of total dust at Izaña Observatory (Tenerife) during the 1987–2014 Saharan dust events (Rodríguez et al., 2015). In contrast, in the period 2020–2022, the duxt events described here led to PM10 and PM2.5 concentrations within the ranges (24 h average) 600–1840 µg m−3 (Fig. 11g) and 200–404 µg m−3 (Fig. 12d), respectively. The three most intense dust events ever recorded on the Canary Islands, exceeding the threshold of 600 µg m−3 of PM10 as 24 h average, in descending order of magnitude, are as follows.
-
The dx-02 event on 23 and 24 February 2020, where the (24 h average) PM10 values averaged at all AQMSs were between 531 and 930 µg m−3 (average of 34 AQMSs distributed over the seven Canary Islands). On 22, 23 and 24 February 2020, a total of 6, 25 and 12 AQMSs recorded a (24 h average) PM10 concentration between 600 and 1840x µg m−3 (x Gran Canaria, Playa del Inglés AQMS). Prior to this event, the (24 h average) PM10 concentrations had only exceeded 600 µg m−3 at just one AQMS (618 µg m−3 at Las Galanas during the dust event on 28 March 2018; Fig. 11g).
-
The dx-05 event on 29 and 30 January 2022, where the (24 h average) PM10 averaged at all the AQMSs was between 463 and 501 µg m−3 (average of 44 AQMSs distributed over the seven islands). On 29 and 30 January 2022, a total of 9 and 10 AQMSs, respectively, recorded a (24 h average) PM10 concentration between 600 and 1055x µg m−3 (x Fuerteventura, El Charco AQMS).
-
The dx-03 event on 16 February 2021, where the (24 h average) PM10 averaged at all AQMSs was 463 µg m−3 (average of 36 AQMSs distributed over the seven islands). On 16 February 2021, 9 AQMSs recorded a (24 h average) PM10 concentration between 600 and 711x µg m−3 (x Las Galletas AQMS, Tenerife).
In mainland Spain and continental Portugal, the dx-06 event is the most intense dust event ever recorded. In Spain, a total of 20 AQMSs distributed across southeastern, central and central northern Spain registered (24 h average) PM10 concentrations within the range 600 to 3070x µg m−3 (x Mediterraneo AQMS in Almería province). In Portugal, four AQMSs located in the central regions registered (24 h average) PM10 concentrations within the range 600 to 648x µg m−3 (x Chamusca AQMS in Lisbon and Vale do Tejo). The 2-decade time series of PMx also offers other interesting data. In many regions of Spain there is a clear decreasing trend in PM10 concentrations from 2000 to 2020 linked to a reduction in emissions following introduction of air quality policies (Fig. 11a, c, and e) (Li et al., 2018; Querol et al., 2014), suggesting that desert dust may have an increasing relative contribution to PM10 concentrations, as is also indicated by recent projections (Gomez et al., 2023).
3.4 Meteorological anomalies linked to duxt events
In winter, North African dust is regularly transported southward to tropical latitudes (Merdji et al., 2023). In this season, dust transport northward, to the subtropical North Atlantic and southern Europe, occurs during rather short periods under specific meteorological scenarios described in previous studies (Flaounas et al., 2015; Fluck and Raveh-Rubin, 2023a; Rodríguez et al., 2001). Winter extreme Saharan dust events have been observed in the southern Sahara, from Mauritania to Niger along the Sahel, associated with PM10 and PM2.5 concentrations within the ranges 800–5000 and 600–1300 µg m−3 (Fluck and Raveh-Rubin, 2023b; Marticorena et al., 2010), respectively, induced by H-to-L dipoles, meaning an anticyclonic high-pressure high core over the Atlantic and western North Africa and a cutoff low over the Mediterranean, which is a meteorological configuration that results in strong southern winds (Fluck and Raveh-Rubin, 2023b).
The six 2020–2022 duxt events we report here were induced by the L-to-H meteorological dipoles formed by cyclones located at the southwest of a blocking anticyclone over western Europe. Figure 13a1–f1 show the anomaly of the 500 hPa geopotential height during the onset of the six duxt events (Fig. 13a2–f2). All duxt events occurred during Northern Hemisphere meteorological anomalies that resemble the anomalies in atmospheric circulation that have been linked in previous studies to global warming (Fig. 13): (i) subtropical anticyclones expanded and shifted to higher latitudes (Cherchi et al., 2018; Cresswell-Clay et al., 2022); (ii) anomalous low pressures expanding northward beyond the tropical belt, resembling tropical expansion (Seidel et al., 2008; Yang et al., 2020, 2023) (e.g., dx-01, dx-02, dx-03 and dx-04); and (iii) mid-latitudes amplified Rossby waves due to the concatenation of cutoff-low cyclones and anticyclones, pointing to a weakening of the polar vortex (e.g., dx-03, dx-05, dx-06 and the event on 23 March 2022) (Mann et al., 2017; Screen and Simmonds, 2013). The duxt events observed in the eastern Mediterranean in March 2018 (Solomos et al., 2018) and in March 2020 (Mifka et al., 2023), in North Africa in June 2020 (Bi et al., 2023; Francis et al., 2020), in Uzbekistan in November 2021 (Xi et al., 2023), and in China in March 2021 (Gui et al., 2022; Liu et al., 2023) occurred in the context of cyclones, blocking anticyclones and dipoles linked to amplified mid-latitude Rossby waves.
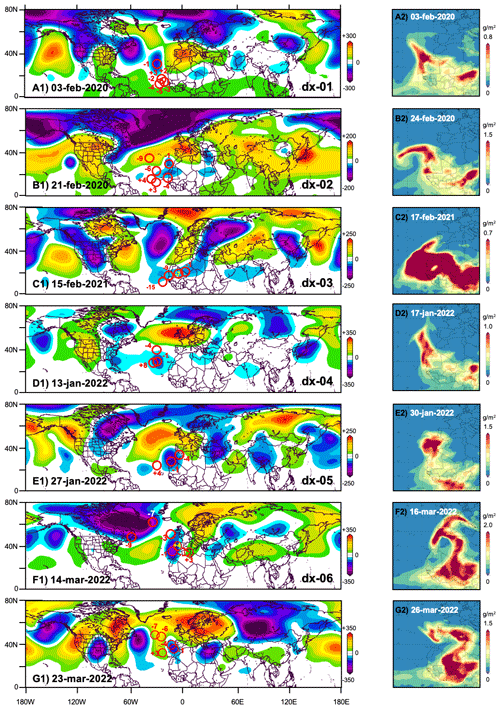
Figure 13Anomaly (a1–g1) in the 500 hPa geopotential height (GPH) (with respect to the 1991–2020 climatology) and column dust at the onset of the dx-01 to dx-06 and 24–26 March 2022 events (a2–g2). Red circles (a1–g1) indicate the location of the cyclones days before (negative number) and after (positive number) the first day of the duxt event.
The winter blocking anticyclone that we observed over western Europe and the western Mediterranean during the duxt events (Fig. 13a1–g1) fits with the picture of the industrial-era eastward expansion and shift of the North Atlantic anticyclone starting in the 1850s and accelerating over the last few decades (Alonso-Pérez et al., 2011a; Cresswell-Clay et al., 2022), a trend that is expected to continue as the concentrations of greenhouses gases increase according to the CMIP5 multi-model simulations (Cherchi et al., 2018). The low pressures to the southwest of the blocking anticyclone that we observe during the duxt events (Fig. 13b1–e1) are expected to increase as the tropics expand northward in the forthcoming decades (e.g., Fig. 1f of Cherchi et al., 2018, for the 2075–2100 period).
The anomalies linked to the duxt events are also evident in the trajectory of the cyclones that finally form the low-to-high dipoles leading to the extreme dust events. Red circles in Fig. 13a1–g1 indicate the location of the cyclones from days before (negative number) to days after (positive number) the duxt event. Due to the anticyclonic blocking over western Europe, the mid-latitude North Atlantic cyclones did not follow their regular path across Europe or the Mediterranean. The cutoff lows forming the low-to-high dipoles reached this region (Canary Islands, Cabo Verde or inner Sahara) via the following two main paths.
-
They deviated southward from the regular mid-latitude westerly circulation in the North Atlantic as a result of the blocking anticyclone over western Europe. Subsequently, these cutoff lows may stay over long periods (up to 12 d) in the subtropical and tropical northeastern Atlantic (near the Canary Islands and Cabo Verde). This is the case for the dipoles of events dx-02, dx-04, dx-05 and dx-06 and also for the intense dust event on 23 March 2022. The cyclones of the events dx-02, dx-04 and dx-05 stayed (blocked by the anticyclonic situation) near the Canary Islands and Cabo Verde for 10, 12 and 8 d (Fig. 13b1, d1 and e1), respectively.
-
They deviated northward from the tropical belt. This is the case of the events dx-01 and dx-03, associated with cyclones that had moved from Cabo Verde to the west of the Canary Islands (Fig. 13a1, dx-01) and to the inner Sahara (Fig. 13c1, dx-03), respectively, across a tropical band that anomalously shifted northward.
The observed sharp increase in dust transport to the western Euro-Mediterranean region during the 2020–2022 winter seasons has been also been associated with the meteorology linked to dipoles and blocking anticyclones (Cuevas-Agulló et al., 2024).
In winter 2020, 2021 and 2022 a set of six extreme dust events expanded northward from NW Africa to the Atlantic and Europe, causing extremely high concentrations of PM10 and PM2.5 in the governmental air quality monitoring stations of the Canary Islands, mainland Spain and continental Portugal, exceeding the upper operation limit of many PM10 monitors. We developed the duxt-r methodology for assessing the consistency of the PM10 and PM2.5 data and to reconstruct the underestimated PM10 concentrations. During these extreme dust events, the 1 h average PM10 and PM2.5 concentrations were within the range 1000–6000 and 400–1200 µg m−3, respectively, whereas the 24 h average PM10 and PM2.5 data were within the range 500–3070 and 200–690 µg m−3, respectively. These extreme dust episodes were caused by the intense winds associated with the meteorological dipoles formed by a blocking anticyclone over western Europe and a cutoff low located at the southwest near the Canary Islands, Cabo Verde or into the Sahara. The analysis of the 2000–2022 time series of PM10 and PM2.5 shows that these events have no precedent. Record-breaking PM10 and PM2.5 (24 h average) concentrations of 1840 and 404 µg m−3 were measured on the Canary Islands during 22–24 February 2020, of 3069 and 688 µg m−3 in mainland Spain (Almeria province) during 15–16 March 2022, and of 648 and 90 µg m−3 in central Portugal, respectively. All duxt events occurred during Northern Hemisphere meteorological anomalies associated with subtropical anticyclones that had shifted and expanded to higher latitudes, anomalous low pressures expanding beyond the tropical belt, and a concatenation of cutoff lows and anticyclones suggesting a weakening of the polar vortex. Climate projections forecast the expansion of the North African drylands toward the northwest, increasing the risk of desertification in Spain and Portugal, with an associated increase in regional dust loads. The air quality monitoring networks need to adapt the strategy and operation range of the PM10 and PM2.5 monitoring programs to ensure accurate measurements during these extreme dust events due to the importance of having suitable data in the public datasets for health effect studies, modeling, etc. New studies have reported on recent record-breaking PM10 and PM2.5 episodes linked to dipoles that induced extreme dust events from North Africa and Asia in a paradoxical context of multidecadal decrease in dust emissions, a topic that will require further investigation.
The duxt-r “PMx evaluation and reconstruction method based on ratios during extreme dust events” methodology described in this study is registered in the blockchain of SigneBlock. The data used in the paper are available from public databases, including the PM10 data reconstructed as result of this study. Data are also available at DIGITAL CSIC (https://doi.org/10.20350/digitalCSIC/16508, Rodríguez and López-Darias, 2024) and upon request from the first author at sergio.rodriguez@csic.es.
The supplement related to this article is available online at: https://doi.org/10.5194/acp-24-12031-2024-supplement.
SR and JLD performed the conceptualization, investigation, data collection, treatment and formal analysis. SR wrote the original version of the manuscript, which was subsequently revised and edited by SR and JLD.
At least one of the (co-)authors is a member of the editorial board of Atmospheric Chemistry and Physics. The peer-review process was guided by an independent editor, and the authors also have no other competing interests to declare.
Publisher's note: Copernicus Publications remains neutral with regard to jurisdictional claims made in the text, published maps, institutional affiliations, or any other geographical representation in this paper. While Copernicus Publications makes every effort to include appropriate place names, the final responsibility lies with the authors.
This article is part of the special issue “Dust aerosol measurements, modeling and multidisciplinary effects (AMT/ACP inter-journal SI)”. It is not associated with a conference.
We thank the 17 autonomous communities of Spain and the Ministry for the Ecological Transition and the Demographic Challenge for kindly supplying us with the data from their air quality monitoring stations. We also thank the Agência Portuguesa do Ambiente for supplying the air quality data for Portugal. We acknowledge that we were provided with access to modeling reanalysis data by the portal websites of NASA Giovanni and the NOAA Physical Science Laboratory. Satellite images were provided by the NASA Worldview website. We also thank Jon Vilches (air quality management in the Government of the Canary Islands) for providing interesting discussions on the topic of PMx monitoring devices.
This study is part of the project AERO-EXTREME (project reference PID2021-125669NB-I00) funded by the State Research Agency (Agencia Estatal de Investigación) of Spain and the European Regional Development Funds.
The article processing charges for this open-access publication were covered by the CSIC Open Access Publication Support Initiative through its Unit of Information Resources for Research (URICI).
This paper was edited by Stelios Kazadzis and reviewed by two anonymous referees.
Alonso-Pérez, S., Cuevas, E., Querol, X., Viana, M., and Guerra, J. C.: Impact of the Saharan dust outbreaks on the ambient levels of total suspended particles (TSP) in the marine boundary layer (MBL) of the Subtropical Eastern North Atlantic Ocean, Atmos. Environ., 41, 9468–9480, https://doi.org/10.1016/j.atmosenv.2007.08.049, 2007.
Alonso-Pérez, S., Cuevas, E., Perez, C., Querol, X., Baldasano, J. M., Draxler, R., and De Bustos, J. J.: Trend changes of African airmass intrusions in the marine boundary layer over the subtropical Eastern North Atlantic region in winter, Tellus B, 63, 255–265, https://doi.org/10.1111/j.1600-0889.2010.00524.x, 2011a.
Alonso-Pérez, S., Cuevas, E., and Querol, X.: Objective identification of synoptic meteorological patterns favouring African dust intrusions into the marine boundary layer of the subtropical eastern north Atlantic region, Meteorol. Atmos. Phys., 113, 109–124, https://doi.org/10.1007/s00703-011-0150-z, 2011b.
Alonso-Pérez, S., Cuevas, E., Querol, X., Guerra, J. C., and Pérez, C.: African dust source regions for observed dust outbreaks over the Subtropical Eastern North Atlantic region, above 25° N, J. Arid Environ., 78, 100–109, https://doi.org/10.1016/j.jaridenv.2011.11.013, 2012.
Bi, H., Chen, S., Zhang, D., Wang, Y., Kang, L., Alam, K., Tang, M., Chen, Y., Zhang, Y., and Wang, D.: The Circum-global Transport of Massive African Dust and its Impacts on the Regional Circulation in Remote Atmosphere, B. Am. Meteorol. Soc., 105, E605–E622, https://doi.org/10.1175/BAMS-D-23-0072.1, 2023.
Cañadillas-Ramallo, D., Moutaoikil, A., Shephard, L. E., and Guerrero-Lemus, R.: The influence of extreme dust events in the current and future 100 % renewable power scenarios in Tenerife, Renew. Energ., 184, 948–959, https://doi.org/10.1016/j.renene.2021.12.013, 2022.
Cherchi, A., Ambrizzi, T., Behera, S., Freitas, A. C. V., Morioka, Y., and Zhou, T.: The Response of Subtropical Highs to Climate Change, Curr. Clim. Chang. Reports, 4, 371–382, https://doi.org/10.1007/s40641-018-0114-1, 2018.
Cresswell-Clay, N., Ummenhofer, C. C., Thatcher, D. L., Wanamaker, A. D., Denniston, R. F., Asmerom, Y., and Polyak, V. J.: Twentieth-century Azores High expansion unprecedented in the past 1200 years, Nat. Geosci., 15, 548–553, https://doi.org/10.1038/s41561-022-00971-w, 2022.
Cuevas, E., Milford, C., Barreto, A., Bustos, J. J., García, R. D., Marrero, C. L., Prats, N., Bayo, C., Ramos, R., Terradellas, E., Suárez, D., Rodríguez, S., de la Rosa, J., Vilches, J., Basart, S., Werner, E., López-Villarrubia, E., Rodríguez-Mireles, S., Pita Toledo, M. L., González, O., Belmonte, J., Puigdemunt, R., Lorenzo, J. A., Oromí, P., and del Campo-Hernández, R.: Desert Dust Outbreak in the Canary Islands (February 2020): Assessment and Impacts, edited by: Cuevas, E., Milford, C., and Basart, S., State Meteorological Agency (AEMET), Madrid, Spain and World Meteorological Organization, Geneva, Switzerland, WMO Global At., http://hdl.handle.net/20.500.11765/12703 (last access: 15 March 2024), 2021.
Cuevas-Agulló, E., Barriopedro, D., García, R. D., Alonso-Pérez, S., González-Alemán, J. J., Werner, E., Suárez, D., Bustos, J. J., García-Castrillo, G., García, O., Barreto, Á., and Basart, S.: Sharp increase in Saharan dust intrusions over the western Euro-Mediterranean in February–March 2020–2022 and associated atmospheric circulation, Atmos. Chem. Phys., 24, 4083–4104, https://doi.org/10.5194/acp-24-4083-2024, 2024.
Domínguez-Rodríguez, A., Báez-Ferrer, N., Abreu-González, P., Rodríguez, S., Díaz, R., Avanzas, P., and Hernández-Vaquero, D.: Impact of Desert Dust Events on the Cardiovascular Disease: A Systematic Review and Meta-Analysis, J. Clin. Med., 10, 727, https://doi.org/10.3390/jcm10040727, 2021.
Dumont, M., Tuzet, F., Gascoin, S., Picard, G., Kutuzov, S., Lafaysse, M., Cluzet, B., Nheili, R., and Painter, T. H.: Accelerated Snow Melt in the Russian Caucasus Mountains After the Saharan Dust Outbreak in March 2018, J. Geophys. Res.-Earth, 125, e2020JF005641, https://doi.org/10.1029/2020JF005641, 2020.
Evan, A. T., Flamant, C., Gaetani, M., and Guichard, F.: The past, present and future of African dust, Nature, 531, 493–495, https://doi.org/10.1038/nature17149, 2016.
Filonchyk, M. and Peterson, M.: Development, progression, and impact on urban air quality of the dust storm in Asia in March 15–18, 2021, Urban Clim., 41, 101080, https://doi.org/10.1016/j.uclim.2021.101080, 2022.
Flaounas, E., Kotroni, V., Lagouvardos, K., Kazadzis, S., Gkikas, A., and Hatzianastassiou, N.: Cyclone contribution to dust transport over the Mediterranean region, Atmos. Sci. Lett., 16, 473–478, https://doi.org/10.1002/asl.584, 2015.
Fluck, E. and Raveh-Rubin, S.: A 16 year climatology of the link between dry air intrusions and large-scale dust storms in North Africa, Atmos. Res., 292, 106844, https://doi.org/10.1016/j.atmosres.2023.106844, 2023a.
Fluck, E. and Raveh-Rubin, S.: Dry air intrusions link Rossby wave breaking to large-scale dust storms in Northwest Africa: Four extreme cases, Atmos. Res., 286, 106663, https://doi.org/10.1016/j.atmosres.2023.106663, 2023b.
Francis, D., Fonseca, R., Nelli, N., Cuesta, J., Weston, M., Evan, A., and Temimi, M.: The Atmospheric Drivers of the Major Saharan Dust Storm in June 2020, Geophys. Res. Lett., 47, e2020GL090102, https://doi.org/10.1029/2020GL090102, 2020.
Francis, D., Nelli, N., Fonseca, R., Weston, M., Flamant, C., and Cherif, C.: The dust load and radiative impact associated with the June 2020 historical Saharan dust storm, Atmos. Environ., 268, 118808, https://doi.org/10.1016/j.atmosenv.2021.118808, 2022.
Gelaro, R., McCarty, W., Suárez, M. J., Todling, R., Molod, A., Takacs, L., Randles, C. A., Darmenov, A., Bosilovich, M. G., Reichle, R., Wargan, K., Coy, L., Cullather, R., Draper, C., Akella, S., Buchard, V., Conaty, A., da Silva, A. M., Gu, W., Kim, G.-K., Koster, R., Lucchesi, R., Merkova, D., Nielsen, J. E., Partyka, G., Pawson, S., Putman, W., Rienecker, M., Schubert, S. D., Sienkiewicz, M., and Zhao, B.: The Modern-Era Retrospective Analysis for Research and Applications, Version 2 (MERRA-2), J. Climate, 30, 5419–5454, https://doi.org/10.1175/JCLI-D-16-0758.1, 2017.
Ginoux, P., Prospero, J. M., Gill, T. E., Hsu, N. C., and Zhao, M.: Global-scale attribution of anthropogenic and natural dust sources and their emission rates based on MODIS Deep Blue aerosol products, Rev. Geophys., 50, RG3005, https://doi.org/10.1029/2012RG000388, 2012.
Gomes, J., Esteves, H., and Rente, L.: Influence of an Extreme Saharan Dust Event on the Air Quality of the West Region of Portugal, Gases, 2, 74–84, https://doi.org/10.3390/gases2030005, 2022.
Gomez, J., Allen, R. J., Turnock, S. T., Horowitz, L. W., Tsigaridis, K., Bauer, S. E., Olivié, D., Thomson, E. S., and Ginoux, P.: The projected future degradation in air quality is caused by more abundant natural aerosols in a warmer world, Commun. Earth Environ., 4, 22, https://doi.org/10.1038/s43247-023-00688-7, 2023.
Govarchin-Ghale, Y. A., Tayanc, M., and Unal, A.: Dried bottom of Urmia Lake as a new source of dust in the northwestern Iran: Understanding the impacts on local and regional air quality, Atmos. Environ., 262, 118635, https://doi.org/10.1016/j.atmosenv.2021.118635, 2021.
Gui, K., Yao, W., Che, H., An, L., Zheng, Y., Li, L., Zhao, H., Zhang, L., Zhong, J., Wang, Y., and Zhang, X.: Record-breaking dust loading during two mega dust storm events over northern China in March 2021: aerosol optical and radiative properties and meteorological drivers, Atmos. Chem. Phys., 22, 7905–7932, https://doi.org/10.5194/acp-22-7905-2022, 2022.
Guiot, J. and Cramer, W.: Climate change: The 2015 Paris Agreement thresholds and Mediterranean basin ecosystems, Science, 354, 465–468, https://doi.org/10.1126/science.aah5015, 2016.
Jiang, Y., Miao, Y., Zhao, Y., Liu, J., and Gao, Y.: Extreme-wind events in China in the past 50 years and their impacts on sandstorm variations, Front. Earth Sci., 10, 1058275, https://doi.org/10.3389/feart.2022.1058275, 2023.
Kalnay, E., Kanamitsu, M., Kistler, R., Collins, W., Deaven, D., Gandin, L., Iredell, M., Saha, S., White, G., Woollen, J., Zhu, Y., Leetmaa, A., Reynolds, R., Chelliah, M., Ebisuzaki, W., Higgins, W., Janowiak, J., Mo, K. C., Ropelewski, C., Wang, J., Jenne, R., and Joseph, D.: The NCEP/NCAR 40-Year Reanalysis Project, B. Am. Meteorol. Soc., 77, 437–471, 1996.
Kaskaoutis, D. G., Rashki, A., Francois, P., Dumka, U. C., Houssos, E. E., and Legrand, M.: Meteorological regimes modulating dust outbreaks in southwest Asia: The role of pressure anomaly and Inter-Tropical Convergence Zone on the 1–3 July 2014 case, Aeolian Res., 18, 83–97, https://doi.org/10.1016/j.aeolia.2015.06.006, 2015.
Kaskaoutis, D. G., Houssos, E. E., Rashki, A., Bartzokas, A., Legrand, M., Francois, P., and Kambezidis, H. D.: Modulation of Atmospheric Dynamics and Dust Emissions in Southwest Asia by the Caspian Sea – Hindu Kush Index, in: Perspectives on Atmospheric Sciences, edited by: Karacostas, T., Bais, A., and Nastos, P., Springer Atmospheric Sciences, Springer, Cham, 941–947, https://doi.org/10.1007/978-3-319-35095-0_134, 2017.
Kaskaoutis, D. G., Rashki, A., Dumka, U. C., Mofidi, A., Kambezidis, H. D., Psiloglou, B. E., Karagiannis, D., Petrinoli, K., and Gavriil, A.: Atmospheric dynamics associated with exceptionally dusty conditions over the eastern Mediterranean and Greece in March 2018, Atmos. Res., 218, 269–284, https://doi.org/10.1016/j.atmosres.2018.12.009, 2019.
Katra, I.: Soil Erosion by Wind and Dust Emission in Semi-Arid Soils Due to Agricultural Activities, Agronomy, 10, 89, https://doi.org/10.3390/agronomy10010089, 2020.
Kok, J. F., Storelvmo, T., Karydis, V. A., Adebiyi, A. A., Mahowald, N. M., Evan, A. T., He, C., and Leung, D. M.: Mineral dust aerosol impacts on global climate and climate change, Nat. Rev. Earth Environ., 4, 71–86, https://doi.org/10.1038/s43017-022-00379-5, 2023.
Kutuzov, S., Legrand, M., Preunkert, S., Ginot, P., Mikhalenko, V., Shukurov, K., Poliukhov, A., and Toropov, P.: The Elbrus (Caucasus, Russia) ice core record – Part 2: history of desert dust deposition, Atmos. Chem. Phys., 19, 14133–14148, https://doi.org/10.5194/acp-19-14133-2019, 2019.
Lambert, A., Hallar, A. G., Garcia, M., Strong, C., Andrews, E., and Hand, J. L.: Dust Impacts of Rapid Agricultural Expansion on the Great Plains, Geophys. Res. Lett., 47, e2020GL090347, https://doi.org/10.1029/2020GL090347, 2020.
Li, J., Chen, B., de la Campa, A. M. S., Alastuey, A., Querol, X., and de la Rosa, J. D.: 2005–2014 trends of PM10 source contributions in an industrialized area of southern Spain, Environ. Pollut., 236, 570–579, https://doi.org/10.1016/j.envpol.2018.01.101, 2018.
Liu, J., Wu, D., Liu, G., Mao, R., Chen, S., Ji, M., Fu, P., Sun, Y., Pan, X., Jin, H., Zhou, Y., and Wang, X.: Impact of Arctic amplification on declining spring dust events in East Asia, Clim. Dynam., 54, 1913–1935, https://doi.org/10.1007/s00382-019-05094-4, 2020.
Liu, J., Wang, X., Wu, D., Wei, H., Li, Y., and Ji, M.: Historical footprints and future projections of global dust burden from bias-corrected CMIP6 models, npj Clim. Atmos. Sci., 7, 1, https://doi.org/10.1038/s41612-023-00550-9, 2024.
Liu, X., Zhang, Y., Yao, H., Lian, Q., and Xu, J.: Analysis of the Severe Dust Process and Its Impact on Air Quality in Northern China, Atmosphere-Basel, 14, 1071, https://doi.org/10.3390/atmos14071071, 2023.
Lorentzou, C., Kouvarakis, G., Kozyrakis, G. V, Kampanis, N. A., Trahanatzi, I., Fraidakis, O., Tzanakis, N., Kanakidou, M., Agouridakis, P., and Notas, G.: Extreme desert dust storms and COPD morbidity on the island of Crete, Int. J. Chronic. Obstr., 14, 1763–1768, https://doi.org/10.2147/COPD.S208108, 2019.
Mann, M. E., Rahmstorf, S., Kornhuber, K., Steinman, B. A., Miller, S. K., and Coumou, D.: Influence of Anthropogenic Climate Change on Planetary Wave Resonance and Extreme Weather Events, Sci. Rep.-UK, 7, 45242, https://doi.org/10.1038/srep45242, 2017.
Marticorena, B., Chatenet, B., Rajot, J. L., Traoré, S., Coulibaly, M., Diallo, A., Koné, I., Maman, A., NDiaye, T., and Zakou, A.: Temporal variability of mineral dust concentrations over West Africa: analyses of a pluriannual monitoring from the AMMA Sahelian Dust Transect, Atmos. Chem. Phys., 10, 8899–8915, https://doi.org/10.5194/acp-10-8899-2010, 2010.
Meinander, O., Kouznetsov, R., Uppstu, A., Sofiev, M., Kaakinen, A., Salminen, J., Rontu, L., Welti, A., Francis, D., Piedehierro, A. A., Heikkilä, P., Heikkinen, E., and Laaksonen, A.: African dust transport and deposition modelling verified through a citizen science campaign in Finland, Sci. Rep.-UK, 13, 21379, https://doi.org/10.1038/s41598-023-46321-7, 2023.
Merdji, A. B., Lu, C., Xu, X., and Mhawish, A.: Long-term three-dimensional distribution and transport of Saharan dust: Observation from CALIPSO, MODIS, and reanalysis data, Atmos. Res., 286, 106658, https://doi.org/10.1016/j.atmosres.2023.106658, 2023.
Micheli, L., Almonacid, F., Bessa, J. G., Fernández-Solas, Á., and Fernández, E. F.: The impact of extreme dust storms on the national photovoltaic energy supply, Sustain. Energy Technol. Assessments, 62, 103607, https://doi.org/10.1016/j.seta.2024.103607, 2024.
Middleton, N.: Variability and Trends in Dust Storm Frequency on Decadal Timescales: Climatic Drivers and Human Impacts, Geosciences, 9, 261, https://doi.org/10.3390/geosciences9060261, 2019.
Middleton, N., Kashani, S. S., Attarchi, S., Rahnama, M., and Mosalman, S. T.: Synoptic Causes and Socio-Economic Consequences of a Severe Dust Storm in the Middle East, Atmosphere-Basel, 12, 1435, https://doi.org/10.3390/atmos12111435, 2021.
Mifka, B., Telišman Prtenjak, M., Kavre Piltaver, I., Mekterović, D., Kuzmić, J., Marciuš, M., and Ciglenečki, I.: Intense desert dust event in the northern Adriatic (March 2020); insights from the numerical model application and chemical characterization results, Earth and Space Science, 10, e2023EA002879, https://doi.org/10.1029/2023EA002879, 2023.
Millán-Martínez, M., Sánchez-Rodas, D., Sánchez de la Campa, A. M., and de la Rosa, J.: Contribution of anthropogenic and natural sources in PM10 during North African dust events in Southern Europe, Environ. Pollut., 290, 118065, https://doi.org/10.1016/j.envpol.2021.118065, 2021.
Miri, A. and Middleton, N.: Long-term impacts of dust storms on transport systems in south-eastern Iran, Nat. Hazards, 114, 291–312, https://doi.org/10.1007/s11069-022-05390-z, 2022.
Mona, L., Amiridis, V., Cuevas, E., Gkikas, A., Trippetta, S., Vandenbussche, S., Benedetti, A., Dagsson-Waldhauserova, P., Formenti, P., Haefele, A., Kazadzis, S., Knippertz, P., Laurent, B., Madonna, F., Nickovic, S., Papagiannopoulos, N., Pappalardo, G., García-Pando, C. P., Popp, T., Rodríguez, S., Sealy, A., Sugimoto, N., Terradellas, E., Vimic, A. V., Weinzierl, B., and Basart, S.: Observing Mineral Dust in Northern Africa, the Middle East and Europe: Current Capabilities and Challenges Ahead for the Development of Dust Services, B. Am. Meteorol. Soc., 104, E2223–E2264, https://doi.org/10.1175/BAMS-D-23-0005.1, 2023.
Monteiro, A., Basart, S., Kazadzis, S., Votsis, A., Gkikas, A., Vandenbussche, S., Tobias, A., Gama, C., García-Pando, C. P., Terradellas, E., Notas, G., Middleton, N., Kushta, J., Amiridis, V., Lagouvardos, K., Kosmopoulos, P., Kotroni, V., Kanakidou, M., Mihalopoulos, N., Kalivitis, N., Dagsson-Waldhauserová, P., El-Askary, H., Sievers, K., Giannaros, T., Mona, L., Hirtl, M., Skomorowski, P., Virtanen, T. H., Christoudias, T., Di Mauro, B., Trippetta, S., Kutuzov, S., Meinander, O., and Nickovic, S.: Multi-sectoral impact assessment of an extreme African dust episode in the Eastern Mediterranean in March 2018, Sci. Total Environ., 843, 156861, https://doi.org/10.1016/j.scitotenv.2022.156861, 2022.
Mulitza, S., Heslop, D., Pittauerova, D., Fischer, H. W., Meyer, I., Stuut, J.-B., Zabel, M., Mollenhauer, G., Collins, J. A., Kuhnert, H., and Schulz, M.: Increase in African dust flux at the onset of commercial agriculture in the Sahel region, Nature, 466, 226–228, https://doi.org/10.1038/nature09213, 2010.
Nishonov, B. E., Kholmatjanov, B. M., Labzovskii, L. D., Rakhmatova, N., Shardakova, L., Abdulakhatov, E. I., Yarashev, D. U., Toderich, K. N., Khujanazarov, T., and Belikov, D. A.: Study of the strongest dust storm occurred in Uzbekistan in November 2021, Sci. Rep.-UK, 13, 20042, https://doi.org/10.1038/s41598-023-42256-1, 2023.
O'Sullivan, D., Marenco, F., Ryder, C. L., Pradhan, Y., Kipling, Z., Johnson, B., Benedetti, A., Brooks, M., McGill, M., Yorks, J., and Selmer, P.: Models transport Saharan dust too low in the atmosphere: a comparison of the MetUM and CAMS forecasts with observations, Atmos. Chem. Phys., 20, 12955–12982, https://doi.org/10.5194/acp-20-12955-2020, 2020.
Peshev, Z., Chaikovsky, A., Evgenieva, T., Pescherenkov, V., Vulkova, L., Deleva, A., and Dreischuh, T.: Combined Characterization of Airborne Saharan Dust above Sofia, Bulgaria, during Blocking-Pattern Conditioned Dust Episode in February 2021, Remote Sens.-Basel, 15, 3833, https://doi.org/10.3390/rs15153833, 2023.
Pey, J., Querol, X., Alastuey, A., Forastiere, F., and Stafoggia, M.: African dust outbreaks over the Mediterranean Basin during 2001–2011: PM10 concentrations, phenomenology and trends, and its relation with synoptic and mesoscale meteorology, Atmos. Chem. Phys., 13, 1395–1410, https://doi.org/10.5194/acp-13-1395-2013, 2013.
Pi, H., Huggins, D. R., Abatzoglou, J. T., and Sharratt, B.: Modeling Soil Wind Erosion From Agroecological Classes of the Pacific Northwest in Response to Current Climate, J. Geophys. Res.-Atmos., 125, 1–14, https://doi.org/10.1029/2019JD031104, 2020.
Preunkert, S., Legrand, M., Kutuzov, S., Ginot, P., Mikhalenko, V., and Friedrich, R.: The Elbrus (Caucasus, Russia) ice core record – Part 1: reconstruction of past anthropogenic sulfur emissions in south-eastern Europe, Atmos. Chem. Phys., 19, 14119–14132, https://doi.org/10.5194/acp-19-14119-2019, 2019.
Prospero, J. M., Ginoux, P., Torres, O., Nicholson, S. E., and Gill, T. E.: Environmental characterization of global sources of atmospheric soil dust identified with the Nimbus 7 Total Ozone Mapping Spectrometer (TOMS) absorbing aerosol product, Rev. Geophys., 40, 2-1–2-31, https://doi.org/10.1029/2000RG000095, 2002.
Pu, B. and Jin, Q.: A Record-Breaking Trans-Atlantic African Dust Plume Associated with Atmospheric Circulation Extremes in June 2020, B. Am. Meteorol. Soc., 102, E1340–E1356, https://doi.org/10.1175/BAMS-D-21-0014.1, 2021.
Qor-El-Aine, A., Béres, A., and Géczi, G.: Case Study of the Saharan Dust Effects on PM10 and PM2.5 Concentrations in Budapest in March 2022, J. Cent. Eur. Green Innov., 10, 67–78, https://doi.org/10.33038/jcegi.3500, 2022.
Querol, X., Alastuey, A., Pandolfi, M., Reche, C., Pérez, N., Minguillón, M. C., Moreno, T., Viana, M., Escudero, M., Orio, A., Pallarés, M., and Reina, F.: 2001–2012 trends on air quality in Spain, Sci. Total Environ., 490, 957–969, https://doi.org/10.1016/j.scitotenv.2014.05.074, 2014.
Ridley, D. A., Heald, C. L., and Prospero, J. M.: What controls the recent changes in African mineral dust aerosol across the Atlantic?, Atmos. Chem. Phys., 14, 5735–5747, https://doi.org/10.5194/acp-14-5735-2014, 2014.
Rodríguez, S. and López-Darias, J.: Dust and tropical PMx aerosols in Cape Verde: Sources, vertical distributions and stratified transport from North Africa, Atmos. Res., 263, 105793, https://doi.org/10.1016/j.atmosres.2021.105793, 2021.
Rodríguez, S. and López-Darias, J.: Data of PM10 and PM2.5 2001-2022 of Spain and Portugal assessed and reconstructed with duxt-r method during extreme dust events, DIGITAL.CSIC [data set], https://doi.org/10.20350/DIGITALCSIC/16508, 2024.
Rodríguez, S., Querol, X., Alastuey, A., Kallos, G., and Kakaliagou, O.: Saharan dust contributions to PM10 and TSP levels in Southern and Eastern Spain, Atmos. Environ., 35, 2433–2447, https://doi.org/10.1016/S1352-2310(00)00496-9, 2001.
Rodríguez, S., Alastuey, A., Alonso-Pérez, S., Querol, X., Cuevas, E., Abreu-Afonso, J., Viana, M., Pérez, N., Pandolfi, M., and de la Rosa, J.: Transport of desert dust mixed with North African industrial pollutants in the subtropical Saharan Air Layer, Atmos. Chem. Phys., 11, 6663–6685, https://doi.org/10.5194/acp-11-6663-2011, 2011.
Rodríguez, S., Alastuey, A., and Querol, X.: A review of methods for long term in situ characterization of aerosol dust, Aeolian Res., 6, 55–74, https://doi.org/10.1016/j.aeolia.2012.07.004, 2012.
Rodríguez, S., Cuevas, E., Prospero, J. M., Alastuey, A., Querol, X., López-Solano, J., García, M. I., and Alonso-Pérez, S.: Modulation of Saharan dust export by the North African dipole, Atmos. Chem. Phys., 15, 7471–7486, https://doi.org/10.5194/acp-15-7471-2015, 2015.
Rodríguez, S., Riera, R., Fonteneau, A., Alonso-Pérez, S., and López-Darias, J.: African desert dust influences migrations and fisheries of the Atlantic skipjack-tuna, Atmos. Environ., 312, 120022, https://doi.org/10.1016/j.atmosenv.2023.120022, 2023.
Rodriguez-Caballero, E., Stanelle, T., Egerer, S., Cheng, Y., Su, H., Canton, Y., Belnap, J., Andreae, M. O., Tegen, I., Reick, C. H., Pöschl, U., and Weber, B.: Global cycling and climate effects of aeolian dust controlled by biological soil crusts, Nat. Geosci., 15, 458–463, https://doi.org/10.1038/s41561-022-00942-1, 2022.
Screen, J. A. and Simmonds, I.: Exploring links between Arctic amplification and mid-latitude weather, Geophys. Res. Lett., 40, 959–964, https://doi.org/10.1002/grl.50174, 2013.
Seidel, D. J., Fu, Q., Randel, W. J., and Reichler, T. J.: Widening of the tropical belt in a changing climate, Nat. Geosci., 1, 21–24, https://doi.org/10.1038/ngeo.2007.38, 2008.
Solomos, S., Kalivitis, N., Mihalopoulos, N., Amiridis, V., Kouvarakis, G., Gkikas, A., Binietoglou, I., Tsekeri, A., Kazadzis, S., Kottas, M., Pradhan, Y., Proestakis, E., Nastos, P., and Marenco, F.: From Tropospheric Folding to Khamsin and Foehn Winds: How Atmospheric Dynamics Advanced a Record-Breaking Dust Episode in Crete, Atmosphere-Basel, 9, 240, https://doi.org/10.3390/atmos9070240, 2018.
Sorribas, M., Adame, J. A., Andrews, E., and Yela, M.: An anomalous African dust event and its impact on aerosol radiative forcing on the Southwest Atlantic coast of Europe in February 2016, Sci. Total Environ., 583, 269–279, https://doi.org/10.1016/j.scitotenv.2017.01.064, 2017.
Tong, D. Q., Gill, T. E., Sprigg, W. A., Van Pelt, R. S., Baklanov, A. A., Barker, B. M., Bell, J. E., Castillo, J., Gassó, S., Gaston, C. J., Griffin, D. W., Huneeus, N., Kahn, R. A., Kuciauskas, A. P., Ladino, L. A., Li, J., Mayol-Bracero, O. L., McCotter, O. Z., Méndez-Lázaro, P. A., Mudu, P., Nickovic, S., Oyarzun, D., Prospero, J., Raga, G. B., Raysoni, A. U., Ren, L., Sarafoglou, N., Sealy, A., Sun, Z., and Vimic, A. V.: Health and Safety Effects of Airborne Soil Dust in the Americas and Beyond, Rev. Geophys., 61, e2021RG000763, https://doi.org/10.1029/2021RG000763, 2023.
Viana, M., Querol, X., Alastuey, A., Cuevas, E., and Rodríguez, S.: Influence of African dust on the levels of atmospheric particulates in the Canary Islands air quality network, Atmos. Environ., 36, 5861–5875, https://doi.org/10.1016/S1352-2310(02)00463-6, 2002.
Vukovic, A., Cvetkovic, B., Giannaros, T., Shahbazi, R., Sehat Kashani, S., Prieto, J., Kotroni, V., Lagouvardos, K., Pejanovic, G., Petkovic, S., Nickovic, S., Vujadinovic, M., Basart, S., Darvishi, A., and Terradellas, E.: Numerical Simulation of Tehran Dust Storm on 2 June 2014: A Case Study of Agricultural Abandoned Lands as Emission Sources, Atmosphere-Basel, 12, 1054, https://doi.org/10.3390/atmos12081054, 2021.
Xi, X., Steinfeld, D., Cavallo, S., Wang, J., Chen, J., Zulpykharov, K., and Henebry, G. M.: What caused the unseasonal extreme dust storm in Uzbekistan during November 2021?, Environ. Res. Lett., 18, 114029, https://doi.org/10.1088/1748-9326/ad02af, 2023.
Xie, X., Liu, X., Shi, Z., Li, X., Xie, X., Sun, H., He, J., Che, H., Zhang, X.-Y., Zhisheng, A., Wang, D., and Liu, Y.: Sharp decline of dust events induces regional wetting over arid and semi-arid Northwest China in the NCAR Community Atmosphere model, Environ. Res. Lett., 19, 014061, https://doi.org/10.1088/1748-9326/ad16a5, 2023.
Yang, H., Lohmann, G., Lu, J., Gowan, E. J., Shi, X., Liu, J., and Wang, Q.: Tropical Expansion Driven by Poleward Advancing Midlatitude Meridional Temperature Gradients, J. Geophys. Res.-Atmos., 125, e2020JD033158, https://doi.org/10.1029/2020JD033158, 2020.
Yang, H., Lohmann, G., Shi, X., and Müller, J.: Evaluating the Mechanism of Tropical Expansion Using Idealized Numerical Experiments, Ocean. Res., 2, 0004, https://doi.org/10.34133/olar.0004, 2023.
Yu, H., Chin, M., Yuan, T., Bian, H., Remer, L. A., Prospero, J. M., Omar, A., Winker, D., Yang, Y., Zhang, Y., Zhang, Z., and Zhao, C.: The fertilizing role of African dust in the Amazon rainforest: A first multiyear assessment based on data from Cloud-Aerosol Lidar and Infrared Pathfinder Satellite Observations, Geophys. Res. Lett., 42, 1984–1991, https://doi.org/10.1002/2015GL063040, 2015.
Yu, H., Tan, Q., Zhou, L., Zhou, Y., Bian, H., Chin, M., Ryder, C. L., Levy, R. C., Pradhan, Y., Shi, Y., Song, Q., Zhang, Z., Colarco, P. R., Kim, D., Remer, L. A., Yuan, T., Mayol-Bracero, O., and Holben, B. N.: Observation and modeling of the historic “Godzilla” African dust intrusion into the Caribbean Basin and the southern US in June 2020, Atmos. Chem. Phys., 21, 12359–12383, https://doi.org/10.5194/acp-21-12359-2021, 2021.
Yu, Y. and Ginoux, P.: Enhanced dust emission following large wildfires due to vegetation disturbance, Nat. Geosci., 15, 878–884, https://doi.org/10.1038/s41561-022-01046-6, 2022.
Zafra-Pérez, A., Boente, C., García-Díaz, M., Gómez-Galán, J. A., de la Campa, A. S., and de la Rosa, J. D.: Aerial monitoring of atmospheric particulate matter produced by open-pit mining using low-cost airborne sensors, Sci. Total Environ., 904, 166743, https://doi.org/10.1016/j.scitotenv.2023.166743, 2023.
Zhang, T., Zheng, M., Sun, X., Chen, H., Wang, Y., Fan, X., Pan, Y., Quan, J., Liu, J., Wang, Y., Lyu, D., Chen, S., Zhu, T., and Chai, F.: Environmental impacts of three Asian dust events in the northern China and the northwestern Pacific in spring 2021, Sci. Total Environ., 859, 160230, https://doi.org/10.1016/j.scitotenv.2022.160230, 2023.


