the Creative Commons Attribution 4.0 License.
the Creative Commons Attribution 4.0 License.
 | 23 Oct 2024
Impacts of tropical cyclone–heat wave compound events on surface ozone in eastern China: comparison between the Yangtze River and Pearl River deltas
Cuini Qi
Huimin Li
Hui Zhang
Lili Ren
Xipeng Jin
Chenchao Zhan
Jianping Tang
Hong Liao
China has implemented some air pollution management measures in recent years, yet severe ozone pollution remains a significant issue. The southeastern coast of China (SECC) is often influenced by hot extremes and tropical cyclones (TCs), and the two can occur simultaneously (TC–HDs). The compound TC–HDs show a rising trend in the summers of 2014–2019, potentially affecting ozone pollution. Here, we found that surface ozone concentrations over the SECC are more elevated during extremely hot days than the summer climatology. However, compared to extremely hot days alone (AHDs), the maximum 8 h average ozone (MDA8 O3) concentration increases by an average of 6.8 µg m−3 in the Pearl River Delta (PRD) and decreases by 13.2 µg m−3 in the Yangtze River Delta (YRD) during the compound TC–HDs. The meteorological conditions during AHDs favor the chemical production of ozone over the SECC, exhibiting increased temperature and solar radiation and decreased relative humidity. Relative to AHDs, strong northeasterly winds prevail in the SECC during TC–HDs, suggesting the potential of ozone cross-regional transport between YRD and PRD. The process analysis in the chemical transport model (GEOS-Chem) suggests that relative to AHDs, the chemical production of ozone is enhanced in YRD during TC–HDs, while horizontal transport alleviates ozone pollution in YRD but worsens it in PRD through cross-regional transport. The results highlight the significant effects of cross-regional transport in modulating ozone pollution in the two megacity clusters during hot extremes accompanied by TC activities, giving insight into future ozone control measures over the SECC under global warming.
- Article
(8680 KB) - Full-text XML
-
Supplement
(1214 KB) - BibTeX
- EndNote


Tropospheric ozone (O3) is the predominant air pollutant in addition to fine particulate matter (PM2.5) in China (Fu et al., 2019), and it poses significant risks to human health and the ecosystem (Feng et al., 2015; Wang et al., 2017). Long-term exposure to high concentrations of ozone could lead to lung tissue damage and chronic obstructive pulmonary disease, thereby increasing premature death (Turner et al., 2016; Liu et al., 2018). Chen et al. (2023) demonstrated that the deterioration of ozone air quality is considered to be the primary factor responsible for the 90 % increase in premature respiratory mortalities in China from 2013 to 2019. Furthermore, ozone can negatively impact crop yield by inhibiting plant photosynthesis; accelerating crop senescence; and reducing both the yield and quality (Ainsworth et al., 2012), ultimately affecting ecosystem stability (Gu et al., 2023).
To deal with the severe air pollution issues, China has implemented several pollution prevention and control measures, which are prioritized to tackle the problem of particulate matter, including the “Air Pollution Prevention and Control Action Plan” and the “Three-Year Action Plan for Winning the Blue Sky Defense Battle” (P. Wang et al., 2022). These efforts are making significant progress in lowering PM2.5 concentrations. Z. Wang et al. (2022) indicated that the annual concentration of PM2.5 in China has decreased by 13.41 µg m−3 from 2014 to 2020. However, it is worth noting that most cities in China still frequently experienced severe ozone episodes (Li et al., 2019). It is demonstrated that surface ozone concentrations in most regions of China have increased by approximately 20 % during the period from 2013 to 2017 (Huang et al., 2018). Also, Wei et al. (2022) recently found that both surface ozone concentration and ozone pollution days (the maximum 8 h average ozone (MDA8 O3) concentrations exceed 160 µg m−3) in China exhibited an increasing trend from 2013 to 2020. Therefore, ozone pollution in China has received widespread attention over the past few decades (Ashmore, 2005; Gong and Liao, 2019; N. Wang et al., 2022).
Changes in tropospheric ozone are closely related to their precursor gases, including nitrogen oxides (NOx) and volatile organic compounds (VOCs) (Fu and Liao, 2014; Jacob et al., 1999; Li et al., 2019). Zhang et al. (2023) revealed that an increase in biogenic volatile organic compounds (BVOCs) increased local ozone production by 23 % yr−1 in Hong Kong. Li et al. (2019) pointed out that anthropogenic NOx emissions in China decreased by 21 % from 2013 to 2017, whereas VOC emissions changed little. In urban China, decreased NOx increased ozone levels under VOC-limited conditions, whereas in rural areas, it resulted in decreased ozone under NOx-limited conditions. In addition to precursor emissions, meteorological conditions can significantly modulate surface ozone levels (Yin et al., 2019; Zhou et al., 2022). For example, severe ozone pollution commonly occurs during summertime with high temperatures, low relative humidity (RH), and strong solar radiation (Dai et al., 2023; Yin et al., 2019). Under low-RH conditions, trees close the stomata (pores for exchanging CO2 and water vapor), inhibiting the dry deposition of ozone and leading to ozone accumulation (Kavassalis and Murphy, 2017). Besides, low-humidity conditions inhibit ozone breakdown as the O(1D) particles combine with water molecules (H2O) to produce hydroxyl radicals that promote ozone decomposition in high-humidity environments (Li et al., 2021). Wind direction and wind speed play an important role in the transport and diffusion of ozone (Banta et al., 2011; Jammalamadaka and Lund, 2006). It is proved that the co-occurred heat waves and atmospheric stagnation days with low wind speeds favor ozone pollution in the US through promoting ozone production (Zhang et al., 2018). Reduced clouds and strengthened solar radiation during the hot extremes favor photochemical ozone production in the troposphere and thus increase the surface ozone concentrations (P. Wang et al., 2022). Large-scale atmospheric circulation can modulate surface ozone through changing the meteorological conditions (Yang et al., 2022). For instance, the stronger western Pacific subtropical high (WPSH) leads to higher temperatures, stronger solar radiation, lower RH, and less precipitation, which favors the production and accumulation of surface ozone in northern China (Jiang et al., 2021).
Extreme weather events, especially heat waves and tropical cyclones (TCs), have a significant impact on ozone pollution in eastern China (Lin et al., 2019; T. Wang et al., 2019). High-ozone concentration events are typically associated with high temperatures, which lead to increased emissions of BVOCs and enhance the chemical formation of ozone (Lu et al., 2019; P. Wang et al., 2022). P. Wang et al. (2022) indicate that ozone pollution levels are significantly higher during extreme heat events compared to other days in the North China Plain region. TC activities can substantially affect tropospheric ozone by affecting the chemical production, transport, and accumulation processes over the coastal regions of China (K. Meng et al., 2022; Qu et al., 2021; Zhan and Xie, 2022). Shu et al. (2016) investigated the impacts of Typhoon Utor on an ozone pollution episode over the Yangtze River Delta (YRD) in China from 7 to 12 August 2013. They found that the peripheral circulations of the approaching typhoon intensified downward airflow, leading to a short-term local weather pattern of high temperatures, low humidity, intense solar radiation, and light winds, which exacerbated ozone pollution. Following the passage of TCs, the lower tropospheric transport of ozone-rich air and strong photochemical reactions also contribute to amplifying ozone pollution (Zhan et al., 2020). For ozone pollution in the Pearl River Delta (PRD), which is influenced by the strong downdrafts related to the periphery of TCs, the PRD region typically is dominated by high pressure, low humidity, and strong solar radiation, leading to the accumulation of ozone (Wei et al., 2016; Ouyang et al., 2022). Moreover, TC activities are proven to enhance the chemical interactions between anthropogenic and biogenic emissions, resulting in extreme ozone pollution over both the YRD and PRD regions (N. Wang et al., 2022).
The southeastern coastal region of China (SECC), including the YRD and PRD regions, experiences both frequent TCs and heat wave events under global warming (W. Wang et al., 2016; Xiao et al., 2011). And there is a significant concurrent relationship between extreme heat waves and TC activity that the peripheral circulations of TCs can promote extreme heat waves (P. Wang et al., 2023; Zhang et al., 2024). Such compound hazards are more destructive than the individual extremes (Matthews et al., 2019). The SECC region has experienced a considerable rise in surface ozone concentrations during the period from 2013 to 2019 (X. Meng et al., 2022). Although the individual effects of heat waves and TCs on ozone have been emphasized, the effects of the compound extremes of heat waves and TCs on ozone pollution have received limited attention.
In this study, we aim to investigate the impacts of the compound hazards of TCs and extremely hot days (TC–HDs) on ozone pollution in the SECC (10–35° N, 105–125° E) based on long-term (2014–2019) observational records of air temperatures and TCs, reanalysis datasets of ground level ozone concentrations and meteorological parameters, and GEOS-Chem simulations. The mechanisms contributing to these impacts are also analyzed. The study is organized as follows: Sect. 2 presents the methods and data utilized, and Sect. 3 describes the spatial and temporal variations in TC–HDs observed in the SECC during 2014–2019. Section 4 describes the impacts of TC–HDs on ozone concentration in the SECC, with a focus on the YRD and PRD regions. In Sect. 5, we investigate the possible mechanisms for the anomalous ozone concentrations in the SECC during TC–HDs, as well as the differences between YRD and PRD, by investigating the meteorological conditions and key chemical and physical process analysis with GEOS-Chem. Finally, Sect. 6 provides a summary and discussion.
2.1 Observational datasets
In this work, we focus on the ozone pollution over the SECC, which is vulnerable to both severe hot extremes and ozone pollution (Ma et al., 2019; P. Wang et al., 2022). A topographic map of the SECC including the YRD and PRD regions is shown in Fig. 1. The daily maximum air temperatures (Tmax) from observational sites in the domain for the period 2014–2019 are provided by the China Meteorological Administration (CMA). The best-tracked dataset of TCs is also released by CMA (accessible at https://tcdata.typhoon.org.cn/zjljsjj.html, last access: 5 May 2022). This dataset includes the time, location, and intensity of TCs and records all of TCs that have passed through the western North Pacific (WNP) since 1949 (Lu et al., 2021; Ying et al., 2014).
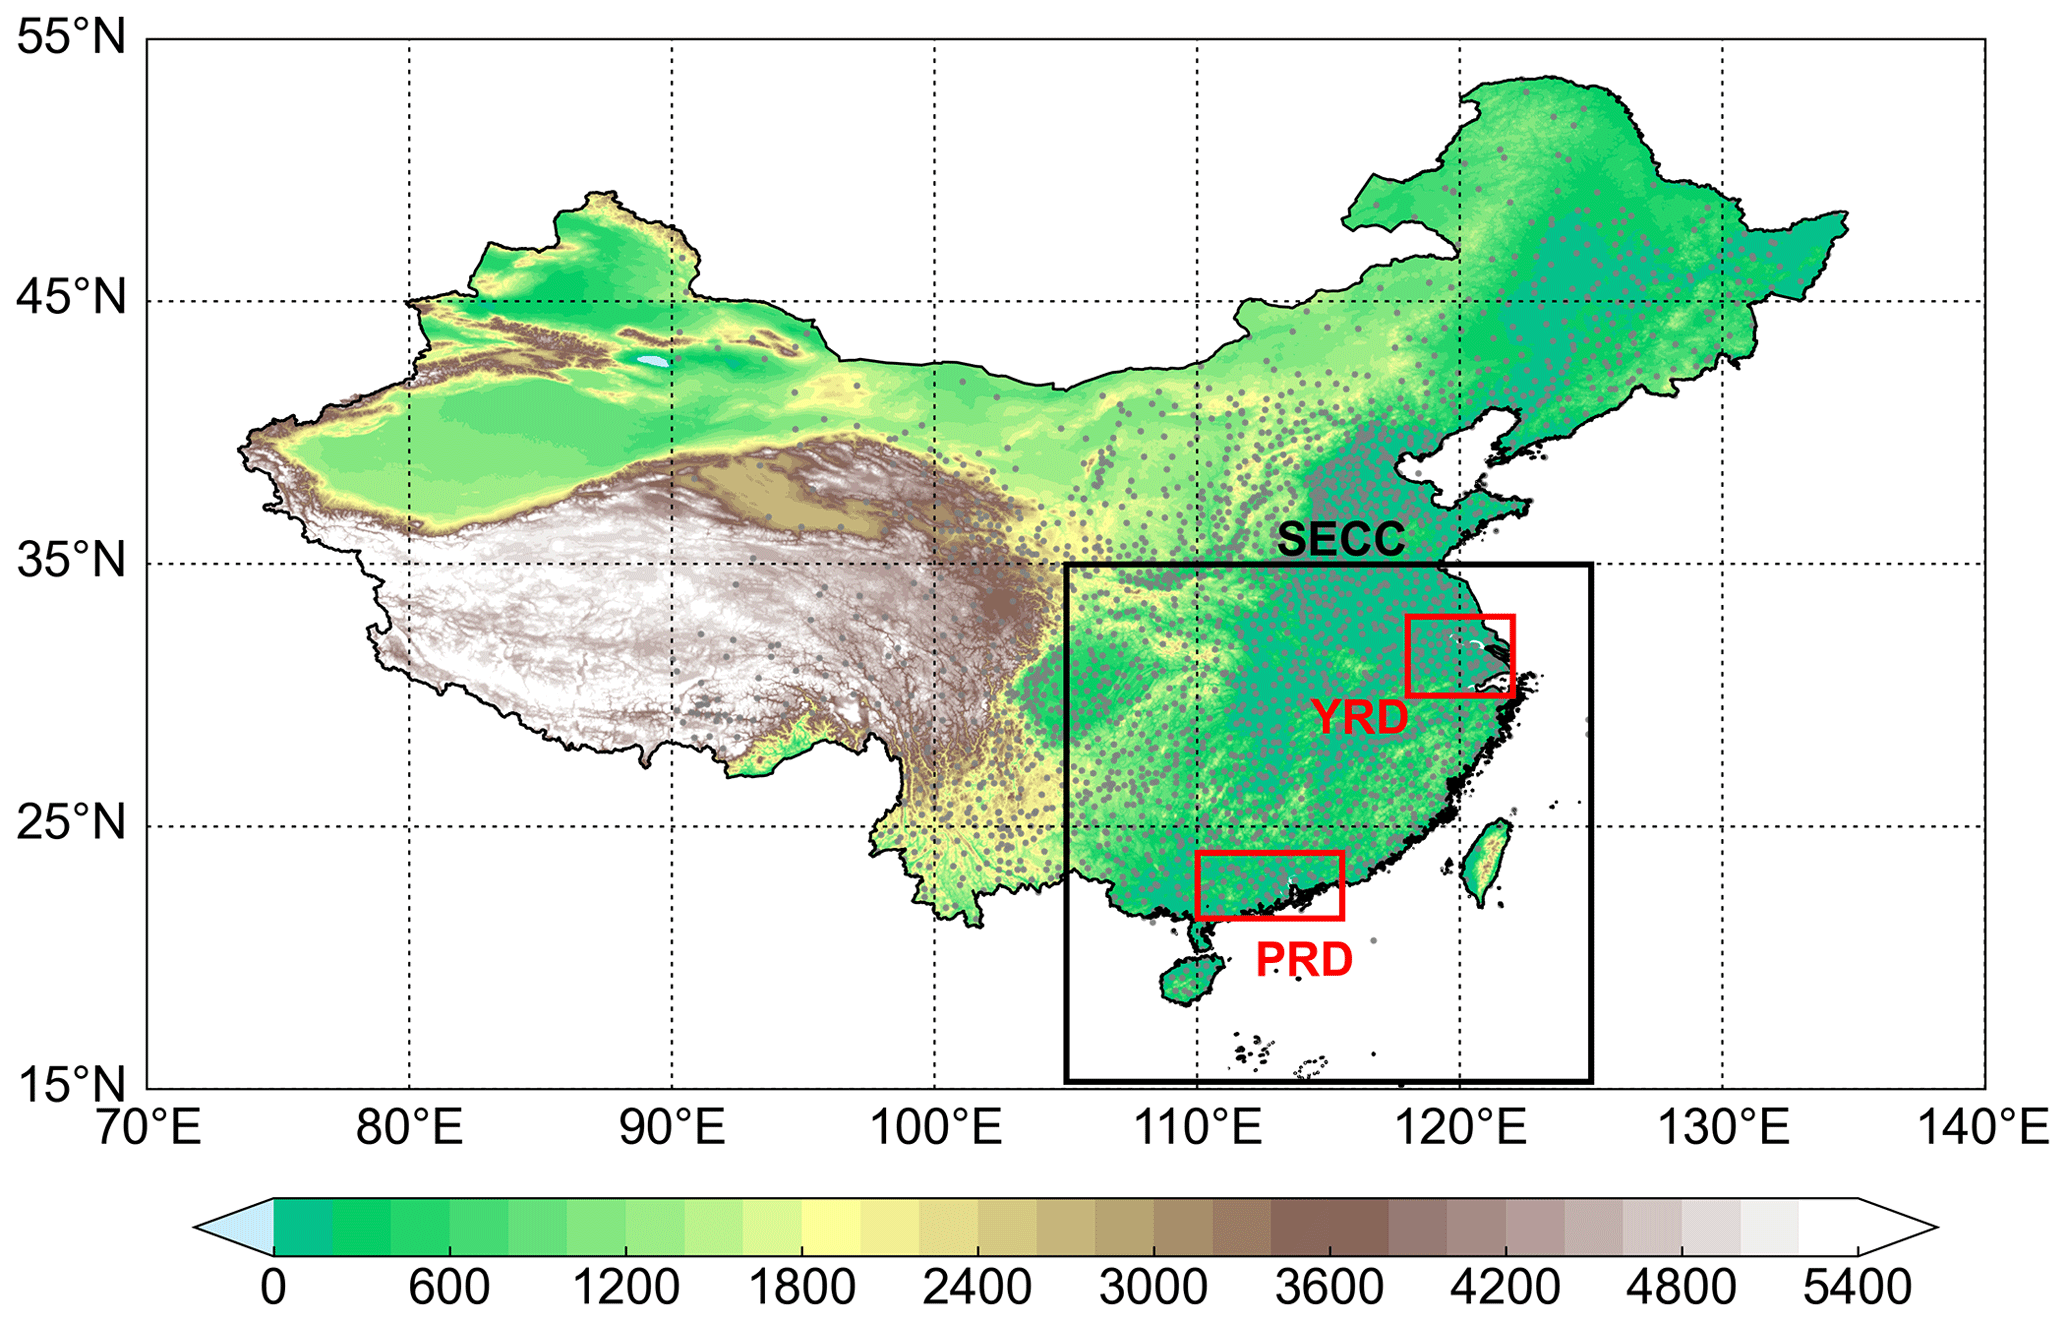
Figure 1Topographic map of China with the SECC (black box) and megacity clusters of the YRD and PRD outlined (red boxes). Gray points represent the temperature observation stations.
2.2 Reanalysis datasets
The ground level ozone concentrations for the period 2014–2019 are obtained from the high-resolution and high-quality ground level MDA8 ozone data (units in µg m−3) for China (ChinaHighO3) at a resolution of 0.1°×0.1°, which is one of the series of the high-resolution and high-quality ground level air pollutants in China (Wei et al., 2022). The ChinaHighO3 dataset provides reliable estimates of MDA8 ozone, demonstrated by an average out-of-sample (out-of-station) coefficient of determination of 0.87 (0.80) and a root mean square error of 17.10 (21.10) µg m−3 across China (Wei et al., 2022).
Meteorological parameters including 2 m air temperature (T2m), relative humidity (RH), surface solar radiation downward (SSRD), geopotential height (HGT), eastward wind (uwnd), northward wind (vwnd), mean sea level pressure (MSLP), total cloud cover (TCC), vertical integral of eastward water vapor flux, vertical integral of northward water vapor flux, and vertically integrated moisture divergence are from the fifth generation of the European Centre for Medium-Range Weather Forecasts (ECMWF) reanalysis data (ERA5), which is the latest global atmospheric reanalysis of ECMWF (Hersbach et al., 2020). The temporal resolution for T2m, SSRD, and TCC is 6 h, while that for other meteorological parameters is 3 h, all of these parameters are all utilized to generate the daily mean values.
2.3 Identifications of extreme events
Severe ozone pollution episodes generally occur in the SECC during summertime, coinciding with frequent heat waves and TCs (Ji et al., 2024; Shu et al., 2016). In this work, we focus on the impacts of extremely high temperatures and TCs on surface ozone during summer only (June, July, and August) in the SECC, as outlined in Fig. 1. P. Wang et al. (2022) pointed out that most TC tracks over the western North Pacific have passed through the SECC region during their lifetimes in the past several decades. The hot days (HDs) are defined as dates when the number of high-temperature sites (Tmax≥35 °C) exceeds more than 40 % of the total number of observation stations within the SECC. We use the proportion of high-temperature sites exceeding 40 % as a measure of HDs to ensure adequate samples and extremely hot conditions over the SECC during HDs. Note that the anomalies of surface ozone concentrations exhibit consistent spatial patterns during HDs identified by with a lower (30 %) or higher (50 %) criterion for the percentage of high-temperature sites (figures not shown). In this work, we classify all HDs into two categories: tropical cyclone–hot days (TC–HDs) and hot days alone (AHDs). TC–HDs are identified when hot days occur over the land regions within the SECC, concurrent with the passages of tropical cyclones through the area, and AHDs indicate hot days that occur independently.
In this work, the least squares method is applied to fit the linear trend, and Student's t test is used to test the significance of the trend (α=0.05). A p value<0.05 indicates the statistically significant trend (as shown in Fig. 2). Student's t test is also used to evaluate the significance of the differences in ozone concentrations and meteorological variables between HDs/TC–HDs and the long-term climatology.
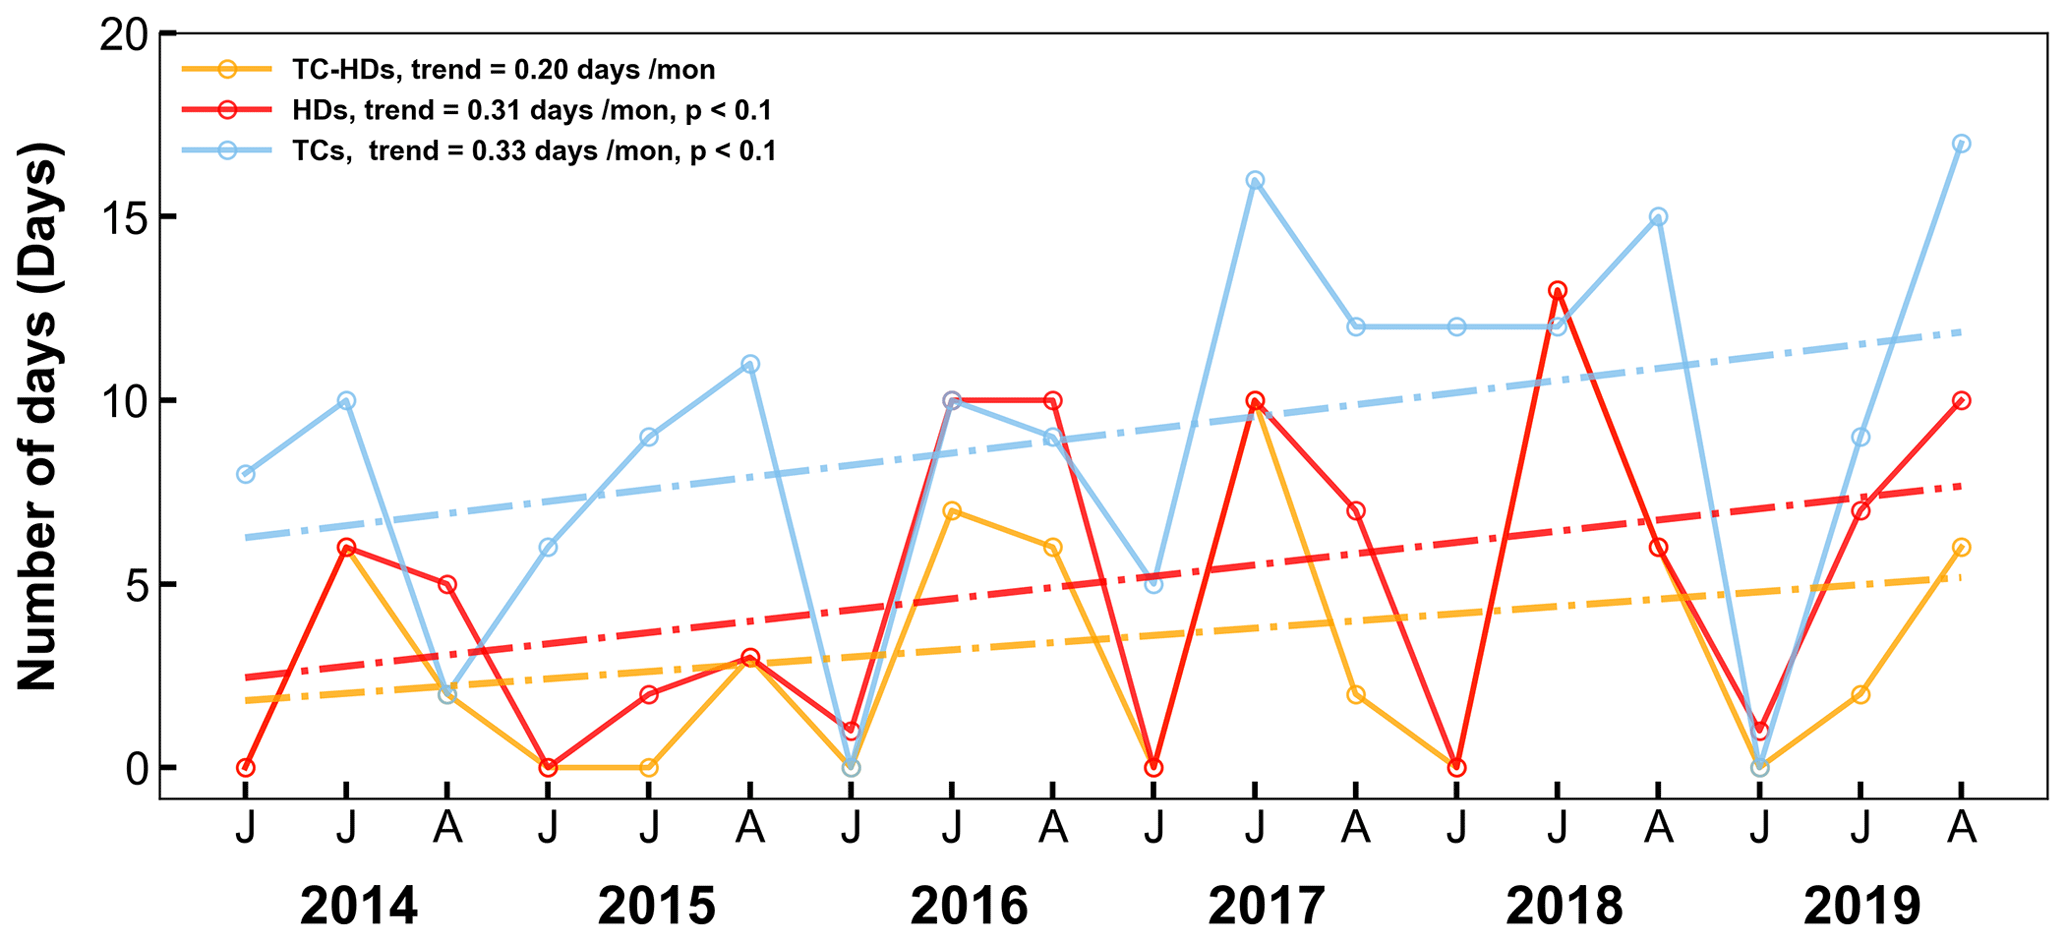
Figure 2Monthly variations in the number of days of TC–HDs, total HDs, and total TCs during the summer season (June, July, and August) from 2014–2019.
2.4 GEOS-Chem
In this study, surface ozone concentrations during 2014–2019 are simulated using the 3-D global chemical transport model (GEOS-Chem, version 13.4.1), with a horizontal resolution of 2° latitude × 2.5° longitude and 47 vertical layers from the surface to 0.01 hPa. GEOS-Chem has the fully coupled O3–NOx–hydrocarbon–aerosol chemical mechanisms (Pye et al., 2009; Sherwen et al., 2016) used to simulate concentrations of gas phase pollutants (such as ozone) and aerosols. It is driven by assimilated meteorological data from Version 2 of the Modern-Era Retrospective analysis for Research and Applications (MERRA-2; Gelaro et al., 2017).
The anthropogenic emissions of ozone precursor gases, including CO, NOx, and non-methane volatile organic compounds (NMVOCs) are provided by the Community Emissions Data System (CEDS) (Hoesly et al., 2018). Methane (CH4) concentrations are provided by the Global Monitoring Laboratory (GML) of the National Oceanic and Atmospheric Administration (NOAA). Biomass burning emissions are obtained from the Global Fire Emissions Database, Version 4 (GFEDv4) (Van Der Werf et al., 2017). The biogenic emissions are estimated with the Model of Emissions of Gases and Aerosols from Nature (MEGAN) version 2.1 (Guenther et al., 2012). Our previous studies show that GEOS-Chem excels in accurately reproducing observed ozone concentrations and spatial distributions in China (Yang et al., 2022, 2014).
Meteorological conditions can modulate surface ozone concentrations through affecting the physical and chemical processes including chemical production, horizontal advection, vertical advection, dry deposition, and diffusion (Gong and Liao, 2019). In this work, we quantify the contributions of individual processes to ozone changes using the model outputs of GEOS-Chem (Gong and Liao, 2019; Ni et al., 2024; Shu et al., 2016). In GEOS-Chem, the change in ozone over the time steps are caused by chemical production, horizontal advection, vertical advection, dry deposition, and diffusion, which can be used for separating out and quantifying the contributions of individual physical and chemical processes to the changes in the simulated ozone concentrations (Gong and Liao, 2019; Ni et al., 2024; Shu et al., 2016).
There are 63 d of TC–HDs over the SECC during the summers of 2014–2019, accounting for around 70 % of the total HDs (91 d), with 28 hot days (30 %) occurring alone (AHDs) over the past 6 years. The monthly variations in HDs, TCs, and TC–HDs over the SECC from 2014 to 2019 are displayed in Fig. 2. All of the weather extremes show notable intraseasonal variations with relatively higher occurrences in July and August but lower occurrences in June each year. Besides, both the occurrences of HDs and TCs demonstrate significant upward trends at the 90 % confidence level, with a rate of 0.31 and 0.33 d month−1, respectively. TC–HDs also show an increasing trend with a rate of increase of 0.2 d month−1, consistent with the variations in HDs and TCs over the past 6 years. Hence, it is essential to examine the effects of rising TC–HDs on ozone pollution in the SECC region.
Figure 3 demonstrates the spatial features of TC–HDs during 2014–2019. The China Meteorological Administration classifies tropical cyclones into six classes based on their intensity, namely tropical depression (TD; 10.8–17.1 m s−1), tropical storm (TS; 17.2–24.4 m s−1), strong tropical storm (STS; 24.5–32.6 m s−1), typhoon (TY; 32.7–41.4 m s−1), strong typhoon (STY; 41.5–50.9 m s−1), and super typhoon (SSTY; ≥51.0 m s−1). TCs are generally stronger before their landfalls, which can reach STY and even SSTY (Fig. 3a and b), consistent with previous findings (Han et al., 2022; Tuleya et al., 1984). TCs that affect the SECC primarily originate east of 135° E and move westward to the eastern coastal regions. Around 90 % of TCs associated with TC–HDs make landfalls, while the others weaken and dissipate over the ocean. Moreover, the air temperatures over the land regions of the SECC during the TC–HDs are generally high, where the average Tmax of most sites is beyond 35 °C and reaches up to 38 °C (Fig. 3a). Compared with the summer climatology from 2014 to 2019, the average Tmax during TC–HDs increased by approximately 4 °C over most land regions of the SECC (Fig. 3b).
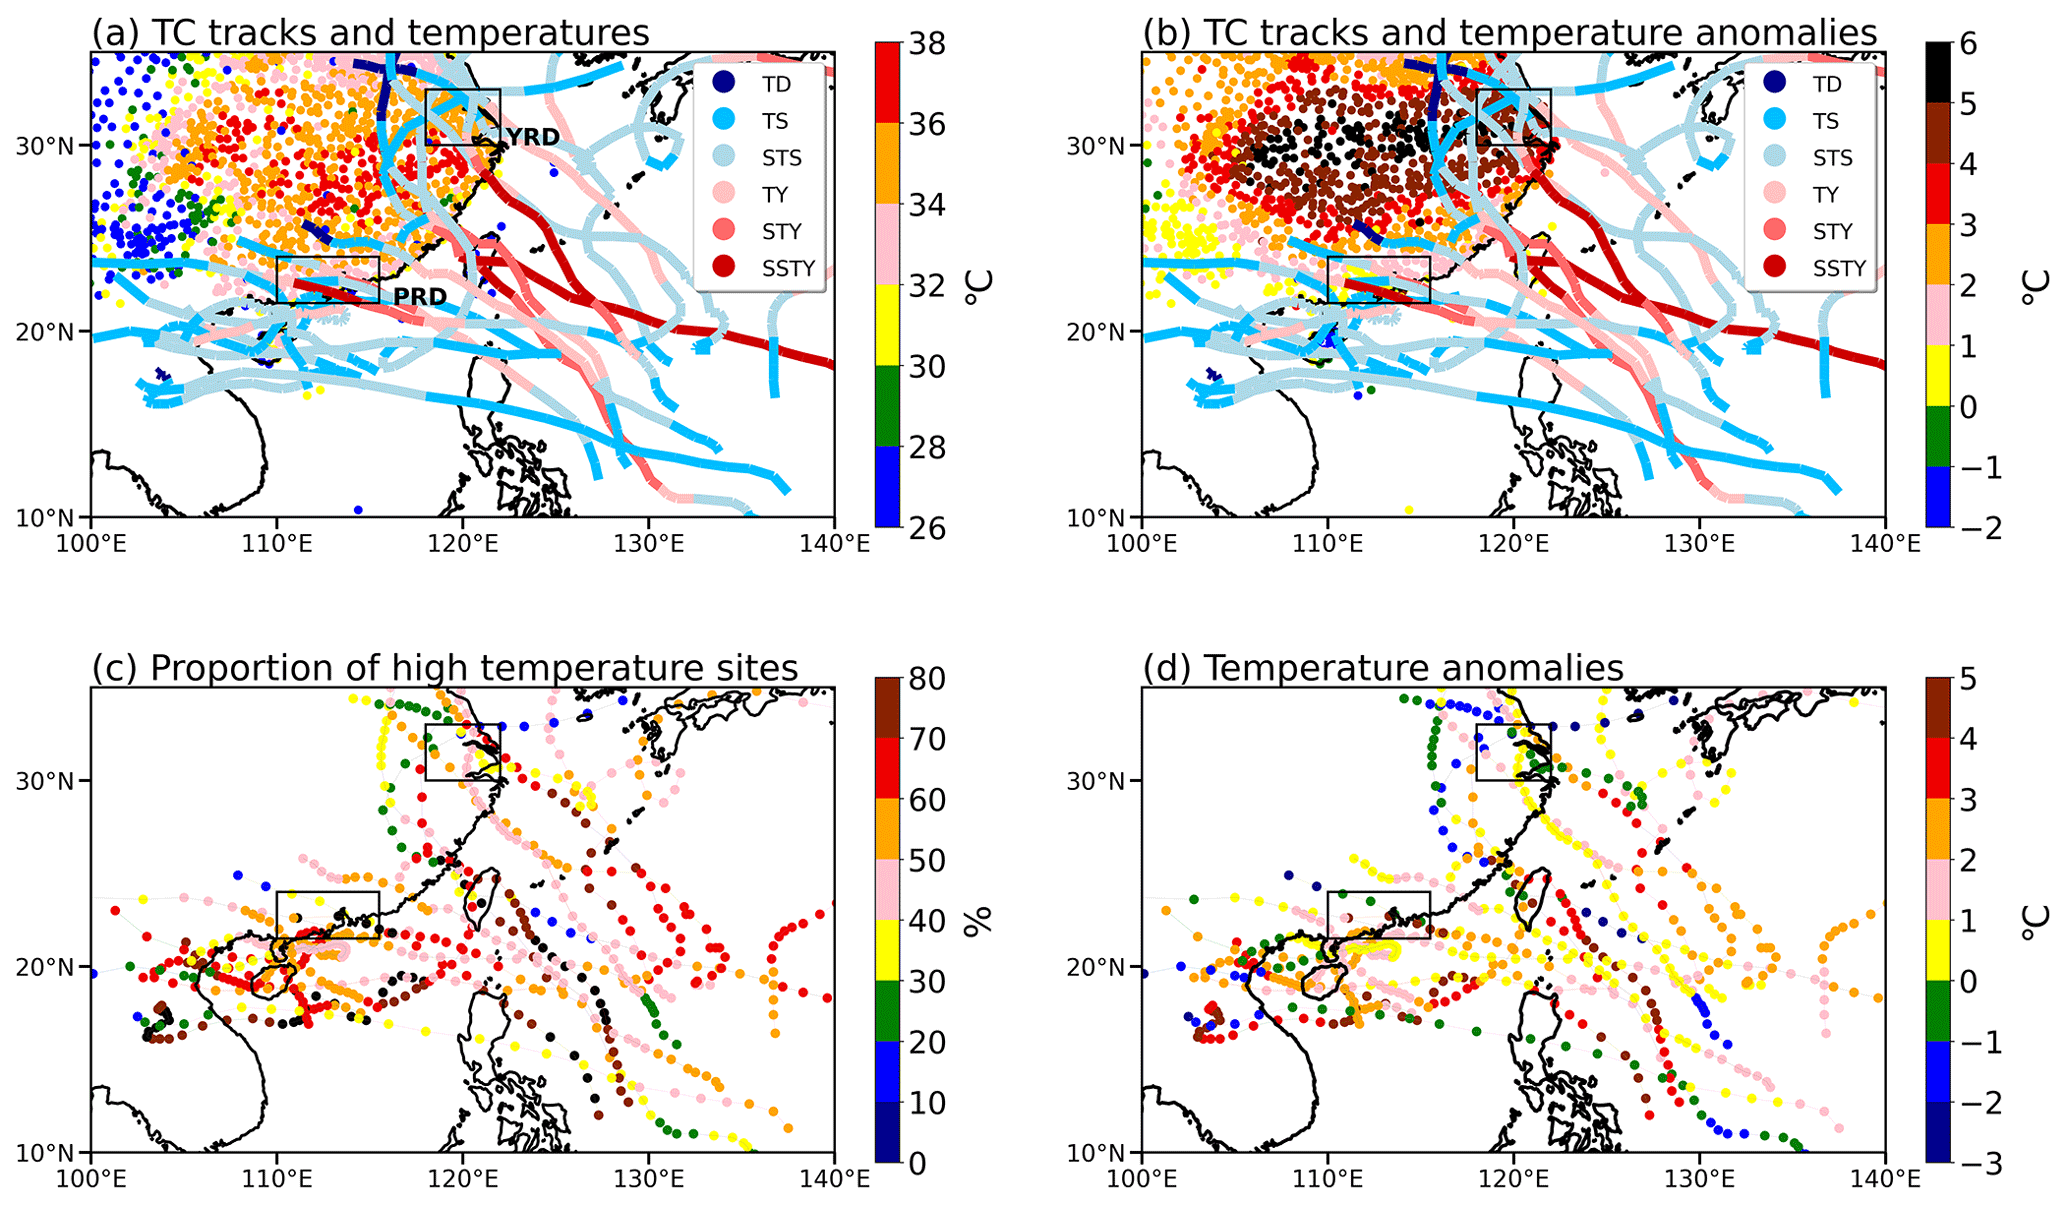
Figure 3(a) The distribution of the average Tmax (dots) and TC tracks during TC–HDs. (b) The area average of Tmax anomalies during the TC–HD period relative to the summer climatology (June to August of 2014–2019), along with the TC tracks categorized by different intensities. (c) The proportion of high-temperature sites (Tmax≥35 °C) over the land region of the SECC, along with the movements of the TCs. The proportion of high-temperature sites refers to the percentage of high-temperature sites within all stations in the SECC region. (d) The average of Tmax anomalies for all observational sites within the SECC relative to the summer climatology, along with the movements of TCs. The YRD and PRD regions are outlined with black boxes in each panel.
The temporal variations in the proportion of high-temperature sites (Tmax≥35 °C) and the temperature anomalies relative to the summertime climatology averaged for the SECC land regions, along with the movements of TCs, are given in Fig. 3c and d. Specifically, in Fig. 3c and d, the colored dots along the movements of TC tracks represent the proportion of high-temperature sites and the average temperature anomalies relative to the summertime climatology in the SECC, respectively. The two variables demonstrate similar patterns of variation. As TCs approach land regions, both the high-temperature sites and temperature anomalies are increasing gradually, with a particularly pronounced temperature increase associated with TCs moving towards the PRD regions. In contrast, there is typically a decline in both the average air temperatures and the proportion of high-temperature sites following the landfalls of TCs, which could be related to the strong wind and rainfall associated with the TCs (Gori et al., 2022; Zhang et al., 2024).
Extremely high temperatures and the accompanying meteorology, such as high-pressure systems and strong radiation, can affect local ozone pollution by enhancing chemical production and/or accumulation (Gong and Liao, 2019; P. Wang et al., 2022; X. Wang et al., 2009). It is also well demonstrated that extremely high temperatures and TCs can affect ozone pollution in coastal regions of China (Ding et al., 2023; Huang et al., 2011; N. Wang et al., 2022). In this work, we further focus on the impacts of TC–HDs on surface ozone concentrations over the land regions of the SECC. Figure 4 presents the spatial distributions of ozone concentration anomalies during TC–HDs and AHDs relative to the summertime climatology from 2014–2019, as well as the differences between the two. Notable increases in surface ozone concentrations are observed over most land regions of the SECC during the AHD period, with anomalous MDA8 ozone reaching 40 and 20 µg m−3 over the YRD (30–33° N, 118–122° E) and PRD (21.5–24° N, 110–115.5° E) regions, respectively (Fig. 4a), consistent with previous finding that hot extremes can worsen ozone pollution (P. Wang et al., 2022). During the compound TC–HDs, most land regions, except Hainan island and the northern part to 33° N of the SECC, experience a significant enhancement in surface ozone concentrations, with MDA8 ozone anomalies above 20 µg m−3 overall (Fig. 4b). Compared to AHDs, ozone concentrations in the easternmost coastal regions of China, including the YRD (outlined in Fig. 4c), are suppressed, while ozone concentrations over the southernmost coastal regions of China, including the PRD (outlined in Fig. 4c), are promoted during the compound TC–HDs. When compared to TCs occurring alone, surface ozone concentrations over most land regions of the SECC increase during TC–HDs (Fig. S1 in the Supplement), which should be attributed to the increases in air temperatures. In this work, we investigate the enhanced surface ozone concentration of the PRD and the contrasting depression over the YRD during the compound TC–HDs.
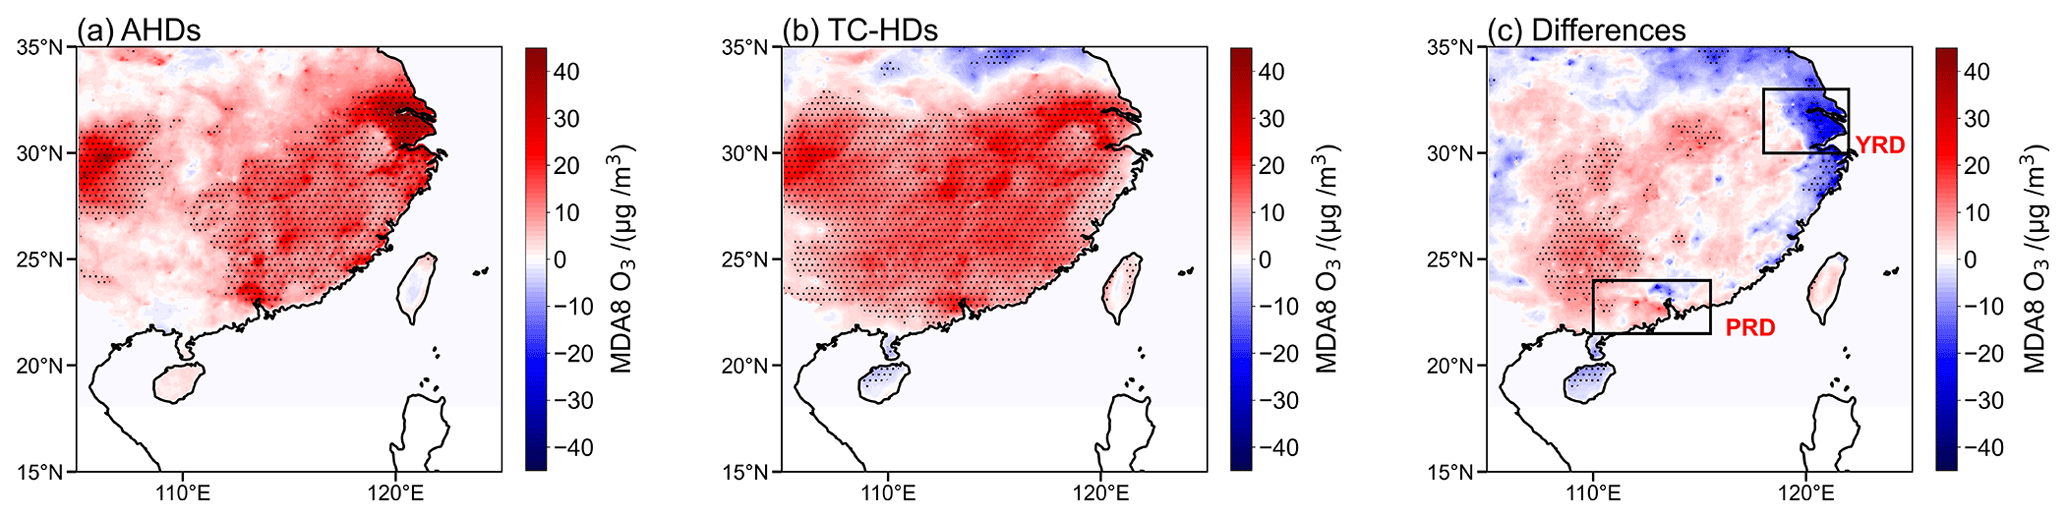
Figure 4The spatial distribution of surface MDA8 ozone concentration anomalies during the periods of (a) AHDs, (b) TC–HDs relative to the summertime climatology, and (c) their differences (TC–HDs minus AHDs). Stippled regions indicate ozone anomalies that are significantly different from zero at the 95 % confidence level. The YRD and PRD regions are outlined in black boxes in panel (c).
The temporal variations in anomalous MDA8 ozone in the YRD and PRD regions relative to the summertime climatology with TC tracks during TC–HDs are shown in Fig. 5. In Fig. 5a and b, the colored dots along the TC track represent the anomalies of regional mean MDA8 ozone concentrations for the YRD and PRD at that time compared with the summertime climatology for 2014–2019. Surface ozone concentrations over the YRD are abnormally higher when TCs are positioned a great distance from land regions, whereas ozone concentrations fall dramatically when TCs approach and make landfall over land regions. And it should be noted that the surface ozone concentrations are elevated by the TCs moving westward of the YRD, while most of the other TCs cause a decline in ozone concentrations with their approach to land regions, consistent with previous work (Shu et al., 2016). Zhan et al. (2020) revealed that O3 pollution episodes in the YRD mainly occurred near the 24 h warning line before a TC landed on the coastline. The region was impacted by an inland wind carrying substantial precursor substances from polluted areas, while approaching TCs led to increased precipitation and strong winds, resulting in decreased ozone concentrations. For the PRD, surface ozone concentrations increase noticeably when TCs approach land regions. Particularly, TCs heading northeast to the YRD favor the increases in ozone concentrations in the PRD, whereas the other TC tracks tend to cause a reduction in surface ozone concentrations following landfall (Fig. 5b).
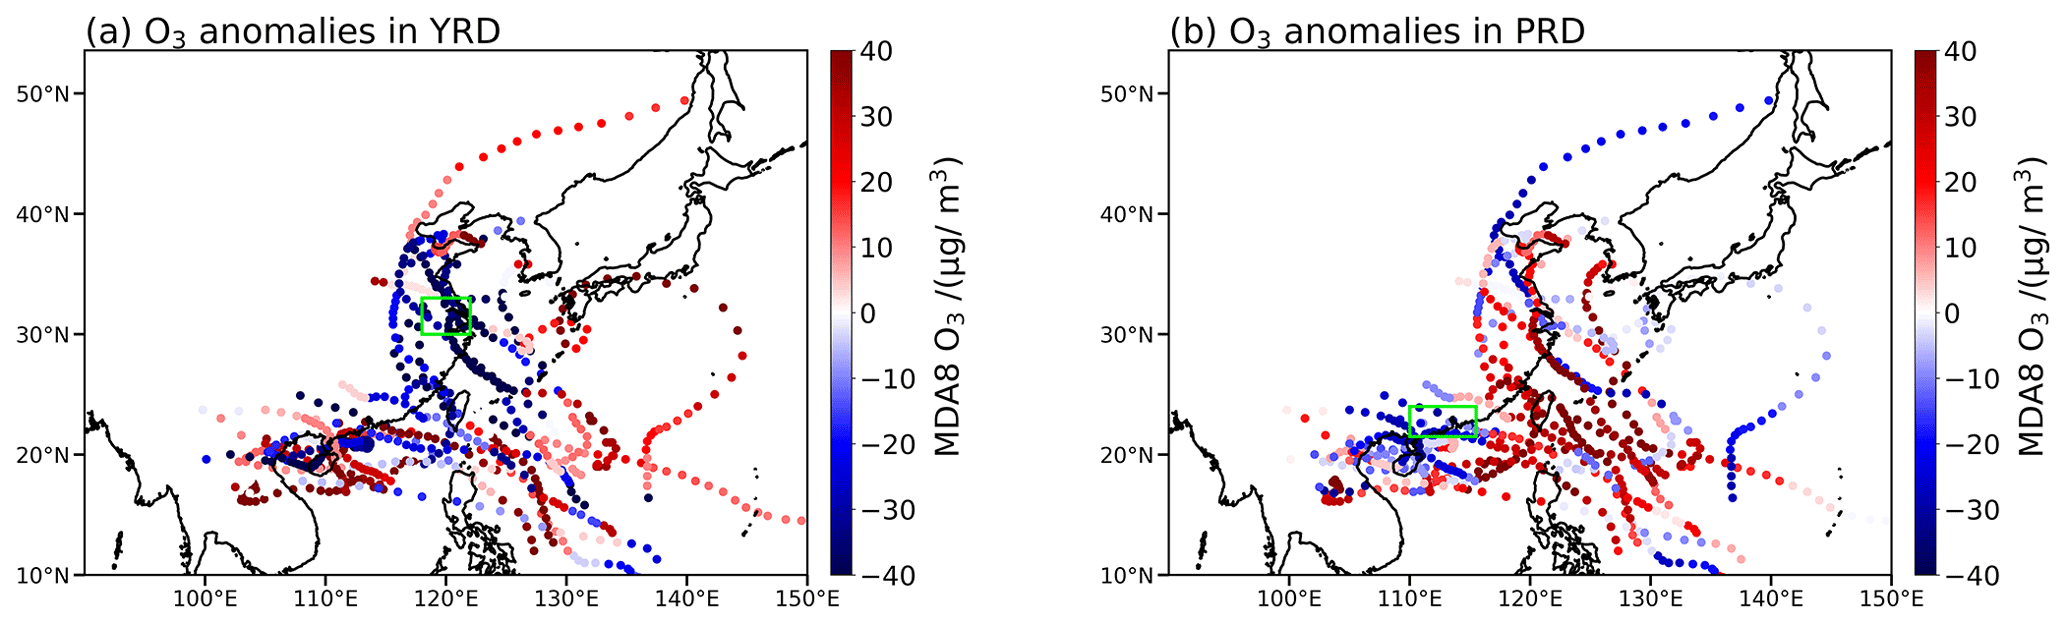
Figure 5The average anomalies of surface MDA8 ozone concentrations over the land regions of the SECC, along with the movements of TCs associated with TC–HDs for the (a) YRD and (b) PRD regions. The YRD (a) and PRD (b) regions are outlined in green boxes in panels (a) and (b).
5.1 The dominant synoptic circulations
The synoptic meteorological conditions during AHDs and TC–HDs are analyzed to disentangle the different responses of surface ozone to hot extremes superimposed by TCs. Specifically, we examine the composites of daily mean air temperature at 2 m (T2m), relative humidity (RH), surface solar radiation downward (SSRD), mean sea level surface (MSLP), geopotential height at 500 hPa (500 hPa HGT) and 10 m wind speeds, and total cloud cover (TCC) anomalies relative to the summertime climatology from 2014 to 2019 during AHDs (Fig. 6) and TC–HDs (Fig. 7), as well as the differences between the two periods (Fig. 8). During the AHD period, the land regions of the SECC are covered by increased T2m, decreased RH, reduced TCC, and enhanced SSRD (Fig. 6a–d), which are favorable conditions for the chemical formation of ozone (Yin et al., 2019), thus supporting the elevated surface ozone during AHDs as shown in Fig. 4a. In the mid–upper troposphere, a band of positive HGT at 500 hPa (H500) anomalies predominates over most land regions of China, extending northeastward to Korea (Fig. 6e). This pattern features westerly wind anomalies in the northern flank and easterly wind anomalies in the southern flank, indicating a westward extension and strengthening of the western North Pacific subtropical high (WNPSH). These conditions favor the occurrences of hot extremes over southern China, as discussed by Luo and Lau (2017) and P. Wang et al. (2018). Besides, it is noteworthy that negative H500 anomalies and cyclonic circulation appear over the east of 125° E, which are also seen at the surface (Fig. 6f), with anomalous prevailing southwesterlies over the SECC land regions at the surface (Fig. 6f). Such a low-pressure system characterizes the TC track which finally recurves northeastward (Fig. S2).
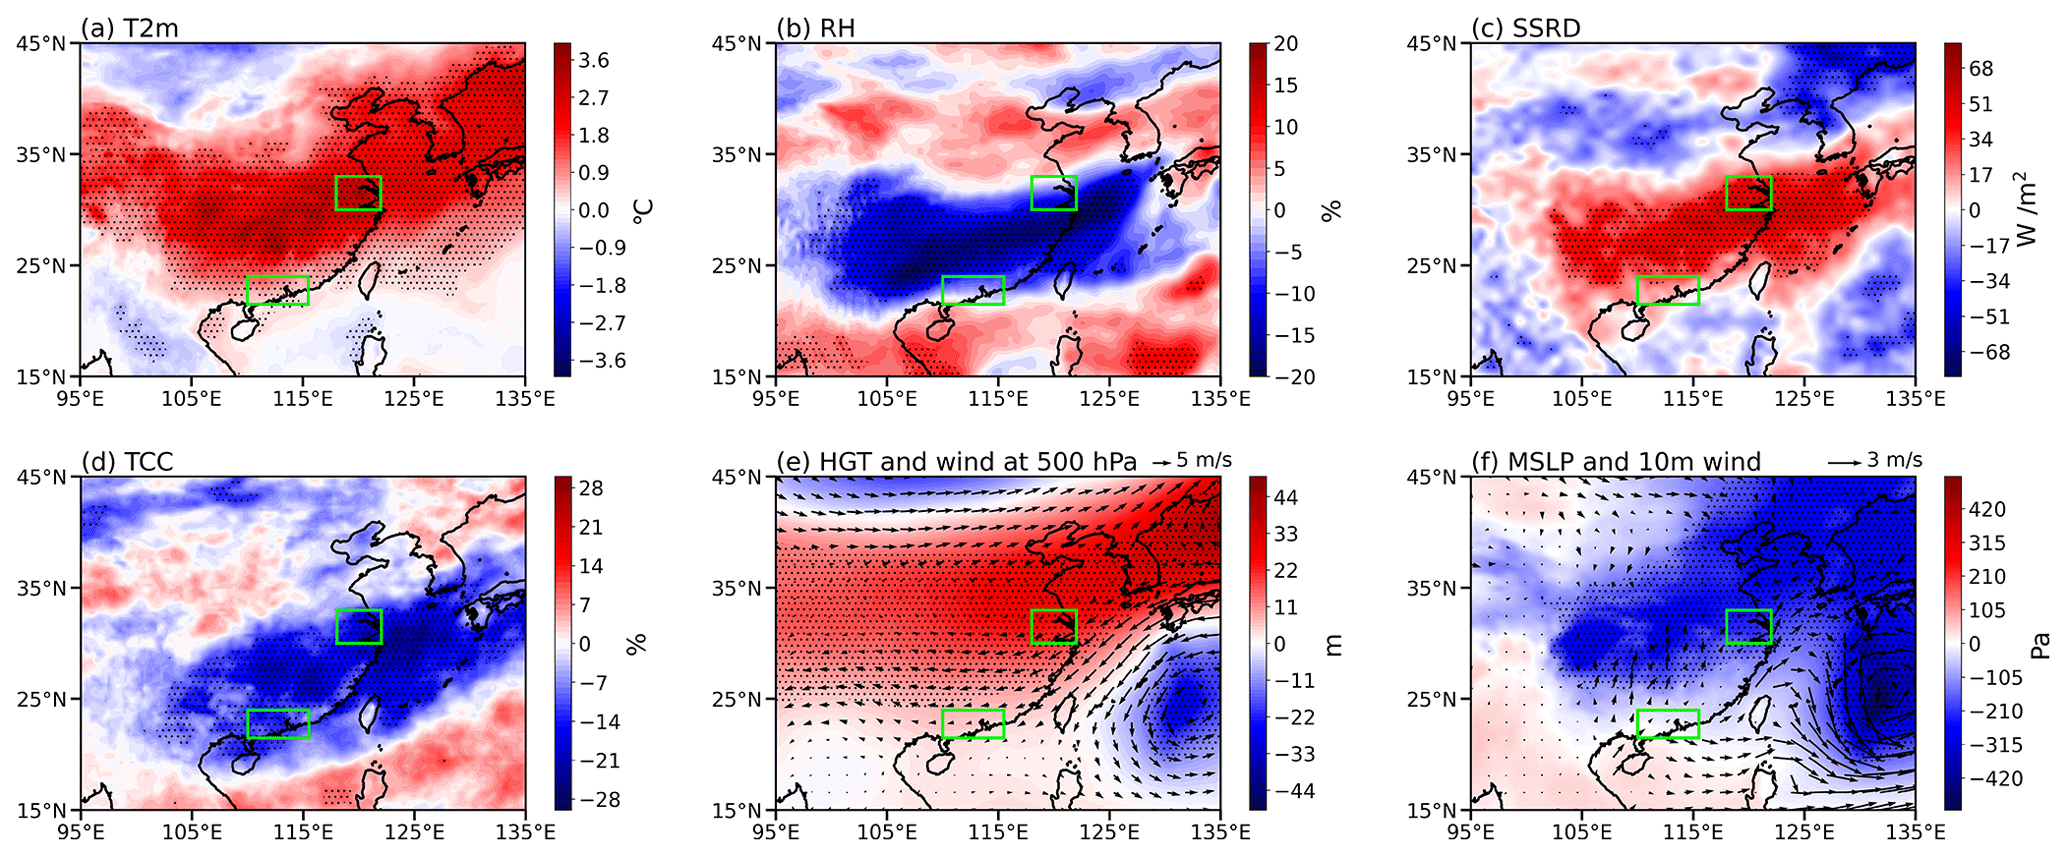
Figure 6The spatial distribution of the composites anomalies of (a) air temperature at 2 m (T2m), (b) relative humidity (RH), (c) surface solar radiation downward (SSRD), (d) total cloud cover (TCC), (e) geopotential height (HGT) and winds at 500 hPa, and (f) mean surface level pressure (MSLP) and 10 m winds during AHDs relative to the summer climatology. Stippling indicates statistically significant anomalies above the 95 % confidence level. The YRD and PRD regions are outlined in green boxes in each panel.
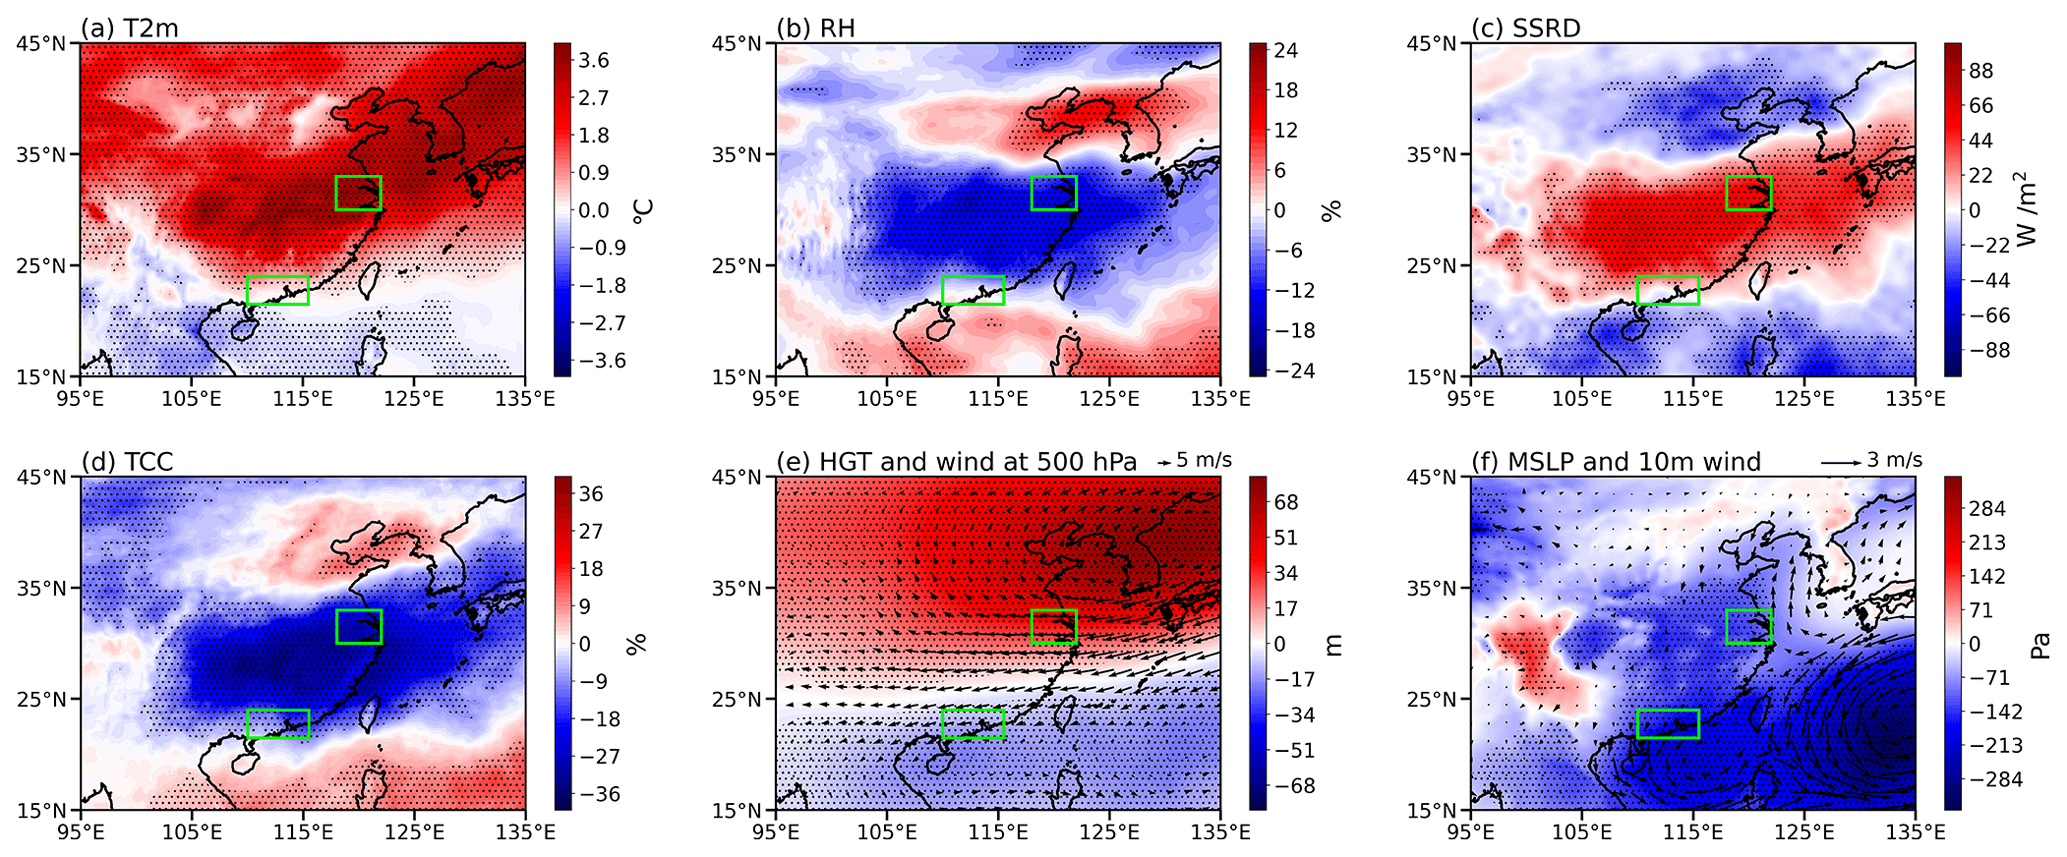
Figure 7Same as Fig. 6 but for the anomalous meteorological conditions during TC–HDs.
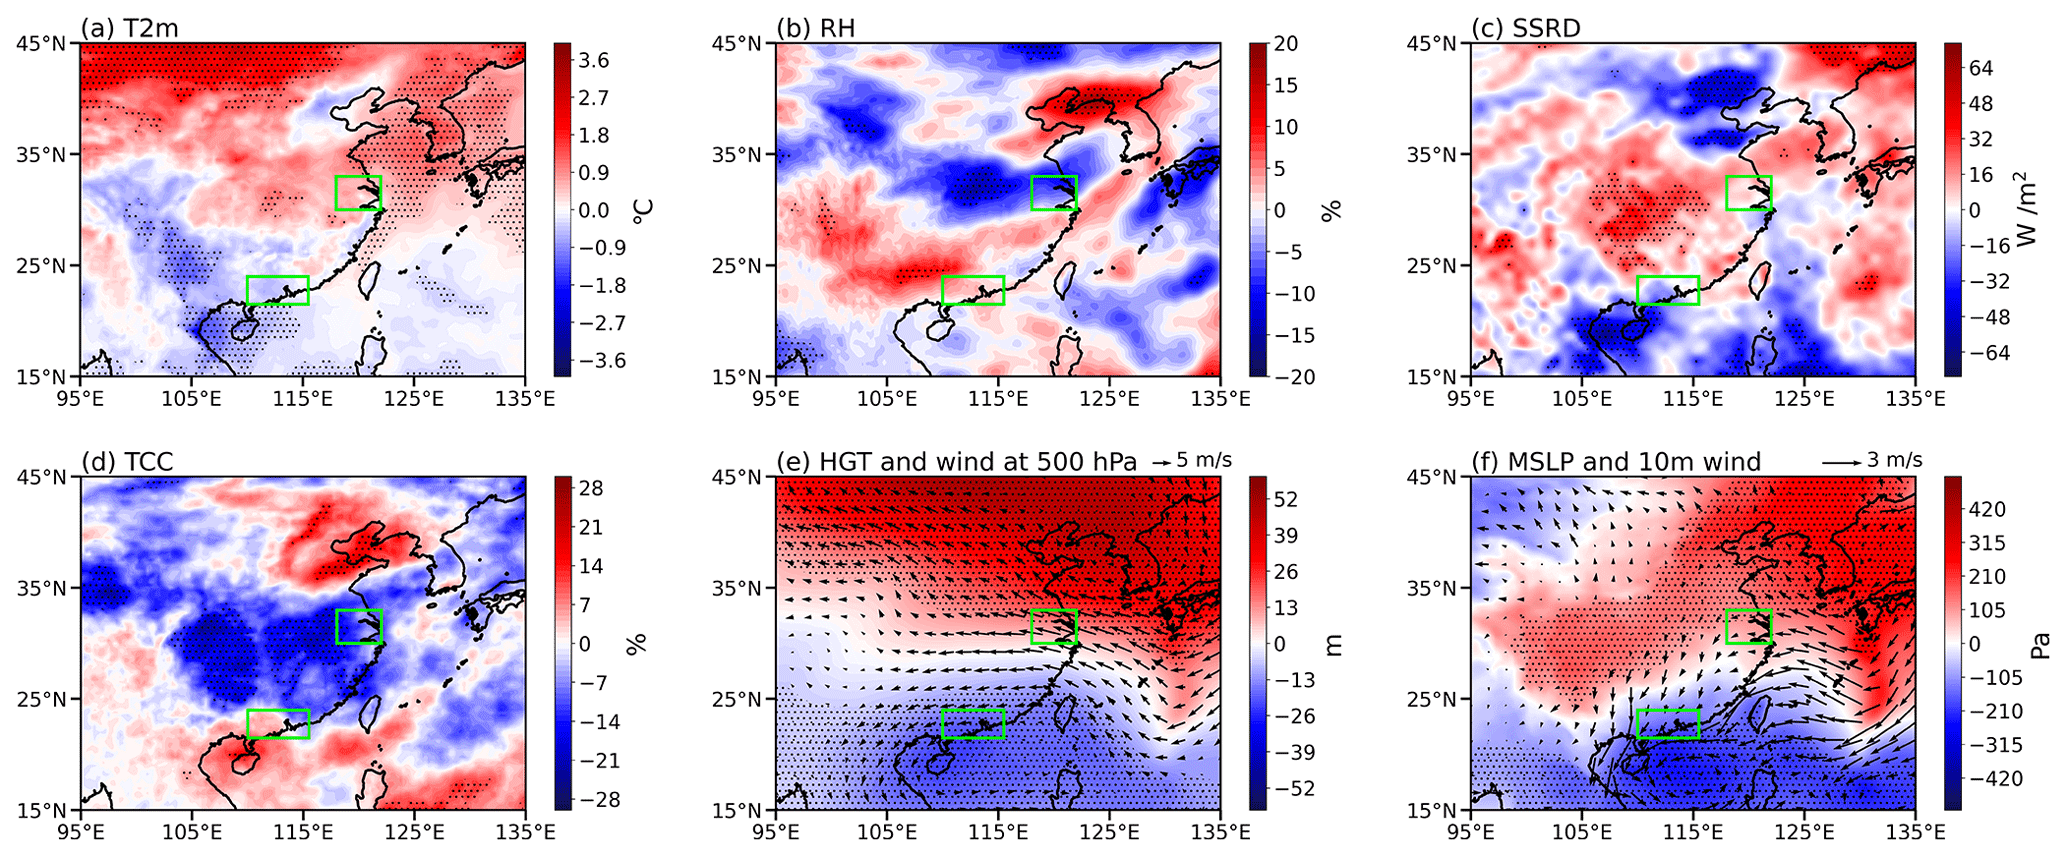
Figure 8Same as Fig. 6 but for the differences between TC–HDs and AHDs (TC–HDs minus AHDs).
During TC–HDs, most land regions of the SECC are covered by increased T2m, decreased RH, reduced TCC, and enhanced SSRD (Fig. 7a–d), thus favoring the enhanced chemical formation of ozone and supporting the elevated surface ozone during TC–HDs, as shown in Fig. 4b. In the mid–upper troposphere, positive H500 anomalies cover nearly the whole land region of China, with the maximum dominating the Korean Peninsula, accompanied by anomalous anticyclonic circulation. Such changes characterize the strengthening and westward extension of the WPSH (Fig. 7e), favoring more hot extremes. A dipole pattern of MSLP anomalies can be observed at the surface, with an abnormal low-pressure center over the South China Sea and another to its east (Fig. 7f). Besides, the land regions are influenced by weak winds at the surface (Fig. 7f). Particularly for the decreased MDA8 ozone, we can see that during TC–HDs, Hainan island is covered by decreased T2m, increased RH, reduced SSRD, and increased TCC (Fig. 7a–d), along with negative H500 and MSLP anomalies (Fig. 7e and f). Such meteorological conditions in Hainan island may suppress the chemical production of ozone, and the oceanic winds may clean the air (Fig. 7e). On the other hand, for the northern part of the SECC, the circulation anomalies favor strengthened southeastern moisture flow and enhance the convergence of water vapor flux there (Fig. S3), which can lead to increased relative humidity (Fig. 7b). The local higher-temperature (Fig. 7a) and humid conditions may favor convection activities (P. Wang et al., 2019b) which are characterized by increased cloud cover (Fig. 7d) and decreased surface solar radiation (Fig. 7c). These meteorological conditions can inhibit the local ozone production and cause a lower-ozone concentration in northern part of the SECC during TC–HDs.
Figure 8 demonstrates the differences in meteorological variables between the periods of TC–HDs and AHDs. Compared to AHDs, the YRD experiences an increase in T2m of approximately 1 °C, while the PRD experiences a decrease in T2m of around 0.5 °C during TC–HDs. In the meanwhile, RH and TCC values are increased (decreased) in the PRD (YRD), while SSRD values are decreased (increased) in the PRD (YRD) (Fig. 8a–d). The large-scale circulations in the middle–upper troposphere show positive H500 anomalies over the north and northeast parts of China, including the YRD, while southern China, including the PRD, is dominated by negative H500 anomalies, supporting the increased T2m (decreased) over the YRD (PRD). Moreover, a cyclonic circulation controls southern China, with the YRD influenced by strong southeasterly winds, while the PRD is influenced by inland northeasterly winds (Fig. 8e). The changes in MSLP show a similar pattern to the H500 anomalies, with positive anomalies over the YRD but negative anomalies over PRD, and an anomalous low-pressure system is observed over South China Sea, accompanied by strong cyclonic circulation at the surface. It should be noted that the YRD is influenced by strong easterly winds from the ocean which may alleviate ozone pollution, as shown in Fig. 4c. In contrast, the PRD is influenced by strong northeasterly winds from inland, which is opposite to the climatological southwesterlies of the summer monsoon circulation and which may favor the accumulation of ozone pollution therein, as shown in Fig. 4c.
It should be noted that the meteorological conditions in the YRD favor the chemical production of ozone, yet reduced ozone concentrations are observed in the YRD during TC–HDs relative to AHDs. The key physiochemical processes associated with the alleviated ozone pollution over YRD but worsened ozone pollution over PRD during TC–HDs relative to AHDs are explored with GEOS-Chem simulations in the following section.
5.2 Process analysis with GEOS-Chem simulations
In this section, process analysis is conducted in GEOS-Chem to quantify the contributions of each process, including net chemical production, horizontal advection, vertical advection, and mixing (diffusion and dry deposition) to the anomalous surface ozone concentrations over the PRD and YRD during TC–HDs, respectively. The observed and simulated anomalous surface MDA8 ozone during TC–HDs relative to the summer climatology mean and AHDs is given in Fig. S4, and the regional averages of surface MDA8 ozone concentrations over the YRD and PRD are summarized in Table 1. The GEOS-Chem simulation can reasonably capture the spatial pattern of anomalous surface MDA8 ozone concentrations during TC–HDs relative to the summer climatology mean (Fig. S4a and b) and relative to AHDs (Fig. S4c and d). Particularly, when compared to AHDs, the simulated surface MDA8 ozone concentrations are inhibited over the YRD but enhanced over the PRD during TC–HDs. As listed in Table 1, when compared to AHDs, during TC–HDs, the observed (simulated) average surface MDA8 ozone concentrations in the YRD decreased by 13.21 µg m−3 (21.94 µg m−3), whereas they increased by 6.8 µg m−3 (7 µg m−3) in the PRD. This suggests that the model simulation can reasonably capture the opposite changes in surface MDA8 ozone concentrations over the YRD and PRD during extremely HDs superimposed by TCs.
Table 1Observed and simulated averaged surface MDA8 ozone (µg m−3) in the Yangtze River Delta (YRD; 30–33° N, 118–122° E) and the Pearl River Delta (PRD; 21.5–24° N, 110–115.5° E) during TC–HDs and AHDs, as well as their differences (TC–HDs minus AHDs).
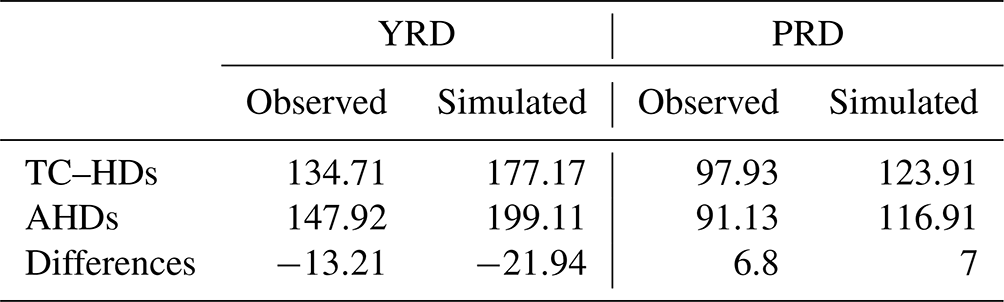
Figure 9 illustrates the vertical profiles of simulated daily mean ozone concentrations for the YRD and PRD from the surface to 500 hPa for the summer climatology with respect to TC–HDs and AHDs during 2014–2019, respectively. For the YRD, surface ozone concentrations are apparently higher during AHDs than those during TC–HDs with respect to summertime climatology from the surface up to the level of 500 hPa (Fig. 9a). This indicates that the enhancements in the ozone concentrations during AHDs occur not only at the surface but also in the middle of the troposphere. In addition, compared with the summertime climatology, ozone concentrations in the YRD during TC–HDs are slightly enhanced from surface to 850 hPa, as well as between 600 and 500 hPa, while they are suppressed between 850 and 600 hPa. For the PRD, ozone concentrations during TC–HDs are higher than the summertime mean for AHDs from the surface up to 500 hPa (Fig. 9b). The ozone concentrations during AHDs are comparable to (slightly stronger than) the summertime mean below (above) 850 hPa (Fig. 9b), based on the GEOS-Chem simulation.
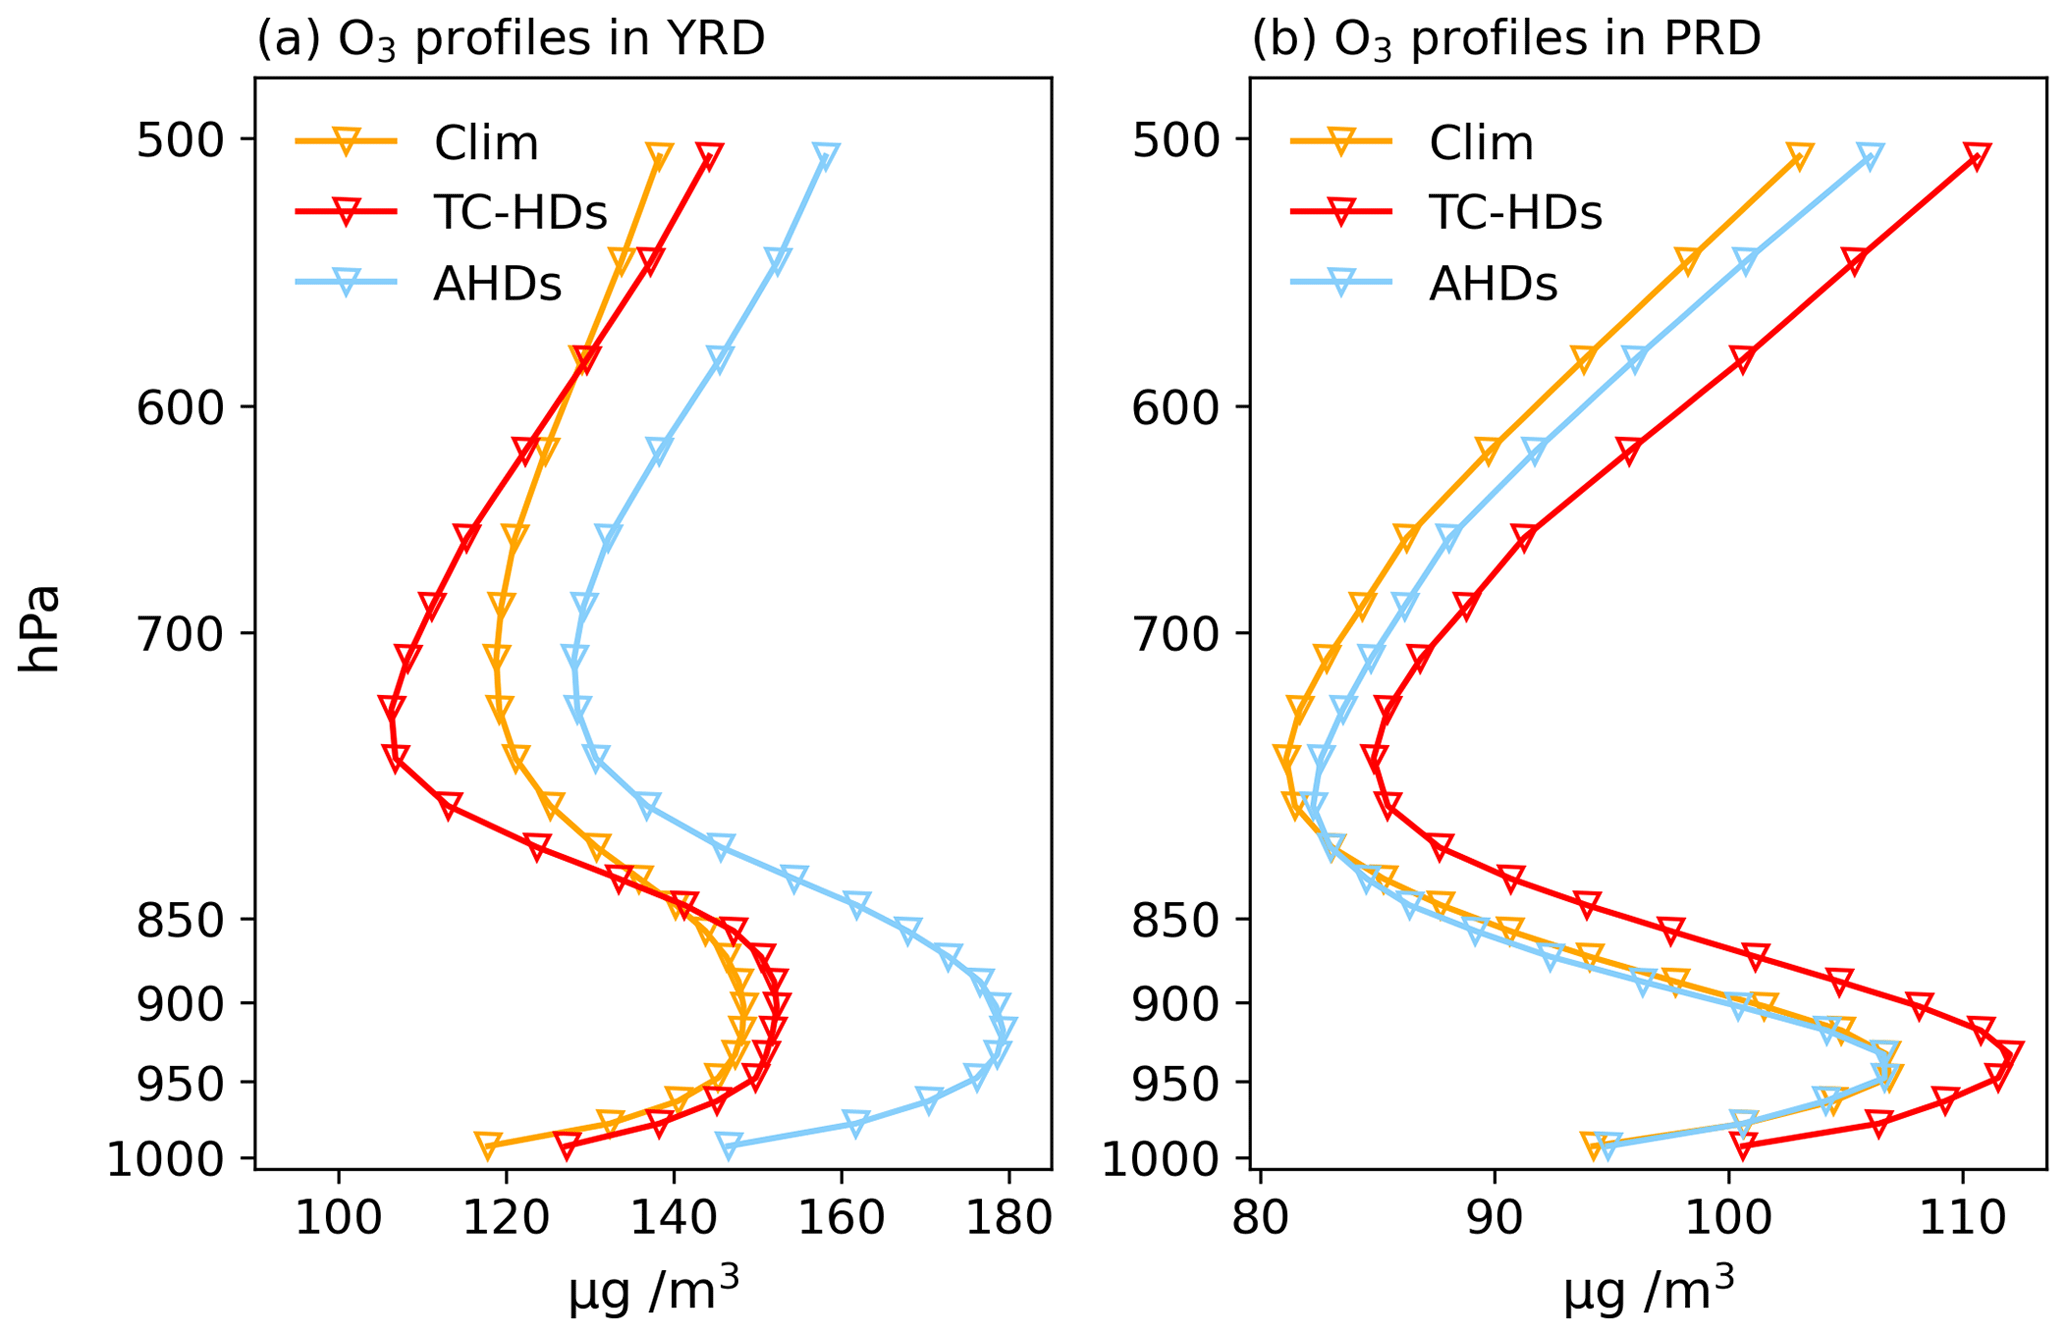
Figure 9Vertical profiles of simulated daily ozone concentrations (µg m−3) averaged over land regions of the SECC for TC–HDs, for AHDs, and for the summertime climatology (Clim) during 2014–2019 for the (a) YRD and (b) PRD.
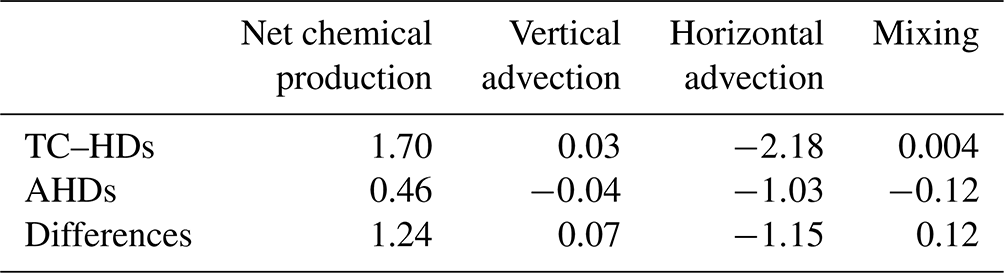
We further analyze the main physiochemical processes affecting ozone concentration, including net chemical production, vertical advection, horizontal advection, and mixing (the sum of dry deposition and diffusion). Figures 10 and 11 show the vertical profiles of the anomaly of each process during TC–HDs and AHDs, relative to the summertime climatology, over the YRD and PRD, as well as the differences between TC–HDs and AHDs. During AHDs, the increase in ozone concentrations in the YRD from the surface to 900 hPa is primarily contributed by chemical production, while transport processes tend to decrease ozone concentration. Between 900 and 700 hPa, the mixing process contributes to the increases in ozone concentrations, while the transport processes and chemical productions tend to decrease ozone concentrations. Between 700 and 500 hPa, horizontal transport hampers ozone increase, while chemical production and vertical transport contribute to ozone enhancement (Fig. 10a). During TC–HDs, the horizontal transport exhibits a suppressive effect on ozone concentrations in the YRD from the surface up to 500 hPa, whereas the chemical production contributes to increases in ozone concentration. And two processes overtake the effects of vertical transport and mixing (Fig. 10b). In comparison with AHDs, during TC–HDs, ozone concentration increases due to chemical production exceed the decreases caused by horizontal transport between the surface and 850 hPa. However, between 850 and 700 hPa, the decrease in ozone concentration due to horizontal transport outweighs the increase from chemical production. Overall, compared to AHDs, the chemical production contributes to increased ozone concentrations in the YRD from the surface up to 500 hPa during TC–HDs, whereas the horizontal transport tends to lower ozone concentrations. The relatively small differences in physicochemical processes between AHDs and TC–HDs around 700 hPa in the vertical profile are due to the minor effects of these processes during both AHDs and TC–HDs (not shown). As listed in Table 2, compared to AHDs, ozone chemical production plays a predominant role in enhancing ozone pollution during TC–HDs in the YRD (1.24 Gg O3 d−1), whereas horizontal transport significantly depresses ozone concentration (−1.15 Gg O3 d−1). As stressed above, the strong and oceanic winds along the YRD can help alleviate ozone pollution. The vertical transport and mixing processes play a less important role in affecting ozone concentrations in YRD during TC–HDs.
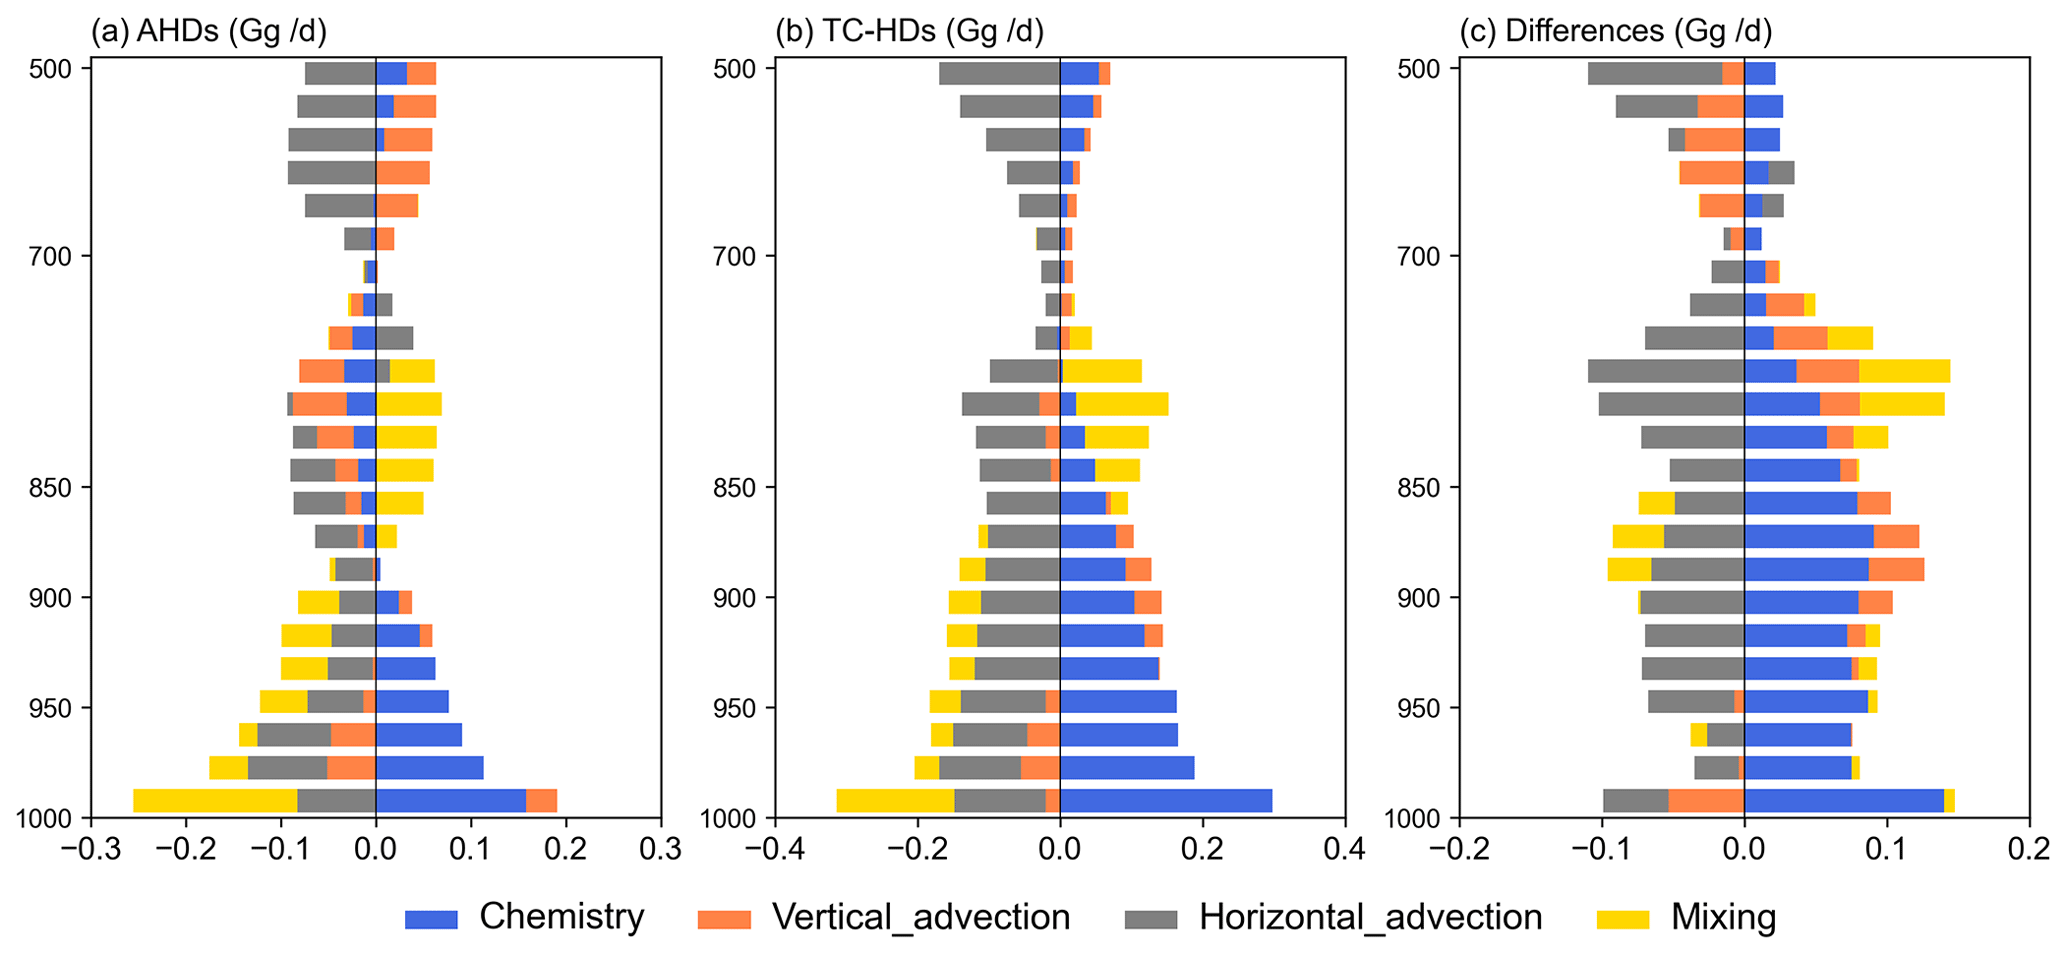
Figure 10Vertical profiles of net changes in ozone mass (Gg O3 d−1) anomalies averaged for YRD for each process during (a) AHDs and (b) TC–HDs relative to summertime climatology, as well as their differences (TC–HDs minus AHDs).
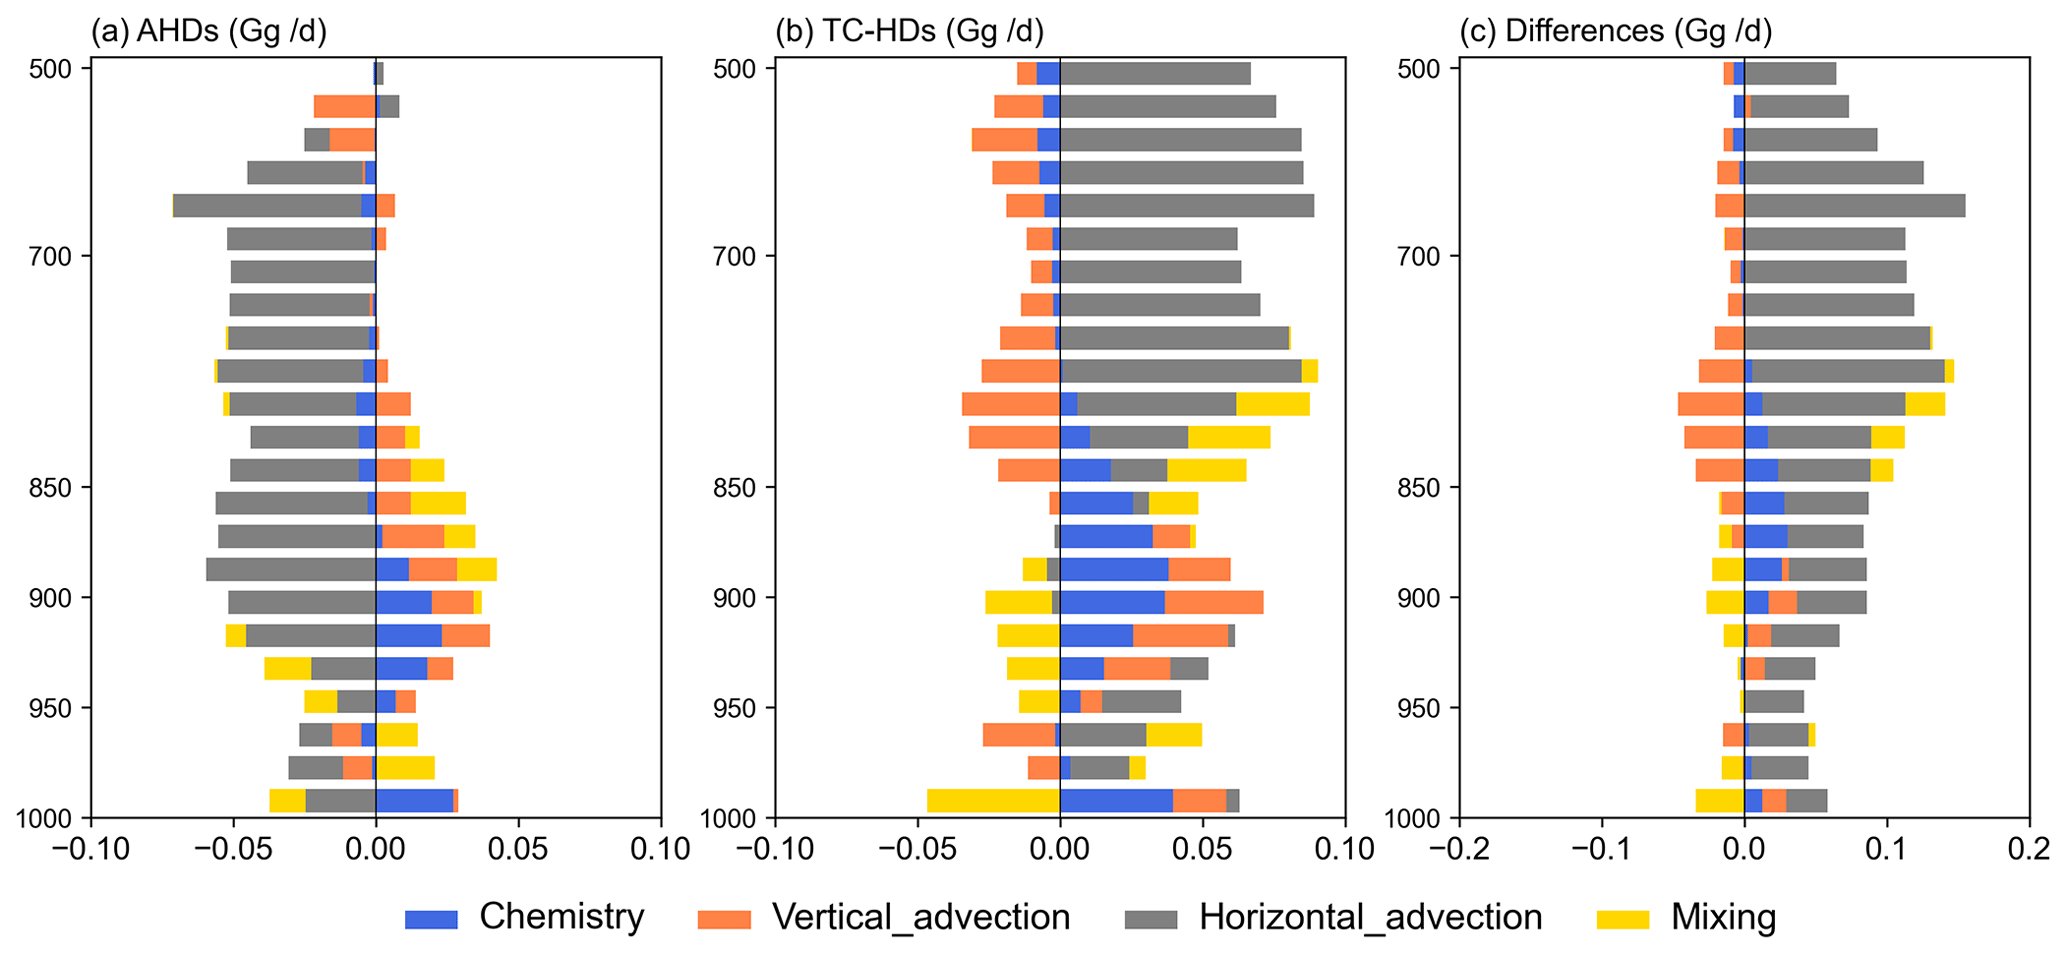
Figure 11Same as Fig. 10 but for the vertical profiles of net changes in ozone mass (Gg O3 d−1) anomalies averaged for the PRD for each process.
Table 2Contributions of difference processes for the anomalous ozone mass (Gg O3 d−1) from the surface to 500 hPa for TC–HDs and AHDs relative to the summer climatology, as well as their difference (TC–HDs minus AHDs), for the YRD.
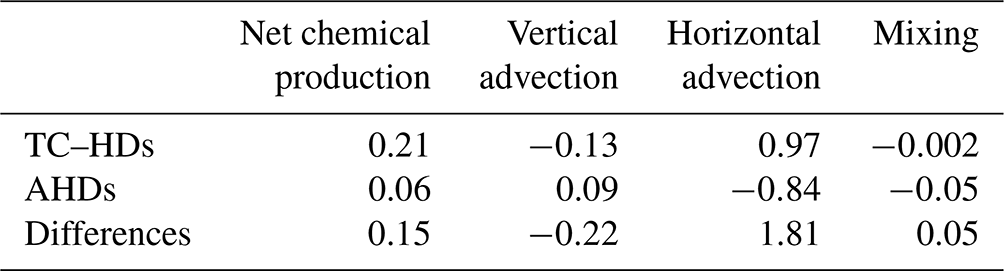
For the PRD, the horizontal transport primarily contributes to decreased ozone concentrations in the PRD between the surface and 500 hPa during AHDs. The chemical production, vertical transport, and mixing processes exhibit promoting effects on ozone concentrations from surface to 700 hPa (Fig. 11a). During TC–HDs, horizontal transport predominantly contributes to increased ozone concentrations over the PRD from the surface to 900 hPa and between 850 and 500 hPa, and the chemical production increases ozone concentrations between 950 and 800 hPa. In contrast, the mixing process and vertical transport play a dominant role in reducing ozone concentrations between the surface to 900 hPa and between 900 to 500 hPa, respectively (Fig. 11b). When compared to AHDs, during TC–HDs, transport processes predominantly contribute to the increases in ozone concentrations in the PRD from the surface up to 500 hPa. Additionally, between 900 and 800 hPa, chemical production plays a positive role in enhancing ozone concentrations. As listed in Table 3, during TC–HDs, when compared to AHDs, the horizontal transport process in the PRD exhibits a significantly stronger enhancing effect on ozone concentrations from surface to 500 hPa (1.81 Gg O3 d−1) when compared to the other three processes. Note that the summer climatology of ozone concentrations in the YRD is significantly higher than that in PRD (Fig. S5), and the cross section of wind anomalies demonstrates that strong winds from YRD to PRD exist during TC–HDs (Fig. S6), implying strong ozone mass transport from YRD to PRD. Thus, the cross-regional transport may play a significant role in worsening ozone pollution over the PRD during TC–HDs relative to AHDs.
Table 3Contributions of difference processes for the anomalous ozone mass (Gg O3 d−1) from the surface to 500 hPa for TC–HDs and AHDs relative to the summer climatology, as well as their difference (TC–HDs minus AHDs), for the PRD.
In summary, favorable synoptic patterns during extremely hot days promote the chemical production of ozone and thus exacerbate ozone pollution over both the YRD and PRD. Compared to AHDs, the anomalously meteorological conditions during TC–HDs enhance the chemical production of ozone in the YRD, while the horizontal transport process mitigates ozone pollution there but worsens ozone pollution in the PRD though cross-regional transport, finally resulting in an increase in ozone in the PRD but a decrease in the YRD.
China has implemented a series of emission reduction strategies to alleviate air pollution, and PM2.5 concentrations have decreased significantly, while ozone pollution remains a major concern. Ozone pollution is sensitive to meteorological conditions, especially the extreme weather conditions that frequently strike China under global warming. Eastern China is economically developed and densely populated, with serious ozone pollution. It is also vulnerable to both extremely hot weather conditions and TCs during the summer, which can substantially affect surface ozone concentrations (Lin et al., 2019; T. Wang et al., 2017). High-ozone levels are generally linked to high air temperatures, which increase BVOC emissions and enhance ozone formation (e.g., Lu et al., 2019; P. Wang et al., 2022). TC activities can modify surface ozone concentrations by affecting the transport and accumulation processes, thus exacerbating pollution in the YRD and PRD (e.g., Shu et al., 2016; Zhan et al., 2020). The SECC region experiences both frequent TCs and heat wave events under global warming (W. Wang et al., 2016; Xiao et al., 2011), which has proven to have an intrinsic concurrent relationship (Matthews et al., 2019; P. Wang et al., 2023). However, the impacts of the compound extremes of hot extremes and TCs on ozone pollution over the SECC have received limited attention.
In this work, we systematically investigate the impacts of extremely hot weather conditions on surface ozone for the summers of 2014–2019 over the SECC coupled with (TC–HDs) and without TCs (AHDs). The associated synoptic conditions and physicochemical processes are assessed combined reanalysis dataset with the GEOS-Chem simulations.
Results show that the surface ozone concentrations over most land regions within the SECC are elevated during both TC–HDs and AHDs relative to the climatological mean; however, there are considerable differences between the changes in ozone concentrations during TC–HDs and AHDs. Relative to AHDs, the surface ozone concentrations are noticeably decreased in the YRD region but increased in the PRD region during TC–HD periods. The meteorological conditions suggest that though the YRD is influenced by higher temperature, lower humidity, and stronger radiation during TC–HDs compared to AHDs, it is influenced by strong sea breezes, which aid in ozone elimination. In contrast, the PRD is influenced by the strong northeasterly winds, in opposition to the climatology, and may transport ozone pollution from polluted regions. Such a hypothesis is validated with the GEOS-Chem simulation. Compared with AHDs, among all the physicochemical processes, horizontal transport plays a crucial role in increasing (reducing) ozone levels over the PRD (YRD). Compared to AHDs, the horizontal transport contributes to −1.15 and 1.8 Gg O3 d−1 to the net changes in tropospheric ozone mass from the surface to 500 hPa in the YRD and PRD during TC–HDs. The findings will provide significant implications for the control measures of ozone pollution in the PRD and YRD during hot extremes in order to consider the significant impacts of TC activities.
Note that throughout the lifetime of tropical cyclones, their positions exert varying influences on air temperatures and surface ozone concentrations over the land regions. Extremely high temperatures are typically observed before TCs make landfalls, and they are driven by descending motions and intensified solar radiation (Wang et al., 2023). However, the high temperatures rapidly decline once TCs make landfalls, primarily due to the accompanying strong winds and precipitation (Gori et al., 2022; Zhang et al., 2024). Similarly, surface ozone concentrations over the YRD and PRD regions tend to be elevated when TCs are at a great distance from the land regions, but they fall dramatically when TCs make landfalls (Fig. 5), consistent with previous findings (e.g., Zhan et al., 2020).
Extremely hot weather conditions are projected to be more frequent and intensified in the future under the continued global warming (P. Wang et al., 2019a). Moreover, it is projected that TCs and heat wave compound events are projected to significantly increase in their intensity and frequency over the Northwest Pacific, causing potentially enlarged population exposures for the southeastern coast of China (Wu et al., 2022). Therefore, the potential impacts of extremely hot weather and the TC–HDs on surface ozone over China warrant future efforts. BVOCs are important precursors of ozone, and their emissions are greatly influenced by weather conditions. As revealed by N. Wang et al. (2022), the TCs over Northwest Pacific could intensify the chemical interactions between anthropogenic and biogenic emissions, resulting in extreme ozone pollution over the YRD and PRD regions. The responses of biogenic emissions during hot extremes accompanied by TCs deserve further investigation.
The ground level ozone concentrations are obtained from the high-resolution and high-quality ground level daily maximum 8 h average ozone (MDA8 O3) data for the China (ChinaHighO3) dataset and is open-access and freely available at https://doi.org/10.5281/zenodo.13342827 (Wei and Li, 2024). The daily maximum air temperature data is provided by the National Meteorological Information Centre of the China Meteorological Administration (CMA, 2022, https://data.cma.cn/en/?r=data/detail&dataCode=A.0012.0001). The CMA provides the tropical cyclone best track dataset, which can be accessed at https://tcdata.typhoon.org.cn/zjljsjj.html (Ying et al., 2014; Lu et al., 2021). The ERA5 reanalysis is available at https://doi.org/10.24381/cds.bd0915c6 (Hersbach et al., 2023). The GEOS-Chem model is available at https://doi.org/10.5281/zenodo.6564702 (The International GEOS-Chem User Community 2022).
The supplement related to this article is available online at: https://doi.org/10.5194/acp-24-11775-2024-supplement.
CQ performed the analyses and wrote the initial draft. PW and YY conceived and supervised the study. HuL performed the GEOS-Chem simulations. PW reviewed and edited the initial draft. All the authors discussed the results and contributed to the final version of the paper.
The contact author has declared that none of the authors has any competing interests.
Publisher's note: Copernicus Publications remains neutral with regard to jurisdictional claims made in the text, published maps, institutional affiliations, or any other geographical representation in this paper. While Copernicus Publications makes every effort to include appropriate place names, the final responsibility lies with the authors.
The authors acknowledge the support by the National Natural Science Foundation of China (grant nos. 42293323 and 42105166), the Natural Science Foundation of Jiangsu Province (grant no. BK20241902), and the Jiangsu Science Fund for Carbon Neutrality (grant no. BK20220031). The authors would like to thank the editor and reviewers for their constructive comments.
This research has been supported by the National Natural Science Foundation of China (grant nos. 42293323 and 42105166), by the Natural Science Foundation of Jiangsu Province (grant no. BK20241902), and by the Jiangsu Science Fund for Carbon Neutrality (grant no. BK20220031).
This paper was edited by Jayanarayanan Kuttippurath and reviewed by three anonymous referees.
Ainsworth, E. A., Yendrek, C. R., Sitch, S., Collins, W. J., and Emberson, L. D.: The Effects of Tropospheric Ozone on Net Primary Productivity and Implications for Climate Change, Annu. Rev. Plant Biol., 63, 637–661, https://doi.org/10.1146/annurev-arplant-042110-103829, 2012.
Ashmore, M. R.: Assessing the future global impacts of ozone on vegetation, Plant Cell Environ., 28, 949–964, https://doi.org/10.1111/j.1365-3040.2005.01341.x, 2005.
Banta, R. M., Senff, C. J., Alvarez, R. J., Langford, A. O., Parrish, D. D., Trainer, M. K., Darby, L. S., Hardesty, R. M., Lambeth, B., and Neuman, J. A.: Dependence of daily peak O3 concentrations near Houston, Texas on environmental factors: Wind speed, temperature, and boundary-layer depth, Atmos. Environ., 45, 162–173, https://doi.org/10.1016/j.atmosenv.2010.09.030, 2011.
Chen, L., Liao, H., Zhu, J., Li, K., Bai, Y., Yue, X., Yang, Y., Hu, J., and Zhang, M.: Increases in ozone-related mortality in China over 2013–2030 attributed to historical ozone deterioration and future population aging, Sci. Total Environ., 858, 159972, https://doi.org/10.1016/j.scitotenv.2022.159972, 2023.
China Meteorological Administration (CMA): Daily Timed Data from automated weather stations in China, https://data.cma.cn/en/?r=data/detail&dataCode=A.0012.0001, last access: 22 May 2022.
Dai, H., Huang, G., Wang, J., and Zeng, H.: VAR-tree model based spatio-temporal characterization and prediction of O3 concentration in China, Ecotox. Environ. Safe., 257, 114960, https://doi.org/10.1016/j.ecoenv.2023.114960, 2023.
Ding, H., Kong, L., You, Y., Mao, J., Chen, W., Chen, D., Chang, M., and Wang, X.: Effects of tropical cyclones with different tracks on ozone pollution over the Pearl River Delta region, Atmos. Res., 286, 106680, https://doi.org/10.1016/j.atmosres.2023.106680, 2023.
Feng, Z., Hu, E., Wang, X., Jiang, L., and Liu, X.: Ground-level O3 pollution and its impacts on food crops in China: A review, Environ. Pollut., 199, 42–48, https://doi.org/10.1016/j.envpol.2015.01.016, 2015.
Fu, Y. and Liao, H.: Impacts of land use and land cover changes on biogenic emissions of volatile organic compounds in China from the late 1980s to the mid-2000s: implications for tropospheric ozone and secondary organic aerosol, Tellus B, 66, 24987, https://doi.org/10.3402/tellusb.v66.24987, 2014.
Fu, Y., Liao, H., and Yang, Y.: Interannual and Decadal Changes in Tropospheric Ozone in China and the Associated Chemistry-Climate Interactions: A Review, Adv. Atmos. Sci., 36, 975–993, https://doi.org/10.1007/s00376-019-8216-9, 2019.
Gelaro, R., McCarty, W., Suárez, M. J., Todling, R., Molod, A., Takacs, L., Randles, C. A., Darmenov, A., Bosilovich, M. G., Reichle, R., Wargan, K., Coy, L., Cullather, R., Draper, C., Akella, S., Buchard, V., Conaty, A., Da Silva, A. M., Gu W., Kim, G., Koster, R., Lucchesi, R., Merkova, D., Nielsen, J., Partyka, G., Pawson, S., Putman, W., Rienecker, M., Schubert, S. D., Sienkiewicz, M., and Zhao, B.: The Modern-Era Retrospective Analysis for Research and Applications, Version 2 (MERRA-2), J. Climate, 30, 5419–5454, https://doi.org/10.1175/JCLI-D-16-0758.1, 2017.
Gong, C. and Liao, H.: A typical weather pattern for ozone pollution events in North China, Atmos. Chem. Phys., 19, 13725–13740, https://doi.org/10.5194/acp-19-13725-2019, 2019.
Gori, A., Lin, N., Xi, D., and Emanuel, K.: Tropical cyclone climatology change greatly exacerbates US extreme rainfall–surge hazard, Nat. Clim. Change, 12, 171–178, https://doi.org/10.1038/s41558-021-01272-7, 2022.
Gu, X., Wang, T., and Li, C.: Elevated ozone decreases the multifunctionality of belowground ecosystems, Glob. Change Biol., 29, 890–908, https://doi.org/10.1111/gcb.16507, 2023.
Guenther, A. B., Jiang, X., Heald, C. L., Sakulyanontvittaya, T., Duhl, T., Emmons, L. K., and Wang, X.: The Model of Emissions of Gases and Aerosols from Nature version 2.1 (MEGAN2.1): an extended and updated framework for modeling biogenic emissions, Geosci. Model Dev., 5, 1471–1492, https://doi.org/10.5194/gmd-5-1471-2012, 2012.
Han, W., Wang, Y., and Liu, L.: The relationship between pre-landfall intensity change and post-landfall weakening of tropical cyclones over China, Front. Earth Sci., 10, 1082181, https://doi.org/10.3389/feart.2022.1082181, 2022.
Hersbach, H., Bell, B., Berrisford, P., Hirahara, S., Horányi, A., Muñoz-Sabater, J., Nicolas, J., Peubey, C., Radu, R., Schepers, D., Simmons, A., Soci, C., Abdalla, S., Abellan, X., Balsamo, G., Bechtold, P., Biavati, G., Bidlot, J., Bonavita, M., De Chiara, G., Dahlgren, P., Dee, D., Diamantakis, M., Dragani, R., Flemming, J., Forbes, R., Fuentes, M., Geer, A., Haimberger, L., Healy, S., Hogan, R. J., Hólm, E., Janisková, M., Keeley, S., Laloyaux, P., Lopez, P., Lupu, C., Radnoti, G., de Rosnay, P., Rozum, I., Vamborg, F., Villaume, S., and Thépaut, J.-N.: The ERA5 global reanalysis, Q. J. Roy. Meteor. Soc., 146, 1999–2049, https://doi.org/10.1002/qj.3803, 2020.
Hersbach, H., Bell, B., Berrisford, P., Biavati, G., Horányi, A., Muñoz Sabater, J., Nicolas, J., Peubey, C., Radu, R., Rozum, I., Schepers, D., Simmons, A., Soci, C., Dee, D., and Thépaut, J.-N.: ERA5 hourly data on pressure levels from 1940 to present, Copernicus Climate Change Service (C3S) Climate Data Store (CDS) [data set], https://doi.org/10.24381/cds.bd0915c6, 2023.
Hoesly, R. M., Smith, S. J., Feng, L., Klimont, Z., Janssens-Maenhout, G., Pitkanen, T., Seibert, J. J., Vu, L., Andres, R. J., Bolt, R. M., Bond, T. C., Dawidowski, L., Kholod, N., Kurokawa, J.-I., Li, M., Liu, L., Lu, Z., Moura, M. C. P., O'Rourke, P. R., and Zhang, Q.: Historical (1750–2014) anthropogenic emissions of reactive gases and aerosols from the Community Emissions Data System (CEDS), Geosci. Model Dev., 11, 369–408, https://doi.org/10.5194/gmd-11-369-2018, 2018.
Huang, C., Chen, C. H., Li, L., Cheng, Z., Wang, H. L., Huang, H. Y., Streets, D. G., Wang, Y. J., Zhang, G. F., and Chen, Y. R.: Emission inventory of anthropogenic air pollutants and VOC species in the Yangtze River Delta region, China, Atmos. Chem. Phys., 11, 4105–4120, https://doi.org/10.5194/acp-11-4105-2011, 2011.
Huang, J., Pan, X., Guo, X., and Li, G.: Health impact of China's Air Pollution Prevention and Control Action Plan: an analysis of national air quality monitoring and mortality data, Lancet Planet. Health, 2, e313–e323, https://doi.org/10.1016/S2542-5196(18)30141-4, 2018.
Jacob, D. J., Logan, J. A., and Murti, P. P.: Effect of rising Asian emissions on surface ozone in the United States, Geophys. Res. Lett., 26, 2175–2178, https://doi.org/10.1029/1999GL900450, 1999.
Jammalamadaka, S. R. and Lund, U. J.: The effect of wind direction on ozone levels: a case study, Environ. Ecol. Stat., 13, 287–298, https://doi.org/10.1007/s10651-004-0012-7, 2006.
Ji, X., Chen, G., Chen, J., Xu, L., Lin, Z., Zhang, K., Fan, X., Li, M., Zhang, F., Wang, H., Huang, Z., and Hong, Y.: Meteorological impacts on the unexpected ozone pollution in coastal cities of China during the unprecedented hot summer of 2022, Sci. Total Environ., 914, 170035, https://doi.org/10.1016/j.scitotenv.2024.170035, 2024.
Jiang, Z., Li, J., Lu, X., Gong, C., Zhang, L., and Liao, H.: Impact of western Pacific subtropical high on ozone pollution over eastern China, Atmos. Chem. Phys., 21, 2601–2613, https://doi.org/10.5194/acp-21-2601-2021, 2021.
Kavassalis, S. C. and Murphy, J. G.: Understanding ozone-meteorology correlations: A role for dry deposition, Geophys. Res. Lett., 44, 2922–2931, https://doi.org/10.1002/2016GL071791, 2017.
Li, K., Jacob, D. J., Liao, H., Shen, L., Zhang, Q., and Bates, K. H.: Anthropogenic drivers of 2013–2017 trends in summer surface ozone in China, P. Natl. Acad. Sci. USA, 116, 422–427, https://doi.org/10.1073/pnas.1812168116, 2019.
Li, M., Yu, S., Chen, X., Li, Z., Zhang, Y., Wang, L., Liu, W., Li, P., Lichtfouse, E., Rosenfeld, D., and Seinfeld, J. H.: Large scale control of surface ozone by relative humidity observed during warm seasons in China, Environ. Chem. Lett., 19, 3981–3989, https://doi.org/10.1007/s10311-021-01265-0, 2021.
Lin, X., Yuan, Z., Yang, L., Luo, H., and Li, W.: Impact of Extreme Meteorological Events on Ozone in the Pearl River Delta, China, Aerosol Air Qual. Res., 19, 1307–1324, https://doi.org/10.4209/aaqr.2019.01.0027, 2019.
Liu, H., Liu, S., Xue, B., Lv, Z., Meng, Z., Yang, X., Xue, T., Yu, Q., and He, K.: Ground-level ozone pollution and its health impacts in China, Atmos. Environ., 173, 223–230, https://doi.org/10.1016/j.atmosenv.2017.11.014, 2018.
Lu, X., Zhang, L., Chen, Y., Zhou, M., Zheng, B., Li, K., Liu, Y., Lin, J., Fu, T.-M., and Zhang, Q.: Exploring 2016–2017 surface ozone pollution over China: source contributions and meteorological influences, Atmos. Chem. Phys., 19, 8339–8361, https://doi.org/10.5194/acp-19-8339-2019, 2019.
Lu, X., Yu, H., Ying, M., Zhao, B., Zhang, S., Lin, L., Bai, L., and Wan, R.: Western North Pacific Tropical Cyclone Database Created by the China Meteorological Administration, Adv. Atmos. Sci., 38, 690–699, https://doi.org/10.1007/s00376-020-0211-7, 2021 (data available at: https://tcdata.typhoon.org.cn/zjljsjj.html).
Luo, M. and Lau, N.-C.: Heat Waves in Southern China: Synoptic Behavior, Long-Term Change, and Urbanization Effects, J. Climate, 30, 703–720, https://doi.org/10.1175/JCLI-D-16-0269.1, 2017.
Ma, M., Gao, Y., Wang, Y., Zhang, S., Leung, L. R., Liu, C., Wang, S., Zhao, B., Chang, X., Su, H., Zhang, T., Sheng, L., Yao, X., and Gao, H.: Substantial ozone enhancement over the North China Plain from increased biogenic emissions due to heat waves and land cover in summer 2017, Atmos. Chem. Phys., 19, 12195–12207, https://doi.org/10.5194/acp-19-12195-2019, 2019.
Matthews, T., Wilby, R. L., and Murphy, C.: An emerging tropical cyclone–deadly heat compound hazard, Nat. Clim. Change, 9, 602–606, https://doi.org/10.1038/s41558-019-0525-6, 2019.
Meng, K., Zhao, T., Xu, X., Hu, Y., Zhao, Y., Zhang, L., Pang, Y., Ma, X., Bai, Y., Zhao, Y., and Zhen, S.: Anomalous surface O3 changes in North China Plain during the northwestward movement of a landing typhoon, Sci. Total Environ., 820, 153196, https://doi.org/10.1016/j.scitotenv.2022.153196, 2022.
Meng, X., Wang, W., Shi, S., Zhu, S., Wang, P., Chen, R., Xiao, Q., Xue, T., Geng, G., Zhang, Q., Kan, H., and Zhang, H.: Evaluating the spatiotemporal ozone characteristics with high-resolution predictions in mainland China, 2013–2019, Environ. Pollut., 299, 118865, https://doi.org/10.1016/j.envpol.2022.118865, 2022.
Ni, Y., Yang, Y., Wang, H., Li, H., Li, M., and Wang, P.: Contrasting changes in ozone during 2019–2021 between eastern China and the other regions of China, Sci. Total Environ., 908, 168272, https://doi.org/10.2139/ssrn.4563723, 2024.
Ouyang, S., Deng, T., Liu, R., Chen, J., He, G., Leung, J. C.-H., Wang, N., and Liu, S. C.: Impact of a subtropical high and a typhoon on a severe ozone pollution episode in the Pearl River Delta, China, Atmos. Chem. Phys., 22, 10751–10767, https://doi.org/10.5194/acp-22-10751-2022, 2022.
Pye, H. O. T., Liao, H., Wu, S., Mickley, L. J., Jacob, D. J., Henze, D. K., and Seinfeld, J. H.: Effect of changes in climate and emissions on future sulfate-nitrate-ammonium aerosol levels in the United States, J. Geophys. Res.-Atmos., 114, 2008JD010701, https://doi.org/10.1029/2008JD010701, 2009.
Qu, K., Wang, X., Yan, Y., Shen, J., Xiao, T., Dong, H., Zeng, L., and Zhang, Y.: A comparative study to reveal the influence of typhoons on the transport, production and accumulation of O3 in the Pearl River Delta, China, Atmos. Chem. Phys., 21, 11593–11612, https://doi.org/10.5194/acp-21-11593-2021, 2021.
Sherwen, T., Schmidt, J. A., Evans, M. J., Carpenter, L. J., Großmann, K., Eastham, S. D., Jacob, D. J., Dix, B., Koenig, T. K., Sinreich, R., Ortega, I., Volkamer, R., Saiz-Lopez, A., Prados-Roman, C., Mahajan, A. S., and Ordóñez, C.: Global impacts of tropospheric halogens (Cl, Br, I) on oxidants and composition in GEOS-Chem, Atmos. Chem. Phys., 16, 12239–12271, https://doi.org/10.5194/acp-16-12239-2016, 2016.
Shu, L., Xie, M., Wang, T., Gao, D., Chen, P., Han, Y., Li, S., Zhuang, B., and Li, M.: Integrated studies of a regional ozone pollution synthetically affected by subtropical high and typhoon system in the Yangtze River Delta region, China, Atmos. Chem. Phys., 16, 15801–15819, https://doi.org/10.5194/acp-16-15801-2016, 2016.
The International GEOS-Chem User Community: geoschem/GCClassic: GEOS-Chem 13.4.1 (13.4.1), Zenodo [data set], https://doi.org/10.5281/zenodo.6564702, 2022.
Tuleya, R. E., Bender, M. A., and Kurihara, Y.: A Simulation Study of the Landfall of Tropical Cyclones, Mon. Weather Rev., 112, 124–136, https://doi.org/10.1175/1520-0493(1984)112<0124:ASSOTL>2.0.CO;2, 1984.
Turner, M. C., Jerrett, M., Pope, C. A., Krewski, D., Gapstur, S. M., Diver, W. R., Beckerman, B. S., Marshall, J. D., Su, J., Crouse, D. L., and Burnett, R. T.: Long-Term Ozone Exposure and Mortality in a Large Prospective Study, Am. J. Resp. Crit. Care, 193, 1134–1142, https://doi.org/10.1164/rccm.201508-1633OC, 2016.
van der Werf, G. R., Randerson, J. T., Giglio, L., van Leeuwen, T. T., Chen, Y., Rogers, B. M., Mu, M., van Marle, M. J. E., Morton, D. C., Collatz, G. J., Yokelson, R. J., and Kasibhatla, P. S.: Global fire emissions estimates during 1997–2016, Earth Syst. Sci. Data, 9, 697–720, https://doi.org/10.5194/essd-9-697-2017, 2017.
Wang, N., Huang, X., Xu, J., Wang, T., Tan, Z., and Ding, A.: Typhoon-boosted biogenic emission aggravates cross-regional ozone pollution in China, Sci. Adv., 8, eabl6166, https://doi.org/10.1126/sciadv.abl6166, 2022.
Wang, P., Tang, J., Wang, S., Dong, X., and Fang, J.: Regional heatwaves in china: a cluster analysis, Clim. Dynam., 50, 1901–1917, https://doi.org/10.1007/s00382-017-3728-4, 2018.
Wang, P., Hui, P., Xue, D., and Tang, J.: Future projection of heat waves over China under global warming within the CORDEX-EA-II project, Clim. Dynam., 53, 957–973, https://doi.org/10.1007/s00382-019-04621-7, 2019a.
Wang, P., Leung, L. R., Lu, J., Song, F., and Tang, J.: Extreme wet-bulb temperatures in China: The significant role of moisture, J. Geophys. Res.-Atmos., 124, 11944–11960, https://doi.org/10.1029/2019JD031477, 2019b.
Wang, P., Yang, Y., Li, H., Chen, L., Dang, R., Xue, D., Li, B., Tang, J., Leung, L. R., and Liao, H.: North China Plain as a hot spot of ozone pollution exacerbated by extreme high temperatures, Atmos. Chem. Phys., 22, 4705–4719, https://doi.org/10.5194/acp-22-4705-2022, 2022.
Wang, P., Yang, Y., Xue, D., Qu, Y., Tang, J., Leung, L. R., and Liao, H.: Increasing Compound Hazards of Tropical Cyclones and Heatwaves over Southeastern Coast of China under Climate Warming, J. Climate, 36, 2243–2257, https://doi.org/10.1175/JCLI-D-22-0279.1, 2023.
Wang, T., Xue, L., Brimblecombe, P., Lam, Y. F., Li, L., and Zhang, L.: Ozone pollution in China: A review of concentrations, meteorological influences, chemical precursors, and effects, Sci. Total Environ., 575, 1582–1596, https://doi.org/10.1016/j.scitotenv.2016.10.081, 2017.
Wang, T., Zhong, Z., Sun, Y., and Wang, J.: Impacts of tropical cyclones on the meridional movement of the western Pacific subtropical high, Atmos. Sci. Lett., 20, e893, https://doi.org/10.1002/asl.893, 2019.
Wang, W., Zhou, W., Li, X., Wang, X., and Wang, D.: Synoptic-scale characteristics and atmospheric controls of summer heat waves in China, Clim. Dynam., 46, 2923–2941, https://doi.org/10.1007/s00382-015-2741-8, 2016.
Wang, X., Chen, F., Wu, Z., Zhang, M., Tewari, M., Guenther, A., and Wiedinmyer, C.: Impacts of weather conditions modified by urban expansion on surface ozone: Comparison between the Pearl River Delta and Yangtze River Delta regions, Adv. Atmos. Sci., 26, 962–972, https://doi.org/10.1007/s00376-009-8001-2, 2009.
Wang, Z., Hu, B., Zhang, C., Atkinson, P. M., Wang, Z., Xu, K., Chang, J., Fang, X., Jiang, Y., and Shi, Z.: How the Air Clean Plan and carbon mitigation measures co-benefited China in PM2.5 reduction and health from 2014 to 2020, Environ. Int., 169, 107510, https://doi.org/10.1016/j.envint.2022.107510, 2022.
Wei, J. and Li, Z.: ChinaHighO3: Big Data Seamless 1 km Ground-level MDA8 O3 Dataset for China (2000–Present) (2 (2000–2023)), Zenodo [data set], https://doi.org/10.5281/zenodo.13342827, 2024.
Wei, J., Li, Z., Li, K., Dickerson, R. R., Pinker, R. T., Wang, J., Liu, X., Sun, L., Xue, W., and Cribb, M.: Full-coverage mapping and spatiotemporal variations of ground-level ozone (O3) pollution from 2013 to 2020 across China, Remote Sens. Environ., 270, 112775, https://doi.org/10.1016/j.rse.2021.112775, 2022.
Wei, X., Lam, K. S., Cao, C., Li, H., and He, J.: Dynamics of the Typhoon Haitang Related High Ozone Episode over Hong Kong, Adv. Atmos. Sci., 2016, 6089154, https://doi.org/10.1155/2016/6089154, 2016.
Wu, J., Chen, Y., Liao, Z., Gao, X., Zhai, P., and Hu, Y.: Increasing risk from landfalling tropical cyclone-heatwave compound events to coastal and inland China, Environ. Res. Lett., 17, 105007, https://doi.org/10.1088/1748-9326/ac9747, 2022.
Xiao, Y. F., Duan, Z. D., Xiao, Y. Q., Ou, J. P., Chang, L., and Li, Q. S.: Typhoon wind hazard analysis for southeast China coastal regions, Struct. Saf., 33, 286–295, https://doi.org/10.1016/j.strusafe.2011.04.003, 2011.
Yang, Y., Liao, H., and Li, J.: Impacts of the East Asian summer monsoon on interannual variations of summertime surface-layer ozone concentrations over China, Atmos. Chem. Phys., 14, 6867–6879, https://doi.org/10.5194/acp-14-6867-2014, 2014.
Yang, Y., Li, M., Wang, H., Li, H., Wang, P., Li, K., Gao, M., and Liao, H.: ENSO modulation of summertime tropospheric ozone over China, Environ. Res. Lett., 17, 034020, https://doi.org/10.1088/1748-9326/ac54cd, 2022.
Yin, Z., Cao, B., and Wang, H.: Dominant patterns of summer ozone pollution in eastern China and associated atmospheric circulations, Atmos. Chem. Phys., 19, 13933–13943, https://doi.org/10.5194/acp-19-13933-2019, 2019.
Ying, M., Zhang, W., Yu, H., Lu, X., Feng, J., Fan, Y., Zhu, Y., and Chen, D.: An Overview of the China Meteorological Administration Tropical Cyclone Database, J. Atmos. Ocean. Tech., 31, 287–301, https://doi.org/10.1175/JTECH-D-12-00119.1, 2014 (data available at: https://tcdata.typhoon.org.cn/zjljsjj.html).
Zhan, C. and Xie, M.: Exploring the link between ozone pollution and stratospheric intrusion under the influence of tropical cyclone Ampil, Sci. Total Environ., 828, 154261, https://doi.org/10.1016/j.scitotenv.2022.154261, 2022.
Zhan, C., Xie, M., Huang, C., Liu, J., Wang, T., Xu, M., Ma, C., Yu, J., Jiao, Y., Li, M., Li, S., Zhuang, B., Zhao, M., and Nie, D.: Ozone affected by a succession of four landfall typhoons in the Yangtze River Delta, China: major processes and health impacts, Atmos. Chem. Phys., 20, 13781–13799, https://doi.org/10.5194/acp-20-13781-2020, 2020.
Zhang, J., Gao, Y., Luo, K., Leung, L. R., Zhang, Y., Wang, K., and Fan, J.: Impacts of compound extreme weather events on ozone in the present and future, Atmos. Chem. Phys., 18, 9861–9877, https://doi.org/10.5194/acp-18-9861-2018, 2018.
Zhang, M., Yang, Y., Zhan, C., Zong, L., Gul, C., and Wang, M.: Tropical cyclone-related heatwave episodes in the Greater Bay Area, China: Synoptic patterns and urban-rural disparities, Weather and Climate Extremes, 44, 100656, https://doi.org/10.1016/j.wace.2024.100656, 2024.
Zhang, Y., Dai, J., Li, Q., Chen, T., Mu, J., Brasseur, G., Wang, T., and Xue, L.: Biogenic volatile organic compounds enhance ozone production and complicate control efforts: Insights from long-term observations in Hong Kong, Atmos. Environ., 309, 119917, https://doi.org/10.1016/j.atmosenv.2023.119917, 2023.
Zhou, Y., Yang, Y., Wang, H., Wang, J., Li, M., Li, H., Wang, P., Zhu, J., Li, K., and Liao, H.: Summer ozone pollution in China affected by the intensity of Asian monsoon systems, Sci. Total Environ., 849, 157785, https://doi.org/10.1016/j.scitotenv.2022.157785, 2022.
- Abstract
- Introduction
- Data and methods
- Spatial and temporal variations in compound TC–HDs
- Influences of TC–HDs on surface ozone concentrations in the SECC
- Possible mechanisms underlying the impacts of TC–HDs on surface ozone
- Conclusion and discussions
- Data availability
- Author contributions
- Competing interests
- Disclaimer
- Acknowledgements
- Financial support
- Review statement
- References
- Supplement