the Creative Commons Attribution 4.0 License.
the Creative Commons Attribution 4.0 License.
 | 26 Jan 2024
Meteorological characteristics of extreme ozone pollution events in China and their future predictions
Yang Zhou
Hailong Wang
Mengyun Li
Huimin Li
Pinya Wang
Hong Liao
Ozone (O3) has become one of the most concerning air pollutants in China in recent decades. In this study, based on surface observations, reanalysis data, global atmospheric chemistry model simulations, and multi-model future predictions, meteorological characteristics conducive to extreme O3 pollution in various regions of China are investigated, and their historical changes and future trends are analyzed. During the most severe O3 polluted months, the chemical production of O3 is enhanced under the hot and dry conditions over the North China Plain (NCP) in June 2018 and the Yangtze River Delta (YRD) in July 2017, while regional transport is the main reason for the severe O3 pollution over the Sichuan Basin (SCB) in July 2015 and the Pearl River Delta (PRD) in September 2019. Over the last 4 decades, the frequencies of high-temperature and low-relative-humidity conditions increased in 2000–2019 relative to 1980–1999, indicating that O3 pollution in both the NCP and YRD has become more frequent under historical climate change. In the SCB and PRD, the occurrence of atmospheric circulation patterns similar to those during the most polluted months increased, together with the more frequent hot and dry conditions, contributing to the increases in severe O3 pollution in the SCB and PRD during 1980–2019. In the future (by 2100), the frequencies of months with anomalous high temperature show stronger increasing trends in the high-forcing scenario (Shared Socioeconomic Pathway (SSP5-8.5)) compared to the sustainable scenario (SSP1-2.6) in China. It suggests that high anthropogenic forcing will not only lead to slow economic growth and climate warming but also likely result in environmental pollution issues.
- Article
(10655 KB) - Full-text XML
- BibTeX
- EndNote


Tropospheric ozone (O3), one major air pollutant, is formed in photochemical reactions of nitrogen oxides (NOx) and volatile organic compounds (VOCs) when exposed to sunlight (Finlayson-Pitts and Pitts, 1997; Sillman, 1999). Enhanced O3 pollution harms ecosystems and human health (Fleming et al., 2018; Maji et al., 2019) by reducing crop yields (Ainsworth et al., 2012; Mills et al., 2018) and aggravating cardiopulmonary disease (Ebi and McGregor, 2008; Liu et al., 2018). In recent years, near-surface ozone concentrations in many regions of China have been increasing considerably (Verstraeten et al., 2015; Cheng et al., 2019; Zhang et al., 2020; Li et al., 2019; Lu et al., 2018; Silver et al., 2018; Yin et al., 2019; Lu et al., 2020). Lu et al. (2020) revealed that the daily maximum of 8 h average O3 concentration (MDA8-O3) in China increased by 2.4 ppb yr−1 (5.0 % relative to the average) during April–September over 2013–2019.
In addition to emissions, O3 concentrations are influenced by meteorological factors such as temperature, relative humidity, solar radiation, and winds (Mott et al., 2005; Fu and Tian, 2019; Gong and Liao, 2019; Li et al., 2019, 2020; Le et al., 2020; Zhao et al., 2020). Typically, strong solar radiation, high surface air temperatures, and low relative humidity are conducive to photochemical production of O3, causing an increase in O3 concentration (Peterson and Flowers, 1977; Xu et al., 2011; Coates et al., 2016; Li et al., 2020; Dang et al., 2021). Wind speed is negatively correlated with surface O3 because low wind speed facilitates the accumulation of O3 upon production (Zhang et al., 2015; Wang et al., 2017; Liu and Wang, 2020). Han et al. (2020) explored the impacts of various meteorological factors on the daily variation of summer surface O3 in eastern China based on a multiple linear regression method and suggested that relative humidity is the primary factor affecting O3 concentration in central and south parts of eastern China, while temperature is the most important factor governing O3 concentration in north of eastern China. Gong and Liao (2019) reported that the meteorological characteristics of O3 pollution events in northern China during 2014–2017 were high daily maximum temperature, low relative humidity, abnormal southerly winds, and high pressure at 500 hPa. These findings emphasize that meteorological factors play a crucial role in regulating O3 pollution in China.
Atmospheric circulation patterns affect O3 concentrations over China through changing meteorological factors (Yang et al., 2014, 2022; Zhao and Wang, 2017; Shu et al., 2019; Dong et al., 2020; Zhou et al., 2022). Zhao and Wang (2017) examined the influence of the western Pacific subtropical high (WPSH) on O3 over eastern China based on observations and reanalysis data from 2014–2016. They found that stronger WPSH enhanced the moisture transport to southern China, which was detrimental to the photochemical reaction of O3, leading to a decrease in surface O3 concentration in southern China, whereas O3 concentrations in northern China increased under the stronger WPSH related to the dry and hot conditions favoring O3 production. On the basis of observational O3 data and ERA5 reanalysis data during 2014–2018, Dong et al. (2019) analyzed the impact of synoptic patterns on summertime O3 pollution in the North China Plain and revealed that the most severe O3 pollution weather pattern is associated with anomalous southwesterly winds, which carry dry, warm air from inland southern China to the North China Plain and favor the chemical production of O3. Zhou et al. (2022) explored the impacts of Asian summer monsoon on the interannual variation of O3 concentrations based on surface measurements and GEOS-Chem model simulations. They showed that the East Asian summer monsoon strength was positively correlated with O3 concentration in south-central China and that the South Asian summer monsoon has complex effects on O3 pollution in China, mainly through changing transboundary transport related to large-scale circulations.
As mentioned above, many previous studies have examined the meteorological characteristics of O3 pollution in China. However, they focused on O3 pollution over limited regions in China in each study (e.g., the North China Plain, southern China). These studies only examined the meteorological characteristics of O3 pollution in a short time period due to the lack of observational data and did not consider the historical and future trends of these meteorological factors. In this study, the meteorological characteristics conducive to the most severe O3 pollution in several polluted areas of China, including the North China Plain (NCP), Yangtze River Delta (YRD), Sichuan Basin (SCB), and Pearl River Delta (PRD), are respectively investigated based on the observed surface O3 concentrations, reanalysis data, and GEOS-Chem model simulations. In addition, the contributions from various chemical and physical processes inducing regional O3 pollution are quantified using an integrated process rate (IPR) analysis method. The historical changes in these meteorological factors favoring the most severe O3 pollution over 1980–2019 are provided. Moreover, variations in future meteorological patterns during 2021–2100 leading to severe O3 pollution in China are presented under the sustainable and high-forcing scenarios according to the multi-model data from the Coupled Model Intercomparison Project Phase 6 (CMIP6).
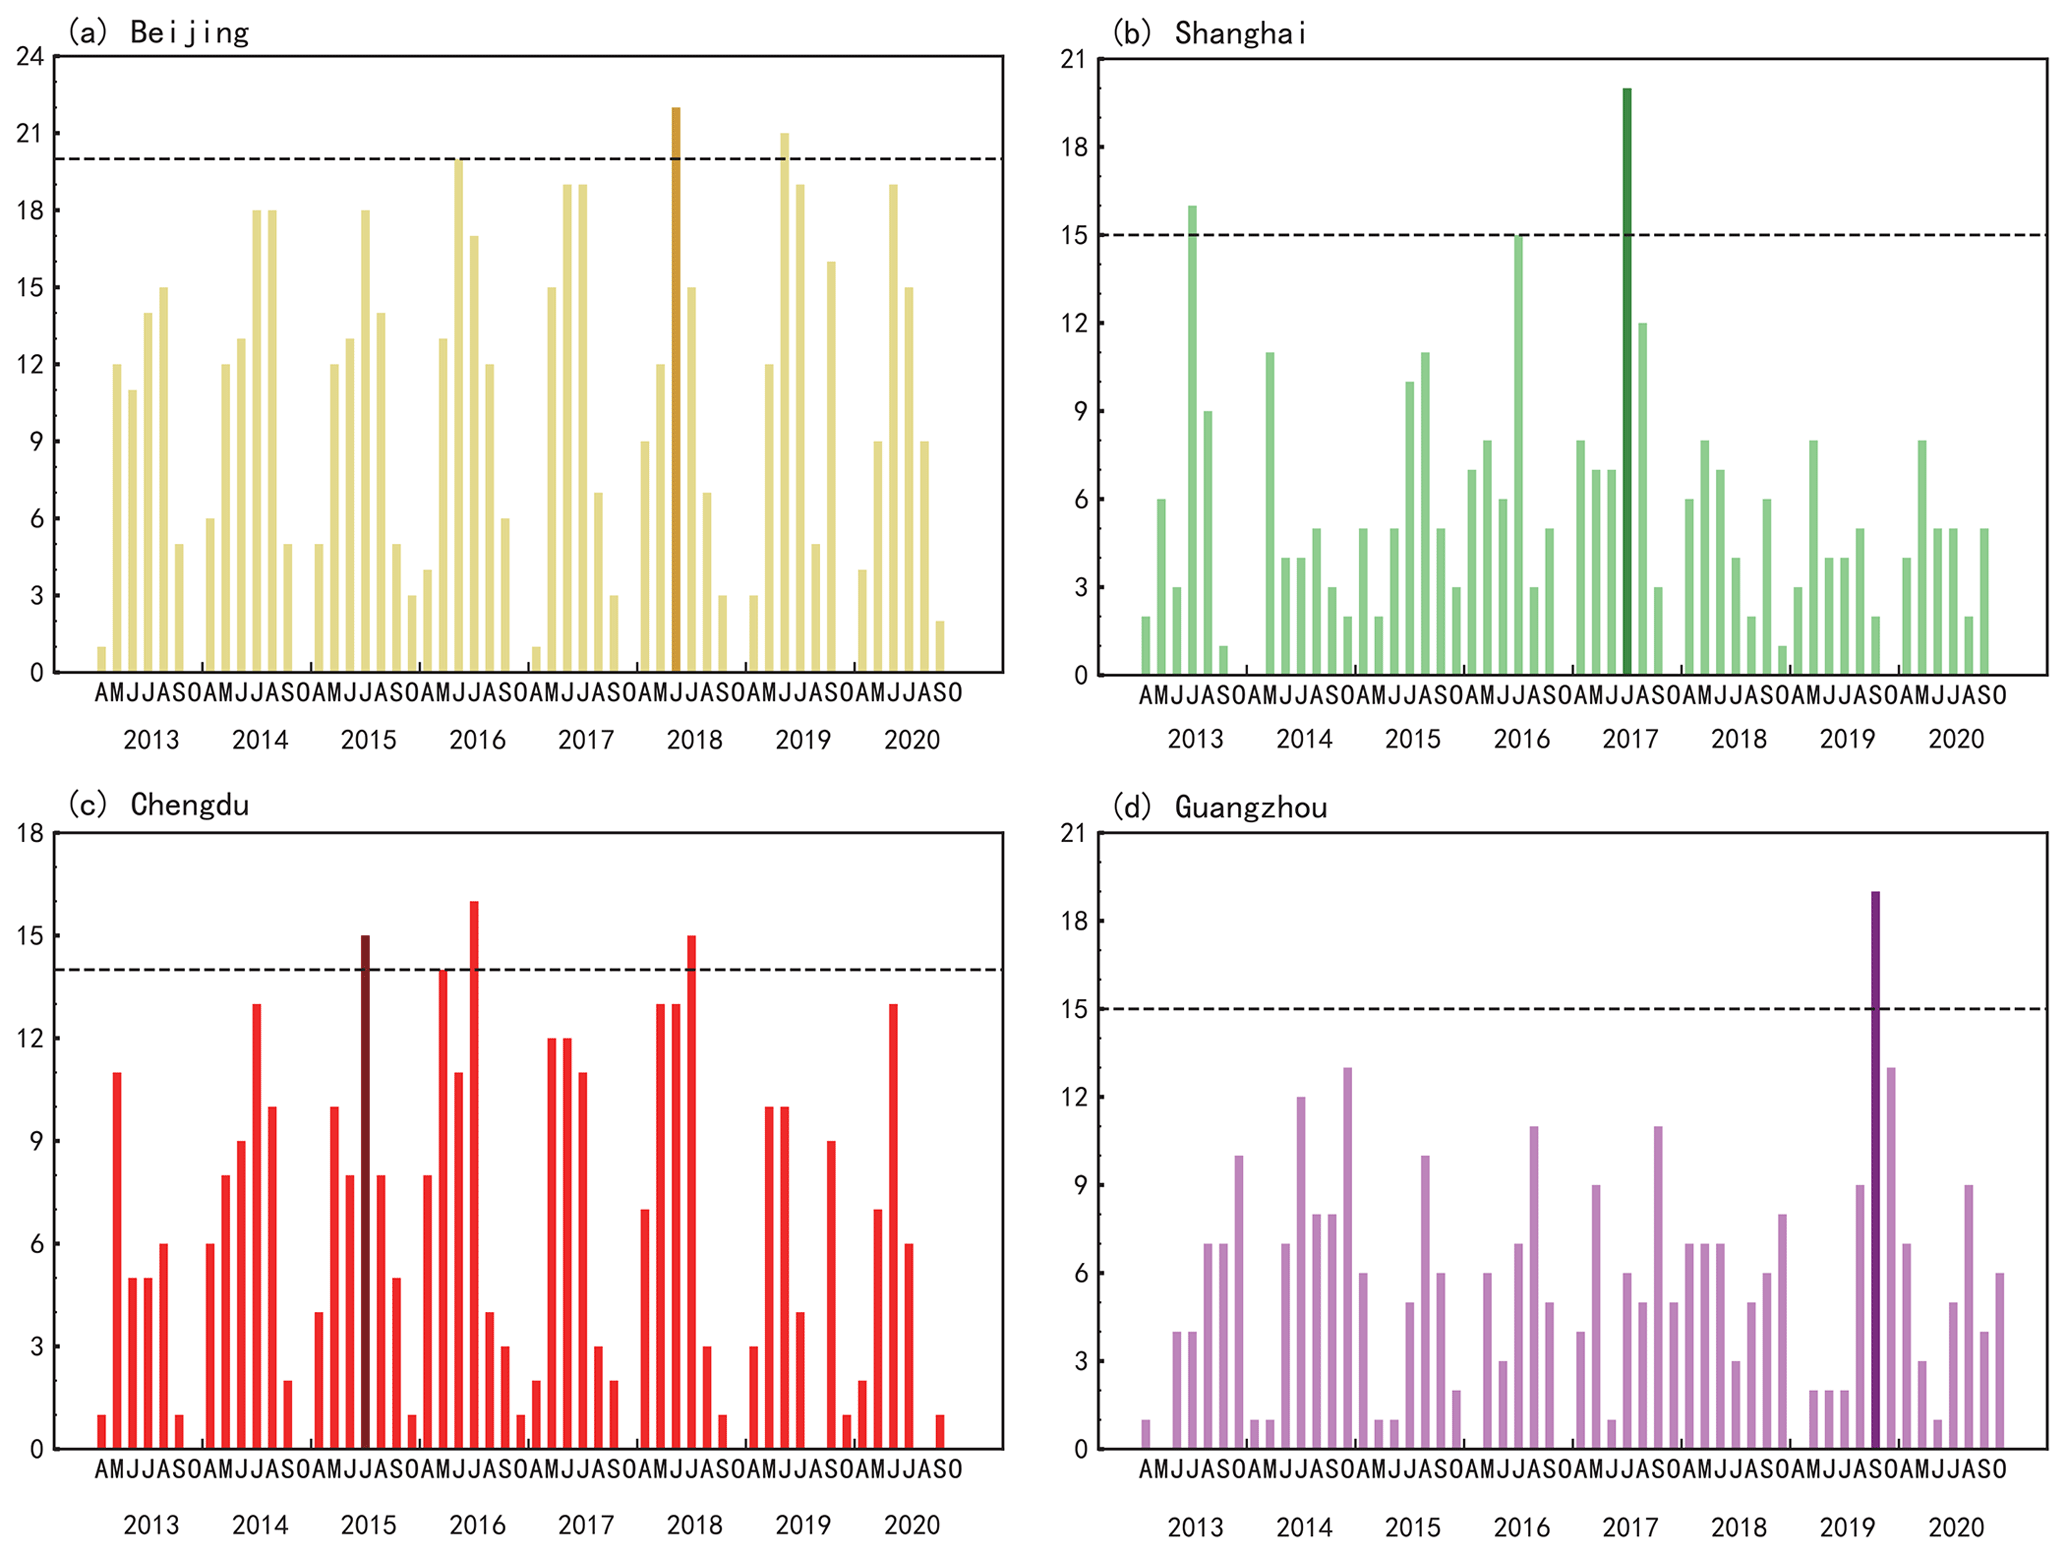
Figure 1Time series of frequencies of severe O3 pollution days (defined by daily maximum of 8 h average ozone (MDA8-O3) concentration greater than 160 µg m−3) in Beijing, Shanghai, Chengdu, and Guangzhou (a–d) from April to October during 2013–2020. The dark-colored bars represent the most severe month (second most for Chengdu) that has the highest frequency of O3 pollution days for the individual cities.
2.1 Surface ozone observations and meteorological reanalysis
Hourly surface O3 concentrations are obtained from the Ministry of Ecology and Environment (MEE) of China. The observational network was established in 2013 with 450 monitoring sites and increased to 1500 monitoring sites by 2019, covering about 360 cities in China. MDA8-O3 are calculated based on hourly O3 concentrations from April–September during 2013–2020. In this study, O3 pollution days are defined as the days when MDA8-O3 exceeds 160 µg m−3 according to the China National Ambient Air Quality Standard (GB3095-2012).
The meteorological fields are taken from the European Centre for Medium-Range Weather Forecasts (ECMWF) ERA5 monthly reanalysis dataset during 1980–2020, with a horizontal resolution of . To explore the meteorological characteristics that are conducive to O3 pollution, sea level pressure (SLP), geopotential height (GPH) at 500 hPa, wind fields at 850 and 500 hPa, temperature at 2m (T2m), and surface relative humidity (RH) are adopted, which can have significant impacts on O3 variations in China (Jiang et al., 2021; Dong et al., 2020; Le et al., 2020).
2.2 GEOS-Chem model simulations
O3 concentrations and the related chemical and physical processes causing O3 variations over 1981–2020 are simulated in the global atmospheric chemistry model GEOS-Chem (version V12.9.3), driven by the Modern-Era Retrospective analysis for Research and Application, Version 2 (MERRA-2). Simulations are performed on 47 vertical layers from the surface to 0.01 hPa and a horizontal grid of 2∘ latitude × 2.5∘ longitude. GEOS-Chem model incorporates a fully coupled O3–NOx–hydrocarbon–aerosol chemical mechanism (Pye et al., 2009; Mao et al., 2013; Sherwen et al., 2016). Boundary-layer mixing uses a non-local scheme (Lin and McElroy, 2010), and stratospheric O3 chemistry employs the linearized O3 parameterization (LINOZ) (McLinden et al., 2000).
Global anthropogenic emissions driving the simulations are from the Community Emissions Data System (CEDS; Hoesly et al., 2018), and biomass burning emissions are from the Global Fire Emissions Database, Edition 4 (GFED4; Van der Werf et al., 2017). VOC emissions from biogenic sources are provided offline by the Model of Emissions of Gases and Aerosols from Nature version 2.1 (MEGAN V2.1; Guenther et al., 2012). Lightning and soil emissions are specified in the model (Hudman et al., 2012; Ott et al., 2010). Anthropogenic emissions in China are updated with the Multi-resolution Emission Inventory (MEIC), a localized emission dataset for China. Anthropogenic, biomass burning, biogenic, and other natural emissions are kept at 2017 levels during the simulations, so as to eliminate the influence of emission changes on the interannual variation and trends of O3. Simulated O3 distributions with the same configuration in GEOS-Chem have been extensively evaluated in many studies, and the model has been reported to capture O3 concentrations well in China (e.g., Li et al., 2019; Lu et al., 2019; Ni et al., 2018).
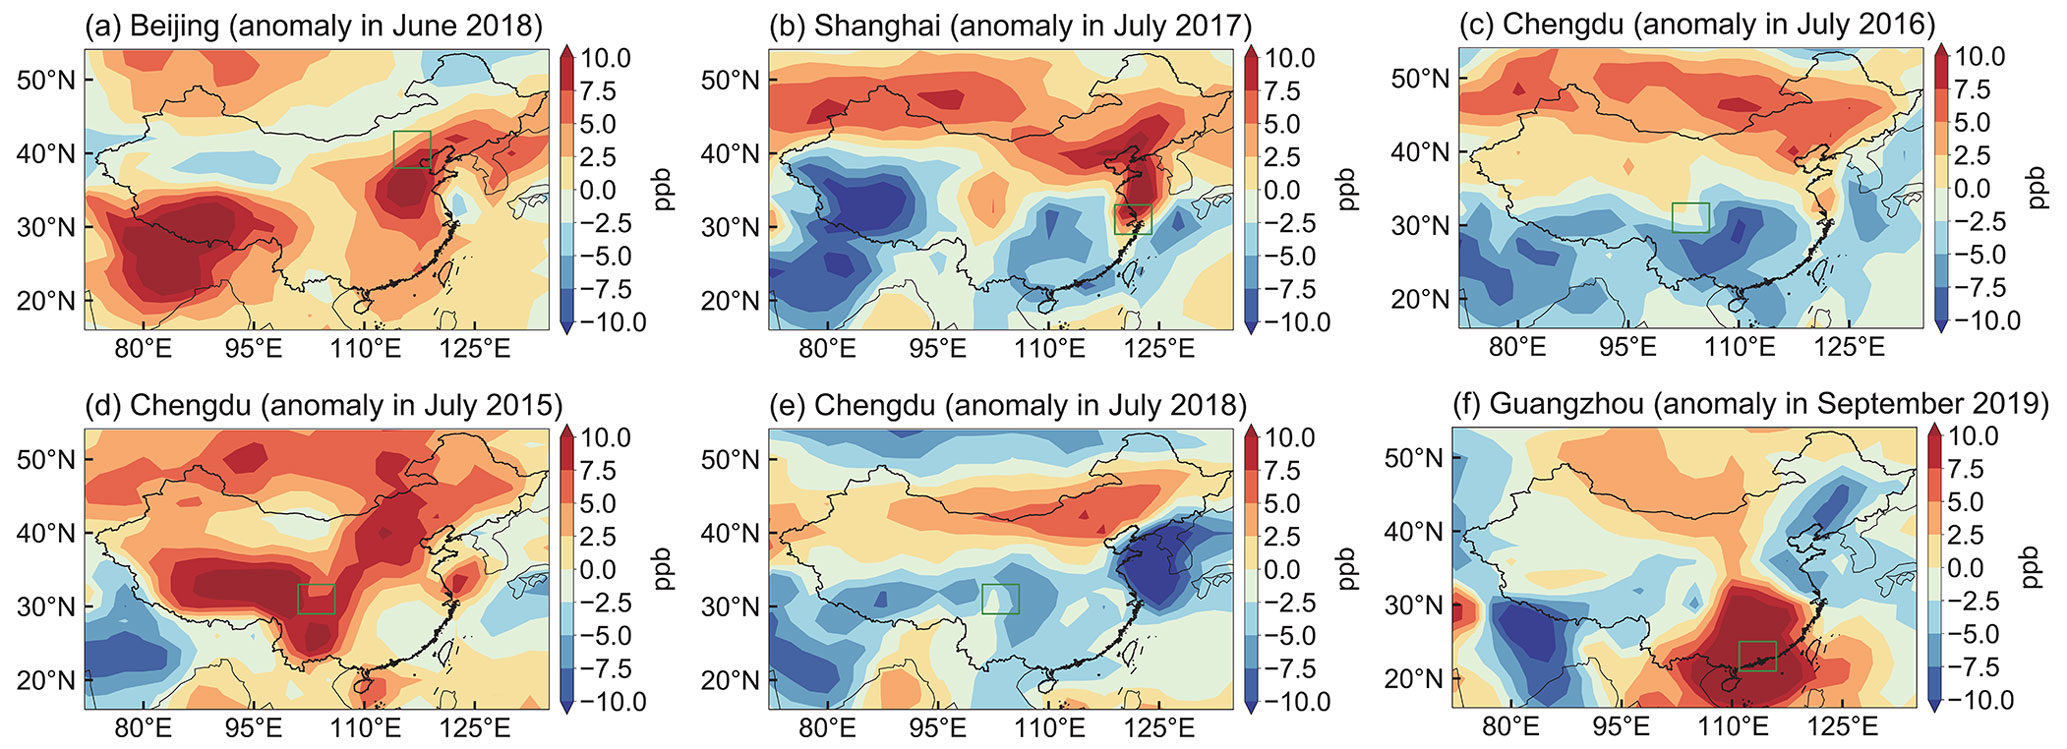
Figure 2Spatial distribution of monthly O3 concentration anomalies (part per billion, ppb) in June 2018 (a), July 2017 (b), July 2016 (c), July 2015 (d), July 2018 (e), and September 2019 (f) relative to the 40-year (1980–2019) monthly average for June (a), July (b, c, d, e), and September (f), simulated in the GEOS-Chem model. The green boxes mark the NCP (a), YRD (b), SCB (c, d, e), and PRD (f).
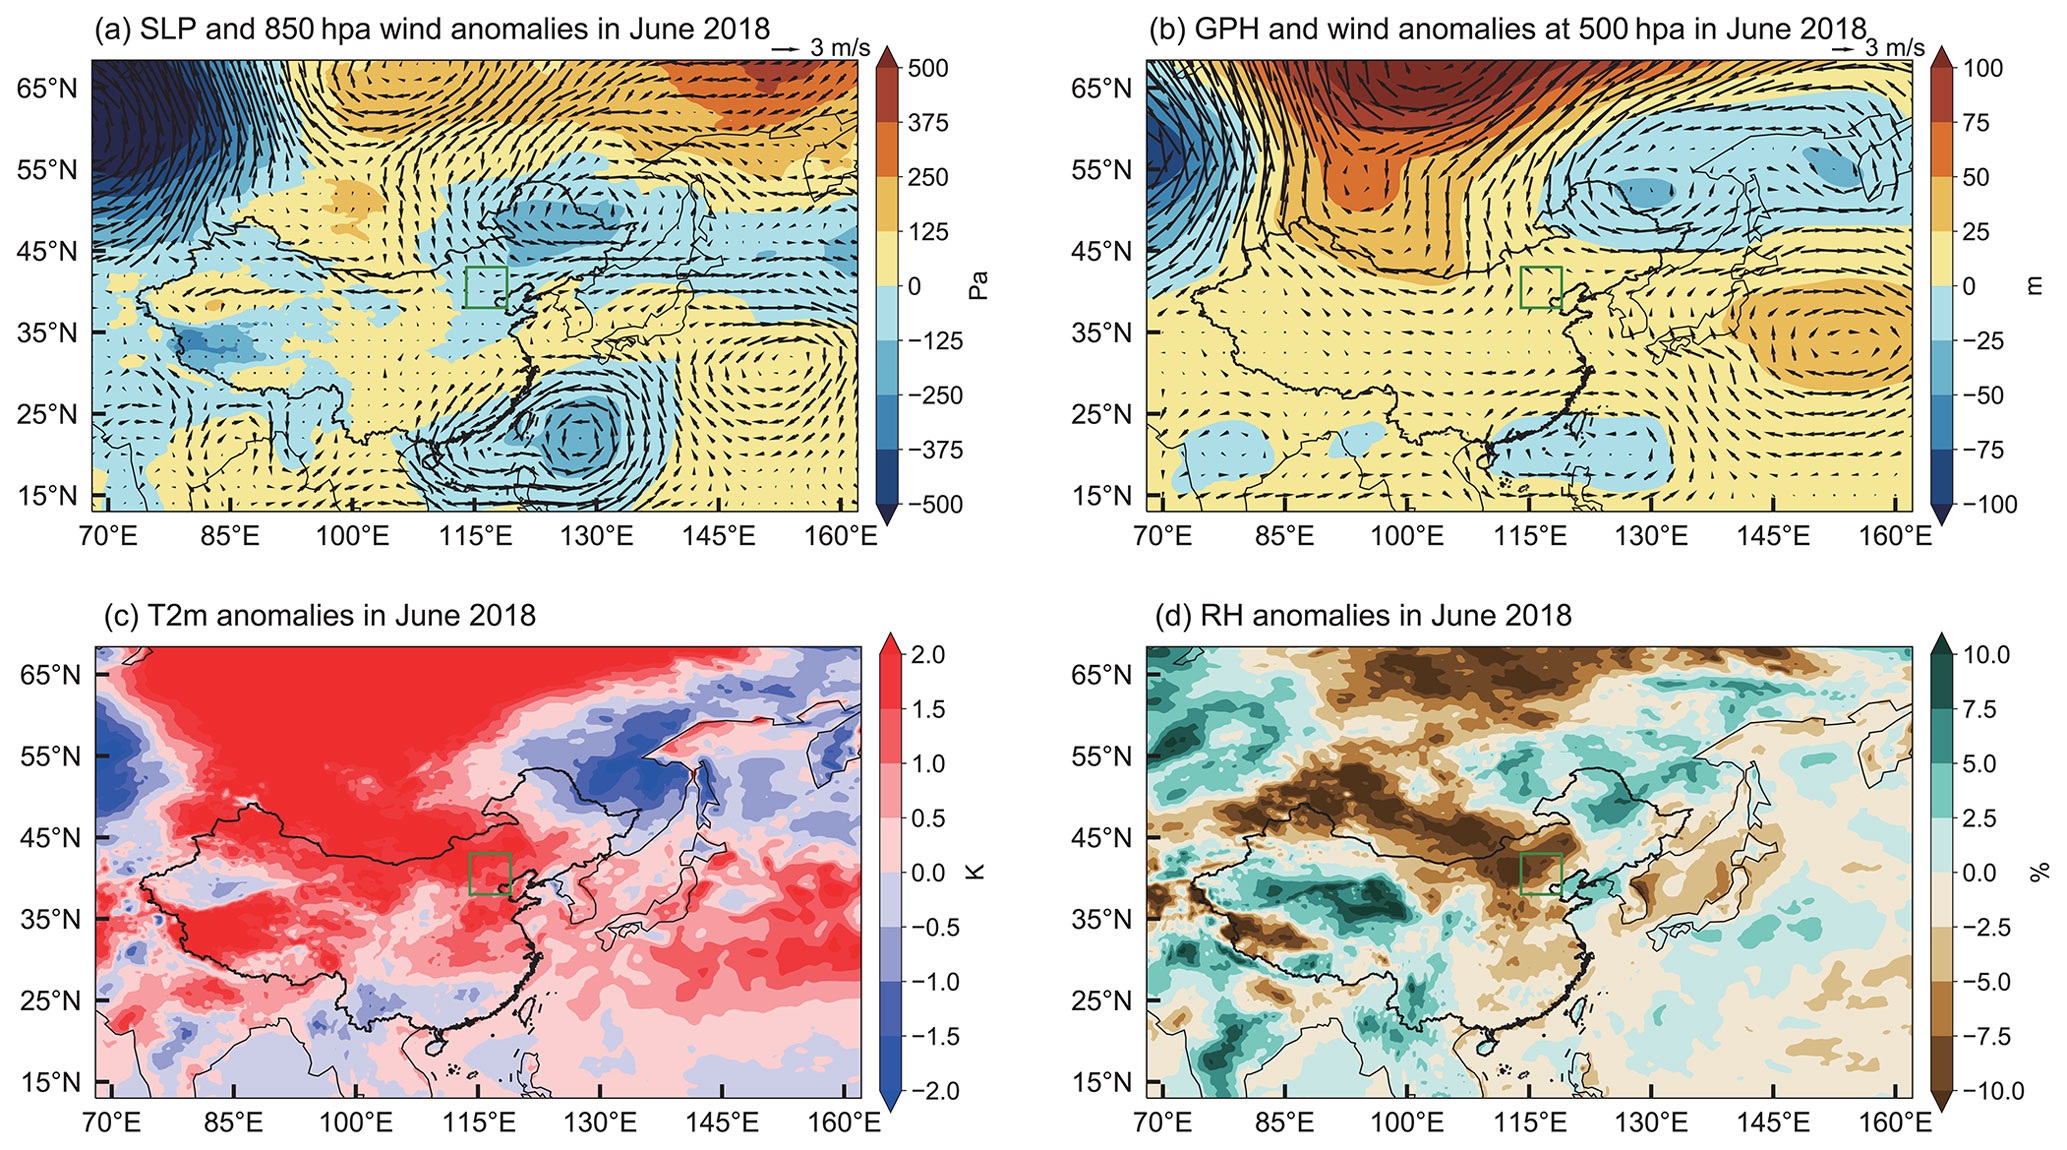
Figure 3Anomalies in sea level pressure (SLP; Pa, shaded) and 850 hPa winds (m s−1, vector) (a), geopotential height (GPH; m, shaded) and winds at 500 hPa (m s−1, vector) (b), 2 m air temperature (T2m; K) (c), and surface relative humidity (RH; %) (d) in June 2018 relative to the 40-year (1980–2019) monthly average for June. The green boxes mark the NCP.
2.3 CMIP6 multi-model simulations
The historical and multi-model simulations from the Scenario Model Intercomparison Project (ScenarioMIP) in CMIP6 are used to analyze the historical variations and future trends of meteorological conditions conducive to the most severe O3 pollution. Two different future scenarios of the Shared Socioeconomic Pathways (SSPs) are applied, including the sustainable scenario (SSP1-2.6) and the high-forcing scenario (SSP5-8.5). Totally simulations from 13 models (ACCESS-CM2, ACCESS-ESM1-5, CAS-ESM2-0, CMCC-CM2-SR5, CMCC-ESM2, FGOALS-f3-L, FGOALS-g3, GFDL-ESM4, INM-CM4-8, INM-CM5-0, IPSL-CM6A-LR, MPI-ESM1-2-HR, MPI-ESM1-2-LR) are analyzed in this study.
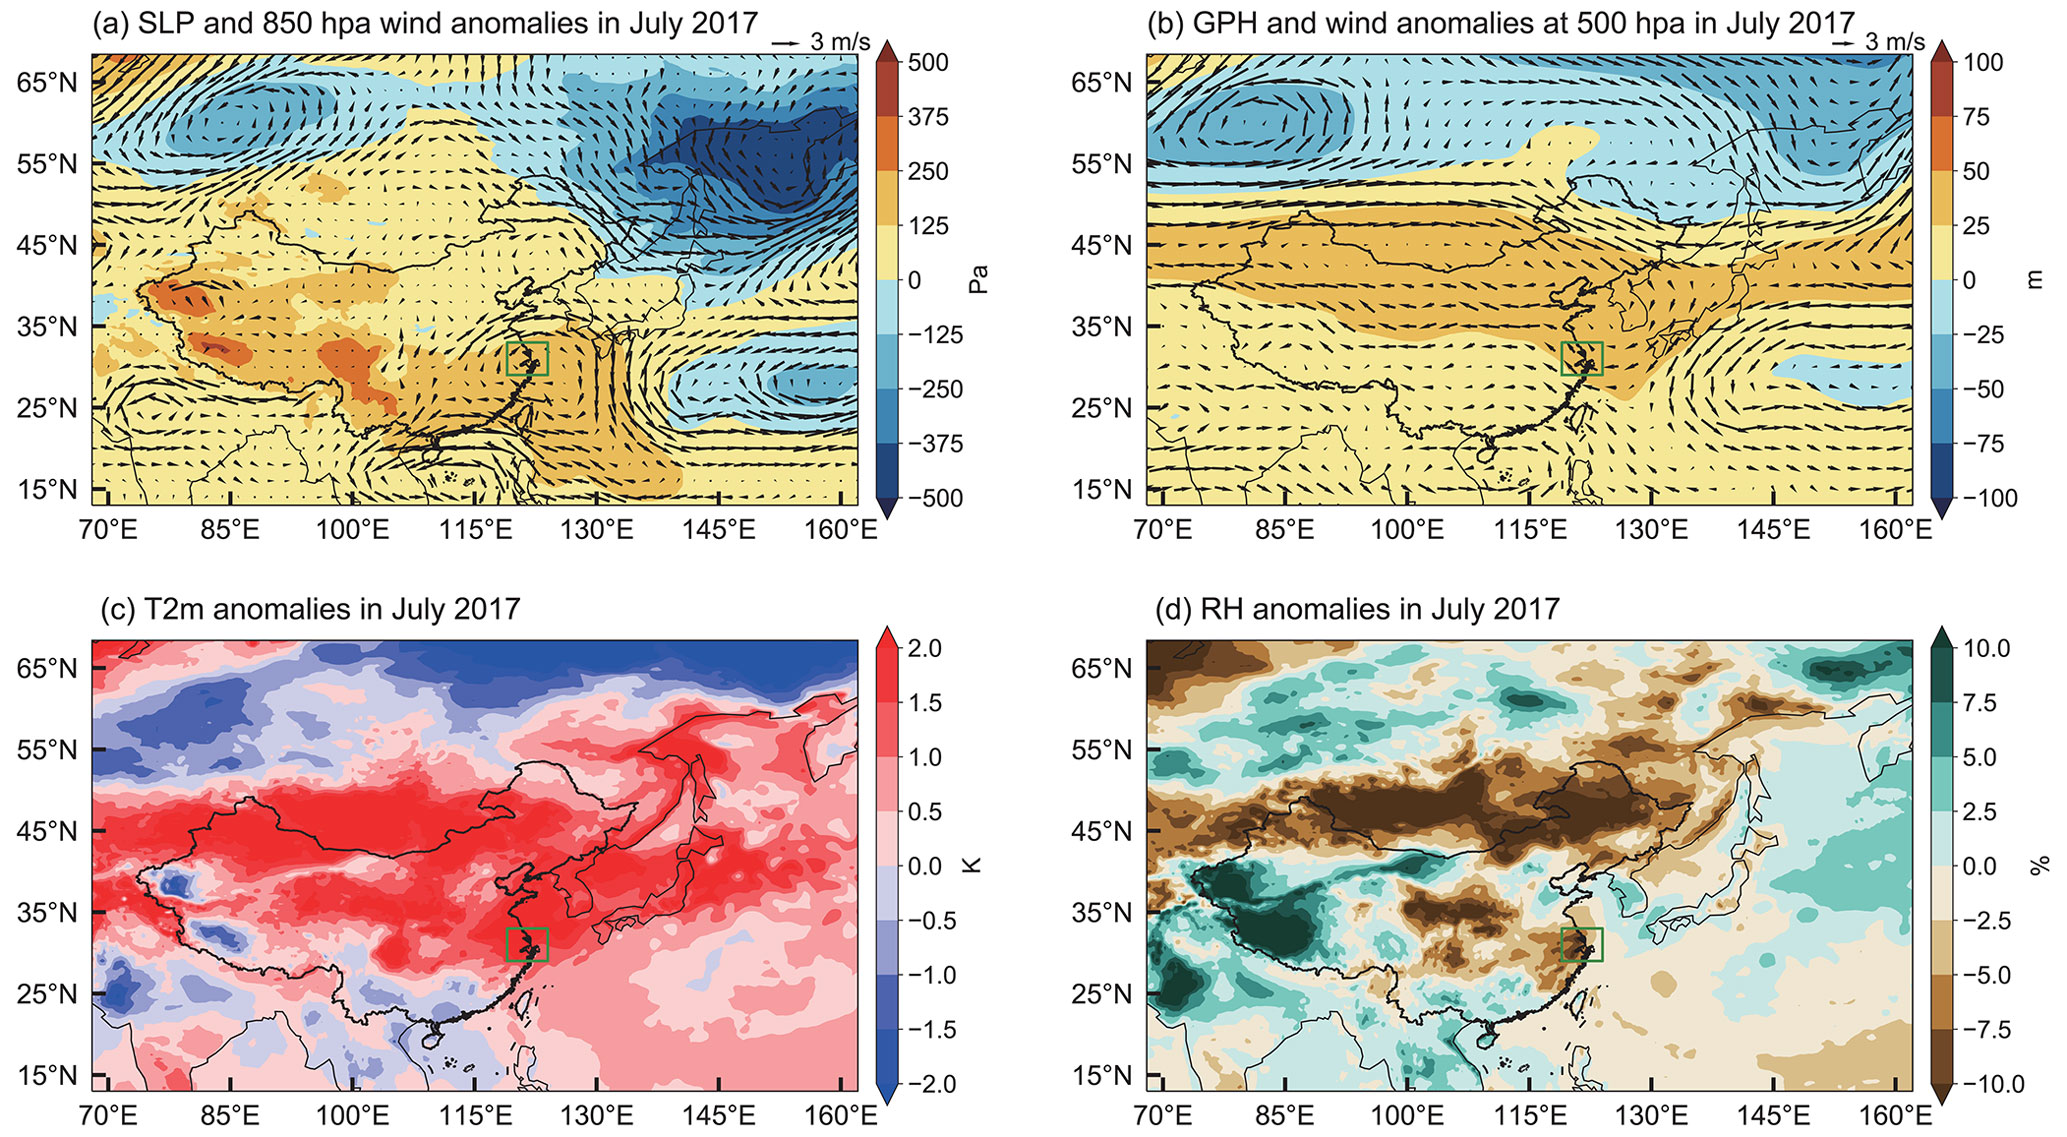
Figure 4Same as Fig. 3 but for the monthly anomalies in July 2017. The green boxes mark the YRD.
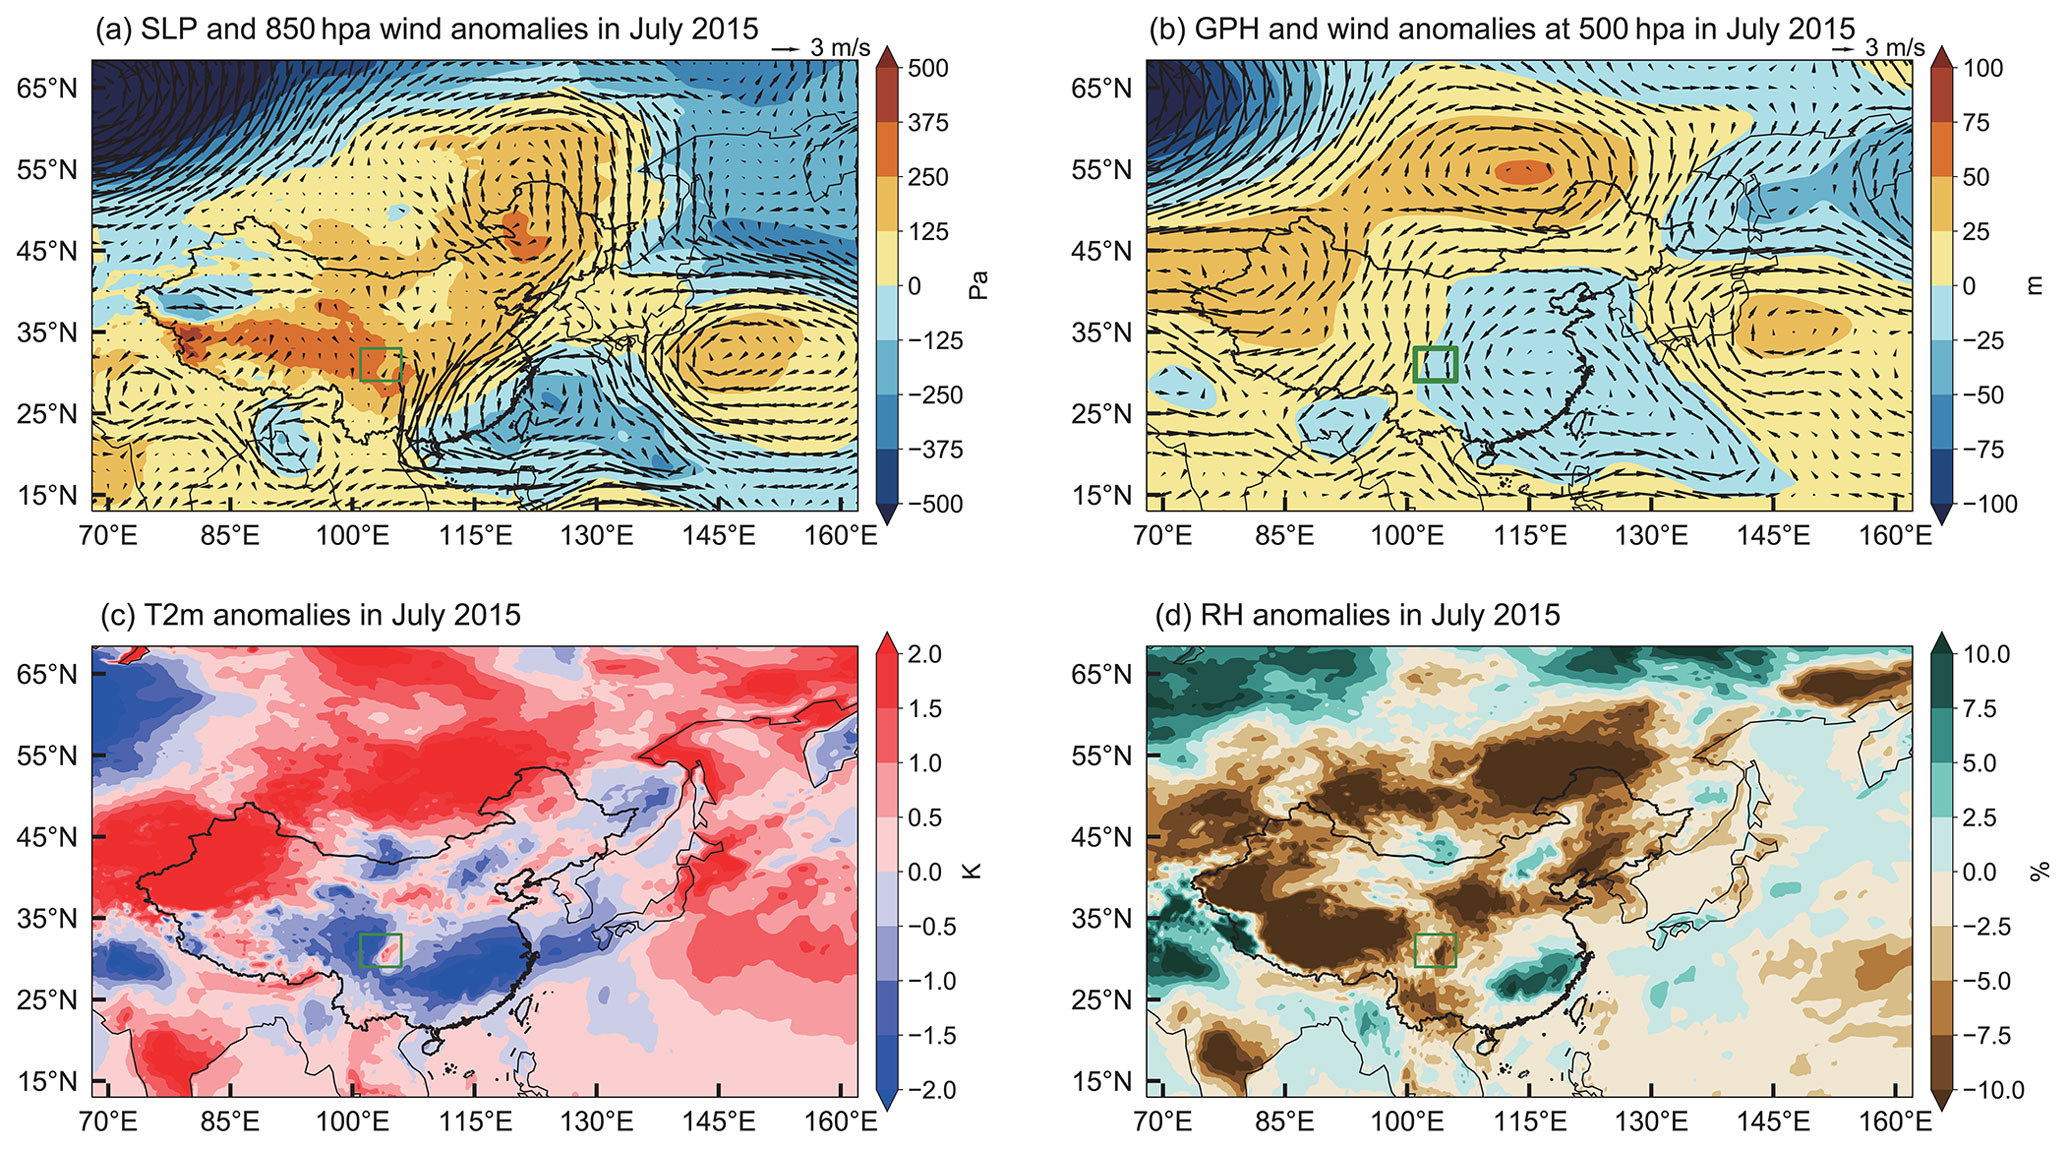
Figure 5Same as Fig. 3 but for the monthly anomalies in July 2015. The green boxes mark the SCB.
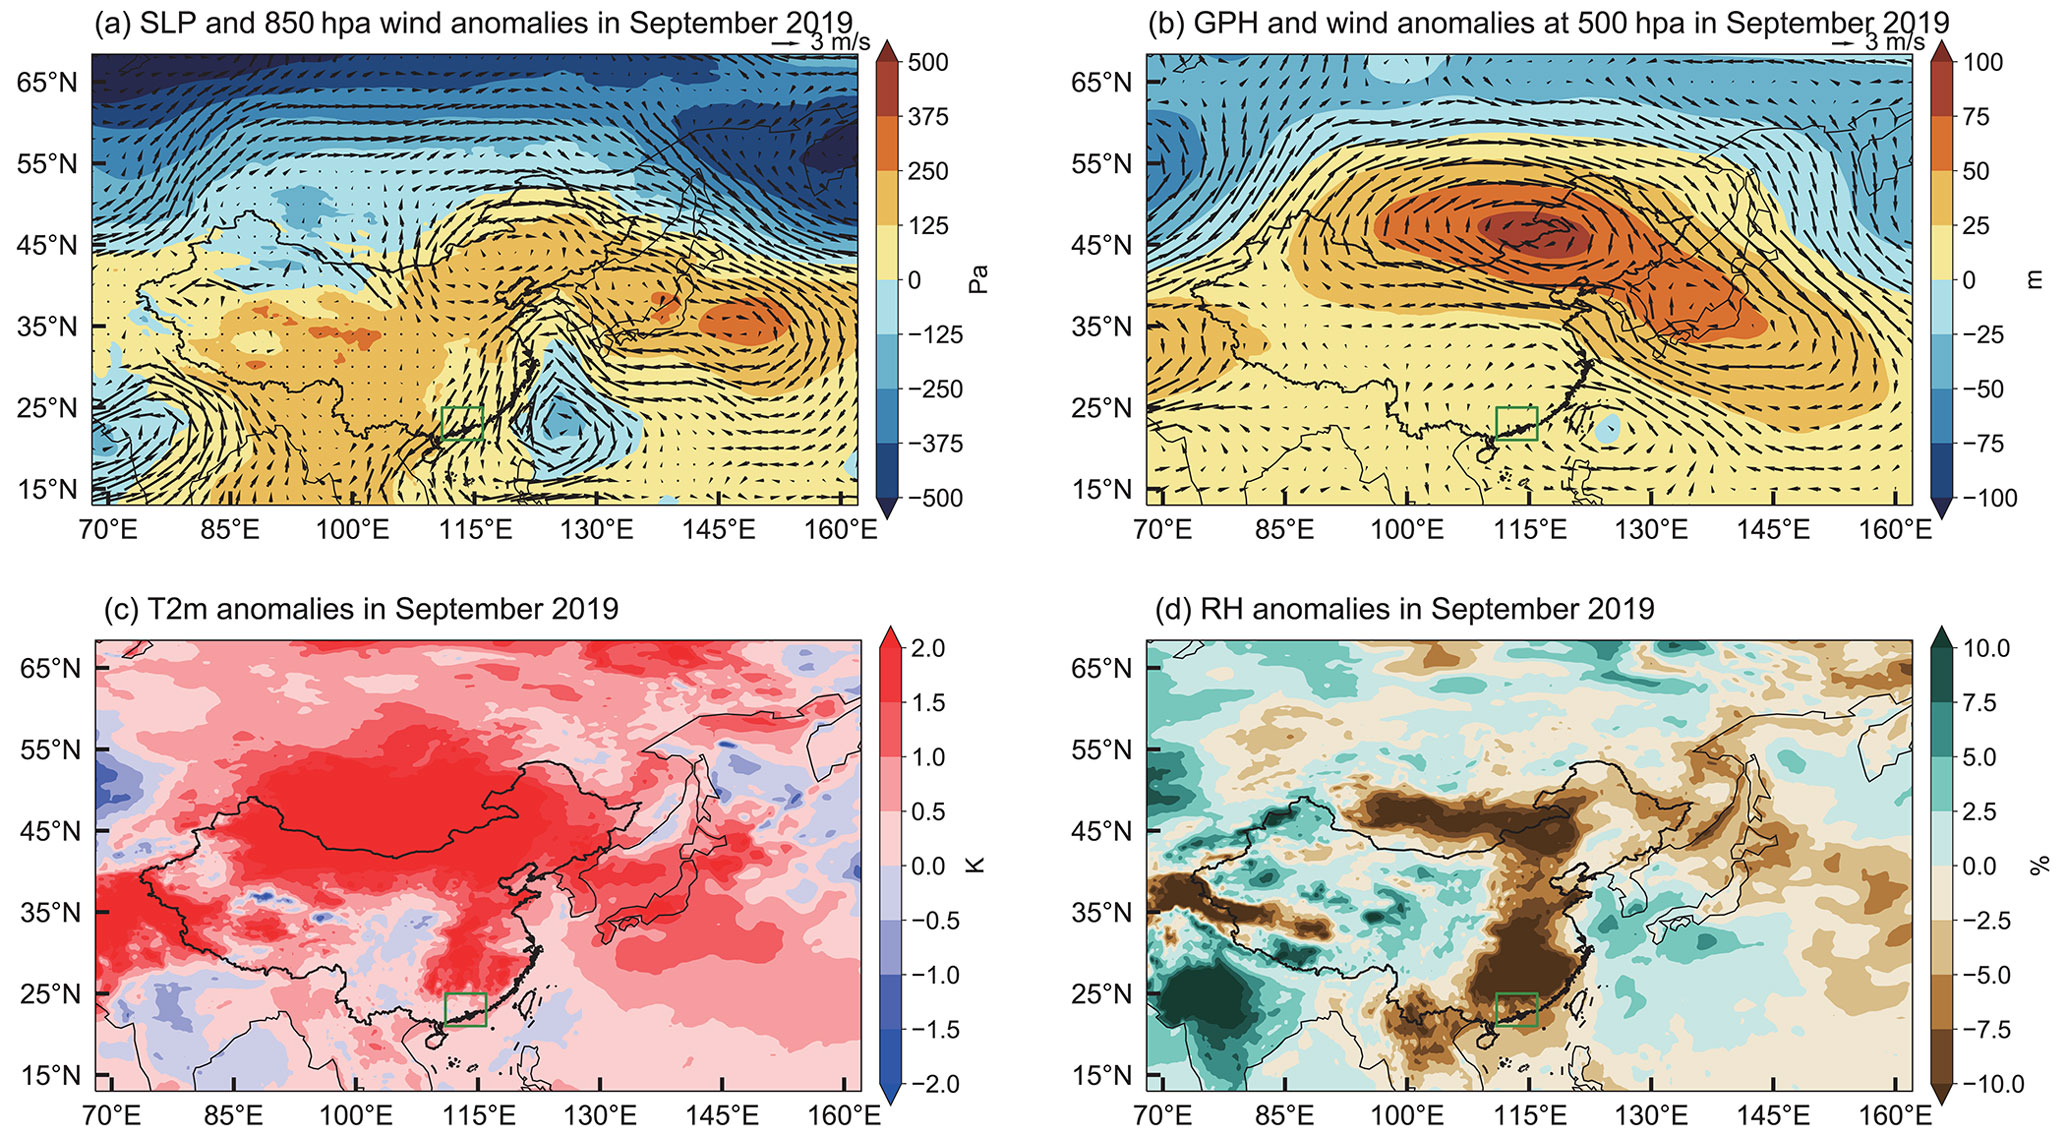
Figure 6Same as Fig. 3 but for the monthly anomalies in September 2019. The green boxes mark the PRD.
3.1 Meteorological characteristics conductive to regional ozone pollution
To investigate the relationship between meteorological conditions and regional O3 pollution in China, the frequencies of O3 pollution days from April to October during 2013–2020 are calculated for Beijing, Shanghai, Chengdu, and Guangzhou, representing the typical four polluted regions in China (i.e., the NCP, YRD, SCB, and PRD) (Fig. 1). Observational data show the highest frequencies of O3 pollution days in June 2018, July 2017, and September 2019 in Beijing, Shanghai, and Guangzhou, with pollution days up to 22, 20, and 19 d per month, respectively. The top-three highest frequencies of O3 pollution days in Chengdu are in July 2016, July 2015, and July 2018 (16, 15, and 15 d per month, respectively). Variations in O3 concentration in the real world are driven by changes in both meteorological factors and emissions. With fixed emissions, the positive anomalies of near-surface O3 concentrations over the NCP, YRD, and PRD during their most polluted months can also be reproduced by the GEOS-Chem model (Fig. 2), suggesting that the O3 pollution during the most polluted months over the NCP, YRD, and PRD is likely attributable to the anomalies of meteorological conditions. In the top-three O3 polluted months in Chengdu, only in July 2015 can the concentrations higher than the long-term averages be captured by the simulations with fixed emissions. Therefore, in this study, we focus on the meteorological characteristics in June 2018, July 2017, July 2015, and September 2019, which were conducive to the most severe O3 pollution over the NCP, YRD, SCB, and PRD, respectively.
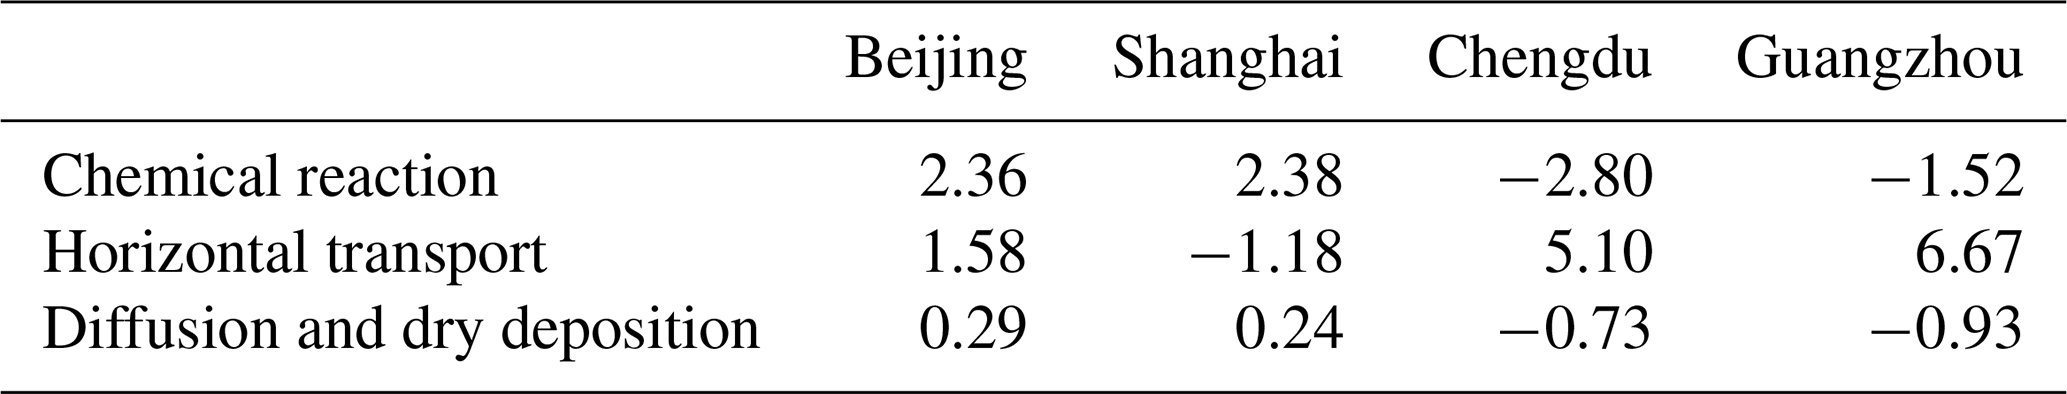
Table 1Anomalies in net rate of changes in tropospheric O3 mass (Gg d−1) over the NCP (38–44∘ N, 115–120∘ E), YRD (28–32∘ N, 120–125∘ E), SCB (30–32∘ N, 102.5–105∘ E) and PRD (22–26∘ N, 110–115∘ E) due to physical and chemical processes in the most polluted months (June 2018, July 2017, July 2015, and September 2019, respectively) relative to the same months averaged during 1981–2019.
When O3 pollution was the most severe over the NCP in June 2018, an anomalous high pressure occurred at 500 hPa over the NCP (Fig. 3b), relative to the 40-year climatological averages from 1980–2019, leading to positive T2m anomalies near the surface (Fig. 3c). Anomalous lows located over northeastern China and the northwestern Pacific (Fig. 3a) and the associated anomalous northerly winds prevent the moisture moving from the ocean to the NCP, causing negative RH anomalies over the NCP (Fig. 3d). The meteorological conditions with the high T2m and low RH are favorable for the photochemical production of O3. When the most severe O3 pollution occurred in July 2017, YRD was dominated by anomalous high pressure in the lower and middle troposphere (Fig. 4a and b). Under the control of high pressure, the meteorological conditions (e.g., high T2m and low RH) enhance the photochemical production of O3 (Fig. 4c and d). In the O3 pollution event of the SCB in July 2015, the negative T2m anomaly is not conducive to the O3 production (Fig. 5c), although the RH was low (Fig. 5d). Meanwhile, the anomalous low over eastern China and the northwestern Pacific in the middle troposphere favors regional O3 transport from the polluted source region over eastern China to the SCB (Fig. 5b), and the anomalous high over central-western China is conducive to the vertical transport of upper tropospheric O3 down to the lower troposphere (Fig. 5a). For the PRD in September 2019, the anomalous high covering almost the whole of China along with the anomalous low over the East China Sea generates northerly wind anomalies in the lower troposphere over eastern China, which tend to transport polluted air from northern China and weaken the inflow of oceanic clean air (Fig. 6). The temperature increase is much more significant in the upwind regions as compared to the PRD, suggesting that the strong regional transport could be the primary reason for this severe O3 pollution event of the PRD.
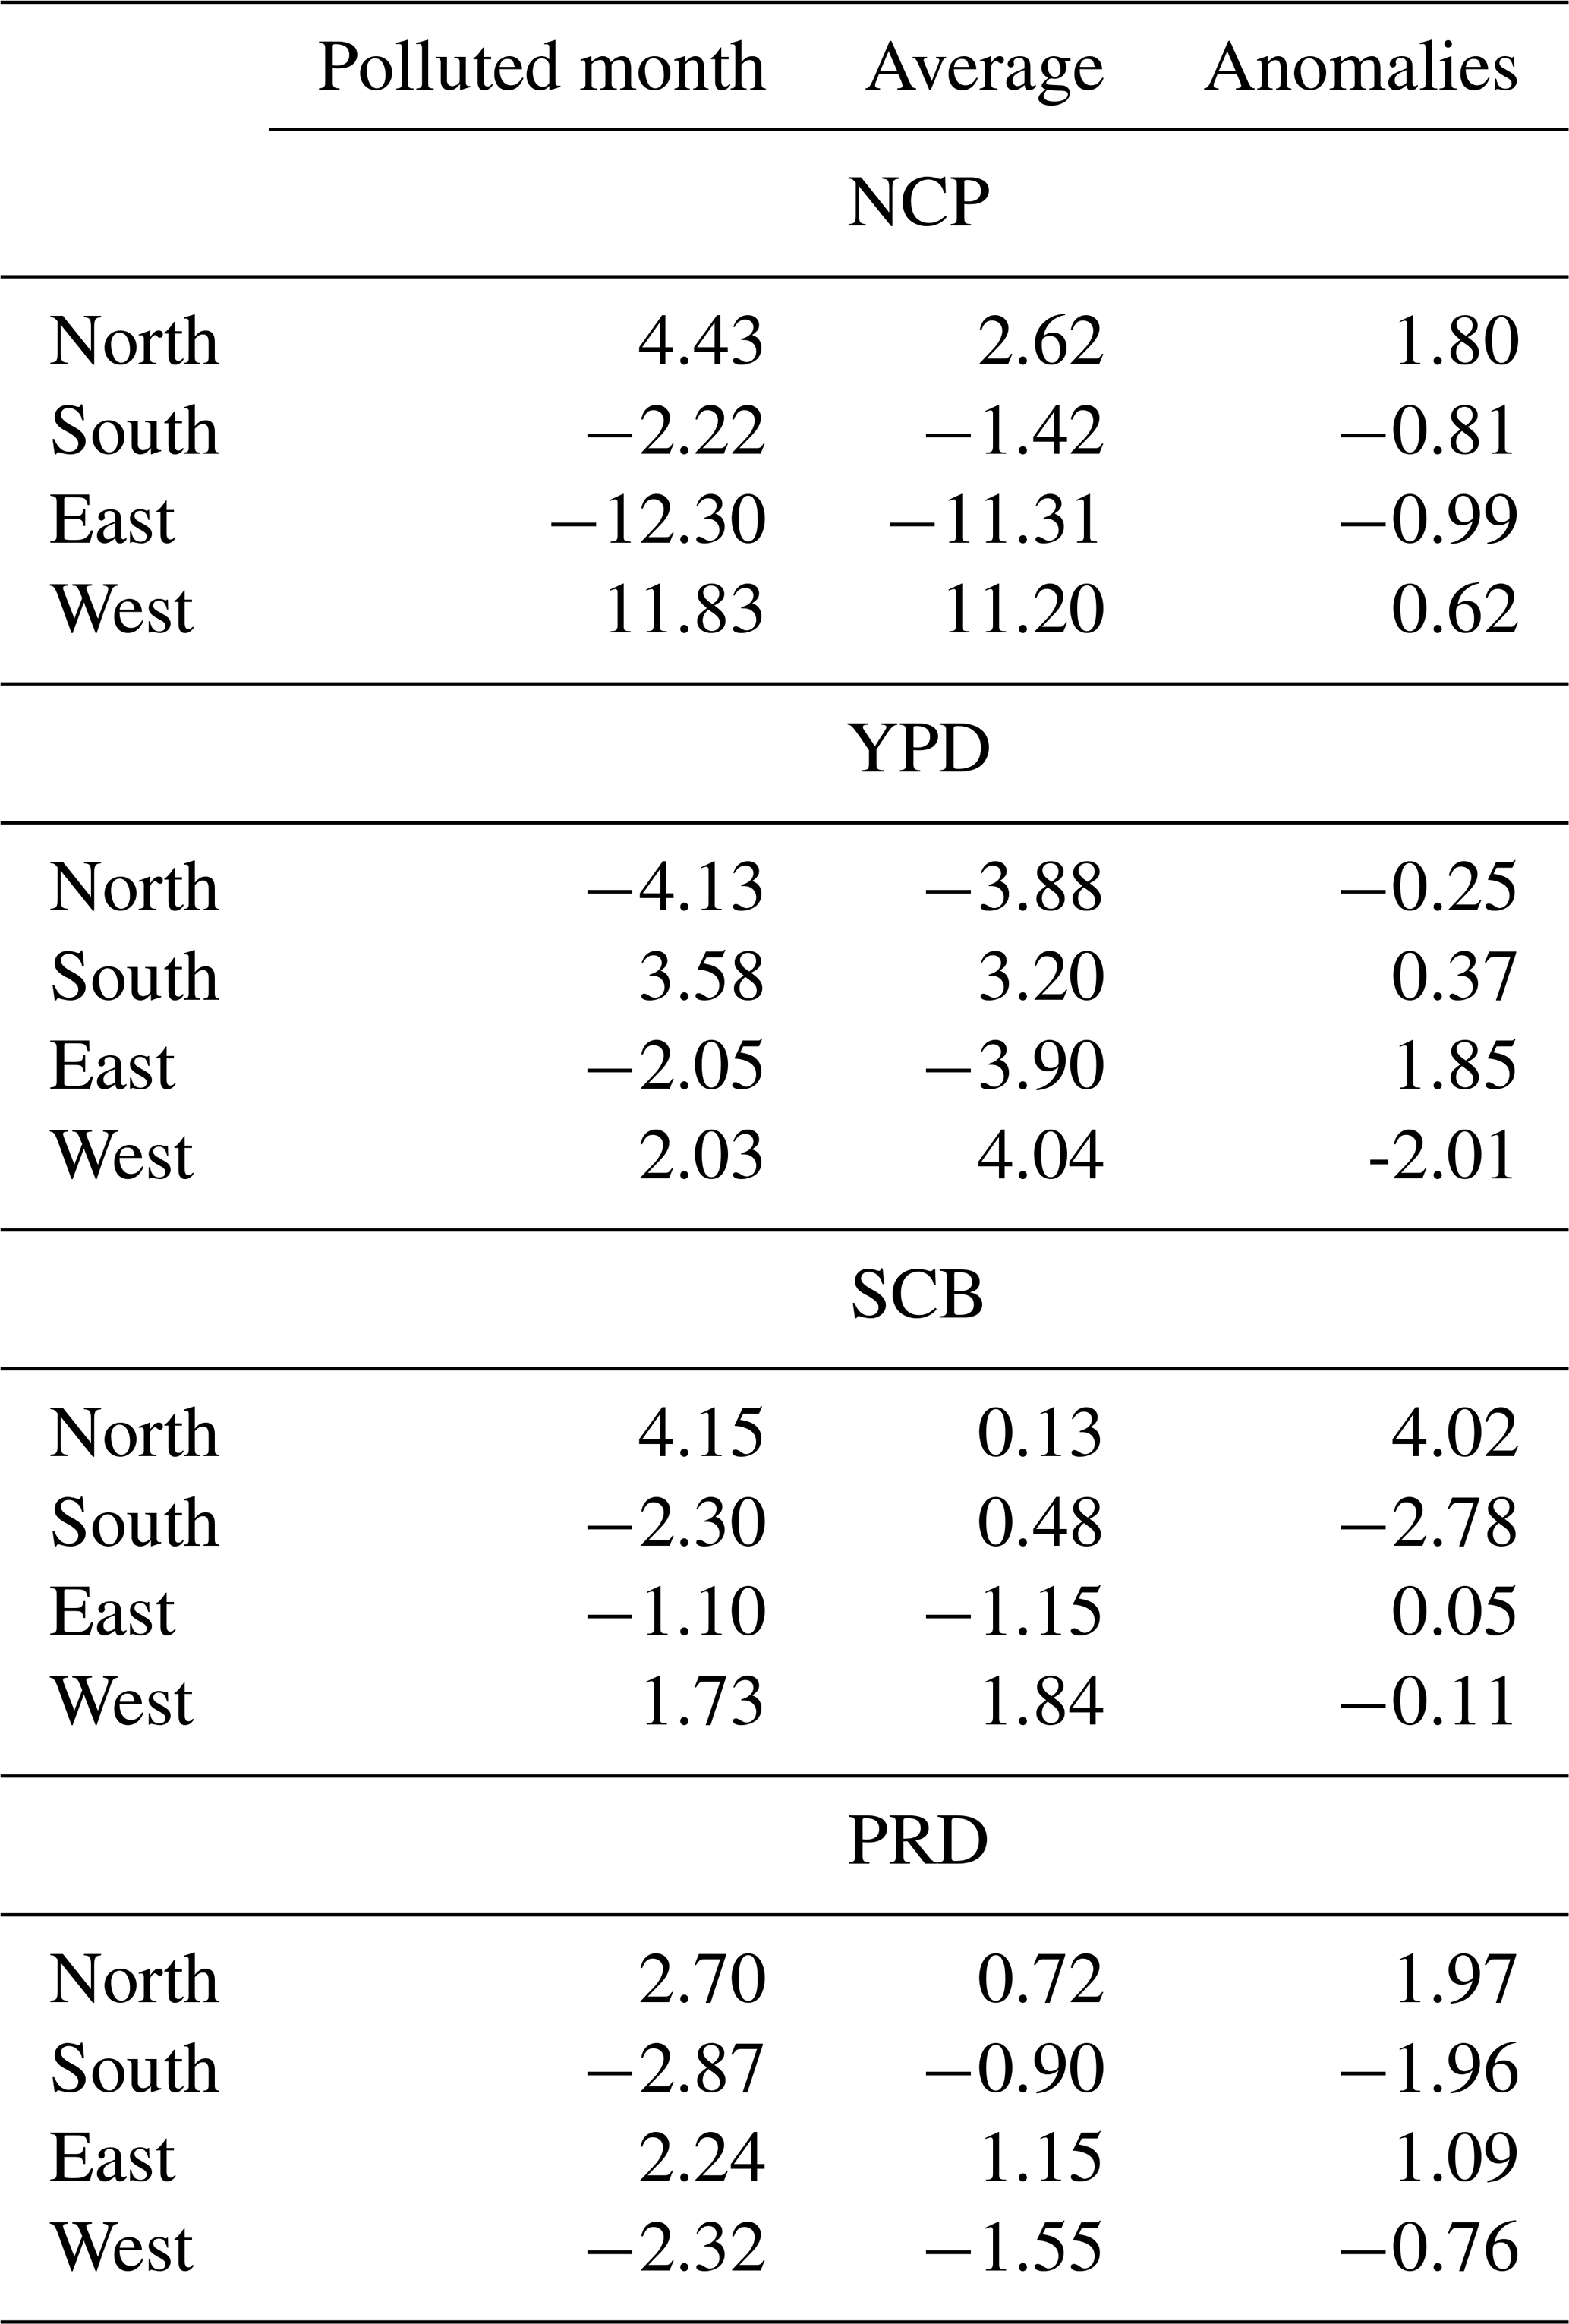
Table 2Horizontal mass transport (Tg) of O3 from the surface to 500 hPa over the NCP (38–44∘ N, 115–120∘ E), YRD (28–32∘ N, 120–125∘ E), SCB (30–32∘ N, 102.5–105∘ E) and PRD (22–26∘ N, 110–115∘ E) in the severely polluted months (June 2018, July 2017, July 2015, and September 2019, respectively) and averaged over the same months of a year during 1981–2019, as well as their differences. Positive values indicate incoming fluxes, and negative values indicate outgoing fluxes.
3.2 Physical and chemical mechanisms leading to regional ozone pollution
To further explore the mechanisms of meteorological changes leading to the severe O3 pollution over the four typical polluted regions in China, contributions of individual chemical and physical processes to O3 variations are quantified based on the IPR analysis from GEOS-Chem simulations and summarized in Table 1.
Consistent with the meteorological anomalies analyzed above, high-temperature and low-RH meteorological conditions in the NCP are conducive to the photochemical production of O3. During the polluted month over the NCP, the chemical production of tropospheric O3 is higher than the long-term average by 2.36 Gg d−1, while the horizontal transport also contributes to the increase in O3 mass by 1.58 Gg d−1 (Table 1). Due to the enhanced northwesterly winds, the import of O3 mass from the north and west of the NCP was increased by 1.80 and 0.62 Tg, respectively (Table 2). In YRD, the chemical production (2.38 Gg d−1) is also the dominant process that drives the O3 concentration increase during the most severe polluted month, associated with the warm and dry conditions. Therefore, the anomalous chemical production is the major process that induced O3 pollution in the NCP and YRD during the most severe polluted months.
Different from the NCP and YRD, horizontal transport is the main process that caused O3 pollution in the SCB and PRD during the most severe months. It contributes to the rate of increase in O3 mass by 5.10 and 6.67 Gg d−1, respectively, over the SCB and PRD, while other processes tend to decrease the O3 mass (Table 1). Due to the anomalous northerly winds over the SCB, more O3 is transported into the SCB from north (by 4.02 Tg), and the anomalous northeasterly winds enhance the O3 transport from the north and east of the PRD by 1.97 and 1.09 Tg, respectively, leading to the increase in O3 concentrations over the SCB and PRD during the most severe months relative to the climatological averages (Table 2). Note that the chemical production of tropospheric O3 decreased in the SCB and PRD during the most severe months. It could have been biased by the relatively coarse model resolution in this study (2∘ latitude × 2.5∘ longitude), since the SCB and PRD for calculating the chemical and physical processes only cover limited grid boxes. Further studies should be performed using a model with finer resolution or a nested simulation method.
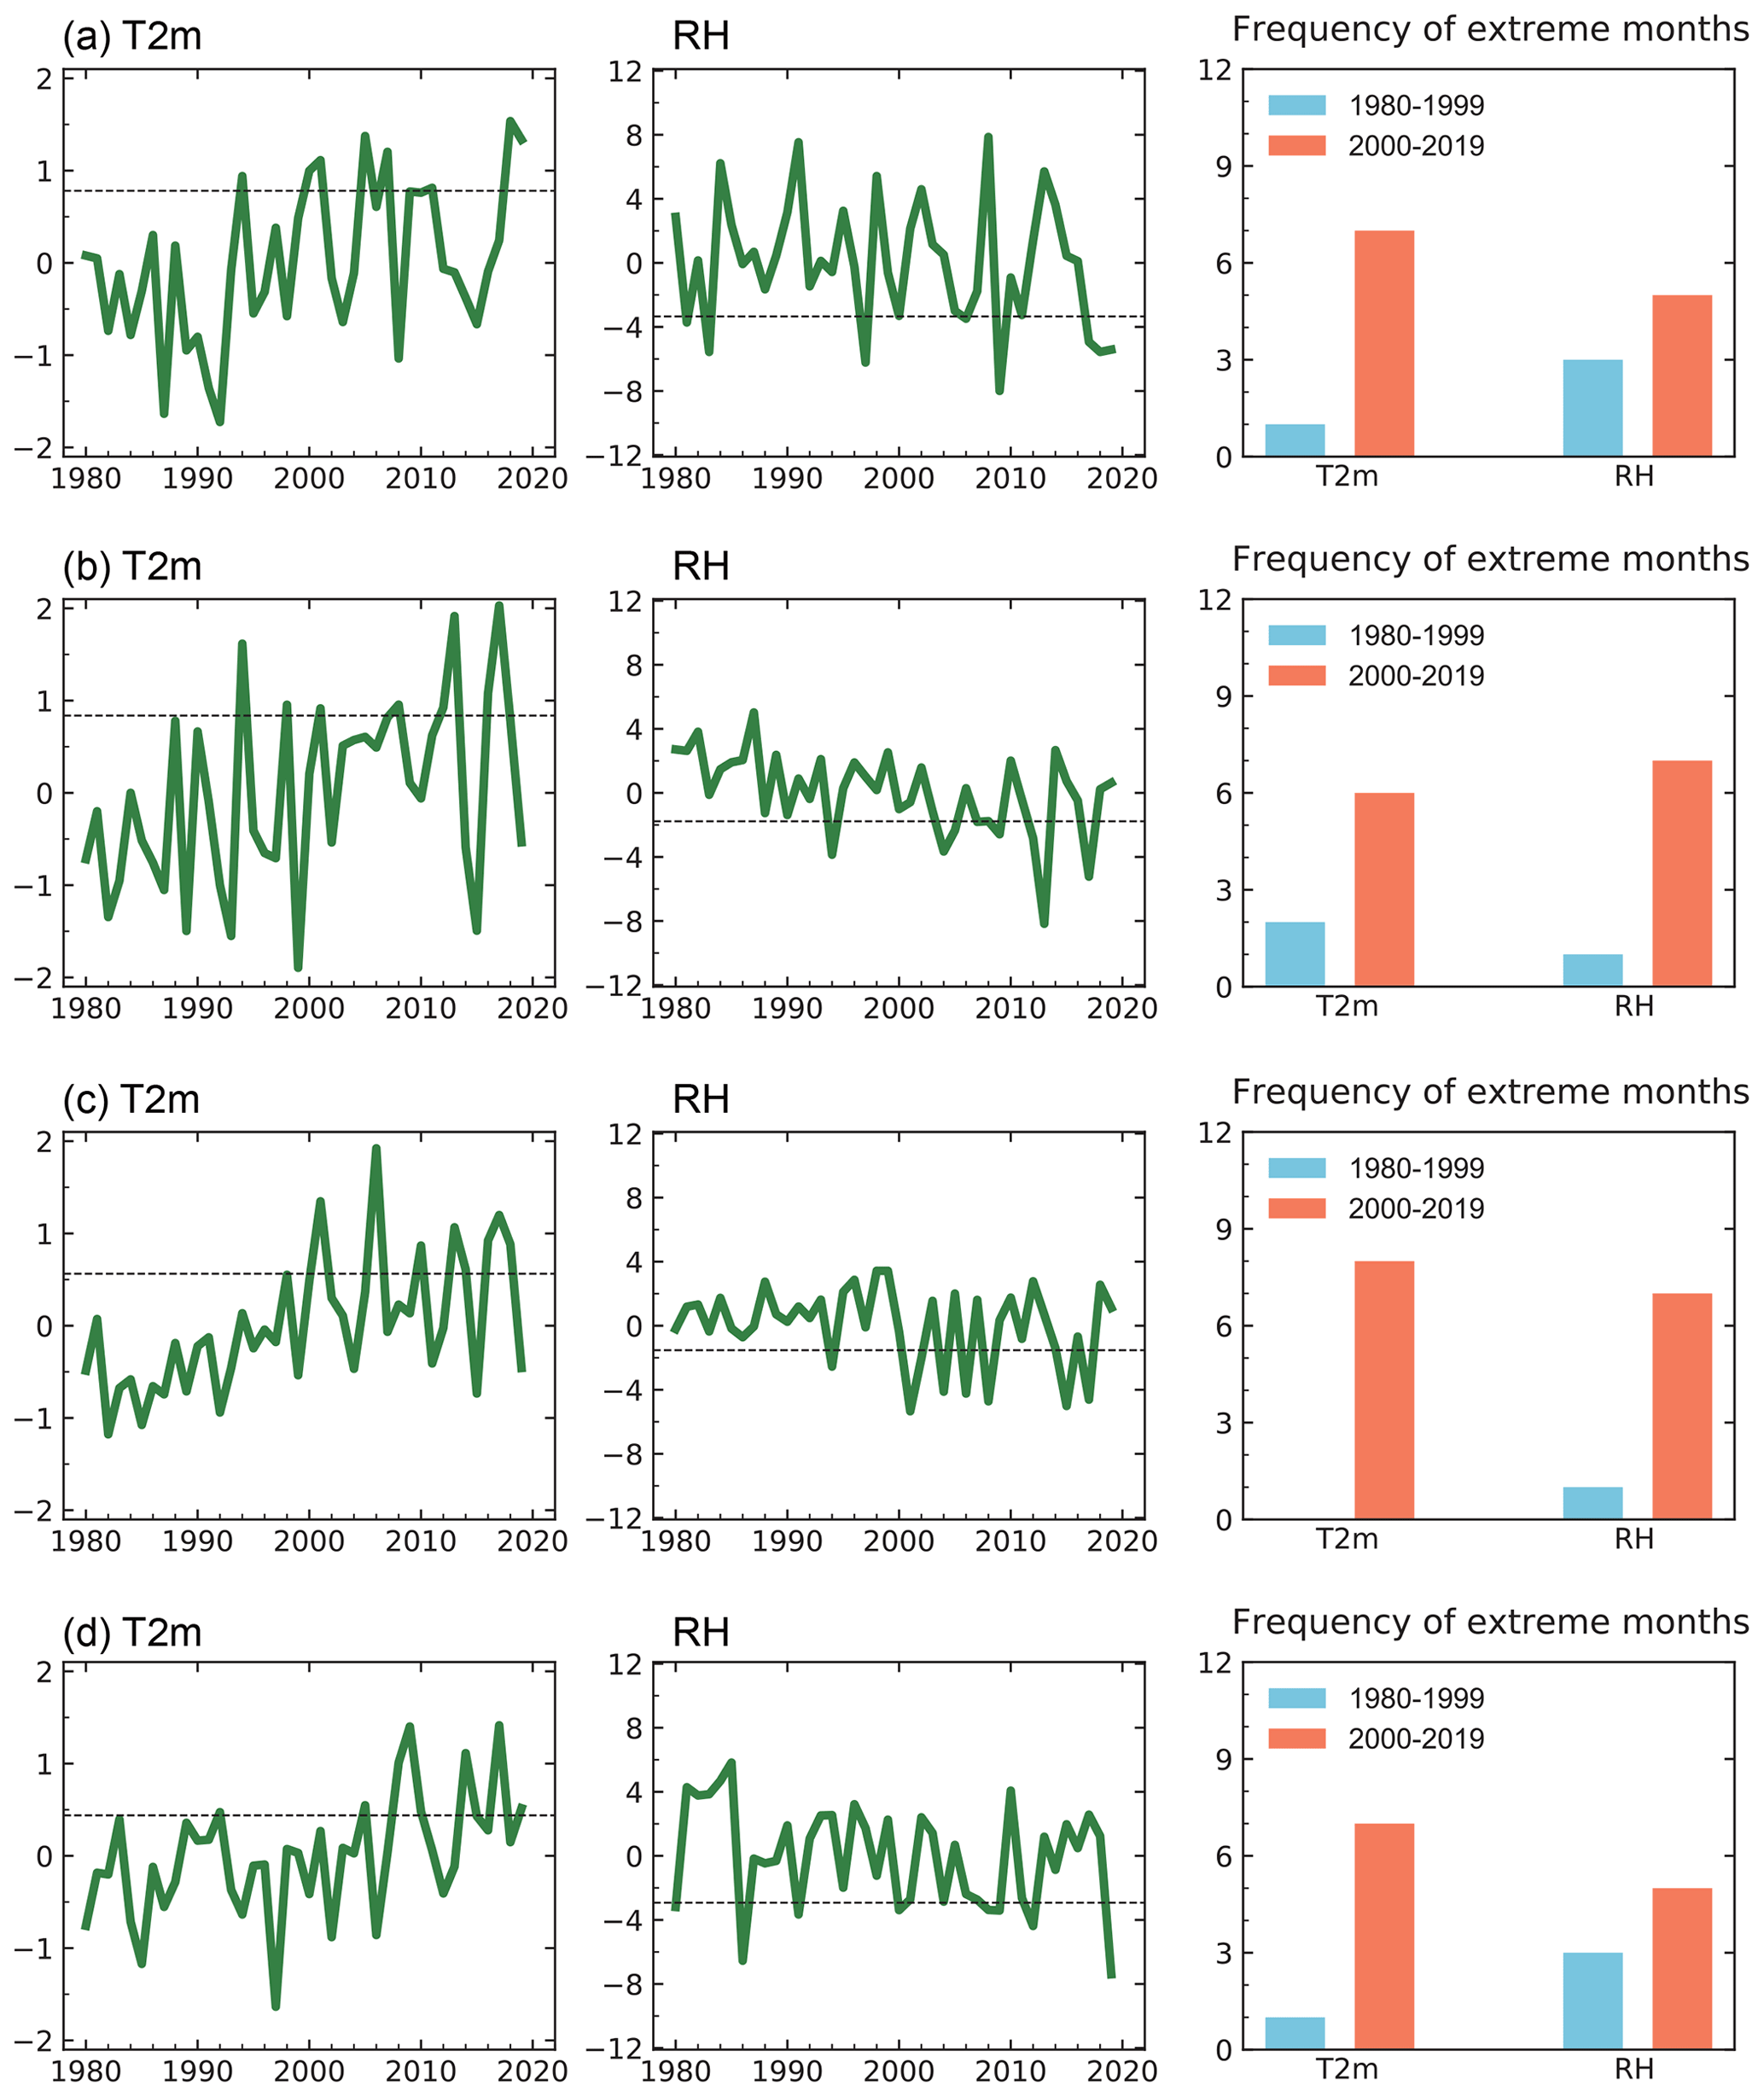
Figure 7Time series of anomalies of T2m (K; left) and surface RH (%; middle) over the (a) NCP (38–44∘ N, 115–120∘ E), (b) YRD (28–32∘ N, 120–125∘ E), (c) SCB (30–32∘ N, 102.5–105∘ E), and (d) PRD (22–26∘ N, 110–115∘ E) in the most polluted months during 1980–2019. The dotted lines mark the 80th percentile of the distributions for T2m and 20th percentile for RH. The bar charts (right) represent the frequency of T2m above the 80th percentile and RH anomalies below the 20th percentile during 1980–1999 (blue) and 2000–2019 (orange).
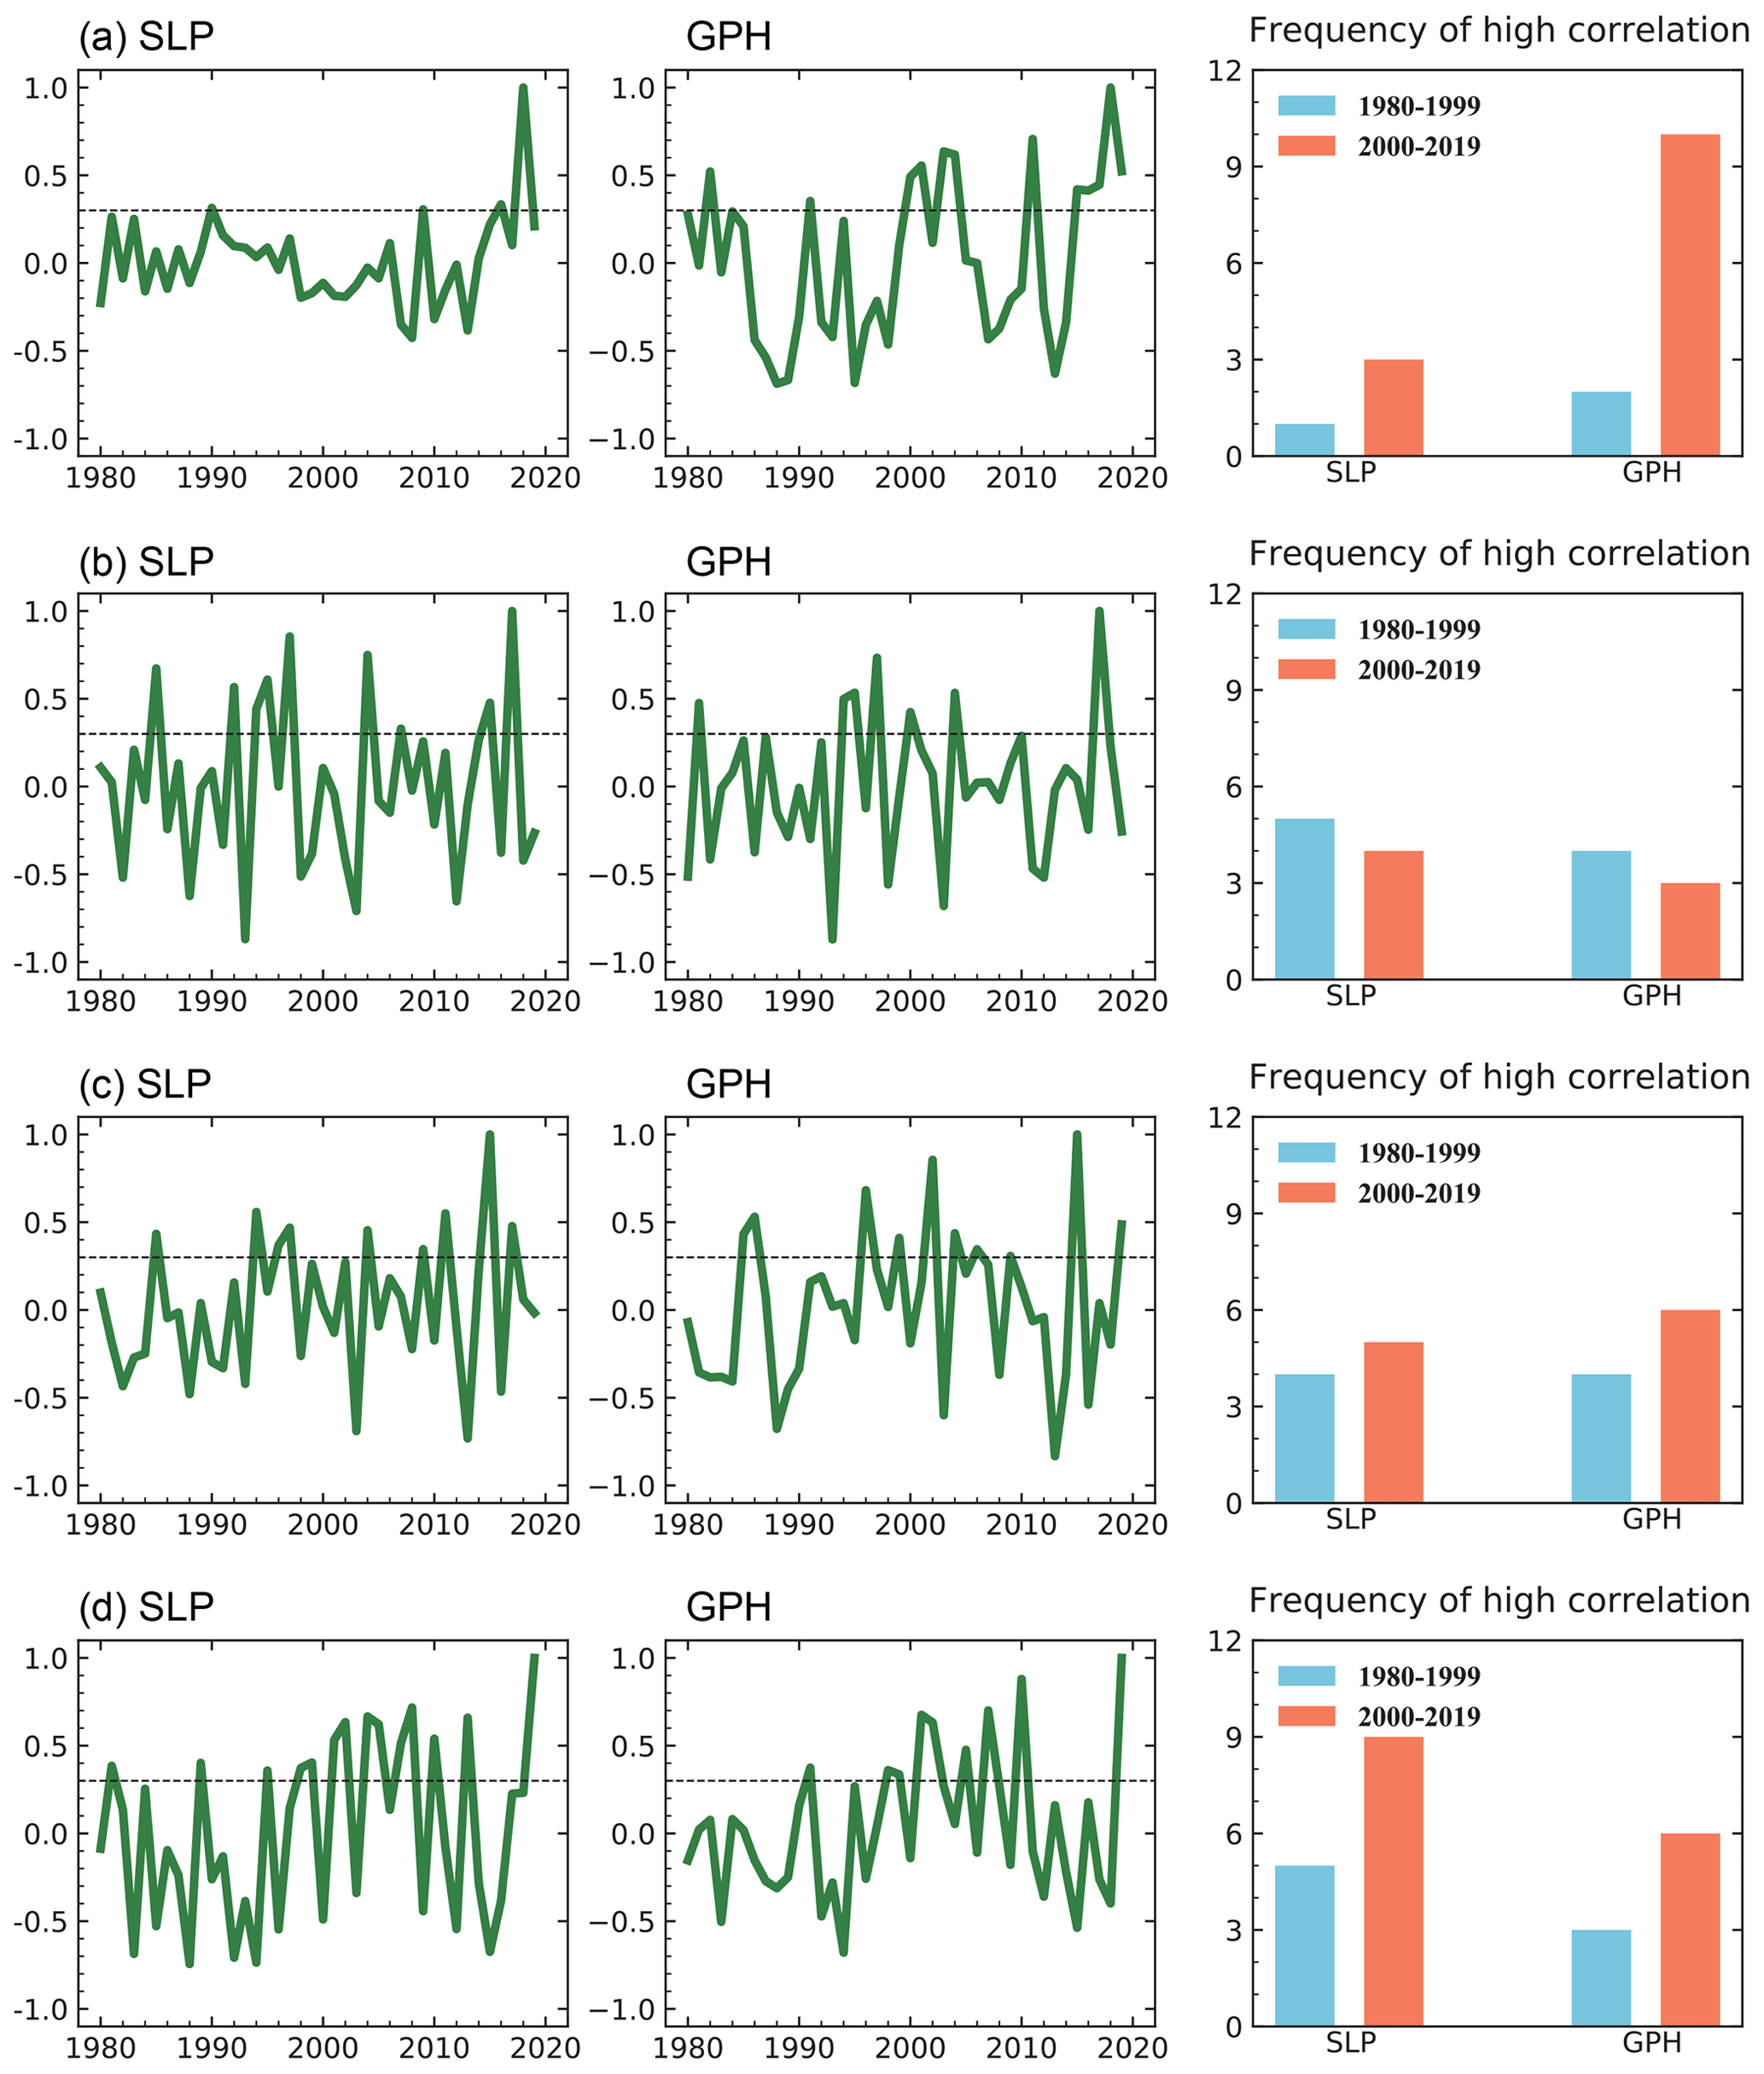
Figure 8Time series of spatial correlation in SLP (left) and 500 hPa GPH (middle) anomalies over East Asia and the western Pacific (EAWP; 20–60∘ N, 90–160∘ E) in June 2018 (a), July 2017 (b), July 2015 (c), and September 2019 (d) and those in the same target month of each year during 1980–2019. The dotted lines mark the correlation coefficient of +0.3, which is used as a threshold to define moderate to high correlation. The bar chart (right) represents the frequency of SLP and 500 hPa GPH anomalies in the same months during 1980–1999 (blue) and 2000–2019 (orange) that have moderate to high correlation (> 0.3) with those in June 2018, July 2017, July 2015, and September 2019.
3.3 Historical and future changes in the meteorological conditions
O3 pollution has deteriorated in China during recent decades, which could be related to the changes in meteorological conditions. Time series of T2m and RH anomalies in the polluted months during 1980–2019 and frequencies of high-T2m and low-RH months during 1980–1999 and 2000–2019 over the four polluted regions in China based on ERA5 reanalysis data are shown in Fig. 7. Due to climate change, both the high-temperature and low-RH conditions in the NCP, YRD, SCB, and PRD all increased during the past 4 decades (2000–2019 versus 1980–1999). Based on the analysis showing that chemical production is the dominant process of the most severe O3 pollution in the NCP and YRD, the increases in the frequency of high temperature and low RH indicate that severe O3 pollution in both the NCP and YRD has become more frequent under historical climate change. In the SCB and PRD, the most severe O3 pollution is more related to changes in regional transport. Similar to the method of analysis used in previous studies (Li et al., 2018; Yang et al., 2021), it was found that the SLP and 500 hPa GPH over East Asia and the western Pacific in the same month of each year, similar to those during the most severe months in both the SCB and PRD, have increased (2000–2019 versus 1980–1999) (Fig. 8), together with the more frequent hot and dry conditions (Fig. 7), leading to the increases in severe O3 pollution in the SCB and PRD during 1980–2019.
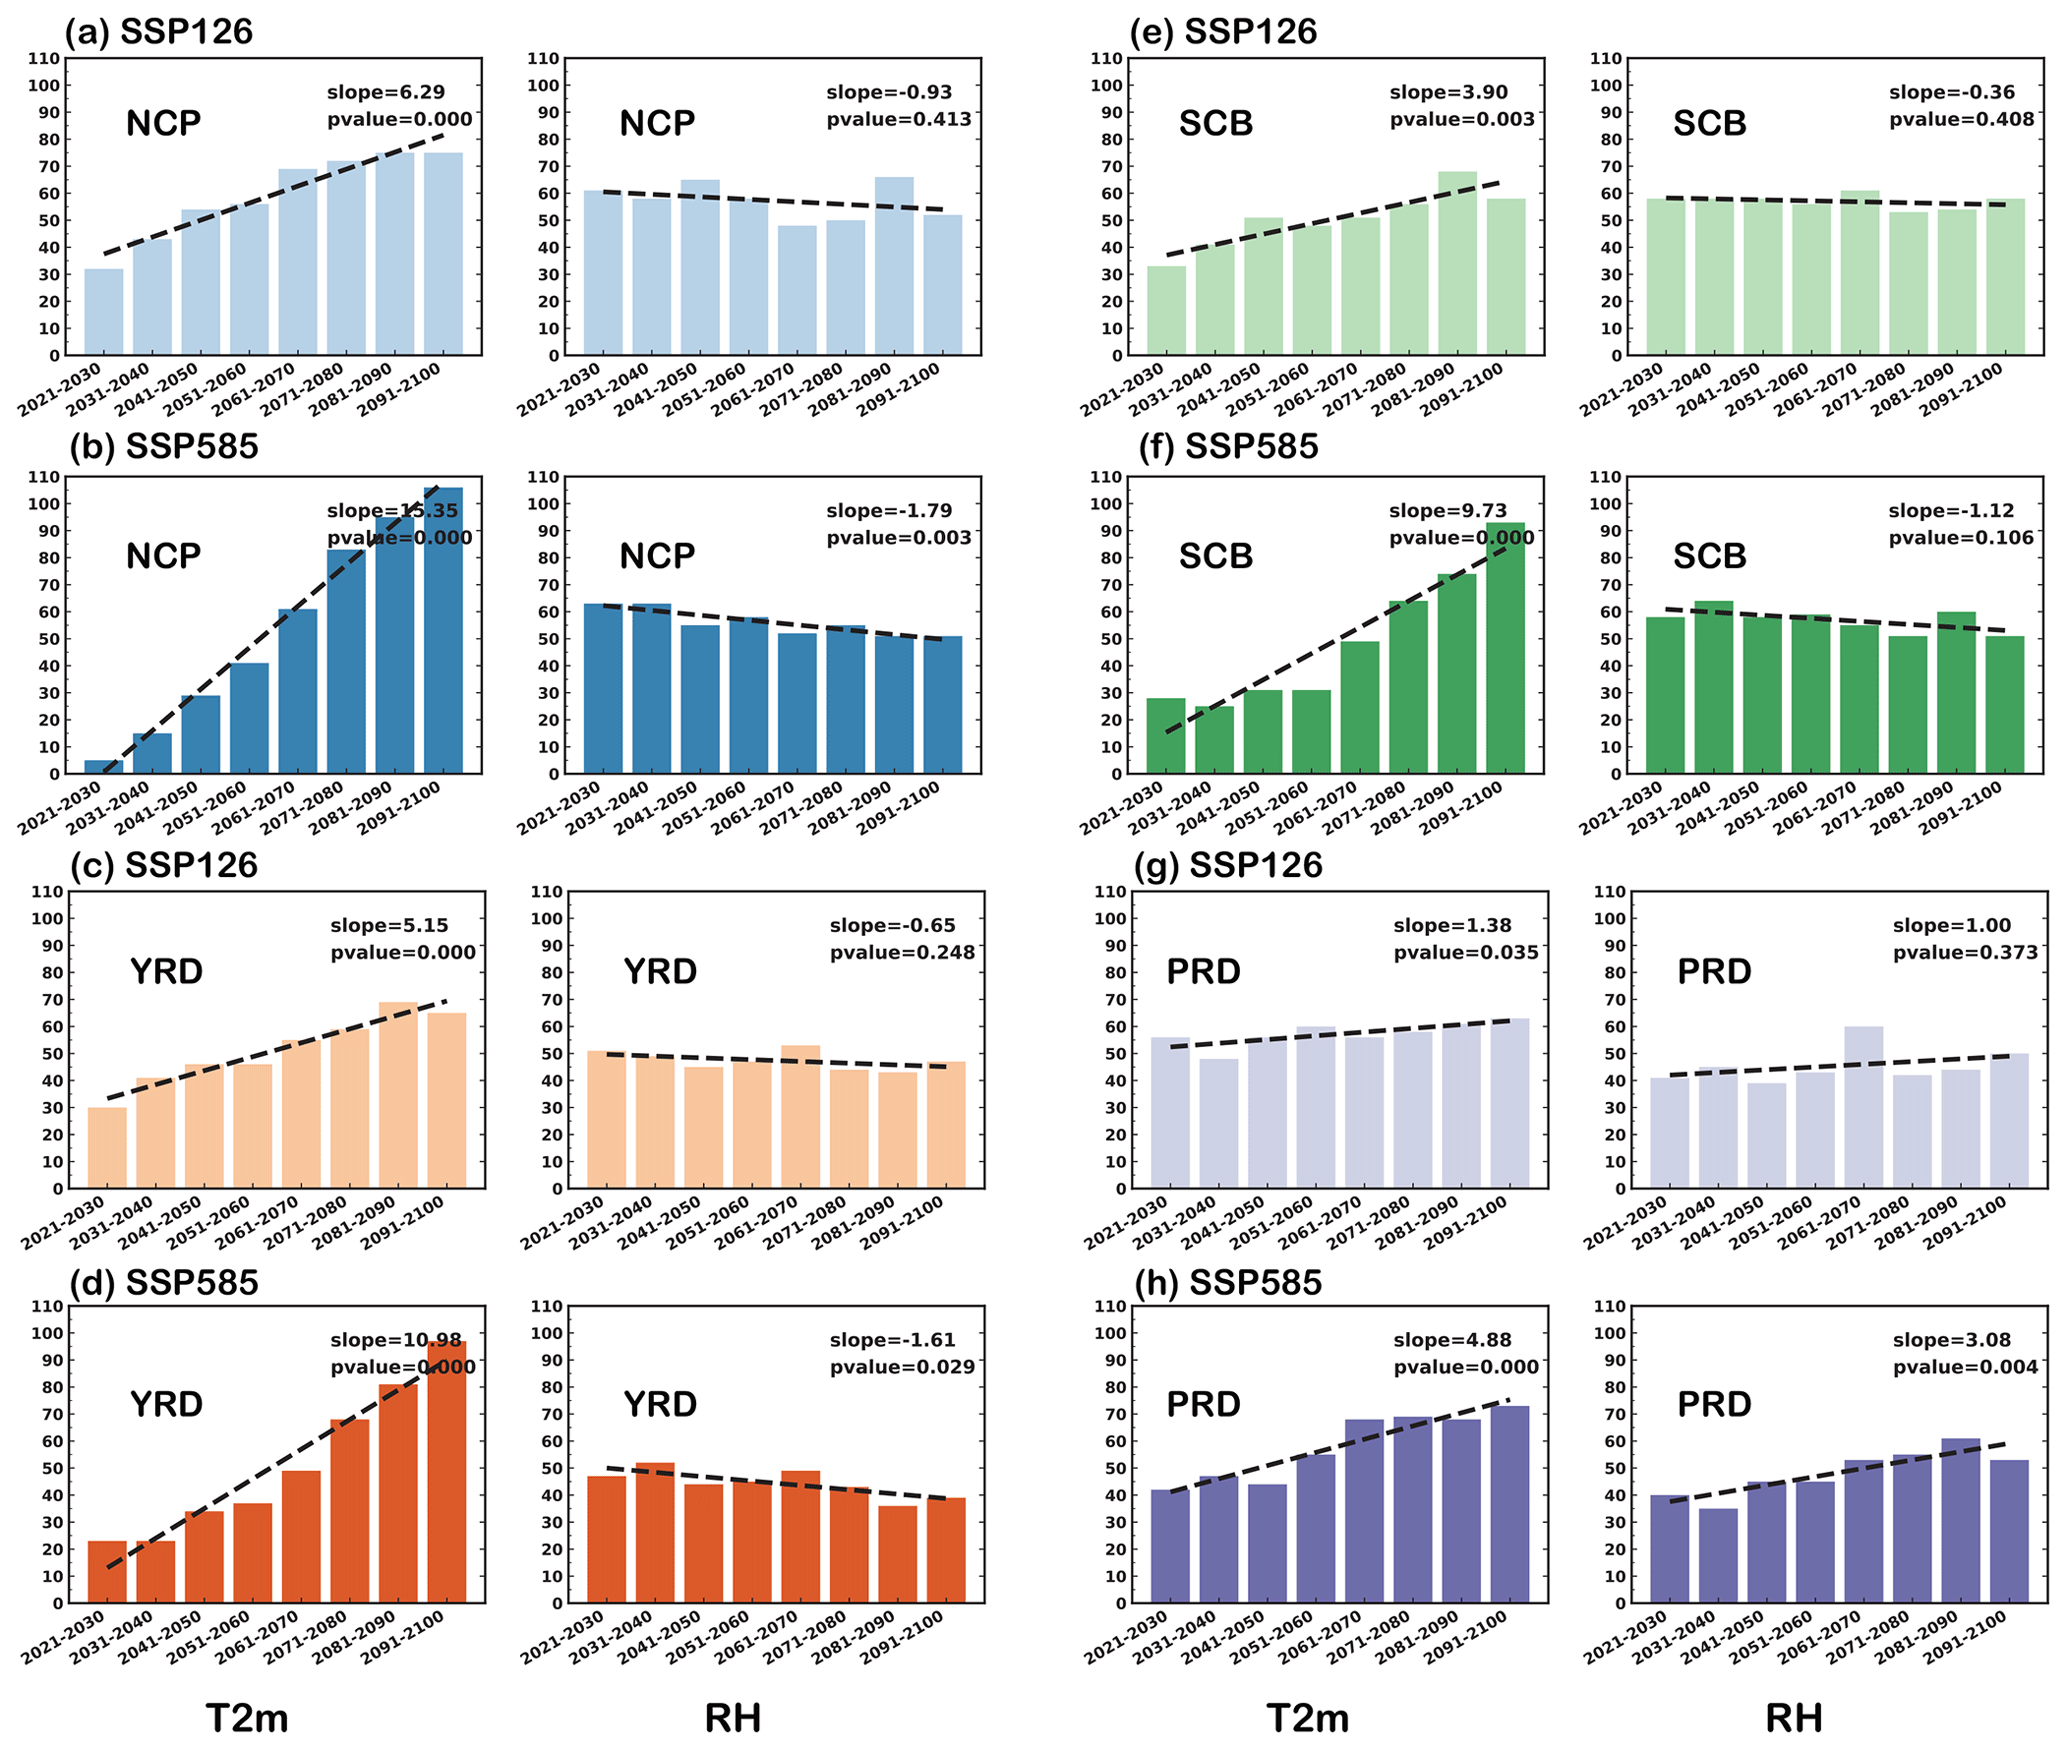
Figure 9Frequencies of extreme months with T2m or RH anomalies exceeding the 80th percentile or below the 20th percentile of the distributions over the NCP (38–44∘ N, 115–120∘ E) (a, b), YRD (28–32∘ N, 120–125∘ E) (c, d), SCB (30–32∘ N, 102.5–105∘ E) (e, f), and PRD (22–26∘ N, 110–115∘ E) (g, h) in each 10-year interval during 2021–2100 under two SSP future scenarios of 13 CMIP6 models. The two SSPs are SSP1-2.6 and SSP5-8.5. The slope and p values of the linear regression during 2021–2100 are shown in the upper right of each panel.
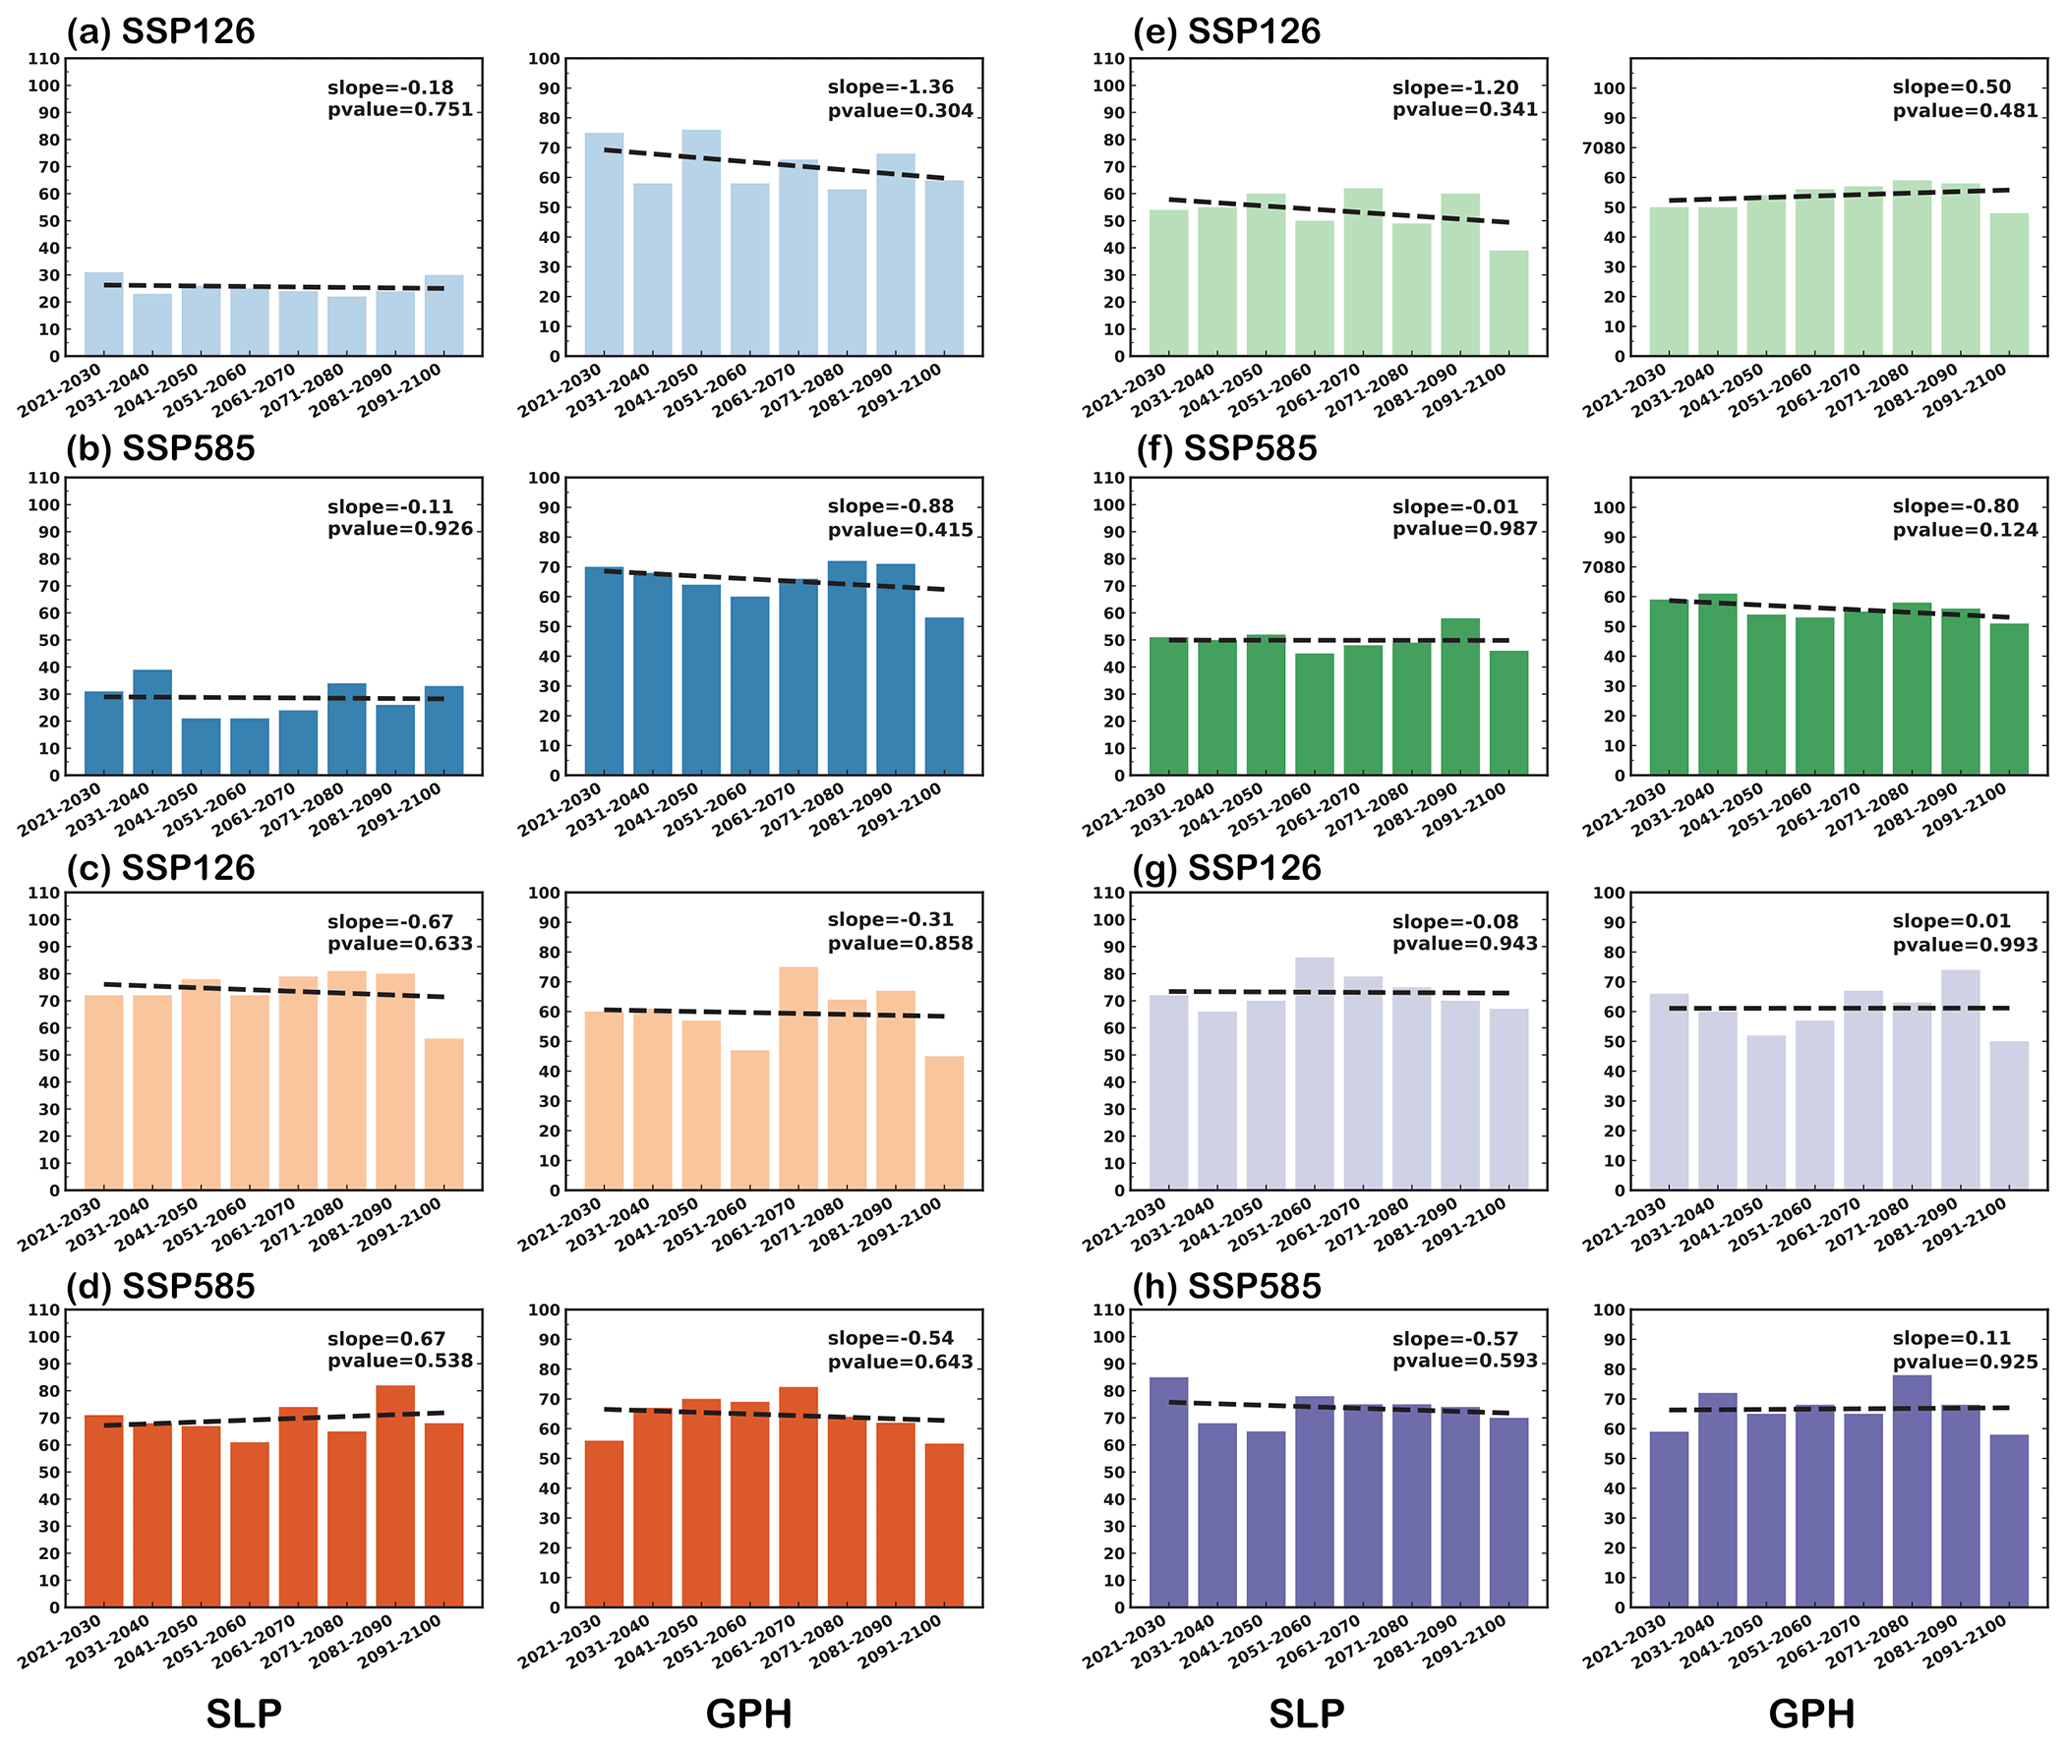
Figure 10Frequencies of extreme months with SLP and 500 hPa GPH that have moderate to high correlation (> 0.3) to those in June 2018 (a, b), July 2017 (c, d), July 2015 (e, f), and September 2019 (g, h) in each 10-year interval during 2021–2100 under two SSP future scenarios of 13 CMIP6 models. The two SSPs are SSP1-2.6 and SSP5-8.5. The slope and p values of the linear regression during 2021–2100 are shown in the upper right of each panel. The linear trends of SLP and GPH in each model grid were removed before the correlation coefficient was calculated.
Many studies have reported that future climate change will have significant influences on O3 pollution in China through changing meteorological factors (e.g., Li et al., 2023; Wang et al., 2022). Here, the frequencies of extreme months with high T2m and low RH and the frequencies of extreme months with SLP and 500 hPa GPH that have moderate to high correlation to those in the most polluted months in the four regions of China, under the sustainable (SSP1-2.6) and high-forcing (SSP5-8.5) scenarios during 2021–2100 from CMIP6 multi-model results, are presented in Figs. 9 and 10, respectively. Unlike the historical changes in the meteorological conditions that caused the severe O3 pollution through chemical production and regional transport, future variations in meteorological conditions conducive to the severe O3 pollution are more related to the global warming process that enhances the O3 production in China. The frequencies of months with anomalous high temperature show obvious upward trends in both SSP1-2.6 and SSP5-8.5 scenarios over the four regions, and the increasing trends in SSP5-8.5 are much more significant than in SSP1-2.6. Frequencies of low-RH months show downward trends in the NCP, YRD, and SCB, especially under SSP5-8.5, while there is an upward trend in the PRD. Note that the trends in frequencies of low-RH months are much less significant than in high-temperature months. The frequencies of extreme months with SLP and 500 hPa GPH that are similar to those in the most severe O3 pollution months in the four regions do not show significant trends in the SSPs. Hence, future climate change may aggregate O3 pollution in China by enhancing the chemical production related to temperature increases. The O3 pollution exacerbation is projected to be less significant in the sustainable scenario due to the more moderate temperature increase than in the high-forcing scenario, suggesting that the sustainable scenario is the optimal path to retaining clean air in China. High anthropogenic radiative forcing will not only lead to slow economic growth and climate warming but also result in the environmental pollution.
O3 pollution harms ecosystems and human health. In recent years, near-surface O3 concentrations in many regions of China have been increasing considerably. Based on observational O3 data, ERA5 reanalysis data, and GEOS-Chem model simulations, meteorological characteristics conducive to extreme O3 pollution in different regions of China are investigated in this study. Contributions from various chemical and physical processes inducing O3 pollution are quantified using the IPR analysis method. Furthermore, historical changes and future trends of meteorological conditions leading to severe O3 pollution in China are explored based on the meteorological reanalysis and CMIP6 multi-model future predictions, which is of great implication for the mitigation and prevention of O3 pollution over China.
In this study, June 2018, July 2017, July 2015, and September 2019 are identified as the most severe O3 pollution months influenced by meteorological factors over the NCP, YRD, SCB, and PRD, respectively. Severe O3 pollution in June 2018 over the NCP and in July 2017 over YRD is mainly due to enhanced chemical production related to hot and dry conditions. The chemical production of O3 in the most severe months over the NCP and YRD is 2.36 and 2.38 Gg d−1, respectively, higher than the climatological averages. Different from the NCP and YRD, regional transport is the main process leading to the high O3 concentration in the SCB and PRD during the respective severely polluted months, which contributes to the rate of increase in O3 mass by 5.10 and 6.67 Gg d−1, respectively, over the SCB and PRD. During the most severe months, related to large-scale circulation patterns, anomalous northerly winds transport more O3 into the SCB from north, and anomalous northeasterly winds enhance the O3 transport from the north and east into the PRD.
Over the last 4 decades (2000–2019 versus 1980–1999), the frequencies of high temperature and low RH increased, indicating that O3 pollution in both the NCP and YRD has become more frequent under historical climate change. In the SCB and PRD, the occurrence of atmospheric circulation patterns similar to those during the most polluted months in both the SCB and PRD has increased, together with the more frequent hot and dry conditions, leading to the increases in severe O3 pollution in the SCB and PRD during 1980–2019. In the future (by 2100), the frequencies of months with anomalous high temperature show obvious upward trends in both sustainable (SSP1-2.6) and high-forcing (SSP5-8.5) scenarios over the four regions, and the increasing trends in SSP5-8.5 are much more significant than in SSP1-2.6. This suggests that high anthropogenic radiative forcing will not only lead to slow economic growth and climate warming but also likely result in environmental pollution issues. The sustainable scenario is the optimal path to retaining clean air in China.
There are some limitations and uncertainties in this work that can be further addressed in future studies. For example, the model only captures the high O3 concentrations in July 2015 in Chengdu among its top-3 polluted months. It is probably because the emissions are kept at 2017 levels during the simulations. The high O3 anomalies in July 2016 and July 2018 are more likely influenced by the interannual changes in local precursor emissions in the background of country-level increases in O3 concentration in recent years. However, we also can not rule out the possible inaccuracy in the model simulations to interpret severe O3 pollution events in the SCB, which deserves further investigation with multi-model simulations. In addition, this study focuses on the most extreme O3 pollution in several polluted areas of China. However, many other meteorological conditions can also cause O3 pollution, although they may not be as extreme as the cases analyzed in this study, which requires comprehensive analysis for individual regions in future studies. Although the historical changes in the meteorological patterns causing severe O3 pollution are in accordance with the elevated O3 levels in China in the recent decade, the quantitative analysis of meteorological impacts needs full consideration of factors leading to O3 pollution, including changes in anthropogenic and natural emissions of its precursors, O3 chemical regime, other meteorological factors conducive to O3 pollution, and stratosphere–troposphere exchange.
The GEOS-Chem model is available at https://zenodo.org/record/3974569#.YTD81NMzagR (last access: June 2023, The International GEOS-Chem User Community, 2020). O3 observations over China can be obtained at https://quotsoft.net/air (last access: June 2023). ERA5 reanalysis data can be downloaded at https://cds.climate.copernicus.eu/cdsapp#!/dataset/reanalysis-era5-pressure-levels-monthly-means?tab=overview (last access: June 2023, Hersbach et al., 2023). The multi-model simulations of the Coupled Model Intercomparison Project Phase 6 (CMIP6) are from https://aims2.llnl.gov/search (last access: June 2023).
YY designed the research, and YY and YZ performed simulations and analyzed the data. All authors including HW, HL, ML, PW, XY, KL and HL discussed the results and wrote the paper.
At least one of the (co-)authors is a member of the editorial board of Atmospheric Chemistry and Physics. The peer-review process was guided by an independent editor, and the authors also have no other competing interests to declare.
Publisher’s note: Copernicus Publications remains neutral with regard to jurisdictional claims made in the text, published maps, institutional affiliations, or any other geographical representation in this paper. While Copernicus Publications makes every effort to include appropriate place names, the final responsibility lies with the authors.
Hailong Wang acknowledges the support by the US Department of Energy (DOE), Office of Science, Office of Biological and Environmental Research (BER), as part of the Earth and Environmental System Modeling program. The Pacific Northwest National Laboratory (PNNL) is operated for DOE by the Battelle Memorial Institute under contract DE-AC05-76RLO1830.
This study was supported by the National Natural Science Foundation of China (grant no. 42293323), the National Key Research and Development Program of China (grant no. 2020YFA0607803), the Jiangsu Science Fund for Distinguished Young Scholars (grant no. BK20211541), the Jiangsu Science Fund for Carbon Neutrality (grant no. BK20220031), and the Graduate Research Innovation Project in Jiangsu province (grant no. KYCX23_1380).
This paper was edited by Amos Tai and reviewed by three anonymous referees.
Ainsworth, E. A., Yendrek, C. R., Sitch, S., Collins, W. J., and Emberson, L. D.: The Effects of Tropospheric Ozone on Net Primary Productivity and Implications for Climate Change, Annu. Rev. Plant Biol., 63, 637–661, https://doi.org/10.1146/annurev-arplant-042110-103829, 2012.
Cheng, N., Li, R., Xu, C., Chen, Z., Chen, D., Meng, F., Cheng, B., Ma, Z., Zhuang, Y., He, B., and Gao, B.: Ground ozone variations at an urban and a rural station in Beijing from 2006 to 2017: trend, meteorological influences and formation regimes, J. Clean. Prod., 235, 11–20, https://doi.org/10.1016/j.jclepro.2019.06.204, 2019.
Coates, J., Mar, K. A., Ojha, N., and Butler, T. M.: The influence of temperature on ozone production under varying NOx conditions – a modelling study, Atmos. Chem. Phys., 16, 11601–11615, https://doi.org/10.5194/acp-16-11601-2016, 2016.
Dang, R., Liao, H., and Fu, Y.: Quantifying the anthropogenic and meteorological influences on summertime surface ozone in China over 2012–2017, Sci. Total Environ., 754, 142394, https://doi.org/10.1016/j.scitotenv.2020.142394, 2021.
Dong, Y., Li, J., Guo, J., Jiang, Z., Chu, Y., Chang, L., Yang, Y., and Liao, H.: The impact of synoptic patterns on summertime ozone pollution in the North China Plain, Sci. Total Environ., 735, 139559, https://doi.org/10.1016/j.scitotenv.2020.139559, 2020.
Ebi, K. L. and McGregor, G.: Climate change, tropospheric O3 and particulate matter, and health impacts, Environ. Health Perspect., 116, 1449–1455, https://doi.org/10.1289/ehp.11463, 2008.
Finlayson-Pitts, B. J. and Pitts, J. N.: Tropospheric air pollution: Ozone, airborne toxics, polycyclic aromatic hydrocarbons, and particles, Science, 276, 1045–1052, https://doi.org/10.1126/science.276.5315.1045, 1997.
Fleming, Z. L., Doherty, R. M., Von Schneidemesser, E., Malley, C. S., Cooper, O. R., Pinto, J. P., Colette, A., Xu, X. B., Simpson, D., Schultz, M. G., Lefohn, A. S., Hamad, S., Moolla, R., Solberg, S., and Feng, Z. Z.: Tropospheric Ozone Assessment Report: Present-day ozone distribution and trends relevant to human health, Elementa, 6, 12, https://doi.org/10.1525/elementa.273, 2018.
Fu, T.-M. and Tian, H.: Climate change penalty to ozone air quality: Review of current understandings and knowledge gaps, Curr. Pollut. Rep., 5, 159–171, https://doi.org/10.1007/s40726-019-00115-6, 2019.
Guenther, A. B., Jiang, X., Heald, C. L., Sakulyanontvittaya, T., Duhl, T., Emmons, L. K., and Wang, X.: The Model of Emissions of Gases and Aerosols from Nature version 2.1 (MEGAN2.1): an extended and updated framework for modeling biogenic emissions, Geosci. Model Dev., 5, 1471–1492, https://doi.org/10.5194/gmd-5-1471-2012, 2012.
Gong, C. and Liao, H.: A typical weather pattern for ozone pollution events in North China, Atmos. Chem. Phys., 19, 13725–13740, https://doi.org/10.5194/acp-19-13725-2019, 2019.
Han, H., Liu, J., Shu, L., Wang, T. J., and Yuan, H.: Local and synoptic meteorological influences on daily variability in summertime surface ozone in eastern China, Atmos. Chem. Phys., 20, 203–222, https://doi.org/10.5194/acp-20-203-2020, 2020.
Hersbach, H., Bell, B., Berrisford, P., Biavati, G., Horányi, A., Muñoz Sabater, J., Nicolas, J., Peubey, C., Radu, R., Rozum, I., Schepers, D., Simmons, A., Soci, C., Dee, D., and Thépaut, J.-N.: ERA5 monthly averaged data on pressure levels from 1940 to present, Copernicus Climate Change Service (C3S) Climate Data Store (CDS) [data set], https://doi.org/10.24381/cds.6860a573, 2023.
Hoesly, R. M., Smith, S. J., Feng, L., Klimont, Z., Janssens-Maenhout, G., Pitkanen, T., Seibert, J. J., Vu, L., Andres, R. J., Bolt, R. M., Bond, T. C., Dawidowski, L., Kholod, N., Kurokawa, J. I., Li, M., Liu, L., Lu, Z., Moura, M. C. P., O'Rourke, P. R., and Zhang, Q.: Historical (1750–2014) anthropogenic emissions of reactive gases and aerosols from the Community Emissions Data System (CEDS), Geosci. Model Dev., 11, 369–408, https://doi.org/10.5194/gmd-11-369-2018, 2018.
Hudman, R. C., Moore, N. E., Mebust, A. K., Martin, R. V., Russell, A. R., Valin, L. C., and Cohen, R. C.: Steps towards a mechanistic model of global soil nitric oxide emissions: implementation and space based-constraints, Atmos. Chem. Phys., 12, 7779–7795, https://doi.org/10.5194/acp-12-7779-2012, 2012.
Jiang, Z., Li, J., Lu, X., Gong, C., Zhang, L., and Liao, H.: Impact of western Pacific subtropical high on ozone pollution over eastern China, Atmos. Chem. Phys., 21, 2601–2613, https://doi.org/10.5194/acp-21-2601-2021, 2021.
Le, T., Wang, Y., Liu, L., Yang, J., Yung, Y., Li, G., and Seinfeld, J. H.: Unexpected air pollution with marked emission reductions during the COVID-19 outbreak in China, Science, 369, 702–706, https://doi.org/10.1126/science.abb7431, 2020.
Li, H., Yang, Y., Jin, J., Wang, H., Li, K., Wang, P., and Liao, H.: Climate-driven deterioration of future ozone pollution in Asia predicted by machine learning with multi-source data, Atmos. Chem. Phys., 23, 1131–1145, https://doi.org/10.5194/acp-23-1131-2023, 2023.
Li, K., Liao, H., Cai, W., and Yang, Y.: Attribution of anthropogenic influence on atmospheric patterns conducive to recent most severe haze over eastern China, Geophys. Res. Lett., 45, 2072–2081, https://doi.org/10.1002/2017gl076570, 2018.
Li, K., Jacob, D. J., Liao, H., Shen, L., Zhang, Q., and Bates, K. H.: Anthropogenic drivers of 2013–2017 trends in summer surface ozone in China, P. Natl. Acad. Sci. USA, 116, 422–427, https://doi.org/10.1073/pnas.1812168116, 2019.
Li, K., Jacob, D. J., Shen, L., Lu, X., De Smedt, I., and Liao, H.: Increases in surface ozone pollution in China from 2013 to 2019: anthropogenic and meteorological influences, Atmos. Chem. Phys., 20, 11423–11433, https://doi.org/10.5194/acp-20-11423-2020, 2020.
Lin, J.-T. and McElroy, M. B.: Impacts of boundary layer mixing on pollutant vertical profiles in the lower troposphere: Implications to satellite remote sensing, Atmos. Environ., 44, 1726–1739, https://doi.org/10.1016/j.atmosenv.2010.02.009, 2010.
Liu, H., Liu, S., Xue, B., Lv, Z., Meng, Z., Yang, X., Xue, T., Yu, Q., and He, K.: Ground-level ozone pollution and its health impacts in China, Atmos. Environ., 173, 223–230, https://doi.org/10.1016/j.atmosenv.2017.11.014, 2018.
Liu, Y. and Wang, T.: Worsening urban ozone pollution in China from 2013 to 2017 – Part 1: The complex and varying roles of meteorology, Atmos. Chem. Phys., 20, 6305–6321, https://doi.org/10.5194/acp-20-6305-2020, 2020.
Lu, X., Hong, J., Zhang, L., Cooper, O. R., Schultz, M. G., Xu, X., Wang, T., Gao, M., Zhao, Y., and Zhang, Y.: Severe Surface Ozone Pollution in China: A Global Perspective, Environ. Sci. Tech. Let., 5, 487–494, https://doi.org/10.1021/acs.estlett.8b00366, 2018.
Lu, X., Zhang, L., Chen, Y., Zhou, M., Zheng, B., Li, K., Liu, Y., Lin, J., Fu, T.-M., and Zhang, Q.: Exploring 2016–2017 surface ozone pollution over China: source contributions and meteorological influences, Atmos. Chem. Phys., 19, 8339–8361, https://doi.org/10.5194/acp-19-8339-2019, 2019.
Lu, X., Zhang, L., Wang, X., Gao, M., Li, K., Zhang, Y., Yue, X., and Zhang, Y.: Rapid increases in warm-season surface ozone and resulting health impact over China since 2013, Environ. Sci. Tech. Let., 7, 240–247, https://doi.org/10.1021/acs.estlett.0c00171, 2020.
Maji, K. J., Ye, W.-F., Arora, M., and Nagendra, S. M. S.: Ozone pollution in Chinese cities: Assessment of seasonal variation, health effects and economic burden, Environ. Pollut., 247, 792–801, https://doi.org/10.1016/j.envpol.2019.01.049, 2019.
Mao, J., Paulot, F., Jacob, D. J., Cohen, R. C., Crounse, J. D., Wennberg, P. O., Keller, C. A., Hudman, R. C., Barkley, M. P., and Horowitz, L. W.: Ozone and organic nitrates over the eastern United States: Sensitivity to isoprene chemistry, J. Geophys. Res.-Atmos., 118, 11256–11268, https://doi.org/10.1002/jgrd.50817, 2013.
McLinden, C. A., Olsen, S. C., Hannegan, B., Wild, O., Prather, M. J., and Sundet, J.: Stratospheric ozone in 3-D models: A simple chemistry and the cross-tropopause flux, J. Geophys. Res., 105, 14653–14665, https://doi.org/10.1029/2000jd900124, 2000.
Mills, G., Sharps, K., Simpson, D., Pleijel, H., Broberg, M., Uddling, J., Jaramillo, F., Davies, W. J., Dentener, F., Van den Berg, M., Agrawal, M., Agrawal, S. B., Ainsworth, E. A., Buker, P., Emberson, L., Feng, Z., Harmens, H., Hayes, F., Kobayashi, K., Paoletti, E., and Van Dingenen, R.: Ozone pollution will compromise efforts to increase global wheat production, Glob. Change Biol., 24, 3560–3574, https://doi.org/10.1111/gcb.14157, 2018.
Mott, J. A., Mannino, D. M., Alverson, C. J., Kiyu, A., Hashim, J., Lee, T., Falter, K., and Redd, S. C.: Cardiorespiratory hospitalizations associated with smoke exposure during the 1997 southeast Asian forest fires, Int. J. Hyg. Envir. Heal., 208, 75–85, https://doi.org/10.1016/j.ijheh.2005.01.018, 2005.
Ni, R., Lin, J., Yan, Y., and Lin, W.: Foreign and domestic contributions to springtime ozone over China, Atmos. Chem. Phys., 18, 11447–11469, https://doi.org/10.5194/acp-18-11447-2018, 2018.
Ott, L. E., Pickering, K. E., Stenchikov, G. L., Allen, D. J., DeCaria, A. J., Ridley, B., Lin, R.-F., Lang, S., and Tao, W.-K.: Production of lightning NOx and its vertical distribution calculated from three-dimensional cloud-scale chemical transport model simulations, J. Geophys. Res., 115, D04301, https://doi.org/10.1029/2009JD011880, 2010.
Peterson, J. T. and Flowers, E. C.: Interactions between air pollution and solar radiation, Sol. Energy, 19, 23–32, https://doi.org/10.1016/0038-092X(77)90085-8, 1977.
Pye, H. O., Liao, H., Wu, S., Mickley, L. J., Jacob, D. J., Henze, D. K., and Seinfeld, J. H.: Effect of changes in climate and emissions on future sulfate-nitrate-mmonium aerosol levels in the United States, J. Geophys. Res., 114, D01205, https://doi.org/10.1029/2008JD010701, 2009.
Sherwen, T., Schmidt, J. A., Evans, M. J., Carpenter, L. J., Großmann, K., Eastham, S. D., Jacob, D. J., Dix, B., Koenig, T. K., Sinreich, R., Ortega, I., Volkamer, R., Saiz-Lopez, A., Prados-Roman, C., Mahajan, A. S., and Ordóñez, C.: Global impacts of tropospheric halogens (Cl, Br, I) on oxidants and composition in GEOS-Chem, Atmos. Chem. Phys., 16, 12239–12271, https://doi.org/10.5194/acp-16-12239-2016, 2016.
Shu, L., Wang, T., Han, H., Xie, M., Chen, P., Li, M., and Wu, H.: Summertime ozone pollution in the Yangtze River Delta of eastern China during 2013–2017: synoptic impacts and source apportionment, Environ. Pollut., 257, 113631, https://doi.org/10.1016/j.envpol.2019.113631, 2020
Sillman, S.: The relation between ozone, NOx and hydrocarbons in urban and polluted rural environments, Atmos. Environ., 33, 1821–1845, https://doi.org/10.1016/s1352-2310(98)00345-8, 1999.
Silver, B., Reddington, C. L., Arnold, S. R., and Spracklen, D. V.: Substantial changes in air pollution across China during 2015–2017, Environ. Res. Lett., 13, 114012, https://doi.org/10.1088/1748-9326/aae718, 2018.
The International GEOS-Chem User Community: geoschem/geos-chem: GEOS-Chem 12.9.3 (12.9.3), Zenodo [code], https://doi.org/10.5281/zenodo.3974569, 2020.
van der Werf, G. R., Randerson, J. T., Giglio, L., van Leeuwen, T. T., Chen, Y., Rogers, B. M., Mu, M., van Marle, M. J. E., Morton, D. C., Collatz, G. J., Yokelson, R. J., and Kasibhatla, P. S.: Global fire emissions estimates during 1997–2016, Earth Syst. Sci. Data, 9, 697–720, https://doi.org/10.5194/essd-9-697-2017, 2017.
Verstraeten, W. W., Neu, J. L., Williams, J. E., Bowman, K. W., Worden, J. R., and Boersma, K. F.: Rapid increases in tropospheric ozone production and export from China, Nat. Geosci., 8, 690–695, https://doi.org/10.1038/ngeo2493, 2015.
Wang, P., Yang, Y., Li, H., Chen, L., Dang, R., Xue, D., Li, B., Tang, J., Leung, L. R., and Liao, H.: North China Plain as a hot spot of ozone pollution exacerbated by extreme high temperatures, Atmos. Chem. Phys., 22, 4705–4719, https://doi.org/10.5194/acp-22-4705-2022, 2022.
Wang, T., Xue, L., Brimblecombe, P., Lam, Y. F., Li, L., and Zhang, L.: Ozone pollution in China: A review of concentrations, meteorological influences, chemical precursors, and effects, Sci. Total Environ., 575, 1582–1596, https://doi.org/10.1016/j.scitotenv.2016.10.081, 2017.
Xu, J., Ma, J. Z., Zhang, X. L., Xu, X. B., Xu, X. F., Lin, W. L., Wang, Y., Meng, W., and Ma, Z. Q.: Measurements of ozone and its precursors in Beijing during summertime: impact of urban plumes on ozone pollution in downwind rural areas, Atmos. Chem. Phys., 11, 12241–12252, https://doi.org/10.5194/acp-11-12241-2011, 2011.
Yang, Y., Liao, H., and Li, J.: Impacts of the East Asian summer monsoon on interannual variations of summertime surface-layer ozone concentrations over China, Atmos. Chem. Phys., 14, 6867–6880, http://https://doi.org/10.5194/acp-14-6867-2014, 2014.
Yang, Y., Zhou, Y., Li, K., Wang, H., Ren, L., Zeng, L., Li, H., Wang, P., Li, B., and Liao, H.: Atmospheric circulation patterns conducive to severe haze in eastern China have shifted under climate change, Geophys. Res. Lett., 48, e2021GL095011, https://doi.org/10.1029/2021GL095011, 2021.
Yang, Y., Li, M., Wang, H., Li, H., Wang, P., Li, K., Gao, M., and Liao, H.: ENSO modulation of summertime tropospheric ozone over China, Environ. Res. Lett., 17, 034020, https://doi.org/10.1088/1748-9326/ac54cd, 2022.
Yin, Z., Cao, B., and Wang, H.: Dominant patterns of summer ozone pollution in eastern China and associated atmospheric circulations, Atmos. Chem. Phys., 19, 13933–13943, https://doi.org/10.5194/acp-19-13933-2019, 2019.
Zhang, X., Zhao, L., Cheng, M., Wu, X., and Chen, D.: Urban ozone sink inferred from surface measurements in China, J. Clean. Prod., 253, 119881, https://doi.org/10.1016/j.jclepro.2019.119881, 2020.
Zhang, H., Wang, Y., Hu, J., Ying, Q., and Hu, X.-M.: Relationships between meteorological parameters and criteria air pollutants in three megacities in China, Environ. Res., 140, 242–254, https://doi.org/10.1016/j.envres.2015.04.004, 2015.
Zhao, Y., Zhang, K., Xu, X., Shen, H., Zhu, X., Zhang, Y., Hu, Y., and Shen, G.: Substantial changes in nitrogen dioxide and ozone after excluding meteorological impacts during the COVID-19 outbreak in mainland China, Environ. Sci. Tech. Let., 7, 402–408, https://doi.org/10.1021/acs.estlett.0c00304, 2020.
Zhao, Z. and Wang, Y.: Influence of the West Pacific subtropical high on surface ozone daily variability in summertime over eastern China, Atmos. Environ., 170, 197–204, https://doi.org/10.1016/j.atmosenv.2017.09.024, 2017.
Zhou, D., Ding, A., Mao, H., Fu, C., Wang, T., Chan, L. Y., Ding, K., Zhang, Y., Liu, J., and Lu, A.: Impacts of the East Asian monsoon on lower tropospheric ozone over coastal South China, Environ. Res. Lett., 8, 044011, https://doi.org/10.1088/1748-9326/8/4/044011, 2013.