the Creative Commons Attribution 4.0 License.
the Creative Commons Attribution 4.0 License.
 | 16 Oct 2024
Importance of aerosol composition and aerosol vertical profiles in global spatial variation in the relationship between PM2.5 and aerosol optical depth
Randall V. Martin
Aaron van Donkelaar
Melanie S. Hammer
Christopher R. Oxford
Yanshun Li
Dandan Zhang
Inderjeet Singh
Alexei Lyapustin
Ambient fine particulate matter (PM2.5) is the leading global environmental determinant of mortality. However, large gaps exist in ground-based PM2.5 monitoring. Satellite remote sensing of aerosol optical depth (AOD) offers information to help fill these gaps worldwide when augmented with a modeled PM2.5–AOD relationship. This study aims to understand the spatial pattern and driving factors of this relationship by examining η () using both observations and modeling. A global observational estimate of η for the year 2019 is inferred from 6870 ground-based PM2.5 measurement sites and satellite-retrieved AOD. The global chemical transport model GEOS-Chem, in its high-performance configuration (GCHP), is used to interpret the observed spatial pattern of annual mean η. Measurements and the GCHP simulation consistently identify a global population-weighted mean η value of 96–98 µg m−3, with regional values ranging from 59.8 µg m−3 in North America to more than 190 µg m−3 in Africa. The highest η value is found in arid regions, where aerosols are less hygroscopic due to mineral dust, followed by regions strongly influenced by surface aerosol sources. Relatively low η values are found over regions distant from strong aerosol sources. The spatial correlation of observed η values with meteorological fields, aerosol vertical profiles, and aerosol chemical composition reveals that spatial variation in η is strongly influenced by aerosol composition and aerosol vertical profiles. Sensitivity tests with globally uniform parameters quantify the effects of aerosol composition and aerosol vertical profiles on spatial variability in η, exhibiting a population-weighted mean difference in aerosol composition of 12.3 µg m−3, which reflects the determinant effects of composition on aerosol hygroscopicity and aerosol optical properties, and a population-weighted mean difference in the aerosol vertical profile of 8.4 µg m−3, which reflects spatial variation in the column–surface relationship.
- Article
(10894 KB) - Full-text XML
- BibTeX
- EndNote


Exposure to ambient fine particulate matter (PM2.5) has been recognized as the predominant environmental risk factor for the global burden of disease, leading to millions of deaths annually (Brauer et al., 2024). Even at low PM2.5 concentrations, long-term exposure can increase circulatory- and respiratory-related mortality (Christidis et al., 2019; Pinault et al., 2016; Weichenthal et al., 2022). Despite the importance of PM2.5, many countries do not provide publicly accessible PM2.5 data (Martin et al., 2019). Satellite remote sensing of aerosol optical depth (AOD), an optical measure of aerosol abundance, offers information about the distribution of PM2.5 (Kondragunta et al., 2022). A large community relies upon the spatial distribution of PM2.5 concentrations inferred from satellite AOD and modeled PM2.5–AOD relationships for health impact assessments and epidemiological analyses of long-term exposure (Brauer et al., 2024; Burnett et al., 2018; Cohen et al., 2017; Hao et al., 2023). Quantitative applications of satellite AOD for long-term characterizations of the spatial distribution of PM2.5 would benefit from a better understanding of the factors affecting the PM2.5–AOD relationship.
The relationship between satellite AOD and surface PM2.5 can be established through statistical methods, geophysical methods, or a combination of the two. Statistical methods use ground-based monitors for training and are well suited for regions with dense monitoring networks (Di et al., 2016; Hu et al., 2014; Xin et al., 2014). Geophysical approaches utilize chemical transport models to simulate the relationship (η) between PM2.5 and AOD for application to satellite AOD (van Donkelaar et al., 2006, 2010; He et al., 2021) and thus depend on accurate model representations of η. Van Donkelaar et al. (2015, 2016) combined the two types of methods by applying geographically weighted regression (GWR) to geophysical PM2.5, further constraining geophysical PM2.5 using ground measurements and other predictors. However, the accuracy of geophysical PM2.5 remains critical across vast areas with sparse monitoring, and knowledge about the factors affecting spatial variability in η is needed to guide improvements of modeled η and geophysical PM2.5.
Previous studies have identified several factors that affect η variability, including aerosol vertical distribution; aerosol hygroscopicity; aerosol optical properties; and ambient meteorological factors, such as relative humidity (RH), planetary boundary layer height (PBLH), wind speed, temperature, and fire events (van Donkelaar et al., 2013; Ford and Heald, 2016; Guo et al., 2017; Jin et al., 2019; Li et al., 2015; Wendt et al., 2023). Most studies have focused on temporal variability in η and have found associations with meteorological variables, such as PBLH (Chu et al., 2015; Damascena et al., 2021; Gupta et al., 2006; He et al., 2021; Yang et al., 2019; Zhang et al., 2009). A few studies have examined regional-scale spatial variation in η with meteorological and land-type variables, as well as aerosol vertical profiles, in North America (van Donkelaar et al., 2006; Jin et al., 2020; Li et al., 2015) and China (Yang et al., 2019). To our knowledge, no studies have examined global-scale factors affecting spatial variation in η or the effects of chemical composition.
In this work, we examine the knowledge gap regarding spatial variation in η at a global scale. We first collect data from more than 6000 PM2.5 monitoring sites across 10 networks, along with satellite AOD data, to obtain an observation-based map of η. We further interpret the global η distribution using the GEOS-Chem model of atmospheric composition, incorporating recent improvements in aerosol size representation, PM2.5 diel variation, and vertical allocation. By decomposing the simulation of η, we identify two strong drivers of spatial variability in η: aerosol composition and aerosol vertical profiles. We conduct sensitivity tests using GEOS-Chem to study how these two factors vary globally and how they contribute to spatial variation in η.
2.1 Ground-measured PM2.5
We collect ground-based measurements of PM2.5 for the year 2019 to produce observational constraints on η (), the spatially and temporally varying ratio between 24 h surface PM2.5 concentrations and total column AOD at the satellite sampling time. At the time of paper preparation, the year 2019 offered the greatest density of measurements and the most current emission inventory. We obtain PM2.5 measurements from seven regional networks and three global networks, as shown in Fig. A1. For the United States, we access data from the United States Environmental Protection Agency's Air Quality System (https://www.epa.gov/outdoor-air-quality-data/download-daily-data, last access: 12 October 2024), including both Federal Reference Method and non-Federal Reference Method PM2.5 (e.g., from the Interagency Monitoring of Protected Visual Environments (IMPROVE) network). PM2.5 data for Canada are from Environment Canada's National Air Pollution Surveillance (NAPS) program. PM2.5 data for Europe are from the European Environment Agency's Air Quality e-Reporting system (https://www.eea.europa.eu/data-and-maps/data/aqereporting, last access: 12 October 2024). For mainland China, PM2.5 measurements from national and provincial environmental protection agencies are downloaded from https://quotsoft.net/air/ (last access: 12 October 2024). For India, PM2.5 data are originally from the Central Pollution Control Board's Continuous Ambient Air Quality Monitoring network and the US embassies. Data quality checks follow Zhou et al. (2024). For Australia, observations are sourced from the Northern Territory (http://ntepa.webhop.net/NTEPA/, last access: 12 October 2024), Queensland (https://www.data.qld.gov.au/dataset/, last access: 12 October 2024), and New South Wales (https://www.dpie.nsw.gov.au/air-quality/air-quality-data-services/data-download-facility, last access: 12 October 2024). We require at least 5 d of measurements for each month for monitoring to be included. Additionally, we obtain PM2.5 measurements from other regions, provided by the World Health Organization (WHO) Ambient Air Quality Database (https://www.who.int/data/gho/data/themes/air-pollution/who-air-quality-database/2022, last access: 12 October 2024); OpenAQ (https://openaq.org/, last access: 12 October 2024); and the Surface Particulate Matter Network (SPARTAN; https://www.spartan-network.org/, last access: 12 October 2024), which is co-located with the Aerosol Robotic Network (AERONET). SPARTAN also provides filter-based PM2.5 chemical compositions, which are initially described in Snider et al. (2016). Subsequent developments in the sampling and analysis procedures of SPARTAN include upgrading the AirPhoton SS5 sampling station to use a cyclone inlet, an automated weighing system (MTL AH500E) that improves precision and throughput, additional black-carbon analysis using the Hybrid Integrating Plate and Sphere system (White et al., 2016), elements measured via X-ray fluorescence (Liu et al., 2024), and a global mineral-dust equation (Liu et al., 2022). We require at least 50 d of coincident PM2.5 and AERONET AOD measurements for a SPARTAN site to be included in our analysis.
We also collected publicly available PM2.5 compositional data to assess the composition simulated with the high-performance version of GEOS-Chem (GCHP). Long-term PM2.5 compositional data from the United States Environmental Protection Agency's Air Quality System, the European Environment Agency's Air Quality e-Reporting system, and SPARTAN are included, with a total of 365 sites covering the US (306), Europe (37), and the Global South (22).
2.2 Satellite AOD
We obtain AOD at 550 nm from the Multi-Angle Implementation of Atmospheric Correction (MAIAC) algorithm, which offers AOD at a high spatial resolution of 1 km worldwide over both land and coastal regions (Lyapustin et al., 2018). The radiances used in the retrieval are measured by the twin Moderate Resolution Imaging Spectroradiometer (MODIS) instruments onboard the Terra and Aqua satellites. The Terra satellite follows a descending orbital path, crossing the Equator at 10:30 LT, while the Aqua satellite follows an ascending orbit, with a 13:30 LT equatorial crossing. Both MODIS instruments offer a wide swath width of 2330 km, enabling nearly global daily coverage of the Earth (Sayer et al., 2014). PM2.5 monitoring sites with an annual mean satellite AOD of less than 0.05 (the background AOD level over land) are excluded to reduce the influence of retrieval uncertainties on our analysis.
2.3 AERONET AOD
AERONET is a worldwide sun photometer network that provides long-term measurements of AOD. We use Version 3 of the Level-2 database, which includes an improved cloud screening algorithm (Giles et al., 2019). We sample AERONET AOD within ± 15 min of the satellite overpass time and interpolate to a 550 nm wavelength, based on the local Ångström exponent at 440 and 670 nm. For SPARTAN sites, we sample AERONET data coincidentally with SPARTAN aerosol composition to obtain the ground-based observation of η.
2.4 GEOS-Chem simulation
We simulate η with the chemical transport model GEOS-Chem (https://www.geos-chem.org, last access: 26 October 2023), driven by offline meteorological data (MERRA-2) from the Goddard Earth Observing System (GEOS) of the NASA Global Modeling and Assimilation Office (Schubert et al., 1993). We use version 13.4.0 of the high-performance configuration of GEOS-Chem (GCHP; Eastham et al., 2018) (DOI: https://doi.org/10.5281/zenodo.7254268), which includes advances in performance and usability (Martin et al., 2022). The simulation is conducted for the year 2019 on a C90 cubed-sphere grid corresponding to a horizontal resolution of about 100 km, with a spin-up time of 1 month.
The GEOS-Chem aerosol simulation includes a sulfate–nitrate–ammonium (SNA) system (Fountoukis and Nenes, 2007), primary and secondary carbonaceous aerosols (Pai et al., 2020; Park et al., 2003; Wang et al., 2014), sea salt (Jaeglé et al., 2011), and both natural (Fairlie et al., 2007; Meng et al., 2021) and anthropogenic (Philip et al., 2017) dust. Emissions are processed with the Harmonized Emissions Component (HEMCO) (Lin et al., 2021). The primary emission data are from version 2 of the Community Emissions Data System (CEDS v2; Hoesly et al., 2018; CEDS, 2024) for the year 2019. Emissions from stacks are distributed vertically (Bieser et al., 2011). Diel variation in anthropogenic emissions is included (Li et al., 2023). Resolution-dependent soil NOx, sea salt, biogenic volatile organic compounds (VOCs), and natural dust emissions are calculated offline at a native meteorological resolution to produce consistent emissions across resolutions (Meng et al., 2021; Weng et al., 2020). Biomass-burning emissions use version 4 of the Global Fire Emissions Database (GFED4) at a daily resolution (van der Werf et al., 2017) for the year 2019. We estimate organic matter (OM) from primary organic carbon (OC) using an parameterization (Canagaratna et al., 2015; Philip et al., 2014b). For secondary aerosol components, the concentration at 2 m above the surface is used to calculate PM2.5, following Li et al. (2023). A 50 % reduction in surface nitrate concentration is applied to account for the long-standing bias in surface nitrate simulated by GEOS-Chem (Heald et al., 2012; Miao et al., 2020; Travis et al., 2022; Zhai et al., 2021; Zhang et al., 2012; see also Fig. A2 in this paper) and other models, such as CMAQ (Shimadera et al., 2014), WRF-Chem (Sha et al., 2019), and the European Monitoring and Evaluation Programme's Meteorological Synthesizing Centre – West (EMEP MSC-W; Prank et al., 2016). Despite this bias, GEOS-Chem can sufficiently represent variability in nitrate, making it suitable for applications in studies at global (McDuffie et al., 2021; Weagle et al., 2018) and regional (Geng et al., 2017; Kim et al., 2015; Philip et al., 2014a; Zhai et al., 2021) scales. Both dry and wet deposition follow Amos et al. (2012), using a standard resistance-in-series dry-deposition scheme (Wang et al., 1998). Wet deposition includes scavenging processes from convection and large-scale precipitation (Liu et al., 2001).
Global RH-dependent aerosol optical properties are based on the Global Aerosol Data Set (GADS) (Kopke et al., 1997), as originally implemented by Martin et al. (2003), with updates for SNA and OM dry sizes (Zhu et al., 2023), hygroscopicity (Latimer and Martin, 2019), mineral dust size distribution (Zhang et al., 2013), and absorbing brown carbon (Hammer et al., 2016). These updates enable GEOS-Chem to capture 74 % of the AOD spatial variability in comparison to AERONET (Zhu et al., 2023). A slight systematic low bias relative to MAIAC AOD is found, with an intercept of −0.05 and a population-weighted mean difference (PWMD) of −0.04. Low bias in simulated AOD is also reported for other models, such as CMAQ (Jin et al., 2019) and WRF-Chem (Benavente et al., 2023). We artificially increase simulated AOD by 0.04 globally to address this poorly understood systematic bias, which, although minor, is useful for the representation of η (with the PWMD reduced from 20.6 to 1.9 µg m−3). PM2.5 is calculated as the sum of each component at 35 % RH in accordance with common measurement protocols.
2.5 Population
Global population information is obtained from the Gridded Population of the World, provided by the NASA Socioeconomic Data and Applications Center (Center for International Earth Science Information Network, 2018).
2.6 Sensitivity tests with globally uniform parameters
We conduct sensitivity tests for factors affecting spatial variation in η, with a focus on aerosol composition and aerosol vertical profiles. To understand the relative importance of these factors, we impose a constant for each factor and simulate the corresponding η value. The difference between the test scenario and the base scenario reflects the change due to variation in the factor. We use the global population-weighted mean (PWM) and population-weighted mean difference (PWMD) to summarize changes, with a focus on the relevance to population exposure:
where i and j are grid box identifiers. X and Y could be any variables of interest, and is the absolute value of their difference. P represents the population density for each grid box.
The first test imposes globally uniform aerosol chemical composition, calculated as the global PWM aerosol component fraction (), which is expressed as
where i, j, and k are grid box identifiers along the latitude, longitude, and vertical layer, respectively. Fs is the fraction of the aerosol component (s) in the total aerosol mass. This test keeps the total columnar aerosol mass and aerosol vertical profile unchanged.
The second test imposes a globally uniform aerosol vertical profile, calculated as the PWM relative vertical profile (), which is expressed as
where is the relative dry-mass ratio compared to the surface. The total mass loading and relative chemical composition remain unchanged.
We analyze global and regional variations in both η and the driving factors. The definitions of the regions used in this study are summarized in Fig. A3.
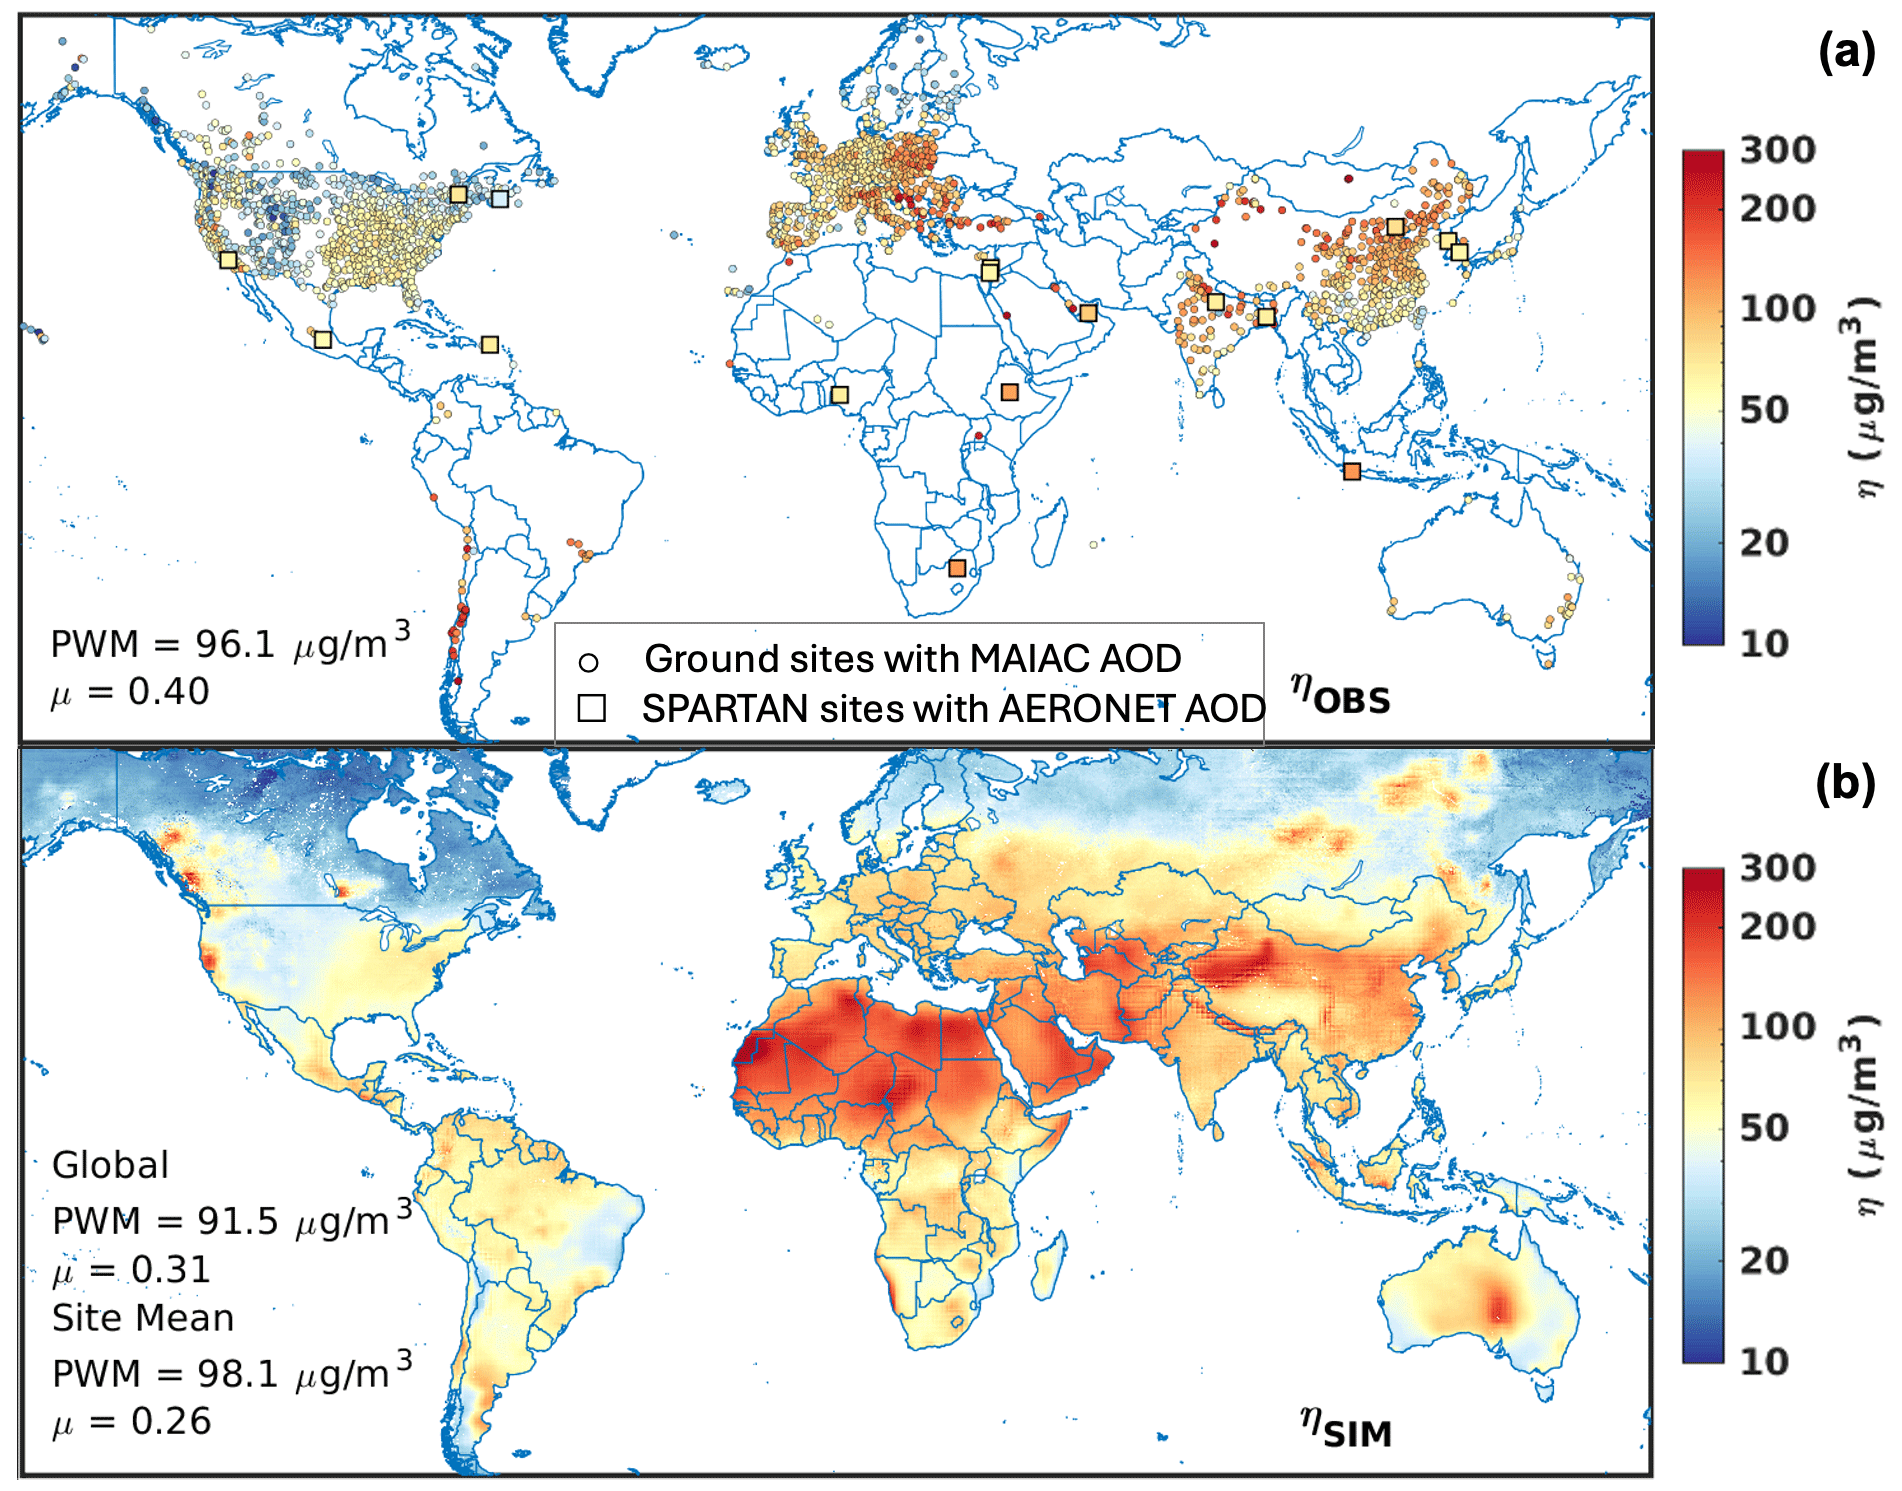
Figure 1(a) Observed (OBS) and (b) simulated (SIM) annual mean η for 2019. Circles represent ground measurement sites from regional networks or the World Health Organization. Squares represent co-located ground-measured PM2.5 data from SPARTAN and AOD data from AERONET. PWM stands for the population-weighted mean, while μ refers to the coefficient of variation (the standard deviation divided by the mean).
3.1 Global spatial pattern of η
Figure 1a shows observation-based annual mean η, inferred from the ratio of ground-measured PM2.5 to MAIAC AOD. Measurements are most dense in North America, Europe, and East Asia. The annual mean η value varies substantially, from 7.8 µg m−3 in Hawaii to 504 µg m−3 in Mongolia, with a PWM of 96.1 µg m−3. Higher PWM η values of 154 to 196 µg m−3 exist over desert regions, such as Africa and West Asia, and PWM η values of 97 to 119 µg m−3 are observed over regions strongly influenced by anthropogenic aerosols, such as East Asia and South Asia (Fig. A4 and Table A1). Over North America, η values are around 60 µg m−3 in the east and in California, more than double the values observed in the Rockies, and are driven by the spatial pattern of surface PM2.5 (Fig. A4). The PWM η value for North America, at 59.8 µg m−3, is about 30 % lower than the global PWM. The η pattern found here is similar to that reported by Jin et al. (2020) for the US. In Europe, η also varies noticeably between the east and the west, driven by the spatial pattern of surface PM2.5, as PM2.5 increases by 60 % from west to east, while AOD increases by only 8 %. The PWM η value for Europe is 92.3 µg m−3, slightly lower than the global PWM. In Asia, measured η is concentrated in China and India. In China, the η spatial pattern shows a clear distinction between the northern and southern regions, driven by the higher AOD in the south (Fig. A5), where relative humidity is high. A similar η spatial pattern and a negative correlation between η and RH are reported by Yang et al. (2019). In India, η is highest in the northwest, where a PWM η value of 129 µg m−3 is observed, and decreases to about 80 µg m−3 toward the east and the south. Both PM2.5 and AOD follow the same spatial pattern, while PM2.5 exhibits a stronger decreasing tendency (Figs. A4 and A5). The PWM η value for Asia is 102 µg m−3, the highest value among populous regions and 6.0 % higher than the global PWM. Globally, from west to east, η increases by about 70 %, despite the fact that both PM2.5 and AOD increase more than 3-fold (Fig. A6). The coefficient of variation (i.e., the standard deviation divided by the mean) for η is higher in Europe (μ = 0.31) and Asia (μ = 0.36) than in North America (μ = 0.25; Fig. A6).
Figure 1b shows GCHP-simulated η, the ratio between simulated 24 h mean surface PM2.5 and simulated total column AOD at the satellite overpass time. The simulation generally reproduces the global observations of η, with a tendency for high values in arid regions influenced by dust and a tendency for low values in regions distant from strong surface sources. Simulated global PWM η values are 2 % higher than the observed values (98.1 vs. 96.1 µg m−3), mostly driven by an overestimation in East Asia (108 vs. 96.9 µg m−3), which reflects an overestimation of PWM PM2.5 (43.3 vs. 38.0 µg m−3). The simulation generally reproduces the regional spatial pattern in North America and Asia but underestimates η variability in Europe as it overestimates η in central Europe and underestimates η in Eastern Europe, which is due to a positive bias in simulated PM2.5 in central Europe and a positive bias in simulated AOD in Eastern Europe. Nonetheless, the PWM η value for Europe (83.6 µg m−3) is within 9.4 % of the observations. Globally, there is overall consistency between simulated η and observed η, with a correlation of 0.59, resulting in a high degree of consistency between geophysical PM2.5 and measured PM2.5 (r = 0.89; Fig. A6). Evaluation of the simulation of PM2.5 chemical composition versus ground-based measurements reveals a high degree of consistency (Fig. A2), which supports further assessment of the factors affecting η.
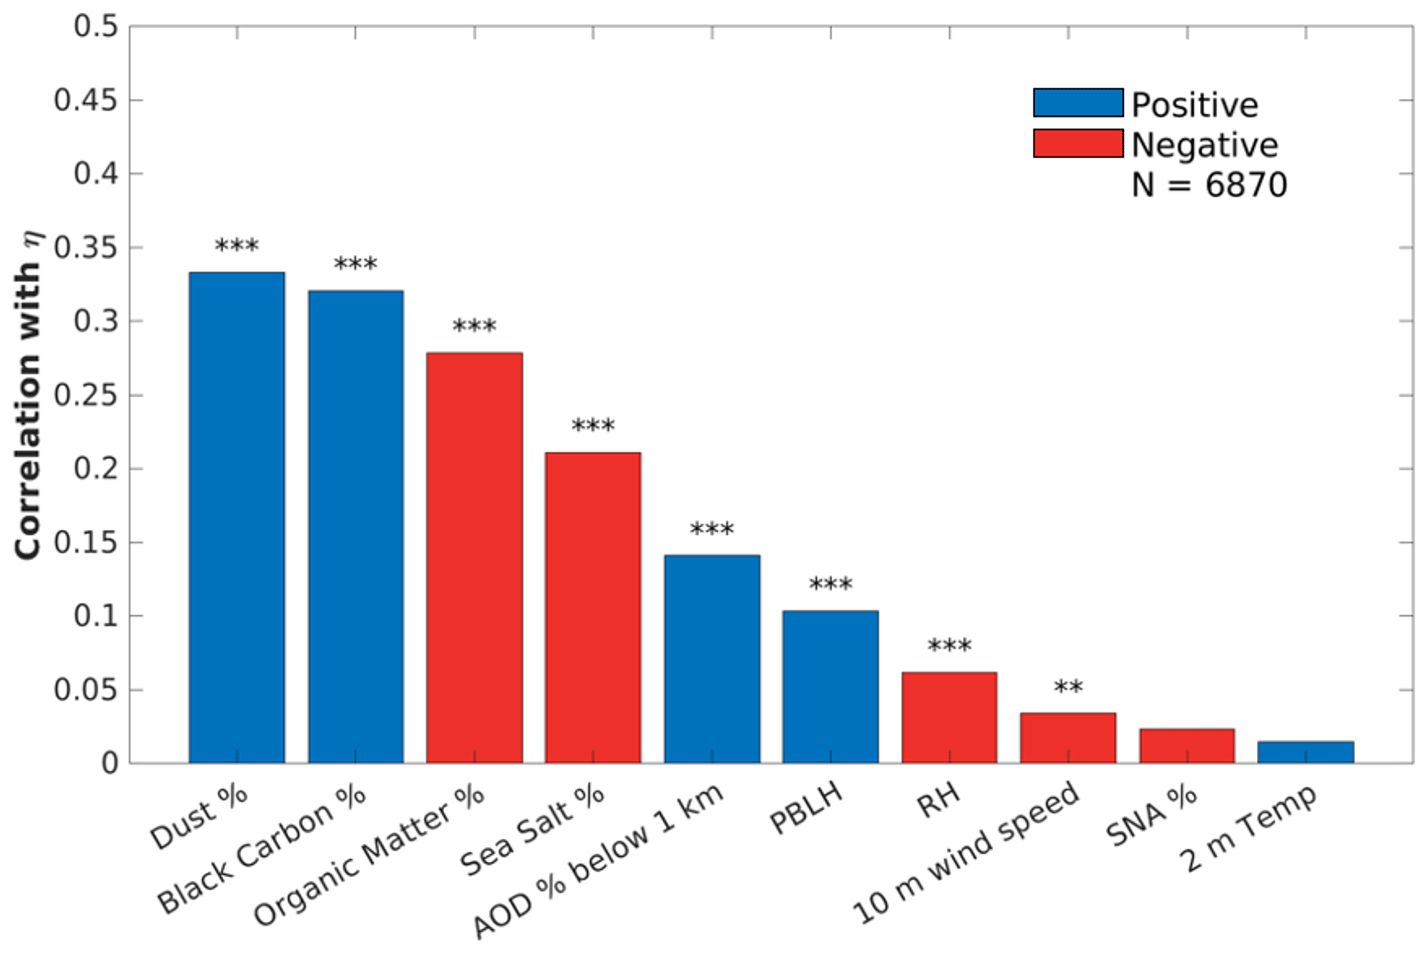
Figure 2Spatial correlation between annual mean modeled parameters and observation-based η. Blue bars indicate positive correlations. Red bars indicate negative correlations. The stars above each bar indicate the p value associated with each correlation: “” indicates a p value lower than 0.001, and “” indicates a p value lower than 0.01.
We explore the dominant driving factors for spatial variation in η by calculating the spatial correlation between each candidate factor and observation-based η. The candidate factors examined include meteorological fields (MERRA-2), aerosol vertical profiles, and aerosol composition, as collected from the GCHP simulation or SPARTAN. Meteorological fields include those commonly regarded as representing temporal variation in η, such as PBLH, RH at 700 hPa, wind speed at 10 m, and temperature at 2 m (Chu et al., 2015; Damascena et al., 2021; He et al., 2021; Yang et al., 2019). The aerosol vertical profile is represented as the AOD fraction below 1 km (i.e., the AOD percentage below 1 km). The aerosol composition includes SNA, OM, dust, black carbon, and sea salt, all represented as fractional contributions to surface PM2.5 (expressed as percentages). Figure 2 shows the spatial correlation of annual mean factors versus observation-based η. Aerosol components, particularly those with strong primary sources (dust, OM, and black carbon), exhibit the strongest correlations with observation-based η (> 0.27). Significant positive correlations are found for mineral dust and black carbon, both of which are non-hygroscopic or weakly hygroscopic. Significant negative correlations are found for organic matter and sea salt, reflecting the weak connection between surface concentrations and AOD aloft. The processes are further discussed in Sect. 3.2 and 3.4. The aerosol vertical profile exhibits a moderate correlation with η (0.14), which is notably higher than that of any meteorological factors (⩽ 0.10). Ground-based data from SPARTAN and AERONET corroborate the correlation between aerosol composition and η (Fig. A7). Thus, in Sect. 3.2–3.4, we focus further analysis on the two main drivers of η: aerosol composition and aerosol vertical profiles.
The drivers of spatial variation in η found here differ from the drivers of temporal variation in η observed in prior work (e.g., He et al., 2021), reflecting the different processes involved. Meteorological parameters drive short-term variability in the aerosol vertical profile, such as day-to-day variation in mixed-layer depth or in advection from a point source. In contrast, the spatial variation in annual mean η reflects the spatial variation in processes affecting the long-term relationship between surface PM2.5 at a controlled RH of 35 % and AOD at an ambient RH. Aerosol composition and the aerosol vertical profile reflect spatial variation in aerosol hygroscopicity, mass extinction efficiency, and sources. The following sections explore how aerosol composition and aerosol vertical profiles vary globally and examine how they affect the spatial pattern of η by conducting two sensitivity tests. In each sensitivity test, we replace the spatial variability in a factor with a globally uniform value. The variability in aerosol composition and aerosol vertical profiles is discussed in Sect. 3.2 and 3.3, respectively. The sensitivity test results are discussed in Sect. 3.4.
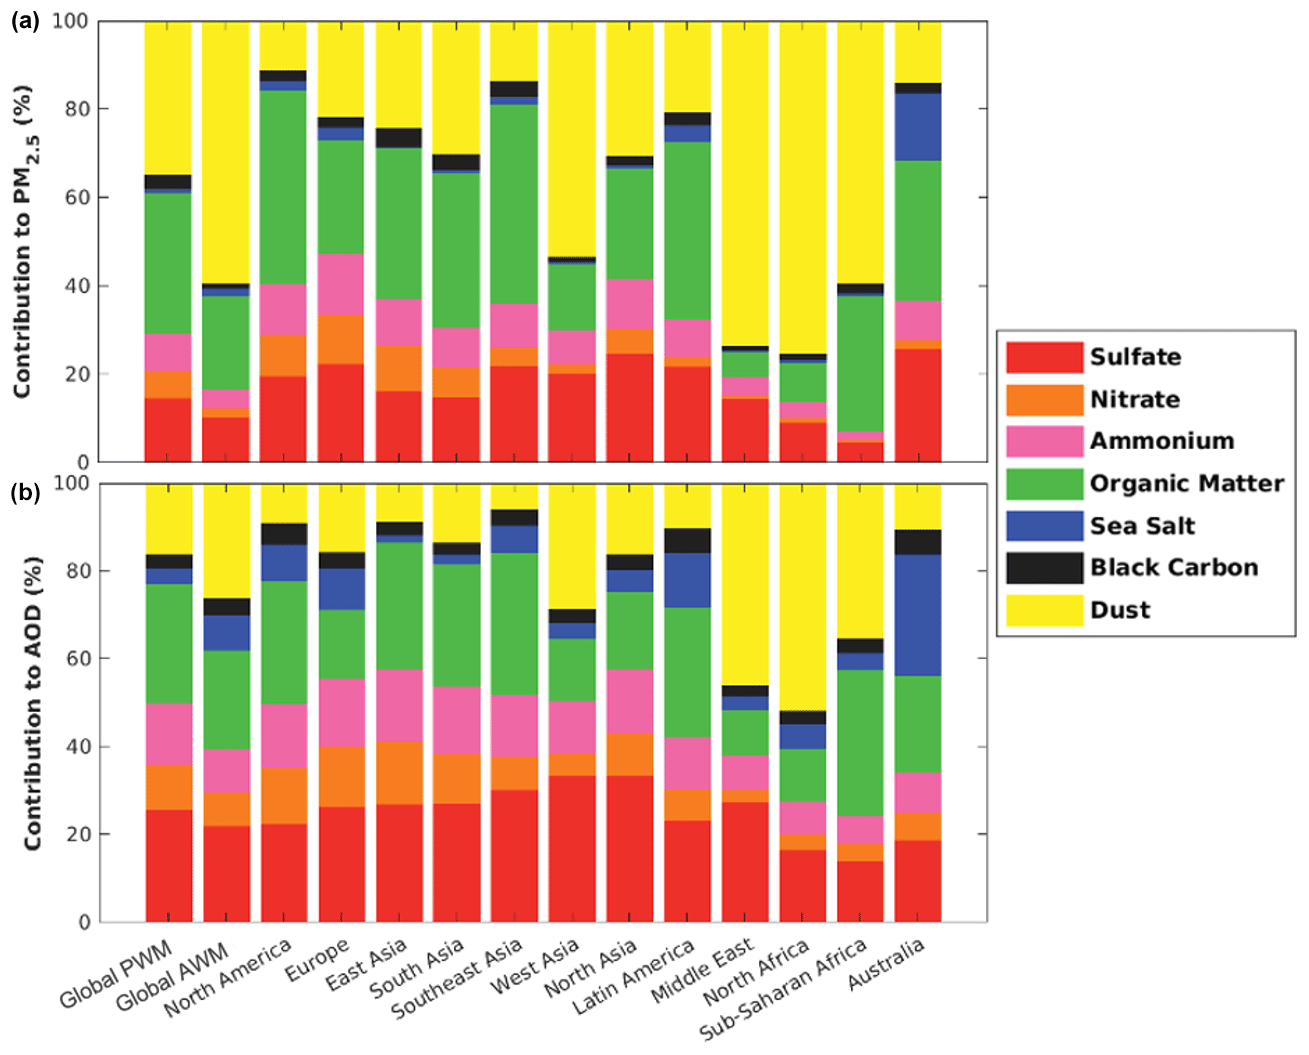
Figure 3Global and regional PWM contributions of aerosol composition to surface PM2.5 (a) and AOD (b). The global area-weighted mean (AWM) over land is also included and represented in the second bar.
3.2 Spatial variability in aerosol composition
Figure 3 shows the simulated PWM aerosol composition globally and regionally, as well as the global area-weighted mean (AWM). Figure 3a shows the compositional contribution to PM2.5. Globally, dust is the leading PWM PM2.5 component (34.7 %), followed by OM (31.9 %) and SNA (29.3 %). Figure 3b shows the compositional contribution to AOD. The PWM AOD composition is more evenly distributed, with a larger contribution from SNA (49.9 %), followed by smaller contributions from OM (27.2 %) and dust (16.1 %). Overall, aerosols that are more hygroscopic, such as SNA, tend to contribute a larger fraction of AOD at an ambient RH, while aerosols that are less hygroscopic, such as mineral dust, tend to contribute a larger fraction of PM2.5 at a controlled RH of 35 %. The AWM PM2.5 and AOD compositions exhibit weaker contributions from SNA, primarily reflecting a larger contribution from dust in remote regions compared to more densely populated areas. Over populous regions, such as North America, Europe, and Southeast Asia, the SNA and OM fractions are greater than the global mean (Fig. 3). Arid regions, such as West Asia, the Middle East, North Africa, and Sub-Saharan Africa, exhibit large fractions of non-hygroscopic mineral dust that (1) reduce the aerosol mass extinction efficiency, yielding less AOD per unit mass, and (2) are unaffected by the controlled RH of PM2.5. Both of these factors increase η in dusty regions compared to regions dominated by hygroscopic SNA aerosols.
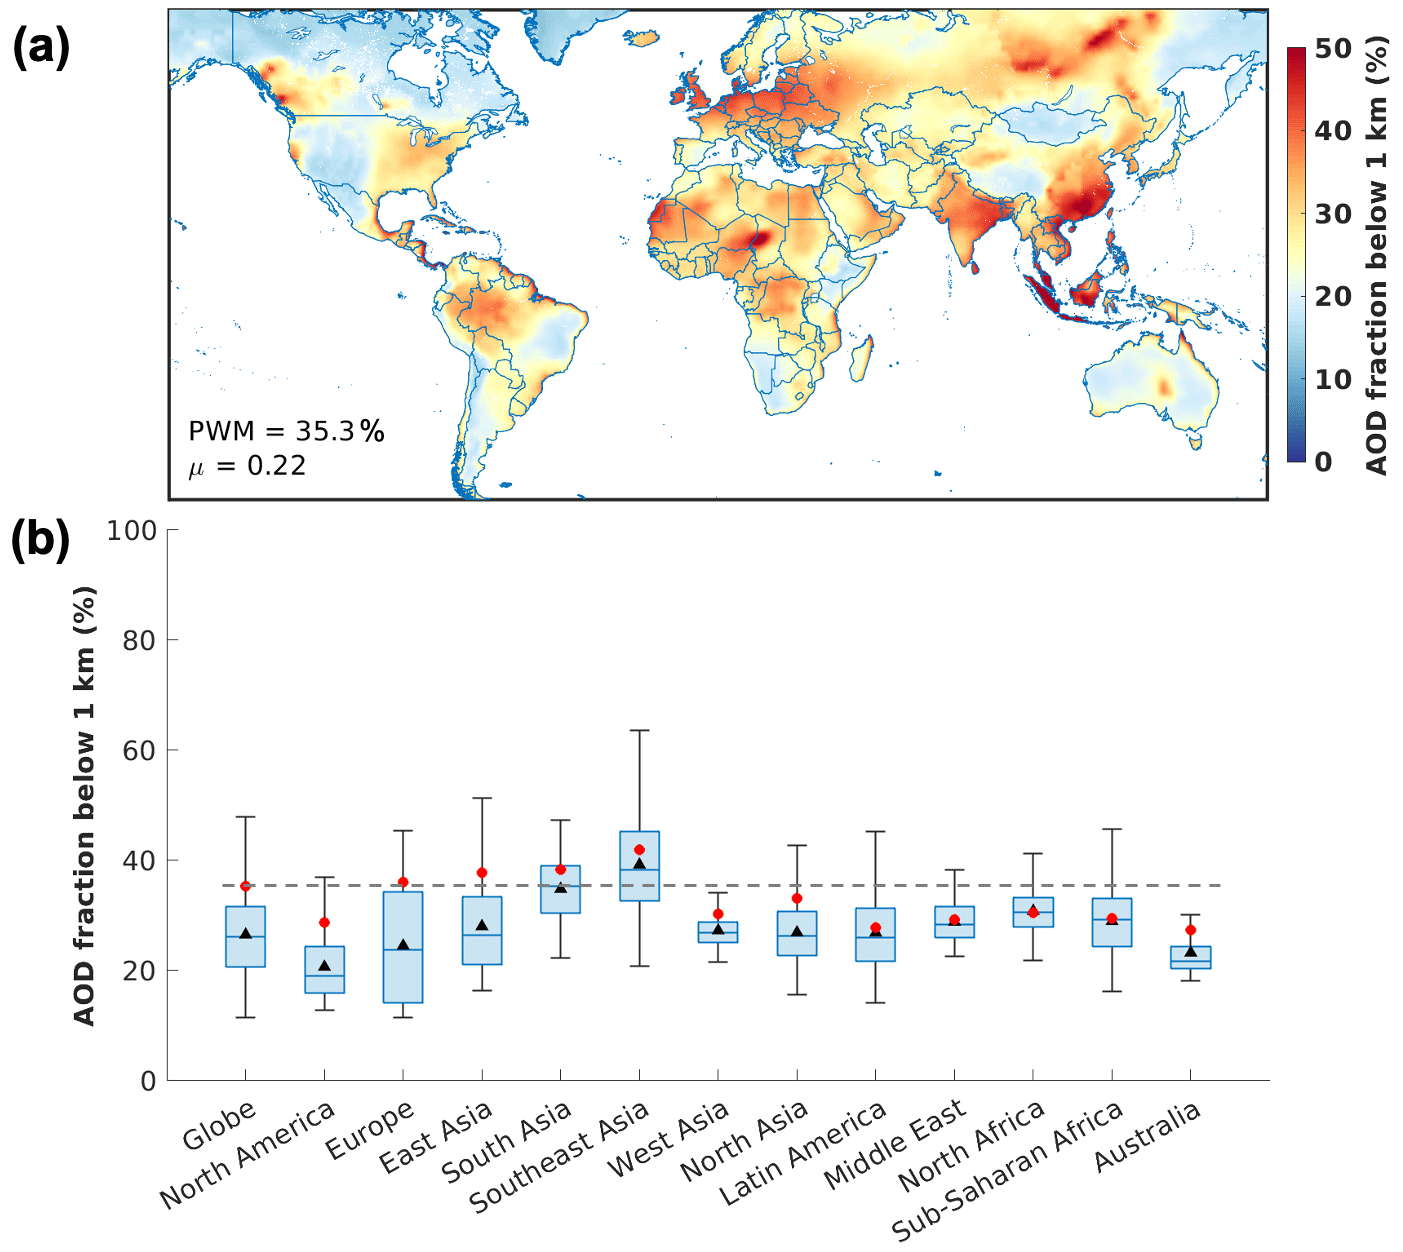
Figure 4(a) Map of the AOD fraction below 1 km. (b) Global and regional statistics for the AOD fraction below 1 km. Black triangles show the area-weighted mean. Red circles show the PWM. The line inside each box represent the sample median. The top and bottom edges of the boxes represent the 75th and 25th quartiles, respectively. Vertical bars represent the maximum and minimum values within 1.5 times the interquartile range. The dashed line indicates the global PWM.
3.3 Spatial variability in aerosol vertical profiles
Figure 4 shows the AOD fraction below 1 km in the GEOS-Chem simulation. Globally, 35.3 % of the PWM AOD is below 1 km. The PWM value is greater than the AWM value since populated areas tend to have more surface emissions of particles and precursors. Over North America, Europe, and East Asia, the PWM surface AOD fractions are much higher than the medians and AWM, indicating high spatial heterogeneity between urban and remote areas. Europe exhibits the highest variation and the largest discrepancy between the PWM and AWM, reflecting the largest spatial heterogeneity in the aerosol vertical profile, driven by influences from regional pollution, marine aerosols, and transported dust (Zhao et al., 2018). Southeast Asia has the highest surface AOD fraction and large variation. Local sources, long-range-transported dust, and the influence of trade winds all contribute to the unique spatial variation in aerosol vertical profiles in this region (Banerjee et al., 2021; Nguyen et al., 2019). Globally, PWM values exhibit less variation than AWM values, indicating moderate variations in the aerosol profile across populous areas.
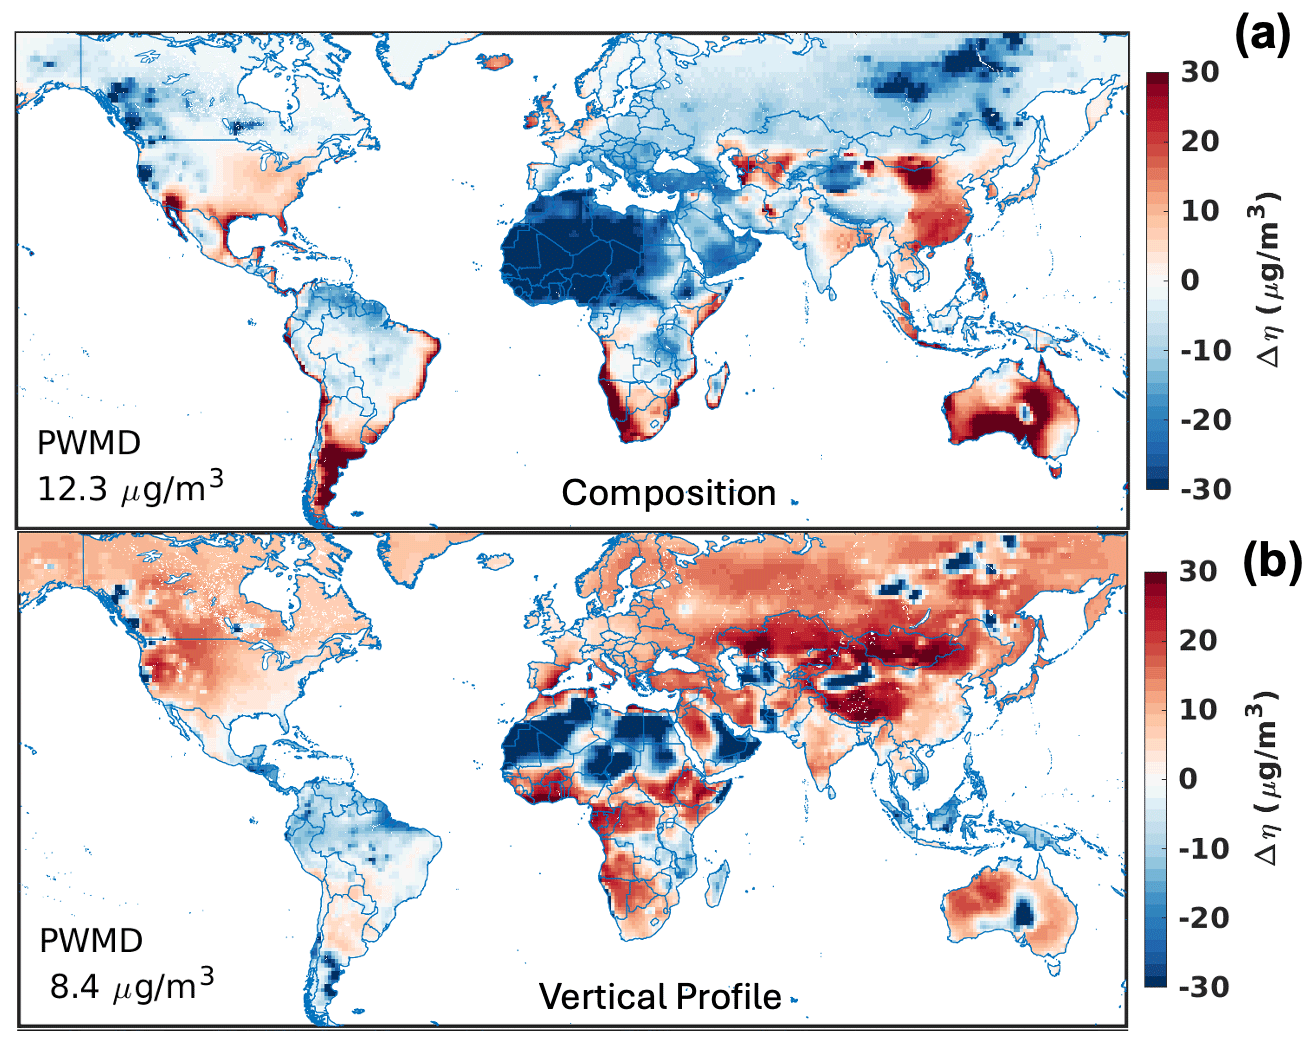
Figure 5Changes in η (test–base) for each sensitivity test. In the first test, a global PWM aerosol composition replaces the actual composition (a). In the second test, a global PWM aerosol profile replaces the actual profile (b). The number in the bottom-right corner of each panel indicates the population-weighted mean difference (PWMD).
3.4 Sensitivity tests with globally uniform parameters
Figure 5 shows global changes in the spatial variation in η due to variations in aerosol chemical composition (panel (a)) and the aerosol vertical profile (panel (b)), the two main drivers identified in Fig. 2. Globally, neglecting spatial variation in aerosol composition induces a 12.3 µg m−3 PWMD in spatial variation in η. Both PM2.5 and AOD are strongly affected by aerosol composition, following a similar spatial pattern (Fig. A8). Over middle- and low-latitude areas, the change in AOD is stronger than that in PM2.5 since AOD at an ambient RH is more sensitive to hygroscopicity changes. This yields an opposite pattern in η. Neglecting spatial variation in chemical composition reduces η over North Africa and the Middle East, desert regions where aerosols contain more weakly hygroscopic components, such as mineral dust; in contrast, populous areas contain more secondary inorganic aerosols (Fig. 3). For smaller deserts in the southwestern US, Argentina, and southwestern Africa, the dust fractions for surface aerosols are higher than the global mean (36 %, 76 %, and 49 %, respectively), but the dust fractions for AOD are similar to the global mean (15 %, 25 %, and 14 %, respectively). Therefore, neglecting spatial variation in chemical composition increases η over these small deserts by increasing the fraction of hygroscopic components in PM2.5 and leaving AOD almost unchanged (Fig. A8). Neglecting spatial variation in chemical composition also reduces η over boreal forests, where surface aerosols are more hygroscopic compared to those in populous areas and show strong changes, while changes are less pronounced for column aerosols (Fig. A8). Moreover, neglecting spatial variation in chemical composition increases η over the eastern US and eastern China, where PM2.5 contains more hygroscopic SNA and less dust than the global mean. It also increases η in coastal regions, where aerosols contain more hygroscopic sea salt than the global mean.
Neglecting spatial variation in the aerosol vertical profile induces an 8.4 µg m−3 PWMD in spatial variation in η (Fig. 5), following the spatial pattern of the change in surface PM2.5 (Fig. A9). The most apparent feature is an increase in η throughout the remote Northern Hemisphere, driven by an increased aerosol fraction near the surface, where the fraction is normally small (Fig. 4). The uniform aerosol vertical profile decreases η over northern Africa and biomass-burning regions of boreal forests, the Amazon, and Indonesia, driven by a decreased aerosol fraction near the surface in regions where this fraction is normally high.
Understanding the global variation in the PM2.5–AOD relationship (η) offers insights into the geophysical inference of PM2.5 from satellite AOD observations. We collected ground-based PM2.5 measurements from 6870 sites and MODIS MAIAC satellite AOD throughout 2019 to obtain, for the first time, a global-scale observation-based η map. Observed annual mean η values range from 7.8 µg m−3 in Hawaii to 504 µg m−3 in Mongolia. We observed enhanced η values of 154 to 196 µg m−3 over arid regions, such as Africa and West Asia, due to the low aerosol extinction efficiency in these regions. Moderate η values of 97 to 119 µg m−3 were found in industrial areas, such as East Asia and South Asia, where anthropogenic emissions increase near-surface PM2.5 concentrations. Over remote areas, low η values (< 50 µg m−3) were usually observed.
We simulated global annual mean η using the chemical transport model GEOS-Chem in its high-performance configuration (GCHP). The simulation generally represented the observed η values with a PWM within 3 % (98.1 vs. 96.1 µg m−3) and a correlation of 0.59 across the 6780 measurement sites. We examined the correlation between the simulation and measurements to identify the two most impactful drivers for spatial variation in η – aerosol composition and aerosol vertical profiles – both of which strongly affect the annual mean relationship between columnar AOD at an ambient RH and surface PM2.5 at a controlled RH of 35 %. We subsequently conducted sensitivity tests by eliminating the spatial variation in each of the two drivers and quantified the impact on spatial variability in η. Imposing a globally uniform aerosol composition led to pronounced changes (i.e., a PWMD of 12.3 µg m−3), reflecting how changes in aerosol composition affect both AOD and surface PM2.5 due to the effects of aerosol hygroscopicity on both quantities. Imposing a globally uniform aerosol vertical profile had a moderate effect (i.e., a PWMD of 8.4 µg m−3), reflecting changes in the fraction of aerosol near the surface.
These findings motivate additional efforts to develop simulations of aerosol composition and aerosol vertical profiles. Promising avenues include (1) enhancing global long-term measurements of PM2.5 chemical composition to evaluate and improve simulations; (2) exploiting new and emerging information about aerosol type from satellite remote sensing (e.g., the PACE (Plankton, Aerosol, Cloud, ocean Ecosystem) and MAIA (Multi-Angle Imager for Aerosols) missions); (3) advancing simulations at a finer spatial resolution to better represent processes affecting aerosol composition and vertical profiles; (4) leveraging aircraft, lidar, and collected AOD-to-PM2.5 measurements for constraints on vertical profiles; and (5) exploiting nascent capabilities in applying satellite remote sensing (e.g., the TROPOspheric Monitoring Instrument (TROPOMI), the “Tropospheric Emissions: Monitoring of Pollution” (TEMPO) instrument, and the Geostationary Environment Monitoring Spectrometer (GEMS)) for top-down constraints on emissions that affect aerosol composition.
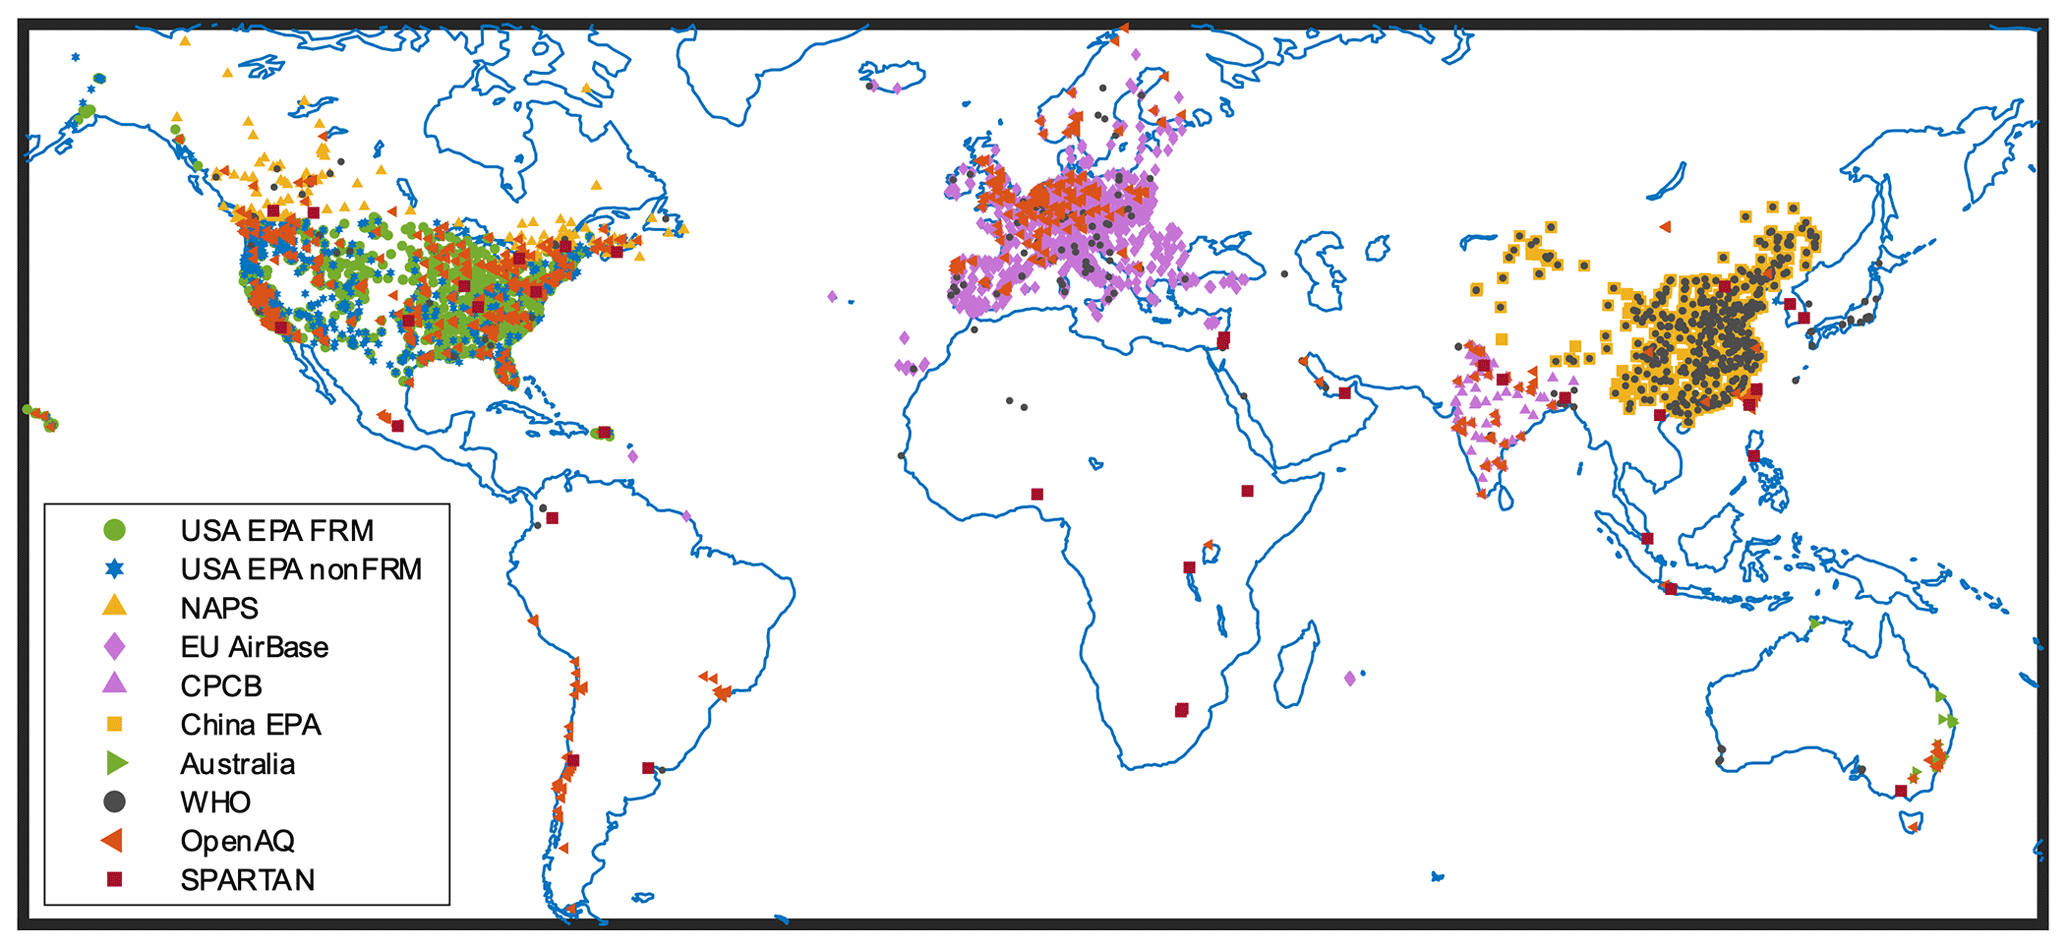
Figure A1PM2.5 measurement sites from publicly available networks. EPA: Environmental Protection Agency. FRM: Federal Reference Method. CPCB: Central Pollution Control Board.
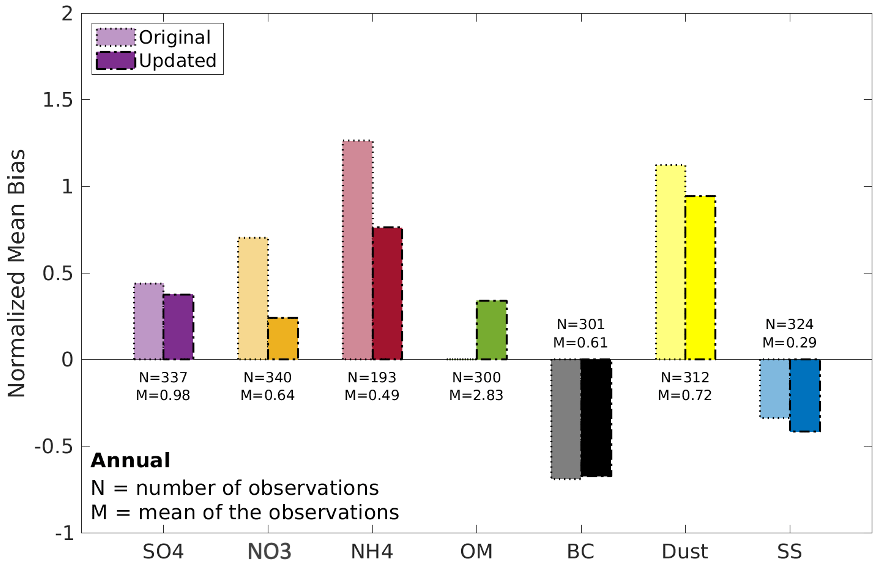
Figure A2Normalized mean bias (NMB) between simulated PM2.5 chemical composition and ground measurements from the Chemical Speciation Network (CSN), the IMPROVE network, the EMEP database, and SPARTAN. The original simulation is the out-of-the-box edition of version 13.4.0 of GCHP, while the updated simulation includes certain adjustments, such as GFED4.1s emissions at a daily scale (where GFED4.1s refers to version 4.1 of the Global Fire Emissions Database with a small fire boost), diel variation, the vertical distribution of anthropogenic emissions, and a 50 % reduction in nitrate concentration. BC: black carbon. SS: sea salt.
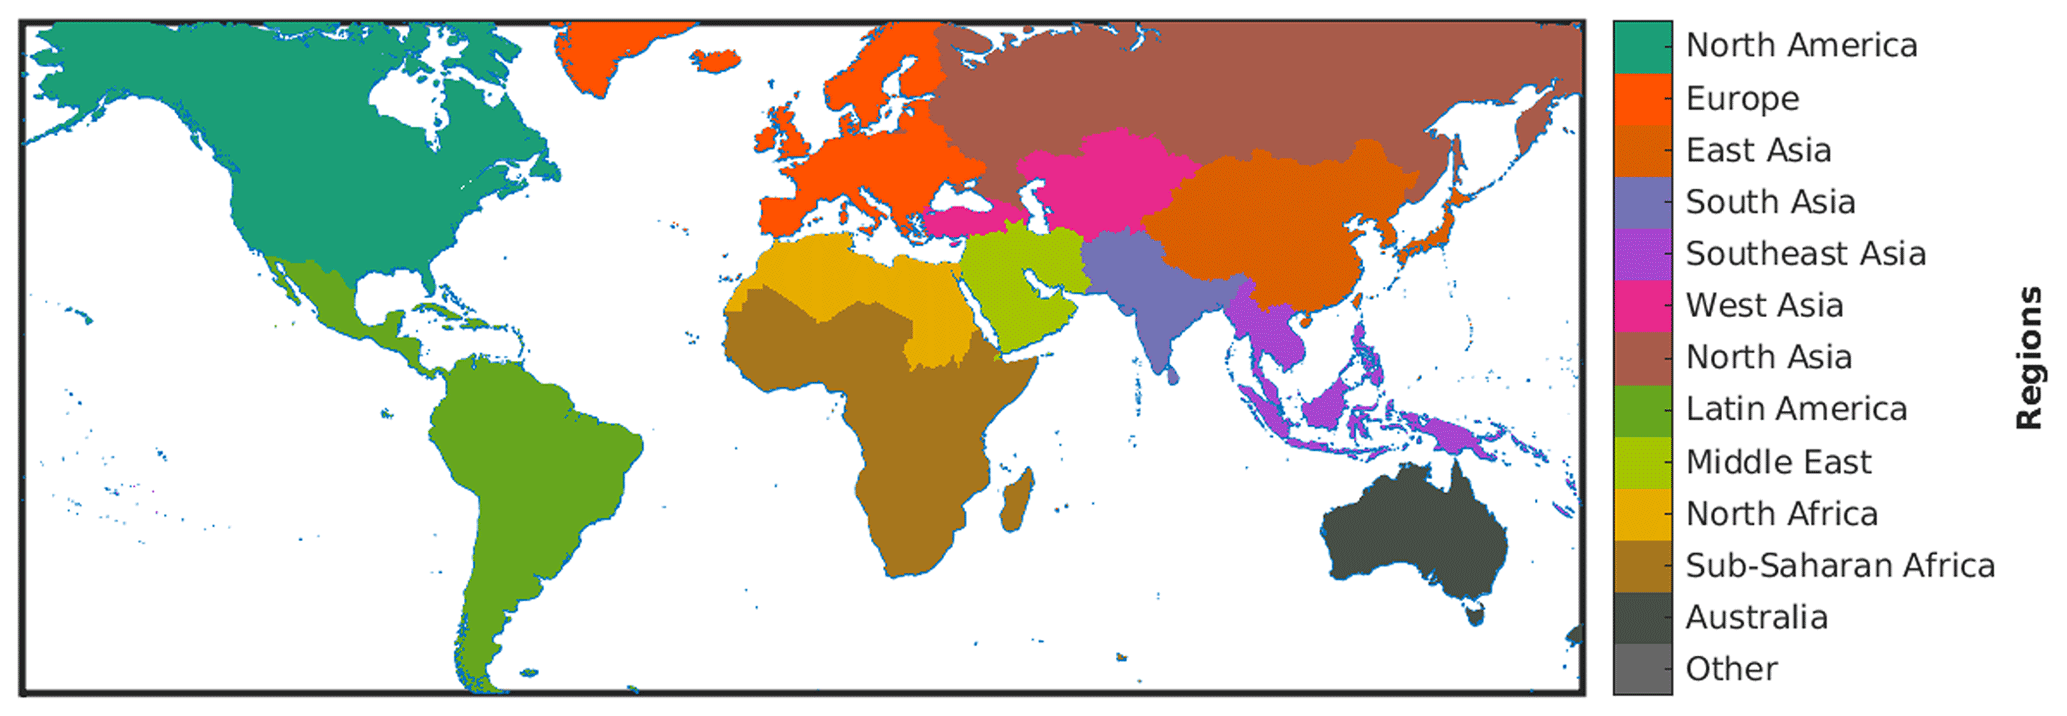
Figure A3Region definitions.
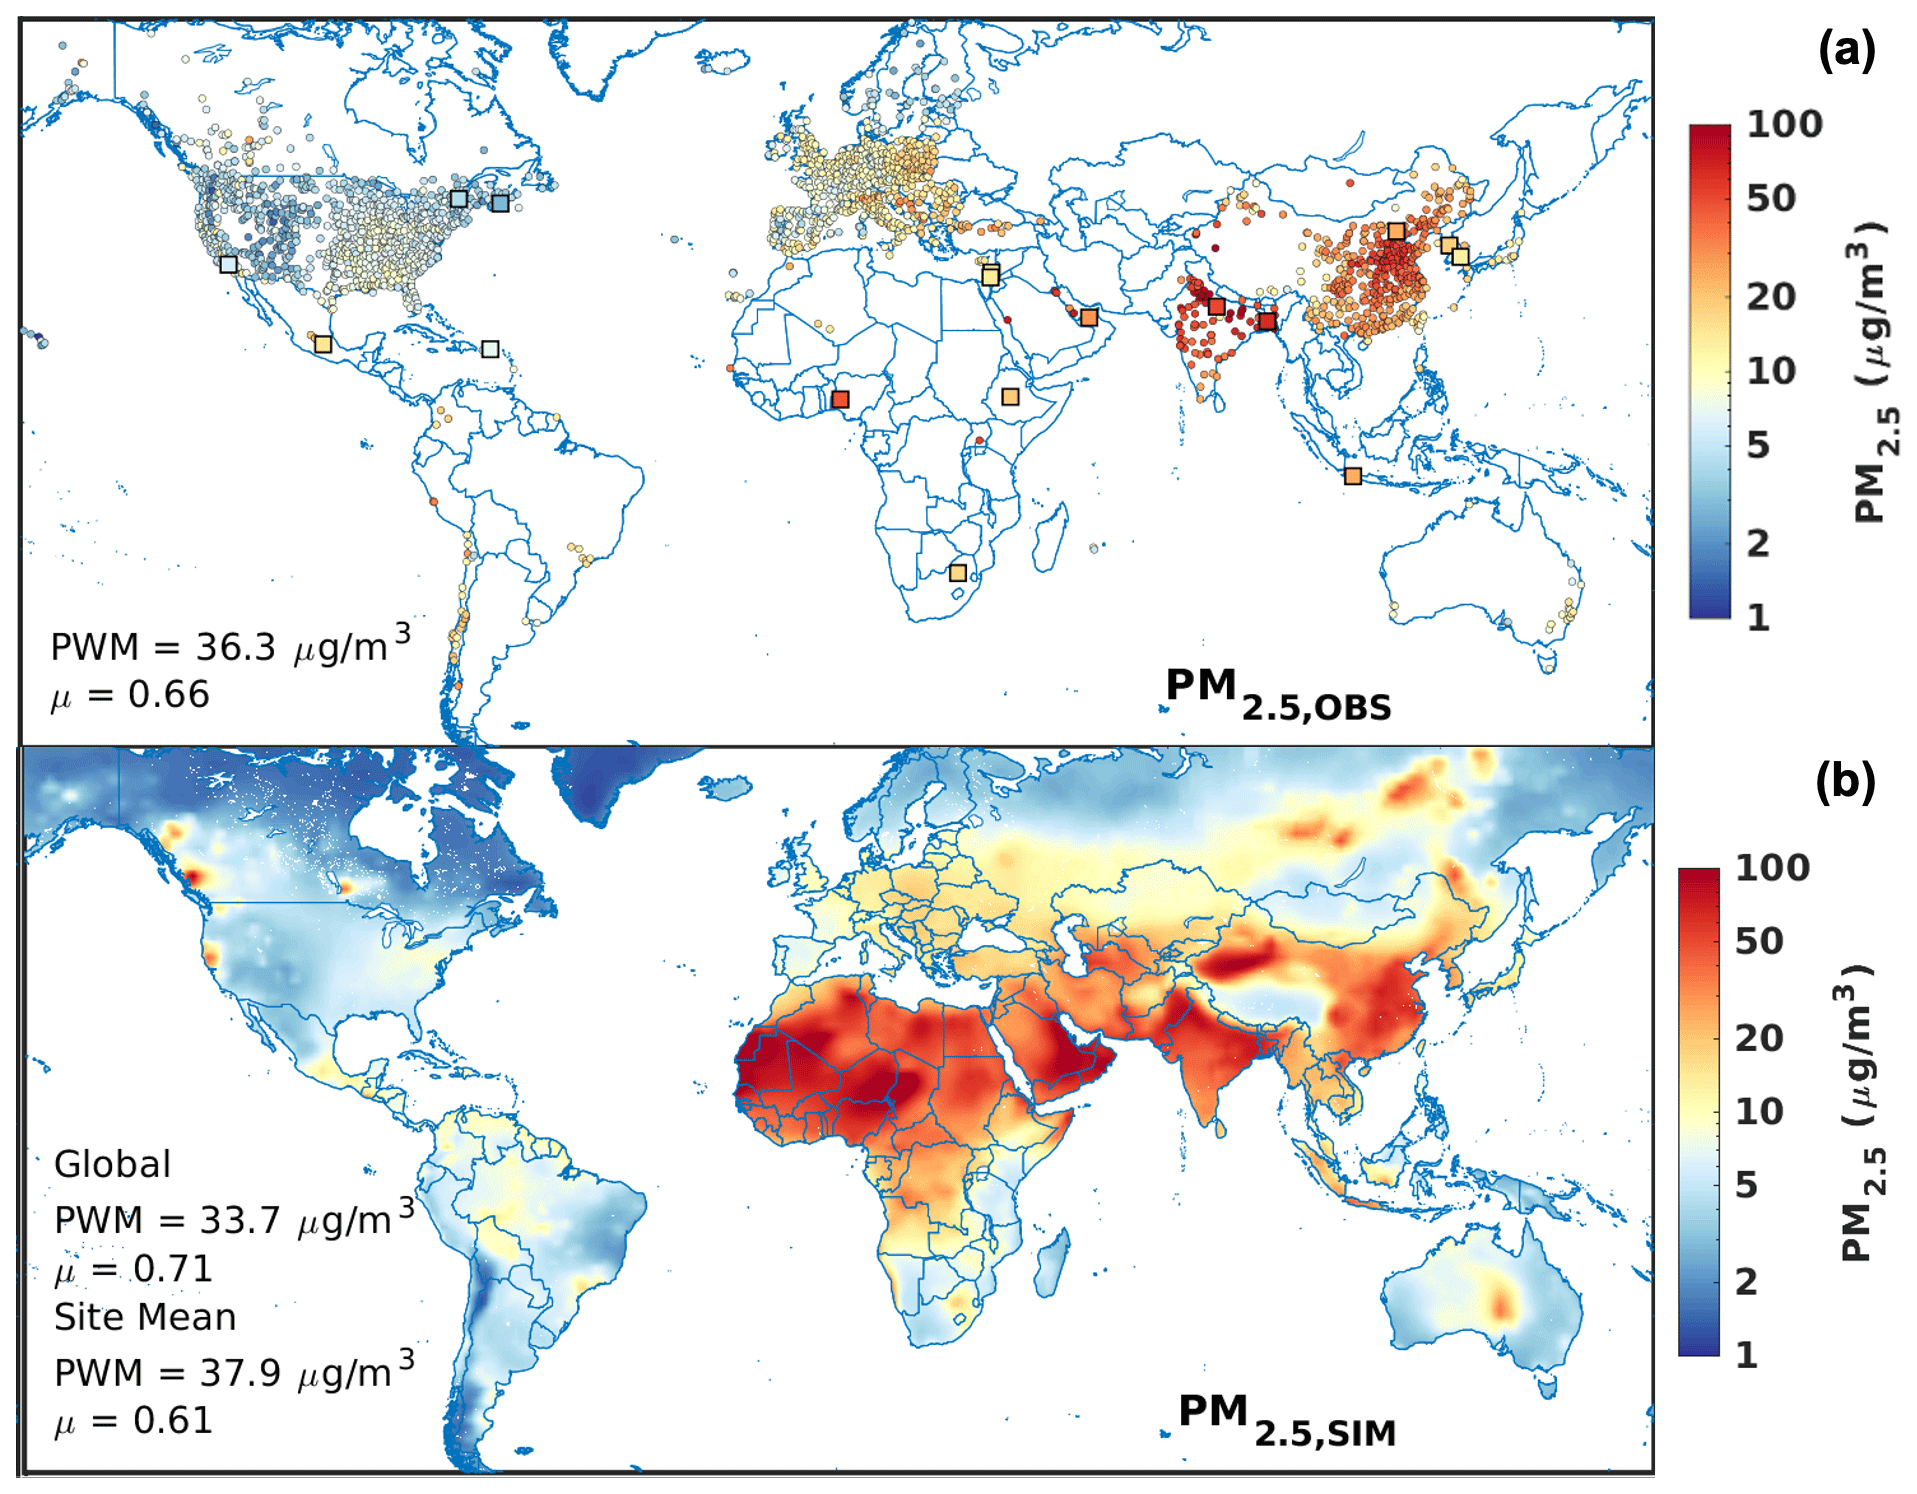
Figure A4Observed (a) and simulated (b) annual mean PM2.5 for 2019. Circles represent measurement sites from regional networks or those reported by the WHO. Squares represent measured PM2.5 from SPARTAN. PWM stands for the population-weighted mean, while μ refers to the coefficient of variation.
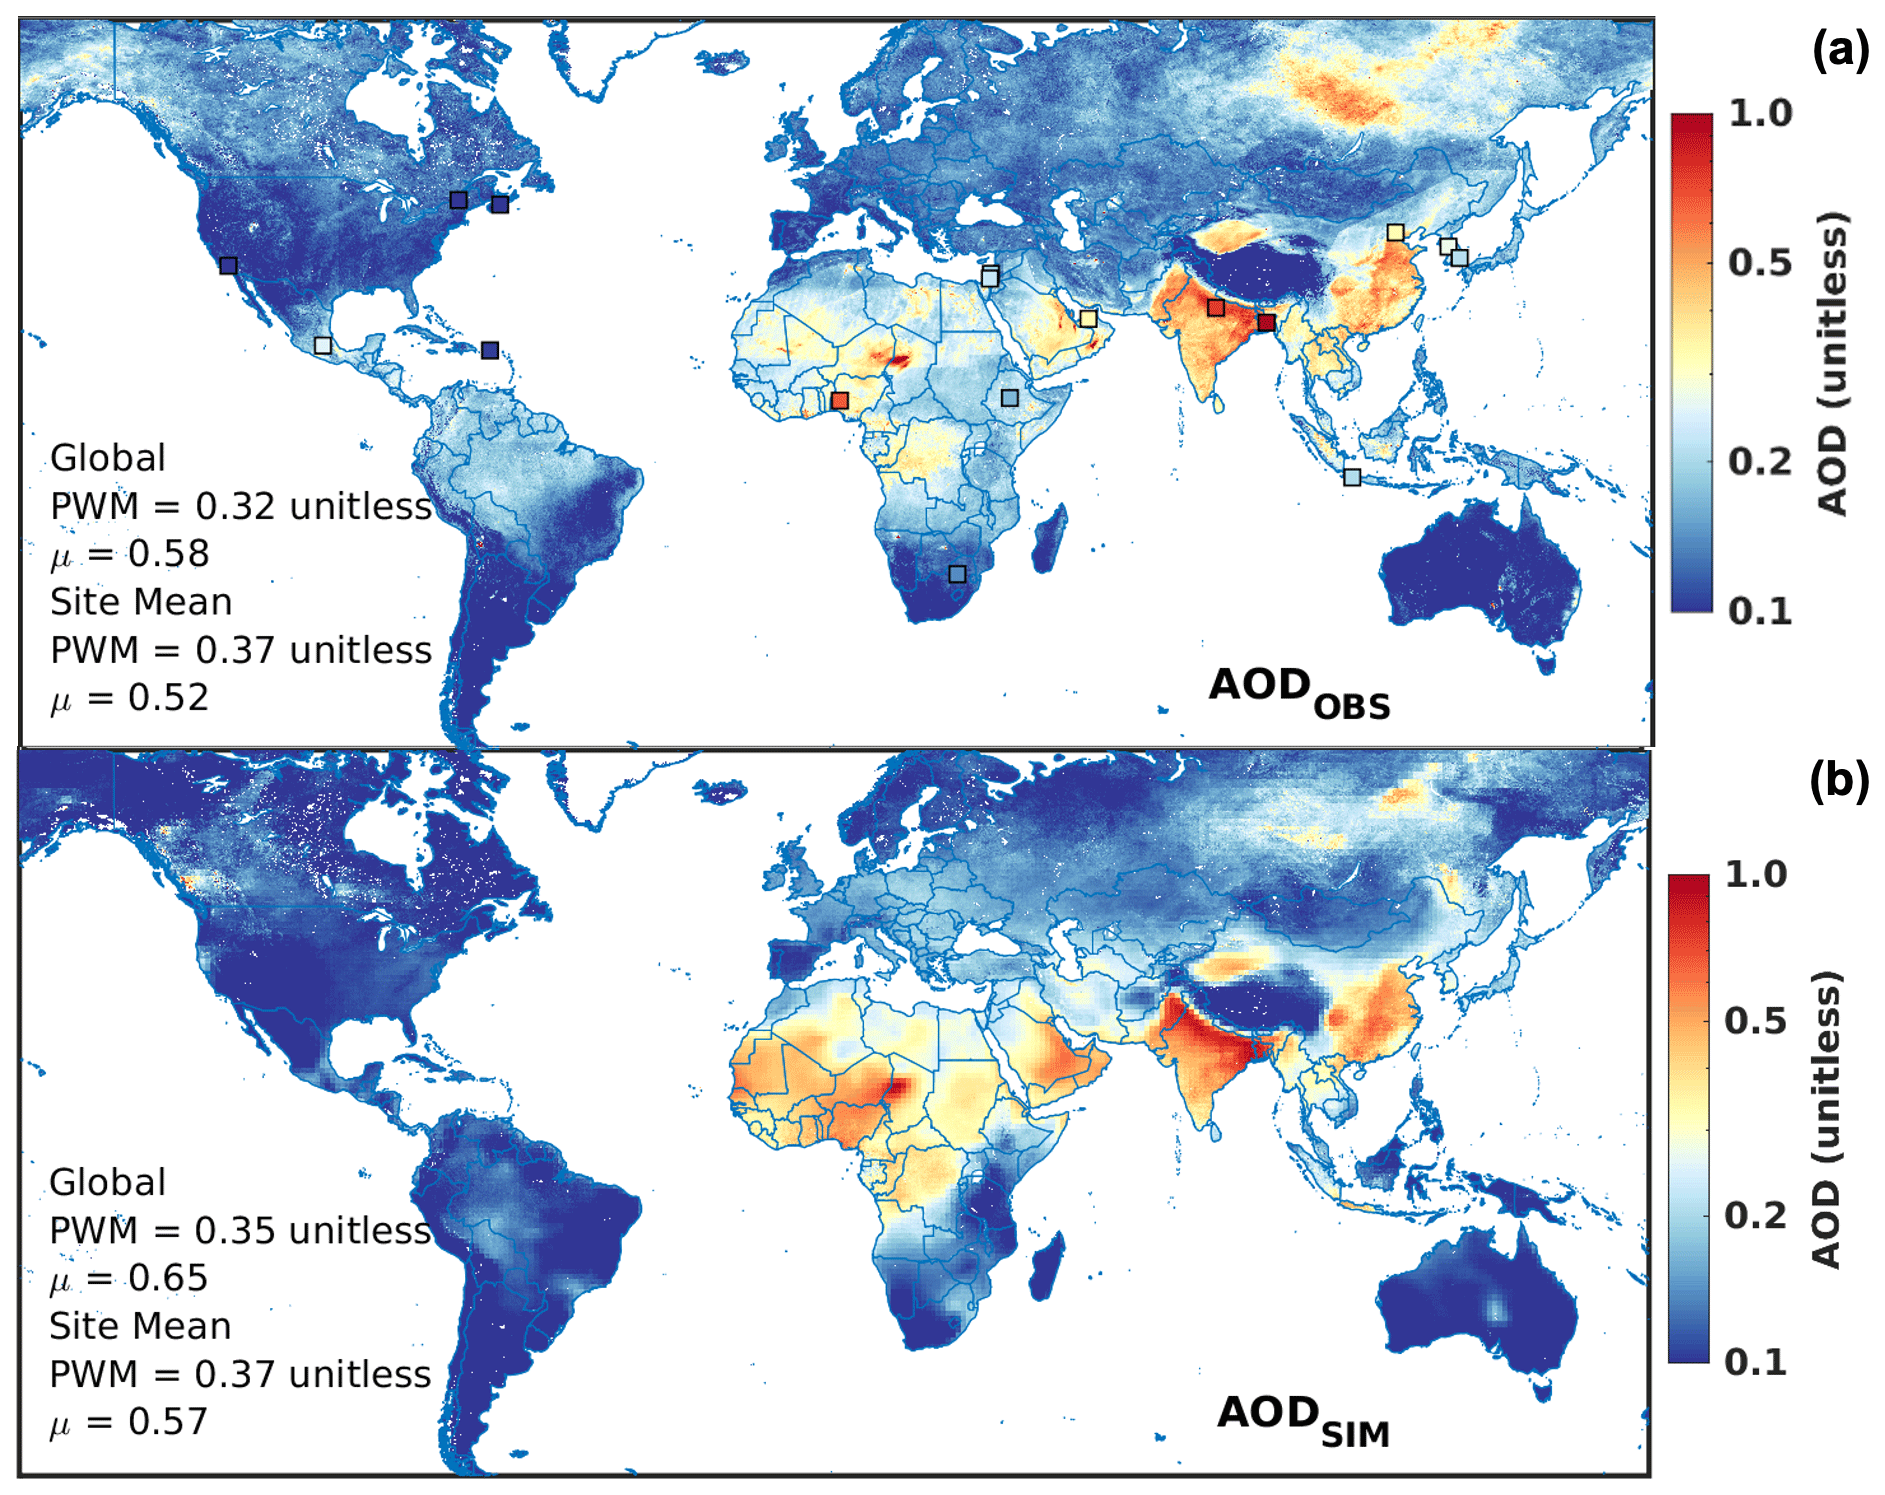
Figure A5Satellite-retrieved (a) and GCHP-simulated (b) annual mean AOD for 2019. Squares represent ground-measured AOD from AERONET. PWM stands for the population-weighted mean, while μ refers to the coefficient of variation.
Table A1Regional population-weighted mean η, PM2.5, and AOD from both observations and simulations. Geophysical PM2.5 is also included. Coefficients of variation are given in parentheses. Regional means and coefficients of variation for North America, Europe, and East Asia can be found in Fig. A6.
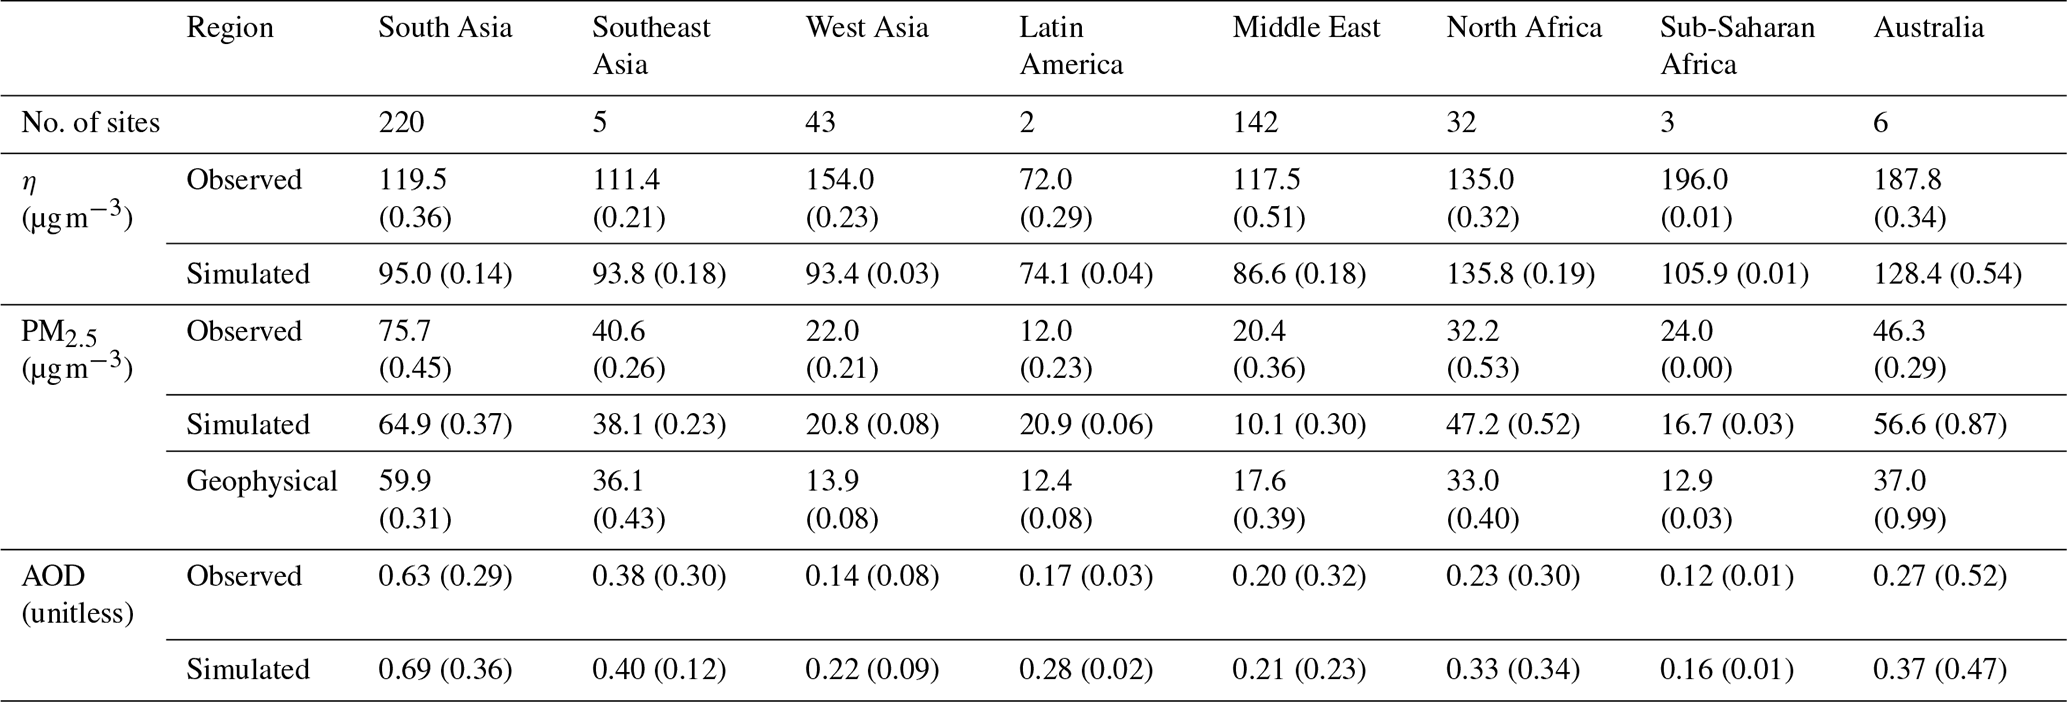
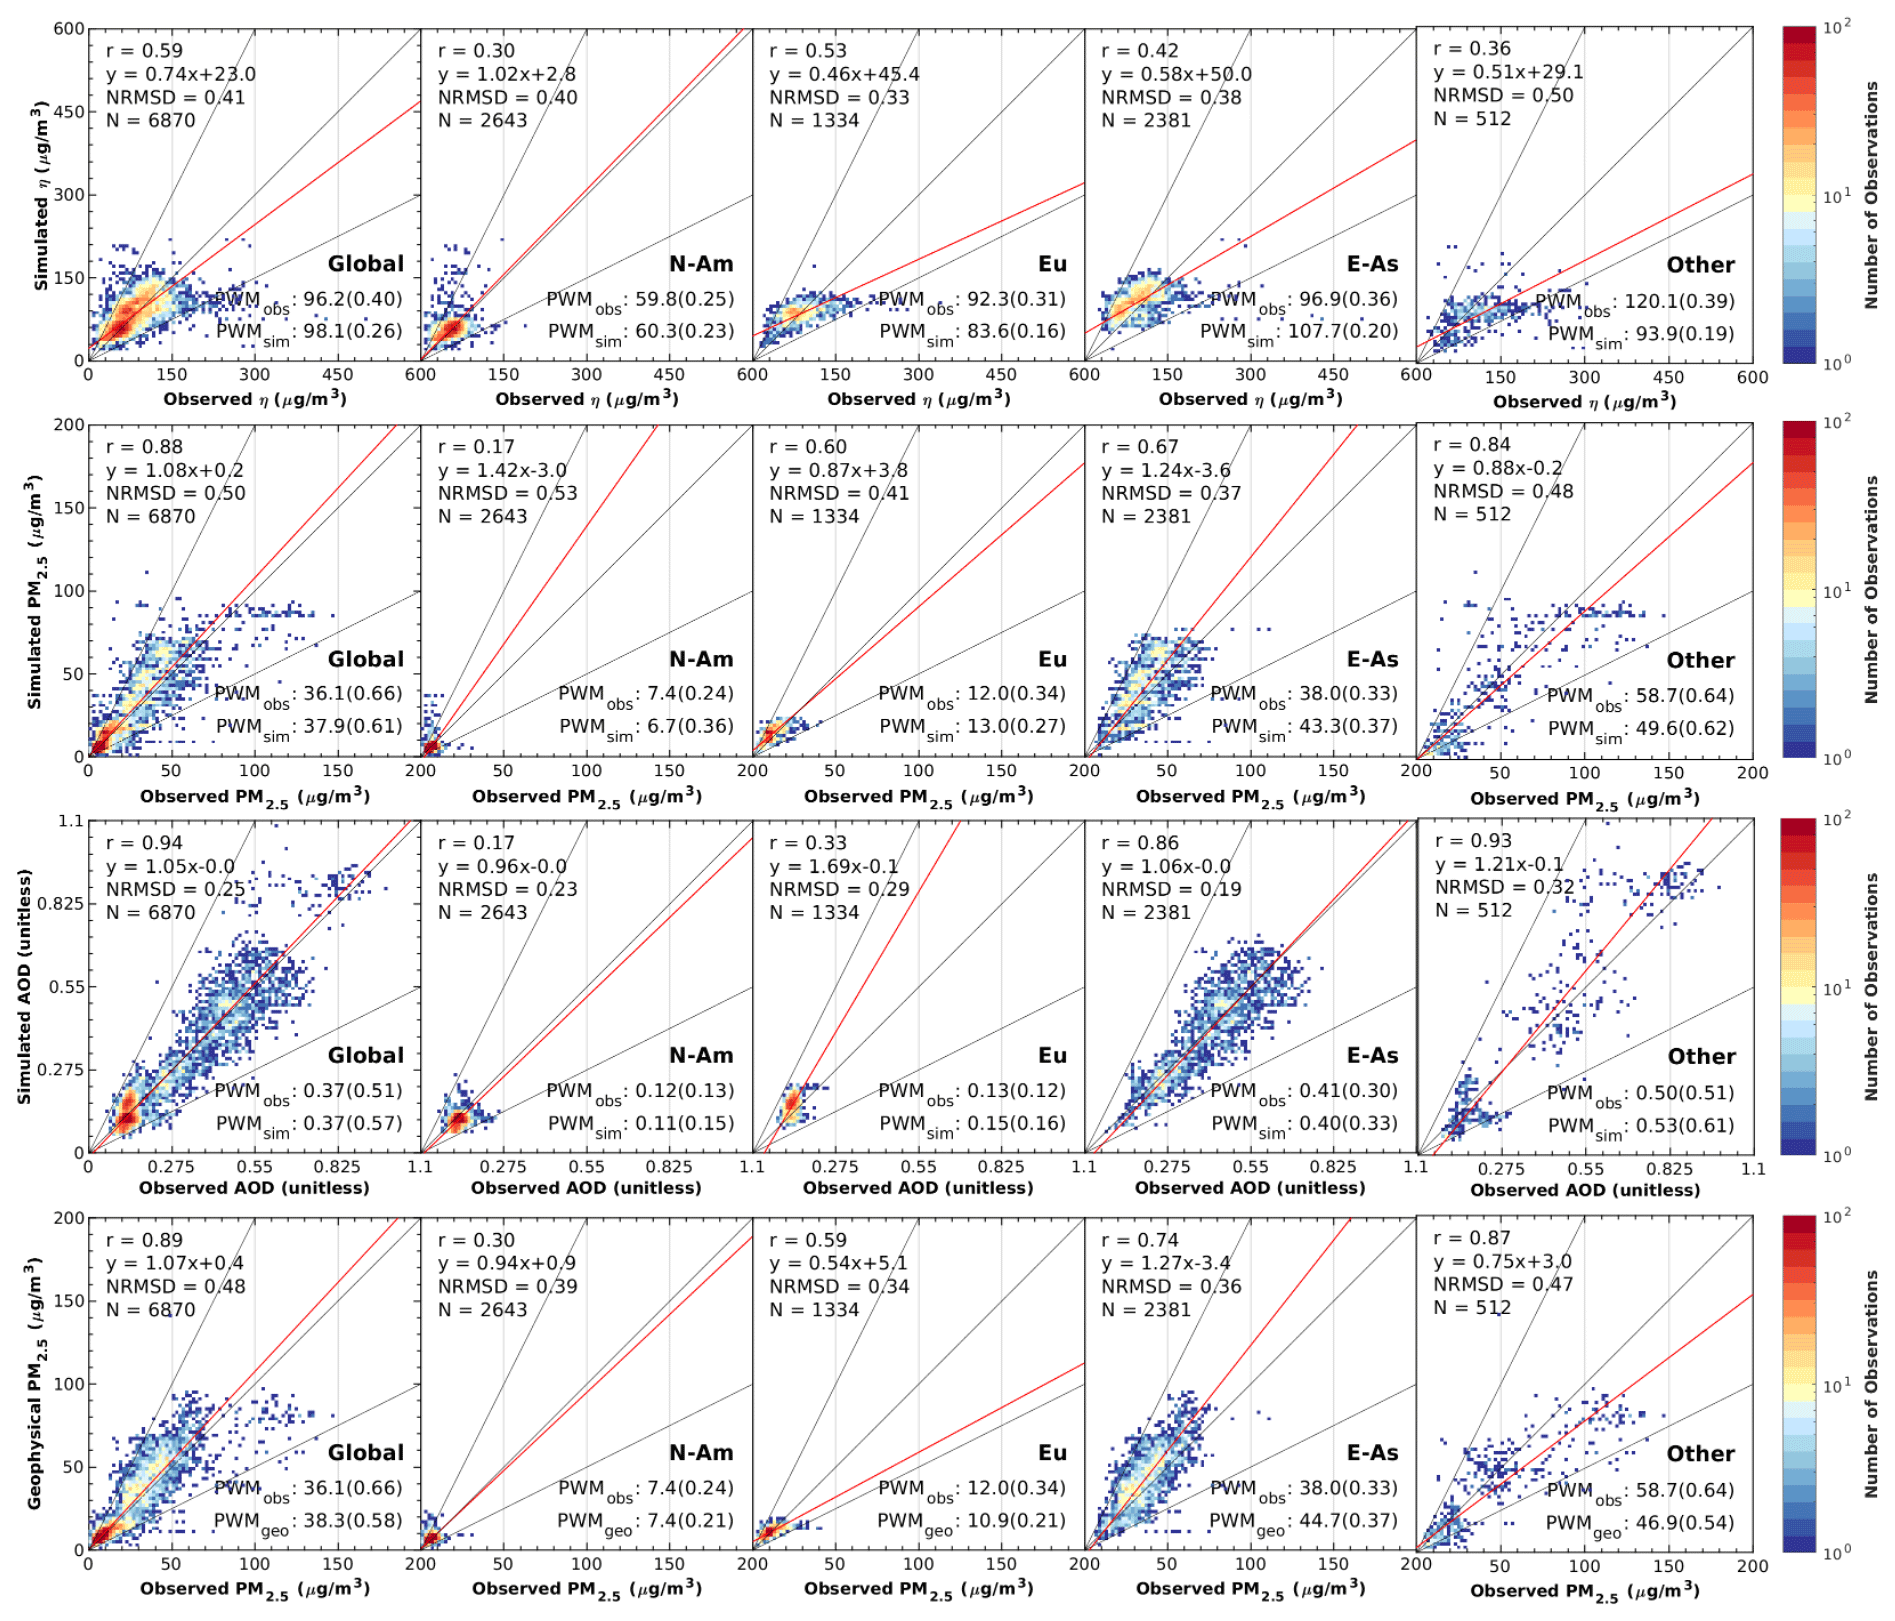
Figure A6Scatter plots of simulated and observed η (top row), simulated and ground-measured PM2.5 (second row), simulated and MAIAC AOD (third row), and geophysical and observed PM2.5 (bottom row). The red line shows the line of best fit using reduced-major-axis linear regression. Insets in the top-left corner of each scatter plot show the coefficient of determination (R2), line of best fit, normalized root-mean-square deviation (NRMSD), and total number of data points (N). The bottom-right insets show the population-weighted means of the observed and simulated/geophysical estimates for each dataset; the coefficients of variation are given in parentheses. Detailed regional means and coefficients of variation for other regions can be found in Table A1. N-Am: North America. Eu: Europe. E-As: East Asia.
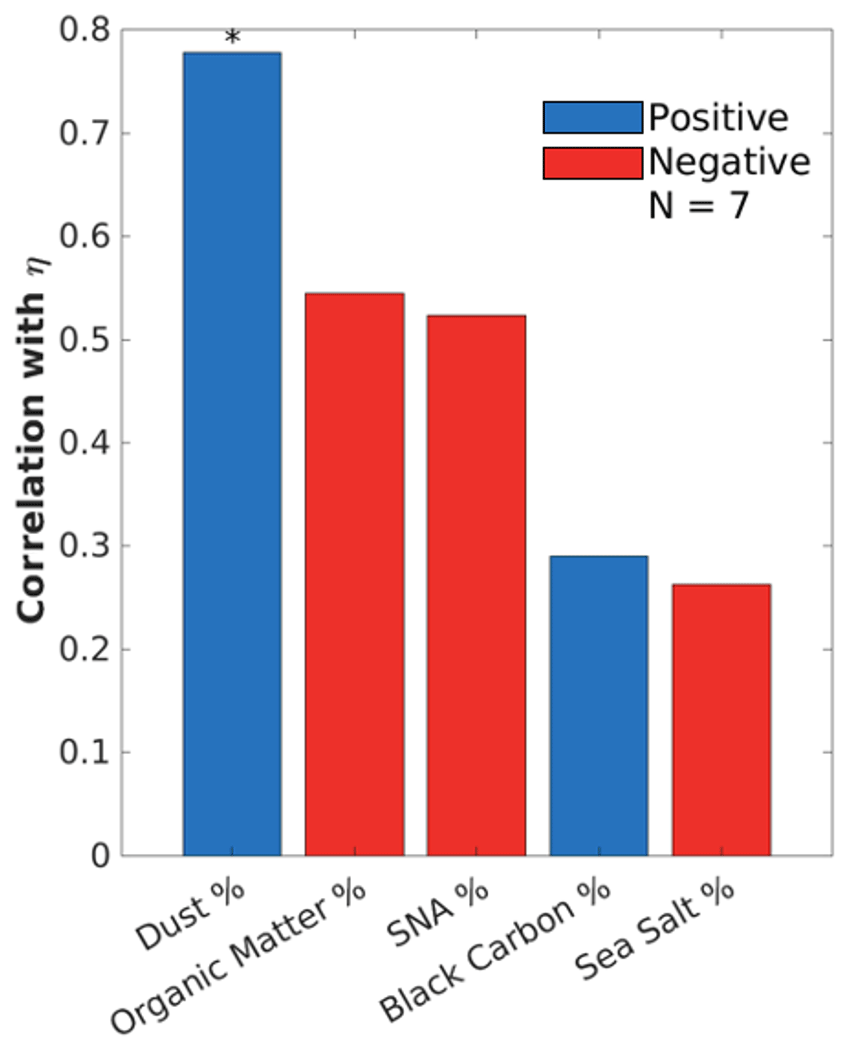
Figure A7Correlation with η with respect to ground-measured aerosol fractional compositions from SPARTAN. Organic matter is inferred from the residual (Snider et al., 2016). Blue bars indicate positive correlations. Red bars indicate negative correlations. The stars above each bar indicate the p value associated with each correlation: “” indicates a p value lower than 0.001, “” indicates a p value lower than 0.01, and “∗” indicates a p value lower than 0.5.
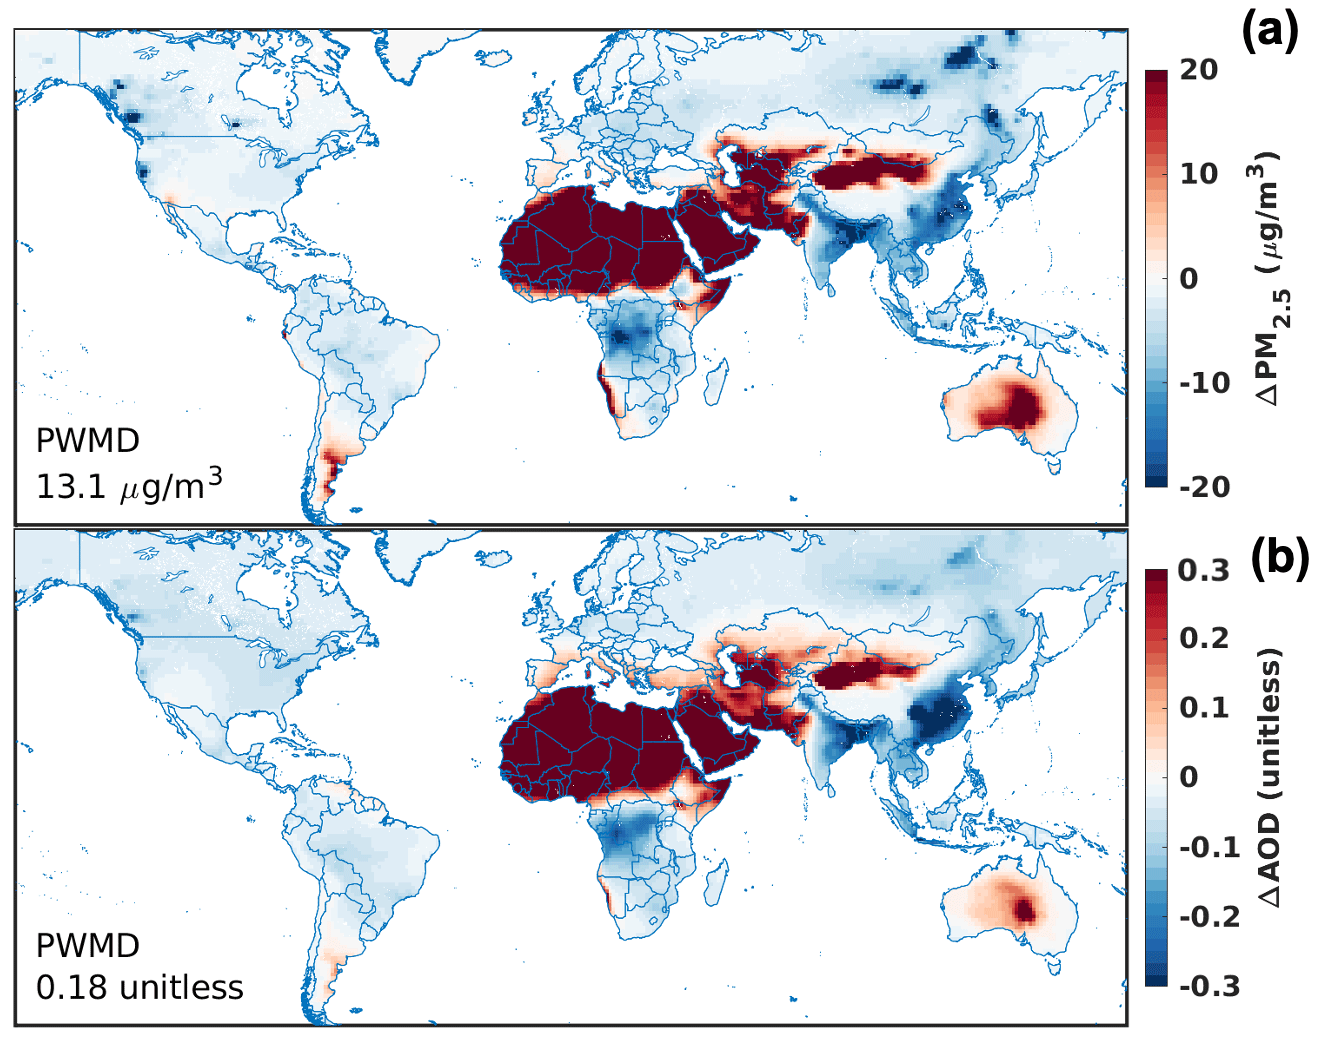
Figure A8Changes in PM2.5 (a) and AOD (b) (test–base) when imposing a global PWM aerosol composition.
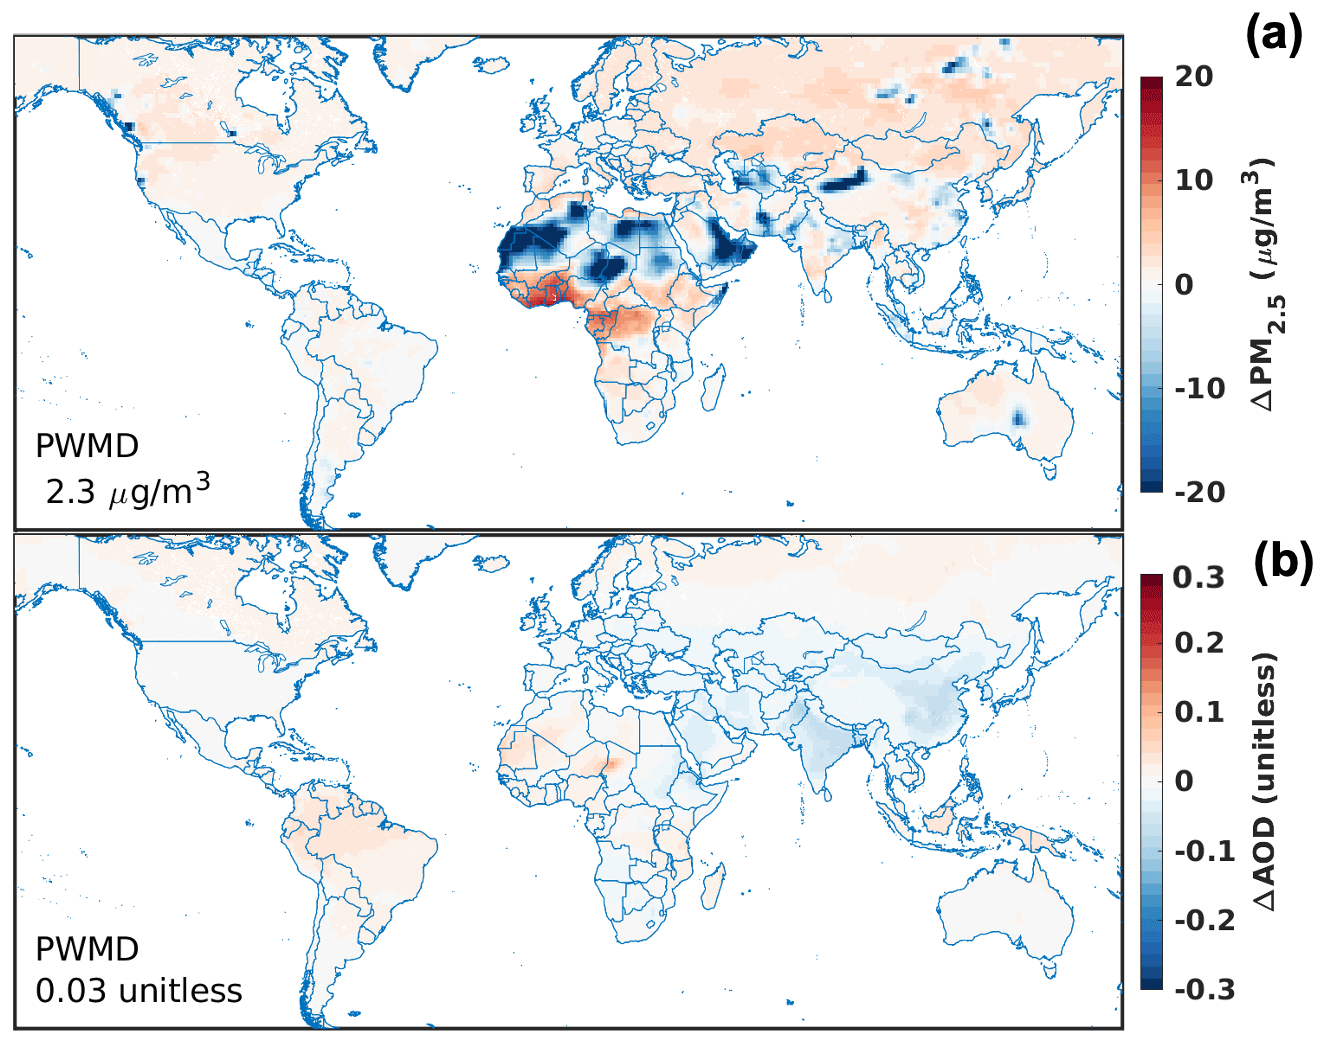
Figure A9Changes in PM2.5 (a) and AOD (b) (test–base) when imposing a global PWM aerosol profile.
GEOS-Chem in its high-performance configuration (version 13.4.0) can be downloaded from https://doi.org/10.5281/zenodo.6512251 (The International GEOS-Chem User Community, 2022).
HZ and RVM designed the study. HZ performed the data analysis and model simulation, with contributions from AvD, CL, YL, DZ, JM, MH, and IS. AvD compiled the MAIAC AOD dataset and ground-based observation datasets for PM2.5. AL contributed to the original MAIAC AOD dataset. CRO and XL contributed to the SPARTAN data utilization and analysis. The paper was written by HZ and RVM, with contributions from all authors.
The contact author has declared that none of the authors has any competing interests.
Publisher's note: Copernicus Publications remains neutral with regard to jurisdictional claims made in the text, published maps, institutional affiliations, or any other geographical representation in this paper. While Copernicus Publications makes every effort to include appropriate place names, the final responsibility lies with the authors.
We thank Mi Zhou from Princeton University for providing ground-based PM2.5 data for India.
This research has been supported by the NASA Earth Sciences Division (grant no. 80NSSC22K0200).
This paper was edited by Zhonghua Zheng and reviewed by two anonymous referees.
Amos, H. M., Jacob, D. J., Holmes, C. D., Fisher, J. A., Wang, Q., Yantosca, R. M., Corbitt, E. S., Galarneau, E., Rutter, A. P., Gustin, M. S., Steffen, A., Schauer, J. J., Graydon, J. A., Louis, V. L. St., Talbot, R. W., Edgerton, E. S., Zhang, Y., and Sunderland, E. M.: Gas-particle partitioning of atmospheric Hg(II) and its effect on global mercury deposition, Atmos. Chem. Phys., 12, 591–603, https://doi.org/10.5194/acp-12-591-2012, 2012.
Banerjee, T., Shitole, A. S., Mhawish, A., Anand, A., Ranjan, R., Khan, M. F., Srithawirat, T., Latif, M. T., and Mall, R. K.: Aerosol Climatology Over South and Southeast Asia: Aerosol Types, Vertical Profile, and Source Fields, J. Geophys. Res.-Atmos., 126, e2020JD033554, https://doi.org/10.1029/2020JD033554, 2021.
Benavente, N. R., Vara-Vela, A. L., Nascimento, J. P., Acuna, J. R., Damascena, A. S., de Fatima Andrade, M., and Yamasoe, M. A.: Air quality simulation with WRF-Chem over southeastern Brazil, part I: Model description and evaluation using ground-based and satellite data, Urban Climate, 52, 101703, https://doi.org/10.1016/j.uclim.2023.101703, 2023.
Bieser, J., Aulinger, A., Matthias, V., Quante, M., and Denier Van Der Gon, H. A. C.: Vertical emission profiles for Europe based on plume rise calculations, Environ. Pollut., 159, 2935–2946, https://doi.org/10.1016/J.ENVPOL.2011.04.030, 2011.
Brauer, M., Roth, G. A., Aravkin, A. Y., Zheng, P., Abate, K. H., Abate, Y. H., Abbafati, C., Abbasgholizadeh, R., Abbasi, M. A., Abbasian, M., Abbasifard, M., Abbasi-Kangevari, M., ElHafeez, S. A., Abd-Elsalam, S., Abdi, P., Abdollahi, M., Abdoun, M., Abdulah, D. M., Abdullahi, A., Abebe, M., Abedi, A., Abedi, A., Abegaz, T. M., Zuñiga, R. A. A., Abiodun, O., Abiso, T. L., Aboagye, R. G., Abolhassani, H., Abouzid, M., Aboye, G. B., Abreu, L. G., Abualruz, H., Abubakar, B., Abu-Gharbieh, E., Abukhadijah, H. J. J., Aburuz, S., Abu-Zaid, A., Adane, M. M., Addo, I. Y., Addolorato, G., Adedoyin, R. A., Adekanmbi, V., Aden, B., Adetunji, J. B., Adeyeoluwa, T. E., Adha, R., Adibi, A., Adnani, Q. E. S., Adzigbli, L. A., Afolabi, A. A., Afolabi, R. F., Afshin, A., Afyouni, S., Afzal, M. S., Afzal, S., Agampodi, S. B., Agbozo, F., Aghamiri, S., Agodi, A., Agrawal, A., Agyemang-Duah, W., Ahinkorah, B. O., Ahmad, A., Ahmad, D., Ahmad, F., Ahmad, N., Ahmad, S., Ahmad, T., Ahmed, A., Ahmed, A., Ahmed, A., Ahmed, L. A., Ahmed, M. B., Ahmed, S., Ahmed, S. A., Ajami, M., Akalu, G. T., Akara, E. M., Akbarialiabad, H., Akhlaghi, S., Akinosoglou, K., Akinyemiju, T., Akkaif, M. A., Akkala, S., Akombi-Inyang, B., Awaidy, S. A., Hasan, S. M. A., Alahdab, F., AL-Ahdal, T. M. A., Alalalmeh, S. O., Alalwan, T. A., Al-Aly, Z., Alam, K., Alam, N., Alanezi, F. M., Alanzi, T. M., Albakri, A., AlBataineh, M. T., Aldhaleei, W. A., et al.: Global burden and strength of evidence for 88 risk factors in 204 countries and 811 subnational locations, 1990–2021: a systematic analysis for the Global Burden of Disease Study 2021, Lancet, 403, 2162–2203, https://doi.org/10.1016/S0140-6736(24)00933-4, 2024.
Burnett, R., Chen, H., Szyszkowicz, M., Fann, N., Hubbell, B., Pope, C. A., Apte, J. S., Brauer, M., Cohen, A., Weichenthal, S., Coggins, J., Di, Q., Brunekreef, B., Frostad, J., Lim, S. S., Kan, H., Walker, K. D., Thurston, G. D., Hayes, R. B., Lim, C. C., Turner, M. C., Jerrett, M., Krewski, D., Gapstur, S. M., Diver, W. R., Ostro, B., Goldberg, D., Crouse, D. L., Martin, R. V., Peters, P., Pinault, L., Tjepkema, M., Van Donkelaar, A., Villeneuve, P. J., Miller, A. B., Yin, P., Zhou, M., Wang, L., Janssen, N. A. H., Marra, M., Atkinson, R. W., Tsang, H., Thach, T. Q., Cannon, J. B., Allen, R. T., Hart, J. E., Laden, F., Cesaroni, G., Forastiere, F., Weinmayr, G., Jaensch, A., Nagel, G., Concin, H., and Spadaro, J. V.: Global estimates of mortality associated with longterm exposure to outdoor fine particulate matter, P. Natl. Acad. Sci. USA, 115, 9592–9597, https://doi.org/10.1073/pnas.1803222115, 2018.
Canagaratna, M. R., Jimenez, J. L., Kroll, J. H., Chen, Q., Kessler, S. H., Massoli, P., Hildebrandt Ruiz, L., Fortner, E., Williams, L. R., Wilson, K. R., Surratt, J. D., Donahue, N. M., Jayne, J. T., and Worsnop, D. R.: Elemental ratio measurements of organic compounds using aerosol mass spectrometry: characterization, improved calibration, and implications, Atmos. Chem. Phys., 15, 253–272, https://doi.org/10.5194/acp-15-253-2015, 2015.
CEDS: A Community Emissions Data System (CEDS) for Historical Emissions, https://www.pnnl.gov/projects/ceds (last access: 6 July 2024), 2024.
Center for International Earth Science Information Network – CIESIN: Gridded Population of the World, Version 4 (GPWv4): Population Density, Revision 11, Columbia University, https://doi.org/10.7927/H49C6VHW, 2018.
Christidis, T., Erickson, A. C., Pappin, A. J., Crouse, D. L., Pinault, L. L., Weichenthal, S. A., Brook, J. R., van Donkelaar, A., Hystad, P., Martin, R. V., Tjepkema, M., Burnett, R. T., and Brauer, M.: Low concentrations of fine particle air pollution and mortality in the Canadian Community Health Survey cohort, Environ. Health, 18, 84, https://doi.org/10.1186/s12940-019-0518-y, 2019.
Chu, D. A., Ferrare, R., Szykman, J., Lewis, J., Scarino, A., Hains, J., Burton, S., Chen, G., Tsai, T., Hostetler, C., Hair, J., Holben, B., and Crawford, J.: Regional characteristics of the relationship between columnar AOD and surface PM2.5: Application of lidar aerosol extinction profiles over Baltimore–Washington Corridor during DISCOVER-AQ, Atmos. Environ., 101, 338e349-349, https://doi.org/10.1016/j.atmosenv.2014.11.034, 2015.
Cohen, A. J., Brauer, M., Burnett, R., Anderson, H. R., Frostad, J., Estep, K., Balakrishnan, K., Brunekreef, B., Dandona, L., Dandona, R., Feigin, V., Freedman, G., Hubbell, B., Jobling, A., Kan, H., Knibbs, L., Liu, Y., Martin, R., Morawska, L., Pope, C. A., Shin, H., Straif, K., Shaddick, G., Thomas, M., van Dingenen, R., van Donkelaar, A., Vos, T., Murray, C. J. L., and Forouzanfar, M. H.: Estimates and 25-year trends of the global burden of disease attributable to ambient air pollution: an analysis of data from the Global Burden of Diseases Study 2015, Lancet, 389, 1907–1918, https://doi.org/10.1016/S0140-6736(17)30505-6, 2017.
Damascena, A. S., Yamasoe, M. A., Martins, V. S., Rosas, J., Benavente, N. R., Sánchez, M. P., Tanaka, N. I., and Saldiva, P. H. N.: Exploring the relationship between high-resolution aerosol optical depth values and ground-level particulate matter concentrations in the Metropolitan Area of São Paulo, Atmos. Environ., 244, 117949, https://doi.org/10.1016/j.atmosenv.2020.117949, 2021.
Di, Q., Kloog, I., Koutrakis, P., Lyapustin, A., Wang, Y., and Schwartz, J.: Assessing PM2.5 Exposures with High Spatiotemporal Resolution across the Continental United States, Environ. Sci. Technol., 50, 4712–4721, https://doi.org/10.1021/acs.est.5b06121, 2016.
Eastham, S. D., Long, M. S., Keller, C. A., Lundgren, E., Yantosca, R. M., Zhuang, J., Li, C., Lee, C. J., Yannetti, M., Auer, B. M., Clune, T. L., Kouatchou, J., Putman, W. M., Thompson, M. A., Trayanov, A. L., Molod, A. M., Martin, R. V., and Jacob, D. J.: GEOS-Chem High Performance (GCHP v11-02c): a next-generation implementation of the GEOS-Chem chemical transport model for massively parallel applications, Geosci. Model Dev., 11, 2941–2953, https://doi.org/10.5194/gmd-11-2941-2018, 2018.
Fairlie, D. T., Jacob, D. J., and Park, R. J.: The impact of transpacific transport of mineral dust in the United States, Atmos. Environ., 41, 1251–1266, https://doi.org/10.1016/j.atmosenv.2006.09.048, 2007.
Ford, B. and Heald, C. L.: Exploring the uncertainty associated with satellite-based estimates of premature mortality due to exposure to fine particulate matter, Atmos. Chem. Phys., 16, 3499–3523, https://doi.org/10.5194/acp-16-3499-2016, 2016.
Fountoukis, C. and Nenes, A.: ISORROPIAII: A computationally efficient thermodynamic equilibrium model for K+–Ca2+–Mg2+––Na+–––Cl−–H2O aerosols, Atmospheric Chemistry and Physics, 7, 4639–4659, https://doi.org/10.5194/acp-7-4639-2007, 2007.
Geng, G., Zhang, Q., Tong, D., Li, M., Zheng, Y., Wang, S., and He, K.: Chemical composition of ambient PM2.5 over China and relationship to precursor emissions during 2005–2012, Atmos. Chem. Phys., 17, 9187–9203, https://doi.org/10.5194/acp-17-9187-2017, 2017.
Giles, D. M., Sinyuk, A., Sorokin, M. G., Schafer, J. S., Smirnov, A., Slutsker, I., Eck, T. F., Holben, B. N., Lewis, J. R., Campbell, J. R., Welton, E. J., Korkin, S. V., and Lyapustin, A. I.: Advancements in the Aerosol Robotic Network (AERONET) Version 3 database – automated near-real-time quality control algorithm with improved cloud screening for Sun photometer aerosol optical depth (AOD) measurements, Atmos. Meas. Tech., 12, 169–209, https://doi.org/10.5194/amt-12-169-2019, 2019.
Guo, J., Xia, F., Zhang, Y., Liu, H., Li, J., Lou, M., He, J., Yan, Y., Wang, F., Min, M., and Zhai, P.: Impact of diurnal variability and meteorological factors on the PM2.5–AOD relationship: Implications for PM2.5 remote sensing, Environ. Pollut., 221, 94–104, https://doi.org/10.1016/j.envpol.2016.11.043, 2017.
Gupta, P., Christopher, S. A., Wang, J., Gehrig, R., Lee, Y., and Kumar, N.: Satellite remote sensing of particulate matter and air quality assessment over global cities, Atmos. Environ., 40, 5880–5892, https://doi.org/10.1016/j.atmosenv.2006.03.016, 2006.
Hammer, M. S., Martin, R. V., van Donkelaar, A., Buchard, V., Torres, O., Ridley, D. A., and Spurr, R. J. D.: Interpreting the ultraviolet aerosol index observed with the OMI satellite instrument to understand absorption by organic aerosols: implications for atmospheric oxidation and direct radiative effects, Atmos. Chem. Phys., 16, 2507–2523, https://doi.org/10.5194/acp-16-2507-2016, 2016.
Hao, H., Wang, Y., Zhu, Q., Zhang, H., Rosenberg, A., Schwartz, J., Amini, H., van Donkelaar, A., Martin, R., Liu, P., Weber, R., Russel, A., Yitshak-sade, M., Chang, H., and Shi, L.: National Cohort Study of Long-Term Exposure to PM2.5 Components and Mortality in Medicare American Older Adults, Environ. Sci. Technol., 57, 6835–6843, https://doi.org/10.1021/acs.est.2c07064, 2023.
He, Q., Wang, M., and Yim, S. H. L.: The spatiotemporal relationship between PM2.5 and aerosol optical depth in China: influencing factors and implications for satellite PM2.5 estimations using MAIAC aerosol optical depth, Atmos. Chem. Phys., 21, 18375–18391, https://doi.org/10.5194/acp-21-18375-2021, 2021.
Heald, C. L., Collett Jr., J. L., Lee, T., Benedict, K. B., Schwandner, F. M., Li, Y., Clarisse, L., Hurtmans, D. R., Van Damme, M., Clerbaux, C., Coheur, P.-F., Philip, S., Martin, R. V., and Pye, H. O. T.: Atmospheric ammonia and particulate inorganic nitrogen over the United States, Atmos. Chem. Phys., 12, 10295–10312, https://doi.org/10.5194/acp-12-10295-2012, 2012.
Hoesly, R. M., Smith, S. J., Feng, L., Klimont, Z., Janssens-Maenhout, G., Pitkanen, T., Seibert, J. J., Vu, L., Andres, R. J., Bolt, R. M., Bond, T. C., Dawidowski, L., Kholod, N., Kurokawa, J.-I., Li, M., Liu, L., Lu, Z., Moura, M. C. P., O'Rourke, P. R., and Zhang, Q.: Historical (1750–2014) anthropogenic emissions of reactive gases and aerosols from the Community Emissions Data System (CEDS), Geosci. Model Dev., 11, 369–408, https://doi.org/10.5194/gmd-11-369-2018, 2018.
Hu, X., Waller, L. A., Lyapustin, A., Wang, Y., and Liu, Y.: 10-year spatial and temporal trends of PM2.5 concentrations in the southeastern US estimated using high-resolution satellite data, Atmos. Chem. Phys., 14, 6301–6314, https://doi.org/10.5194/acp-14-6301-2014, 2014.
Jaeglé, L., Quinn, P. K., Bates, T. S., Alexander, B., and Lin, J.-T.: Global distribution of sea salt aerosols: new constraints from in situ and remote sensing observations, Atmos. Chem. Phys., 11, 3137–3157, https://doi.org/10.5194/acp-11-3137-2011, 2011.
Jin, Q., Crippa, P., and Pryor, S. C.: Spatial characteristics and temporal evolution of the relationship between PM2.5 and aerosol optical depth over the eastern USA during 2003–2017, Atmos. Environ., 239, 117718, https://doi.org/10.1016/j.atmosenv.2020.117718, 2020.
Jin, X., Fiore, A. M., Curci, G., Lyapustin, A., Civerolo, K., Ku, M., van Donkelaar, A., and Martin, R. V.: Assessing uncertainties of a geophysical approach to estimate surface fine particulate matter distributions from satellite-observed aerosol optical depth, Atmos. Chem. Phys., 19, 295–313, https://doi.org/10.5194/acp-19-295-2019, 2019.
Kim, P. S., Jacob, D. J., Fisher, J. A., Travis, K., Yu, K., Zhu, L., Yantosca, R. M., Sulprizio, M. P., Jimenez, J. L., Campuzano-Jost, P., Froyd, K. D., Liao, J., Hair, J. W., Fenn, M. A., Butler, C. F., Wagner, N. L., Gordon, T. D., Welti, A., Wennberg, P. O., Crounse, J. D., St. Clair, J. M., Teng, A. P., Millet, D. B., Schwarz, J. P., Markovic, M. Z., and Perring, A. E.: Sources, seasonality, and trends of southeast US aerosol: an integrated analysis of surface, aircraft, and satellite observations with the GEOS-Chem chemical transport model, Atmos. Chem. Phys., 15, 10411–10433, https://doi.org/10.5194/acp-15-10411-2015, 2015.
Kondragunta, S., Veihelmann, B., and Chatfield, R. J.: Monitoring Surface PM2.5: An International Constellation Approach to Enhancing the Role of Satellite Observations, NOAA, https://doi.org/10.25923/7SNZ-VN34, 2022.
Kopke, P., Hess, M., Schult, I., and Shettle, E. P.: Global Aerosol Data Set, No. 243, Max-Planck-Institut Für Meteorologie, Hamburg, https://aeris-geisa.ipsl.fr/geisa_files/fichiers_pdf/2011/GADS_MPI-Report_243.pdf (last access: 12 October 2024), 1997.
Latimer, R. N. C. and Martin, R. V.: Interpretation of measured aerosol mass scattering efficiency over North America using a chemical transport model, Atmos. Chem. Phys., 19, 2635–2653, https://doi.org/10.5194/acp-19-2635-2019, 2019.
Li, J., Carlson, B. E., and Lacis, A. A.: How well do satellite AOD observations represent the spatial and temporal variability of PM2.5 concentration for the United States?, Atmos. Environ., 102, 260–273, https://doi.org/10.1016/j.atmosenv.2014.12.010, 2015.
Li, Y., Martin, R. V., Li, C., Boys, B. L., van Donkelaar, A., Meng, J., and Pierce, J. R.: Development and evaluation of processes affecting simulation of diel fine particulate matter variation in the GEOS-Chem model, Atmos. Chem. Phys., 23, 12525–12543, https://doi.org/10.5194/acp-23-12525-2023, 2023.
Lin, H., Jacob, D. J., Lundgren, E. W., Sulprizio, M. P., Keller, C. A., Fritz, T. M., Eastham, S. D., Emmons, L. K., Campbell, P. C., Baker, B., Saylor, R. D., and Montuoro, R.: Harmonized Emissions Component (HEMCO) 3.0 as a versatile emissions component for atmospheric models: application in the GEOS-Chem, NASA GEOS, WRF-GC, CESM2, NOAA GEFS-Aerosol, and NOAA UFS models, Geosci. Model Dev., 14, 5487–5506, https://doi.org/10.5194/gmd-14-5487-2021, 2021.
Liu, H., Jacob, D. J., Bey, I., and Yantosca, R. M.: Constraints from 210Pb and 7Be on wet deposition and transport in a global three-dimensional chemical tracer model driven by assimilated meteorological fields, J. Geophys. Res.-Atmos., 106, 12109–12128, https://doi.org/10.1029/2000JD900839, 2001.
Liu, X., Turner, J. R., Hand, J. L., Schichtel, B. A., and Martin, R. V.: A Global-Scale Mineral Dust Equation, J. Geophys. Res.-Atmos., 127, e2022JD036937, https://doi.org/10.1029/2022JD036937, 2022.
Liu, X., Turner, J. R., Oxford, C. R., McNeill, J., Walsh, B., Le Roy, E., Weagle, C. L., Stone, E., Zhu, H., Liu, W., Wei, Z., Hyslop, N. P., Giacomo, J., Dillner, A. M., Salam, A., Hossen, A., Islam, Z., Abboud, I., Akoshile, C., Amador-Muñoz, O., Anh, N. X., Asfaw, A., Balasubramanian, R., Chang, R. Y.-W., Coburn, C., Dey, S., Diner, D. J., Dong, J., Farrah, T., Gahungu, P., Garland, R. M., Grutter de la Mora, M., Hasheminassab, S., John, J., Kim, J., Kim, J. S., Langerman, K., Lee, P.-C., Lestari, P., Liu, Y., Mamo, T., Martins, M., Mayol-Bracero, O. L., Naidoo, M., Park, S. S., Schechner, Y., Schofield, R., Tripathi, S. N., Windwer, E., Wu, M.-T., Zhang, Q., Brauer, M., Rudich, Y., and Martin, R. V.: Elemental Characterization of Ambient Particulate Matter for a Globally Distributed Monitoring Network: Methodology and Implications, ACS EST Air, 1, 283–293, https://doi.org/10.1021/acsestair.3c00069, 2024.
Lyapustin, A., Wang, Y., Korkin, S., and Huang, D.: MODIS Collection 6 MAIAC algorithm, Atmos. Meas. Tech., 11, 5741–5765, https://doi.org/10.5194/amt-11-5741-2018, 2018.
Martin, R. V., Jacob, D. J., Yantosca, R. M., Chin, M., and Ginoux, P.: Global and regional decreases in tropospheric oxidants from photochemical effects of aerosols, J. Geophys. Res.-Atmos., 108, 4097, https://doi.org/10.1029/2002jd002622, 2003.
Martin, R. V., Brauer, M., van Donkelaar, A., Shaddick, G., Narain, U., and Dey, S.: No one knows which city has the highest concentration of fine particulate matter, Atmospheric Environment: X, 3, 100040, https://doi.org/10.1016/j.aeaoa.2019.100040, 2019.
Martin, R. V., Eastham, S. D., Bindle, L., Lundgren, E. W., Clune, T. L., Keller, C. A., Downs, W., Zhang, D., Lucchesi, R. A., Sulprizio, M. P., Yantosca, R. M., Li, Y., Estrada, L., Putman, W. M., Auer, B. M., Trayanov, A. L., Pawson, S., and Jacob, D. J.: Improved advection, resolution, performance, and community access in the new generation (version 13) of the high-performance GEOS-Chem global atmospheric chemistry model (GCHP), Geosci. Model Dev., 15, 8731–8748, https://doi.org/10.5194/gmd-15-8731-2022, 2022.
McDuffie, E. E., Martin, R. V., Spadaro, J. V., Burnett, R., Smith, S. J., O'Rourke, P., Hammer, M. S., van Donkelaar, A., Bindle, L., Shah, V., Jaeglé, L., Luo, G., Yu, F., Adeniran, J. A., Lin, J., and Brauer, M.: Source sector and fuel contributions to ambient PM2.5 and attributable mortality across multiple spatial scales, Nat. Commun., 12, 1–12, https://doi.org/10.1038/s41467-021-23853-y, 2021.
Meng, J., Martin, R. V., Ginoux, P., Hammer, M., Sulprizio, M. P., Ridley, D. A., and van Donkelaar, A.: Grid-independent high-resolution dust emissions (v1.0) for chemical transport models: application to GEOS-Chem (12.5.0), Geosci. Model Dev., 14, 4249–4260, https://doi.org/10.5194/gmd-14-4249-2021, 2021.
Miao, R., Chen, Q., Zheng, Y., Cheng, X., Sun, Y., Palmer, P. I., Shrivastava, M., Guo, J., Zhang, Q., Liu, Y., Tan, Z., Ma, X., Chen, S., Zeng, L., Lu, K., and Zhang, Y.: Model bias in simulating major chemical components of PM2.5 in China, Atmos. Chem. Phys., 20, 12265–12284, https://doi.org/10.5194/acp-20-12265-2020, 2020.
Nguyen, T. T. N., Pham, H. V., Lasko, K., Bui, M. T., Laffly, D., Jourdan, A., and Bui, H. Q.: Spatiotemporal analysis of ground and satellite-based aerosol for air quality assessment in the Southeast Asia region, Environ. Pollut., 255, 113106, https://doi.org/10.1016/j.envpol.2019.113106, 2019.
Pai, S. J., Heald, C. L., Pierce, J. R., Farina, S. C., Marais, E. A., Jimenez, J. L., Campuzano-Jost, P., Nault, B. A., Middlebrook, A. M., Coe, H., Shilling, J. E., Bahreini, R., Dingle, J. H., and Vu, K.: An evaluation of global organic aerosol schemes using airborne observations, Atmos. Chem. Phys., 20, 2637–2665, https://doi.org/10.5194/acp-20-2637-2020, 2020.
Park, R. J., Jacob, D. J., Chin, M., and Martin, R. V.: Sources of carbonaceous aerosols over the United States and implications for natural visibility, J. Geophys. Res.-Atmos., 108, AAC 5-1–AAC 5-12, https://doi.org/10.1029/2002jd003190, 2003.
Philip, S., Martin, R. V., van Donkelaar, A., Lo, J. W.-H., Wang, Y., Chen, D., Zhang, L., Kasibhatla, P. S., Wang, S., Zhang, Q., Lu, Z., Streets, D. G., Bittman, S., and Macdonald, D. J.: Global Chemical Composition of Ambient Fine Particulate Matter for Exposure Assessment, Environ. Sci. Technol., 48, 13060–13068, https://doi.org/10.1021/es502965b, 2014a.
Philip, S., Martin, R. V., Pierce, J. R., Jimenez, J. L., Zhang, Q., Canagaratna, M. R., Spracklen, D. V., Nowlan, C. R., Lamsal, L. N., Cooper, M. J., and Krotkov, N. A.: Spatially and seasonally resolved estimate of the ratio of organic mass to organic carbon, Atmos. Environ., 87, 34–40, https://doi.org/10.1016/j.atmosenv.2013.11.065, 2014b.
Philip, S., Martin, R. V., Snider, G., Weagle, C. L., Van Donkelaar, A., Brauer, M., Henze, D. K., Klimont, Z., Venkataraman, C., Guttikunda, S. K., and Zhang, Q.: Anthropogenic fugitive, combustion and industrial dust is a significant, underrepresented fine particulate matter source in global atmospheric models, Environ. Res. Lett., 12, 044018, https://doi.org/10.1088/1748-9326/aa65a4, 2017.
Pinault, L., Tjepkema, M., Crouse, D. L., Weichenthal, S., van Donkelaar, A., Martin, R. V., Brauer, M., Chen, H., and Burnett, R. T.: Risk estimates of mortality attributed to low concentrations of ambient fine particulate matter in the Canadian community health survey cohort, Environ. Health, 15, 18, https://doi.org/10.1186/s12940-016-0111-6, 2016.
Prank, M., Sofiev, M., Tsyro, S., Hendriks, C., Semeena, V., Vazhappilly Francis, X., Butler, T., Denier van der Gon, H., Friedrich, R., Hendricks, J., Kong, X., Lawrence, M., Righi, M., Samaras, Z., Sausen, R., Kukkonen, J., and Sokhi, R.: Evaluation of the performance of four chemical transport models in predicting the aerosol chemical composition in Europe in 2005, Atmos. Chem. Phys., 16, 6041–6070, https://doi.org/10.5194/acp-16-6041-2016, 2016.
Sayer, A. M., Munchak, L. A., Hsu, N. C., Levy, R. C., Bettenhausen, C., and Jeong, M. J.: MODIS Collection 6 aerosol products: Comparison between Aqua's e-Deep Blue, Dark Target, and “merged” data sets, and usage recommendations, J. Geophys. Res.-Atmos., 119, 13965–13989, https://doi.org/10.1002/2014JD022453, 2014.
Schubert, S. D., Rood, R. B., and Pfaendtner, J.: An Assimilated Dataset for Earth Science Applications, B. Am. Meteorol. Soc., 74, 2331–2342, https://doi.org/10.1175/1520-0477(1993)074<2331:AADFES>2.0.CO;2, 1993.
Sha, T., Ma, X., Jia, H., Tian, R., Chang, Y., Cao, F., and Zhang, Y.: Aerosol chemical component: Simulations with WRF-Chem and comparison with observations in Nanjing, Atmos. Environ., 218, 116982, https://doi.org/10.1016/j.atmosenv.2019.116982, 2019.
Shimadera, H., Hayami, H., Chatani, S., Morino, Y., Mori, Y., Morikawa, T., Yamaji, K., and Ohara, T.: Sensitivity analyses of factors influencing CMAQ performance for fine particulate nitrate, J. Air Waste Manage., 64, 374–387, https://doi.org/10.1080/10962247.2013.778919, 2014.
Snider, G., Weagle, C. L., Murdymootoo, K. K., Ring, A., Ritchie, Y., Stone, E., Walsh, A., Akoshile, C., Anh, N. X., Balasubramanian, R., Brook, J., Qonitan, F. D., Dong, J., Griffith, D., He, K., Holben, B. N., Kahn, R., Lagrosas, N., Lestari, P., Ma, Z., Misra, A., Norford, L. K., Quel, E. J., Salam, A., Schichtel, B., Segev, L., Tripathi, S., Wang, C., Yu, C., Zhang, Q., Zhang, Y., Brauer, M., Cohen, A., Gibson, M. D., Liu, Y., Martins, J. V., Rudich, Y., and Martin, R. V.: Variation in global chemical composition of PM2.5: emerging results from SPARTAN, Atmos. Chem. Phys., 16, 9629–9653, https://doi.org/10.5194/acp-16-9629-2016, 2016.
The International GEOS-Chem User Community: geoschem/GCHP: GCHP 13.4.0 (13.4.0), Zenodo [data set], https://doi.org/10.5281/zenodo.6512251, 2022.
Travis, K. R., Crawford, J. H., Chen, G., Jordan, C. E., Nault, B. A., Kim, H., Jimenez, J. L., Campuzano-Jost, P., Dibb, J. E., Woo, J.-H., Kim, Y., Zhai, S., Wang, X., McDuffie, E. E., Luo, G., Yu, F., Kim, S., Simpson, I. J., Blake, D. R., Chang, L., and Kim, M. J.: Limitations in representation of physical processes prevent successful simulation of PM2.5 during KORUS-AQ, Atmos. Chem. Phys., 22, 7933–7958, https://doi.org/10.5194/acp-22-7933-2022, 2022.
van der Werf, G. R., Randerson, J. T., Giglio, L., van Leeuwen, T. T., Chen, Y., Rogers, B. M., Mu, M., van Marle, M. J. E., Morton, D. C., Collatz, G. J., Yokelson, R. J., and Kasibhatla, P. S.: Global fire emissions estimates during 1997–2016, Earth Syst. Sci. Data, 9, 697–720, https://doi.org/10.5194/essd-9-697-2017, 2017.
van Donkelaar, A., Martin, R. V., and Park, R. J.: Estimating ground-level PM2.5 using aerosol optical depth determined from satellite remote sensing, J. Geophys. Res.-Atmos., 111, 1–10, https://doi.org/10.1029/2005JD006996, 2006.
van Donkelaar, A., Martin, R. V., Brauer, M., Kahn, R., Levy, R., Verduzco, C., and Villeneuve, P. J.: Global estimates of ambient fine particulate matter concentrations from satellite-based aerosol optical depth: Development and application, Environ. Health Persp., 118, 847–855, https://doi.org/10.1289/ehp.0901623, 2010.
van Donkelaar, A., Martin, R. V., Spurr, R. J. D., Drury, E., Remer, L. A., Levy, R. C., and Wang, J.: Optimal estimation for global ground-level fine particulate matter concentrations, J. Geophys. Res.-Atmos., 118, 5621–5636, https://doi.org/10.1002/jgrd.50479, 2013.
van Donkelaar, A., Martin, R. V., Spurr, R. J. D., and Burnett, R. T.: High-Resolution Satellite-Derived PM2.5 from Optimal Estimation and Geographically Weighted Regression over North America, Environ. Sci. Technol., 49, 10482–10491, https://doi.org/10.1021/acs.est.5b02076, 2015.
van Donkelaar, A., Martin, R. V., Brauer, M., Hsu, N. C., Kahn, R. A., Levy, R. C., Lyapustin, A., Sayer, A. M., and Winker, D. M.: Global Estimates of Fine Particulate Matter using a Combined Geophysical-Statistical Method with Information from Satellites, Models, and Monitors, Environ. Sci. Technol., 50, 3762–3772, https://doi.org/10.1021/acs.est.5b05833, 2016.
Wang, Q., Jacob, D. J., Spackman, J. R., Perring, A. E., Schwarz, J. P., Moteki, N., Marais, E. A., Ge, C., Wang, J., and Barrett, S. R. H.: Global budget and radiative forcing of black carbon aerosol: Constraints from pole-to-pole (HIPPO) observations across the Pacific, J. Geophys. Res., 119, 195–206, https://doi.org/10.1002/2013JD020824, 2014.
Wang, Y., Jacob, D. J., and Logan, J. A.: Global simulation of tropospheric O3-NOx-hydrocarbon chemistry - 1. Model formulation, J. Geophys. Res.-Atmos., 103, 10713–10725, https://doi.org/10.1029/98jd00158, 1998.
Weagle, C. L., Snider, G., Li, C., Van Donkelaar, A., Philip, S., Bissonnette, P., Burke, J., Jackson, J., Latimer, R., Stone, E., Abboud, I., Akoshile, C., Anh, N. X., Brook, J. R., Cohen, A., Dong, J., Gibson, M. D., Griffith, D., He, K. B., Holben, B. N., Kahn, R., Keller, C. A., Kim, J. S., Lagrosas, N., Lestari, P., Khian, Y. L., Liu, Y., Marais, E. A., Martins, J. V., Misra, A., Muliane, U., Pratiwi, R., Quel, E. J., Salam, A., Segev, L., Tripathi, S. N., Wang, C., Zhang, Q., Brauer, M., Rudich, Y., and Martin, R. V.: Global Sources of Fine Particulate Matter: Interpretation of PM2.5 Chemical Composition Observed by SPARTAN using a Global Chemical Transport Model, Environ. Sci. Technol., 52, 11670–11681, https://doi.org/10.1021/acs.est.8b01658, 2018.
Weichenthal, S., Pinault, L., Christidis, T., Burnett, R. T., Brook, J. R., Chu, Y., Crouse, D. L., Erickson, A. C., Hystad, P., Li, C., Martin, R. V., Meng, J., Pappin, A. J., Tjepkema, M., van Donkelaar, A., Weagle, C. L., and Brauer, M.: How low can you go? Air pollution affects mortality at very low levels, Science Advances, 8, eabo3381, https://doi.org/10.1126/sciadv.abo3381, 2022.
Wendt, E. A., Ford, B., Cheeseman, M., Rosen, Z., Pierce, J. R., H. Jathar, S., L'Orange, C., Quinn, C., Long, M., Mehaffy, J., D. Miller-Lionberg, D., H. Hagan, D., and Volckens, J.: A national crowdsourced network of low-cost fine particulate matter and aerosol optical depth monitors: results from the 2021 wildfire season in the United States, Environmental Science: Atmospheres, 3, 1563–1575, https://doi.org/10.1039/D3EA00086A, 2023.
Weng, H., Lin, J., Martin, R., Millet, D. B., Jaeglé, L., Ridley, D., Keller, C., Li, C., Du, M., and Meng, J.: Global high-resolution emissions of soil NOx, sea salt aerosols, and biogenic volatile organic compounds, Scientific Data, 7, 1–15, https://doi.org/10.1038/s41597-020-0488-5, 2020.
White, W. H., Trzepla, K., Hyslop, N. P., and Schichtel, B. A.: A critical review of filter transmittance measurements for aerosol light absorption, and de novo calibration for a decade of monitoring on PTFE membranes, Aerosol Sci. Tech., 50, 984–1002, https://doi.org/10.1080/02786826.2016.1211615, 2016.
Xin, J., Zhang, Q., Wang, L., Gong, C., Wang, Y., Liu, Z., and Gao, W.: The empirical relationship between the PM2.5 concentration and aerosol optical depth over the background of North China from 2009 to 2011, Atmos. Res., 138, 179–188, https://doi.org/10.1016/j.atmosres.2013.11.001, 2014.
Yang, Q., Yuan, Q., Yue, L., Li, T., Shen, H., and Zhang, L.: The relationships between PM2.5 and aerosol optical depth (AOD) in mainland China: About and behind the spatio-temporal variations, Environ. Pollut., 248, 526–535, https://doi.org/10.1016/j.envpol.2019.02.071, 2019.
Zhai, S., Jacob, D. J., Brewer, J. F., Li, K., Moch, J. M., Kim, J., Lee, S., Lim, H., Lee, H. C., Kuk, S. K., Park, R. J., Jeong, J. I., Wang, X., Liu, P., Luo, G., Yu, F., Meng, J., Martin, R. V., Travis, K. R., Hair, J. W., Anderson, B. E., Dibb, J. E., Jimenez, J. L., Campuzano-Jost, P., Nault, B. A., Woo, J.-H., Kim, Y., Zhang, Q., and Liao, H.: Relating geostationary satellite measurements of aerosol optical depth (AOD) over East Asia to fine particulate matter (PM2.5): insights from the KORUS-AQ aircraft campaign and GEOS-Chem model simulations, Atmos. Chem. Phys., 21, 16775–16791, https://doi.org/10.5194/acp-21-16775-2021, 2021.
Zhang, H., Hoff, R. M., and Engel-Cox, J. A.: The relation between moderate resolution imaging spectroradiometer (MODIS) aerosol optical depth and PM2.5 over the United States: A geographical comparison by U. S. Environmental Protection Agency regions, J. Air Waste Manage., 59, 1358–1369, https://doi.org/10.3155/1047-3289.59.11.1358, 2009.
Zhang, L., Jacob, D. J., Knipping, E. M., Kumar, N., Munger, J. W., Carouge, C. C., van Donkelaar, A., Wang, Y. X., and Chen, D.: Nitrogen deposition to the United States: distribution, sources, and processes, Atmos. Chem. Phys., 12, 4539–4554, https://doi.org/10.5194/acp-12-4539-2012, 2012.
Zhang, L., Kok, J. F., Henze, D. K., Li, Q., and Zhao, C.: Improving simulations of fine dust surface concentrations over the western United States by optimizing the particle size distribution, Geophys. Res. Lett., 40, 3270–3275, https://doi.org/10.1002/grl.50591, 2013.
Zhao, B., Jiang, J. H., Diner, D. J., Su, H., Gu, Y., Liou, K.-N., Jiang, Z., Huang, L., Takano, Y., Fan, X., and Omar, A. H.: Intra-annual variations of regional aerosol optical depth, vertical distribution, and particle types from multiple satellite and ground-based observational datasets, Atmos. Chem. Phys., 18, 11247–11260, https://doi.org/10.5194/acp-18-11247-2018, 2018.
Zhou, M., Xie, Y., Wang, C., Shen, L., and Mauzerall, D. L.: Impacts of current and climate induced changes in atmospheric stagnation on Indian surface PM2.5 pollution, Nat. Commun., 15, 7448, https://doi.org/10.1038/s41467-024-51462-y, 2024.
Zhu, H., Martin, R. V., Croft, B., Zhai, S., Li, C., Bindle, L., Pierce, J. R., Chang, R. Y.-W., Anderson, B. E., Ziemba, L. D., Hair, J. W., Ferrare, R. A., Hostetler, C. A., Singh, I., Chatterjee, D., Jimenez, J. L., Campuzano-Jost, P., Nault, B. A., Dibb, J. E., Schwarz, J. S., and Weinheimer, A.: Parameterization of size of organic and secondary inorganic aerosol for efficient representation of global aerosol optical properties, Atmos. Chem. Phys., 23, 5023–5042, https://doi.org/10.5194/acp-23-5023-2023, 2023.