the Creative Commons Attribution 4.0 License.
the Creative Commons Attribution 4.0 License.
 | 10 Oct 2024
Effect of secondary ice production processes on the simulation of ice pellets using the Predicted Particle Properties microphysics scheme
Mathieu Lachapelle
Mélissa Cholette
Julie M. Thériault
Ice pellets can form when supercooled raindrops collide with small ice particles that can be generated through secondary ice production processes. The use of atmospheric models that neglect these collisions can lead to an overestimation of freezing rain. The objective of this study is therefore to understand the impacts of collisional freezing and secondary ice production on simulations of ice pellets and freezing rain. We studied the properties of precipitation simulated with the Predicted Particle Properties (P3) microphysics scheme for two distinct secondary ice production processes. Improvements to the representation of ice pellets and ice crystals in P3 were analyzed by simulating an ice pellet storm that occurred over eastern Canada in January 2020. Those simulations showed that adding secondary ice production processes increased the accumulation of ice pellets but led to unrealistic size distributions of precipitation particles. Realistic size distributions of ice pellets were obtained by modifying the collection of raindrops by small ice particles and the merging criteria of ice categories in P3.
- Article
(14461 KB) - Full-text XML
- BibTeX
- EndNote


Freezing rain is among the most hazardous weather phenomena in North America. In January 1998, freezing rain events caused 35 deaths and more than CAD 4 billion of damage in southeastern Canada (Public Safety Canada, 2013). More recently, in April 2023, 1 million people lost power after the accumulation of more than 30 mm of freezing rain in southern Quebec (Duchesne, 2023; Hydro-Québec, 2024). In addition to its impact on infrastructure, freezing rain causes more than 10 aircraft accidents every year by accumulating over critical aircraft components (Green, 2015). The occurrence of freezing rain is also associated with car accidents that can lead to casualties (Tobin et al., 2021). The regions that are affected by this hazardous precipitation type are expected to change due to climate change. For example, freezing rain events are expected to increase in northern Canada and decrease in southern Canada and in most of the United States (McCray et al., 2022).
Forecasting the occurrence and predicting the climatological changes of freezing rain in the context of global warming rely on an accurate representation of precipitation in atmospheric models. Freezing rain is difficult to represent in models because it forms in conditions that can lead to other precipitation types, such as snow and ice pellets. For example, ice pellets and freezing rain both occur when a melting layer at temperatures > 0 °C develops above a subfreezing layer with temperatures < 0 °C near the surface (Brooks, 1920). In these atmospheric conditions, solid particles melt in the melting layer and reach the subfreezing layer. If the particle is partially melted, the ice that remains in the mixed-phase particle can refreeze into an ice pellet before it reaches the surface. If the particle is completely melted, freezing rain is often observed (Zerr, 1997). However, some heterogeneous freezing processes, including collisional freezing with ice crystals or immersion and contact freezing with primary ice nuclei, can also produce ice pellets (Hogan, 1985; Lachapelle and Thériault, 2022; Stewart, 1991; Stewart and Crawford, 1995). Current observational records suggest that the concentration of primary ice nucleation particles is too low to explain the formation of ice pellets from completely supercooled liquid raindrops at temperatures > −10 °C (Kanji et al., 2017; Lachapelle and Thériault, 2022; Petters and Wright, 2015).
Secondary ice production (SIP) processes can generate small ice crystals in concentrations that exceed those of primary ice nucleation particles at temperatures > −10 °C (e.g. Field et al., 2017; Korolev et al., 2020; Korolev and Leisner, 2020). It has been hypothesized that SIP processes were responsible for the production of ice pellets in some observed events (Kumjian et al., 2020; Lachapelle and Thériault, 2022; Stewart and Crawford, 1995). Among the different documented SIP processes, the Hallett–Mossop process (HM; Mossop, 1970; Hallett and Mossop, 1974) and the fragmentation of freezing drops (FFD; Kleinheins et al., 2021) are suggested to be active during ice pellet formation (Lachapelle and Thériault 2022). HM is the most studied SIP process (Field et al., 2017). Although some doubts remain concerning its physics (Seidel et al., 2023), it is thought to occur when a fast-falling solid particle collects small cloud droplets at temperatures between −8 and −3 °C. FFD occurs through the deformation of relatively large liquid drops (e.g. breakup, cracks, bulges) during freezing (Lauber et al., 2018; Keinert et al., 2020; Korolev and Leisner, 2020). Although FFD has been observed in laboratory experiments at T > −5 °C, this process seems to produce more secondary ice particles at T ∼ −15 °C (e.g. Keinert et al., 2020; Phillips et al. 2018). In general, the efficiency of FFD and HM processes remains difficult to establish and requires more research in the field and in the laboratory (Korolev et al., 2020; Korolev and Leisner, 2020; Lawson et al., 2023; Seidel et al., 2023).
Nonetheless, the impacts of SIP can be studied using microphysics parametrization schemes coupled to atmospheric models to predict cloud and precipitation properties. So far, studies on SIP have been conducted by simulating different types of clouds and weather, including orographic mixed-phase clouds (e.g. Dedekind et al., 2023; Georgakaki et al., 2022), polar mixed-phase clouds (Sotiropoulou et al., 2020; Zhao et al., 2021), cold frontal rainbands (Sullivan et al., 2018), cold marine boundary layer clouds (Karalis et al., 2022), stratiform clouds (Zhao and Liu, 2022), and convective weather. Convective weather represents most of this research (Field et al., 2017). In convective weather simulations, the impact of the HM process is recognized as the most important SIP process. Recent work from Qu et al. (2022) also showed that FFD could have an important impact on the high concentration of ice particles in mesoscale convective systems. To our knowledge, simulations have never been used to investigate and compare the impacts of HM and FFD on the distributions of ice pellets and freezing rain at the surface.

Figure 1Simulated domain and elevation (m). The red rectangle in the upper-left panel shows the location of the domain in North America. The locations of the UQAM-PK weather station, Mirabel International Airport, and Ottawa International Airport are indicated by the red circle, orange triangle, and white square, respectively. The segmented black line is an air parcel ending 500 m above UQAM-PK station at 08:00 UTC on 12 January 2020. The black dots along the line are located at every hour along the trajectory. The panel in the lower-left corner shows the vertical height of the trajectory for experiment nCat2_noSIP; the trajectories calculated with experiments nCat2_HM, nCat2_FFD, and nCat2_FFD_MOD reached similar results (not shown). Finally, the hatched black square shows the area where the size distribution of simulated precipitation was studied in Sect. 4.3.
A mixed precipitation storm that included a long-duration ice pellet episode (> 10 h) was recently documented by Lachapelle and Thériault (2022) (LT22 hereafter). The ice pellet episode was characterized by a warm and deep melting layer and the freezing of completely melted hydrometeors. A 17 mm water equivalent accumulation of ice pellets was measured at the UQAM-PK weather station in downtown Montréal (Fig. 1). The observation of ice crystals at the surface during the entire ice pellet episode led LT22 to suggest that the ice pellets may have formed by collisional freezing. Furthermore, SIP processes were thought to have favoured the formation of ice crystals below the melting layer. The presence of riming on many ice pellets indicated that the HM process may have been active within the subfreezing layer. In addition, the many deformed ice pellets, including fractioned pellets, and bulged particles (representing 18 % and 25 % of all ice pellet particles, respectively; Lachapelle et al., 2024), indicated that the FFD also contributed to SIP. Finally, LT22 suggested that the heavy northeasterly wind in the subfreezing layer increased the area affected by ice pellets by transporting the slowly falling ice crystals below the melting layer (see conceptual model Fig. 13 in LT22).
Given that the hypothesis presented by LT22 has not been studied using simulations, the objective is to investigate the impacts of SIP processes on the simulation of ice pellet properties. We used the Predicted Particle Properties (P3; Morrison and Milbrandt, 2015) bulk microphysics scheme and high-resolution simulations with the Canadian Global Environmental Multiscale Model (GEM; Côté et al., 1998; Girard et al., 2014) of the January 2020 ice pellet storm, for which detailed observations of precipitation particles are available.
This article is organized as follows. Section 2 describes the P3 scheme and the changes made to it and lists the simulations used in this study. Section 3 presents the configuration of GEM simulations. The simulations of the January 2020 ice pellet storm along with an analysis focused on the simulated particle properties are presented in Sect. 4. Conclusions are presented in Sect. 5.
2.1 The baseline version of P3
The P3 scheme (Morrison and Milbrandt, 2015) is used operationally in the GEM-based High Resolution Deterministic Prediction System (HRDPS; Milbrandt et al., 2016) from Environment and Climate Change Canada. We used a double-moment P3 for cloud droplets, raindrops, and ice. Triple-moment ice is also available (Cholette et al., 2023; Milbrandt et al., 2021). The two liquid-phase species have two prognostic variables, mass and number mixing ratio, and the ice-phase species have five prognostic variables per ice category in this study (Cholette et al., 2019; Morrison and Milbrandt, 2015). These are the total mass, the liquid on ice mass, the rime mass, the rime volume, and the total number mixing ratios. Ice particles in P3 grow freely from ice nucleation and vapour deposition to partial and complete riming. All simulations in this study predict the liquid on ice mass of mixed-phase particles (Cholette et al., 2019) that allows the refreezing of partially melted ice particles into ice pellets.
In P3, ice particles can be formed/initiated via the following processes: homogeneous freezing, condensation freezing, immersion freezing with primary ice nuclei, and collection of rain and clouds by ice. Homogeneous freezing causes all cloud and rain particles to freeze when the temperature (T) is < −40 °C. The resulting particles have a rime mass equal to their total mass, with a rime density of bulk ice of 900 kg m−3. Condensation freezing/deposition ice nucleation occurs at T < −15 °C with a degree of ice supersaturation > 5 % (Cooper, 1986). P3 assumes that initial ice crystal radii are 1 µm with a rime density of 900 kg m−3. Immersion freezing of cloud droplets and rain can occur when T < −4 °C, following the volume and temperature-dependent formulation presented in Bigg (1953) with parameters from Barklie and Gokhale (1959). In Appendix A, we show that this parametrization of immersion freezing leads to the freezing of a negligible fraction of raindrops in the atmospheric conditions observed during ice pellet events. Finally, cloud and rain collected by ice instantaneously freeze when T < 0 °C, except for a fraction that is shed, following Musil (1970). It is worth noting that the main conclusions of this work remained the same when the simulations were run with immersion freezing turned off.
The precipitation types in P3 are diagnosed using the properties of the species located at the lowest model level. The diagnosed precipitation types are ice crystals, snow, graupel, unmelted snow, hail, ice pellets, drizzle, and rain. To simplify how precipitation types are presented in this study, ice crystals, snow, graupel, and unmelted snow have been grouped together under the same category, which we refer to as snow. Hail and ice pellets have been grouped together under the same category, which we refer to as ice pellets. Rain and drizzle have been grouped together under the same category, which we refer to as rain. Ice pellets are diagnosed when the mass-weighted mean density of ice particles (ρi) is > 700 kg m−3, and snow is diagnosed when ρi < 700 kg m−3. Freezing rain and rain are diagnosed when precipitation is liquid, and the lowest model level temperature is < 0 and ≥ 0 °C, respectively. Since the model has two liquid species and many possible ice categories, a mixture of distinct precipitation phases can be simulated at the same location.
2.2 The multiple “free” ice categories and SIP parametrization
Using more than one ice category (nCat > 1) is possible but optional in P3 (Milbrandt and Morrison, 2016). The use of two or more ice categories facilitates the parametrization of SIP processes since it allows ice particles with different properties to coexist. The baseline version for P3 includes only the HM process. In this study, HM is compared to another SIP process, the fragmentation of freezing drops (FFD) adapted from Lawson et al. (2015; L15 hereafter). Observations collected in the field suggest that FFD and HM were active SIP processes during the 12 January 2020 ice pellet episode (LT22; Lachapelle et al., 2024). However, because the objective of this work is to examine how SIP affects simulated precipitation types and particle size distributions, the two SIP processes, HM and FFD, were used individually. This approach facilitated the understanding of their respective effects.
The HM SIP process produces 350 ice splinters that are 10 µm in diameter when large ice particles (mean mass-weighted diameter > 1000 µm) collect 1 mg of rain at temperatures between −3 and −8 °C (Hallett and Mossop, 1974; Mossop and Hallett, 1974). The number of splinters produced decreases linearly as temperatures deviate from the optimal temperature of −5 °C, as in Milbrandt and Morrison (2016). Different ice diameter thresholds were used in different studies to activate HM (e.g. Cholette et al., 2024; Qu et al., 2022; Sotiropoulou et al., 2020; Sullivan et al., 2018). Sensitivity tests (not shown) demonstrated that the accumulated amounts of ice pellets and freezing rain were sensitive to this value (e.g. ice pellet amounts decreased with a larger ice diameter threshold), but similar locations of precipitation types and particle size distributions were obtained.
The FFD process is added to P3 as described in Qu et al. (2022) using the parametrization of L15. L15 suggests that the number of ice splinters produced by the freezing of a drop with diameter D, expressed in micrometres, follows
This parametrization does not depend on the particle temperature. However, observations reported by Phillips et al. (2018), Korolev et al. (2020), and our own observations of ice pellets (Lachapelle et al., 2024) suggest that less FFD occurs when the freezing temperature is > −5 °C. For this reason, we modified the L15 parametrization by linearly decreasing Nf,L15(D) (Eq. 1) between −6 and −3 °C and setting Nf,L15 = 0 at T > −3 °C. This imitated the temperature dependency between −6 and −3 °C that is presented in Phillips et al. (2018). In our parametrization, as in Qu et al. (2022), we assumed that freezing drops of equivalent-volume diameters between 100 and 3500 µm contributed to SIP. The total number of splinters was calculated by multiplying Eq. (1) by the particle size distribution of freezing drops over their equivalent-volume diameters.
2.3 Other changes to P3
We introduced two other modifications to P3 to improve the representation of ice particle properties with nCat > 1. These modifications improve the size distributions of ice in the one-dimensional idealized simulations (Appendix B) and in the three-dimensional simulations (Sect. 4).
First, the collection of raindrops by small ice particles was modified to limit problems associated with the dilution of secondary ice particles. As mentioned above, P3 assumes that rain collected by ice instantaneously freezes when T < 0 °C, except for a fraction that is shed, following Musil (1970). The ice–rain collection routine computes the mass (qrcol) and the number (nrcol) of raindrops that are collected for every ice category based on an integration of the ice particle and raindrop size distribution multiplied by the difference in fall speed (Morrison and Milbrandt, 2015). The resulting qrcol and nrcol are then subtracted from the raindrop mass and number. The value for qrcol is added to the ice category responsible for the collection. When collection occurs between a small number of large raindrops and a high number of small ice crystals, the entire collected rain mass is added to the mass of the ice crystal category. Because the mass for collected rain is larger than the mass for ice crystals, the ice crystal properties are diluted into a category with properties that resemble ice pellets. This occurs even if the resulting frozen drops would have a diameter that corresponds more closely with another category of ice. To avoid this dilution effect, we added a routine to P3 to distribute large raindrops collected by ice to the most appropriate ice category when the mean mass-weighted diameter of rain is twice as large as the mean mass-weighted diameter of ice.

Second, the criteria used to add newly formed ice to an empty ice category and to merge already-existing ice categories were changed to favour the presence of ice categories with small mean diameters. In P3, newly formed ice particles are added to an empty ice category if the differences between the mean mass-weighted diameters (Di,m) of the new ice and those of the already-existing populated categories are larger than a certain threshold, ΔDi,m. At the same time, two ice categories are merged if the difference between their Di,m is < ΔDi,m. The choice of ΔDi,m depends on the number of ice categories, and ΔDi,m = 500 µm when two ice categories are used (Milbrandt and Morrison, 2016). When simulating ice pellets, this approach results in the dilution of small ice particles when the precipitation rate is low. For example, if an existing ice category has a Di,m = 500 µm, newly formed secondary ice particles with diameter Di,m = 10 µm will be added to this category because the difference between 500 and 10 µm is less than ΔDi,m. This results in the dilution of these ice splinters even if they are 50 times smaller than the mean mass diameter of the existing ice category. To avoid this problem, we modified the criteria for merging ice categories and for adding mass to an empty ice category by using ratios instead of differences between the ice categories Di,m. The experiments that included this modification in our study used a threshold ratio of 10 %. Hence, two categories merged if their Di,m had a relative difference of < 10 %, and new ice particles were initiated in an empty ice category if their Di,m had a relative difference > 10 % compared to the Di,m of all non-empty categories.
2.4 Description of the conducted experiments
Four experiments were conducted (Table 1). The control experiment (nCat1_noSIP) used the baseline version of P3 (Sect. 2.1), with only one ice category and no SIP processes. The second experiment (nCat2_HM) used the same P3 version as in nCat1_noSIP but with two ice categories (i.e. including HM; Morrison and Milbrandt, 2016). The third experiment (nCat2_FFD) had two ice categories and the FFD process (i.e. no HM). The fourth experiment (nCat2_FFD_MOD) had two ice categories, the FFD process, the modifications to the collection of rain by small ice particles, and the modifications to the merging criteria described in Sect. 2.3.
The four experiments (Table 1) were conducted with high-resolution GEM-based hindcast simulations of an ice pellet storm that happened in January 2020 and for which several observations of the microphysics properties are available (LT22; Lachapelle et al. 2024). The GEM configuration is described in Sect. 3. The P3 versions used in the four experiments were first tested with a one-dimensional model to study the effect of our modifications (Sect. 2.3) in idealized conditions (Appendix B). One-dimensional simulations were also performed using three and four ice categories (not shown). Similar results were obtained with these simulations compared to those obtained using two ice categories, suggesting that two ice categories are enough to represent the precipitation types and properties observed during this ice pellet storm.
GEM was used to simulate the winter storm that occurred in southern Quebec (eastern Canada) on 11 and 12 January 2020. The GEM dynamical core implicitly solves the fully compressible governing equations in time and uses a semi-Lagrangian advection scheme (Côté et al., 1998; Girard et al., 2014). The domain was centered on Montréal (Fig. 1), within an area of 9.20° latitude by 12.0° longitude, and with a horizontal resolution of 0.0090° (≈ 1 km). The number of vertical levels was 66, with the lowest model level at ∼ 15 m above the ground. Physical parametrizations included the Interaction Soil–Biosphere–Atmosphere (ISBA) scheme as the surface scheme (Bélair et al., 2003, 2005), FLake as the lake scheme (Mironov et al., 2010), and the shallow convection scheme from Bélair et al. (2005). Deep convection was assumed to be resolved at that grid spacing. The simulations were driven every hour at the borders using ERA5 reanalysis data (Hersbach et al., 2020), which have a grid spacing of 31 km. The simulations were initialized with ERA5 data at 00:00 UTC on 10 January 2020 and were run up to 00:00 UTC on 14 January 2020. The entire passage of a low-pressure system in this domain was captured by the simulations during this period.
The simulated precipitation types were compared to those reported hourly at different airports in the domain and recorded in the Integrated Surface Database (ISD; Smith et al., 2011). As complementary information, the probability of detection; success ratio; bias; and critical success index of rain, snow, ice pellets, and freezing rain, following Roebber (2009), are presented in Appendix C. For rain and snow, the critical success index was slightly improved for the simulations including SIP. For ice pellets, adding SIP clearly improved the critical index because the baseline simulation produced a negligible amount of this precipitation type. The two simulations that included FFD reached the highest critical success ratio. For freezing rain, adding SIP slightly decreased the probability of detection. However, for the simulation including FFD and our modifications, the decrease in the probability of detection was counterbalanced by a slight increase in the success ratio.
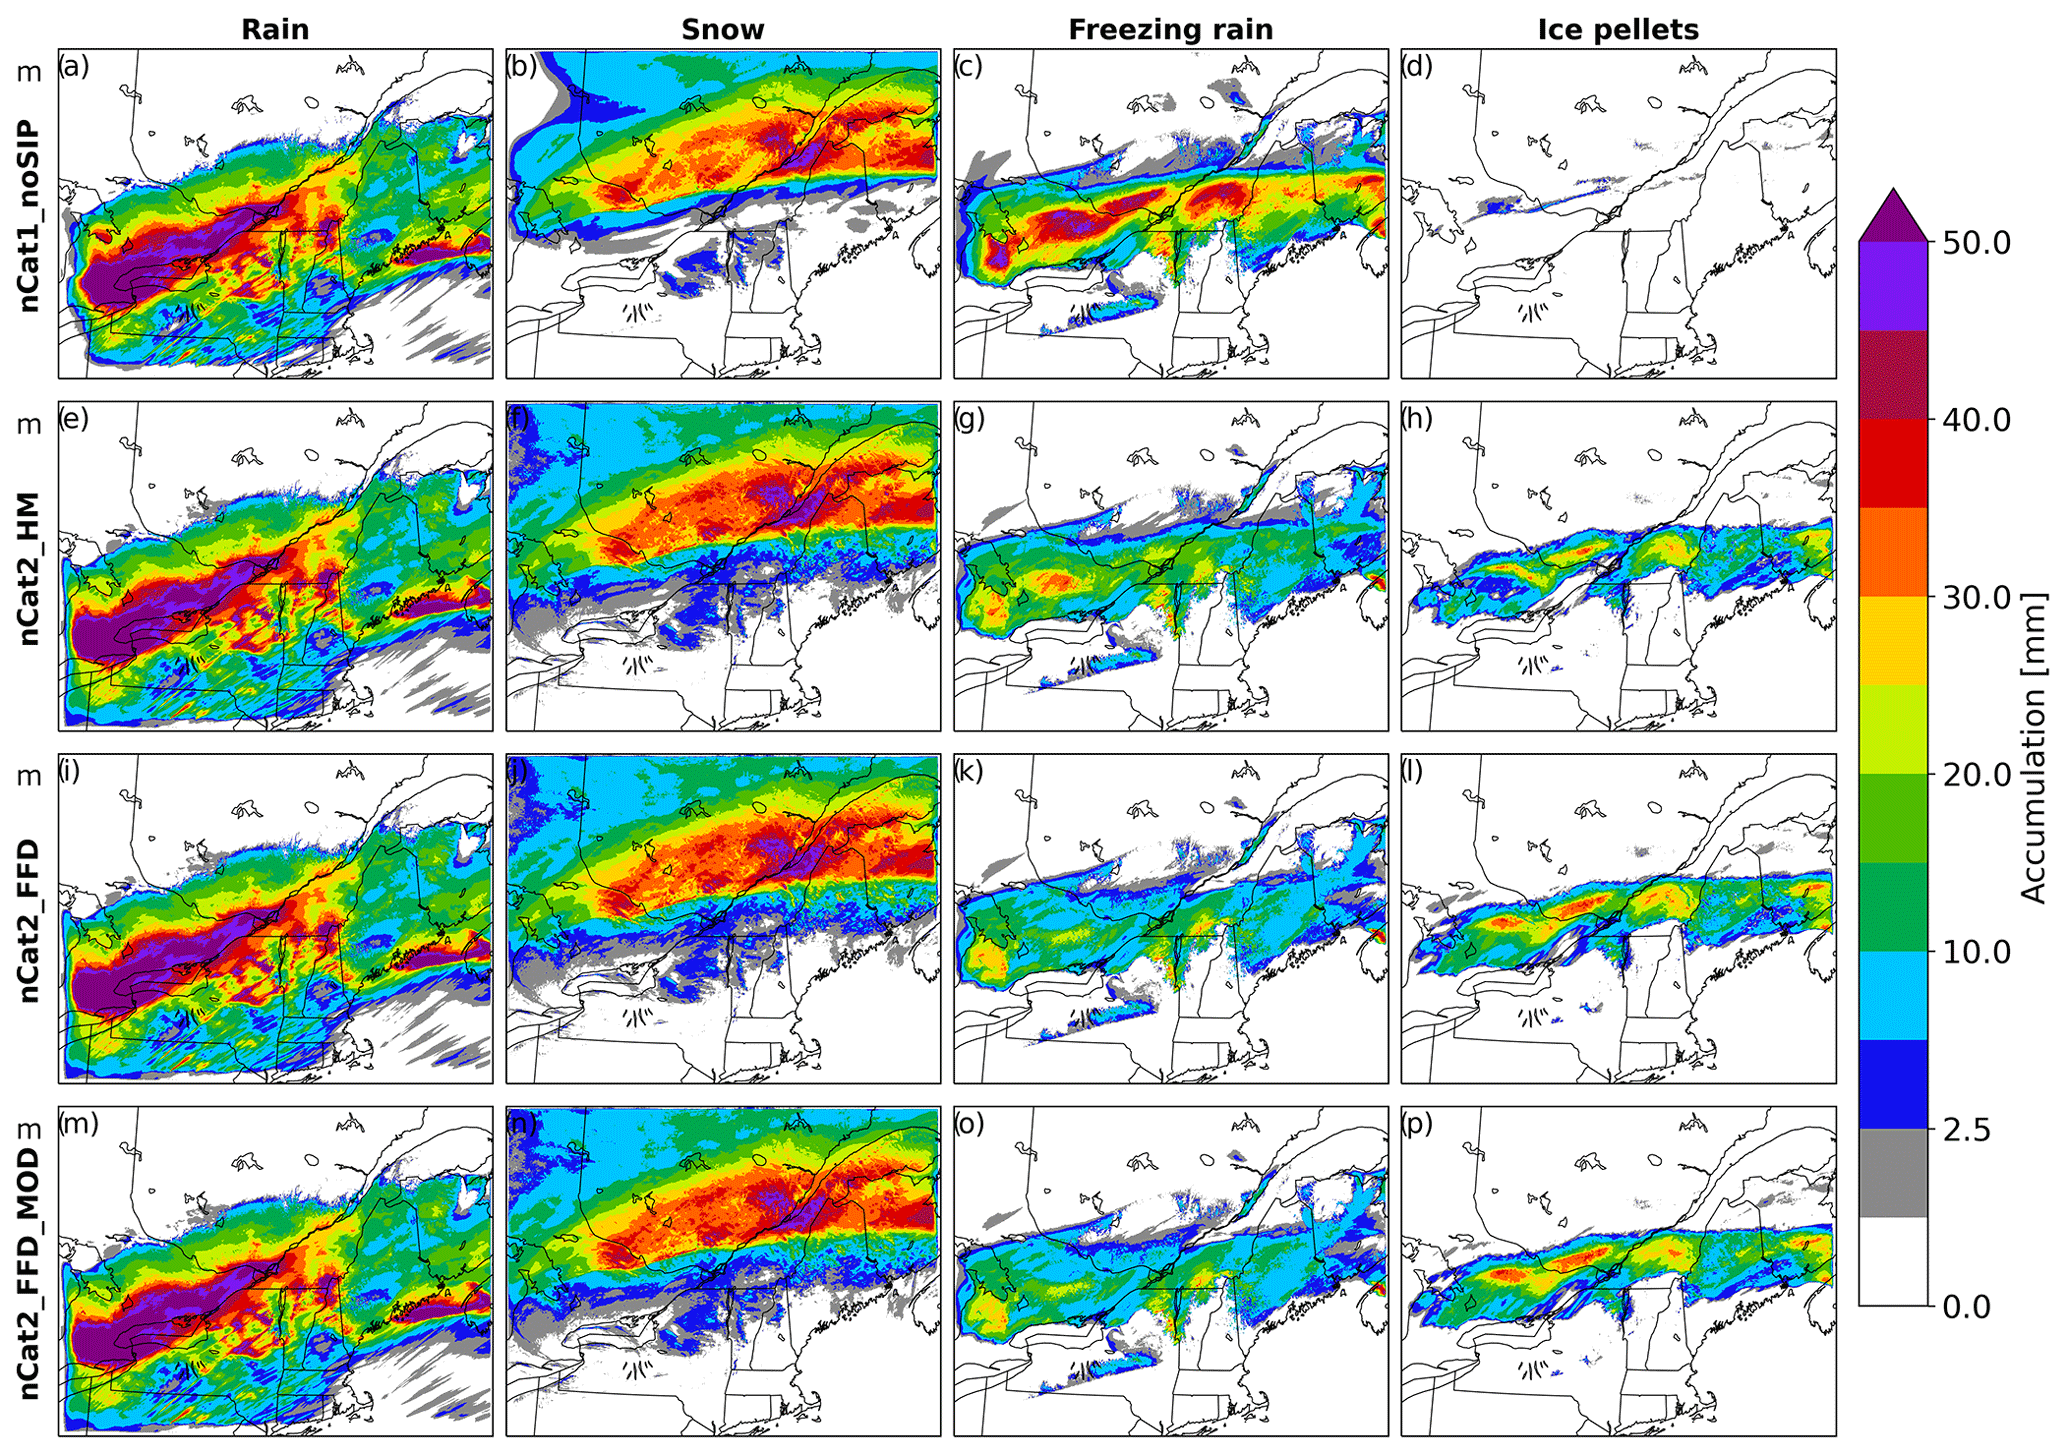
Figure 2Simulated accumulation between 00:00 UTC on 10 January 2020 and 00:00 UTC on 14 January 2020 of (a, e, i, m) rain, (b, f, j, n) snow, (c, g, k, o) freezing rain, and (d, h, l, p) ice pellets for (a–d) nCat1_noSIP, (e–h) nCat2_HM, (i–l) nCat2_FFD, and (m–p) nCat2_FFD_MOD.
The experiments' analysis was as follows. Hourly simulated precipitation types and precipitation rates were compared with those measured and observed at UQAM-PK, where a rain gauge measured the precipitation rate and manual observers reported the precipitation types. The precipitation types and rates that were simulated at Mirabel International Airport and Ottawa International Airport were also compared with the manual observations included in the ISD. Finally, the properties of simulated precipitation were studied. This was done by first studying cross-sections along an air parcel trajectory that ended 500 m above UQAM-PK at 08:00 UTC on 12 January (Fig. 1). Second, the size distributions of precipitation were studied in an area where ice pellets were simulated at 08:00 UTC on 12 January 2020 (hatched area in Fig. 1). We chose to study the properties of simulated ice categories at 08:00 UTC because this was in the middle of a period of continuous ice pellet precipitation measured at UQAM-PK (LT22).

Figure 3Total number of hours during which (a) rain, (b) snow, (c) freezing rain, and (d) ice pellets were reported at airports included in the ISD database between 00:00 UTC on 10 January 2020 and 00:00 UTC on 14 January 2020. (e–t) Total number of hours during which the simulated precipitation type was (e, i, m, q) rain, (f, j, n, r) snow, (g, k, o,s) freezing rain, and (h, l, p, t) ice pellets for (e–h) nCat1_noSIP, (i–l) nCat2_HM, (m–p) nCat2_FFD, and (q–t) nCat2_FFD_MOD. Only precipitation types with a rate > 0.2 mm h−1 were considered.
4.1 Precipitation types and phases at the surface
The four experiments produced almost the same amount of rain and snow (Fig. 2a, b, e, f, i, j,m, n). The control experiment (nCat1_noSIP) failed to produce substantial ice pellet accumulation (Fig. 2d). Instead, an accumulation amount of > 20 mm freezing rain was simulated near Montréal (Fig. 2c). The version of P3 used in nCat1_noSIP also failed to produce solid precipitation when it was coupled to the one-dimensional model (Appendix B). However, all experiments that included SIP processes produced ice pellets at the surface (Fig. 2h, l, and p). Experiments nCat2_HM, nCat2_FFD, and nCat2_FFD_MOD simulated ice pellets along a relatively narrow latitudinal band near Montréal, spreading from west to east in the domain. Experiments with FFD produced more ice pellets than the experiment with HM. This is consistent with the one-dimensional simulations shown in Fig. B1 in Appendix B. Finally, the total number of hours during which snow, rain, freezing rain, and ice pellets were simulated in the experiments that included the FFD process was similar to that of the observations included in the ISD (Fig. 3).
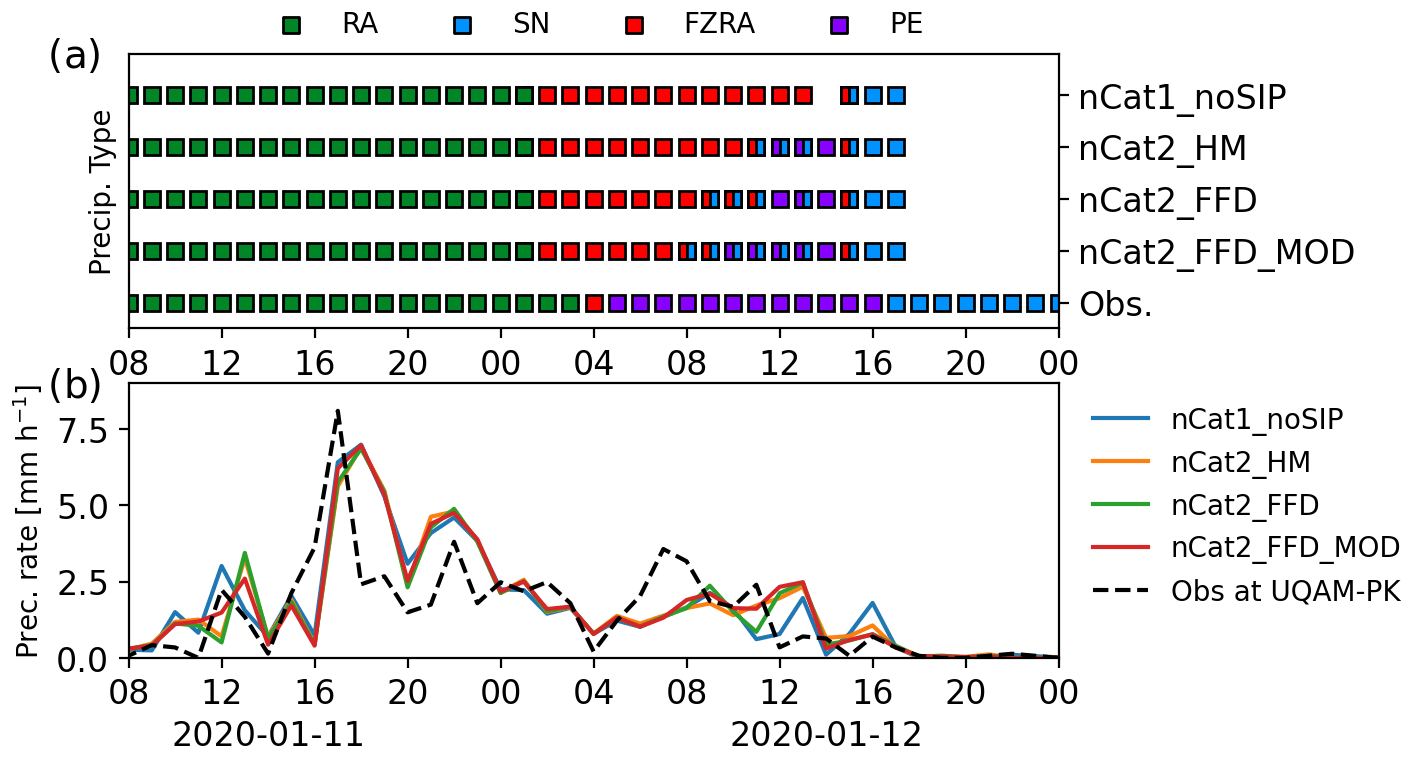
Figure 4(a) Hourly simulated and reported precipitation types at UQAM-PK for nCat1_noSIP, nCat2_HM, nCat2_HM_FFD, and nCat2_HM1mm_FFD_MOD. Precipitation types are rain (green), snow (blue), freezing rain (red), and ice pellets (purple). Note that between 04:30 and 16:00 UTC on 12 January 2020, the macro photography analysis revealed the presence of tiny ice crystals (∼ 200 µm) mixed with ice pellets. These were too small to be reported by manual observers. (b) Total precipitation rate simulated and observed at UQAM-PK for the same simulations. The dashed black line shows the precipitation rate measured by a single-alter Geonor.

Figure 5The same as Fig. 4 but at Mirabel International Airport. The manual observations were conducted hourly. The measured precipitation rate was not available for this location.

Figure 6The same as Fig. 4 but at Ottawa International Airport. The precipitation rate was measured by a rain gauge installed at Ottawa International Airport.
The time of the simulated precipitation type transitions was also investigated by comparing the simulated precipitation types at three sites: UQAM-PK, Mirabel International Airport, and Ottawa International Airport (Figs. 4–6, respectively). For these sites (locations shown in Fig. 1), using two ice categories and an SIP process simulated a transition between freezing rain and ice pellets. However, the simulated transitions occurred later than the observations, and all the experiments produced fewer hours of ice pellets compared with observations. This suggests that increasing the efficiency of SIP could decrease the difference between simulated and observed precipitation types. However, more cases and observations are needed to improve the parametrizations. The time series also highlight the importance of the precipitation rate for the precipitation type simulated at the surface. Low precipitation rates were associated with the simulation of freezing rain (e.g. Fig. 4 04:00 UTC on 12 January), and higher precipitation rates were associated with the simulation of ice pellets (e.g. Fig. 4 09:00–10:00 UTC on 12 January, Fig. 5 07:00–08:00 UTC on 12 January, Fig. 6 08:00–10:00 UTC on 12 January). Finally, fewer ice pellets were simulated when the HM process was included compared to when the FFD process was included (Figs. 4b, 5b, and 6b).
Adding SIP and other modifications had a non-negligible impact on the simulated precipitation rate because it impacted the particle size distribution and fall velocity. Smaller simulated particles fall at a slower velocity and are advected over longer distances by horizontal wind. In contrast, larger and denser ice particles fall at a higher velocity and reach the surface closer to their point of origin (e.g. Thériault et al., 2012). This behaviour suggests that simulating the accurate size distributions would improve the simulated precipitation rate. In Sect. 4.2, we show that the hydrometeor size distributions simulated by nCat2_FFD_MOD were similar to those observed, unlike in the other experiments.

Figure 7Fraction of precipitation that reached the surface in the solid phase during 3 different hours, (a, d, g, j) 04:00, (b, e, h, k) 08:00, and (c, f, i, l) 12:00 UTC on 12 January 2020. The same map is presented for experiments (a–c) nCat1_noSIP, (d–f) nCat2_HM, (g–i) nCat2_FFD, and (j–l) nCat2_FFD_MOD. Each panel presents this fraction for precipitation accumulation over 1 h in the simulated domain. The regions within the dashed red lines include grid points with a temperature (T) profile characterized by a melting layer with T > 0 °C aloft and a subfreezing layer with a minimum T < −3 °C. The hatched black patterns indicate areas with hourly averaged precipitation rates > 2 mm h−1. The orange lines show areas with heavy hourly averaged precipitation rates (> 7 mm h−1).
The one-dimensional model (Appendix B) simulated solid precipitation in experiments that included FFD when the minimum temperature in the subfreezing layer was < −3 °C and the precipitation rate was > 0.5 mm h−1. Therefore, the freezing rain and ice pellet distributions at the surface were also expected to be impacted by the precipitation rate and the minimum temperature in the subfreezing layer (Tmin). Figure 7 shows the fraction of solid-phase precipitation that reached the surface in the simulation domain at different hours when ice pellets were reported at UQAM-PK. Experiment nCat1_noSIP produced almost only liquid precipitation in the region with a melting layer aloft and a cold subfreezing layer of Tmin < −3 °C below (Fig. 7a–c). This region is within the dashed red lines in the panels of Fig. 7. The experiments that included SIP produced solid precipitation in a fraction of this region. As expected, the experiment using HM produced less solid precipitation than experiments nCat2_FFD and nCat2_FFD_MOD. For these last two experiments, the phase of the precipitation was highly correlated with the precipitation rate and Tmin. At 04:00 UTC on 12 January 2020, the precipitation rate was low in the region within the dashed red line, and mostly liquid precipitation reached the surface (Fig. 7a, d, g, and j). At 08:00 and 12:00 UTC, solid precipitation reached the surface (Fig. 7h and k) in the regions characterized by higher precipitation rates (Fig. 7b, e, h, and k, hatched area). Because the SIP process cannot be activated when Tmin > −3 °C, solid precipitation was mostly limited to the north portion of the dashed red line zone (Fig. 7i and l).
4.2 Hydrometeor properties along air parcel trajectories
The wind measurements recorded during the January 2020 storm indicated that a strong, low-altitude northeasterly wind was channelled by the Saint Lawrence River valley. LT22 suggested that the production of observed ice pellets and ice crystals in the Montréal area at that time was enhanced by the advection of ice, below the melting layer, from the northeast of Montréal where snow was reported. To investigate this hypothesis, we calculated the trajectory of an air parcel that reached an altitude of 500 m above UQAM-PK station at 08:00 UTC on 12 January. The altitude of 500 m corresponds to the altitude at which supercooled raindrops froze into ice pellets, as measured by the MRR-PRO installed in Montréal during the ice pellet storm (LT22). The trajectory was calculated by iteratively subtracting the distance travelled by the air parcel at 1 min time steps. The wind values used were interpolated in time and space from the simulation outputs. The result was not sensitive to the time step chosen and shows that trajectories ending above UQAM-PK station at an altitude of 500 m originated from the region impacted by snow to the northeast of Montréal (Fig. 1).

Figure 8Cross-sections of ice category properties simulated with the four experiments along an air parcel trajectory ending at 500 m above UQAM-PK station at 08:00 UTC. The properties presented are (a–d) the ice mass of ice category 1, (e–h) the ice mass of ice category 2, (i–l) the mean mass-weighted diameter of ice category 1, (m–p) the mean mass-weighted diameter of ice category 2, (q–t) the rime mass fraction of ice category 1, and (u–x) the rime mass fraction of ice category 2. The latitude of the UQAM-PK station is 45.50° N and is indicated by MTL on the x axis.
In this section, the properties of the simulated ice category 1 and ice category 2 are studied along a cross-section that follows the air parcel trajectory reaching UQAM-PK at 08:00 UTC. As mentioned above, nCat1_noSIP was unable to produce substantial solid precipitation accumulation in the region characterized by a melting layer aloft. However, the cross-section shows that a small mass mixing ratio of ice reached the surface at the north end of the melting layer (Fig. 8a). This ice resulted from the freezing of partially melted snow, making the ice particles highly rimed (Fig. 8q) and resulting in a high mean mass-weighted diameter (Fig. 8i).
At 08:00 UTC on 12 January 2020, nCat2_HM was similar to nCat1_noSIP, as the ice did not propagate below the melting layer (Fig. 8b). Ice category 2 was populated with a very low mass mixing ratio above the melting layer and is characterized by larger particles (Fig. 8n). At a different time and in a different location, nCat2_HM produced ice pellets at the surface (e.g. 12:00 UTC, Fig. 7f). This happened when the melting layer was colder and when the precipitation rate was higher. These conditions resulted in large ice particles (> 1000 µm) reaching the subfreezing layer and producing secondary ice through the HM process.
In the two experiments that included FFD, ice appeared in the subfreezing layer in a continuous shape that connected to the region with snow to the northeast of Montréal, at a latitude of > 46.50° N (Fig. 8). This is consistent with the hypothesis suggesting that the advection of ice below the melting layer initiated the glaciation of the subfreezing layer and increased the area affected by ice pellets (Fig. 13 in LT22). Moreover, the latent heat released by the formation of ice pellets increased the temperature in the subfreezing layer. This is shown by the −10 °C isotherm that disappeared from the subfreezing layer at latitudes < 460° N for the two experiments that included FFD (Fig. 8).
In contrast with nCat2_FFD, the two ice categories for the nCat2_FFD_MOD experiment were populated with a substantial ice mass mixing ratio in the subfreezing layer (Fig. 8d and h). The mean mass-weighted diameter of the two ice categories showed high variability in the subfreezing layer (Fig. 8l and p). Nonetheless, when one ice category contained small ice particles, the mean mass-weighted diameter of the other category was larger (Fig. 8l and p). In addition, the rime mass fraction of the smallest ice category was lower than that of the largest one (Fig. 8t and x). This is consistent with our observation conducted at UQAM-PK of small, unrimed ice particles mixed with larger ice pellets that were 100 % rimed (LT22).

Figure 9(a, c, e, g) Precipitation rates of the different precipitation types at 08:00 UTC on 12 January 2020 by (a) nCat1_noSIP, (c) nCat2_HM, (e) nCat2_FFD, and (g) nCat2_FFD_MOD. In the case of a mixture of two or more precipitation types, the type with the highest precipitation rate is represented. The precipitation types are rain (RA), freezing rain (FZRA), ice pellets (PL), and snow (SN) (b, d, f, h). Observed size distribution of ice pellets (black dots) and ice crystals (horizontal black lines) and size distributions of rain (pink) and the two ice categories (orange and blue) simulated by (b) nCat1_noSIP, (d) nCat2_HM, (f) nCat2_FFD, and (h) nCat2_FFD_MOD at the lowest model level, calculated for 200 grid points located within the study domain. The observed size distributions were measured with photographs and a laser-optical disdrometer at UQAM-PK between 06:00 and 08:00 UTC on 12 January 2020.
4.3 Size distributions at the surface
The particle size distributions of the precipitation simulated at 08:00 UTC on 12 January 2020 were analyzed in a region where ice pellets were simulated (Figs. 1 and 9). At 08:00 UTC, this region had a mean precipitation rate of ∼ 3.5 mm h−1, which is the same as the mean precipitation rate between 06:00 and 08:00 UTC on 12 January measured at UQAM-PK. The laser-optical disdrometer measurements between 06:00 and 08:00 UTC on 12 January were used to calculate the size distribution of ice pellets presented in Figs. 9 and B2.
At 08:00 UTC on 12 January 2020, nCat1_noSIP produced only liquid precipitation in the studied region. As expected, the particle size distribution of the rain species is similar to the size distribution measured by the laser-optical disdrometer (Fig. 9b). Similarly, a large amount of rain reached the surface in this area in nCat2_HM, and the size distributions of the simulated rain are similar to those of the observed ice pellets (Fig. 9d).
At 08:00 UTC, solid precipitation was simulated for the entire study domain for nCat2_FFD and nCat2_FFD_MOD. The hydrometeors simulated with nCat2_FFD for ice category 1 were small and had a high number mixing ratio (Fig. 9f). In contrast, the ice in category 2 had a very low number mixing ratio. Experiment nCat2_FFD produced similar size distributions using the idealized one-dimensional model (Fig. B1c). In contrast, the size distributions with nCat2_FFD_MOD were closer to those observed in the field compared to nCat2_FFD. Similar results were also obtained with the one-dimensional model (Fig. B2d).
These results suggest that adding an efficient SIP process to the microphysics scheme can help to produce solid precipitation near the surface, but the resulting particles might have an unrealistic size distribution. The modifications that were implemented in P3 in this study, which include modifications to the collection of rain by small ice particles and to the criteria for ice category merging and ice category initiation (Table 1), helped to produce more realistic size distributions of ice pellets.
The impacts of two secondary ice production (SIP) processes on freezing rain and ice pellet distribution at the surface were studied using high-resolution three-dimensional simulations coupled to the Predicted Particle Properties (P3) microphysics scheme. The SIP processes that were tested were the Hallett–Mossop (HM) process and the fragmentation of freezing drops (FFD) process.
The control experiment (nCat1_noSIP), which did not include SIP, simulated mostly liquid precipitation near the surface in conditions that led to ice pellets in the field. Including the HM process (i.e. nCat2_HM) did produce some ice pellets in the experiment – a result that is not reproduced with the one-dimensional cloud model (Appendix B). The HM process produces secondary ice when large ice particles collect raindrops. Hence, this process cannot be activated if all the ice melts in the melting layer, as shown in the one-dimensional experiment. In the GEM experiment, however, some regions were characterized by partial melting aloft, fulfilling the conditions for activating the HM process. Experiment nCat2_HM simulated a smaller amount of ice pellets compared to the experiments including FFD (nCat2_FFD and nCat2_FFD_MOD).
The FFD process clearly improved the representation of ice pellets. This SIP process produced secondary ice when raindrops froze at T < −3 °C. A raindrop can freeze at this temperature by collisional freezing with another frozen particle or by immersion freezing. In contrast with the HM process, conditions for the FFD process can be met when there is complete melting aloft and if secondary ice already exists in the subfreezing layer. Experiments nCat2_FFD and nCat2_FFD_MOD therefore produced ice pellets at the surface in both the idealized one-dimensional simulation and the GEM simulation.
Adding an efficient SIP process can lead to the simulation of unrealistic ice particle size distributions. Experiment nCat2_FFD simulated a higher number of small ice particles compared to those observed in the field. By modifying the collection of raindrops by small ice particles and the criteria for the ice category merging and the ice category initiation, more realistic size distributions of ice pellets were simulated.
The properties of the simulated ice categories that were studied along the trajectory of an air parcel support the mesoscale process previously described by LT22. This process suggests that the glaciation of the subfreezing layer can be favoured by the wind direction in the subfreezing layer. If the wind is strong enough, very small ice particles can be advected from the snow region to below the melting layer and cause the freezing of supercooled raindrops through collisional freezing. The secondary ice particles produced by these freezing drops have a low fall speed and can be advected further below the melting layer, increasing the area impacted by ice pellets.
Overall, our results suggest that the distributions of ice pellets and freezing rain are sensitive to these physical processes (SIPs, ice-rain collection, and advection of small ice crystals) as well as how ice categories are combined in P3. For example, increasing the ice diameter threshold for HM decreases the amount of ice pellets produced. The identification of an optimal SIP parametrization for ice pellet and freezing rain simulations will require more observations and modelled cases. Future research should also include simulations combining multiple SIP processes from which complex interactions and feedback processes could emerge. Finally, the impacts of the modifications presented in this work, including the potential adverse effects, should be studied in other types of weather such as hail formation in severe summer weather. This work will eventually lead to a better representation of partially and fully rimed ice particle properties and supercooled rain in models and to improved forecasts and climate projections. Moreover, as noted by others (e.g. Cholette et al., 2024; Korolev and Leisner, 2020; Qu et al., 2022), this research shows the importance of SIP and justifies the need for further laboratory experiments to improve the parametrization of SIP within atmospheric models.
The heterogeneous freezing of liquid drops and droplets in different microphysics schemes, including P3 and Thompson microphysics schemes, follows the parametrization found in Bigg (1953) (Thompson et al., 2004). For P3, this parametrization follows the equation presented in Pruppacher and Klett (2010) using the parameters for distilled water, which were experimentally identified by Barklie and Gokhale (1959). This parametrization assumes a constant concentration of ice nuclei in any given volume of liquid water. Figure A1a shows that this parametrization leads to only a small fraction of total raindrops freezing when temperatures are > −10 °C and when the supercooled drops fall 1000 m at this temperature. Figure A1 also shows the same fractions when the parametrization for rainwater is used. The rainwater parametrization, which is not used in P3, would drastically increase the fraction of freezing raindrops but still not produce 100 % ice pellets, as observed on 12 January 2020.

Figure A1The fraction of total raindrops of different diameters that freeze when falling for 1000 m, using Bigg's (1953) formulation with Barklie and Gokhale's (1959) parametrization for (a) distilled water (used in P3) and (b) rainwater.
B1 Model configuration
One-dimensional simulations were used to study HM and FFD processes under constant atmospheric conditions. The time step, 30 s, was the same as for the ice pellet simulation presented in Sect. 3. The spacing between the 41 vertical was 100 m. The mass and number mixing ratio, Qi and Ni, of the snow initiated at the model's highest level were chosen to reproduce the observed surface precipitation rate of 3.5 mm h−1, which was the precipitation rate measured at the UQAM-PK station at 08:00 UTC on 12 January 2020. To do so, Qi and Ni were first extracted from the three-dimensional simulations at 4 at locations where the precipitation rate was 3.5 mm h−1. Then, the values of the extracted Qi and Ni had to be modified by a factor of 3 to obtain the observed surface precipitation rate. The vertical profiles for temperature and humidity above the UQAM-PK station were extracted from ERA5 and used as the initial conditions. The temperature profile was kept constant during the simulations, but the humidity profile was allowed to evolve freely. To initiate freezing in the subfreezing layer, a small concentration (100 m−3) of ice particles with a mean mass-weighted diameter of 100 µm was introduced to the subfreezing layer between 0 and 1000 m at the first step. Simulations were run for periods of 3 h, after which all simulations reached a constant concentration of solid and liquid particles at every level of the column. The simulated vertical profiles of ice and rain mass and number mixing ratios, as well as particle size distributions, were compared for the different P3 versions listed in Table 1.
B2 Results
Experiment nCat1_noSIP produced almost no ice in the subfreezing layer (Fig. 2). Experiment nCat2_HM also resulted in mostly liquid particles at the surface. In these two experiments, the ice mass and number mixing ratios produced at elevations below 1 km mainly came from the immersion freezing of rain (Appendix A). As the number of frozen raindrops was too small to freeze the other particles by collisional freezing, the precipitation type at the surface remained liquid. With nCat2_HM, the HM process was never triggered because the ice particles produced in the subfreezing level were not large enough.

Figure B1Vertical profiles of (a, g) temperature (solid black line) and final dew-point temperature (dashed red line) of nCat2_FFD_MOD; (b–e) total ice mass mixing ratio (in g kg−1) for category 1 (blue dots) and category 2 (orange dots); rimed ice mass mixing ratio for category 1 (blue plus signs) and category 2 (orange plus signs); and (h–k) total ice number mixing ratios of ice from category 1 (blue dots), category 2 (orange dots), and rain (pink dots). Results generated after 3 h of constant precipitation rates of 3.5 mm h−1 at the model top for (b, h) nCat1_noSIP, (c, i) nCat2_HM, (d, j) nCat2_FFD, and (e, k) nCat2_FFD_MOD. Nmax is 2 × 10⁶ m−3.

Figure B2Size distributions of simulated rain (pink) and ice (blue for category 1 and orange for category 2) at the lowest vertical level (solid line) and at a height of 1 km (dashed line) after 180 min for (a) nCat1_noSIP, (b) nCat2_HM, (c) nCat2_FFD, and (d) nCat2_FFD_MOD. Size distributions are compared with ice pellets (black dots) and ice crystals (dashed black) measured at UQAM-PK between 06:00 and 08:00 UTC on January 2020 (LT22).
Under the same conditions, nCat2_FFD and nCat2_FFD_MOD simulated solid precipitation at the surface. With nCat2_FFD (Fig. B1d and j), the number mixing ratio of ice quickly became high enough to freeze all raindrops below 800 m. The number of ice particles reached the maximum number allowed in P3, which is 2 × 10⁶ m−3 (Fig. B1j). This rapid increase is explained by the exponential behaviour of SIP processes. In nCat2_FFD, the collected raindrops and the secondary ice particles were added to the same ice category. This resulted in the simulation of a large population of small, completely rimed ice particles (Fig. B1c). Hence, the properties of the simulated precipitation particles are completely different from those observed. In a perfect simulation, the frozen raindrops would have diameters similar to those of the raindrops at the top of the subfreezing layer, while the non-collected secondary ice particles would grow to form ice crystals due to vapour deposition. The size distribution of the raindrops at the top of the subfreezing layer is presented by the dashed pink curve in Fig. B2.
With nCat2_FFD_MOD, the two modifications presented in Sect. 2.3 limited the dilution of the ice category properties, and the two ice categories were more realistically populated in the subfreezing layer (Fig. B1e and k). At the level closest to the surface, the size distributions of the two ice categories were consistent with those observed (Fig. B2d; LT22). The ice properties for category 2 were likely those of ice pellets, with a similar size distribution to that of raindrops simulated at 1000 m (Fig. B2d) and the density of bulk ice (900 kg m−3) (Fig. B1e). The ice properties for category 1 were similar to the observed ice crystals. The particles were not rimed (Fig. B1e) and were small (Fig. B2d). However, the simulated ice crystals were smaller than those observed. This might be explained by the limited water vapour that was available in the idealized one-dimensional simulations, where the relative humidity rapidly reached saturation over ice in the subfreezing layer.
In addition to performing simulations with the observed precipitation rate and temperature profile, sensitivity tests were conducted by varying the precipitation rate and the minimum temperature in the subfreezing layer with the P3 version in nCat2_FFD_MOD. First, given the temperature threshold in our FFD parametrization, it was expected that secondary ice would not be produced in warmer conditions. Second, the FFD parametrization depends strongly on the freezing raindrop diameter. Hence, higher precipitation rates are expected to produce larger raindrops, producing more ice particles. As expected, these tests showed that the phase of precipitation after the 3 h simulations was sensitive to these parameters, resulting in solid precipitation at the surface when the minimum subfreezing temperature was < −3 °C and when the precipitation rate was > 0.5 mm h−1. In contrast, freezing rain was simulated at the surface when the temperature in the subfreezing layer was warmer or the precipitation rate was lower. These conditions produced secondary ice particles that were insufficient to initiate the process leading to the freezing of all supercooled raindrops.
Indices for a performance diagram were calculated based on the simulated and observed hourly precipitation types at the different airports in the simulation domain. The performance diagram presented in Fig. C1 follows the method presented by Roebber (2009). The diagram includes the four precipitation types considered in our study (rain, snow, ice pellets, and freezing rain). For the four simulations, the diagram shows the probability of detection (POD), the success ratio (SR), the false alarm ratio (FAR), and the critical success index (CSI). Overall, this analysis shows that the critical success ratio for ice pellets improves drastically when SIP processes are added to P3. The critical success ratios for the three other precipitation types do not vary much but do show improvement. A threshold of 0.2 mm h−1 was used to filter out low simulated precipitation rates that may not be observed by manual observers. Choosing a lower precipitation rate threshold results in an increase in the probability of detection and a decrease in the success ratio but does not affect the general conclusion of this appendix.
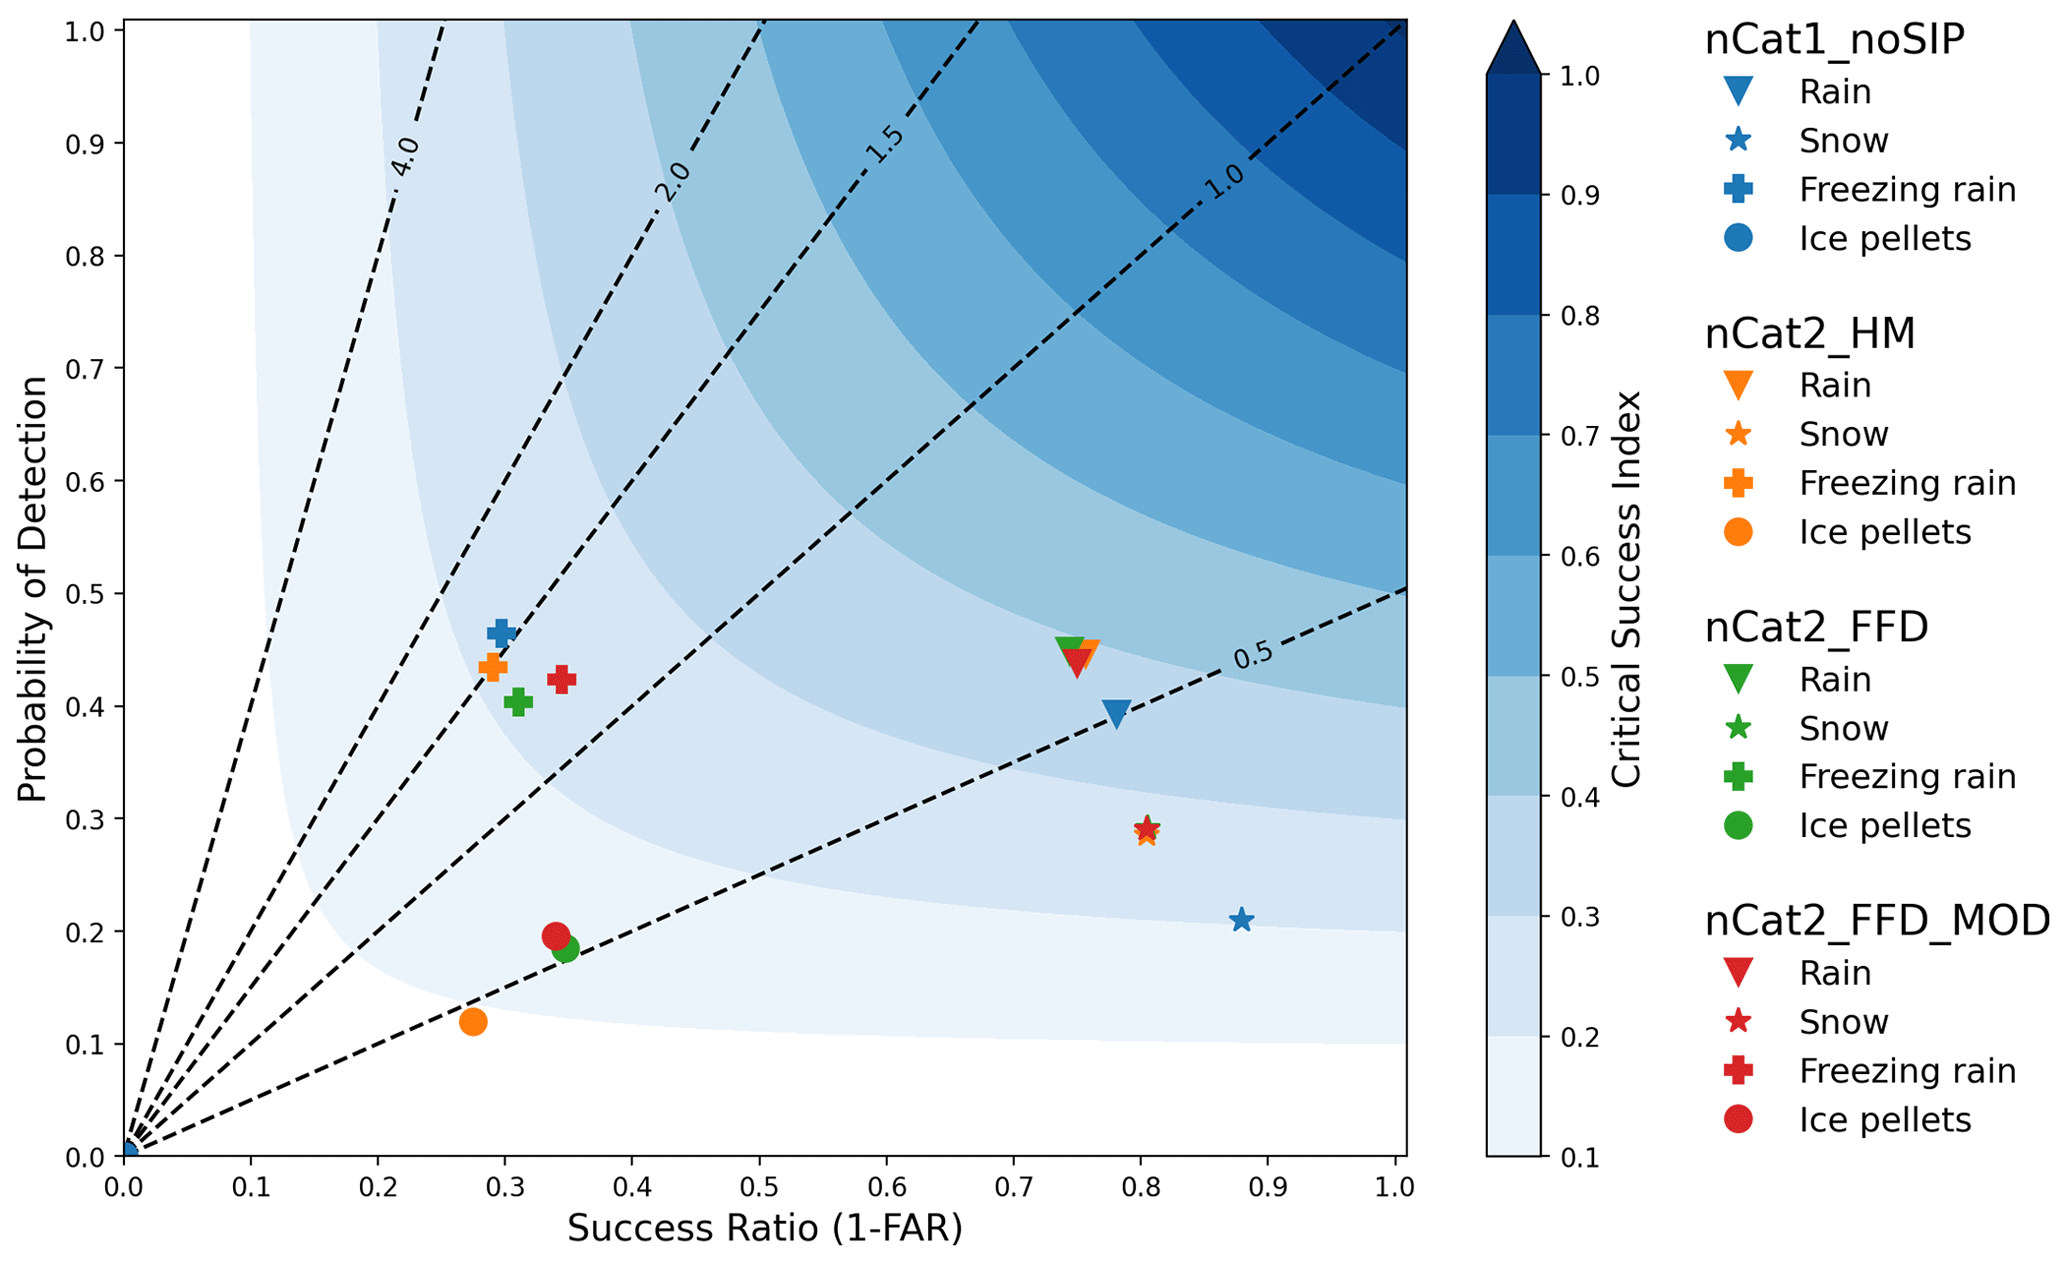
Figure C1Performance diagram as presented by Roebber (2009). The probability of detection (POD), the success ratio (SR), and the critical success index were calculated for four precipitation types (shapes) and four simulations (colours) using the hourly observations of precipitation types from the Integrated Surface Database (Smith et al., 2011) and hourly simulated precipitation types at the surface. Only precipitation types with an hourly water equivalent accumulation > 0.2 mm were considered. The dashed lines show the slope POD/SR.
The code for producing the figures is available upon request.
Observational data for the 12 January storm are available online on The Canadian Dataverse Repository Borealis (https://doi.org/10.5683/SP3/TGS5HU, Lachapelle et al., 2023). Simulation outputs are available upon request.
ML conceived and led this study and conducted the simulations. JMT and MC supervised and contributed to the writing and the scientific content. MC also provided support for working with the P3 microphysics scheme.
The contact author has declared that none of the authors has any competing interests.
Publisher's note: Copernicus Publications remains neutral with regard to jurisdictional claims made in the text, published maps, institutional affiliations, or any other geographical representation in this paper. While Copernicus Publications makes every effort to include appropriate place names, the final responsibility lies with the authors.
The authors would like to thank Hadleigh Thompson, Charlie Hébert-Pinard, Karel Veilleux, Aurélie Desroches-Lapointe, Félix Biron, Sébastien Marinier, Julien Chartrand, and Sara-Ann Piscopo for assistance with manual observations during the 11–12 January 2020 ice pellet storm. We also wish to thank François Roberge and Katja Winger for their assistance with the simulations that were conducted on infrastructure from the Digital Research Alliance of Canada, whom we also thank for their support. We would like to thank Tangui Picart for his constructive comments. Financial support for this study was provided by the Fonds de recherche du Québec – Nature et Technologies, the Natural Sciences and Engineering Research Council of Canada, the Canada Foundation for Innovation, and the Canada Research Chairs program (CRC-2018-00312). The lead author received funding from the National Research Council of Canada (NRC) within the Aeronautical Product Development and Certification (APDC) program.
This research has been supported by the Fonds de recherche du Québec – Nature et technologies (grant nos. 271109 and 328138), the Natural Sciences and Engineering Research Council of Canada (grant no. RGPIN-2019-06654), the Canada Foundation for Innovation (grant nos. 37720 and 36146), the Canada Research Chairs (grant no. CRC-2018-00312), and the National Research Council of Canada's Aeronautical Product Development and Certification program.
This paper was edited by Odran Sourdeval and reviewed by two anonymous referees.
Barklie, R. H. D. and Gokhale, N.: The freezing of supercooled water drops, McGill University, Stormy Weather Group, Scientific Report MW-30, Part III, 43–64, 1959.
Bélair, S., Crevier, L.-P., Mailhot, J., Bilodeau, B., and Delage, Y.: Operational Implementation of the ISBA Land Surface Scheme in the Canadian Regional Weather Forecast Model. Part I: Warm Season Results, J. Hydrometeorol., 4, 352–370, https://doi.org/10.1175/1525-7541(2003)4<352:OIOTIL>2.0.CO;2, 2003.
Bélair, S., Mailhot, J., Girard, C., and Vaillancourt, P.: Boundary Layer and Shallow Cumulus Clouds in a Medium-Range Forecast of a Large-Scale Weather System, Mon. Weather Rev., 133, 1938–1960, https://doi.org/10.1175/MWR2958.1, 2005.
Bigg, E. K.: The supercooling of water, Proc. Phys. Soc. B, 66, 688–694, https://doi.org/10.1088/0370-1301/66/8/309, 1953.
Brooks, C. F.: THE NATURE OF SLEET AND HOW IT IS FORMED, Mon. Weather Rev., 48, 69–72, https://doi.org/10.1175/1520-0493(1920)48<69b:TNOSAH>2.0.CO;2, 1920.
Cholette, M., Morrison, H., Milbrandt, J. A., and Thériault, J. M.: Parameterization of the Bulk Liquid Fraction on Mixed-Phase Particles in the Predicted Particle Properties (P3) Scheme: Description and Idealized Simulations, J. Atmos. Sci., 76, 561–582, https://doi.org/10.1175/JAS-D-18-0278.1, 2019.
Cholette, M., Milbrandt, J. A., Morrison, H., Paquin-Ricard, D., and Jacques, D.: Combining Triple-Moment Ice With Prognostic Liquid Fraction in the P3 Microphysics Scheme: Impacts on a Simulated Squall Line, J. Adv. Model. Earth Sy., 15, e2022MS003328, https://doi.org/10.1029/2022MS003328, 2023.
Cholette, M., Milbrandt, J. A., Morrison, H., Kirk, S., and Lalonde, L.-É.: Secondary Ice Production Improves Simulations of Freezing Rain, Geophys. Res. Lett., 51, e2024GL108490, https://doi.org/10.1029/2024GL108490, 2024.
Cooper, W. A.: Ice Initiation in Natural Clouds, in: Precipitation Enhancement—A Scientific Challenge, edited by: Braham, R. R., Cooper, W. A., Cotton, W. R., Elliot, R. D., Flueck, J. A., Fritsch, J. M., Gagin, A., Grant, L. O., Heymsfield, A. J., Hill, G. E., Isaac, G. A., Marwitz, J. D., Orville, H. D., Rangno, A. L., Silverman, B. A., and Smith, P. L., American Meteorological Society, Boston, MA, https://doi.org/10.1007/978-1-935704-17-1_4, 29–32, 1986.
Côté, J., Gravel, S., Méthot, A., Patoine, A., Roch, M., and Staniforth, A.: The Operational CMC–MRB Global Environmental Multiscale (GEM) Model. Part I: Design Considerations and Formulation, Mon. Weather Rev., 126, 1373–1395, https://doi.org/10.1175/1520-0493(1998)126<1373:TOCMGE>2.0.CO;2, 1998.
Dedekind, Z., Grazioli, J., Austin, P. H., and Lohmann, U.: Heavy snowfall event over the Swiss Alps: did wind shear impact secondary ice production?, Atmos. Chem. Phys., 23, 2345–2364, https://doi.org/10.5194/acp-23-2345-2023, 2023.
Duchesne, A.: Verglas: 1998 c. 2023: Deux catastrophes, deux réalités, La Presse, 7 April 2023, Montréal, Québec, Canada, 2023.
Field, P. R., Lawson, R. P., Brown, P. R. A., Lloyd, G., Westbrook, C., Moisseev, D., Miltenberger, A., Nenes, A., Blyth, A., Choularton, T., Connolly, P., Buehl, J., Crosier, J., Cui, Z., Dearden, C., DeMott, P., Flossmann, A., Heymsfield, A., Huang, Y., Kalesse, H., Kanji, Z. A., Korolev, A., Kirchgaessner, A., Lasher-Trapp, S., Leisner, T., McFarquhar, G., Phillips, V., Stith, J., and Sullivan, S.: Secondary Ice Production: Current State of the Science and Recommendations for the Future, Meteorol. Monogr., 58, 7.1-7.20, https://doi.org/10.1175/AMSMONOGRAPHS-D-16-0014.1, 2017.
Georgakaki, P., Sotiropoulou, G., Vignon, É., Billault-Roux, A.-C., Berne, A., and Nenes, A.: Secondary ice production processes in wintertime alpine mixed-phase clouds, Atmos. Chem. Phys., 22, 1965–1988, https://doi.org/10.5194/acp-22-1965-2022, 2022.
Girard, C., Plante, A., Desgagné, M., McTaggart-Cowan, R., Côté, J., Charron, M., Gravel, S., Lee, V., Patoine, A., Qaddouri, A., Roch, M., Spacek, L., Tanguay, M., Vaillancourt, P. A., and Zadra, A.: Staggered Vertical Discretization of the Canadian Environmental Multiscale (GEM) Model Using a Coordinate of the Log-Hydrostatic-Pressure Type, Mon. Weather Rev., 142, 1183–1196, https://doi.org/10.1175/MWR-D-13-00255.1, 2014.
Green, S. D.: The Icemaster Database and an Analysis of Aircraft Aerodynamic Icing Accidents and Incidents, technical report, https://trid.trb.org/View/1402001 (last access: 8 October 2024), 2015.
Hallett, J. and Mossop, S. C.: Production of secondary ice particles during the riming process, Nature, 249, 26–28, https://doi.org/10.1038/249026a0, 1974.
Hersbach, H., Bell, B., Berrisford, P., Hirahara, S., Horányi, A., Muñoz-Sabater, J., Nicolas, J., Peubey, C., Radu, R., Schepers, D., Simmons, A., Soci, C., Abdalla, S., Abellan, X., Balsamo, G., Bechtold, P., Biavati, G., Bidlot, J., Bonavita, M., De Chiara, G., Dahlgren, P., Dee, D., Diamantakis, M., Dragani, R., Flemming, J., Forbes, R., Fuentes, M., Geer, A., Haimberger, L., Healy, S., Hogan, R. J., Hólm, E., Janisková, M., Keeley, S., Laloyaux, P., Lopez, P., Lupu, C., Radnoti, G., de Rosnay, P., Rozum, I., Vamborg, F., Villaume, S., and Thépaut, J. N.: The ERA5 global reanalysis, Q. J. Roy. Meteor. Soc., 146, 1999–2049, https://doi.org/10.1002/qj.3803, 2020.
Hogan, A. W.: Is sleet a contact nucleation phenomenon?, 42nd Eastern Snow Conference, Montreal, Québec, Canada, 292–294, https://www.easternsnow.org/esc-1985 (last access: 8 October 2024), 1985.
Hydro-Québec: Hydro-Québec fait le point sur les pannes d'électricité, http://nouvelles.hydroquebec.com/fr/communiques-de-presse/1941/hydro-quebec-fait-le-point-sur-les-pannes-delectricite last access: 2 October 2024.
Kanji, Z. A., Ladino, L. A., Wex, H., Boose, Y., Burkert-Kohn, M., Cziczo, D. J., and Krämer, M.: Overview of Ice Nucleating Particles, Meteorol. Monogr., 58, 1.1–1.33, https://doi.org/10.1175/AMSMONOGRAPHS-D-16-0006.1, 2017.
Karalis, M., Sotiropoulou, G., Abel, S. J., Bossioli, E., Georgakaki, P., Methymaki, G., Nenes, A., and Tombrou, M.: Effects of secondary ice processes on a stratocumulus to cumulus transition during a cold-air outbreak, Atmos. Res., 277, 106302, https://doi.org/10.1016/j.atmosres.2022.106302, 2022.
Keinert, A., Spannagel, D., Leisner, T., and Kiselev, A.: Secondary Ice Production upon Freezing of Freely Falling Drizzle Droplets, J. Atmos. Sci., 77, 2959–2967, https://doi.org/10.1175/JAS-D-20-0081.1, 2020.
Kleinheins, J., Kiselev, A., Keinert, A., Kind, M., and Leisner, T.: Thermal Imaging of Freezing Drizzle Droplets: Pressure Release Events as a Source of Secondary Ice Particles, J. Atmos. Sci., 78, 1703–1713, https://doi.org/10.1175/JAS-D-20-0323.1, 2021.
Korolev, A. and Leisner, T.: Review of experimental studies of secondary ice production, Atmos. Chem. Phys., 20, 11767–11797, https://doi.org/10.5194/acp-20-11767-2020, 2020.
Korolev, A., Heckman, I., Wolde, M., Ackerman, A. S., Fridlind, A. M., Ladino, L. A., Lawson, R. P., Milbrandt, J., and Williams, E.: A new look at the environmental conditions favorable to secondary ice production, Atmos. Chem. Phys., 20, 1391–1429, https://doi.org/10.5194/acp-20-1391-2020, 2020.
Kumjian, M. R., Tobin, D. M., Oue, M., and Kollias, P.: Microphysical insights into Ice pellet formation revealed by fully polarimetric Ka-band doppler radar, J. Appl. Meteorol. Clim., 59, 1557–1580, https://doi.org/10.1175/JAMC-D-20-0054.1, 2020.
Lachapelle, M. and Thériault, J. M.: Characteristics of precipitation particles and microphysical processes during the 11–12 January 2020 ice pellet storm in the Montréal area, Québec, Canada, Mon. Weather Rev., 1043–1059, https://doi.org/10.1175/mwr-d-21-0185.1, 2022.
Lachapelle, M., Thériault, J. M., and Thompson, H. D.: Observation data for four ice pellet events, Borealis, V1 [data set], https://doi.org/10.5683/SP3/TGS5HU, 2023.
Lachapelle, M., Thompson, H. D., Leroux, N. R., and Thériault, J. M.: Measuring Ice Pellets and Refrozen Wet Snow Using a Laser-Optical Disdrometer, J. Appl. Meteorol. Clim., 63, 65–84, https://doi.org/10.1175/JAMC-D-22-0202.1, 2024.
Lauber, A., Kiselev, A., Pander, T., Handmann, P., and Leisner, T.: Secondary Ice Formation during Freezing of Levitated Droplets, J. Atmos. Sci., 75, 2815–2826, https://doi.org/10.1175/JAS-D-18-0052.1, 2018.
Lawson, R. P., Woods, S., and Morrison, H.: The Microphysics of Ice and Precipitation Development in Tropical Cumulus Clouds, J. Atmos. Sci., 72, 2429–2445, https://doi.org/10.1175/JAS-D-14-0274.1, 2015.
Lawson, R. P., Korolev, A. V., DeMott, P. J., Heymsfield, A. J., Bruintjes, R. T., Wolff, C. A., Woods, S., Patnaude, R. J., Jensen, J. B., Moore, K. A., Heckman, I., Rosky, E., Haggerty, J., Perkins, R. J., Fisher, T., and Hill, T. C. J.: The Secondary Production of Ice in Cumulus Experiment (SPICULE), B. Am. Meteorol. Soc., 104, E51–E76, https://doi.org/10.1175/BAMS-D-21-0209.1, 2023.
McCray, C. D., Paquin, D., Thériault, J. M., and Bresson, É.: A Multi-Algorithm Analysis of Projected Changes to Freezing Rain Over North America in an Ensemble of Regional Climate Model Simulations, J. Geophys. Res.-Atmos., 127, e2022JD036935, https://doi.org/10.1029/2022JD036935, 2022.
Milbrandt, J. A. and Morrison, H.: Parameterization of cloud microphysics based on the prediction of bulk ice particle properties. Part III: Introduction of multiple free categories, J. Atmos. Sci., 73, 975–995, https://doi.org/10.1175/JAS-D-15-0204.1, 2016.
Milbrandt, J. A., Bélair, S., Faucher, M., Vallée, M., Carrera, M. L., and Glazer, A.: The Pan-Canadian High Resolution (2.5 km) Deterministic Prediction System, Weather Forecast., 31, 1791–1816, https://doi.org/10.1175/WAF-D-16-0035.1, 2016.
Milbrandt, J. A., Morrison, H., Ii, D. T. D., and Paukert, M.: A Triple-Moment Representation of Ice in the Predicted Particle Properties (P3) Microphysics Scheme, J. Atmos. Sci., 78, 439–458, https://doi.org/10.1175/JAS-D-20-0084.1, 2021.
Mironov, D., Heise, E., Kourzeneva, E., Ritter, B., Schneider, N., and Terzhevik, A.: Implementation of the lake parameterisation scheme FLake into the numerical weather prediction model COSMO, Boreal Environ. Res., 15, 218–230, 2010.
Morrison, H. and Milbrandt, J. A.: Parameterization of Cloud Microphysics Based on the Prediction of Bulk Ice Particle Properties. Part I: Scheme Description and Idealized Tests, J. Atmos. Sci., 72, 287–311, https://doi.org/10.1175/JAS-D-14-0065.1, 2015.
Mossop, S. C.: concentrations of ice crystals in clouds, B. Am. Meteorol. Soc., 51, 474–480, https://doi.org/10.1175/1520-0477(1970)051<0474:COICIC>2.0.CO;2, 1970.
Mossop, S. C. and Hallett, J.: Ice Crystal Concentration in Cumulus Clouds: Influence of the Drop Spectrum, Science, 186, 632–634, https://doi.org/10.1126/science.186.4164.632, 1974.
Musil, D. J.: Computer Modeling of Hailstone Growth in Feeder Clouds, J. Atmos. Sci., 27, 474–482, https://doi.org/10.1175/1520-0469(1970)027<0474:CMOHGI>2.0.CO;2, 1970.
Petters, M. D. and Wright, T. P.: Revisiting ice nucleation from precipitation samples, Geophys. Res. Lett., 42, 8758–8766, https://doi.org/10.1002/2015GL065733, 2015.
Phillips, V. T. J., Patade, S., Gutierrez, J., and Bansemer, A.: Secondary ice production by fragmentation of freezing drops: Formulation and theory, J. Atmos. Sci., 75, 3031–3070, https://doi.org/10.1175/JAS-D-17-0190.1, 2018.
Pruppacher, H. R. and Klett, J. D.: Microphysics of Clouds and Precipitation, Springer Netherlands, Dordrecht, https://doi.org/10.1007/978-0-306-48100-0, 2010.
Public Safety Canada: Canadian Disaster Database, https://cdd.publicsafety.gc.ca/ (last access: 2 October 2024), 2013.
Qu, Z., Korolev, A., Milbrandt, J. A., Heckman, I., Huang, Y., McFarquhar, G. M., Morrison, H., Wolde, M., and Nguyen, C.: The impacts of secondary ice production on microphysics and dynamics in tropical convection, Atmos. Chem. Phys., 22, 12287–12310, https://doi.org/10.5194/acp-22-12287-2022, 2022.
Roebber, P. J.: Visualizing Multiple Measures of Forecast Quality, Weather Forecast., 24, 601–608, https://doi.org/10.1175/2008WAF2222159.1, 2009.
Seidel, J. S., Kiselev, A., Keinert, A., Stratmann, F., Leisner, T., and Hartmann, S.: Secondary Ice Production – No Evidence of Efficient Rime-Splintering Mechanism, EGUsphere [preprint], https://doi.org/10.5194/egusphere-2023-2891, 2023.
Smith, A., Lott, N., and Vose, R.: The Integrated Surface Database: Recent Developments and Partnerships, B. Am. Meteorol. Soc., 92, 704–708, https://doi.org/10.1175/2011BAMS3015.1, 2011.
Sotiropoulou, G., Sullivan, S., Savre, J., Lloyd, G., Lachlan-Cope, T., Ekman, A. M. L., and Nenes, A.: The impact of secondary ice production on Arctic stratocumulus, Atmos. Chem. Phys., 20, 1301–1316, https://doi.org/10.5194/acp-20-1301-2020, 2020.
Stewart, R. E.: Canadian Atlantic Storms Program: Progress and Plans of the Meteorological Component, B. Am. Meteorol. Soc., 72, 364–371, https://doi.org/10.1175/1520-0477(1991)072<0364:CASPPA>2.0.CO;2, 1991.
Stewart, R. E. and Crawford, R. W.: Some characteristics of the precipitation formed within winter storms over eastern Newfoundland, Atmos. Res., 36, 17–37, https://doi.org/10.1016/0169-8095(94)00004-W, 1995.
Sullivan, S. C., Barthlott, C., Crosier, J., Zhukov, I., Nenes, A., and Hoose, C.: The effect of secondary ice production parameterization on the simulation of a cold frontal rainband, Atmos. Chem. Phys., 18, 16461–16480, https://doi.org/10.5194/acp-18-16461-2018, 2018.
Thériault, J. M., Stewart, R. E., and Henson, W.: Impacts of terminal velocity on the trajectory of winter precipitation types, Atmos. Res., 116, 116–129, https://doi.org/10.1016/j.atmosres.2012.03.008, 2012.
Thompson, G., Rasmussen, R. M., and Manning, K.: Explicit Forecasts of Winter Precipitation Using an Improved Bulk Microphysics Scheme. Part I: Description and Sensitivity Analysis, Mon. Weather Rev., 132, 519–542, 2004.
Tobin, D. M., Kumjian, M. R., and Black, A. W.: Effects of precipitation type on crash relative risk estimates in Kansas, Accident. Anal. Prev., 151, 105946, https://doi.org/10.1016/j.aap.2020.105946, 2021.
Zerr, R. J.: Freezing Rain: An Observational and Theoretical Study, J. Appl. Meteorol., 36, 1647–1661, https://doi.org/10.1175/1520-0450(1997)036<1647:FRAOAT>2.0.CO;2, 1997.
Zhao, X. and Liu, X.: Primary and secondary ice production: interactions and their relative importance, Atmos. Chem. Phys., 22, 2585–2600, https://doi.org/10.5194/acp-22-2585-2022, 2022.
Zhao, X., Liu, X., Phillips, V. T. J., and Patade, S.: Impacts of secondary ice production on Arctic mixed-phase clouds based on ARM observations and CAM6 single-column model simulations, Atmos. Chem. Phys., 21, 5685–5703, https://doi.org/10.5194/acp-21-5685-2021, 2021.
- Abstract
- Introduction
- Description of the P3 microphysics scheme
- GEM configuration and analysis
- Results
- Conclusions
- Appendix A: Immersion freezing parametrization
- Appendix B: Idealized one-dimensional simulations
- Appendix C: Precipitation type statistics
- Code availability
- Data availability
- Author contributions
- Competing interests
- Disclaimer
- Acknowledgements
- Financial support
- Review statement
- References