the Creative Commons Attribution 4.0 License.
the Creative Commons Attribution 4.0 License.
 | 10 Oct 2024
Measurements of particle emissions of an A350-941 burning 100 % sustainable aviation fuels in cruise
Daniel Sauer
Christiane Voigt
Theresa Harlaß
Felicitas Sakellariou
Raphael Märkl
Ulrich Schumann
Monika Scheibe
Stefan Kaufmann
Anke Roiger
Andreas Dörnbrack
Charles Renard
Maxime Gauthier
Peter Swann
Paul Madden
Darren Luff
Mark Johnson
Denise Ahrens
Reetu Sallinen
Tobias Schripp
Georg Eckel
Uwe Bauder
Patrick Le Clercq
In order to reduce aviation's CO2 emissions and comply with current climate targets, the European Union plans a mandatory quota of 2 % sustainable aviation fuel (SAF) by 2025, rising up to ≥70 % SAF by 2050. In addition to a reduction of life cycle CO2 emissions, the use of SAF can also have a positive impact on particle emissions and contrail properties. In this study we present observations from the ECLIF3 (Emission and CLimate Impact of alternative Fuels) aircraft campaign, which investigated exhaust and contrail characteristics of an Airbus A350-941 equipped with Rolls-Royce Trent XWB-84 engines. For the first time, non-volatile and total particle emissions of 100 % HEFA-SPK (hydroprocessed esters and fatty acids–synthetic paraffinic kerosene) SAF, a blended fuel and a reference Jet A-1 fuel were measured in flight. A maximum reduction in non-volatile particle number emissions of ∼41 % compared to the reference Jet A-1 fuel was measured at low cruise engine power settings when using 100 % HEFA-SPK. The reduction decreases to ∼29 % for typical cruise engine settings and to ∼22 % at high cruise engine power settings. The size of non-volatile particles was slightly smaller for HEFA-SPK compared to Jet A-1. We show a comprehensive analysis of the hydrogen content of globally available fuels. Our results demonstrate the impact of the fuel composition in terms of its aromatic, hydrogen, and sulfur content as well as of the effect of engine power settings on particle emissions. We demonstrate that the use of HEFA-SPK can significantly reduce particle emissions and thus contrail ice particles and therefore can provide an aviation climate benefit.
- Article
(3118 KB) - Full-text XML
- BibTeX
- EndNote


With an effective radiative forcing of 100.9 mW m−2 in 2018, about 3.5 % of global anthropogenic radiative forcing is caused by global aviation. The emission of CO2 and NOx and the formation of contrail cirrus account for the major share of the net warming impact (Lee et al., 2021). Contrail cirrus clouds generate the largest warming impact (∼57.4 mW m−2 in 2018) due to the trapping of outgoing long-wave radiation, followed by CO2 (34.3 mW m−2) and NOx emissions (17.5 mW m−2). Unlike CO2, which has an atmospheric residence time of centuries, contrail cirrus have a lifetime of several hours (Vázquez-Navarro et al., 2015; Bier et al., 2017). Reducing or avoiding contrail-induced clouds could therefore reduce the radiative forcing (RF) of aviation on short timescales.
Contrails are formed when warm exhaust air is cooled down to cold atmospheric air temperatures at cruise altitude (Schumann, 1996). When liquid saturation is reached in the plume, water vapour from exhaust condenses on emitted or pre-existing atmospheric aerosol particles forming droplets which immediately freeze to ice particles. In the case of soot-rich combustion from past and current combustor technologies, the main fraction of water droplets condenses on soot particles produced during combustion (Heymsfield et al., 2010; Kärcher, 2018; Kleine et al., 2018). If the air mass remains supersaturated with respect to ice, contrails may continue to grow and spread, forming extended contrail cirrus on regional scales (Voigt et al., 2011; Minnis et al., 2013; Schumann et al., 2017; Voigt et al., 2017; Chauvigné et al., 2018; Wang et al., 2023).
Several approaches are pursued to reduce the impact of aviation on global warming. On long-term timescales, hydrogen-powered engines could be a promising option. However, these technologies will not be available for commercial use for a long time because they face several challenges, particularly related to fuel storage and airport infrastructure (Hoelzen et al., 2022).
On a short- to mid-term timescale, technologies are needed that are feasible with the current aircraft fleet and airport infrastructure (drop-in solutions). Since fewer than 10 % of flights are responsible for about 80 % of the RF caused by contrails (Teoh et al., 2020a, 2022a), the rerouting of such flights or the targeted use of sustainable aviation fuels (SAFs) could be a promising option (Teoh et al., 2022b).
The most prominent commercially available SAF is currently HEFA-SPK (hydroprocessed esters and fatty acids–synthetic paraffinic kerosene). During the combustion of HEFA, no fossil CO2 is released, which reduces the life cycle of greenhouse-gas emissions by up to 84 % (ICAO, 2023a; Prussi et al., 2021). Furthermore, it is nearly free of aromatics and sulfuric compounds, which can have a positive effect on contrail properties, leading to a reduced radiative forcing (Voigt et al., 2021; Märkl et al., 2024).
The dominating constituent of contrail formation on engine exhaust is soot particles as they are emitted in large numbers and are sufficiently large to serve as condensation nuclei that can be readily activated as seed droplets for ice formation (Kärcher et al., 2015; Burkhardt et al., 2018). As shown in laboratory tests and engine tests, fuels with a higher hydrogen content, such as blends of HEFA-SPK and Jet A-1, produce less soot during combustion (Lobo et al., 2011; Beyersdorf et al., 2104). Ground experiments investigating soot emissions from sustainable aviation fuels as well as in-flight measurements with HEFA-SPK blends (up to 50 % blending ratio) have already demonstrated the reduction potential of SAF concerning soot formation and the associated formation of contrail ice particles (Schripp et al., 2018; Moore et al., 2015, 2017; Tran et al., 2020). For example, Moore et al. (2017) have shown that biofuel blending can reduce soot number emissions in flight by 25 % for high cruise power settings and by 50 % for low to medium cruise power settings. Comparable and slightly larger reductions in contrail ice particles have been observed by Voigt et al. (2021) and Bräuer et al. (2021). It is to be noted that these campaigns were performed with engines from previous generations and therefore with different engine performance parameters compared to modern engines, which can influence the observed reductions. Slightly larger reductions in contrail ice crystals (Voigt et al., 2021) may point to an additional role of sulfur in contrail ice crystal formation. Global models show that reductions in contrail ice particle number concentration by 41 % can reduce contrail radiative forcing (CRF) by 15 %. The CRF reduction increases to 59 % for 84 % ice crystals reduction (Bier and Burkhardt, 2022). Another model study of the effects of low aromatic fuels with increased hydrogen content in emissions and contrails for air traffic in the Northern Atlantic flight corridor (Teoh et al., 2022b) suggests that a stepwise increase in SAF blending ratio leads to a reduction in soot particle emission, a slight increase in the prevalence of contrail formation, a reduction in ice crystal number concentration and contrail optical thickness, and a reduction in contrail cloud cover and therefore a reduction in the climate impact of contrails. For 100 % SAF, Teoh et al. (2022a) simulate a 44 % change in radiative forcing from contrails. Märkl et al. (2024) found a 56 % decrease in ice particle number from the combustion of 100% HEFA-SPK compared to a reference Jet A-1 fuel during a case study on the ECLIF3 measurements. From that, they estimated a decrease in CRF of 26 % on a global scale. While each study suggests a climate benefit when using SAF, the estimate of the actual change in contrail forcing by reduced soot emissions is uncertain (Burkhardt et al., 2018).
So far, hardly any in-flight measurements have been carried out to investigate the impact of the combustion of more than 50 % HEFA-SPK on trace gas and aerosol emissions as well as on contrail properties. This is due to the fact that there is a regulatory lower limit for the aromatic content of the resulting blended fuel of 8 % by volume to keep the elastomer seals swollen and prevent fuel from leaking. It was therefore the aim of the ECLIF3 (Emission and CLimate Impact of alternative Fuels) campaign to sample the effects of using up to 100 % HEFA-SPK on the large passenger aircraft A350 with Rolls-Royce engines for the first time and investigate the influence of varying cruise engine power settings. This project was realized in collaboration with the German Aerospace Center (DLR), Airbus, Rolls-Royce, Neste, NRC Canada, and the University of Manchester and involved major certification and testing efforts. While this paper focuses on the non-volatile and total particle number emissions sampled during the in-flight measurements, results regarding NOx emissions and contrail formation are discussed elsewhere (Harlass et al., 2024; Märkl et al., 2024).
2.1 The ECLIF3 campaign
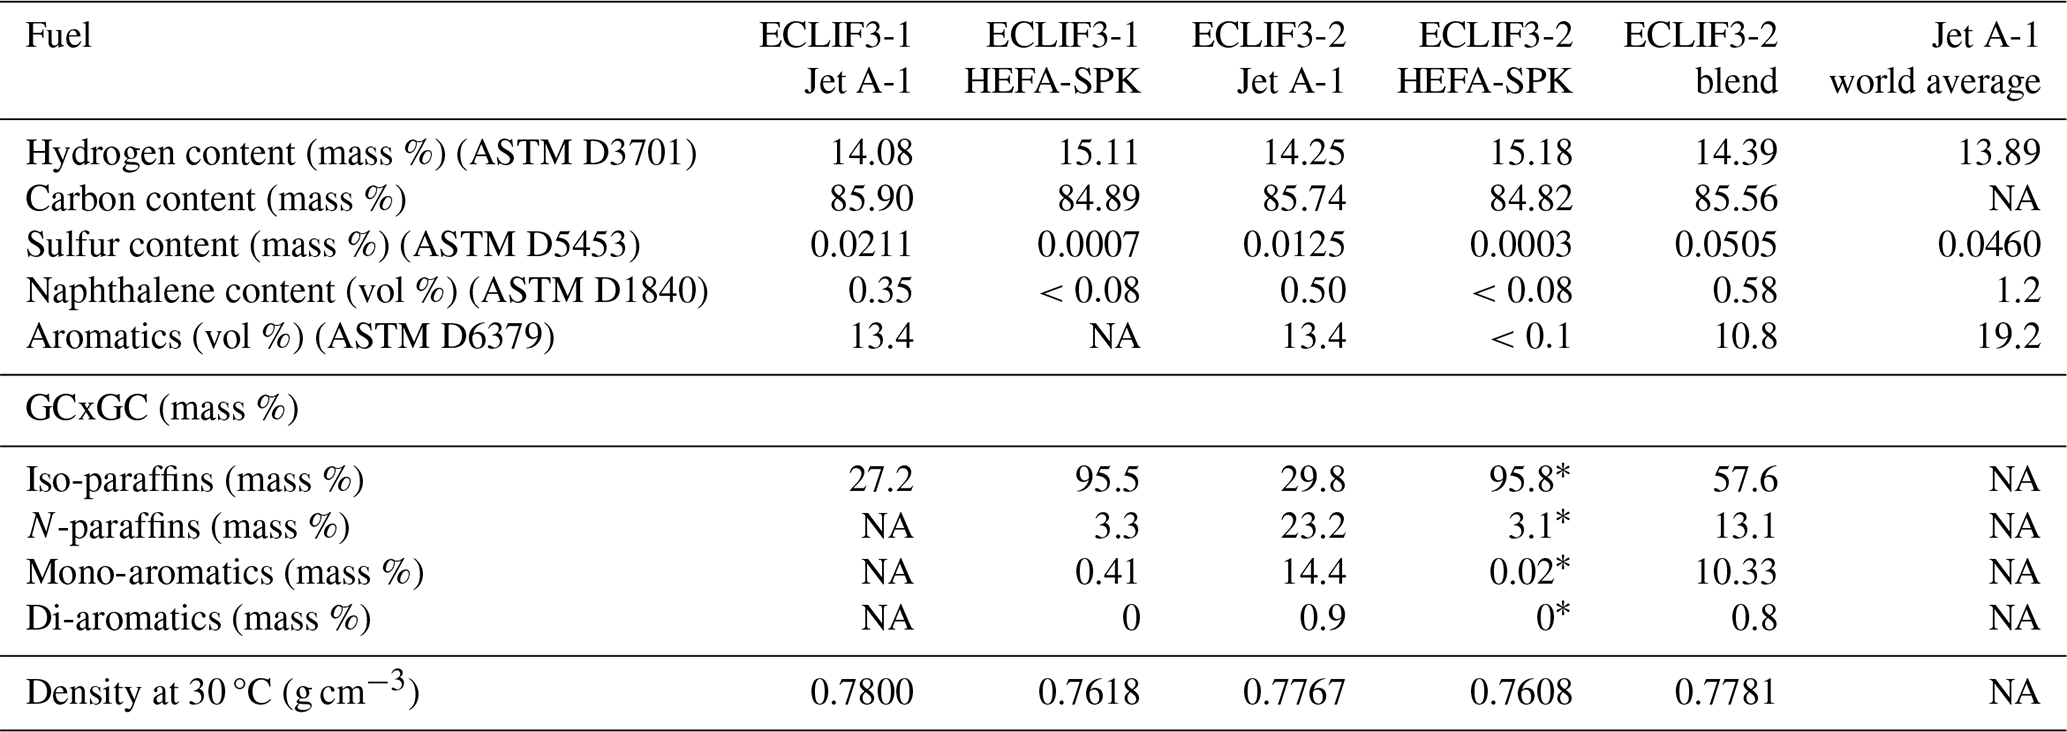
Measurement data have been collected as part of the ECLIF3 campaign (Emission and CLimate Impact of alternative Fuels) that took place in April 2021 (ECLIF3-1) and November 2021 (ECLIF3-2). The aim of the flight experiments was to characterize the influence of the combustion of three different jet fuels and different engine power settings on soot properties, contrail ice particles, and trace gas emissions. An Airbus A350-941 (reg. F-XWB) with Rolls-Royce Trent XWB-84 engines served as the source aircraft. For the first time, in-flight measurements of contrails and emissions burning 100 % HEFA-SPK on both engines have been performed. For operational reasons, the right engine (engine serial number 21004) was replaced by another engine (engine serial number 21012) of the same type between April and November 2021. In addition to the replaced engine, the fuels were slightly different between ECLIF3-1 and ECLIF3-2 (see Table 2).
As the main parameter for determining the engine state, the combustor inlet temperature (commonly designated as T3 or T30) was used, which is defined as the temperature at the outlet of the high-pressure compressor and prior to the combustion chamber. The corresponding pressure at the combustor inlet is accordingly referred to as P30. In situ in-flight measurements were performed with the DLR-operated research aircraft Dassault Falcon 20-E5 (reg. D-CMET). The Falcon is equipped with a comprehensive payload for measurements of trace gases and particle emissions as well as cloud particle formation of the source aircraft exhaust plume. A total of nine measurement flights were conducted in extended racetrack patterns in special traffic restricted areas along the French Mediterranean coast and the Atlantic coast west of Bordeaux (see Table 1, Fig. 1).
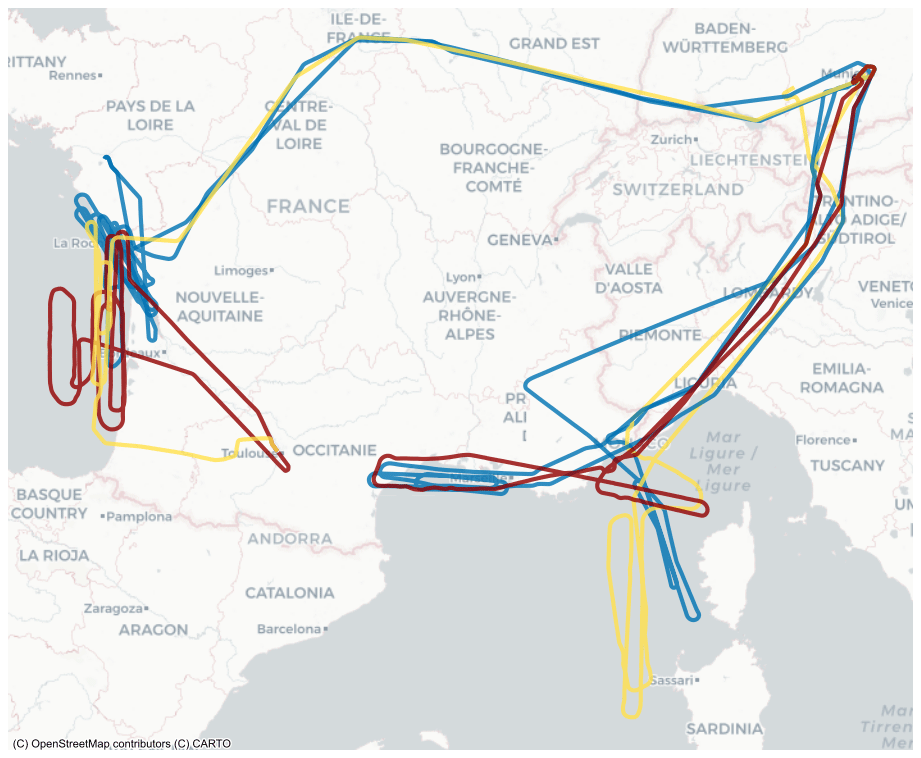
Figure 1Flight tracks of the chase flights during the ECLIF3 campaign in April and November 2021. Emission measurement flights are marked blue, contrail flights are red, and flight missions covering both objectives are marked yellow.
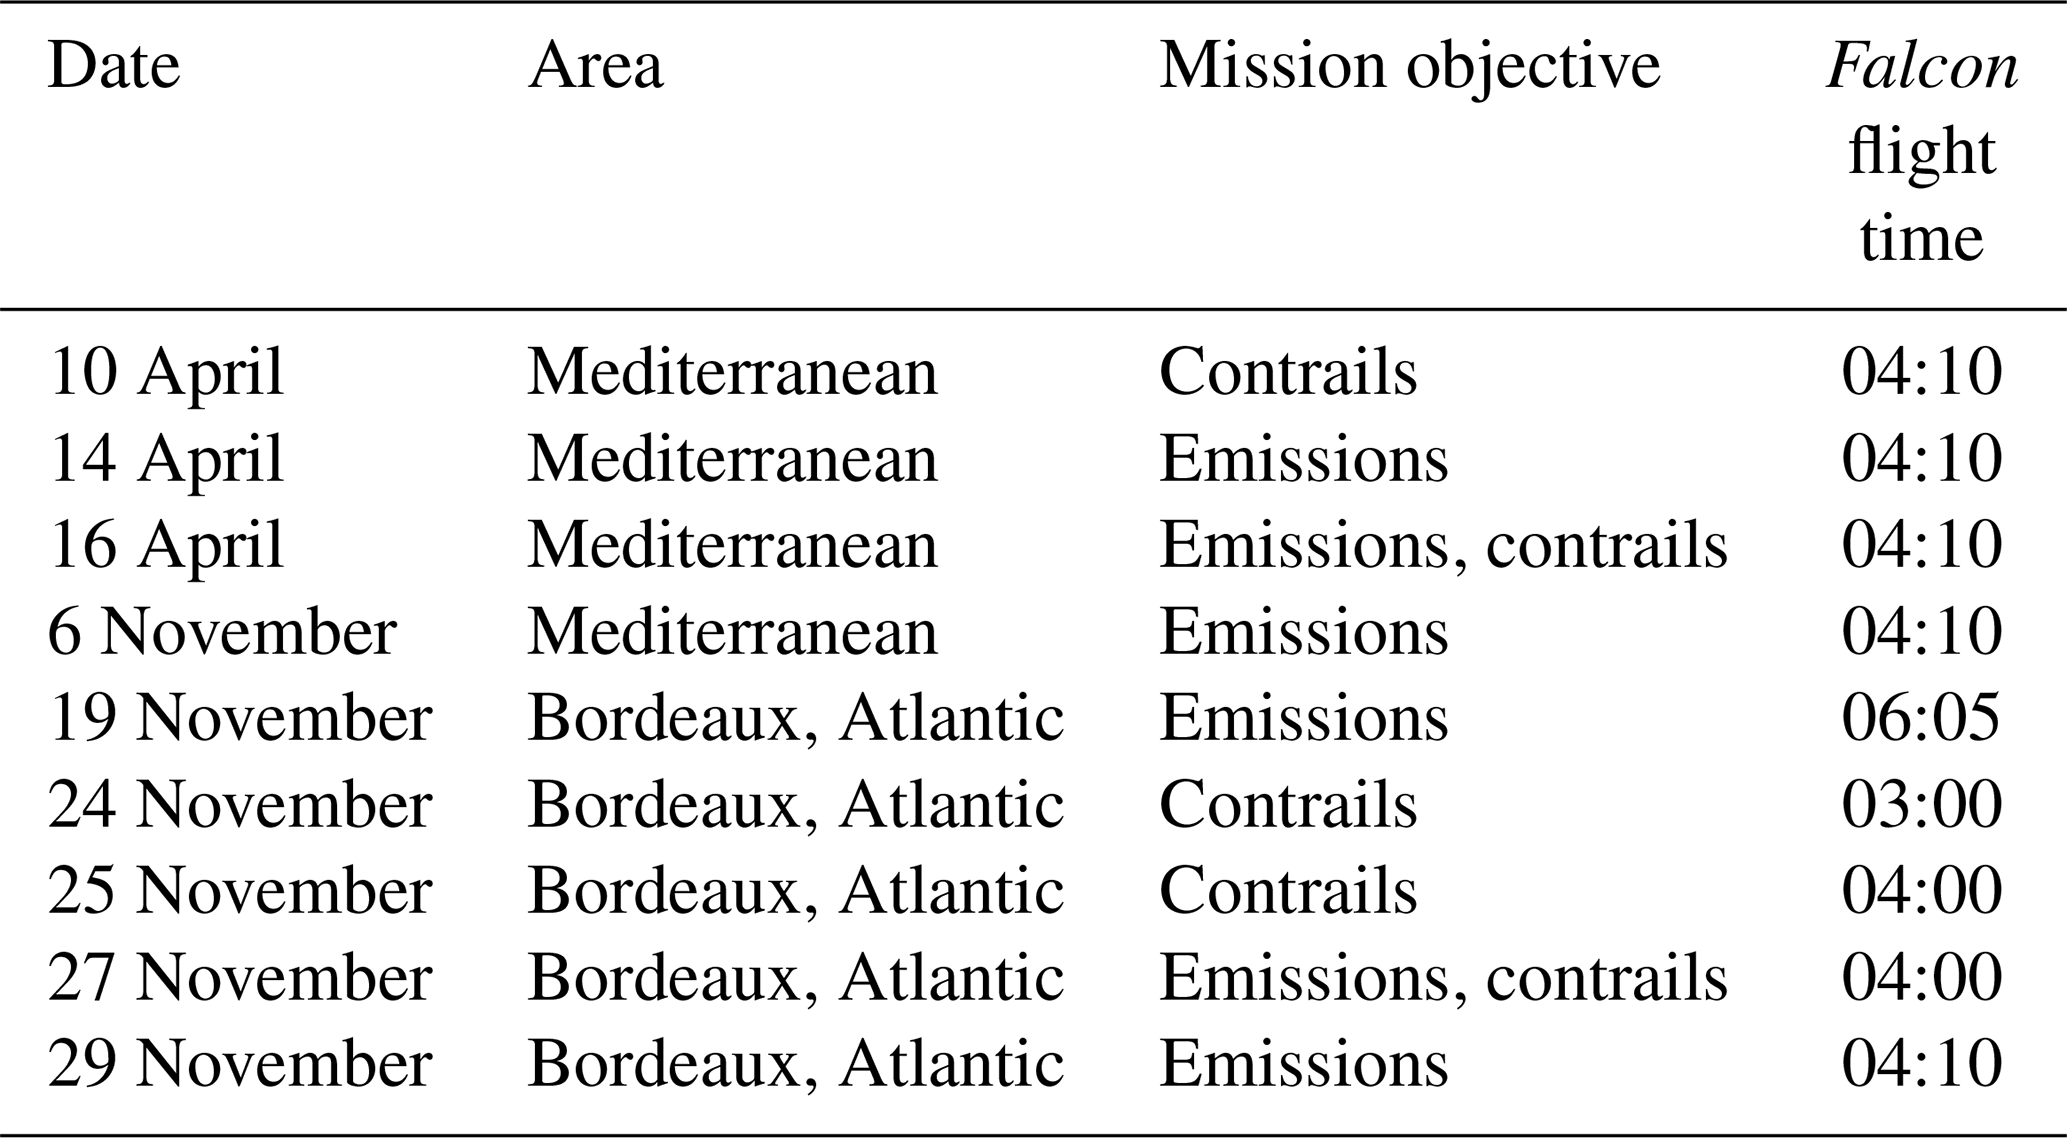
Table 2Selected properties of the fuels burned by the A350 during the test sequences. Fuel properties were analysed according to ASTM standards. Additionally, the contents of iso-paraffins, n-paraffins, mono-aromatics, and di-aromatics were evaluated by GCxGC gas chromatography. The carbon content refers to the difference between 100 % and hydrogen and sulfur content. Some ECLIF3-1 fuel data have been revised compared to Märkl et al. (2024). Fuel samples were collected from the aircraft tank prior to the flights. * Samples for GCxGC analysis of ECLIF3-2 HEFA-SPK fuel were collected during loading of the ISO container. World average fuel data were obtained from the CRC World Fuel Sampling Program (Hadaller and Johnson, 2006).
NA: not available.
Contrails were generally measured in the far field at >5 nmi distance to the A350. Emission measurements, which are the focus of this work, were captured in the near field about 100–200 m (<1 s) behind the A350 in test areas where comparatively high ambient air temperatures and low humidities prevented the formation of contrail ice particles in order to measure the unprocessed emissions of the source aircraft. The right engine was studied and operated at typical cruise T30, while the other engine was operated at variable thrust to keep the airspeed of the A350 within the range of the Falcon's speed performance. Near-field measurements were taken directly behind the right engine to exclusively capture the emissions of this engine. The dedicated flight test instrumentation on the A350 permitted the targeting of specific combustor inlet temperatures T30, at a given Mach number and altitude. The engine conditions were kept constant during individual measurement sequences typically lasting 10–20 min, depending on measurement conditions, defining different test points.
During the measurements, a conventional Jet A-1 fuel from the local supplier at Toulouse–Blagnac airport (TotalEnergies) was probed. This fuel was used as a reference for the measurements using 100 % HEFA-SPK and a 38 % blend of HEFA-SPK and Jet A-1 fuel, both supplied by Neste Corporation. The blended fuel was sampled during ECLIF3-2 only. It was composed of the HEFA-SPK sampled during ECLIF3-2 but a different Jet A-1 with a higher naphthalene and sulfur content. Since the engines of the A350 can be fed from separate tanks, test points with three different fuels could be accomplished within a single flight to ensure comparable atmospheric and engine conditions. The properties of the fuels varied slightly between the two mission phases of the campaign. Selected fuel properties are shown in Table 2. Both HEFA-SPKs show a high content of iso-paraffins in relation to n-paraffins. This property could slightly increase the formation of soot particles (Kathrotia and Riedel, 2020). Compared to the global average Jet A-1 fuel, the reference fuels of ECLIF3-1 and ECLIF3-2 show a high hydrogen content, which is linked to a lower carbon content as well as a reduced aromatic and naphthalene content.
Figure 2 visually communicates a comparison of the hydrogen content in different types of fuels: conventional fuels, HEFA-SPK blends, and HEFA-SPK. The figure is designed in a tabular format with three rows, each representing a different fuel type. The first row pertains to conventional fuels, represented by data compiled from 91 different fuels included in the CRC World Fuel Sampling Program of 2006 and various DLR (German Aerospace Center) research projects.
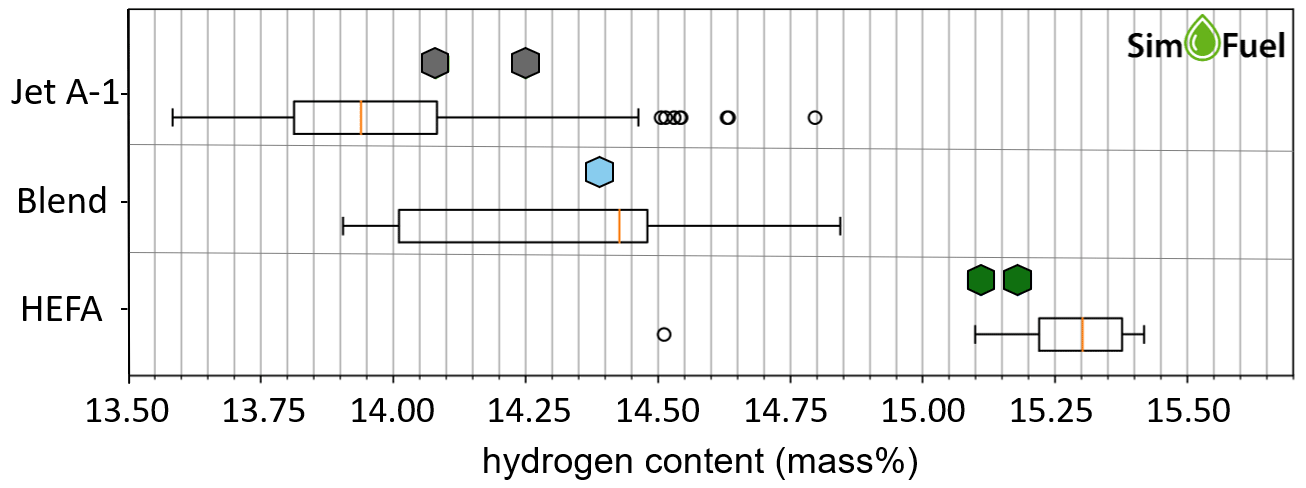
Figure 2Hydrogen content of the fuels used during the ECLIF3 campaign (hexagons) compared to world average fuel data (box-and-whisker symbols) from the SimFuel platform. Both conventional Jet A-1 fuels used during the campaign show a higher hydrogen content, the HEFA-SPK shows a lower hydrogen content, and the blended fuel shows an average hydrogen content compared to average fuels of the same type. The box in the plot extends from the first quartile to the third quartile of the data, with an orange line indicating the median. The whiskers extend from the box to the furthest data point that falls within 1.5 times the interquartile range. Any data points beyond the end of the whiskers are marked as empty circles, indicating outliers.
The second row represents HEFA-SPK blends, for which the figure includes data from nine fuels, all from DLR research projects. These fuels include HEFA-SPK that is blended with either synthetic aromatic components, conventional kerosene, or both. The third row is dedicated to HEFA-SPK, and it includes data from 17 fuels from DLR research projects. It should be noted that the dataset for HEFA-SPK and its blends is quite small compared to that of the conventional fuel type. The figure underscores that both instances of Jet A-1 used in the measurement campaign had a higher hydrogen content relative to the global average of the available conventional fuels. In contrast, the pure HEFA-SPK had a relatively low hydrogen content compared to other HEFA-SPKs. The HEFA-SPK blend is positioned in the upper section of the box, just slightly below the median.
In addition, the sulfur content of both Jet A-1 is reduced compared to the global average, underscoring that our reference fuel is rather on the clean side of the typical fuel properties spectrum regarding its hydrogen content. Naturally, HEFA-SPK does not contain sulfur. However, residual fuel may remain in tanks and pipelines in the supply chain and the aircraft fuel system, resulting in low sulfur levels of 0.0003 %–0.0007 % by mass in the test fuels (see Table 2).
2.2 Aerosol and trace gas measurements
The instrumentation of the DLR research aircraft Falcon consisted of several cabin-mounted aerosol particle and trace gas instruments, which sample ambient air through inlets located on the upper fuselage in the centre line of the aircraft. These instruments were used to detect the particle number concentration of total particulate matter (totPM), non-volatile particulate matter (nvPM), the sum of NOx and all reactive nitrogen species (NOy), CO2, CO, and H2O. To measure ice particles in ambient atmospheric conditions, two cloud particle probes were mounted in the inner underwing pods. This study focuses on the aerosol measurements. Results regarding NOy and contrails can be found in accompanying publications.
The aerosol instrumentation for ECLIF3 included a set of five butanol-based condensation particle counters (CPCs) (Feldpausch et al., 2006; Kleine, 2019; Voigt et al., 2021) sampling from a forward-facing isokinetic aerosol inlet. The particle counters are based on TSI CPC model 3010 and 3768a (TSI Inc, Minneapolis, USA) that have been modified for aircraft use in low-pressure environments. Three of the CPCs were sampling through the heated inlet line of a thermal denuder at 250 °C to characterize the number concentration of non-volatile particulate matter (nvPM), the other two counters were sampling the total particle number concentration (totPM). To obtain size information of the particulates, the particle counters were operated at different lower cut-offs (D50 – referring to the diameter of 50 % detection efficiency; e.g. Mertes et al., 1995). The D50 values of the totPM were set to 5 and 10 nm by adjusting the temperature difference between saturator and condenser. One of the nvPM counters was set to a D50 value of 14 nm, the other two were operated with diffusion screen separators in the inlet lines to achieve larger cut-off values of ∼30 and ∼90 nm (see Feldpausch et al., 2006, for details of the setup). The cut-off diameters were characterized and validated in laboratory measurements at low pressure with Ag aerosol against a Faraday cup electrometer (GRIMM Aerosol Technik, Ainring, Germany) as reference. In addition, the detection efficiency of the particle counters at low inlet pressure was determined in the laboratory to derive a pressure-dependent correction function, which was applied to the airborne measurements (see Appendix A). Unfortunately, the totPM particle counter TSI 3768a with D50=10 nm showed a leak during the second part of the campaign such that no data are available for this size for the second campaign. Therefore, our analysis of totPM is based on the 5 nm counter. Further details on CPC calibration, e.g. the correction of inlet line losses, and the uncertainty analysis are given in Appendix A.
Instrumentation for CO2 measurements comprised a cabin-mounted high-frequency (≈10 Hz) non-dispersive infrared gas analyser, LI-7000 (LI-COR Inc., Lincoln, NE, USA), used for in-plume and background detection. The accuracy of the CO2 measurement amounts to around 0.2 ppm and is independent of measured mixing ratios. A slower (≈0.3 Hz) but more stable wavelength-scanned cavity ring-down spectrometer (CRDS; Picarro G2401-m, Picarro Inc., Santa Clara, USA) was used for atmospheric background and absolute mixing ratio detection. The accuracy of the Picarro G2401-m ranges between 0.5 and 740 ppb (avg. 55 ppb), depending on the stability of the optical cavity pressure. Trace gas instruments were calibrated repeatedly with commercial gas standards during the campaign. Trace gas detectors, as the aerosol detectors, obtain their sample air through inlets on the centre line of the upper fuselage (Harlass et al., 2024).
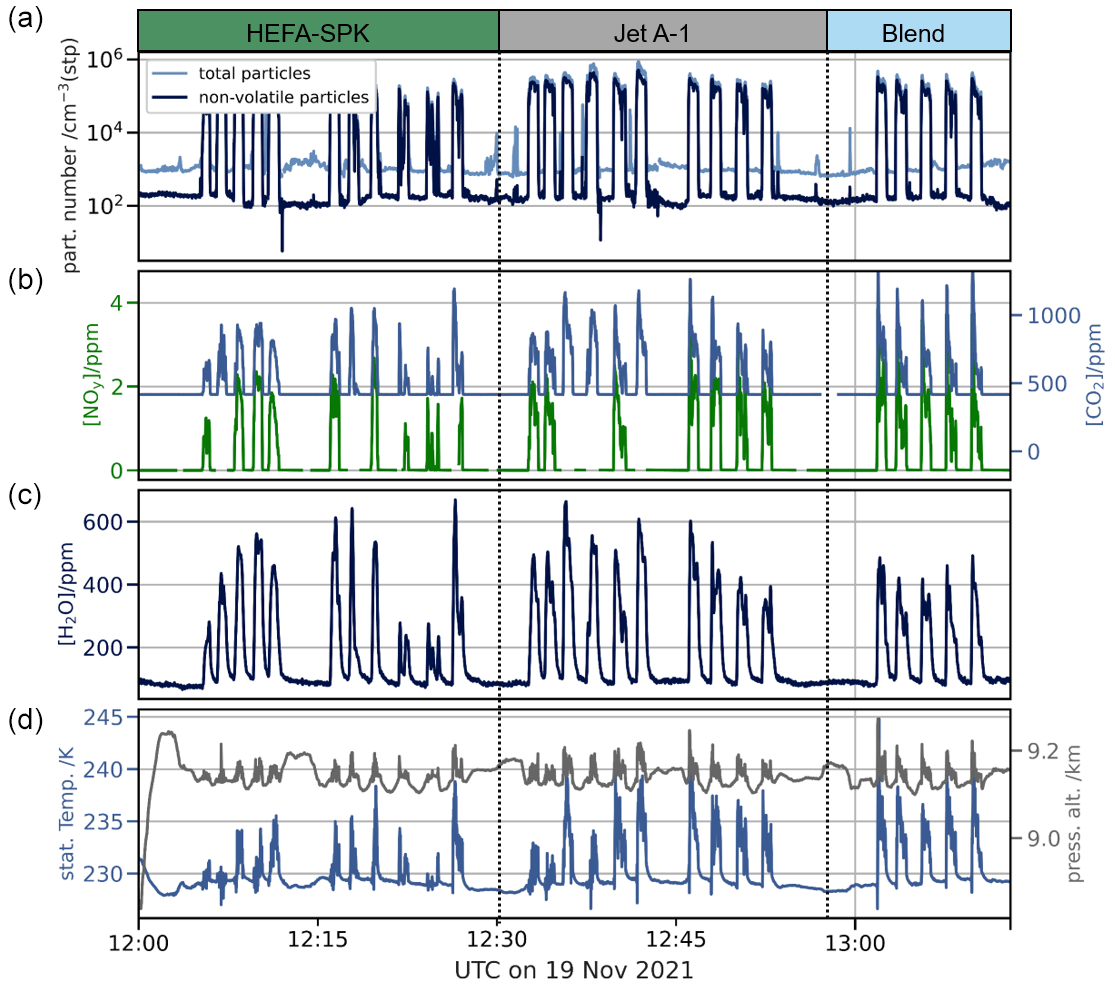
Figure 3Timeline of the second emission flight during ECLIF3-2 on 19 November 2021 over the Atlantic. Panel (a) shows the number concentration of total particles larger than 5 nm (light blue) and non-volatile particles larger than 14 nm (dark blue) at standard temperature and pressure, panel (b) shows trace gas concentrations of CO2 (blue) and NOy (green), panel (c) shows the timeline of the water vapour concentration, and panel (d) shows the ambient temperature and the altitude of the research aircraft. During the peak sequences of the timelines, the Falcon was located within the plume about 100–200 m behind the A350.
Figure 3 shows an example of a time series of aerosol and trace gas measurements as well as flight altitude and ambient air temperature of an emission measurement flight on 19 November 2021. The distinct collocated enhancements in particle and trace gas emissions as soon as the Falcon climbs into the plume of the A350 are clearly visible. Usually, the Falcon climbed into the exhaust plume from the right side slightly below the plume to ensure that the inlets on the upper fuselage were located inside the plume. This position was then held for about 45 s before the Falcon dropped out again to measure the atmospheric background concentrations. This process was repeated three to five times per test point.
To account for dilution, inhomogeneities, and mixing of exhaust air with ambient air, the particle emission index (EI) is calculated. The emission index links the particle concentration to the amount of fuel burned by the engine by scaling particle measurements with CO2 measurements, for which the EI is known and constant (e.g. Moore et al., 2017):
where R is the ideal gas constant, T and p are standard temperature (273.15 K) and pressure (1013.25 hPa), α is the hydrogen-to-carbon molar ratio of the fuel, M(C) and M(H) are the molar masses of carbon and hydrogen, and ΔCO2 and ΔN are the background-subtracted peak areas of the recorded concentrations of CO2 and particles at standard conditions during a plume encounter sequence. The emissions index has the unit number of particles per kg fuel burned. The uncertainty of the particle emission index can be calculated using Gaussian error propagation comprising the standard deviation of CO2 and particle background sequences, the uncertainty of the particle measurement correction functions, the uncertainty of the hydrogen-to-carbon molar ratio of the fuel, and the measurement uncertainty of the CO2 instrumentation and amounts to approximately 10 % (see Appendix A).
2.3 Modelling of nvPM number emissions
Measurements of aircraft particle emissions in flight can be used to evaluate models predicting aircraft engine nvPM emissions. These models are used to predict the impact of different flight and engine operating conditions and the influence of different fuels on particle emissions. Such models are also used to perform further analyses, for example to estimate the impact on contrail formation and radiative forcing (e.g. Teoh et al., 2024). Here, results from the flight experiments will be compared to modelled emissions indices of two different emission models, whose methodologies are publicly available. The first is the Mission Emissions Estimation Methodology (MEEM) (Ahrens et al., 2022), which models soot emissions based on estimated engine parameters. The second one is the T4/T2 model (Teoh et al., 2022a), which estimates soot emissions based in particular on fuel flow, which is usually available to modellers via performance models or in this case from the flight measurements.
2.3.1 MEEM
MEEM provides an estimation of the emission index for non-volatile particulate matter mass and number of jet engine aircraft at altitude as described by Ahrens et al. (2022). The methodology can be applied to the three flight phases climb, cruise, and descent (above 3000 ft). MEEM recommends to use given LTO (landing-and-take-off cycle) points for altitudes below 3000 ft. The methodology uses ground-level reference data to estimate in-flight conditions. It is recommended to use the publicly available emissions certification LTO (covering 7 %, 30 %, 85 %, and 100 % of rated thrust) nvPM data from the International Civil Aviation Organization (ICAO) Aircraft Engine Emissions Databank (EEDB; ICAO, 2024). For older engines showing no nvPM data in the EEDB, MEEM recommends using SCOPE 11 (Agarwal et al., 2019) to estimate EI mass and number values from given smoke number measurements (described as Step 0). The core MEEM calculation is performed in four steps. In Step 1, in-flight conditions are estimated using altitude and Mach Number as input. With the help of a given fixed pressure coefficient and compressor efficiency (specified separately for climb, cruise, and descent mode), in-flight T30 and P30 are calculated. In Step 2, the equivalent ground thrust condition is determined at the same calculated T30 and the corresponding ground reference P30. The read-out of EI mass and number at the calculated thrust requires a linear interpolation between the four given LTO points in Step 3. In addition to the four LTO points, the maximum EI mass and EI number values are also reported by engine manufacturers in the EEDB. For some engines, the engine manufacturer has also provided an indication on the position of these maxima vs. the standard LTO points. In the case of the Trent XWB-84, these maxima are reported to be located between the 30 % and 85 % LTO points. Therefore, it is assumed that this fifth point (one for EI mass, one for EI number) is in this case at 57.5 % thrust. Here, a five-point interpolation (MEEM describes four- vs. five-point interpolation in Step 3) is used since the data are available in the EEDB. Finally, Step 4 corrects the EI mass for the difference in combustor pressure and air-to-fuel ratio (AFR) between the ground and flight relying on simplified Döpelheuer and Lecht correlation (Döpelheuer, 2002). As combustor AFRs at the ground and in flight are regarded as highly sensitive data only known to engine manufacturers, MEEM gives a default enrichment factor of 1.1 assuming the combustor runs 10 % soot-richer in flight. The EI number value is then calculated by multiplying the corrected altitude EI mass value by the ratio of the read-out EI number to EI mass at ground reference. In order to include fuel impacts on nvPM emissions in MEEM, the proposed hydrogen content correction in ICAO CAEP Annex 16 Vol II (ICAO, 2023b) is applied to the nvPM emission indices.
2.3.2 The T4/T2 method
The T4/T2 method is a new approach described by Teoh et al. (2022a) which utilizes nvPM number EI from the ICAO Aircraft Engine Emissions Databank to perform a linear interpolation relative to a non-dimensional engine power parameter, T4/T2. The T4/T2 model simulates the temperature at combustor exit (engine station 4), accounting for the combustion of fuel with an estimated air-to-fuel mass ratio. This requires an estimate of engine power for given fuel mass flow rate. The fuel mass flow rate is known from Airbus A350 data as a function of time during each ECLIF3 flight. Besides fuel flow, the method requires input for the engine pressure ratio and the nvPM number emission index for available engine types at the four LTO certification test points (ICAO, 2024). Internally it uses a compressor efficiency = 0.9 as suited for cruise. For details of the method we refer to the supplement of Teoh et al. (2022a). The T4/T2 method replaces the older fractal aggregate model that was used in earlier studies (Teoh et al., 2019, 2020a, b) to estimate the nvPM EI from the particle size distribution, morphology, and mass emission index (Stettler et al., 2013; Abrahamson et al., 2016).
3.1 Influence of engine power settings on particle number emission
In order to link particulate emissions to the respective engine state, emission indices are evaluated relative to fuel flow and T30. Since exact values of the engine state fall under intellectual property of the manufacturer, we denote relative changes to mean values for fuel flow and to typical cruise conditions for T30 only (marked as REF). Three different T30 temperatures were tested, with the low T30 setting differing −40 K and the high T30 setting differing +20 K from the medium T30 value (REF). Scales of ECLIF3-1 and ECLIF3-2 are based on the same absolute values.
Emissions from burning the different fuels were sampled at several altitudes between FL280 and FL360, corresponding to a pressure altitude of 28 000–36 000 ft (8500–11 000 m), emissions from burning the blended fuel were sampled exclusively at FL310 due to constraints in fuel availability and measurement time in suitable atmospheric conditions. For near-field emission measurements, the right engine of the A350 was sampled at different combustor inlet temperatures (T30). During the measurement sequences, the Mach number was kept constant at 0.61–0.62. One test point during ECLIF3-1 at FL350 was performed, with a diverging Mach number of 0.68 for the HEFA-SPK test point and 0.65 for the Jet A-1 test point. It is important to note that the typical cruise speed of an A350 is around 0.85 and therefore higher than during the measurement sequences. T30 of the probed engine was adjusted to correspond to typical cruise T30 conditions. The difference in Mach number and altitude can result, at fixed T30, in different P30 and a different air-to-fuel ratio compared to typical cruise conditions, which can lead to a variance in absolute particle EI. However, the observed percentage difference in particle emissions between the fuels is comparable to that measured in the far field in typical cruise conditions (see Märkl et al., 2024). Since different engines and fuels were used for the two campaign periods, the influence of the engine power settings will be assessed separately to make the comparison more conclusive.
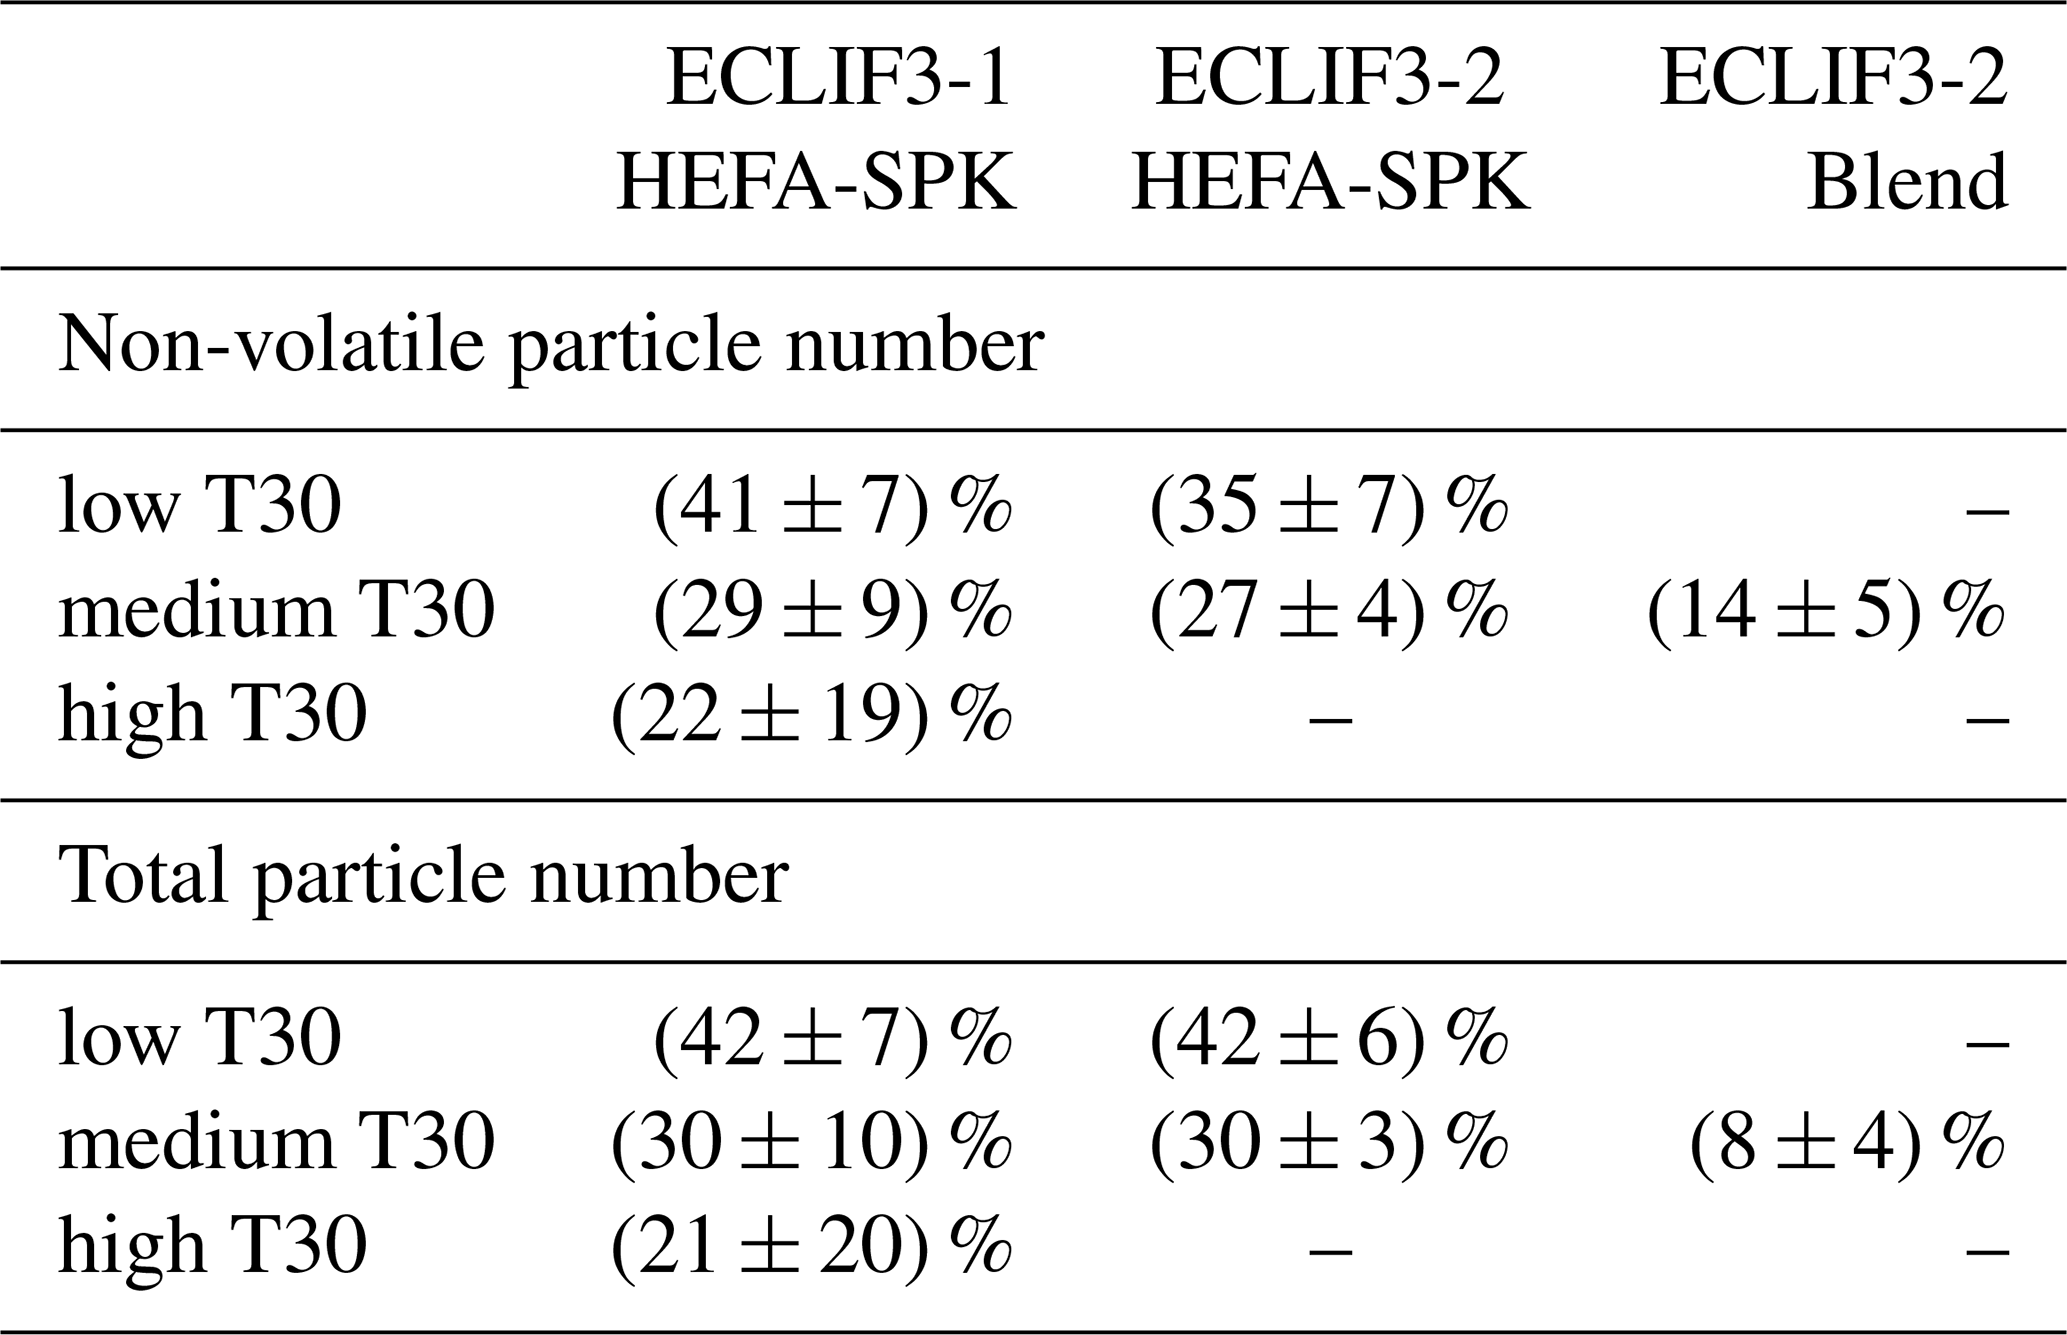
In Fig. 4, the correlation of non-volatile and total particle number emission index, with combustor inlet temperature of the ECLIF3-1 campaign on the left and the ECLIF3-2 campaign on the right, is shown. To increase comparability, only measurement data at pressure altitudes between 8500–9500 m (FL280–FL310) are considered. The Mach number was fixed at 0.61–0.62 for the measurements. The nvPM emission index decreases with increasing T30 for both Jet A-1 and HEFA-SPK measurement sequences. The effect is less pronounced for HEFA-SPK fuel than for Jet A-1, which lowers the relative reduction of nvPM due to HEFA-SPK compared to the fossil reference Jet A-1 fuel at higher values of T30. The reduction in particle emissions of the test engine at given thrust range (based on median values) as a result of using 100 % HEFA-SPK instead of Jet A-1 amounts to 35 %–42 % for low T30, 27 %–29 % for medium T30, and 21 %–22 % for high T30; see Table 3. The classification from low to high does not refer to the maximum aircraft performance but to typical in-flight values. A reduction of 14 % is observed using the blended fuel compared to Jet A-1 (ECLIF3-2 data, medium T30). The reduction in the total particle number EI is comparable to the reduction in nvPM.
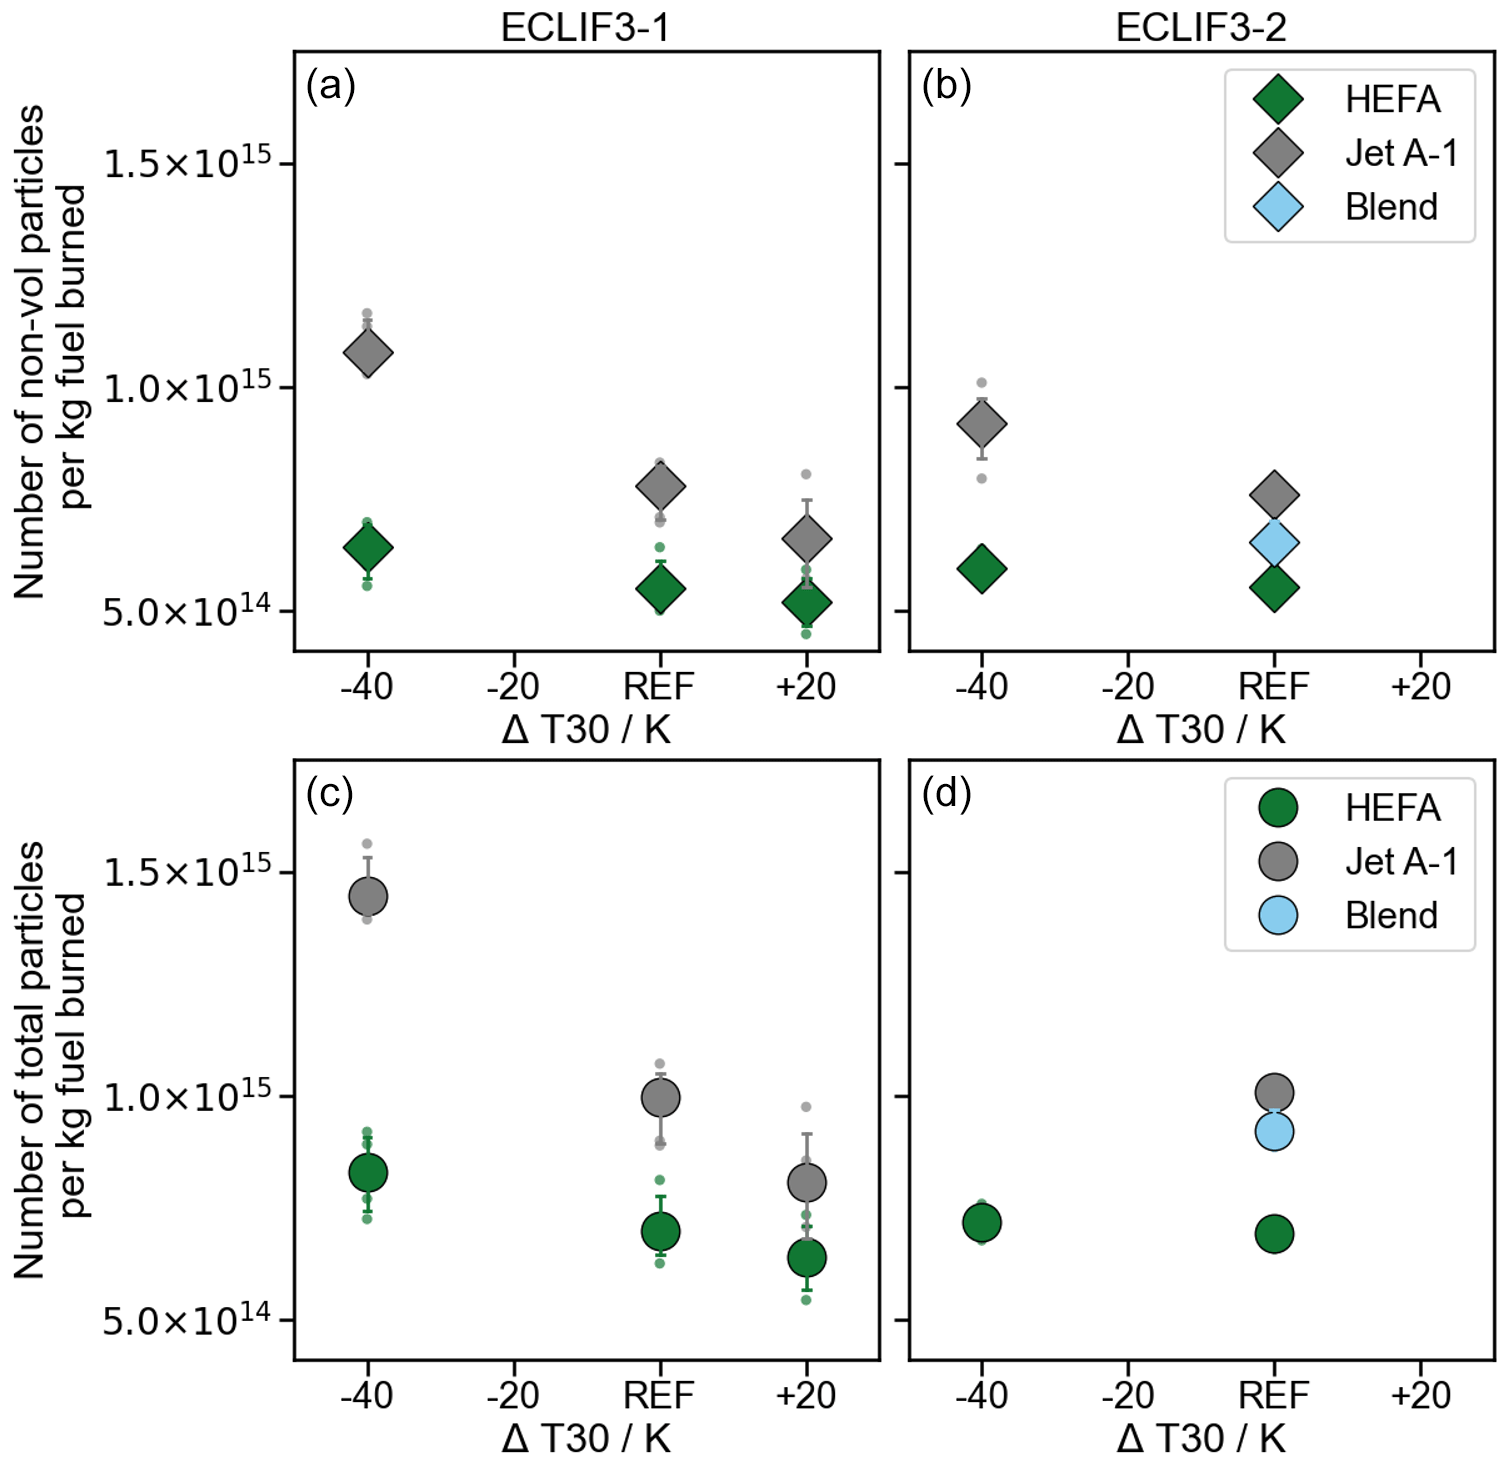
Figure 4Emission index of non-volatile particle (a, b) and total particle number (c, d) with difference to a reference combustor inlet temperature (T30) in kelvin for the different fuels probed during ECLIF3-1 at FL280 (a, c) and ECLIF3-2 at FL310 (b, d). The particle emission index decreases with increasing T30, with the largest decrease in emissions when using Jet A-1. The figure shows median values and 25th–75th percentiles.
Table 3Reduction in nvPM number emission index (top) and total particle emission index (bottom) from the use of the alternative fuel compared to the reference fuel Jet A-1 sampled during ECLIF3-1 at FL280 and ECLIF3-2 at FL310 for the different combustor inlet temperatures (T30).
In Fig. 5, fuel flow dependent particle number EI are shown. Due to the wider spread of the fuel flow settings, these were grouped into bins with a range of 10 % of the mean fuel flow. The flight altitude ranges between FL280–FL360 and the Mach number was 0.61–0.62, except for one test point during ECLIF3-1, where the Mach number was 0.65–0.68 during the reference test point. An increasing fuel flow (correlating with an increase in T30; see Fig. 6) is associated with a decrease in both nvPM and total particle emission index. This effect is less pronounced for the HEFA-SPK compared to Jet A-1. As a consequence, the impact of using SAF on nvPM number EI is reduced for higher fuel flows. The decreasing reduction in nvPM number emission index of the SAF fuel compared to Jet A-1 at higher cruise power settings is in accordance with the observations in flight and on the ground during the preceding ECLIF2/ND-MAX campaign (Moore et al., 2017; Voigt et al., 2021; Bräuer et al., 2021; Schripp et al., 2022). As shown in Fig. 6, the fuel flow correlates with T30; thus the decrease in particle number EI may be the result of the increase in T30 temperature at higher power settings.
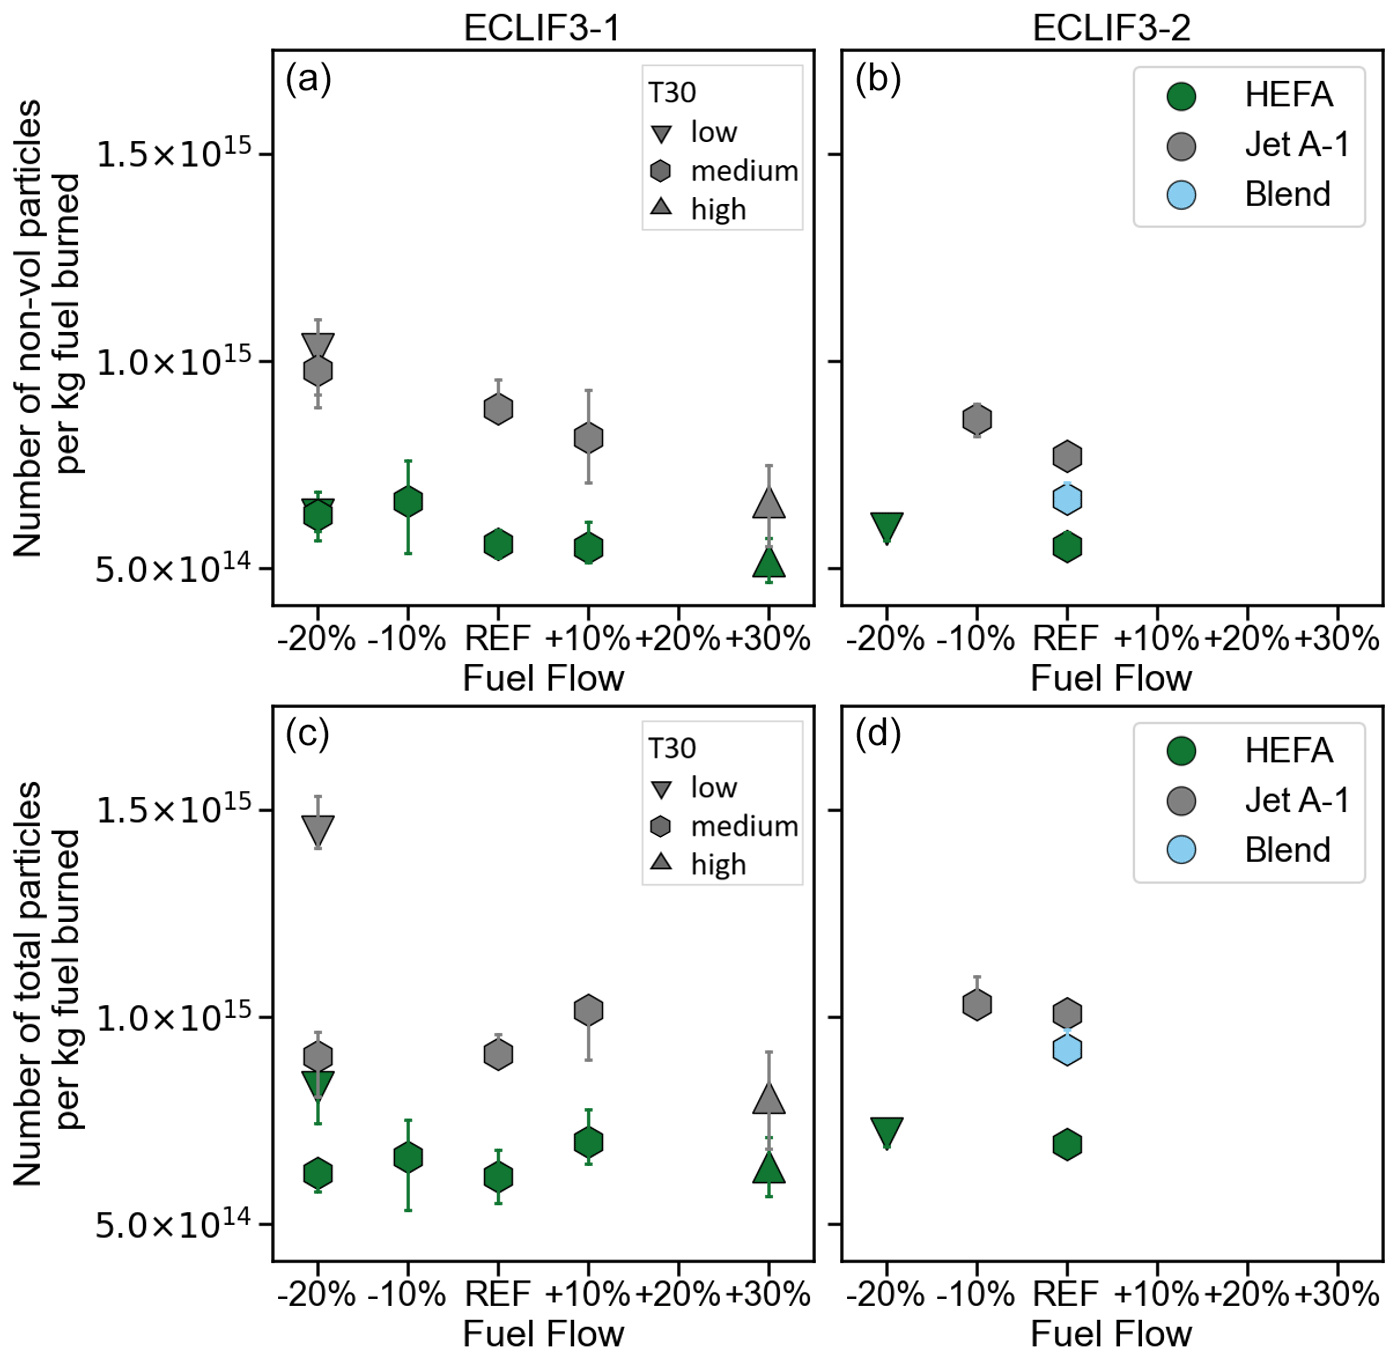
Figure 5Emission indices of non-volatile particle (a, b) and total particle number (c, d) with difference to reference fuel flow (%) for the different fuels and combustor inlet temperatures (T30) probed during ECLIF3-1 (a, c) and ECLIF3-2 (b, d). The nvPM emission index decreases with increasing fuel flow, with the largest decrease in emissions when using Jet A-1. The emission index of total particles shows a lower dependence on fuel flow. The figure shows median values and 25th–75th percentiles.
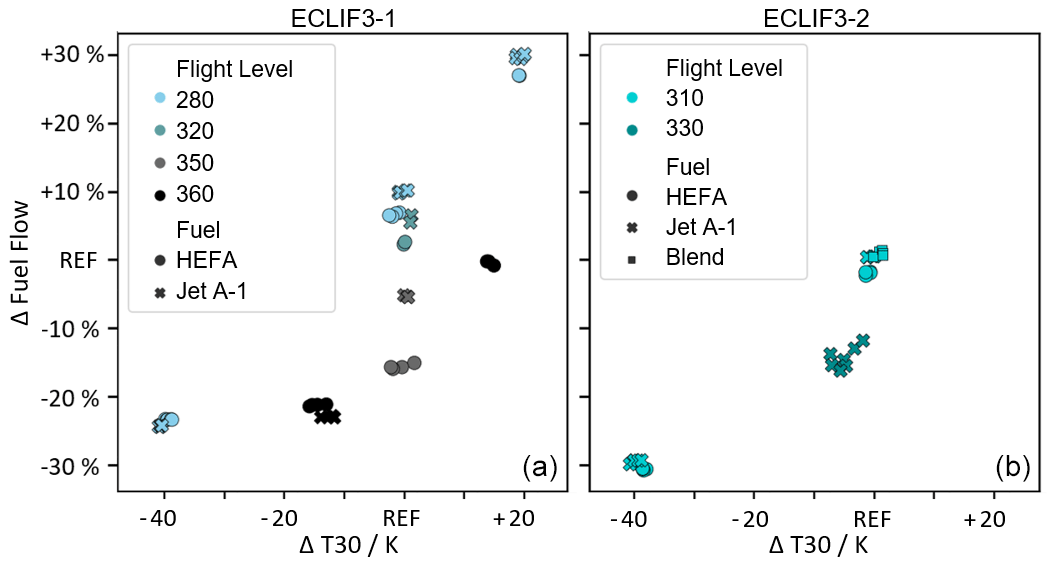
Figure 6Correlation between combustor inlet temperature T30 and fuel flow of the engine probed during ECLIF3-1 (a) and ECLIF3-2 (b). A strong, flight-altitude-dependent correlation between the combustor inlet temperature and fuel flow is observed.
However, at constant combustor inlet temperature, the air mass flow, the pressure, and also the associated fuel flow decrease with increasing flight altitude. The variability in fuel flow with flight altitude at constant T30 allows the investigation of the dependence of particle emissions with fuel flow at constant medium T30 (see hexagons in Fig. 5). It is observed that also at constant T30, the nvPM emissions decrease with increasing fuel flow. On the other hand, this effect cannot be observed for the total particle concentration. Note that the drop in total particle number EI at reference fuel flow during ECLIF3-1 results from the different Mach number and altitude affecting the comparison.
3.2 Exhaust particle size distribution
The measurement technique of the condensation particles counters is based on the growth of ultrafine particles by condensation in an environment supersaturated with butanol to a size at which they become measurable by optical methods. Due to this growth process, information about the initial size of the particle is lost. During ECLIF3, four CPCs were used, with a 50 % detection diameter D50 of the CPCs being about 5 nm for the measurement of total particles and 14 nm for nvPM. The lower cut-off can be increased by installing diffusion screen separators in the inlet lines (see Feldpausch et al., 2006). As a result, the pressure-dependent lower cut-off D50 at 300 hPa is raised to 34 nm (one diffusion screen) or 81 nm (three diffusion screens), where D50 increases with decreasing ambient pressure (see Appendix A, Fig. A2). As a result, nvPM measurements can be divided into three size bins, particles larger than ∼14 nm, particles larger than ∼32–38 nm, and particles larger than ∼77–93 nm, depending on the atmospheric pressure. The corresponding distribution of non-volatile particles measured in-flight at medium T30 during ECLIF3 is shown in Fig. 7.
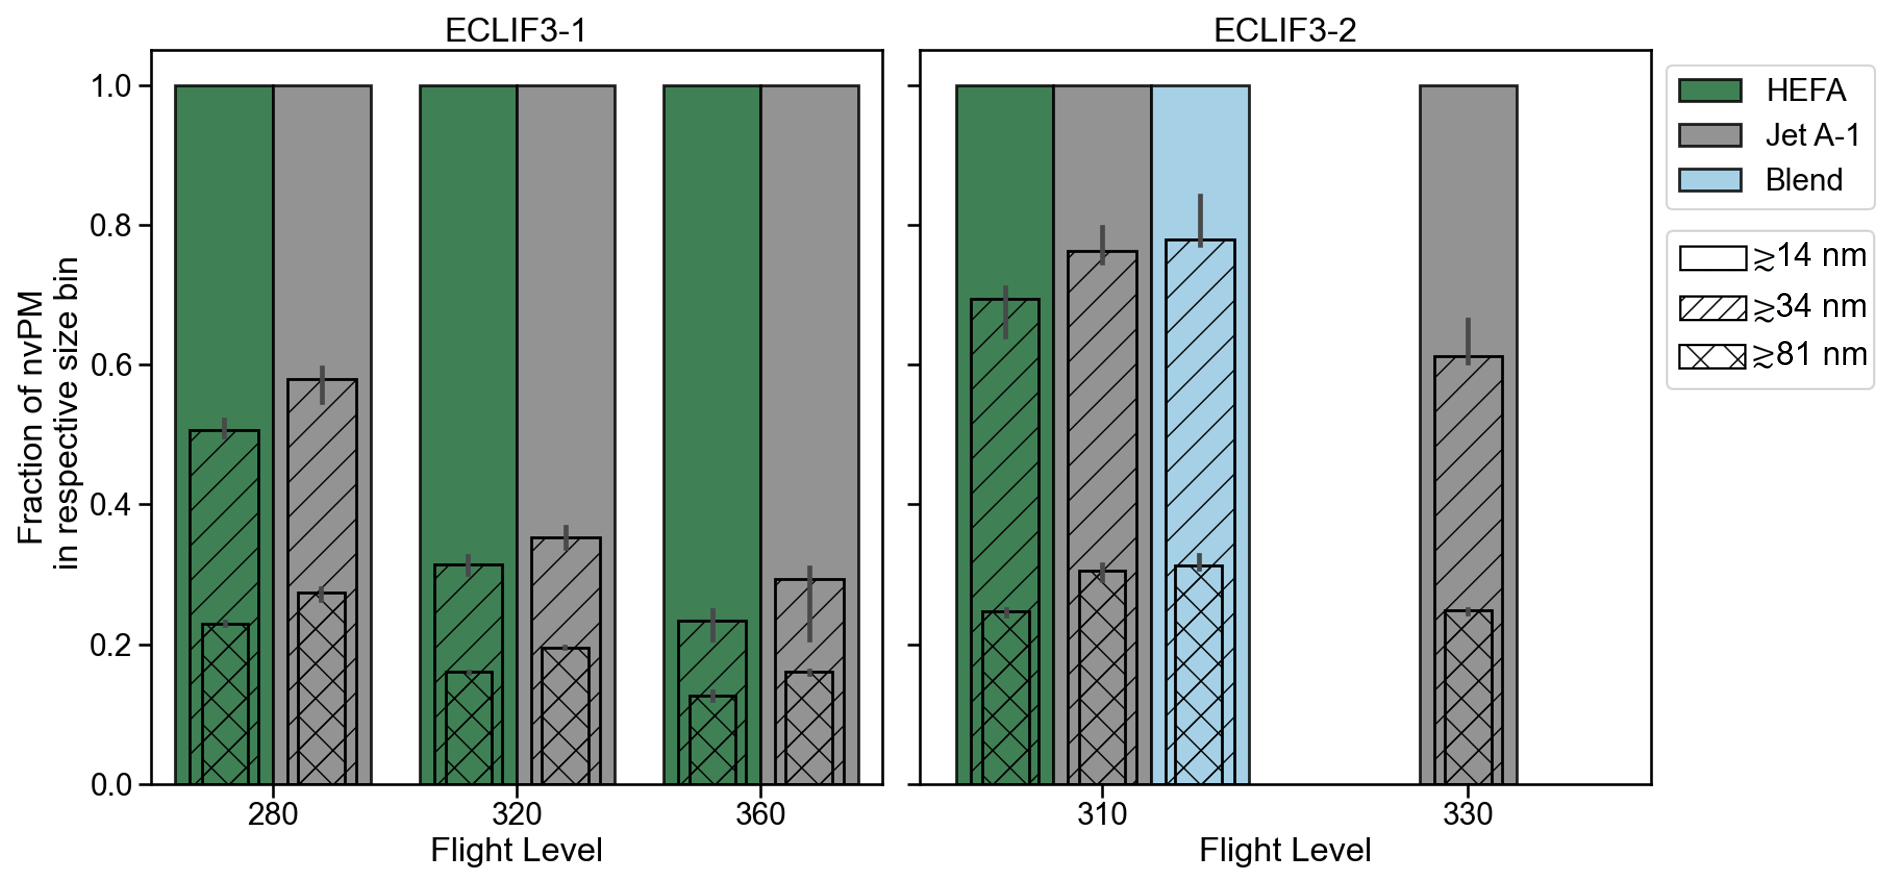
Figure 7Number of non-volatile particles in specific size bins relative to the sum of nvPM numbers, yielding the relative size distribution of non-volatile particles per flight level at medium T30. Non-hatched bars mark the sum of the measured nvPM with a lower cut-off D50 of 14 nm. Diagonally hatched bars mark the proportion of particles with a D50 of about 34 nm, the cross-hatched bars mark the proportion of particles with a D50 of about 81 nm. The cut-off is pressure-dependent and shifts to larger particle sizes with decreasing pressure. Nevertheless, a significant shift to smaller nvPM with increasing flight altitude is observed. Jet A-1 fuel and blended fuel show a comparable size distribution. The combustion of HEFA-SPK results in a larger proportion of smaller particles.
For 100 % HEFA, the number of particles in both larger size bins decreases; thus the size distribution is shifted towards smaller particles compared to Jet A-1. In contrast, Jet A-1 fuel and blended fuel show a comparable size distribution. Furthermore, the number of large particles decreases with increasing altitude. The cut-off shifts to larger particles with altitude, so fewer particles are detected by the counters with diffusion screens at higher flight levels. Assuming the size distribution of nvPM measured on the ground during accompanying ground tests, this effect leads to a 4 % decrease in the number concentration per 4000 ft when using one diffusion screen and to a decrease of up to 11 % when using three diffusion screens. During the flight measurements however, a decrease in the number concentration of up to 39 % in the medium size bin and of up to 29 % in the largest size bin is observed with an increase in flight altitude of 4000 ft. Hence, the size distribution of nvPM shifts to smaller particles with higher flight altitudes. The shift to larger particles at the lower altitudes could be explained by the increasing pressure at the combustor inlet (P30). Higher P30 at lower altitudes could support the formation of larger nvPM aggregates due to the acting pressure in the combustion chamber. A similar dependence of soot particle size with pressure has already been observed by, for example, Joo et al. (2018).
Also for ECLIF3-1, the highest number concentration of non-volatile particulate matter is measured in the smallest size range at ∼14 to 34 nm for all flight levels. Particles <14 nm cannot be detected with the CPC due to its lower size cut-off D50 of ∼14 nm. For ECLIF3-2 the size distribution is shifted to larger sizes. Engine-to-engine variability, e.g. the maintenance cycle, may contribute to this change.
Soot is formed when a lack of oxygen during combustion prevents the complete conversion of hydrocarbons into CO2 and H2O as is the case in rich-burn engines. Conventional aviation fuel is largely composed of aliphatic hydrocarbon chains and a smaller proportion of cyclic aromatic hydrocarbons. Polycyclic aromatic hydrocarbons (PAHs) are thought to be the molecular precursors of soot particles, since more energy is required to break the chemical bonds and oxidize the aromatic ring structures compared to the hydrocarbon chains (Mitchell and Frenklach, 2003). In aromatic-rich fuels, such as conventional Jet A-1, PAHs are present in relatively large concentrations. Fuel specifications allow aromatic concentrations of up to 25 %. It has been shown that especially fuels with a large amount of naphthalenes have strong sooting tendencies (Brem et al., 2015; Schripp et al., 2022; Harper et al., 2022). In contrast, in aliphatic fuels such as the HEFA-SPK probed during ECLIF3 (see Table 2, Fig. 8), the aromatic ring structures must be formed by fuel decomposition products through a sequence of elementary reactions (Richter and Howard, 2000). Consequently, the active ring formation reactants are available to a smaller extent in HEFA-SPK compared to the aromatic-rich reference fuel Jet A-1. This is reflected in the measurements (see Fig. 8e and f). The HEFA-SPK, which is low in aromatics and consequently also in naphthalene content, shows a significant reduction in soot particle number emission index.
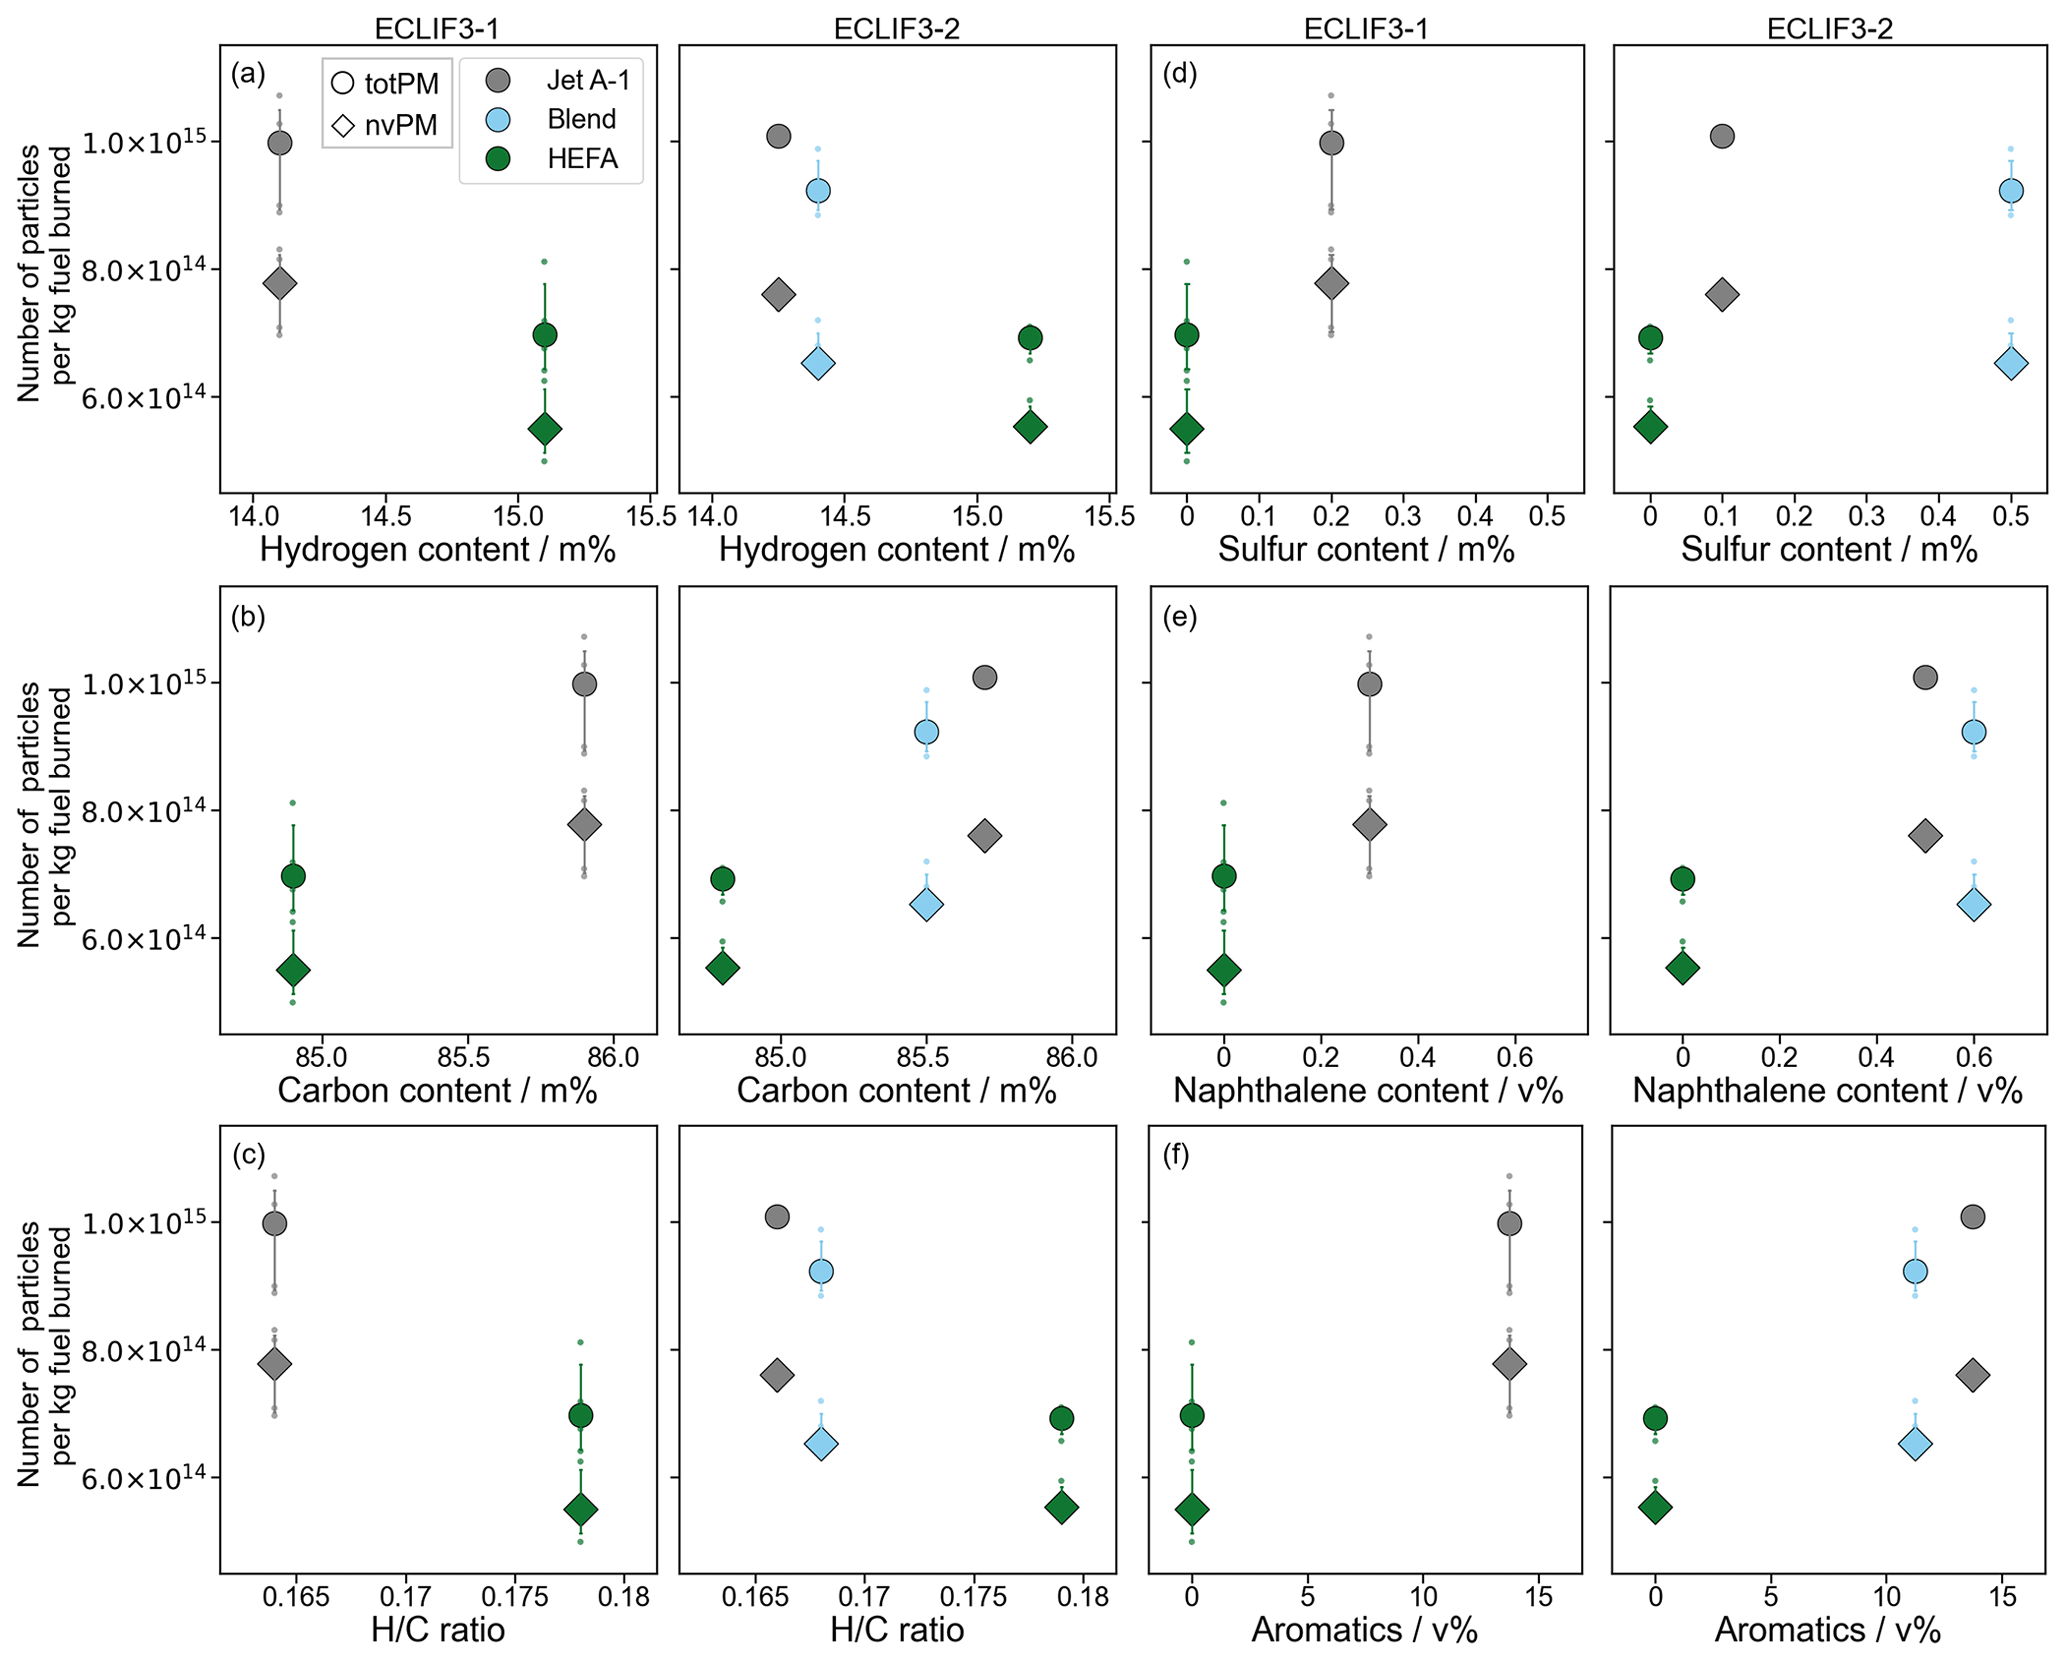
Figure 8Emission index of non-volatile particulate matter (diamonds) and total particles (circles) with different fuel properties. The figure shows median values and 25th–75th percentiles. In order to improve comparability and enhance the quality of the dataset, only measurement points at FL280 (ECLIF3-1) and FL310 (ECLIF3-2) at medium combustor inlet temperatures are shown. Emissions increase with increasing carbon content and decreasing hydrogen content. The aromatic content contributes to the formation of nvPM. The blended fuel had the highest sulfur and naphthalene content.
The hydrogen-to-carbon ratio ( ratio) of the fuel provides a good indication of how the hydrocarbons are distributed in the fuel. Aromatic molecules have a lower ratio than aliphatic hydrocarbon chains. Therefore, fuels with a larger ratio, or an increased hydrogen content, are associated with lower soot number concentrations (Naegeli et al., 1983; Cain et al., 2013; Schripp et al., 2018). Higher soot emissions with lower ratios are also observed during ECLIF3 measurements (see Fig. 8c). Both reference Jet A-1 fuels have a similar hydrogen content with comparable nvPM emissions (see Fig. 8a). HEFA-SPK has a higher ratio due to the absence of aromatic ring structures, which results in a higher hydrogen content and reduced soot emissions. The blended fuel is characterized by a lower aromatic content and a higher hydrogen content than the reference Jet A-1, also leading to a reduction in nvPM emissions.
Compared to the world average Jet A-1, the Jet A-1 fuels sampled during ECLIF3 have a relatively high hydrogen content of about 14.1 %–14.3 % by mass, while the sampled HEFA-SPK have a comparatively low hydrogen content of about 15.1 %–15.2 % compared to the mean of previously measured fuels of the SimFuel platform (see Table 2, Fig. 2). Therefore, we expect to measure a smaller reduction in soot number emission index between the fuels than if we would have used Jet A-1 with world average hydrogen content. Also, the HEFA-SPK has a lower hydrogen content than the mean of previously measured fuels of the SimFuel platform, suggesting that a replacement of market average Jet A-1 by market average HEFA-SPK could lead to a larger reduction in soot emission than presented in this study. Further, both HEFA-SPKs have a high content of iso-paraffins in relation to n-paraffins, which might have promoted soot formation.
Volatile particles in the aircraft exhaust plume are composed of a complex mixture of sulfur and organic components from the fuel or lubrication oil (Takegawa et al., 2023). The sulfur contained in the fuel is oxidized to SO2 during combustion. Subsequently, the S(IV) is partially converted to S(VI) (mainly SO3), which reacts with water vapour in the cooling exhaust forming H2SO4 (Jurkat et al., 2011). Part of the gaseous sulfuric acid can be chemisorbed by the surface of available combustion aerosols, e.g. nvPM, or it may condense on these particles during cooling of the exhaust gas. In addition, homogeneous and ion-induced heterogeneous nucleation of H2SO4 contributes to the formation of volatile aerosols, which can subsequently grow by condensation of H2SO4 and water vapour (Kärcher et al., 1995; Miake-Lye et al., 1998; Schumann et al., 2002; Sorokin, 2004; Petzold et al., 2005). The influence of the sulfur content on the number EI of volatile particles is demonstrated with the example of the ECLIF3-2 measurements in Fig. 8d. The fraction of soot particles larger than 14 nm to the total particle concentration is largest for the quasi-sulfur-free HEFA-SPK with 80 %, followed by Jet A-1 with a fraction of 76 % and the blended fuel with 72 % and the highest sulfur content. This shows that the highest sulfur content is linked with the highest fraction of volatile particles. Here, the percentage of nvPM larger than 14 nm is 72 %. In Fig. 4, a comparatively low reduction in total particles when using the blended fuel compared to Jet A-1 is striking, which could be attributed to the higher sulfur content of this fuel.
For better comparability, only measurement data at the same flight level and engine power setting were considered in Fig. 8 However, the observed dependencies remain when adding different engine conditions and flight levels from other test points of the campaign.
4.1 Comparison of model results with measurements
Figure 9 shows non-volatile particle EI (EInvPM) observed during ECLIF3 near-field measurements and their corresponding values as predicted by the T4/T2 model and MEEM for the different fuels used during the campaign. All valid data points measured on FL280–FL360 at different fuel flows and T30 were used, comparable with the data from Fig. 5. As explained in Sect. 2.3.2, MEEM estimates the P30 and T30 based on the flight conditions (altitude, Mn) and default compressor efficiency and pressure coefficient values. For cruise in particular, these default values were derived from the analysis of actual cruise conditions, therefore with both engines running at the same power setting. Hence, MEEM implicitly assumes that both engines are running at a similar power setting. Therefore, test points for which the difference of T30 between the two engines was greater than 50 K were discarded from the MEEM model comparison.
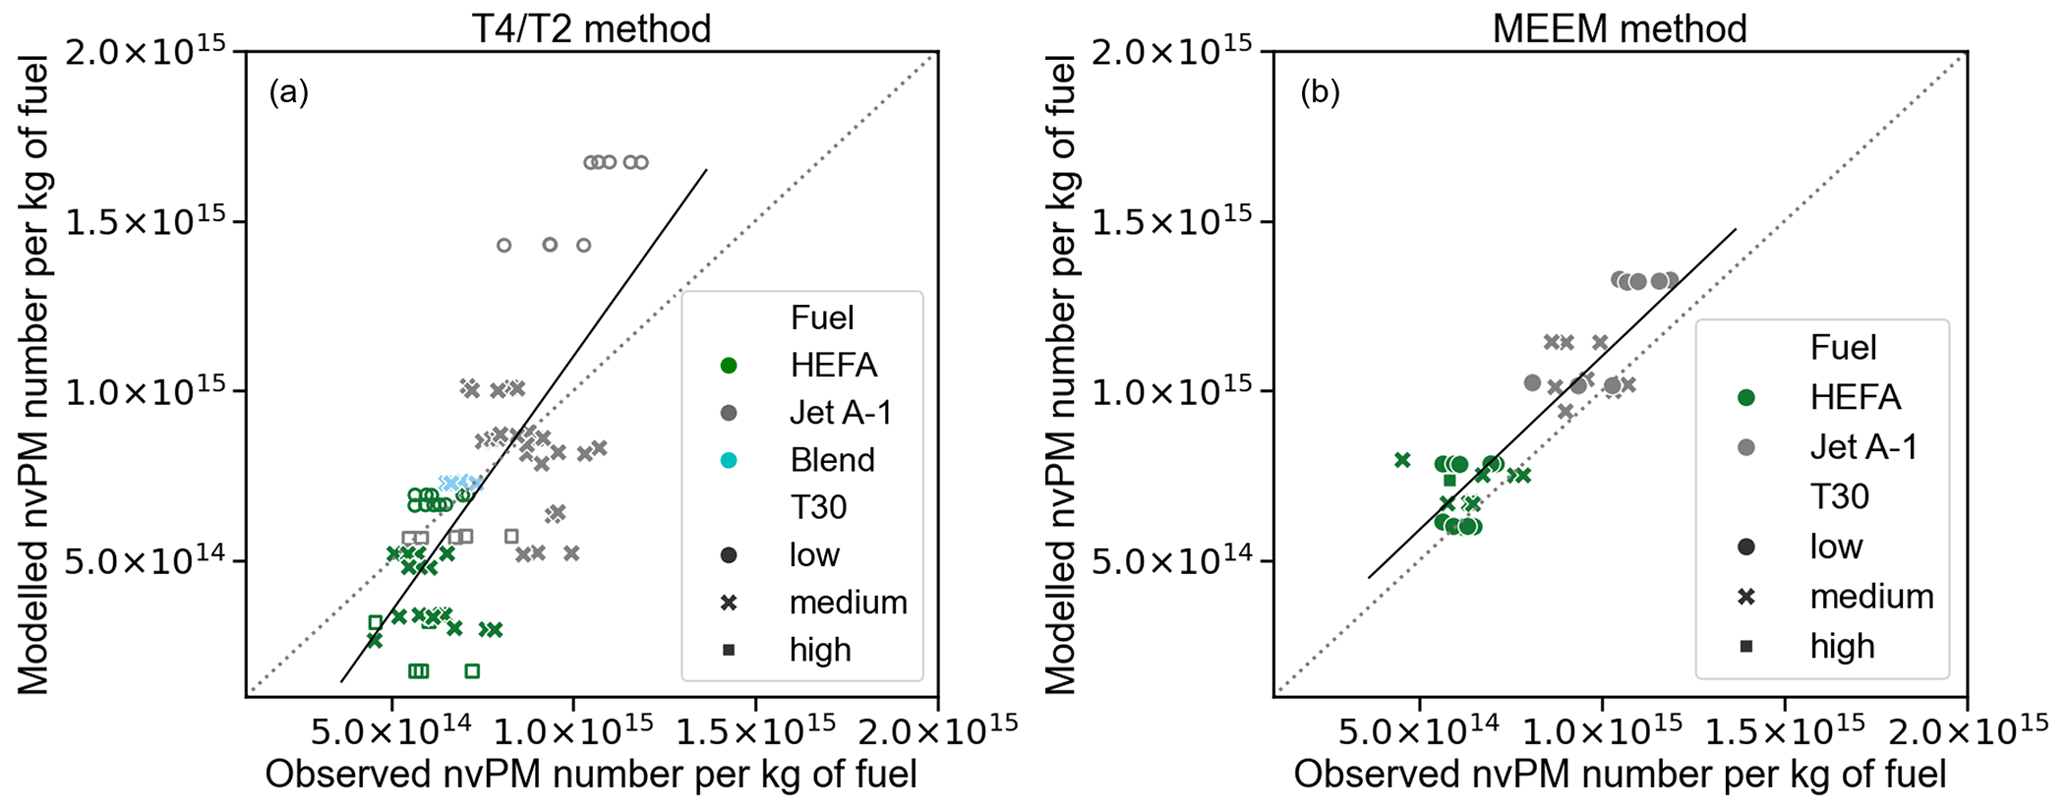
Figure 9Comparison of measured non-volatile particle emission indices to modelled results from the T4/T2 model (a) and the MEEM model (b). Data are classified according to the fuel used and the combustor inlet temperature (T30). The fuel impact is clearly visible for both T4/T2 and MEEM model results. For the MEEM model, some data points have been discarded as they correspond to engine states outside the applicability of the model assumptions (see text). The dashed line represents the ideal 1:1 relationship between observations and the model. The solid black line represents the linear relationship of the data.
The T4/T2 method provides a publicly available method for the determination of particulate emissions, using fuel mass flow rates as primary input. The objective of the model is therefore the prediction of soot emissions at medium engine power settings typically encountered in cruise flight. These conditions are marked in Fig. 9a with filled symbols. Other engine power settings can also be modelled (blank symbols), but the prediction skill of the T4/T2 model is clearly strongest for average cruise flight conditions.
The nvPM number emission data generally show a significant correlation between observation and model results. The span of the T4/T2 model results is larger than the range of observed values for low T30 and high T30, while the emissions are well reproduced for medium T30. Model and observation results for nvPM numbers show a quadratic Pearson correlation coefficient r2 of 52 %. Application of a linear regression shows a slope of 1.50±0.17 and a y-axis intercept of for the T4/T2 model. The MEEM model accurately reproduces the variability of nvPM emissions caused by different engine settings, altitudes, and fuels. Here, a correlation r2 of 79 % is found. The linear regression shows a slope of 1.02 ± 0.09 and a y-axis intercept of .
Finally, we look for systematic relationships between modelled and observed EI values for the different fuels. Here, we evaluate the same data points as in the analysis of the fuel impact during the measurements in Table 3. We find that for both model and observation results, the EI values for the number of soot particles vary systematically with fuel hydrogen content. The T4/T2 model finds a reduction of 44 % for high T30, 47 % for medium, and 56 % for low T30. Hence, the observed trend of a decreasing reduction in nvPM emissions between the fuels with increasing T30 is reflected by the T4/T2 model. Emissions when using the blended fuel are underestimated by the T4/T2 model, showing a 22 % reduction compared to Jet A-1.
The MEEM model finds a reduction of about 41 % when HEFA-SPK is used instead of Jet A-1 for low T30 and thus reflects the measured reduction well. For medium T30, the MEEM model predicts a reduction of 32 % where the measured reduction is 33 %. Note, however, that only test points at FL350 and FL360 have been used here; FL280 and FL310 test points were discarded as the engine conditions were outside the specifications where the MEEM model is applicable. For the T4/T2 model, no such limitation is known; therefore all data points are retained in this comparison.
In-flight measurements of the combustion of 100 % HEFA-SPK sustainable aviation fuel, a 38 % HEFA-SPK blend, and a fossil Jet A-1 were performed in the course of the ECLIF3 campaign in 2021. At pressure altitudes between 8500 and 11 000 m, the DLR Falcon research aircraft measured trace gas and aerosol emissions approximately 100–200 m behind the emitting aircraft, an Airbus A350-941 equipped with latest-generation Rolls-Royce Trent XWB-84 engines. During a total of six flights, data of the emissions of non-volatile particles larger than 14 nm as well as total particles with a size larger than 5 nm were recorded in situ by four cabin-mounted condensation particle counters.
The power setting, here controlled via the combustor inlet temperature, has a significant influence on particle emissions. At low cruise power settings, the use of 100 % HEFA-SPK compared to fossil Jet A-1 resulted in a reduction of both non-volatile particles and total particles of up to 42 %. At medium power settings typical of cruise conditions, the use of 100 % HEFA-SPK reduced nvPM emissions by 29 %. At the same engine power setting, the use of a mixed fuel with 38 % HEFA-SPK led to a reduction in nvPM of 14 %. At high cruise power settings, particle emissions decreased approximately 20 % using 100 % HEFA-SPK compared to Jet A-1. Furthermore, a shift in the size distribution of nvPM to smaller particles for HEFA-SPK with respect to Jet A-1 and for measurements with increasing pressure altitude was observed.
The reference Jet A-1 had an increased hydrogen content (14.08 %–14.25 % by mass) compared to the global mean (13.9 % by mass). In contrast, the HEFA-SPK used for this study had a lower hydrogen content (15.11 %–15.18 % by mass) than other HEFA-SPK components available on the market. A high hydrogen content, or a high ratio, is associated with lower fuel sooting tendencies. For the combustion of fuels with fleet average hydrogen content, the benefit for particle emissions from using 100 % HEFA-SPK might therefore be higher. Previous flight experiments have already observed a reduction in the non-volatile particle number concentration of up to 50 % with blends of Jet A-1 and HEFA-SPK (Moore et al., 2017; Voigt et al., 2021; Bräuer et al., 2021). It is important to keep in mind that combustor design, as well as engine cycle parameters, influences aircraft emissions and were different for the aforementioned projects. However, these results highlight the importance of the fuel composition when addressing aviation soot emissions. Cleaner fuels in terms of hydrogen and aromatic content compared to the global average can lead to a significant reduction in particle emissions and may therefore have a positive influence on the climate impact from contrails (Märkl et al., 2024).
We show that both the T4/T2 model and the MEEM model generally correlate well with our nvPM measurements. The MEEM model accurately reproduces soot emission encountered during the flight experiments. The T4/T2 model correctly reproduces nvPM emissions at medium power settings most relevant for cruise flight, while some deviations are apparent for high and low power settings.
For the future, in-flight measurements of contrails and particles from lean-burn engines will be interesting, where combustion in the soot-poor regime is expected. Models show that in the soot-poor regime, as is the case with lean burn engines, increased activation of volatile particles may occur (Kärcher, 2018). In this context, the influence of lubrication oil emissions on aerosol particles could also be of interest. Further, different fossil-based hydrotreated or hydrocracked fuels with reduced aromatics and sulfur content, as well as a higher hydrogen content, or SAFs with a high ratio could be viable pathways of soot emission reduction. In the future, modern jet engines and targeted use of sustainable aviation fuels, together with other technologies such as flight route optimization, can lower the climate forcing from contrails and are therefore an important factor in mitigating the climate impact of aviation.
For the use of classical condensation particle counters in low-pressure environments during in-flight measurements, a number of processes affecting the counting efficiency as well as particle losses in the inlet lines have to be considered and characterized. The counting efficiency of butanol-based CPCs has been found to degrade at lower inlet pressures in the past (Noone and Hansson, 1990; Hermann and Wiedensohler, 2001). Therefore, the counting efficiency of the instruments is characterized in the laboratory under low-pressure conditions between 200–900 hPa and for different particle sizes using Ag aerosol from a tube furnace that is size-selected with a differential mobility analyser (DMA; model 55-40-26-S-DMA, Grimm Aerosol Ainring, Germany). As the reference instrument within the low-pressure manifold, a Faraday cup electrometer (model 5.705, GRIMM Aerosol Technik, Ainring, Germany) is used. From calibration runs at 35 nm particles, a parameterized pressure-dependent function of the form
is determined, to fit the counting efficiency for each CPC. This function is evaluated at each measurement point using the measured inlet pressure to correct the raw concentration readings of the airborne measurements. Here, p designates the current sample manifold pressure, and p0 is the reference (laboratory) pressure at which the reference counting efficiency for ambient conditions c0 at ground level is determined. The parameters m, α, and b are fitted using a Markov chain–Monte Carlo procedure (Foreman-Mackey et al., 2013), also resulting in uncertainty estimates for each parameter. Diffusion losses and the intrinsic counting efficiency in the relevant size range are size-dependent; however, we do not obtain detailed size information in our airborne measurements. Therefore, a size-independent correction is used. The particle diameter of 35 nm was chosen to approximately match the mode diameter of the particle size distribution measured in flight described in Moore et al. (2017). The measured particle number concentrations are corrected for multiply charged particles from the DMA following the procedure described in ISO 27891:2015(E) (ISO, 2015). The calibrations in the laboratory were performed with inlet lines comparable to the inlet lines in the aircraft to also capture inlet line losses (mainly diffusion losses) at the respective pressure levels. Diffusion screens were removed for laboratory measurements to separate the pressure effect on the particle counters from the pressure-dependent transmission functions of the diffusion screen. The median counting efficiency curves of all counters, from which the correction functions for low pressure and inlet line losses can be derived, are shown in Fig. A1. The overall uncertainty of the correction function arises from the uncertainty of the fit parameters and the pressure control during the laboratory measurement and amounts to about 9 % at 300 hPa
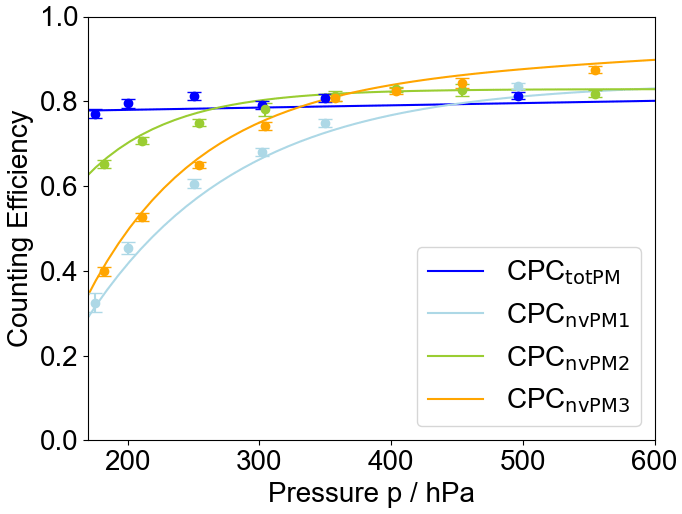
Figure A1Counting efficiency at low pressure derived from laboratory measurements (marker). The CPC used for total particle measurements is shown in blue and the CPC measuring total nvPM in light blue. CPCs used with diffusion screen separators during the flight measurements are depicted in green (one diffusion screen) and yellow (three diffusion screens). Diffusion screens were removed for laboratory measurements. Calibrations have been captured with rack inlet lines to also account for inlet line losses.
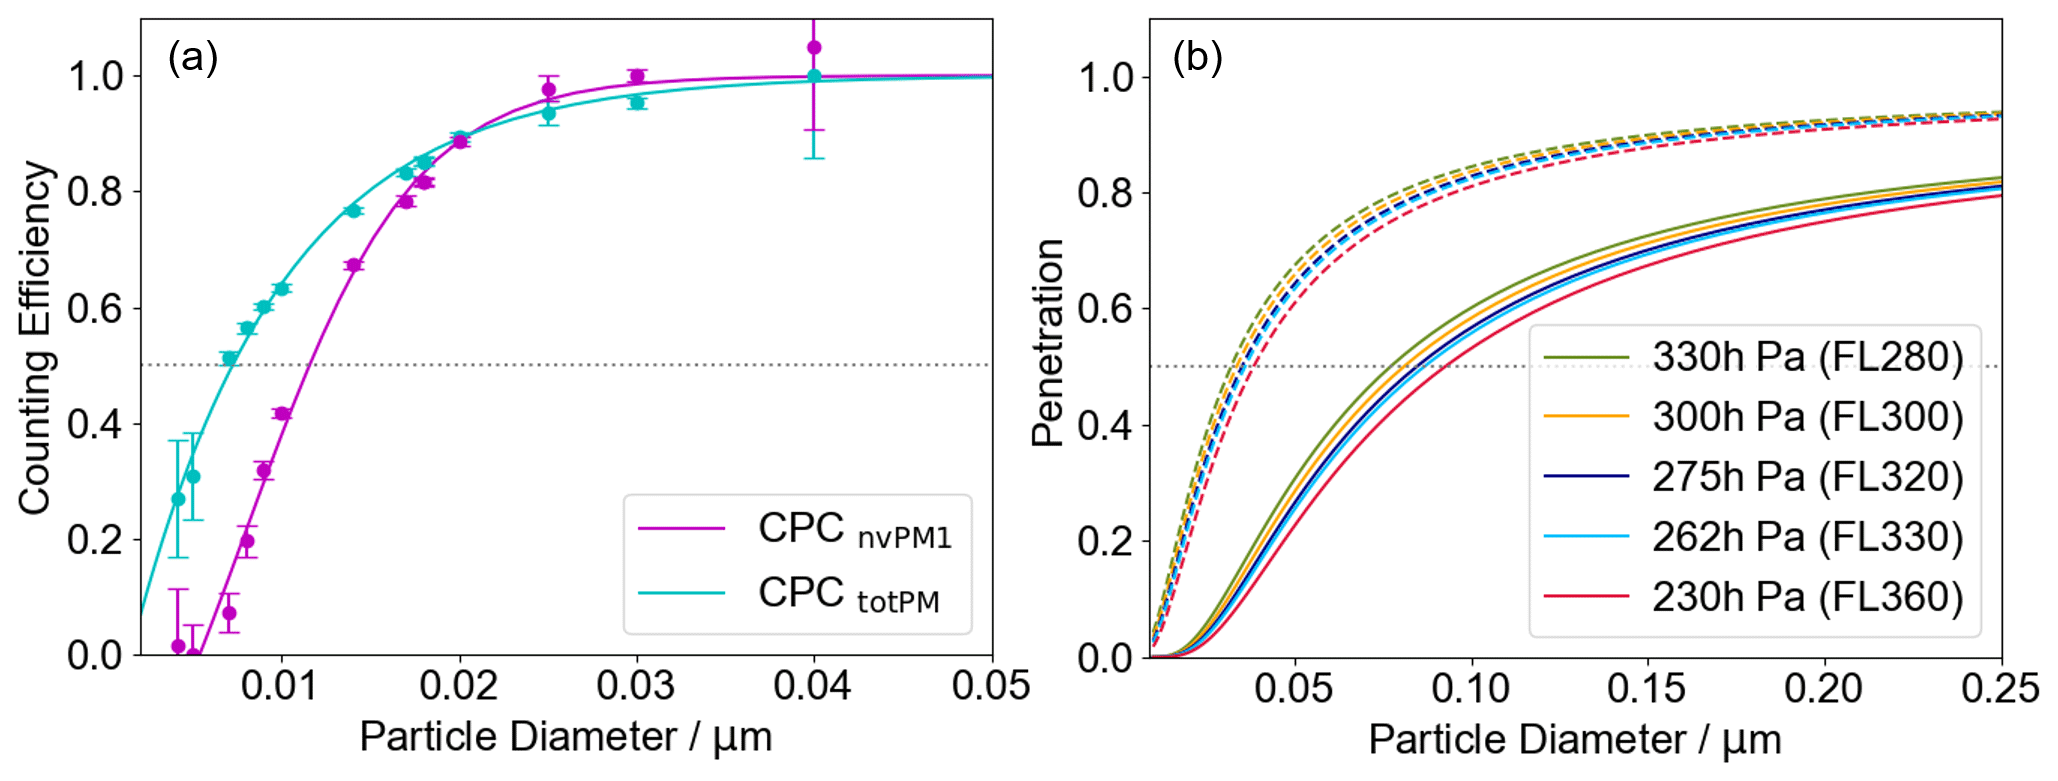
Figure A2Panel (a) shows the counting efficiency derived from laboratory measurements (marker) at 300 hPa of the CPC measuring nvPM and total particles. The penetration with particle size at different pressures using CPC nvPM2 (dashed line) with one or CPC nvPM3 (solid line) with three diffusion screen separators (b) was derived according to Feldpausch et al. (2006). Cut-off diameters D50 are reached at 50 % counting efficiency (dotted grey).
Furthermore, the lower cut-off or 50 % detection diameter D50 at 300 hPa was determined for all CPCs. For this calibration run, the DMA was set to select a range of particle sizes from 4.1 to 30 nm. The resulting data were parameterized using a function following Mertes et al. (1995). The derived cut-off functions are shown in Fig. A2. Measurements indicate a lower cut-off of 7 nm for the total particles (CPC totPM) and 11.6 nm for the non-volatile particle counter (CPC nvPM1).
The cut-off diameter can be shifted to larger particle sizes by connecting the CPC to a diffusion screen separator (see Feldpausch et al., 2006). During ECLIF3, two CPCs measuring nvPM were equipped with one (CPC nvPM2) or three (CPC nvPM3) diffusion screens in the inlet lines in order to obtain a rough size distribution. The penetration denotes the fraction of particles of a given size which penetrate through the diffusion screen separators. The cut-off obtained by this method is pressure-dependent and is well characterized by a function following Feldpausch et al. (2006). The corresponding curves are shown in Fig. A2. For altitudes between 28 000 and 36 000 ft (corresponding to 330 and 230 hPa), the cut-off is between 32–38 nm when using one diffusion screen (CPC nvPM2) and 77–93 nm when using three diffusion screens (CPC nvPM3).
The thermal denuder vaporizes volatile parts of the aerosol by heating the sample air to 250 °C. By heating the sample flow to a predetermined temperature, volatile components like organic carbon compounds and sulfuric acid are evaporated, leaving non-volatile, solid particles such as soot in the sample flow. These non-volatile particles are influenced by thermophoresis effects. The temperature gradient before and after the heating section inside the thermal denuder impacts the particles' mobility in the sample flow, leading to partial removal of non-volatile particles from the sample. Particle losses through thermophoresis effects were evaluated in the laboratory by comparing measurements of an Ag test aerosol with cold and hot thermal denuder. At 35 nm particle diameter, the losses due to the thermal denuder amount to 17 % and are corrected for by applying a size-independent correction factor to the measured data.
At high aerosol number concentrations, as can be encountered in near-field measurements, the probability of coincidence effects increases. In that case, two particles coincide in the viewing volume of the laser of the CPC. The counting electronics will not recognize them as two particles but rather as one. The coincidence effect has been characterized experimentally and the data have been corrected following the procedure described in Collins et al. (2013). The experiments showed that the procedure shows reliable results for correction factors up to about 1.2. Data with a higher coincidence factor were removed from the dataset. Based on the calibration studies, the uncertainty of the coincidence correction factor is 10 %.
During the in-flight measurements, the aerosol detectors obtained their sample air through an isokinetic inlet on the centre line of the upper fuselage. A detailed characterization of the Falcon inlet system has recently been published by Schöberl et al. (2023). Depending on the airspeed, depletion or enrichment of aerosol particles can be caused by the inlet system. Errors due to inlet effects for aerosol in the submicrometer range are small and amount to 2 % for near-field measurement in the absence of ice particles. For measurements with contrail ice particles, i.e. far-field measurements, the inlet effect cannot be neglected because the contrail ice particles are in a size range which will be ingested up to an upper cut-off diameter. Even though the ice crystals will sublimate once they enter the warm inlet lines inside the fuselage, the ice residuals will be detected by the particle instruments. The upper cut-off diameter of the sampling system for true airspeeds exceeding 190 m s−1 is approximately 6 µm, requiring a correction of the particle measurement data according to the ambient ice particle size distribution.
Possible deviations in the sample flow in flight lead to an additional measurement uncertainty of 1 %. The total uncertainty of the particle measurements Δnx depends on the applied coincidence correction and pressure and amounts to 7 %–13 % for an air pressure of 250–350 hPa, where the uncertainty increases with decreasing pressure.
The error in the particle emission index (Eq. 1),
additionally includes the standard deviation of the aerosol background Δbgn of about 5 %–10 % of the background concentration, the standard deviation of the CO2 background of about 0.1–0.2 ppmv, the uncertainty of the CO2 measurement of 0.2 ppmv, and the error in the hydrogen-to-carbon ratio Δα of 0.1 %. Due to the strongly pronounced enhancements in trace gas and aerosol species during the plume encounter during near-field measurements (see Fig. 3), the error results mainly from the uncertainty in the aerosol measurement, leading to a ΔEI of about 10 %. However, background uncertainties can become a prominent factor in determining the EI from far-field measurements, where the plume encounters are not as distinct from the background as during near-field measurements.
The data are collected in the HALO database at https://doi.org/10.17616/R39Q0T (Sauer and Dischl , 2024).
CR and MG coordinated the ECLIF3 project. CR, CV, and PM defined the test plan. AD, CR, CV, and SK planned and coordinated the flight experiment. AR, DS, FS, MS, RD, RM, SK, and TH performed the in-flight measurements. RD performed the aerosol and test data evaluation and wrote the paper. CV conceptualized the study. US performed the model calculations. CR and MG assisted in aircraft data analysis and in the overall test data analysis. DA, DL, MJ, PM, and PS assisted emission, engine and model data interpretation. RS provided the fuels and CR, GE, MG, PLC, RS, TS, and UB performed fuel analyses. All authors contributed to the paper.
Darren Luff, Mark Johnson, Paul Madden, and Peter Swann are employed by Rolls-Royce plc.; Denise Ahrens is employed by Rolls-Royce Deutschland; and Reetu Sallinen is employed by Neste Corporation. All other authors declare that they have no conflict of interest.
Publisher's note: Copernicus Publications remains neutral with regard to jurisdictional claims made in the text, published maps, institutional affiliations, or any other geographical representation in this paper. While Copernicus Publications makes every effort to include appropriate place names, the final responsibility lies with the authors.
We thank Roger Teoh and Marc Stettler (Imperial College London) for useful discussions on the analysis of T4/T2 model data.
This research has been supported by the Deutsche Forschungsgemeinschaft (grant no. SPP 1294 HALO, contract nos. VO 1504/7-1 and VO 1504/9-1).
The article processing charges for this open-access publication were covered by the German Aerospace Center (DLR).
This paper was edited by Radovan Krejci and reviewed by two anonymous referees.
Abrahamson, J. P., Zelina, J., Andac, M. G., and Vander Wal, R. L.: Predictive Model Development for Aviation Black Carbon Mass Emissions from Alternative and Conventional Fuels at Ground and Cruise, Environ. Sci. Technol., 50, 12048–12055, https://doi.org/10.1021/acs.est.6b03749, 2016. a
Agarwal, A., Speth, R. L., Fritz, T. M., Jacob, S. D., Rindlisbacher, T., Iovinelli, R., Owen, B., Miake-Lye, R. C., Sabnis, J. S., and Barrett, S. R. H.: SCOPE11 Method for Estimating Aircraft Black Carbon Mass and Particle Number Emissions, Environ. Sci. Technol., 53, 1364–1373, https://doi.org/10.1021/acs.est.8b04060, 2019. a
Ahrens, D., Méry, Y., Guénard, A., and Miake-Lye, R. C.: A New Approach to Estimate Particulate Matter Emissions From Ground Certification Data: The nvPM Mission Emissions Estimation Methodology, J. Eng. Gas Turb. Power, 145, 031019, https://doi.org/10.1115/1.4055477, 2022. a, b
Beyersdorf, A. J., Timko, M. T., Ziemba, L. D., Bulzan, D., Corporan, E., Herndon, S. C., Howard, R., Miake-Lye, R., Thornhill, K. L., Winstead, E., Wey, C., Yu, Z., and Anderson, B. E.: Reductions in aircraft particulate emissions due to the use of Fischer–Tropsch fuels, Atmos. Chem. Phys., 14, 11–23, https://doi.org/10.5194/acp-14-11-2014, 2104. a
Bier, A. and Burkhardt, U.: Impact of Parametrizing Microphysical Processes in the Jet and Vortex Phase on Contrail Cirrus Properties and Radiative Forcing, J. Geophys. Res.-Atmos., 127, e2022JD036677, https://doi.org/10.1029/2022JD036677, 2022. a
Bier, A., Burkhardt, U., and Bock, L.: Synoptic Control of Contrail Cirrus Life Cycles and Their Modification Due to Reduced Soot Number Emissions, J. Geophys. Res.-Atmos., 122, 11584–11603, https://doi.org/10.1002/2017JD027011, 2017. a
Bräuer, T., Voigt, C., Sauer, D., Kaufmann, S., Hahn, V., Scheibe, M., Schlager, H., Huber, F., Le Clercq, P., Moore, R. H., and Anderson, B. E.: Reduced ice number concentrations in contrails from low-aromatic biofuel blends, Atmos. Chem. Phys., 21, 16817–16826, https://doi.org/10.5194/acp-21-16817-2021, 2021. a, b, c
Brem, B. T., Durdina, L., Siegerist, F., Beyerle, P., Bruderer, K., Rindlisbacher, T., Rocci-Denis, S., Andac, M. G., Zelina, J., Penanhoat, O., and Wang, J.: Effects of Fuel Aromatic Content on Nonvolatile Particulate Emissions of an In-Production Aircraft Gas Turbine, Environ. Sci. Technol., 49, 13149–13157, https://doi.org/10.1021/acs.est.5b04167, 2015. a
Burkhardt, U., Bock, L., and Bier, A.: Mitigating the contrail cirrus climate impact by reducing aircraft soot number emissions, npj Clim. Atmos. Sci., 1, 37, https://doi.org/10.1038/s41612-018-0046-4, 2018. a, b
Cain, J., DeWitt, M. J., Blunck, D., Corporan, E., Striebich, R., Anneken, D., Klingshirn, C., Roquemore, W. M., and Vander Wal, R.: Characterization of Gaseous and Particulate Emissions From a Turboshaft Engine Burning Conventional, Alternative, and Surrogate Fuels, Energ. Fuels, 27, 2290–2302, https://doi.org/10.1021/ef400009c, 2013. a
Chauvigné, A., Jourdan, O., Schwarzenboeck, A., Gourbeyre, C., Gayet, J. F., Voigt, C., Schlager, H., Kaufmann, S., Borrmann, S., Molleker, S., Minikin, A., Jurkat, T., and Schumann, U.: Statistical analysis of contrail to cirrus evolution during the Contrail and Cirrus Experiment (CONCERT), Atmos. Chem. Phys., 18, 9803–9822, https://doi.org/10.5194/acp-18-9803-2018, 2018. a
Collins, A. M., Dick, W. D., and Romay, F. J.: A New Coincidence Correction Method for Condensation Particle Counters, Aerosol Sci. Tech., 47, 177–182, https://doi.org/10.1080/02786826.2012.737049, 2013. a
Döpelheuer, A.: Anwendungsorientierte Verfahren Zur Bestimmung Von CO, HC Und Ruß Aus Luftfahrttriebwerken, PhD thesis, German Aerospace Center (DLR), Institute of Propulsion Technology, Cologne, Germany, https://elib.dlr.de/49148/ (last access: 8 October 2024), 2002. a
Feldpausch, P., Fiebig, M., Fritzsche, L., and Petzold, A.: Measurement of ultrafine aerosol size distributions by a combination of diffusion screen separators and condensation particle counters, J. Aerosol Sci., 37, 577–597, https://doi.org/10.1016/j.jaerosci.2005.04.009, 2006. a, b, c, d, e, f
Foreman-Mackey, D., Hogg, D. W., Lang, D., and Goodman, J.: emcee: The MCMC Hammer, in: Publications of the Astronomical Society of the Pacific, University of Chicago Press, https://doi.org/10.1086/670067, 2013. a
Hadaller, O. and Johnson, J.: World Fuel Sampling Program, CRC Report No. 647, Tech. rep., Coordinating Research Council, Alpharetta, GA, https://crcao.org/product/world-fuel-sampling-program-crc-report-647/ (last access: 8 October 2024), 2006. a
Harlass, T., Dischl, R., Kaufmann, S., Märkl, R., Sauer, D., Scheibe, M., Stock, P., Bräuer, T., Dörnbrack, A., Roiger, A., Schlager, H., Schumann, U., Schripp, T., Grein, T., Bondorf, L., Renard, C., Gauthier, M., Johnson, M., Luff, D., Madden, P., Swann, P., Ahrens, D., Sallinen, R., and Voigt, C.: Measurement report: In-flight and ground-based measurements of nitrogen oxide emissions from latest generation jet engines and 100 % sustainable aviation fuel, EGUsphere [preprint], https://doi.org/10.5194/egusphere-2024-454, 2024. a, b
Harper, J., Durand, E., Bowen, P., Pugh, D., Johnson, M., and Crayford, A.: Influence of alternative fuel properties and combustor operating conditions on the nvPM and gaseous emissions produced by a small-scale RQL combustor, Fuel, 315, 123045, https://doi.org/10.1016/j.fuel.2021.123045, 2022. a
Hermann, M. and Wiedensohler, A.: Counting efficiency of condensation particle counters at low-pressures with illustrative data from the upper troposphere, J. Aerosol Sci., 32, 975–991, https://doi.org/10.1016/S0021-8502(01)00037-4, 2001. a
Heymsfield, A., Baumgardner, D., DeMott, P., Forster, P., Gierens, K., and Kärcher, B.: Contrail Microphysics, B. Am. Meteorol. Soc., 91, 465–472, https://doi.org/10.1175/2009BAMS2839.1, 2010. a
Hoelzen, J., Silberhorn, D., Zill, T., Bensmann, B., and Hanke-Rauschenbach, R.: Hydrogen-powered aviation and its reliance on green hydrogen infrastructure – Review and research gaps, Int. J. Hydrogen Energ., 47, 3108–3130, https://doi.org/10.1016/j.ijhydene.2021.10.239, 2022. a
ICAO: First sustainable aviation fuel batches certified under CORSIA, https://www.icao.int/Newsroom/Pages/First-sustainable-aviation-fuel-batches-certified-under-CORSIA.aspx (last access: 7 March 2024), 2023a. a
ICAO: Volume II: Aircraft Engine Emissions, Tech. Rep., 5th Edn., ICAO, Montréal, QC, Canada, https://standart.aero/en/icao/book/annex-16-v-2-environmental-protection-volume-ii-aircraft (last access: 1 January 2024), 2023b. a
ICAO: ICAO Aircraft Engine Emissions Databank, Tech. rep., EASA, Montréal, QC, Canada, https://www.easa.europa.eu/en/domains/environment/icao-aircraft-engine-emissions-databank (last access: 1 January 2024), 2024. a, b
ISO: Aerosol particle number concentration – Calibration of condensation particle counters, https://www.iso.org/standard/44414.html (last access: 1 January 2020), 2015. a
Joo, P. H., Gigone, B., Griffin, E. A., Christensen, M., and Gülder, O. L.: Soot primary particle size dependence on combustion pressure in laminar ethylene diffusion flames, Fuel, 220, 464–470, https://doi.org/10.1016/j.fuel.2018.02.025, 2018. a
Jurkat, T., Voigt, C., Arnold, F., Schlager, H., Kleffmann, J., Aufmhoff, H., Schäuble, D., Schaefer, M., and Schumann, U.: Measurements of HONO, NO, NOy and SO2 in aircraft exhaust plumes at cruise, Geophys. Res. Lett., 38, L10807, https://doi.org/10.1029/2011GL046884, 2011. a
Kärcher, B.: Formation and radiative forcing of contrail cirrus, Nat. Commun., 9, 1824, https://doi.org/10.1038/s41467-018-04068-0, 2018. a, b
Kärcher, B., Peter, T., and Ottmann, R.: Contrail formation: Homogeneous nucleation of H2SO4/H2O, Geophys. Res. Lett., 22, 1501–1504, https://doi.org/10.1029/95GL01337, 1995. a
Kärcher, B., Burkhardt, U., Bier, A., Bock, L., and Ford, I. J.: The microphysical pathway to contrail formation, J. Geophys. Res.-Atmos., 120, 7893–7927, https://doi.org/10.1002/2015JD023491, 2015. a
Kathrotia, T. and Riedel, U.: Predicting the soot emission tendency of real fuels – A relative assessment based on an empirical formula, Fuel, 261, 116482, https://doi.org/10.1016/j.fuel.2019.116482, 2020. a
Kleine, J.: Flugzeuggetragene Messungen von Eis- und Rußpartikeln in Kondensstreifen bei Verwendung konventioneller und synthetischer Treibstoffe, PhD thesis, Johannes Gutenberg-Universität Mainz, https://doi.org/10.25358/OPENSCIENCE-3574, 2019. a
Kleine, J., Voigt, C., Sauer, D., Schlager, H., Scheibe, M., Jurkat‐Witschas, T., Kaufmann, S., Kärcher, B., and Anderson, B. E.: In Situ Observations of Ice Particle Losses in a Young Persistent Contrail, Geophys. Res. Lett., 45, 13553–13561, https://doi.org/10.1029/2018GL079390, 2018. a
Lee, D., Fahey, D., Skowron, A., Allen, M., Burkhardt, U., Chen, Q., Doherty, S., Freeman, S., Forster, P., Fuglestvedt, J., Gettelman, A., De León, R., Lim, L., Lund, M., Millar, R., Owen, B., Penner, J., Pitari, G., Prather, M., Sausen, R., and Wilcox, L.: The contribution of global aviation to anthropogenic climate forcing for 2000 to 2018, Atmos. Environ., 244, 117834, https://doi.org/10.1016/j.atmosenv.2020.117834, 2021. a
Lobo, P., Hagen, D. E., and Whitefield, P. D.: Comparison of PM Emissions from a Commercial Jet Engine Burning Conventional, Biomass, and Fischer–Tropsch Fuels, Environ. Sci. Technol., 45, 10744–10749, https://doi.org/10.1021/es201902e, 2011. a
Märkl, R. S., Voigt, C., Sauer, D., Dischl, R. K., Kaufmann, S., Harlaß, T., Hahn, V., Roiger, A., Weiß-Rehm, C., Burkhardt, U., Schumann, U., Marsing, A., Scheibe, M., Dörnbrack, A., Renard, C., Gauthier, M., Swann, P., Madden, P., Luff, D., Sallinen, R., Schripp, T., and Le Clercq, P.: Powering aircraft with 100 % sustainable aviation fuel reduces ice crystals in contrails, Atmos. Chem. Phys., 24, 3813–3837, https://doi.org/10.5194/acp-24-3813-2024, 2024. a, b, c, d, e, f
Mertes, S., Schröder, F., and Wiedensohler, A.: The Particle Detection Efficiency Curve of the TSI-3010 CPC as a Function of the Temperature Difference between Saturator and Condenser, Aerosol Sci. Tech., 23, 257–261, https://doi.org/10.1080/02786829508965310, 1995. a, b
Miake-Lye, R. C., Anderson, B. E., Cofer, W. R., Wallio, H. A., Nowicki, G. D., Ballenthin, J. O., Hunton, D. E., Knighton, W. B., Miller, T. M., Seeley, J. V., and Viggiano, A. A.: SOx oxidation and volatile aerosol in aircraft exhaust plumes depend on fuel sulfur content, Geophys. Res. Lett., 25, 1677–1680, https://doi.org/10.1029/98GL00064, 1998. a
Minnis, P., Bedka, S. T., Duda, D. P., Bedka, K. M., Chee, T., Ayers, J. K., Palikonda, R., Spangenberg, D. A., Khlopenkov, K. V., and Boeke, R.: Linear contrail and contrail cirrus properties determined from satellite data, Geophys. Res. Lett., 40, 3220–3226, https://doi.org/10.1002/grl.50569, 2013. a
Mitchell, P. and Frenklach, M.: Particle aggregation with simultaneous surface growth, Phys. Rev. E, 67, 061407, https://doi.org/10.1103/PhysRevE.67.061407, 2003. a
Moore, R. H., Shook, M., Beyersdorf, A., Corr, C., Herndon, S., Knighton, W. B., Miake-Lye, R., Thornhill, K. L., Winstead, E. L., Yu, Z., Ziemba, L. D., and Anderson, B. E.: Influence of Jet Fuel Composition on Aircraft Engine Emissions: A Synthesis of Aerosol Emissions Data from the NASA APEX, AAFEX, and ACCESS Missions, Energ. Fuels, 29, 2591–2600, https://doi.org/10.1021/ef502618w, 2015. a
Moore, R. H., Thornhill, K. L., Weinzierl, B., Sauer, D., D'Ascoli, E., Kim, J., Lichtenstern, M., Scheibe, M., Beaton, B., Beyersdorf, A. J., Barrick, J., Bulzan, D., Corr, C. A., Crosbie, E., Jurkat, T., Martin, R., Riddick, D., Shook, M., Slover, G., Voigt, C., White, R., Winstead, E., Yasky, R., Ziemba, L. D., Brown, A., Schlager, H., and Anderson, B. E.: Biofuel blending reduces particle emissions from aircraft engines at cruise conditions, Nature, 543, 411–415, https://doi.org/10.1038/nature21420, 2017. a, b, c, d, e, f
Naegeli, D. W., Dodge, L. G., and Moses, C. A.: Effects of Flame Temperature and Fuel Composition on Soot Formation in Gas Turbine Combustors, Combust. Sci. Technol., 35, 117–131, https://doi.org/10.1080/00102208308923706, 1983. a
Noone, K. J. and Hansson, H.-C.: Calibration of the TSI 3760 Condensation Nucleus Counter for Nonstandard Operating Conditions, Aerosol Sci. Tech., 13, 478–485, https://doi.org/10.1080/02786829008959462, 1990. a
Petzold, A., Gysel, M., Vancassel, X., Hitzenberger, R., Puxbaum, H., Vrochticky, S., Weingartner, E., Baltensperger, U., and Mirabel, P.: On the effects of organic matter and sulphur-containing compounds on the CCN activation of combustion particles, Atmos. Chem. Phys., 5, 3187–3203, https://doi.org/10.5194/acp-5-3187-2005, 2005. a
Prussi, M., Lee, U., Wang, M., Malina, R., Valin, H., Taheripour, F., Velarde, C., Staples, M. D., Lonza, L., and Hileman, J. I.: CORSIA: The first internationally adopted approach to calculate life-cycle GHG emissions for aviation fuels, Renew. Sustain. Energ. Rev., 150, 111398, https://doi.org/10.1016/j.rser.2021.111398, 2021. a
Richter, H. and Howard, J.: Formation of polycyclic aromatic hydrocarbons and their growth to soot – a review of chemical reaction pathways, Prog. Energ. Combust. Sci., 26, 565–608, https://doi.org/10.1016/S0360-1285(00)00009-5, 2000. a
Sauer, D. and Dischl, R.: Mission: ECLIF3, HALO Database [code and data set], https://doi.org/10.17616/R39Q0T, 2024. a
Schöberl, M., Dollner, M., Gasteiger, J., Seibert, P., Tipka, A., and Weinzierl, B.: Characterization of the airborne aerosol inlet and transport system used during the A-LIFE aircraft field experiment, Atmos. Meas. Tech., 17, 2761–2776, https://doi.org/10.5194/amt-17-2761-2024, 2024. a
Schripp, T., Anderson, B., Crosbie, E. C., Moore, R. H., Herrmann, F., Oßwald, P., Wahl, C., Kapernaum, M., Köhler, M., Le Clercq, P., Rauch, B., Eichler, P., Mikoviny, T., and Wisthaler, A.: Impact of Alternative Jet Fuels on Engine Exhaust Composition During the 2015 ECLIF Ground-Based Measurements Campaign, Environ. Sci. Technol., 52, 4969–4978, https://doi.org/10.1021/acs.est.7b06244, 2018. a, b
Schripp, T., Anderson, B. E., Bauder, U., Rauch, B., Corbin, J., Smallwood, G., Lobo, P., Crosbie, E., Shook, M. A., Miake-Lye, R. C., Yu, Z., Freedman, A., Whitefield, P. D., Robinson, C. E., Achterberg, S. L., Köhler, M., Oßwald, P., Grein, T., Sauer, D., Voigt, C., Schlager, H., and LeClercq, P.: Aircraft Engine Particulate Matter and Gaseous Emissions from Sustainable Aviation Fuels: Results from Ground-Based Measurements During the Nasa/Dlr Campaign Eclif2/Nd-Max, SSRN Elect. J., 325, 124764, https://doi.org/10.2139/ssrn.4045444, 2022. a, b
Schumann, U.: On conditions for contrail formation from aircraft exhausts, Meteorol. Z., 5, 4–23, https://doi.org/10.1127/metz/5/1996/4, 1996. a
Schumann, U., Arnold, F., Busen, R., Curtius, J., Kärcher, B., Kiendler, A., Petzold, A., Schlager, H., Schröder, F., and Wohlfrom, K.-H.: Influence of fuel sulfur on the composition of aircraft exhaust plumes: The experiments SULFUR 1–7, J. Geophys. Res.-Atmos., 107, AAC 2–27, https://doi.org/10.1029/2001JD000813, 2002. a
Schumann, U., Baumann, R., Baumgardner, D., Bedka, S. T., Duda, D. P., Freudenthaler, V., Gayet, J.-F., Heymsfield, A. J., Minnis, P., Quante, M., Raschke, E., Schlager, H., Vázquez-Navarro, M., Voigt, C., and Wang, Z.: Properties of individual contrails: a compilation of observations and some comparisons, Atmos. Chem. Phys., 17, 403–438, https://doi.org/10.5194/acp-17-403-2017, 2017. a
Sorokin, A.: Gaseous SO3 and H2SO4 in the exhaust of an aircraft gas turbine engine: measurements by CIMS and implications for fuel sulfur conversion to sulfur (VI) and conversion of SO3 to H2SO4, Atmos. Environ., 38, 449–456, https://doi.org/10.1016/j.atmosenv.2003.09.069, 2004. a
Stettler, M. E. J., Swanson, J. J., Barrett, S. R. H., and Boies, A. M.: Updated Correlation Between Aircraft Smoke Number and Black Carbon Concentration, Aerosol Sci. Tech., 47, 1205–1214, https://doi.org/10.1080/02786826.2013.829908, 2013. a
Takegawa, N., Nagasaki, A., Fushimi, A., Fujitani, Y., Murashima, Y., and Sakurai, H.: Volatility of aircraft exhaust ultrafine particles inferred from field measurements at Narita International Airport, Atmos. Environ., 292, 119391, https://doi.org/10.1016/j.atmosenv.2022.119391, 2023. a
Teoh, R., Stettler, M. E., Majumdar, A., Schumann, U., Graves, B., and Boies, A. M.: A methodology to relate black carbon particle number and mass emissions, J. Aerosol Sci., 132, 44–59, https://doi.org/10.1016/j.jaerosci.2019.03.006, 2019. a
Teoh, R., Schumann, U., Majumdar, A., and Stettler, M. E. J.: Mitigating the Climate Forcing of Aircraft Contrails by Small-Scale Diversions and Technology Adoption, Environ. Sci. Technol., 54, 2941–2950, https://doi.org/10.1021/acs.est.9b05608, 2020a. a, b
Teoh, R., Schumann, U., and Stettler, M. E. J.: Beyond Contrail Avoidance: Efficacy of Flight Altitude Changes to Minimise Contrail Climate Forcing, Aerospace, 7, 121, https://doi.org/10.3390/aerospace7090121, 2020b. a
Teoh, R., Schumann, U., Gryspeerdt, E., Shapiro, M., Molloy, J., Koudis, G., Voigt, C., and Stettler, M. E. J.: Aviation contrail climate effects in the North Atlantic from 2016 to 2021, Atmos. Chem. Phys., 22, 10919–10935, https://doi.org/10.5194/acp-22-10919-2022, 2022a. a, b, c, d, e
Teoh, R., Schumann, U., Voigt, C., Schripp, T., Shapiro, M., Engberg, Z., Molloy, J., Koudis, G., and Stettler, M. E. J.: Targeted Use of Sustainable Aviation Fuel to Maximize Climate Benefits, Environ. Sci. Technol., 56, 17246–17255, https://doi.org/10.1021/acs.est.2c05781, 2022b. a, b
Teoh, R., Engberg, Z., Schumann, U., Voigt, C., Shapiro, M., Rohs, S., and Stettler, M. E. J.: Global aviation contrail climate effects from 2019 to 2021, Atmos. Chem. Phys., 24, 6071–6093, https://doi.org/10.5194/acp-24-6071-2024, 2024. a
Tran, S., Brown, A., and Olfert, J. S.: Comparison of Particle Number Emissions from In-Flight Aircraft Fueled with Jet A1, JP-5 and an Alcohol-to-Jet Fuel Blend, Energ. Fuels, 34, 7218–7222, https://doi.org/10.1021/acs.energyfuels.0c00260, 2020. a
Vázquez-Navarro, M., Mannstein, H., and Kox, S.: Contrail life cycle and properties from 1 year of MSG/SEVIRI rapid-scan images, Atmos. Chem. Phys., 15, 8739–8749, https://doi.org/10.5194/acp-15-8739-2015, 2015. a
Voigt, C., Schumann, U., Jessberger, P., Jurkat, T., Petzold, A., Gayet, J.-F., Krämer, M., Thornberry, T., and Fahey, D. W.: Extinction and optical depth of contrails, Geophys. Res. Lett., 38, L11806, https://doi.org/10.1029/2011GL047189, 2011. a
Voigt, C., Schumann, U., Minikin, A., Abdelmonem, A., Afchine, A., Borrmann, S., Boettcher, M., Buchholz, B., Bugliaro, L., Costa, A., Curtius, J., Dollner, M., Dörnbrack, A., Dreiling, V., Ebert, V., Ehrlich, A., Fix, A., Forster, L., Frank, F., Fütterer, D., Giez, A., Graf, K., Grooß, J.-U., Groß, S., Heimerl, K., Heinold, B., Hüneke, T., Järvinen, E., Jurkat, T., Kaufmann, S., Kenntner, M., Klingebiel, M., Klimach, T., Kohl, R., Krämer, M., Krisna, T. C., Luebke, A., Mayer, B., Mertes, S., Molleker, S., Petzold, A., Pfeilsticker, K., Port, M., Rapp, M., Reutter, P., Rolf, C., Rose, D., Sauer, D., Schäfler, A., Schlage, R., Schnaiter, M., Schneider, J., Spelten, N., Spichtinger, P., Stock, P., Walser, A., Weigel, R., Weinzierl, B., Wendisch, M., Werner, F., Wernli, H., Wirth, M., Zahn, A., Ziereis, H., and Zöger, M.: ML-CIRRUS: The Airborne Experiment on Natural Cirrus and Contrail Cirrus with the High-Altitude Long-Range Research Aircraft HALO, B. Am. Meteorol. Soc., 98, 271–288, https://doi.org/10.1175/BAMS-D-15-00213.1, 2017. a
Voigt, C., Kleine, J., Sauer, D., Moore, R., Bräuer, T., Le Clercq, P., Kaufmann, S., Scheibe, M., Jurkat-Witschas, T., Aigner, M., Bauder, U., Boose, Y., Borrmann, S., Crosbie, E., Diskin, G. S., DiGangi, J., Hahn, V., Heckl, C., Huber, F., Nowak, J. B., Rapp, M., Rauch, B., Robinson, C., Schripp, T., Shook, M., Winstead, E., Ziemba, L., Schlager, H., and Anderson, B. E.: Cleaner burning aviation fuels can reduce contrail cloudiness, Commun. Earth Environ., 2, 114, https://doi.org/10.1038/s43247-021-00174-y, 2021. a, b, c, d, e, f
Wang, Z., Bugliaro, L., Jurkat-Witschas, T., Heller, R., Burkhardt, U., Ziereis, H., Dekoutsidis, G., Wirth, M., Groß, S., Kirschler, S., Kaufmann, S., and Voigt, C.: Observations of microphysical properties and radiative effects of a contrail cirrus outbreak over the North Atlantic, Atmos. Chem. Phys., 23, 1941–1961, https://doi.org/10.5194/acp-23-1941-2023, 2023. a
- Abstract
- Introduction
- Experiment and instrumentation
- Results
- Dependence of nvPM and totPM on fuel composition
- Conclusions and outlook
- Appendix A: Instrument characterization and calibrations
- Data availability
- Author contributions
- Competing interests
- Disclaimer
- Acknowledgements
- Financial support
- Review statement
- References