the Creative Commons Attribution 4.0 License.
the Creative Commons Attribution 4.0 License.
 | 08 Oct 2024
Simulated particle evolution within a winter storm: contributions of riming to radar moments and precipitation fallout
Lynn A. McMurdie
Angela K. Rowe
Andrew J. Heymsfield
Remote sensing radars from airborne and spaceborne platforms provide critical observations of clouds to estimate precipitation rates across the globe. The ability of these radars to detect changes in precipitation properties is advanced by Doppler measurements of particle fall speed. Within mixed-phase clouds, precipitation mass and its fall characteristics are especially sensitive to the effects of riming. In this study, we quantified these effects and investigated the distinction of riming from aggregation in Doppler radar vertical profiles using quasi-idealized particle-based model simulations. Observational constraints of a control simulation were determined from airborne in situ and remote sensing measurements collected during the Investigation of Microphysics and Precipitation for Atlantic Coast-Threatening Snowstorms (IMPACTS) for a wintry–mixed precipitation event over the northeastern United States on 4 February 2022. From the upper boundary of a one-dimensional column, particle evolution was simulated through vapor deposition, aggregation, and riming processes, producing realistic Doppler radar profiles. Despite a modest observed amount of supercooled liquid water (0.05 g m−3), riming accounted for 55 % of the ice-phase precipitation mass, cumulatively increasing reflectivity by 44 % and Doppler velocity by 68 %. Independent evaluation of process-based sensitivities showed that, while radar reflectivity is comparably sensitive to either riming- or aggregation-based particle morphology, the Doppler velocity profile is uniquely sensitive to particle density changes during riming. Thus, Doppler velocity profiles advance the diagnosis of riming as a dominant microphysical process in stratiform clouds from single-wavelength radars, which has implications for quantitative constraints of particle properties in remote sensing applications.
- Article
(4164 KB) - Full-text XML
- BibTeX
- EndNote


Ice crystals within precipitating winter storms evolve through an inherently stochastic sequence of microphysical processes which uniquely affect their physical properties and fall characteristics. This continuous and process-based evolution of ice-phase particles remains poorly represented by many numerical models and remote sensing retrieval algorithms. A fundamental limitation is that cloud and precipitation processes occur on physical scales that are several orders of magnitude smaller than typical cloud-scale model grids or the remote sensing instrument sampling volume. Nevertheless, realistic representation of varied particle populations within clouds is necessary to accurately estimate precipitation rates.
Commonly, a population of particles within some volume is expressed by a particle size distribution (PSD), and weighted integrals (i.e., moments) of the PSD are sensitive to the microphysical evolution of ice-phase particles (Morrison et al., 2020). Ice-phase precipitation mass is proportional to the second moment of the PSD. Because radar reflectivity, Z, is proportional to the square of the mass (i.e., the fourth moment of the PSD), the precipitation mass directly affects the power returned to a radar. However, because of the physical complexity arising from diversity in initial ice crystal habits and their unique process-based morphologies with time, assumptions about the particle properties and the PSD are often necessary for deriving remote sensing precipitation rate estimates. For example, ice crystals are commonly assumed to be spherical (e.g., Iguchi et al., 2018) and the population may be constrained to a prescriptive PSD shape or snow density (e.g., Grecu et al., 2016). The consequences of such a priori assumptions are that process-based variations cannot be expressed and retrieved precipitation rate estimates are inherently constrained, leading to snowfall rate underestimation and increased error compared to the liquid phase (e.g., Speirs et al., 2017). To advance the utility of radar remote sensing measurements of ice-phase precipitation, it is important to understand the quantitative effects of process-based evolution on the intrinsic physical properties of precipitation in natural clouds and their implications for radar measurements.
A remarkable property of precipitating clouds is that liquid water droplets are frequently present at subfreezing temperatures alongside ice crystals. A region of cloud containing both ice and subfreezing (i.e., supercooled) liquid water (SLW) is described as a mixed-phase layer. One implication of the mixed-phase particle population is that depositional ice growth occurs at the expense of liquid water due to differences in saturation vapor pressures over ice and liquid surfaces, a process commonly referred to as the Wegener–Bergeron–Findeisen process (Pruppacher and Klett, 1997). Additionally, upon contact with falling ice crystals, the SLW droplets freeze and are accreted by the crystal (i.e., riming), initiating a physical morphology of the particle. Natural ice crystals demonstrate tremendous variability in shape and complexity, depending on growth habits (e.g., Magono and Lee, 1966; Pruppacher and Klett, 1997; Bailey and Hallet, 2009). Because of this diversity, it is often convenient to define the crystal size along major and minor axes, while the major axis is assumed to be along the maximum dimension of the crystal and the minor axis along an orthogonal orientation. The aspect ratio defines the ratio between the crystal dimensions along the minor and major axes (Jensen and Harrington, 2015). One commonly adopted conceptual description for the change in particle properties during riming is the “fill-in” model (Heymsfield, 1982), whereby the liquid water will initially fill open voids while largely maintaining the initial dimensions of the crystal axes. During the later stages of the fill-in riming model, rime accumulates on the underside of the falling crystal, increasing the minor dimension of the crystal while the major dimension remains unchanged. With increasing riming, the aspect ratio approaches unity, which is expected for heavily rimed graupel particles. Consequently, riming results in increasing particle density and, therefore, fall velocity. The adjustments in particle geometry and fall characteristics with rime accumulation are relative to, and dependent on, the initial ice crystal geometry and accreted rime but also dependent on prior and concurrent processes, including vapor depositional growth and aggregation (e.g., Jensen and Harrington, 2015).
Ice-phase particle growth by deposition of vapor-phase water directly increases the ice water content (IWC) and therefore yields direct increases in Z (Field et al., 2005, 2007). However, depositional mass accumulation occurs at a relatively slow rate, and thus gradual increases in Z are expected from depositional growth alone. Aggregation of two or more particles does not explicitly alter the IWC of the particles but rather redistributes the mass to a larger size particle. Despite unchanging IWC, an increased particle diameter, D, during aggregation enhances radar scattering at a rate proportional to D4, and consequently Z may be significantly increased by effects of aggregation. Through accumulation of liquid-phase water which yields increases in IWC, similar, rapid adjustments of Z are also possible during riming. Evaluation of process-based effects on the evolution of the PSD moments and their implications for precipitation fallout from natural clouds is challenging because specific processes cannot be readily isolated, even if observations are collected in situ. In general, observationally consistent numerical modeling simulations are necessary for determining such effects.
The physical scales of the processes that govern the formation and evolution of falling ice crystals are not resolved by most numerical models. In bulk and bin microphysics schemes, ice-phase processes are commonly expressed implicitly through conversion processes whereby precipitation is exchanged among predefined categories (e.g., ice, snow, graupel, or hail; Thompson et al., 2004; Morrison et al., 2005). However, prior studies (e.g., Colle et al., 2005; Morrison and Milbrandt, 2011; van Weverberg et al., 2012) have demonstrated that the precipitation evolution and fallout are sensitive to a priori thresholds that define category conversions (e.g., snow to graupel during riming). For rimed growth, Lagrangian particle-based model simulations indicate that bulk particle density can undergo rapid evolution in response to small variations in the background SLW concentration, significantly modulating the particle fall velocity and surface precipitation rate (DeLaFrance et al., 2024). For remote sensing retrievals of mixed-phase precipitation, the effects of rime accumulation are constrained by the a priori assumptions about the particle's mass, geometry, or fall characteristics. Recently, diverse methodologies leveraging multifrequency, dual-polarization, and Doppler radar measurements have been proposed for retrieving some properties of ice-phase particles that would otherwise be prescribed (e.g., Leinonen and Szyrmer, 2015; Kneifel et al., 2016; Moisseev et al., 2017; Oue et al., 2018; Leinonen et al., 2018; Mason et al., 2019; Chase et al., 2021). Among these methods, leveraging radar Doppler data has shown promise in inferring the onset of riming and, subsequently, the riming-based modulations of retrieved particle property estimates. Mason et al. (2018) demonstrated that the addition of Doppler radar measurements provides a constraint on the bulk ice density parameter in retrievals of snowfall. Furthermore, as shown by Kalesse et al. (2016), rimed snow occupies a unique region of Doppler spectra that is distinct from unrimed snow. One-dimensional (1D) spectral bin microphysics modeling simulations have shown promise in reproducing the Doppler spectral moments of riming but demonstrate sensitivity to particle property assumptions (Kalesse et al., 2016).
The 1D columnar modeling approach offers a framework for simulating explicit microphysical processes and detailed particle properties that are computationally prohibitive in a 3D dynamic model. The 1D construction is therefore well suited to advanced bin and Lagrangian particle-based microphysics schemes. One challenge for such simulation designs, however, is constraining the model in a way that minimizes assumptions and, as a result, ambiguity in the attributing physical process for adjustments in the cloud's radar and precipitation characteristics (e.g., Kalesse et al., 2016; Bringi et al., 2020). Some assumptions can be constrained by coincident in situ and remote sensing radar measurements.
Data collected during the winters of 2020, 2022, and 2023 from the Investigation of Microphysics and Precipitation for Atlantic Coast-Threatening Snowstorms (IMPACTS) campaign (McMurdie et al., 2022) provide those constraints. Midlatitude cyclones over the United States East Coast and Midwest regions were comprehensively sampled by coordinated aircraft- and ground-based platforms to better understand the precipitation microphysics within regions of snowfall that organize into elongated regions commonly recognized as snowbands (e.g., Novak et al., 2004). Consistent with the IMPACTS goal of supporting improved numerical modeling and remote sensing retrievals of winter precipitation, in the present study we investigate the process-based effects of riming in a sampled storm that produced moderate rates of wintry–mixed precipitation for a prolonged period over the northeast. Our overarching approach is to combine these observations with numerical modeling simulations to describe the process-based particle evolution and contributions of riming to the observed radar properties and precipitation rates. Here, we use an observationally constrained, sophisticated Lagrangian particle-based model within a 1D columnar framework to address the following questions:
-
Can primary ice processes (i.e., deposition, aggregation, and riming) within a simplified 1D simulation reasonably reproduce the observed evolution of particles within the natural cloud?
-
What were the quantitative contributions of riming to the observed Doppler radar vertical profiles and to the surface precipitation rate?
-
Do simulated Doppler radar vertical profiles yield characteristic responses to the onset or degree of riming that are distinct from other ice-phase processes (e.g., aggregation)?
2.1 The 4 February 2022 case study
For this analysis, we will use IMPACTS observations collected during the 4 February 2022 event that delivered wintry–mixed precipitation across a broad region of the northeastern US. IMPACTS deployed an in situ (P-3) and remote sensing (ER-2) aircraft. The P-3 aircraft was equipped with instrumentation to measure the in situ cloud microphysical properties, and the high-altitude ER-2 aircraft was equipped with nadir-viewing remote sensing instrumentation analogous to those on board satellite-based platforms (e.g., Skofronick-Jackson et al., 2017). The two aircraft targeted the storm over the coastal New England area, where, as an example of the surface precipitation characteristics during this event, the Boston MA (KBOS) Automated Surface Observing System (ASOS; Brodzik, 2022a) reported nearly 32 mm of precipitation in 24 h. Precipitation initially accumulated in the form of light to heavy rain before transitioning to freezing rain at about 13:00 UTC, ice pellets by 16:00 UTC, and back to freezing rain at about 19:30 UTC. A transition to snow and continued accumulation occurred on 5 February at KBOS and over most of the New England area.
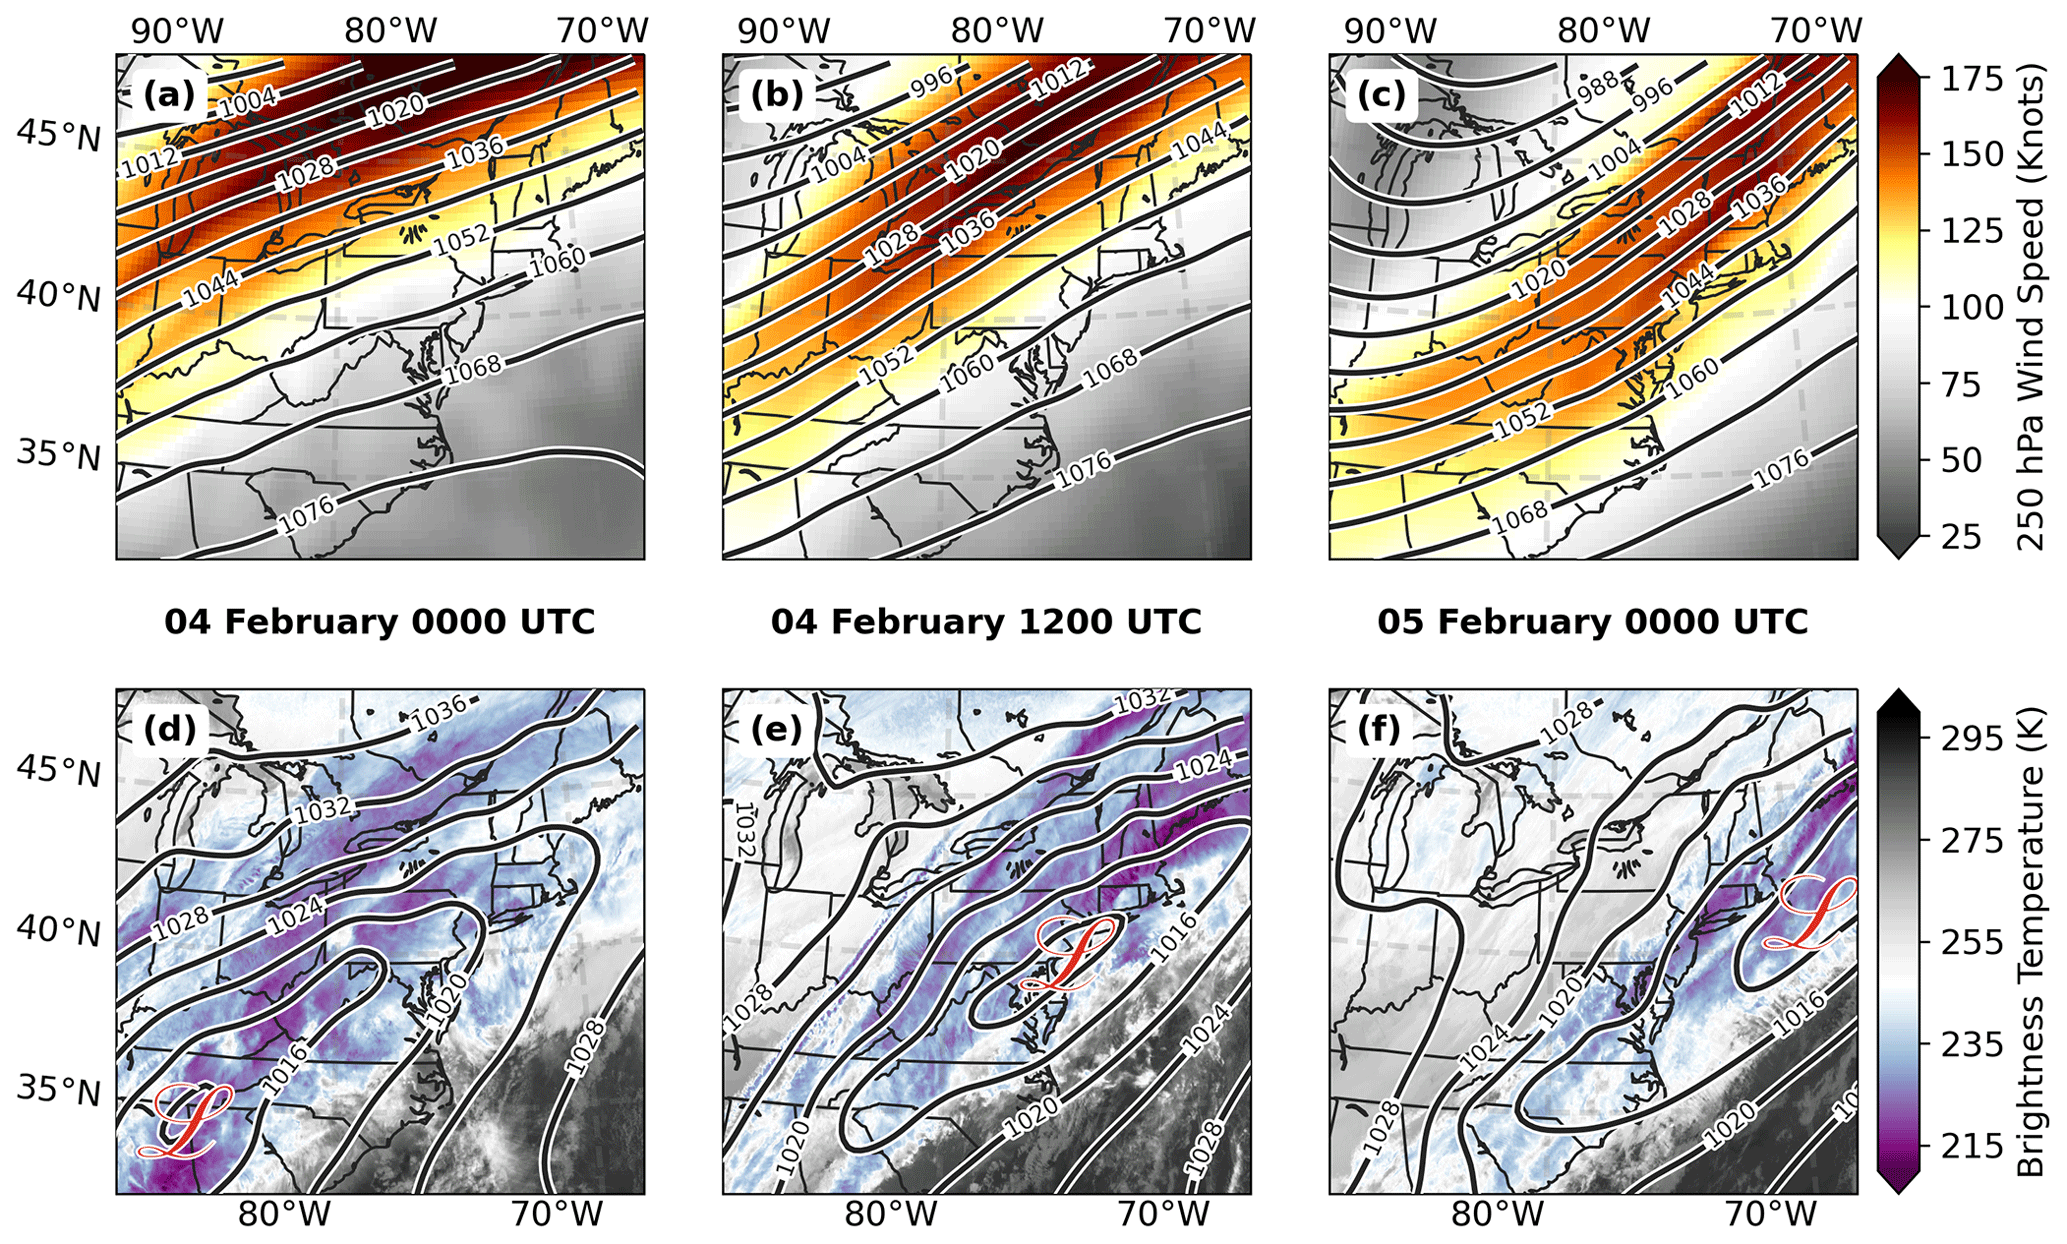
Figure 1Synoptic evolution of the winter storm that impacted the northeastern US: (a–c) 250 hPa geopotential heights (dam) and wind speeds (knots) and (d–f) mean sea level pressure (MSLP, hPa) and cloud brightness temperature (K) for the times 00:00 UTC 4 February (a, d) and 12:00 UTC 4 February (b, e) and 00:00 UTC 5 February 2022 (c, f). The 250 hPa and MSLP data are from the European Centre for Medium-Range Weather Forecasts Reanalysis v5 (ERA5; Hersbach et al., 2020), and the brightness temperature data are from the Geostationary Operational Environmental Satellites (GOES) 10.3 µm channel (Brodzik, 2022b).
Winter storms that impact the northeastern US are commonly described according to the track of the low-pressure center, with implications for their precipitation characteristics. From these tracks, Zaremba et al. (2024) classified 26 IMPACTS events in one of six categories, which varied in, for example, rates and regions of cyclogenesis, frontal forcing, and precipitation intensity and distribution. Six of the events were classified as cold fronts and had relatively weak and expansive low-pressure areas which yielded widespread rain and snow along, and to the cold side of, the front. As one of these cold front events, the 4 February case had a broad frontal boundary that extended from the Gulf of Mexico to Maine. The prolonged period of wintry–mixed precipitation over the northeastern US was sustained by isentropic lifting of moisture-rich low-level flow along this front and overrunning of a surface layer which, for many areas, remained subfreezing. Over the eastern US, a mean southwesterly flow developed ahead of an initially positively tilted 250 hPa trough at 00:00 UTC 4 February that developed to nearly neutral tilt by 00:00 UTC 5 February (Fig. 1a–c). An associated jet streak exceeding 150 kn was situated over northern New England such that, between about 12:00 UTC 4 February and 00:00 UTC 5 February, upper-level divergence in the right entrance region further supported lifting within the atmospheric column (Bjerknes, 1951; Uccellini and Kocin, 1987; Holton and Hakim, 2012). During this time period, a modest elongated southwest–northeast-oriented low-pressure minimum of approximately 1010 hPa was maintained over a broad region of coastal New England (Fig. 1d–f).

Figure 2IMPACTS operations on 4 February 2022 over the northeastern US targeting regions of enhanced reflectivity that persisted for several hours in the operational National Weather Service (NWS) Multi-Radar Multi-Sensor (MRMS; Zhang et al., 2011) product. Shown are (a) the coordinated P-3 and ER-2 flight tracks and the MRMS composite reflectivity at approximately mid-flight (16:58 UTC) with subsets for each numbered flight leg in the southern enhanced region of reflectivity, indicating the data used for this study. Also indicated in panel (a) are the NWS rawinsonde launch site at Islip, NY (KOKX), and the ground verification site at Boston, MA (KBOS). Ku-band reflectivity (b) and Doppler velocity (c) vertical profiles as measured by the ER-2 aircraft from 16:28 UTC (north) to 16:34 UTC (south) depict the vertical cloud profile across the region of enhanced reflectivity (between transparent regions) for the fourth flight leg, while the P-3 aircraft sampled in situ at ∼ 4.3 km a.m.s.l. altitude (magenta line in panels b and c), ending the flight leg at ∼ 42.4° N.
Between about 13:00 and 18:00 UTC, the P-3 and ER-2 aircraft flew a “lawnmower-style” pattern orthogonal to the long axis of an enhanced region of reflectivity while translating subsequent flight legs to the northeast, such that the storm was sampled in an approximately Lagrangian manner (Fig. 2a). The P-3 flew its initial flight leg south to north, beginning at about 13:40 UTC briefly at 6.5 km a.m.s.l. before descending to a constant altitude of about 6.2 km a.m.s.l. At the southern end, this initial flight leg was near the NWS rawinsonde launch site at Islip, NY (KOKX). The P-3 descended on each subsequent flight leg to sample different layers of the cloud, reaching an altitude of 3 km a.m.s.l. on the final north-to-south flight leg, which transected the 0 °C melting level. The two enhanced regions of reflectivity, on either side of the surface frontal boundary, exhibited differing cloud and precipitation properties. At the surface, the northern region of enhanced reflectivity was dominated by snowfall, whereas the southern region was dominated by rain during the period of aircraft sampling before transitioning to wintry–mixed precipitation. As we describe in Sect. 2.2, in situ measurements are used to indicate riming, which was commonly observed over the southern region of enhanced reflectivity but was absent over the northern region. Therefore, to address our science questions, our present analysis is constrained to measurements of the southern portions of the flight legs (Fig. 2a).
2.2 Observations: surface-based, remote sensing, and in situ
The initial ER-2 and P-3 flight leg approximately overflew the NWS operational Islip NY (KOKX) rawinsonde launch site (Fig. 2a). Because of the relatively steady-state nature of the storm during the aircraft sampling period, the KOKX 12:00 UTC rawinsonde (Waldstreicher and Brodzik, 2022) is used to estimate the atmospheric properties in the southern portion of the flight legs. Because these southern portions of the flight legs were mostly offshore, we use the nearest ASOS measurements at KBOS between 13:00 and 18:00 UTC to estimate the mean surface precipitation rate for model comparison. The ER-2 aircraft flew well above the storm at approximately 20 km a.m.s.l. and operated two nadir-viewing radars on 4 February: the dual-band 13.9 GHz (Ku-band) and 35.6 GHz (Ka-band) High-Altitude Wind and Rain Airborne Profiler (HIWRAP; Li et al., 2016; McLinden et al., 2022) and the 94 GHz (W-band) Cloud Radar System (CRS; McLinden et al., 2021). For radar reflectivity and Doppler velocity measurements of the precipitation, we use HIWRAP measurements, which have a vertical resolution of 150 m and a surface footprint of 1 km. At Ku-band, HIWRAP has a minimum sensitivity of approximately −10 dB at an altitude of 10 km a.m.s.l. (Li et al., 2016).
Of the numerous instruments on board the P-3 aircraft, those of relevance to this study include cloud optical array probes (OAPs) and those that measure liquid water content (LWC) and vertical air motion. The OAPs provide measurements of the 2D projected sizes, shapes, and concentrations of particles. Data from the Two-Dimensional Stereo (2D-S; Lawson et al., 2006), which is commonly used for measurements of particles smaller than about 1 mm in diameter, are unavailable for the 4 February flight. However, the vertically oriented High-Volume Precipitation Spectrometer (HVPS; Lawson et al., 1993) provided particle measurements at sizes greater than 0.5 mm, which were used to construct the PSDs. Measurements of LWC were obtained from a Fast Cloud Droplet Probe (FCDP; Lawson et al., 2017) which operated as part of the Hawkeye combination probe. The FCDP uses Mie light scattering principles to size and count liquid water droplets from 2 to 50 µm in diameter, from which number and mass concentrations can be derived. Processing of the OAP and FCDP data was performed by the National Center for Atmospheric Research (NCAR; Bansemer et al., 2022) and is used at a 1 Hz frequency. Vertical air motion measurements were provided by the Turbulent Air Motion Measurement System (TAMMS), which uses several sensors at different locations on the aircraft to estimate the 3D components of the ambient wind (Thornhill et al., 2003). For TAMMS configured to the P-3, the accuracy of vertical wind measurements is estimated to be 0.2 m s−1 (Thornhill, 2022).
3.1 Model description
Several bulk microphysics schemes have been developed to more realistically represent the observed continuous evolution of ice-phase particle populations during riming (e.g., Morrison and Milbrandt, 2015; Jensen et al., 2017; Cholette et al., 2023). Recently, this modeling approach was extended to a Lagrangian particle-based scheme in the novel McSnow model (Brdar and Seifert, 2018). The particle-based approach affords some advantages over the bulk approach, i.e., that the evolution of a population of particles occurs independently of an Eulerian grid cell structure and is not constrained by assumptions about the PSD. The McSnow model was developed in a 1D columnar configuration and was expressly designed to simulate the evolution of an initial particle population during sedimentation through the column (Brdar and Seifert, 2018). The notion of a particle in McSnow follows the super-droplet principle (Shima et al., 2009), whereby a multiplicity of real particles with commonalities among physical properties and locations is represented by a single super-particle. These super-particles are continuously introduced in the upper boundary of the model such that initially prescribed PSD characteristics are maintained and then evolve by vapor deposition and aggregation, with an option for riming to occur within a user-defined mixed-phase layer. From 2D simulations using McSnow, DeLaFrance et al. (2024) demonstrated that mixed-phase layer depth significantly modulates surface precipitation rates, varying by up to 50 % in response to a depth change of 750 m, and that in situ measurements of SLW content provide a constraint on the layer's vertical extent. Following riming, melting of the particles occurs as its surface temperature exceeds 0 °C, and collision–coalescence processes may then occur, but no additional precipitation mass is generated by warm rain processes. The thermodynamic profile is prescribed, and there are no mechanisms of feedback on the ambient environment based on the microphysical processes.
At any point in the column, detailed information about individual particle properties is directly accessible. In general, however, there is greater utility in the description of a population of particles in the form of a binned PSD expressed as the number concentration, N, of particles with diameter D. We use a construction of 200 bins linearly spaced from 2 µm to 10 cm. From the PSD, radar quantities associated with moments of the PSD are computed by using a forward operator to estimate the radar scattering properties. Several scattering models have previously been adopted for radar scattering from ice crystals, principally differing in the complexity of the scattering particle's geometry. A population of ice crystals may be treated as spheres and scattering computed directly from Mie theory (Bohren and Huffman, 1983); however, this approach vastly simplifies the irregular geometry of natural ice crystals. Scattering estimates based on the T-matrix method (Mishchenko et al., 1996) support nonsphericity of particles using a spheroidal shape. Furthermore, the orientation of the spheroids relative to the radar beam may be specified or randomized (Mishchenko and Travis, 1998). A more sophisticated approach termed discrete-dipole approximation (DDA) accounts for the complex scattering interactions of irregular crystal geometry (Purcell and Pennypacker, 1973) and is therefore a compelling method for estimating scattering of natural crystals. However, for our simulations, crystal habits or detailed properties of particle geometry are not predicted, and thus T-matrix is an apt method for estimating radar scattering. Specifically, we use the PyTMatrix software (Leinonen, 2014) to estimate the radar backscattering cross section, σ, and compute Z, defined as
where λ is the radar wavelength and K is the dielectric factor. From the simulations, we also estimate the Doppler velocity, VD, which is the reflectivity-weighted fall velocity v of the particles, defined as
For a mixed-phase cloud, Tridon et al. (2019) demonstrated a degradation of skill in T-matrix Z estimates at higher radar frequencies (i.e., Ka- and W-band). To minimize uncertainties associated with non-Rayleigh radar scattering effects (e.g., Matrosov, 2007; Liu, 2004, 2008), we specify λ = 25 mm for all the calculations, which is comparable to the Ku channel on the HIWRAP radar. Additionally, for consistency with the HIWRAP measurements, a two-way correction for attenuation due to precipitation particles was applied following the methodology described in Williams (2022).
3.2 Control simulation design
We use the in situ measurements combined with rawinsonde data to construct a quasi-idealized cloud profile that is representative of the mean state of the 4 February storm, which we apply prescriptively in the 1D columnar McSnow model. The process-based model design is illustrated by the schematic in Fig. 3. Introduction of new particles from a prescribed PSD occurs at 6.5 km a.m.s.l., which approximately corresponds to the uppermost height of the in situ observations. The dominant particle types observed at this height were side planes and bullet rosettes. As newly introduced particles undergo sedimentation, growth occurs initially through vapor deposition only. Aggregation is introduced at 6 km a.m.s.l. (−15 °C) since aggregate particles, mostly side planes and other planar crystals, were present in observations below 6 km a.m.s.l. Riming is introduced at 5.5 km a.m.s.l., which we approximate as an upper extent of the mixed-phase layer based on the presence of SLW droplets and rimed particles beginning at flight leg 3 (4.9 km a.m.s.l.) and, subsequently, legs 4 and 5 (4.3 and 3.6 km a.m.s.l.). The onset of melting is determined by the thermodynamic profile, which is obtained from the 12:00 UTC KOKX rawinsonde. Although model processes are largely independent of an Eulerian grid (see the discussion in Brdar and Seifert, 2018, Sect. 2), model output and analysis occur in a gridded column with 500 vertical levels, which yields a vertical resolution of 13 m. Additionally, we specify a time step of 5 s and a total run duration of 10 h; results are analyzed as averages over the final 5 h, after the system has reached a steady state.

Figure 3Schematic of the 1D columnar configuration of the McSnow model with prescriptive process-based layers for the evolution of new particles initiated at the column's upper boundary. Static temperature and dew point vertical profiles are derived from the 4 February 12:00 UTC KOKX rawinsonde.
As a constraint on the observational data used for simulation construction, we approximate the horizontal extent of the southern region of enhanced reflectivity by visually assessing its lateral edges during each flight leg using the Ku-band radar vertical profiles. An example of this approach is provided in Fig. 2b, c for the fourth flight leg in which the data used are from the center portion of the figure. The boundaries (opaque regions) varied for each flight leg, adapting to the northeastward progression of the storm and the translation of each flight leg. The initial PSD characteristics are derived from an average of the measurements on the uppermost flight leg at ∼ 6.5 km a.m.s.l. between the southern end point of the leg and 40.7° N latitude (see Fig. 2a). Because measurements are unavailable for particles smaller than 0.5 mm, we fit a Gamma distribution to the mean PSD from HVPS measurements and then extend the fitted distribution to a lower size limit of 112.5 µm to estimate an IWC of 0.14 g m−3 and a total number concentration, N, of 23 × 103 m−3. For all the simulations, an initial super-particle multiplicity of 105 at the upper boundary is specified. We assume that newly initialized particles at 6.5 km a.m.s.l. have a mass–dimension relationship of m = 0.00294D1.94 (centimeter–gram–second) following Brown and Francis (1995) for unrimed aggregate ice crystals in a stratiform cloud. From analysis of four IMPACTS events during the preceding 2020 deployment, Heymsfield et al. (2023) showed that Z calculated from a PSD using the Brown and Francis (1995) mass–dimension relationship and a T-matrix approach yielded an agreement with observations at Ku-band within 1.15 dB.
Falling particles are subject to an updraft. We estimate a mean-state vertical wind profile by fitting a third-degree polynomial curve to the mean measurements from each flight leg and extending the uppermost and lowermost measurements as constant values to heights beyond the observation altitudes (violet curve in Fig. 4). Within the mixed-phase layer (h2 to h1 in Fig. 3), SLW properties are derived collectively using FCDP measurements on flight legs 3, 4, and 5. We uniformly prescribe the mean values for a SLW concentration of 0.05 g m−3 (Fig. 5) and a characteristic droplet diameter of 22 µm within the mixed-phase layer.

Figure 4Vertical wind velocity measurements from the Turbulent Air Motion Measurement System (TAMMS) during P-3 flight legs indicating lower to upper quartiles in the boxed regions, 10th and 90th percentiles at the whiskers, and medians at the vertical lines. A mean profile is fitted to the flight level mean values (white markers).

Figure 5Histogram of liquid water content (LWC) measurements from the Fast Cloud Droplet Probe (FCDP) during P-3 flight legs through mixed-phase cloud (4.9 to 3.6 km a.m.s.l.). Vertical bars indicate mean (0.05 g m−3) and perturbed-state values used for sensitivity simulations scaled from the mean by factors of 0.5 and 2.0.
Although we prioritize the use of observations for model constraint, several decisions are necessary regarding the parameterizations of modeled processes. With two exceptions, these parameterization decisions follow those discussed in DeLaFrance et al. (2024; see Sect. 2.3 and Appendix A). The first difference regards the aggregation process. Upon collision of two or more particles, a sticking efficiency parameter which scales from 0 to 1 is used to describe the probability of the particles merging, where an efficiency of 1 will always yield a union. The sticking efficiency parameterization follows Connolly et al. (2012), is dependent on temperature, and maximizes at −15 °C. In testing, however, we found that the maximum likelihood estimate (MLE) values of Connolly et al. (2012; see Fig. 14b) yielded lower concentrations of large particles than were observed. Alternatively, the use of a higher efficiency value inspired by the upper extent of their confidence interval yielded a more observationally consistent PSD evolution and maximum particle sizes. Therefore, aggregation is introduced at 6 km a.m.s.l. (Fig. 3) with a sticking efficiency of 0.9 at −15 °C and linearly decreases to 0.5 at −10 °C, remaining constant at 0.5 between −10 and 0 °C. The second parameterization decision which differs from DeLaFrance et al. (2024) regards riming where a continuous approach was used in favor of a stochastic approach, although they describe only minor differences between the two approaches. In the present analysis, we find a slightly reduced collection of rime mass using the continuous parameterization when compared to the stochastic parameterization. Applying the continuous parameterization approach, particles accumulate a mean rime fractional mass of 0.49 by the time they reach 3.6 km a.m.s.l. (flight leg 5, immediately above the melting level), whereas, when applying the stochastic parameterization, a rime fractional mass of 0.55 is accumulated. Visual assessment of the in situ particle imagery indicated that the stochastic method produces a more observationally consistent riming evolution. Therefore, the stochastic riming parameterization is used in all the simulations.
3.3 Control simulation assessment
The objective of a control simulation is to produce an evolution of a population of particles within a vertical column that is physically consistent with the observed cloud profile. In Fig. 6, we compare the control simulation PSD to the mean observed PSD (D ≥ 0.7 mm). Although PSD measurements at smaller particle sizes are unavailable for this flight, the approximately Lagrangian aircraft sampling yielded a temporally consistent evolution of the PSD at larger sizes. Measurements from flight leg 1 are used to assess the simulation during the particle initialization stages within the uppermost region of the model, whereas measurements collected downstream on flight legs 2 through 6 are used to assess the simulation performance during the later stages of particle evolution. The model produces an initial particle population at 6.5 km a.m.s.l. (Fig. 6a) that is consistent with the mean observations at large particle sizes and follows the assumed Gamma distribution form at small sizes. Flight leg 5 (Fig. 2a), at approximately 3.6 km a.m.s.l., had the lowest altitude flown before reaching the melting level. At this altitude, evaluation of the simulation shows skill in evolving this initial particle population by deposition, aggregation, and riming processes throughout a nearly 3 km deep cloud layer.

Figure 6Particle size distributions (PSDs) of ice mass for observed 1 Hz and mean values derived from (a) P-3 flight leg 1 at 6.5 km a.m.s.l. and (b) flight leg 5 at 3.6 km a.m.s.l. (see Fig. 2) and for the control simulation at equivalent altitudes.
Particle growth between 6.5 km (Fig. 6a) and 3.6 km a.m.s.l. (Fig. 6b) through aggregation and to a lesser extent depositional growth is expressed in the shift of the observed PSD to larger particle sizes. This evolutionary characteristic is reproduced by the control simulation, although slightly larger maximum particle sizes are generated and the ice mass may be underrepresented among particles smaller than about 2 mm in diameter. We note, however, that the sizing uncertainty in the observed measurements is greater at these small sizes owing to the relatively coarse pixel resolution of 150 µm for the HVPS probe (Bansemer et al., 2022). To further validate the control simulation and to assess the continuous particle evolution throughout the vertical profile, Z is estimated from the simulated PSD and compared to the HIWRAP Ku-band measurements.
Figure 7 shows the median observed vertical profile of Z and VD computed from downstream flight legs 2 through 6, as indicated in Fig. 2a. Data from the lowest 500 m were removed due to noise from ground clutter. From the observed vertical profiles, several inferences are made about the microphysical processes. Beginning at 6 km a.m.s.l., Z rapidly increases with descent, which is expected with an onset of aggregation. The rate of increase in Z with descending height reaches a relative maximum near 5.5 km a.m.s.l. (Fig. 7a), coincident with an apparent acceleration of VD. Within the subsequent 1 km (5.5 to 4.5 km a.m.s.l.), VD becomes increasingly negative (−0.72 to −1.00 m s−1) as particle fall speeds increase (Fig. 7b). This effect is assumed to be associated with the onset of riming and, subsequently, changes in particle densities. Particle melting begins near 3.4 km a.m.s.l., at which point a bright-band signature is apparent and VD rapidly accelerates. Below the bright band, Z remains nearly constant at about 25 dBZ and VD is about −5 m s−1.

Figure 7Vertical profiles of (a) radar reflectivity and (b) Doppler velocity at Ku-band for the control simulation (blue lines) and observed median (dashed black lines) from ER-2 HIWRAP radar during flight legs 2–6 (see Fig. 2a, magenta segments). Data for the observed profile below 500 m a.m.s.l. are omitted due to ground clutter. A dotted line at 5.5 km a.m.s.l. indicates the onset of riming, and a dash-dotted line indicates the 0 °C height. Also shown on the right are the surface rain rate values from the control simulation (blue) and observed at KBOS (black) between 13:00 and 18:00 UTC on 4 February 2022; horizontal bar lengths illustrate magnitude differences.
The vertical profile of Z is reproduced well by the control simulation, particularly above the melting level (Fig. 7a), which suggests confidence in its prescriptive configuration. Upon melting, Z is overestimated by the control simulation and maintains a bias of about 2 to 5 dB throughout the warm layer. While an evaluation of warm rain processes is beyond the scope of the present study, it is possible that this overestimation in Z results from an incomplete representation of warm rain processes by the model, such as droplet breakup and shedding, or from uncertainties in the scattering estimates. Confirmation of an attributable mechanism would be challenging without in situ observations below the melting level. Rain rates at the surface are one common model validation metric. Because the aircraft sampling occurred primarily offshore (see Fig. 2a), an ideally situated ground site is unavailable. However, we find comparison with a nearby ground site useful for determining whether the control simulation produces physically realistic estimates that are representative of the rainfall across the broader region. At the surface, during aircraft sampling (13:00 to 18:00 UTC), the nearest ground site, KBOS, reported a rain rate of 1.42 mm h−1. The control simulation produces about 25 % more surface rain with an average rain rate of 1.77 mm h−1.
Despite the confidence in Z aloft, we find that VD is underestimated by about 0.5 to 1 m s−1 in the control simulation but within an uncertainty range of ±1 m s−1 (Matthew McLinden, personal communication, 25 April 2024) for the HIWRAP Ku-band VD measurements. Some of the uncertainty in the VD measurements is due to corrections necessary for the aircraft motion, which, although unlikely to significantly affect the relative evolution of VD with height, may yield an absolute magnitude bias. This bias between the observed and simulated VD is consistent throughout the column, suggesting that this consistent bias may be explained, to a large extent, by those uncertainties in the observations. More importantly for this analysis, the relative changes in VD with height, which have process-based implications, are similar between the observed and simulated profiles.
A principal advantage of the particle-based design of the McSnow model is that information about microphysical properties is retained by the model at the scale of the individual particles. For particles in the control simulation, the onset of riming at 5.5 km a.m.s.l. (h2 in Fig. 3) initiates a change in the physical evolution of the particles with subsequent sedimentation. At 3.6 km a.m.s.l., the particles have accumulated a mean rime fractional mass of 0.55, increasing the total precipitation mass and accelerating its fallout rate. Radar scattering by the particle, expressed by Z, is also modified by rime accumulation, yet these effects are difficult to distinguish from concurrent processes, including deposition and aggregation. To investigate these scattering implications, we estimate the vertical profile of Z with and without contributions of rime mass.
Figure 8 compares Z from the control simulation (as in Fig. 7a) to an unrimed estimate of Z obtained by subtracting the rime mass from the particles and recomputing their scattering properties. Removal of rime mass appears to significantly impede further increases in Z with descending height below 5.5 km a.m.s.l. Near the melting level, Z is reduced from 20.07 to 13.03 dBZ between the control simulation and unrimed estimate, suggesting that the accumulated rime mass contributes about 35 % of the total Z (dB). This calculation, however, only considers the implications of riming for radar scattering; the complex interactions of concurrent processes are neglected by solely removing the rime mass from evolved particles in the control simulation. Additionally, the effects on VD, which manifest cumulatively during riming, cannot be investigated in the same manner. To explicitly investigate the effects of riming on the radar profiles and to distinguish these effects from concurrent processes, we introduce several sensitivity simulations which independently perturb the riming or aggregation processes.

Figure 8As in Fig. 7a but with an added vertical profile (in green) for estimated reflectivity (Z) with the particle rime mass removed. Shown on the right are the simulated and observed Z values computed at 3.6 km a.m.s.l.; the horizontal bar lengths illustrate magnitude differences.
Table 1Descriptions and perturbations relative to the control simulation applied for each simulation.

Although the southern regions of the 4 February 2024 event were predominantly stratiform, variations in the mixed-phase-layer LWC were observed (Fig. 5). Within sufficiently deep mixed-phase layers, prior model simulations have demonstrated that small (e.g., < 0.05 g m−3) perturbations in LWC alter particle fallout characteristics, which can yield substantial increases or decreases in the surface precipitation rate (DeLaFrance et al., 2024). Here, we similarly introduce two sensitivity simulations perturbing LWC within the mixed-phase layer (h1 to h2 in Fig. 3) within the range of observed LWC (Fig. 5). In the control simulation, we prescribed the mean observed LWC value of 0.05 g m−3. A scaling factor of 2 relative to the control is used to prescribe a high concentration (0.1 g m−3) for the “high_SLW” simulation and a low concentration (0.025 g m−3) for the “low_SLW” concentration. As a limiting case which is analogous to the removal of rime mass (Fig. 8), we construct a “no_riming” simulation with the riming process inactive. A brief summary of these riming sensitivity simulations is provided in Table 1.
Vertical profiles of Z and VD for the high_SLW, low_SLW, and no_riming sensitivity simulations relative to the control are shown in Fig. 9. Complete removal of the riming process in the no_riming simulation (Fig. 9a) produces a similar Z profile to that found by computing Z for equivalent unrimed particles from the control simulation (Fig. 8). This result underscores the significant sensitivity of Z to changes in particle mass during riming, despite concurrent microphysical processes. Perturbing LWC by factors of 2 and 0.5 in the high_SLW or low_SLW simulations, respectively, relative to the control produces opposing but similar (in magnitude) changes in Z (Fig. 9a), indicating a regularity in the response of Z to SLW variability. Similarly, the effects of SLW variability on VD demonstrate a regular response (Fig. 9b). We note that these simulation responses in Z and VD to SLW variability assume that the particles are well mixed such that probabilistic collision of ice crystals and SLW droplets is the same throughout the layer.
As discussed in Sect. 3.3, remote sensing measurements of VD, including those from the HIWRAP radar used throughout this study, are subject to magnitude biases. Nonetheless, as with Z, the relative magnitude changes in VD with height demonstrate a sensitivity to the riming process. In the high_SLW simulation, the rate of further VD acceleration with descent below 5.5 km a.m.s.l. is nearly doubled relative to the control. Conversely, below about 5 km a.m.s.l., further increases in VD cease in the low_SLW simulation and a decrease in VD occurs in the no_riming simulation. As a result of rime accumulation in the control simulation, VD immediately above the melting level (3.6 km a.m.s.l.) increased by about 68 % relative to the no_riming simulation. Similarly, Z increased by about 44 %. The competing effects of riming and aggregation processes on VD manifest in the low_SLW and no_riming simulations; riming accelerates the VD with mass accumulation, whereas, in the absence of riming, further aggregation yields larger, lower-density particles with reduced fall speeds. Consequently, vertical profiles of VD may provide an insight into dominant microphysical processes, which is consistent with the notion that rimed particles occupy a distinct region of the Doppler spectra (Kalesse et al., 2016). To advance the differentiation of particles evolved by riming, it is necessary to first consider the relative effects of variability in the aggregation process.
In our development of the control simulation for the 4 February 2022 event, the aggregation process was initially assumed to follow a temperature-dependent sticking efficiency identified as the MLE by Connolly et al. (2012; see Fig. 14b). Comparison with in situ PSDs indicated that the MLE sticking efficiency parameter was insufficient for generating observed concentrations of large particles, motivating the use of an increased sticking efficiency in the control simulation. However, to elucidate the effects of aggregation efficiency on radar profiles, we now consider a sensitivity simulation, “MLE_C12_agg”, which follows the MLE sticking efficiency of Connolly et al. (2012). Additionally, analogous to the design of the riming sensitivity simulations, we introduce a “low_C12_agg” simulation for which the sticking efficiency is further reduced from the MLE estimate by a factor of 0.5. Relative to the control simulation, the reduction in the sticking efficiency in the MLE_C12_agg and low_C12_agg sensitivity simulations lacks observational consistency with the presently analyzed 4 February 2022 event. However, it is useful to consider the implications of a realistic range of variability in the aggregation process efficiency to inform general distinctions from the effects of riming within vertical profiles of Z and VD.
Figure 10 shows the vertical profiles of Z and VD for the aggregation efficiency sensitivity simulations, MLE_C12_agg and low_C12_agg. Reducing aggregation efficiency suppresses the generation of large particles and, because of the strong dependency of radar backscatter on particle size, Z decreases relative to the control (Fig. 10a). Additionally, smaller aggregate particles become smaller targets for collision with SLW droplets to accumulate rime mass, which also reduces Z. The latter effect manifests in the reduced surface rain rates, decreasing by 38 % in MLE_C12_agg (1.10 mm h−1) and by 45 % in low_C12_agg (0.97 mm h−1) simulations relative to the control (1.77 mm h−1). Conversely, a reduction in aggregation efficiency has a minimal effect on VD for ice-phase particles (Fig. 10b). Above the melting level, at 3.6 km a.m.s.l., VD in the MLE_C12_agg simulation is reduced from the control simulation by about 4 %, and in the low_C12_agg simulation it is reduced by about 13 %. This relative insensitivity of VD to aggregation arises despite these sensitivity simulations assessing a broad range of possible sticking efficiencies. For example, at −15 °C, the sticking efficiency is reduced from 0.9 in the control to 0.32 in the low_C12_agg simulation and at −10 °C from 0.5 in the control simulation to 0.12 in the low_C12_agg simulation.

Figure 9As in Fig. 7 but for the control and riming-based sensitivity simulations: high_SLW, low_SLW, and no_riming. On the right are surface-simulated and observed surface rain rate values; the horizontal bar lengths illustrate magnitude differences.

Figure 10As in Fig. 7 but for the control and aggregation-based sensitivity simulations: MLE_C12_agg and low_C12_agg. On the right are surface-simulated and observed surface rain rate values; the horizontal bar lengths illustrate magnitude differences.
Below the melting layer, however, the effects of aggregation on VD become significant, decreasing by approximately 2 m s−1 between the control and low_C12_agg simulations. Similarly, the surface rain rate decreases by about 45 % between the control and low_C12_agg simulations. Thus, despite the significant implications of the aggregation process for precipitation production and its fallout, its variations are not readily perceived in the vertical profiles of VD. This finding significantly differs from the robust sensitivity of VD to variations in the riming process. While variations in the aggregation and riming processes may manifest similarly in vertical profiles of Z, we find that VD is uniquely sensitive to riming. Thus, vertical profiles of VD show promise in identification of riming as a dominant ice-phase microphysical process, which is ambiguous in profiles of Z only.
Sensitivity in vertical profiles of both Z and VD owing to rime accumulation rates was previously shown by Kalesse et al. (2016) from bin model simulations by prescribing a fixed vertical profile of LWC then testing two different riming efficiency parameterizations. Their two simulations yielded similar vertical gradients in the Z and VD profiles but with differences in magnitude. They attributed these differences to assumptions about the physical morphology of the ice crystals with accretion of rime mass that had implications for their scattering properties. In our study, we uniquely provided an observational constraint to establish a control-state simulation and modeling framework for assessing impacts of riming and aggregation independently. By selecting a fixed riming parameterization for all simulations using this framework, we were able to assess Z and VD sensitivities attributable to LWC perturbations within the range of observed variability. We found that a small (≤ 0.05 g m−3) range of perturbations in the LWC produced substantial changes in the surface precipitation rate and a corresponding sensitivity in vertical profiles of Z and VD.
The sensitivities expressed in Doppler radar profiles to LWC perturbations are tied to the impact on bulk microphysical properties, especially the particle density ρe. In the deposition- and aggregation-prescribed region above 5.5 km a.m.s.l. (Fig. 11), ρe rapidly decreases with descending height due to the efficient aggregation of increasingly open-particle geometry. At 5.5 km a.m.s.l., riming is introduced and ρe approaches 0.02 g cm−3, remaining nearly constant until the melting level as a result of the competing effects of aggregation and riming. In the high_SLW simulation, the effects of riming dominate, whereby the gradient in ρe abruptly increases with descending height. Conversely, in the low_SLW and no_riming simulations, the effects of aggregation continue to dominate and ρe decreases further.
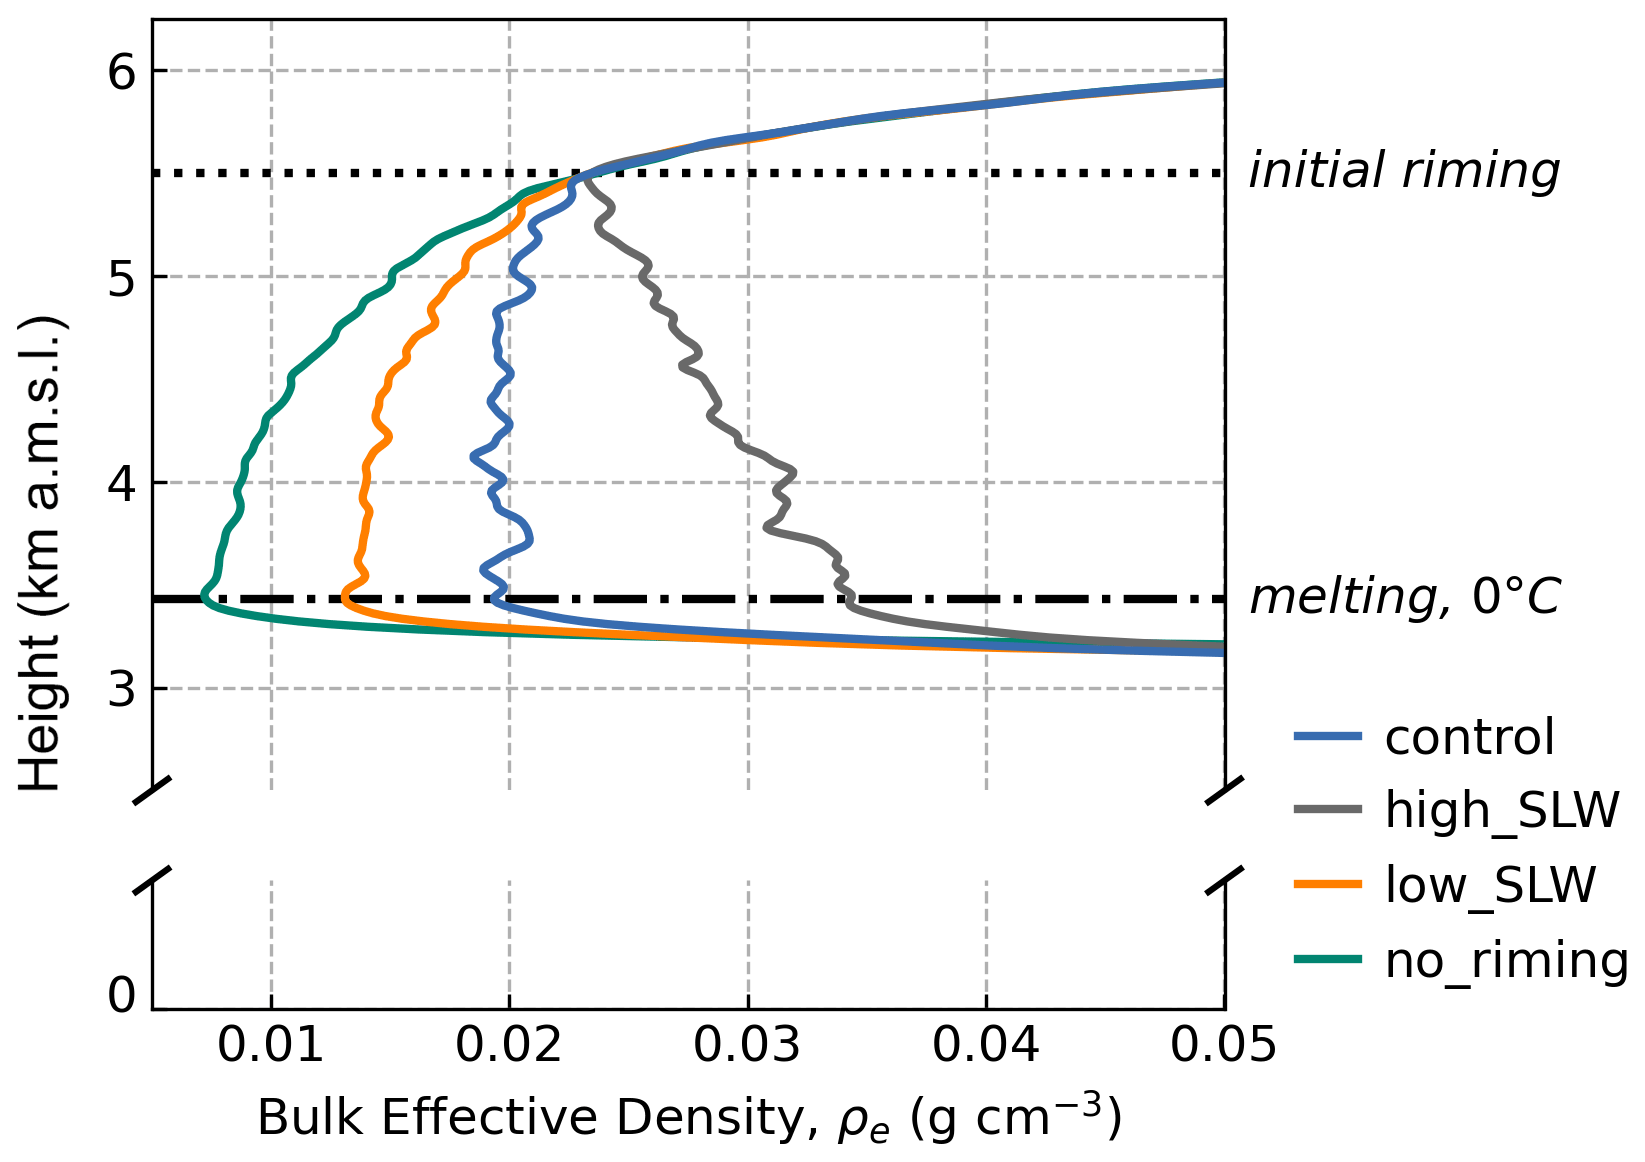
Figure 11Vertical profiles of bulk effective density, ρe, for the evolved particle population for the control simulation and the three riming-based sensitivity simulations described in Sect. 4: high_SLW, low_SLW, and no_riming. Calculations of ρe assume equivalent spherical volumes of the particles following Heymsfield et al. (2004).
Despite the opposing process-based effects on the evolution of ρe with height, our simulations suggest that the effects of aggregation and riming are not readily distinguished by Z from a Ku-band radar band alone. Riming may be detectable, however, from three-wavelength (Ku-, Ka-, and W-band) radar by leveraging differential attenuation effects. In prior idealized modeling simulations for rimed particle growth scenarios, Leinonen and Szyrmer (2015) identified unique signatures of riming by comparing dual-wavelength ratios (DWRs) between Ka- and W-bands with DWR at Ku- and Ka-bands. However, they found the magnitude of this signature to be modest and proposed that it would likely be difficult to accurately distinguish in observational data. Mason et al. (2019) later investigated the use of triple-frequency Doppler radar measurements from mixed-phase clouds during wintertime snow events to constrain the retrievals of bulk microphysical properties, including the PSD shape factor and ρe. They found that triple-wavelength Z measurements effectively constrained the PSD shape parameter but did not constrain ρe. Rather, VD measurements were necessary for identifying transitions to rimed growth cloud regions and providing a constraint on ρe. Our findings demonstrate that this constraint on ρe is attributable to the unique density-dependent response in VD, expressly owing to variations in the riming process within mixed-phase cloud layers with concurrent riming and aggregational growth. Further, our findings suggest that, when combined with Z, coincident vertical profiling measurements of VD have utility in diagnosing riming as a dominant process within stratiform clouds from a single-wavelength radar.
The evolution of ice-phase precipitating particles within a mixed-phase stratiform cloud was simulated to evaluate the effects of riming on the PSD moments and assess the process-based implications for Doppler radar vertical profiles. In situ and remote sensing airborne observations collected during the IMPACTS field campaign for a prolonged wintry–mixed precipitation event over the northeastern US on 4 February 2022 were used to design and constrain a quasi-idealized 1D mean-state control simulation. Using the Lagrangian particle-based McSnow model, we defined an initial population of ice particles based on in situ measurements in the upper portion of the cloud. As those particles fell, initial evolution occurred by vapor deposition, followed by subsequent additions of aggregation and then riming within prescriptive observation-based layered regions. Radar scattering properties were estimated using a T-matrix forward operator, and vertical profiles of Z and VD were computed from the evolved PSD and then evaluated through comparisons with the airborne radar data. The effects of riming on PSD moments expressed through Z and VD were assessed from simulations which introduce small perturbations in cloud LWC within a range of observed variability. To distinguish effects of riming and aggregation, two additional sensitivity simulations were introduced to determine the unique implications of aggregational growth efficiency for Z and VD. Through these approaches, we found the following:
-
Ice-phase precipitation particle evolution in a mixed-phase wintertime storm cloud is well constrained by the 1D quasi-idealized McSnow model.
-
Despite modest supercooled liquid water concentrations, rime accumulation is estimated to account for 55 % of particle mass generated above the melting level, dominating the ice-phase contribution to precipitation rates.
-
Riming cumulatively increased radar reflectivity above the melting level by an estimated 44 % and Doppler velocity by 68 % and demonstrated significant sensitivity to small perturbations in supercooled liquid water concentrations.
-
Vertical profiles of radar reflectivity demonstrate similar sensitivities to riming and aggregation, but Doppler velocity is uniquely sensitive to riming-based perturbations through changes in particle density.
Constraining parameterized treatments of rimed particle evolution in numerical models is a known source of uncertainty in simulations of precipitation from bulk, bin, and Lagrangian particle-based models (e.g., Lin and Colle, 2011; Jensen and Harrington, 2015; Jensen et al., 2017; Brdar and Seifert, 2018). One objective of our analysis was to address this constraining need by quantifying precipitation sensitivities to riming in model simulations based on an observed range of variability in LWC. We found a difference of about 6 % in rime fractional mass accumulation in our control simulation, whether using a continuous or stochastic representation of riming with the McSnow model. This effect was expressed within a modeling framework using a quasi-idealized and steady-state 1D column with a homogeneous mixed-phase layer. This approach was appropriate for our intentionally selected region of the observed storm because of its idealistic layered vertical structure apparent in radar observations (Fig. 2b, c), along with its known presence of SLW based on in situ observations. However, in reality, processes are not neatly initiated at distinct levels (e.g., in convective areas). It is expected that increasing ambiguity will exist when distinguishing concurrent microphysical processes in these scenarios and, thus, our analysis did not assess the full natural range of complexity in mixed-phase precipitation processes.
While model schemes have become increasingly sophisticated, it is not clear that uncertainty in ice-based precipitation estimates has necessarily decreased, highlighting the need for judicious use of observations to advance constraints on modeled processes (e.g., Morrison et al., 2020). Because of the capacity for explicit process representation at the scale of individual particles, Lagrangian models (e.g., McSnow) may be ideally suited to addressing these challenges, especially when combined with datasets which prioritize observations that are consistent with the evolution of particles. This observational consideration was favored during the 4 February 2022 event, which was sampled by IMPACTS in an approximately Lagrangian manner. In this study, we focused on riming as a primary ice-phase process, but the northern region of the sampled storm observed significantly less SLW and rime accumulation, presenting a unique natural laboratory for evaluation of modeled aggregation. Sticking efficiencies during aggregation are highly uncertain and difficult to constrain from laboratory experiments (e.g., Connolly et al., 2012). However, as we demonstrated in our study, these have significant implications for the accuracy of the simulated Z and rain rates. Ongoing work involves curating the in situ measurements of particle evolution within this northern storm region to constrain Lagrangian particle-based simulations and assessing the ambient environmental dependencies (i.e., temperature and water supersaturation) and ranges of sensitivities associated with modeled aggregation.
All the field observation data from IMPACTS used in this study are accessible through the NASA Distributed Active Archive Center (https://doi.org/10.5067/IMPACTS/DATA101, McMurdie et al., 2019). Readers can find a complete description of the McSnow model and its availability in Brdar and Seifert (2018).
Specific data sets from the IMPACTS collection used in this study include: NCAR Particle Probes (https://doi.org/10.5067/IMPACTS/PROBES/DATA101, Bansemer et al., 2022), Automated Surface Observing System (https://doi.org/10.5067/IMPACTS/ASOS/DATA101, Brodzik, 2022a), GOES (https://doi.org/10.5067/IMPACTS/GOES/DATA101, Brodzik, 2022b), High Altitude Imaging Wind and Rain Airborne Profiler (https://doi.org/10.5067/IMPACTS/HIWRAP/DATA101, McLinden et al., 2022), Turbulent Air Motion Measurement System (https://doi.org/10.5067/IMPACTS/TAMMS/DATA101, Thornhill, 2022), and NOAA Soundings (https://doi.org/10.5067/IMPACTS/SOUNDING/DATA201, Waldstreicher and Brodzik, 2022).
All the authors contributed to the study design and methodology decisions. AD conducted the data curation and performed the simulations and computations from the model output. All the authors contributed to the evaluation and interpretation of the results. AD prepared the manuscript with contributions from all the co-authors.
The contact author has declared that none of the authors has any competing interests.
Publisher's note: Copernicus Publications remains neutral with regard to jurisdictional claims made in the text, published maps, institutional affiliations, or any other geographical representation in this paper. While Copernicus Publications makes every effort to include appropriate place names, the final responsibility lies with the authors.
The authors acknowledge the entire IMPACTS team for their excellence in the collection and distribution of the robust IMPACTS dataset. The authors thank Axel Seifert and Christoph Siewert for their support and feedback regarding application of the McSnow model. The authors also expressly thank Aaron Bansemer for processing of the microphysics probe data and helpful discussions regarding their application and limitations. NCAR provided resources for Andrew DeLaFrance to visit its Mesoscale and Microscale Meteorology Laboratory (host Andrew J. Heymsfield), which benefited the design and data curation for this analysis. We are grateful for the feedback received from two anonymous reviewers, which greatly improved this paper.
This research has been supported by the National Aeronautics and Space Administration (grant nos. 80NSSC21K1589, 80NSSC19K0338, and 80NSSC19K0397). Andrew J. Heymsfield is supported by the National Science Foundation.
This paper was edited by Greg McFarquhar and reviewed by two anonymous referees.
Bailey, M. P. and Hallett, J.: A Comprehensive Habit Diagram for Atmospheric Ice Crystals: Confirmation from the Laboratory, AIRS II, and Other Field Studies, J. Atmos. Sci., 66, 2888–2899, https://doi.org/10.1175/2009JAS2883.1, 2009.
Bansemer, A., Delene, D., Heymsfield, A., O'Brien, J., Poellot, M., Sand, K., Sova G., Moore J., and Nairy, C.: NCAR Particle Probes IMPACTS, Dataset available online from the NASA Global Hydrometeorology Resource Center DAAC, Huntsville, Alabama, USA [data set], https://doi.org/10.5067/IMPACTS/PROBES/DATA101, 2022.
Bjerknes, J.: Extratropical Cyclones, in: Compendium of Meteorology, edited by: Malone, T. F., American Meteorological Society, Boston, MA, 577–598, https://doi.org/10.1007/978-1-940033-70-9_48, 1951.
Bohren, C. F. and Huffman, D. R.: Absorption and Scattering of Light by Small Particles, John Wiley and Sons, New York, 530 pp., ISBN 3527618163, 1983.
Brdar, S. and Seifert, A.: McSnow: A Monte-Carlo Particle Model for Riming and Aggregation of Ice Particles in a Multidimensional Microphysical Phase Space, J. Adv. Model Earth Syst., 10, 187–206, https://doi.org/10.1002/2017MS001167, 2018.
Bringi, V., Seifert, A., Wu, W., Thurai, M., Huang, G.-J., and Siewert, C.: Hurricane Dorian Outer Rain Band Observations and 1D Particle Model Simulations: A Case Study, Atmosphere, 11, 879, https://doi.org/10.3390/atmos11080879, 2020.
Brodzik, S.: Automated Surface Observing System (ASOS) IMPACTS, Dataset available online from the NASA Global Hydrometeorology Resource Center DAAC, Huntsville, Alabama, USA [data set], https://doi.org/10.5067/IMPACTS/ASOS/DATA101, 2022a.
Brodzik, S.: GOES IMPACTS, Dataset available online from the NASA Global Hydrometeorology Resource Center DAAC, Huntsville, Alabama, USA [data set], https://doi.org/10.5067/IMPACTS/GOES/DATA101, 2022b.
Brown, P. R. A. and Francis, P. N.: Improved Measurements of the Ice Water Content in Cirrus Using a Total-Water Probe, J. Atmos. Ocean. Tech., 12, 410–414, https://doi.org/10.1175/1520-0426(1995)012<0410:IMOTIW>2.0.CO;2, 1995.
Chase, R. J., Nesbitt, S. W., and McFarquhar, G. M.: A Dual-Frequency Radar Retrieval of Two Parameters of the Snowfall Particle Size Distribution Using a Neural Network, J. Appl. Meteorol. Clim., 60, 341–359, https://doi.org/10.1175/JAMC-D-20-0177.1, 2021.
Cholette, M., Milbrandt, J. A., Morrison, H., Paquin-Ricard, D., and Jacques, D.: Combining Triple-Moment Ice with Prognostic Liquid Fraction in the P3 Microphysics Scheme: Impacts on a Simulated Squall Line, J. Adv. Model Earth Syst., 15, e2022MS003328, https://doi.org/10.1029/2022MS003328, 2023.
Colle, B. A., Garvert, M. F., Wolfe, J. B., Mass, C. F., and Woods, C. P.: The 13–14 December 2001 IMPROVE-2 Event. Part III: Simulated Microphysical Budgets and Sensitivity Studies, J. Atmos. Sci., 62, 3535–3558, https://doi.org/10.1175/JAS3552.1, 2005.
Connolly, P. J., Emersic, C., and Field, P. R.: A laboratory investigation into the aggregation efficiency of small ice crystals, Atmos. Chem. Phys., 12, 2055–2076, https://doi.org/10.5194/acp-12-2055-2012, 2012.
DeLaFrance, A., McMurdie, L. A., Rowe, A. K., and Conrick, R.: Effects of Riming on Ice-Phase Precipitation Growth and Transport Over an Orographic Barrier, J. Adv. Model Earth Syst., 16, e2023MS003778, https://doi.org/10.1029/2023MS003778, 2024.
Field, P. R., Hogan, R. J., Brown, P. R. A., Illingworth, A. J., Choularton, T. W., and Cotton, R. J.: Parametrization of Ice-Particle Size Distributions for Mid-Latitude Stratiform Cloud, Q. J. Roy. Meteor. Soc., 131, 1997–2017, https://doi.org/10.1256/qj.04.134, 2005.
Field, P. R., Heymsfield, A. J., and Bansemer, A.: Snow Size Distribution Parameterization for Midlatitude and Tropical Ice Clouds, J. Atmos. Sci., 64, 4346–4365, https://doi.org/10.1175/2007JAS2344.1, 2007.
Grecu, M., Olson, W. S., Munchak, S. J., Ringerud, S., Liao, L., Haddad, Z., Kelley, B. L., and McLaughlin, S. F.: The GPM Combined Algorithm, J. Atmos. Ocean Tech., 33, 2225–2245, https://doi.org/10.1175/JTECH-D-16-0019.1, 2016.
Hersbach, H., Bell, B., Berrisford, P., Hirahara, S., Horányi, A., Muñoz-Sabater, J., Nicolas, J., Peubey, C., Radu, R., Schepers, D., Simmons, A., Soci, C., Abdalla, S., Abellan, X., Balsamo, G., Bechtold, P., Biavati, G., Bidlot, J., Bonavita, M., De Chiara, G., Dahlgren, P., Dee, D., Diamantakis, M., Dragani, R., Flemming, J., Forbes, R., Fuentes, M., Geer, A., Haimberger, L., Healy, S., Hogan, R. J., Hólm, E., Janisková, M., Keeley, S., Laloyaux, P., Lopez, P., Lupu, C., Radnoti, G., De Rosnay, P., Rozum, I., Vamborg, F., Villaume, S., and Thépaut, J.: The ERA5 Global Reanalysis, Q. J. Roy. Meteor. Soc., 146, 1999–2049, https://doi.org/10.1002/qj.3803, 2020.
Heymsfield, A., Bansemer, A., Heymsfield, G., Noone, D., Grecu, M., and Toohey, D.: Relationship of Multiwavelength Radar Measurements to Ice Microphysics from the IMPACTS Field Program, J. Appl. Meteorol. Clim., 62, 289–315, https://doi.org/10.1175/JAMC-D-22-0057.1, 2023.
Heymsfield, A. J.: A Comparative Study of the Rates of Development of Potential Graupel and Hail Embryos in High Plains Storms, J. Atmos. Sci., 39, 2867–2897, https://doi.org/10.1175/1520-0469(1982)039<2867:ACSOTR>2.0.CO;2, 1982.
Heymsfield, A. J., Bansemer, A., Schmitt, C., Twohy, C., and Poellot, M. R.: Effective Ice Particle Densities Derived from Aircraft Data, J. Atmos. Sci., 61, 982–1003, https://doi.org/10.1175/1520-0469(2004)061<0982:EIPDDF>2.0.CO;2, 2004.
Holton, J. R. and Hakim, G. J.: An Introduction to Dynamic Meteorology, 5th edn., Elsevier: Academic Press, Amsterdam, 532 pp., ISBN 0123848679, 2012.
Iguchi, T., Seto, S., Meneghini, R., Yoshida, N., Awaka, J., Le, M., Chandrasekhar, V., Brodzik, S., and Kubota, T.: GPM/DPR Level-2 Algorithm Theoretical Basis Document, NASA Goddard Space Flight Center, https://www.eorc.jaxa.jp/GPM/doc/algorithm/ATBD_DPR_201811_with_Appendix3b.pdf (last access: May 2024), 2018.
Jensen, A. A. and Harrington, J. Y.: Modeling Ice Crystal Aspect Ratio Evolution during Riming: A Single-Particle Growth Model, J. Atmos. Sci., 72, 2569–2590, https://doi.org/10.1175/JAS-D-14-0297.1, 2015.
Jensen, A. A., Harrington, J. Y., Morrison, H., and Milbrandt, J. A.: Predicting Ice Shape Evolution in a Bulk Microphysics Model, J. Atmos. Sci., 74, 2081–2104, https://doi.org/10.1175/JAS-D-16-0350.1, 2017.
Kalesse, H., Szyrmer, W., Kneifel, S., Kollias, P., and Luke, E.: Fingerprints of a riming event on cloud radar Doppler spectra: observations and modeling, Atmos. Chem. Phys., 16, 2997–3012, https://doi.org/10.5194/acp-16-2997-2016, 2016.
Kneifel, S., Kollias, P., Battaglia, A., Leinonen, J., Maahn, M., Kalesse, H., and Tridon, F.: First Observations of Triple-Frequency Radar Doppler Spectra in Snowfall: Interpretation and Applications, Geophys. Res. Lett., 43, 2225–2233, https://doi.org/10.1002/2015GL067618, 2016.
Lawson, R. P., Stewart, R. E., Strapp, J. W., and Isaac, G. A.: Aircraft Observations of the Origin and Growth of Very Large Snowflakes, Geophys. Res. Lett., 20, 53–56, https://doi.org/10.1029/92GL02917, 1993.
Lawson, R. P., O'Connor, D., Zmarzly, P., Weaver, K., Baker, B., Mo, Q., and Jonsson, H.: The 2D-S (Stereo) Probe: Design and Preliminary Tests of a New Airborne, High-Speed, High-Resolution Particle Imaging Probe, J. Atmos. Ocean. Tech., 23, 1462–1477, https://doi.org/10.1175/JTECH1927.1, 2006.
Lawson, R. P., Gurganus, C., Woods, S., and Bruintjes, R.: Aircraft Observations of Cumulus Microphysics Ranging from the Tropics to Midlatitudes: Implications for a “New” Secondary Ice Process, J. Atmos. Sci., 74, 2899–2920, https://doi.org/10.1175/JAS-D-17-0033.1, 2017.
Leinonen, J.: High-level Interface to T-matrix Scattering Calculations: Architecture, Capabilities and Limitations, Opt. Express, 22, 1655, https://doi.org/10.1364/OE.22.001655, 2014.
Leinonen, J. and Szyrmer, W.: Radar Signatures of Snowflake Riming: A Modeling Study, Earth Space Sci., 2, 346–358, https://doi.org/10.1002/2015EA000102, 2015.
Leinonen, J., Lebsock, M. D., Tanelli, S., Sy, O. O., Dolan, B., Chase, R. J., Finlon, J. A., von Lerber, A., and Moisseev, D.: Retrieval of snowflake microphysical properties from multifrequency radar observations, Atmos. Meas. Tech., 11, 5471–5488, https://doi.org/10.5194/amt-11-5471-2018, 2018.
Li, L., Heymsfield, G., Carswell, J., Schaubert, D. H., McLinden, M. L., Creticos, J., Perrine, M., Coon, M., Cervantes, J. I., Vega, M., Guimond, S., Tian, L., and Emory, A.: The NASA High-Altitude Imaging Wind and Rain Airborne Profiler, IEEE T. Geosci. Remote, 54, 298–310, https://doi.org/10.1109/TGRS.2015.2456501, 2016.
Lin, Y. and Colle, B. A.: A New Bulk Microphysical Scheme That Includes Riming Intensity and Temperature-Dependent Ice Characteristics, Mon. Weather Rev., 139, 1013–1035, https://doi.org/10.1175/2010MWR3293.1, 2011.
Liu, G.: Approximation of Single Scattering Properties of Ice and Snow Particles for High Microwave Frequencies, J. Atmos. Sci., 61, 2441–2456, https://doi.org/10.1175/1520-0469(2004)061<2441:AOSSPO>2.0.CO;2, 2004.
Liu, G.: A Database of Microwave Single-Scattering Properties for Nonspherical Ice Particles, B. Am. Meteorol. Soc., 89, 1563–1570, https://doi.org/10.1175/2008BAMS2486.1, 2008.
Magono, C. and Lee, C. W.: Meteorological Classification of Natural Snow Crystals, J. Fac. Sci., Hokkaido University, Series 7, Geophysics, 2, 321–335, 1966.
Mason, S. L., Chiu, C. J., Hogan, R. J., Moisseev, D., and Kneifel, S.: Retrievals of Riming and Snow Density from Vertically Pointing Doppler Radars, J. Geophys. Res.-Atmos., 123, 13807–13834, https://doi.org/10.1029/2018JD028603, 2018.
Mason, S. L., Hogan, R. J., Westbrook, C. D., Kneifel, S., Moisseev, D., and von Terzi, L.: The importance of particle size distribution and internal structure for triple-frequency radar retrievals of the morphology of snow, Atmos. Meas. Tech., 12, 4993–5018, https://doi.org/10.5194/amt-12-4993-2019, 2019.
Matrosov, S. Y.: Modeling Backscatter Properties of Snowfall at Millimeter Wavelengths, J. Atmos. Sci., 64, 1727–1736, https://doi.org/10.1175/JAS3904.1, 2007.
McLinden, M., Li, L. Heymsfield, G. M., Coon, M. and Emory, A.: The NASA GSFC 94-GHz Airborne Solid-State Cloud Radar System (CRS), J. Atmos. Ocean. Tech., 38, 1001–1017, https://doi.org/10.1175/JTECH-D-20-0127.1, 2021.
McLinden, M., Li, L., and Heymsfield, G. M.: High Altitude Imaging Wind and Rain Airborne Profiler (HIWRAP) IMPACTS, Dataset available online from the NASA Global Hydrometeorology Resource Center DAAC, Huntsville, Alabama, USA [data set], https://doi.org/10.5067/IMPACTS/HIWRAP/DATA101, 2022.
McMurdie, L. A., Heymsfield, G., Yorks, J. E., and Braun, S. A.: Investigation of Microphysics and Precipitation for Atlantic Coast-Threatening Snowstorms (IMPACTS) Collection, NASA Global Hydrometeorology Resource Center DAAC, Huntsville, Alabama, USA [data set], https://doi.org/10.5067/IMPACTS/DATA101, 2019.
McMurdie, L. A., Heymsfield, G. M., Yorks, J. E., Braun, S. A., Skofronick-Jackson, G., Rauber, R. M., Yuter, S., Colle, B., McFarquhar, G. M., Poellot, M., Novak, D. R., Lang, T. J., Kroodsma, R., McLinden, M., Oue, M., Kollias, P., Kumjian, M. R., Greybush, S. J., Heymsfield, A. J., Finlon, J. A., McDonald, V. L., and Nicholls, S.: Chasing Snowstorms: The Investigation of Microphysics and Precipitation for Atlantic Coast-Threatening Snowstorms (IMPACTS) Campaign, B. Am. Meteorol. Soc., 103, E1243–E1269, https://doi.org/10.1175/BAMS-D-20-0246.1, 2022.
Mishchenko, M. I. and Travis, L. D.: Capabilities and Limitations of a Current FORTRAN Implementation of the T-matrix Method for Randomly Oriented, Rotationally Symmetric Scatterers, J. Quant. Spectrosc. Ra., 60, 309–324, https://doi.org/10.1016/S0022-4073(98)00008-9, 1998.
Mishchenko, M. I., Travis, L. D., and Mackowski, D. W.: T-matrix Computations of Light Scattering by Nonspherical Particles: A Review, J. Quant. Spectrosc. Ra., 55, 535–575, https://doi.org/10.1016/0022-4073(96)00002-7, 1996.
Moisseev, D., Von Lerber, A., and Tiira, J.: Quantifying the Effect of Riming on Snowfall Using Ground-Based Observations, J. Geophys. Res.-Atmos., 122, 4019–4037, https://doi.org/10.1002/2016JD026272, 2017.
Morrison, H. and Milbrandt, J.: Comparison of Two-Moment Bulk Microphysics Schemes in Idealized Supercell Thunderstorm Simulations, Mon. Weather Rev., 139, 1103–1130, https://doi.org/10.1175/2010MWR3433.1, 2011.
Morrison, H. and Milbrandt, J. A.: Parameterization of Cloud Microphysics Based on the Prediction of Bulk Ice Particle Properties. Part I: Scheme Description and Idealized Tests, J. Atmos. Sci., 72, 287–311, https://doi.org/10.1175/JAS-D-14-0065.1, 2015.
Morrison, H., Curry, J. A., and Khvorostyanov, V. I.: A New Double-Moment Microphysics Parameterization for Application in Cloud and Climate Models. Part I: Description, J. Atmos. Sci., 62, 1665–1677, https://doi.org/10.1175/JAS3446.1, 2005.
Morrison, H., Van Lier-Walqui, M., Fridlind, A. M., Grabowski, W. W., Harrington, J. Y., Hoose, C., Korolev, A., Kumjian, M. R., Milbrandt, J. A., Pawlowska, H., Posselt, D. J., Prat, O. P., Reimel, K. J., Shima, S., Van Diedenhoven, B., and Xue, L.: Confronting the Challenge of Modeling Cloud and Precipitation Microphysics, J. Adv. Model Earth Syst., 12, e2019MS001689, https://doi.org/10.1029/2019MS001689, 2020.
Novak, D. R., Bosart, L. F., Keyser, D., and Waldstreicher, J. S.: An Observational Study of Cold Season–Banded Precipitation in Northeast U.S. Cyclones, Weather Forecast., 19, 993–1010, https://doi.org/10.1175/815.1, 2004.
Oue, M., Kollias, P., Ryzhkov, A., and Luke, E. P.: Toward Exploring the Synergy Between Cloud Radar Polarimetry and Doppler Spectral Analysis in Deep Cold Precipitating Systems in the Arctic, J. Geophys. Res.-Atmos., 123, 2797–2815, https://doi.org/10.1002/2017JD027717, 2018.
Pruppacher, H. R. and Klett, J. D.: Microphysics of Clouds and Precipitation, 2nd rev. and enl. ed., Kluwer Academic Publishers, Dordrecht, Boston, 954 pp., https://doi.org/10.1007/978-0-306-48100-0, 1997.
Purcell, E. M. and Pennypacker, C. R.: Scattering and Absorption of Light by Nonspherical Dielectric Grains, Astrophys. J., 186, 705–714, https://doi.org/10.1086/152538, 1973.
Shima, S., Kusano, K., Kawano, A., Sugiyama, T., and Kawahara, S.: The Super-Droplet Method for the Numerical Simulation of Clouds and Precipitation: A Particle-Based and Probabilistic Microphysics Model Coupled with a Non-Hydrostatic Model, Q. J. Roy. Meteor. Soc., 135, 1307–1320, https://doi.org/10.1002/qj.441, 2009.
Skofronick-Jackson, G., Petersen, W. A., Berg, W., Kidd, C., Stocker, E. F., Kirschbaum, D. B., Kakar, R., Braun, S. A., Huffman, G. J., Iguchi, T., Kirstetter, P. E., Kummerow, C., Meneghini, R., Oki, R., Olson, W. S., Takayabu, Y. N., Furukawa, K., and Wilheit, T.: The Global Precipitation Measurement (GPM) Mission for Science and Society, B. Am. Meteorol. Soc., 98, 1679–1695, https://doi.org/10.1175/BAMS-D-15-00306.1, 2017.
Speirs, P., Gabella, M., and Berne, A.: A Comparison Between the GPM Dual-Frequency Precipitation Radar and Ground-Based Radar Precipitation Rate Estimates in the Swiss Alps and Plateau, J. Hydrometeorol., 18, 1247–1269, https://doi.org/10.1175/JHM-D-16-0085.1, 2017.
Thompson, G., Rasmussen, R. M., and Manning, K.: Explicit Forecasts of Winter Precipitation Using an Improved Bulk Microphysics Scheme. Part I: Description and Sensitivity Analysis, Mon. Weather Rev., 132, 519–542, https://doi.org/10.1175/1520-0493(2004)132<0519:EFOWPU>2.0.CO;2, 2004.
Thornhill, K. L.: Turbulent Air Motion Measurement System (TAMMS) IMPACTS, Dataset available online from the NASA Global Hydrometeorology Resource Center DAAC, Huntsville, Alabama, USA [data set], https://doi.org/10.5067/IMPACTS/TAMMS/DATA101, 2022.
Thornhill, K. L., Anderson, B. E., Barrick, J. D. W., Bagwell, D. R., Friesen, R., and Lenschow, D. H.: Air Motion Intercomparison Flights During Transport and Chemical Evolution in the Pacific (TRACE-P)/ACE-ASIA, J. Geophys. Res.-Atmos., 108, 2002JD003108, https://doi.org/10.1029/2002JD003108, 2003.
Tridon, F., Battaglia, A., Chase, R. J., Turk, F. J., Leinonen, J., Kneifel, S., Mroz, K., Finlon, J., Bansemer, A., Tanelli, S., Heymsfield, A. J., and Nesbitt, S. W.: The Microphysics of Stratiform Precipitation During OLYMPEX: Compatibility Between Triple-Frequency Radar and Airborne In Situ Observations, J. Geophys. Res.-Atmos., 124, 8764–8792, https://doi.org/10.1029/2018JD029858, 2019.
Uccellini, L. W. and Kocin, P. J.: The Interaction of Jet Streak Circulations during Heavy Snow Events along the East Coast of the United States, Weather Forecast., 2, 289–308, https://doi.org/10.1175/1520-0434(1987)002<0289:TIOJSC>2.0.CO;2, 1987.
Van Weverberg, K., Vogelmann, A. M., Morrison, H., and Milbrandt, J. A.: Sensitivity of Idealized Squall-Line Simulations to the Level of Complexity Used in Two-Moment Bulk Microphysics Schemes, Mon. Weather Rev., 140, 1883–1907, https://doi.org/10.1175/MWR-D-11-00120.1, 2012.
Waldstreicher, J. and Brodzik, S.: NOAA Sounding IMPACTS, Dataset available online from the NASA Global Hydrometeorology Resource Center DAAC, Huntsville, Alabama, USA [data set], https://doi.org/10.5067/IMPACTS/SOUNDING/DATA201, 2022.
Williams, C. R.: How Much Attenuation Extinguishes mm-Wave Vertically Pointing Radar Return Signals?, Remote Sens., 14, 1305, https://doi.org/10.3390/rs14061305, 2022.
Zaremba, T. J., Rauber, R. M., Heimes, K., Yorks, J. E., Finlon, J. A., Nicholls, S. D., Selmer, P., McMurdie, L. A., and McFarquhar, G. M.: Cloud-Top Phase Characterization of Extratropical Cyclones over the Northeast and Midwest United States: Results from IMPACTS, J. Atmos. Sci., 81, 341–361, https://doi.org/10.1175/JAS-D-23-0123.1, 2024.
Zhang, J., Howard, K., Langston, C., Vasiloff, S., Kaney, B., Arthur, A., Van Cooten, S., Kelleher, K., Kitzmiller, D., Ding, F., Seo, D.-J., Wells, E., and Dempsey C.: National Mosaic and Multi-Sensor QPE (NMQ) System: Description, Results, and Future Plans, B. Am. Meteorol. Soc., 92, 1321–1338, https://doi.org/10.1175/2011BAMS-D-11-00047.1, 2011.
- Abstract
- Introduction
- Winter storm observations
- Simulation design and validation
- Process-based contributions and sensitivities on Doppler radar vertical profiles
- Discussion
- Conclusions
- Code and data availability
- Author contributions
- Competing interests
- Disclaimer
- Acknowledgements
- Financial support
- Review statement
- References