the Creative Commons Attribution 4.0 License.
the Creative Commons Attribution 4.0 License.
 | 26 Sep 2024
A thermal-driven graupel generation process to explain dry-season convective vigor over the Amazon
Toshi Matsui
Daniel Hernandez-Deckers
Scott E. Giangrande
Thiago S. Biscaro
Ann Fridlind
Scott Braun
Large-eddy simulations (LESs) are conducted for each day of the intensive observation periods (IOPs) of the Green Ocean Amazon (GoAmazon) field campaign to characterize the updrafts and microphysics within deep convective cores while contrasting those properties between Amazon wet and dry seasons. Mean Doppler velocity (Vdop) values simulated using LESs are compared with 2-year measurements from a radar wind profiler (RWP) as viewed by statistical composites separated according to wet- and dry-season conditions. In the observed RWP and simulated LES Vdop composites, we find more intense low-level updraft velocity, vigorous graupel generation, and intense surface rain during the dry periods compared with the wet periods. To investigate coupled updraft–microphysical processes further, single-day golden cases are selected from the wet and dry periods to conduct detailed cumulus thermal tracking analysis. Tracking analysis reveals that simulated dry-season environments generate more droplet-loaded low-level thermals than wet-season environments. This tendency correlates with seasonal contrasts in buoyancy and vertical moisture advection profiles in large-scale forcing. Employing a normalized time series of mean thermal microphysics, the simulated cumulus thermals appear to be the primary generator of cloud droplets. When subsequent thermals penetrate the ice crystal layer, droplets within the thermals interact with entrained ice crystals, which enhances riming in the thermals. This appears to be a production pathway of graupel/hail particles within simulated deep convective cores. In addition, less-diluted dry-case thermals tend to be elevated higher, and graupel grows further during sedimentation after spilling out from thermals. Therefore, greater concentrations of low-level moist thermals likely result in more graupel/hail production and associated dry-season convective vigor.
- Article
(17984 KB) - Full-text XML
- BibTeX
- EndNote


Deep convection is a fundamental process of turbulence that drives the Earth's general circulation and regulates thermodynamic fields (Emanuel et al., 1994). Deep convection undergoes complex dynamical and microphysical processes throughout its life cycle; these processes appear as towering clouds visible from satellites in different parts of the world (Stephens et al., 2002). As a result, deep convection generates significant amounts of atmospheric latent heat, surface precipitation, and hydrometeors that reflect/absorb solar and infrared radiation, modifying atmospheric circulation and surface energy and mass fluxes (Hartmann, 2016). These complexities in deep convection and feedback processes pose significant challenges with respect to predicting weather and climate using numerical Earth system modeling across different scales (Grabowski and Petch, 2009; Sullivan and Voigt, 2021).
Characteristics of deep convection are unique in different seasons and geographic regimes affected by the local environment. One of the most straightforward yet most robust regime separation concepts is the land–ocean (L–O) contrast (Williams and Stanfill, 2002). Solar radiation increases the surface skin temperature over land more readily than over the ocean due to the smaller heat capacity of soils and vegetation compared with deep water bodies, thus producing stronger surface infrared flux and turbulent heat flux (Matsui and Mocko, 2014). This greater surface energy deepens planetary boundary layers that may trigger deeper convective clouds depending on the atmospheric profiles (Pielke, 2001). Overall, the continental environment tends to promote deeper convection with stronger, wider convective cores (Lucas et al., 1994; Wang et al., 2019), with suppressed warm-rain and enhanced cold-precipitation processes (Williams et al., 2005), often leading to unique drop size distribution characteristics and precipitation partitioning between convective and stratiform process outcomes in different geographic regions (e.g., Tokay and Short, 1996; Giangrande et al., 2012; Dolan et al., 2018).
Satellite observations similarly depict continental convective invigoration, as characterized by more frequent lightning flashes and heavily rimed particles aloft over land compared with over ocean (Williams et al., 2004; Zipser et al., 2006; Stolz et al., 2015; Matsui et al., 2016). Takahashi et al. (2017, 2021) showed that continental convection generally contains less-diluted cores than their oceanic counterparts, following an inverse relationship between convective core width and dilution rate. Similarly, Jeyaratnam et al. (2021) recently suggested that convective updraft and mass flux properties were distinctly different between tropical land and tropical oceanic convection using methods to estimate those properties that blend satellite observations with plume models. Hereafter, we define “convective vigor” by the enhanced cold-precipitation process characterized by larger rimed particles (graupel/hail) and large and copious raindrops in convective cores.
Representation of deep convective cloud land–ocean contrasts is still an ongoing challenge for global atmospheric models at a storm-resolving resolution (a few kilometers of horizontal grid spacing), partially owing to the poor representation of cloud dynamics (Matsui et al., 2016). Robinson et al. (2011) configured idealized simulation setups to investigate the “island” effect of convection with finer grid spacing (500 m or 1 km) and successfully simulated convective vigor equivalent to the observed microwave brightness temperature. Matsui et al. (2020) used a nested regional model with a 1 km grid spacing to compare midlatitude continental vs. tropical maritime storms and successfully reproduced land–ocean contrasts in hydrometeor identification profiles from polarimetric radars.
However, the statistical evaluation of simulated vertical velocity and association with convective vigor process (i.e., graupel/hail generation) have not yet been examined very well due to a lack of observations and detailed process-oriented model investigation, respectively. For example, mesoscale convective system (MCS) studies performed by Prein et al. (2022) and Ramos-Valle et al. (2023) have highlighted the challenges involved with attempting to represent continental convection within the constraints of limited observations while also attempting to establish optimal configurations as a function of model grid spacing for typical midlatitude (Oklahoma) and tropical continental (Amazon) conditions.
The 2-year measurements from the Green Ocean Amazon (GoAmazon) campaign provide unprecedented data on the vertical velocity of deep convection by the Atmospheric Radiation Measurement (ARM) user facility (ARM Mobile Facility – AMF; Martin et al., 2017; Giangrande et al., 2017). Recently, Giangrande et al. (2023) contrasted the thermodynamics and life cycle properties, including the vertical air velocity within isolated convective clouds observed during the Amazon wet and dry seasons, and found that dry-season convection exhibited more intense low-level updrafts and larger reflectivity associated with smaller convective cell areas than wet-season counterparts. Dry-season convection also tended to exhibit a shorter life cycle and often achieved maximum updraft and precipitation intensity at earlier life cycle stages than wet-season storms. Pre-convective thermodynamics profiles from those events revealed that the dry season showed a stronger deficit of dew-point temperature in the middle troposphere and higher values of mean-layer convective available potential energy (MLCAPE) at lower levels.
In addition to primary thermodynamic transitions between wet- and dry-season convective regimes (e.g., Giangrande et al., 2020), the Amazon dry seasons may experience larger concentrations of aerosols due to biomass burning that have recently been associated with potential secondary contributions to changes in storm precipitation properties and convective vigor (e.g., Lin et al., 2006; Wang et al., 2018; Öktem et al., 2023). Moreover, the Amazon dry (wet) season has long been suggested to promote a continental (maritime) convection contrast for a given thermodynamic profile and background aerosols (Williams et al., 2002). Typical land–ocean contrast is characterized by a “hot” continental surface (Williams and Stanfill, 2002) and sea-breeze type of mesoscale dynamics due to the thermal-patch effect (Robinson et al., 2011). Thus, instead of focusing on the complex nature of land–ocean contrast or other active vs. break monsoonal contrasts performed globally (e.g., Holland et al., 1986; Keenan and Carbone, 1992; Pope et al., 2009; Wu et al., 2009), the dry-season–wet-season contrasts over the Amazon Basin allow a unique emphasis on the impact of thermodynamic profiles and large-scale dynamics upon the formulation of convective vigor.
The main objective of this paper is to investigate the dry-season–wet-season contrast and potential changes in the evolution of deep convection cloud processes using a large-eddy simulation (LES) model and forward simulations of Doppler radar observations. This attempts to reveal dynamical and microphysical processes that explain the observed dry–wet contrasts, focusing on the bulk controls imposed by the background thermodynamic profiles and large-scale forcing. The motivation for these efforts is the argument that an improved understanding of these dry–wet contrasts should facilitate untangling the more complex processes of land–ocean contrasts in deep convection. For this study, we employ a series of daily LESs with bulk single-moment microphysics throughout the GoAmazon campaign dry- and wet-season intensive observation periods (IOPs) to characterize the dry-season–wet-season contrast in convection. These simulations are validated against the cumulative statistics of ground-based Doppler velocity measurements during those periods. A thermal tracking analysis is conducted to select golden cases from these dry- and wet-season LES runs to further investigate the physical process of convective vigor. This effort focuses on thermodynamic impacts and cloud dynamical roles in this paper, while the aerosol effects will be investigated in another study.
Section 2 describes the general methodology and tools, including radar profilers, LESs, instrumental simulators, large-scale meteorological forcing, and thermal tracking algorithms for this study. Section 3 shows the results of the dry–wet contrast in meteorological forcing, statistical composites of Doppler velocity, and thermal tracking analysis. Section 4 summarizes a thermal-driven process of dry-season convective vigor, its uncertainties, and future directions.
2.1 GoAmazon: radar wind profiler (RWP) observations
The primary datasets for this study are those collected by the 1290 MHz ARM radar wind profiler (RWP) operated during the US Department of Energy's ARM facility deployment during its “Observations and Modeling of the Green Ocean Amazon 2014–2015” (GoAmazon) campaign near Manaus, Brazil, from March 2014 through December 2015 (e.g., Martin et al., 2017). The RWP was configured for precipitation sampling that included frequent vertical pointing to collect conventional radar reflectivity factor Z and mean Vdop profiles through deep convective cells to approximately 17 km in altitude (e.g., Giangrande et al., 2013, 2016; Wang et al., 2019; Williams et al., 2023). For measurements collected at these ultrahigh frequencies and without the expectation of larger hail in Amazon deep convective storms (Liu and Zipser, 2015; Bang and Cecil, 2019), all radar estimates are assumed to be within Rayleigh scattering regimes, and measurements are unattenuated in rain. The RWP deployed during GoAmazon had a beamwidth of approximately 10°; thus, the horizontal measurement resolution is typically less than 1 km, with a 200 m vertical (bin, gate) resolution and 10 s intervals between consecutive radar profiles. All radar measurements were calibrated against a reference laser disdrometer collocated at the main AMF site during the campaign (e.g., Wang et al., 2018); the detailed calibration method is discussed in Williams et al. (2023).
For observation and simulation comparisons, the deep convective core is defined using thresholds applied to the observed and simulated RWP profiles: (1) column-maximum reflectivity is greater than 35 dBZ; (2) column-maximum Vdop is greater than 5 m s−1. The choice for these criteria is admittedly flexible, as model vs. observed Z thresholds, in particular, are not necessarily well-posed for convective–stratiform segregation, such as removing all stratiform cells (e.g., Steiner et al., 1995). Still, the additional velocity constraint afforded by the vertically pointing RWP and statistical representation of convective and stratiform composites seems to be reasonable (not shown here), noting that an attempt to apply thresholds for both observations and simulations is what is important here. A slightly different threshold does not alter the conclusions. Note that events on 19, 20, and 23 March 2014 as well as the 4 October 2014 cases from the dry-season IOP are clear examples of Amazon mesoscale convective systems (MCSs; e.g., Wang et al., 2019). Thus, these cases have also been removed from our statistical analysis to focus on isolated convective days.
2.2 GoAmazon LESs, forcing, and simulator
GoAmazon LES runs utilize the Goddard Cumulus Ensemble (GCE), a cloud-process model developed and improved at the NASA Goddard Space Flight Center (GSFC) over several decades (Tao et al., 2014). The GCE is driven by large-scale forcing (LSF) with cyclic boundary conditions to generate cloud dynamics and microphysics processes in Cartesian grid coordinates. No additional heat, moisture, or momentum enters the domain apart from that imposed by the LSF or solar/infrared radiative processes. In addition, GCE's anelastic dynamic core option allows faster integration (up to 1.5–2 times) of finer-resolution runs than its compressible dynamic core option.
GoAmazon LES runs use a 200 m horizontal grid spacing with 512 × 64 × 128 grids (x–y–z Cartesian coordinates) with a 2 s model time step. Vertical grid spacings stretch from near the surface level (starting from 44 m) and reach 200 m at around the 4 km level, not to exceed the horizontal resolution. Thus, the domain covers a 102 km × 12.8 km area; this “narrow-channel” domain setup intends to resolve three-dimensional large eddies (i.e., thermals) while minimizing computational cost in order to run LESs for the entire IOPs. In terms of model physics, the 1.5-order turbulent kinetic energy (TKE) scheme is used for subgrid turbulent mixing, and the Goddard radiation scheme is used for computing radiative flux and heating (Chou and Suarez, 1999, 2001; Matsui et al., 2018). The Goddard bulk one-moment six-class scheme (4ICE hereafter) has four ice classes and uses preset size and density mapping for snow, graupel, and hail (Lang et al., 2014; Tao et al., 2016). The 4ICE scheme has successfully generated a realistic L–O contrast of convective-core hydrometeor distributions compared to polarimetric radar retrievals in a previous study (Matsui et al., 2020). Furthermore, note that the one-moment scheme is unaffected by the background aerosol concentrations; thus, we can focus on the impact of thermodynamic and large-scale forcing on convective vigor in this study.
The LSF is derived from the variational analysis (VARANAL) approach, which is a broadly accepted method for generating large-scale forcing wherein data are collected and adjusted based on the vertical integration of the atmospheric mass, moisture, dry static energy, and momentum budgets (Zhang and Lin, 1997; Zhang et al., 2001; Xie et al., 2004). The VARANAL approach is applied to the GoAmazon field campaign using the ERA-Interim reanalysis (Dee et al., 2011) and constrained by the radar-based surface precipitation rate (Tang et al., 2016). The horizontal/vertical advective forcings, mean wind profiles, and surface heat fluxes from the GoAmazon LSF are used to drive the LES. These fields are interpolated and imposed as tendency terms at every model time step. Our previous research demonstrated that GCE reproduced the observed precipitation quite well when forced by the GoAmazon LSF (Tao et al., 2022). GoAmazon LESs are run from September to 10 October 2014, defined as the dry-season IOP, and from 14 February to 26 March 2014, defined as the wet-season IOP, as suggested by thermodynamic behaviors characteristic of larger dry- and wet-season expectations, respectively (Giangrande et al., 2017, 2020). Each daily LES is initialized at 24:00 LT (local time) from the LSF and integrated for just 30 h, rather than continuously integrated during the entire IOPs, because the convection life cycle typically follows a strong diurnal cycle due to the solar heating cycle, except for propagating organized convection (Tang et al., 2016; Giangrande et al., 2017, 2020). As a default setting, hourly LES outputs are used to analyze the mean seasonal behavior of LESs.
Hourly LES outputs include an additional Doppler velocity field, corresponding to an expected RWP observation through a multi-instrumental simulator, the Goddard Satellite Data Simulator Unit (G-SDSU; Matsui et al., 2014a, b). In this study, a ground-based Doppler radar simulator is implemented in the model to replicate RWP-observable signals. Radar backscatter is estimated from non-Rayleigh calculations with a Maxwell Garnett assumption of air–water–ice mixtures at 1290 MHz frequency, although for the RWP frequency, vertical pointing, and media type/size expectations therein, the forward modeling is more straightforward than most weather radar wavelength applications and appropriate for Rayleigh scattering assumptions. Doppler velocity is estimated using the pressure-adjusted hydrometeor terminal velocities weighted by the radar backscatter spectrum for each particle size distribution (PSD). All of these single-scattering calculations follow the 4ICE microphysics calculation/assumptions of particle size, density, and phase for each hydrometeor species for consistency (Matsui et al., 2014b). Finally, simulated signals are averaged to be consistent with the RWP beamwidth (10°). This beamwidth implies different averaging at different heights, for example, corresponding to the six horizontal grids of the LESs being averaged for a representative output at 15 km height. Overall, this beamwidth averaging smears LES-scale Doppler velocity signal statistics closer to the anticipated observed instrumental signals (Matsui et al., 2014b). However, it should be noted that the exact sampling methods are different between observations and simulations. For example, the RWP observations are vertically pointing measurements that collect profiles at 6 s (“instantaneous”) intervals. In contrast, the modeled RWP signals are drawn from a domain-wide sampling of hourly LES outputs.
2.3 Thermal tracking algorithm
The thermal tracking method used here is described in detail by Hernandez-Deckers and Sherwood (2016), who improved the initial version used by Sherwood et al. (2013). It is an offline algorithm that uses high-temporal-resolution output (∼ 1 min) from LESs to identify and track coherent rising volumes of cloudy air, i.e., thermals. The algorithm first identifies all peak vertical velocities larger than 0.8 m s−1 that have a water condensate content of at least 0.01 g kg−1 at every available snapshot of the simulation and matches peaks from successive snapshots to identify the available points of the trajectories of rising cloudy air parcels. A third-order polynomial is fitted to these points to reconstruct smooth trajectories and to allow a precise estimate of the ascent rate of the rising air volume at each snapshot. Notice that this ascent rate differs from the actual vertical velocity at a particular grid point, as thermals develop internal toroidal circulations such that the peak vertical velocity at their centers is higher than the actual ascent rate of the air volume (e.g., Blyth et al., 2005; Sherwood et al., 2013).
The extent of each rising air volume (the size of each thermal) is estimated assuming a spherical shape centered at its smoothed trajectory, ensuring that the average vertical velocity of the enclosed volume matches that obtained from the derivative of the trajectory. Tracked thermals must fulfill certain requirements; for example, they must be tracked for at least three time steps; their radius must be larger than 2 times the horizontal grid spacing; their time-averaged ascent rate must be at least 1 m s−1; their change in size in between successive snapshots must be less than 80 % of the smallest radius; and, most importantly, their trajectories must be consistent with their vertical momentum budget. The momentum budget of a tracked thermal is computed from its buoyancy (obtained from the density field), the pressure gradient force (obtained by integrating the pressure field over the entire thermal's surface), a “resolved mixing term” (obtained from the convergence of vertical momentum flux across the thermal's surface), and an entrainment or detrainment contribution due to the change in size between snapshots. This allows us to compute the expected final position of each thermal based only on its initial ascent rate, which is compared with the thermal's last tracked position. The distance between the actual and expected final positions must be smaller than the average thermal diameter and smaller than 20 % of the vertical distance traveled; otherwise, the thermal is discarded.
Once thermals are tracked with this algorithm, many properties can be studied based on all available model variables of interest. For example, average values for each thermal, such as ascent rate, size, altitude, and entrainment rate, are easily computed. Moreover, composites of different quantities can be obtained for different “stages” of a thermal's life cycle. Typically, thermals exhibit one maximum ascent rate throughout their lifetime, which indicates their most vigorous phase. This time step is used as a time reference (t = 0) common to all thermals to create composites of various properties at different stages of thermal lifetimes. Note that our tracking algorithm cannot analyze merging or splitting thermals, regardless of their occurrence. This limitation requires further study.
This thermal tracking algorithm was first used to study the main properties of cumulus thermals in simulations of convection with transient growth (Sherwood et al., 2013; Hernandez-Deckers and Sherwood, 2016) and provided strong evidence that thermals are typically small, short-lived (4–5 min on average), and mix vigorously with their environment. Furthermore, Hernandez-Deckers and Sherwood (2016) showed that the spherical shape approximation is generally valid and that thermals, rather than plumes, are a more realistic building block for cumulus clouds. Hernandez-Deckers and Sherwood (2018) used this algorithm to study the mixing properties of thermals in more detail and contrast them with known parameterizations. Results from these studies have set the stage for a deeper understanding of cumulus dynamics and for further studies that use different approaches (e.g., Gu et al., 2020; Morrison et al., 2020; Peters et al., 2020; Xu et al., 2021; Morrison et al., 2023). Recently Hernandez-Deckers et al. (2022) used this algorithm to study aerosol–deep convection interactions, highlighting the importance of the strong coupling between microphysics and small-scale dynamics in convective clouds. Here, we run this tracking algorithm with the GCE model output for 5 h starting at 19:00Z (15:00 LT) on 7 September 2014 (dry case) and 26 February 2014 (wet case), using 1 min interval output.
3.1 Dry–wet contrast in large-scale forcing
Campaign atmospheric thermodynamic profiles and the typical variability observed during GoAmazon dry and wet seasons have previously been depicted using composite radiosonde skew-T log-P diagrams (e.g., Giangrande et al., 2017, 2020, 2023). These depictions often show very similar temperature profiles between dry and wet seasons, whereas the moisture profiles indicate apparent differences, highlighting the mid-level deficit of the dew-point temperature profile in dry-season composites. As this study utilizes LSF to drive LESs, seasonal thermodynamics and dynamics are re-characterized by the LSF (Tang et al., 2016).
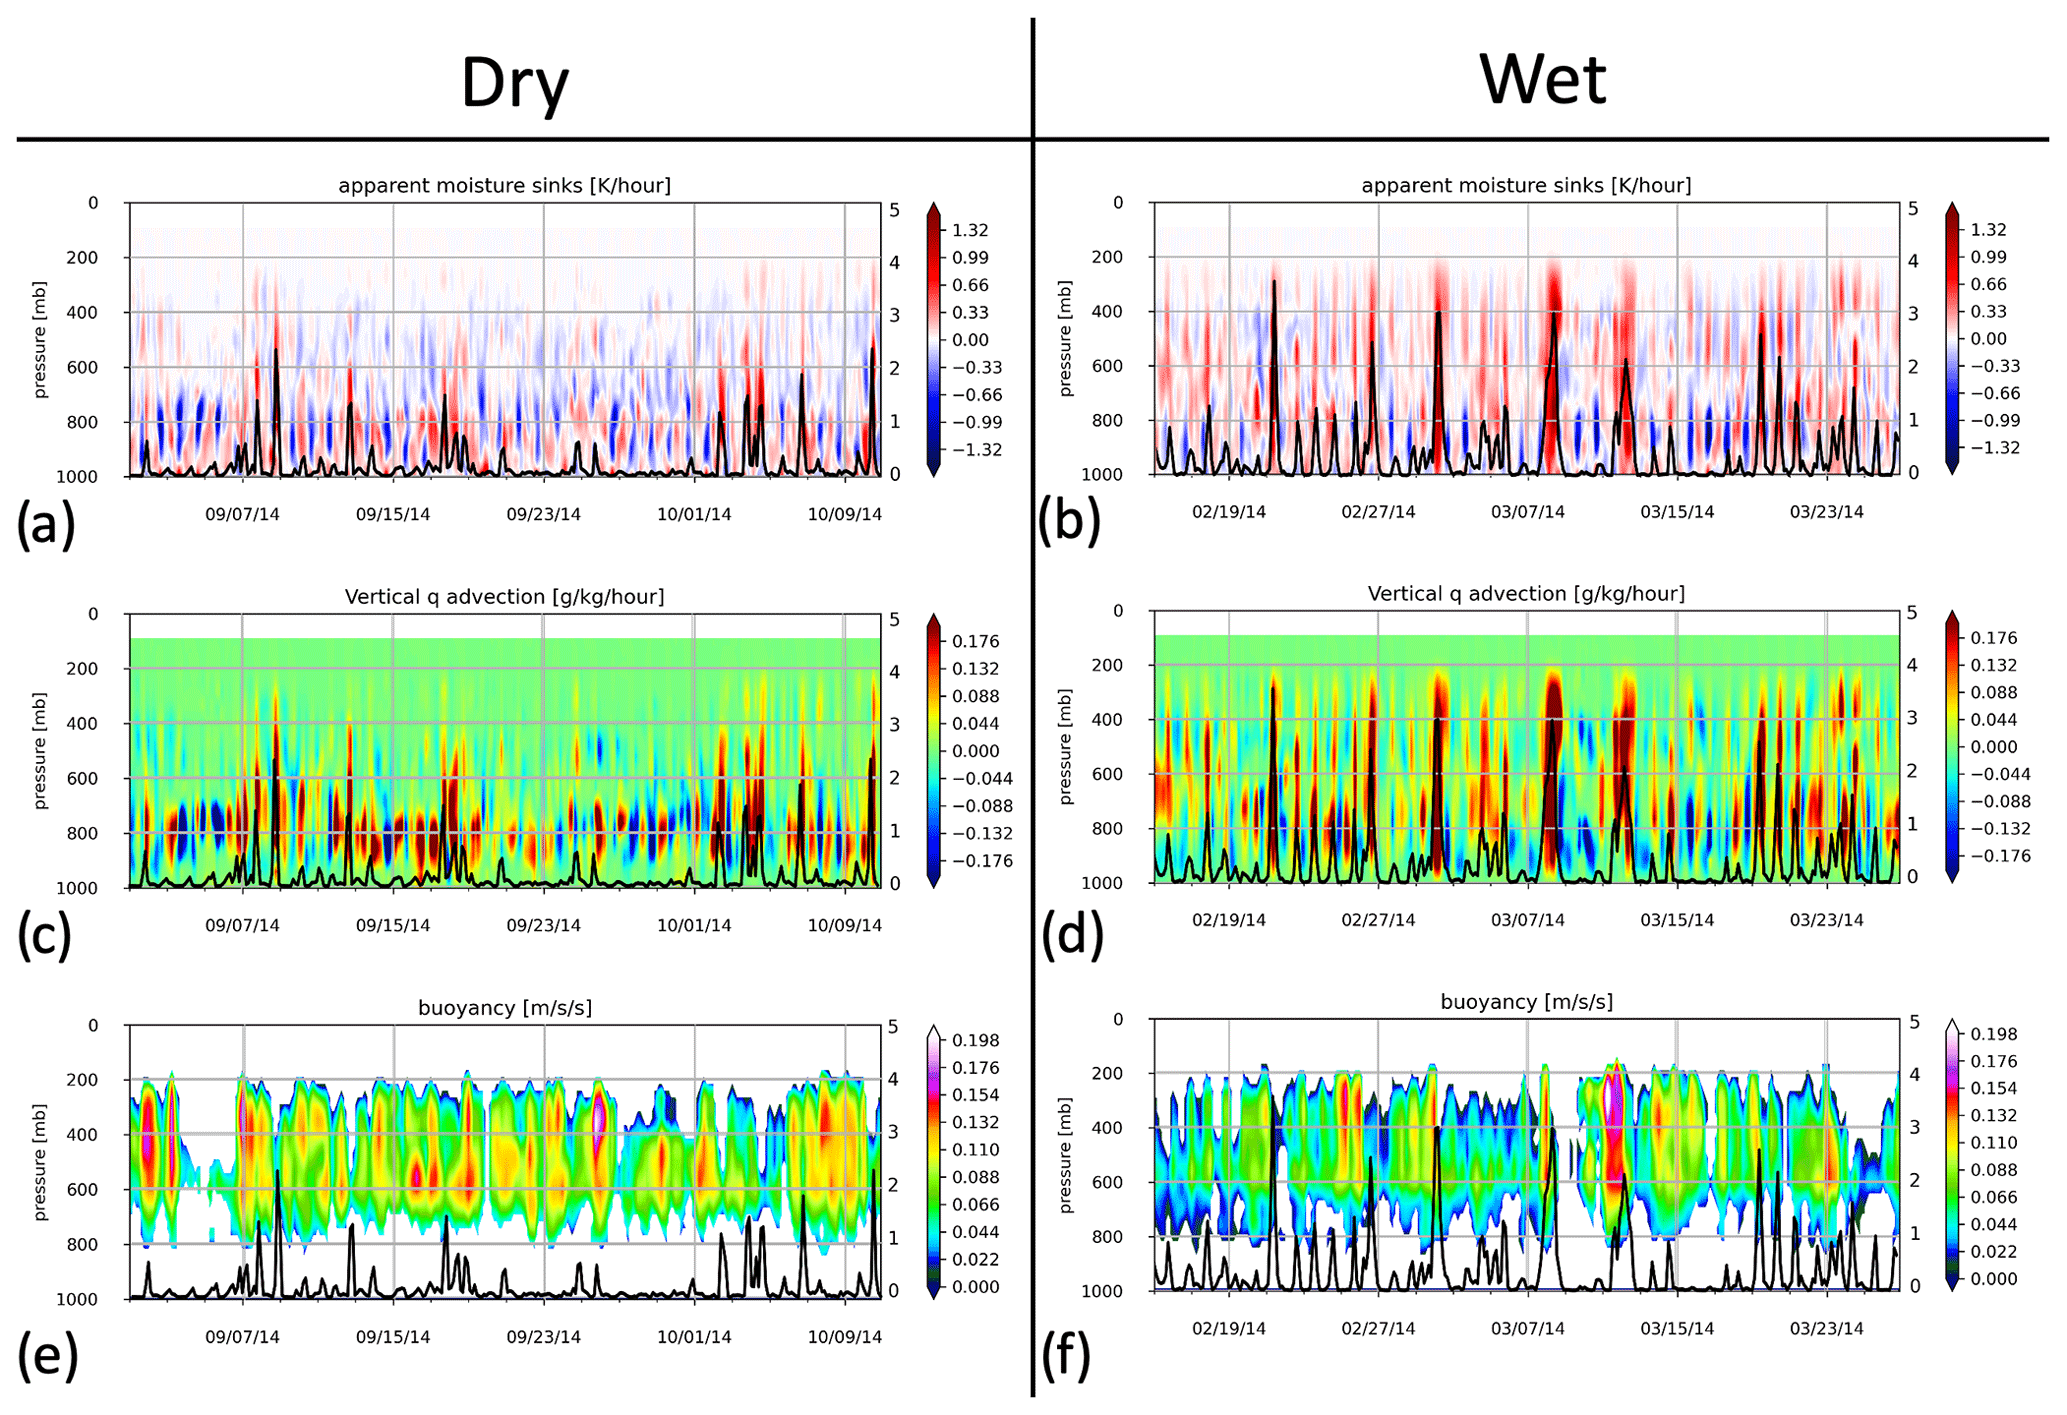
Figure 1Time series of VARANAL large-scale forcing profiles between wet and dry periods: (a–b) apparent moisture sink (Q2), (c–d) vertical moisture advection, and (e–f) potential buoyancy. The solid black lines on the secondary y axis represent the surface precipitation rate. The date format used in the figure is mm/dd/yyyy.
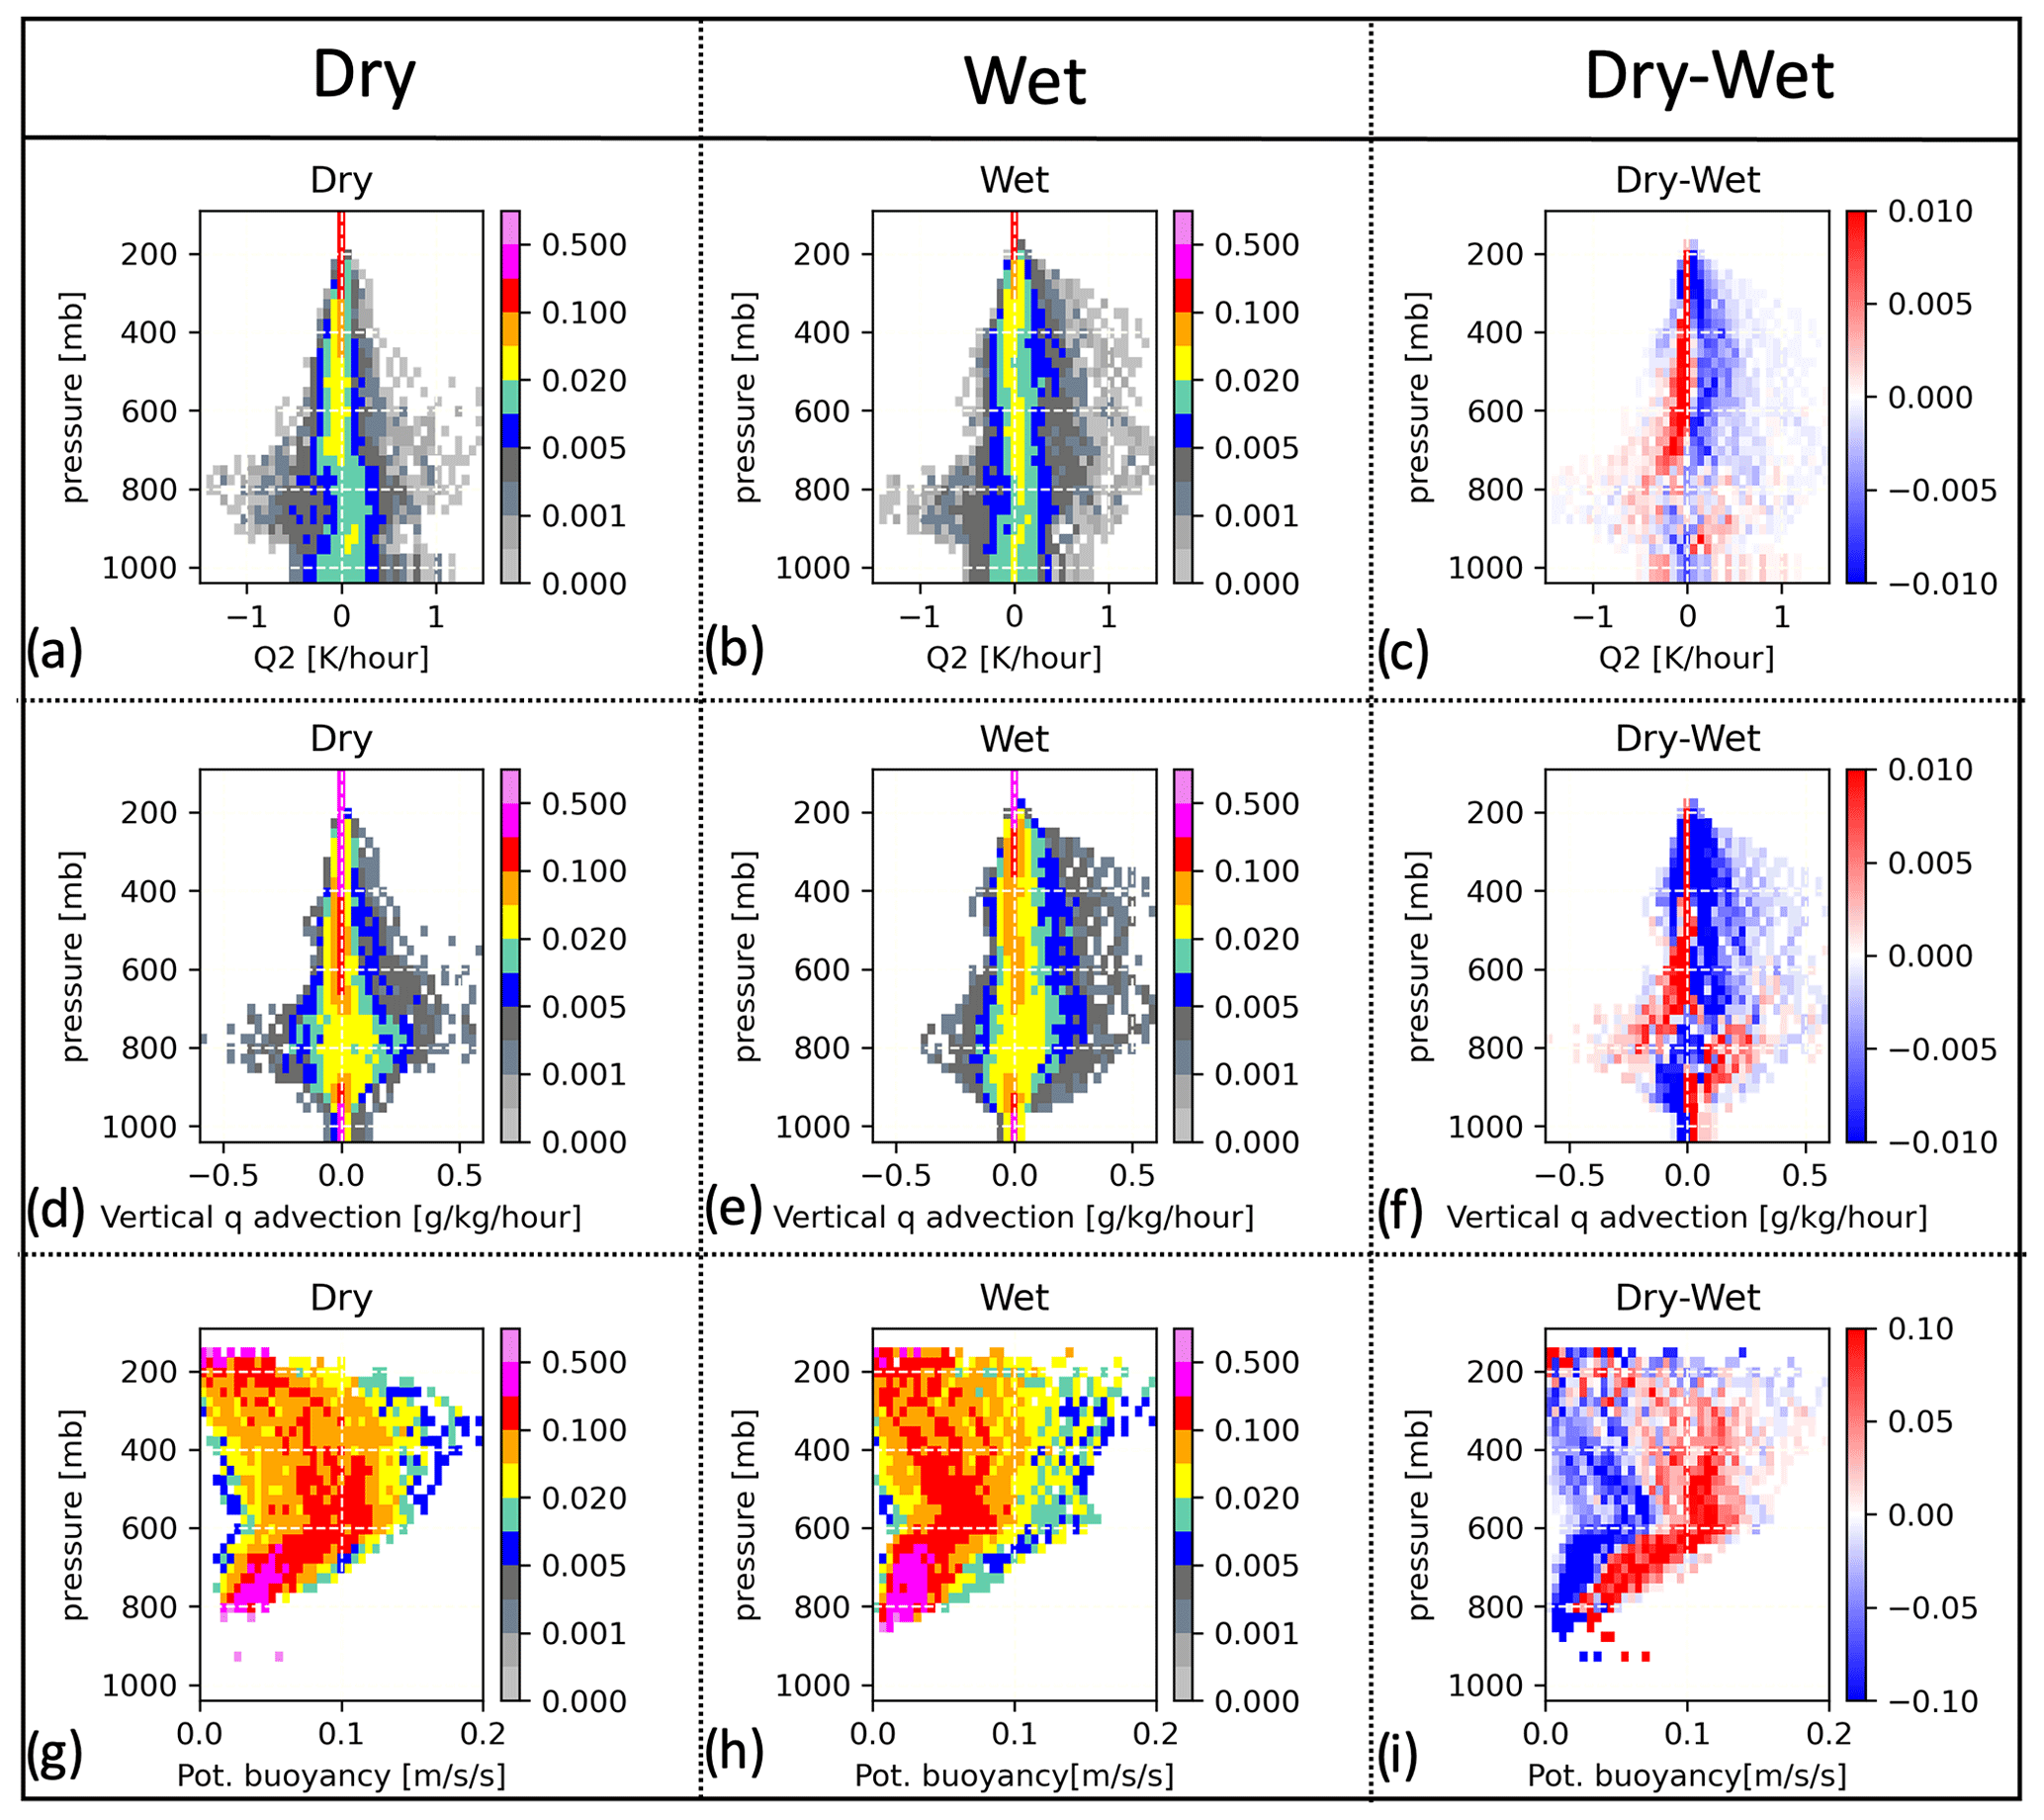
Figure 2Contoured frequency of altitude diagrams (CFADs) of (a–c) apparent moisture sink (Q2), (d–f) vertical moisture (q) advection, and (g–i) potential buoyancy integrated over dry and wet periods; the (c, f, i) dry–wet differences are also shown.
In Fig. 1, we plot a time series of apparent moisture sinks (Q2), vertical moisture advection, and parcel potential buoyancy profiles with surface precipitation rate from GoAmazon LSF for the IOPs. These time series of LSF profiles are integrated and contrasted in terms of contoured frequency by altitude diagrams (CFADs; Yuter and Houze, 1995) as the dry- and wet-season IOPs (Fig. 2).
Here, Q2 is the sum of changes in moisture content, horizontal moisture advection, and vertical moisture advection (Yanai et al., 1973), balanced with net condensation rate and turbulent transport of moisture vertical advection. Large Q2 corresponds to a large atmospheric moisture loss due to net condensation loss (i.e., precipitation). Large Q2 is associated with intervals with heavier or more widespread surface precipitation; thus, dry-IOP Q2 and surface precipitation are typically smaller than wet IOP (Fig. 1a, b). Similarly, Fig. 1c and d show that peaks in the vertical moisture advection term coincide with those peaks in the Q2 rate. Note that the Q2 rate in tropical environments is mainly contributed by the vertical moisture advection term, rather than the horizontal advection term (not shown here). More importantly, positive (red shade) vertical moisture advection of the wet IOP tends to be stretched up to a higher altitude (up to 200 millibar) than the dry IOP (up to 600 mb) in most cases.
As previously discussed by Tang et al. (2016), the associated Amazon Q2 CFADs show the largest positive Q2 between 700 and 400 mb, while the largest negative Q2 is around 800 mb (Fig. 2a, b). The dry–wet composite CFAD highlights more frequent positive Q2 values above the 800 mb level during the wet IOP. In contrast, more frequent negative Q2 values are found during the dry IOP (Fig. 2c). Vertical moisture advection depicts similar CFAD shapes (Fig. 2d, e). Still, it highlights high frequencies of low-level positive vertical moisture advection and intermediate- to low-level negative moisture vertical advection in the dry IOP in comparison with the wet IOP.
Finally, in Fig. 1e and f, we plot the time series of parcel potential buoyancy profiles (positive components only), computed from LSFs. These potential buoyancy magnitudes are not necessarily associated with precipitation intensity. Potential buoyancy CFADs show peak forcing between the 600 and 200 mb levels (Fig. 2g, h, and i). The wet IOP suggests a larger variability in the potential buoyancy in the upper troposphere than the dry IOP (Fig. 2g, h). Potential buoyancy appears to be slightly stronger in the dry IOP, and it is concentrated in a relatively lower troposphere than its wet-IOP counterpart (Fig. 2i), which agrees with the findings in Giangrande et al. (2023). These results will be further discussed along the thermal concentrations in the following section.
3.2 Dry–wet composite of Doppler velocity CFADs
Giangrande et al. (2023) highlighted the dry–wet seasonal characteristics of storm vertical air motions retrieved using an RWP. They found that isolated daytime dry-season convective cells tend to have stronger updrafts at altitudes below the melting level. Yet, unlike their wet-season counterparts, updrafts do not increase in intensity much above the melting layer. However, dry-season convective cores were also characterized by stronger downdrafts at all altitudes, especially when compared with their wet-season counterparts aloft. Our present study utilizes similar direct measurements of the mean Vdop from an RWP to characterize the dry–wet contrast in deep convective cores. The advantage of using Vdop measurements is that the quantity is the direct radar measurement and helps reduce uncertainties from retrieval assumptions, such as requiring hydrometeor identification or associated terminal fall speed corrections if the intent was to retrieve the vertical air motion (Giangrande et al., 2013, 2016). Here, vertically pointing Vdop measurements contain sufficient information to evaluate storm characteristics, with the understanding that these measurements represent the terminal velocities of hydrometeors combined with the vertical air motion.
In Fig. 3a, we provide the cumulative sample numbers of CFADs (for each bin of Vdop and altitude) as simulated and subsampled from the LES hourly outputs from the combined dry- and wet-season IOPs. If the sampling numbers are normalized for each altitude, the Vdop CFADs will be formed. Figure 3b shows the sum of hydrometeor mass concentrations from each Vdop–altitude bin. Namely, each hydrometeor mass concentrations from “cloud”, “rain”, “graupel–hail”, or “ice–snow” are separately accumulated for each bin. The larger number of samples associated with a larger accumulated mass concentration of hydrometeor can generate the “representativeness” of the hydrometeor class for a given Vdop–altitude bin location. Because Vdop is the sum of the vertical velocity of the air and the terminal velocity of hydrometeor particles weighted by their reflectivity, this plot facilitates understanding Vdop CFADs.
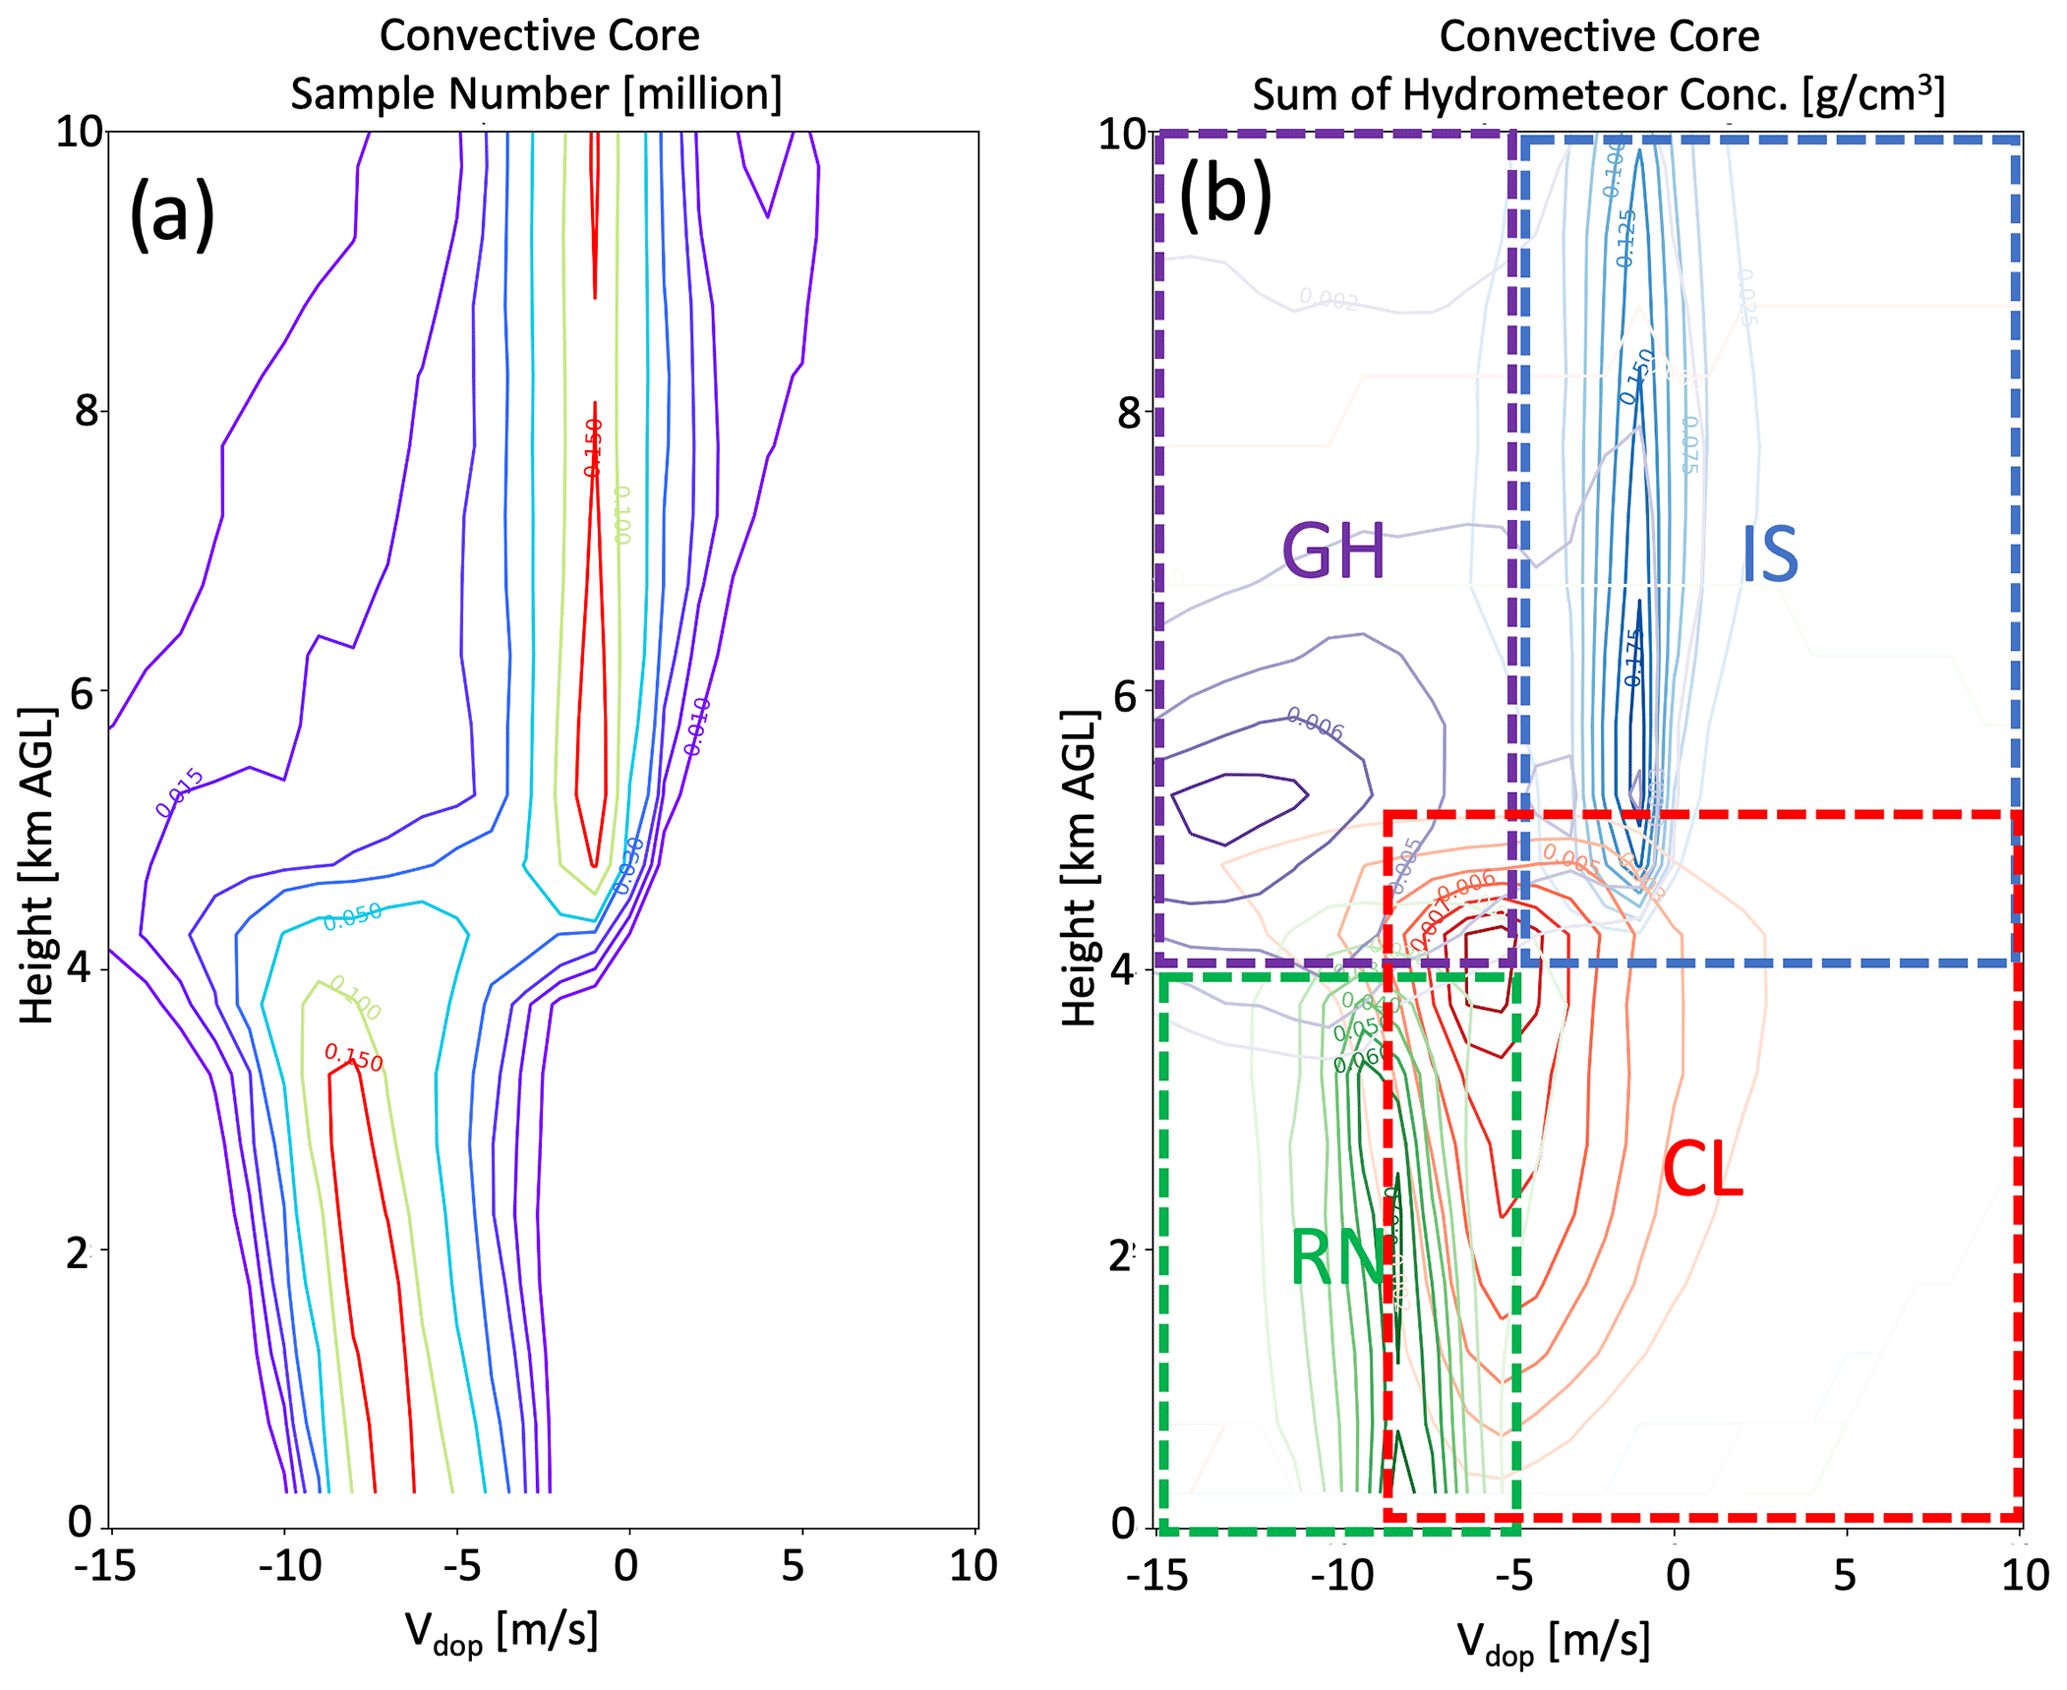
Figure 3(a) Cumulative Vdop sample numbers from LESs during dry and wet periods, presented as CFADs for each Vdop bin and altitude. (b) The cumulative hydrometeor mass concentrations from each Vdop–altitude bin. Red contours represent cloud (CL), green contours represent rain (RN), blue contours represent ice and snow (IS), and purple contours represent graupel and hail (GH).
As mentioned above, we defined four regimes based on the accumulated mass of each hydrometeor category. The cloud category (CL) is centered around −5 m s−1 of Vdop and 4 km altitude, slightly overlapping with other categories. The rain category (RA) is more narrowly concentrated around −8 m s−1 of Vdop and below 4 km altitude. The graupel–hail category (GH) is centered around −14 m s−1 of Vdop at 5 km altitude. Finally, the ice–snow category (IS) is narrowly concentrated along −1 m s−1 of Vdop above 5 km altitude. These locations roughly correspond to each hydrometeor category's altitude and terminal velocity when factoring in the background/ambient vertical air velocity. Note that our cloud regime has no terminal velocity in GCE 4ICE microphysics; thus, Vdop represents or tracks the background vertical air velocity and overlaps with the other regimes. Moreover, simulated Vdop and hydrometeor statistics are also sensitive to model physics and those assumptions to some degree. For example, any real-world cloud regime may be extended to higher altitudes, but the model 4ICE microphysics scheme tends to quickly convert the cloud liquid to a cloud ice category due to saturation adjustment (see Figs. 14–16 of Matsui et al., 2023). Nevertheless, this representative mapping will help discuss the variability in the Vdop CFADs between the dry- and wet-season IOPs.
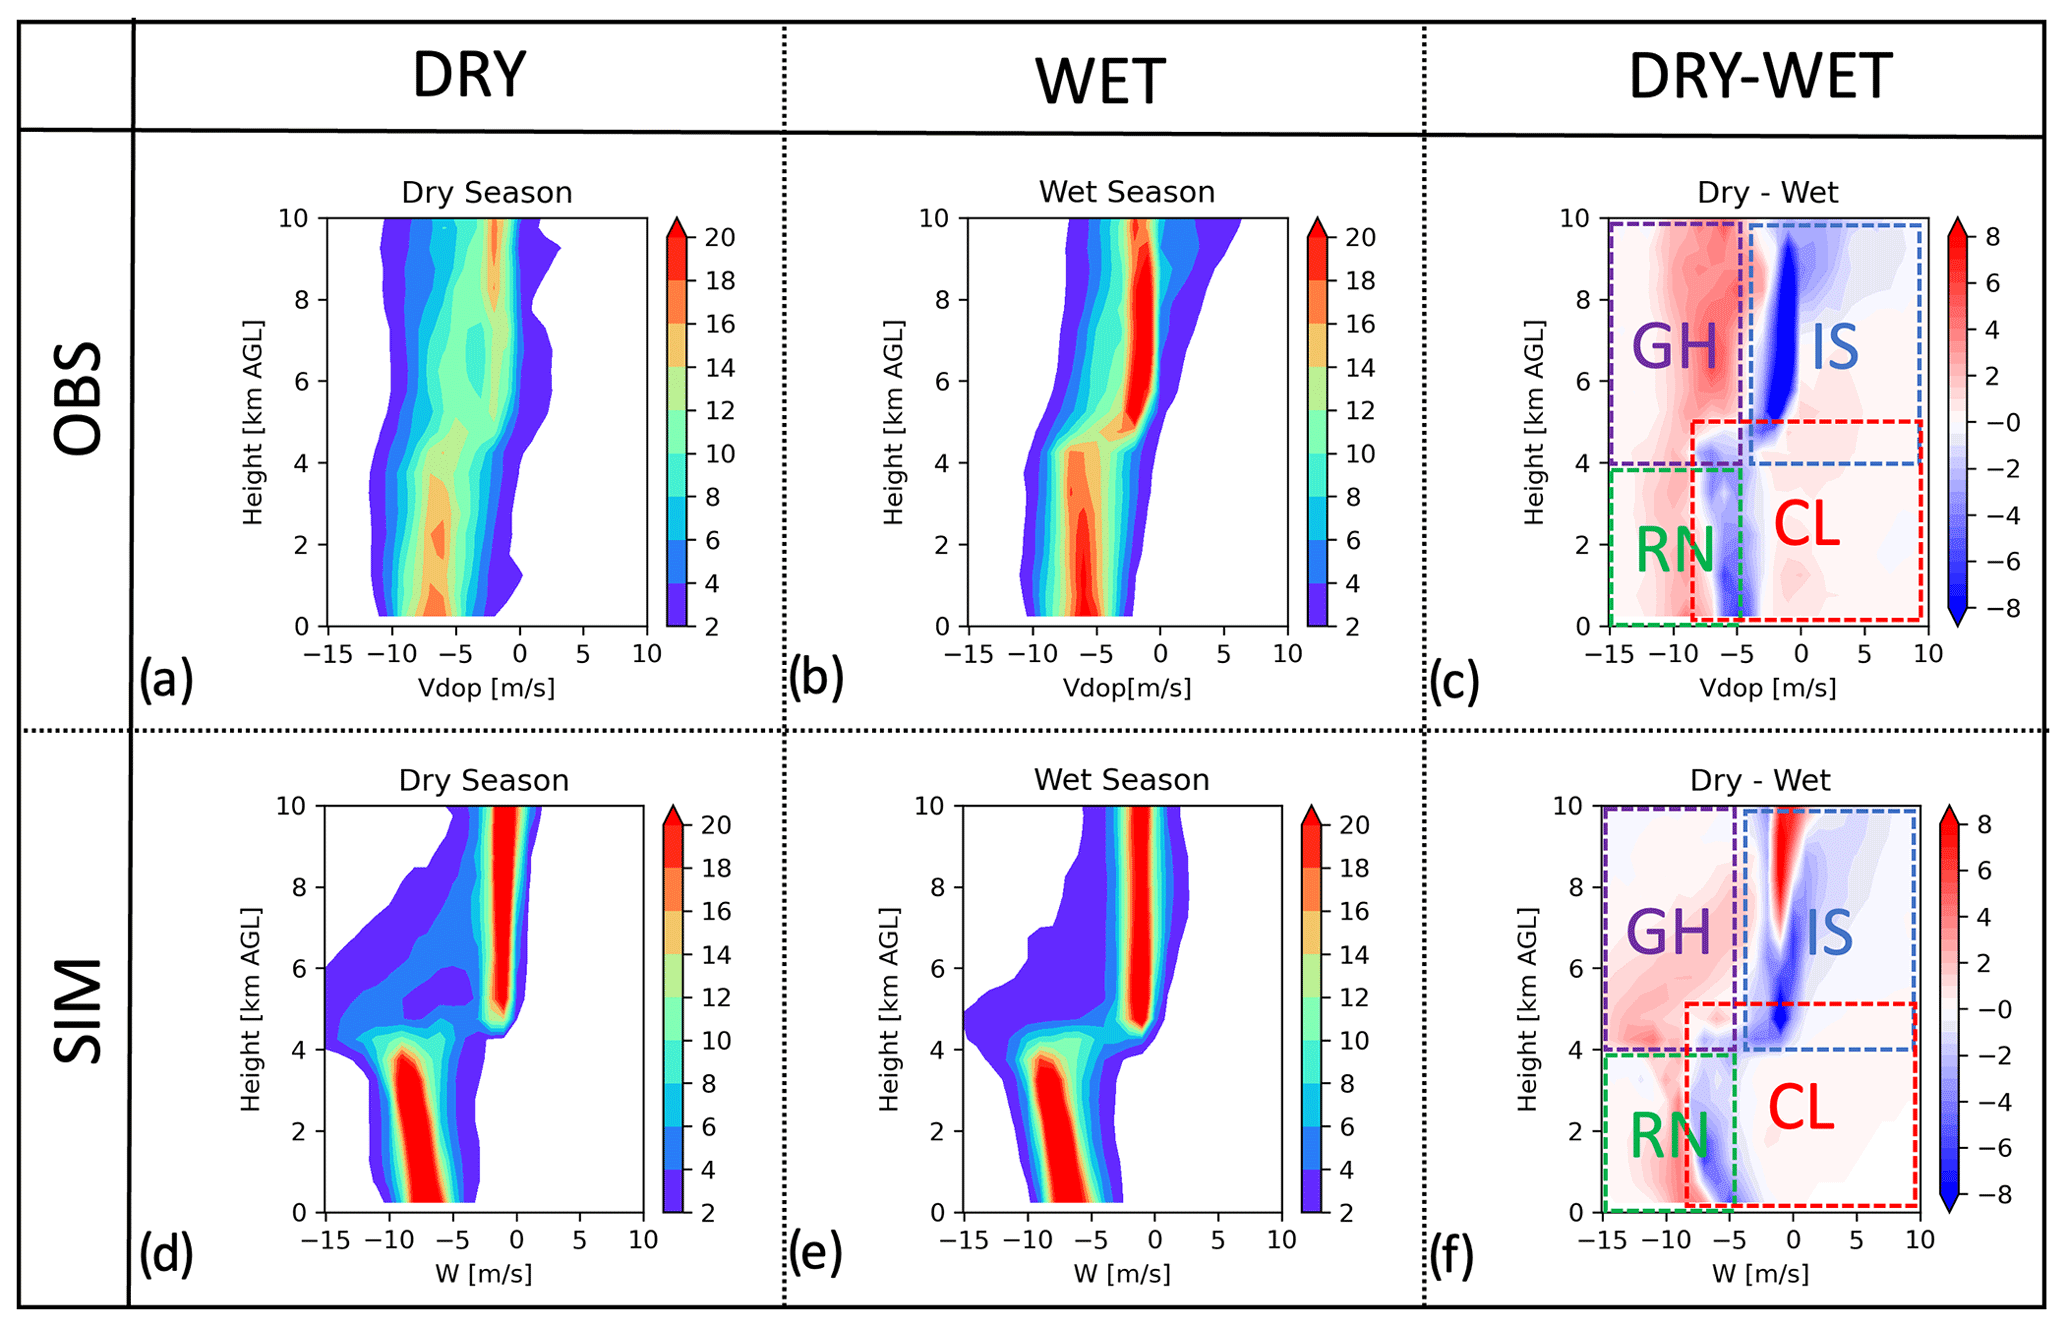
Figure 4Contoured frequency of altitude diagrams (CFADs) of Vdop integrated over dry and wet periods; the dry–wet differences are also shown. The upper row (a–c) represents observed composites, while the lower row (d–f) represents simulated composites. CL, RN, IS, and GH represent the hydrometeor regimes defined in the caption of Fig. 3.
In Fig. 4, we provide an observed and simulated climatology of Vdop CFADs as sampled from deep convective cores and summarized over the dry- and wet-season IOPs. In both the dry- and wet-season IOPs, the observed CFADs depict a smoother transition of the Vdop at the freezing level into the melting layer (4–5 km; Fig. 4a, b). At the same time, simulations show a more abrupt transition around the freezing layer (Fig. 4d, e). This is primarily because bulk single-moment microphysics more abruptly converts solid phases to liquid phases through autoconversion compared with explicit bin-resolving microphysics (Iguchi et al., 2014). This rapid conversion also overestimates the terminal velocity of raindrops near and just below the freezing level. Another possible reason is overestimating the graupel/hail size, leading to larger melted raindrops with a high terminal velocity.
The CFADs have been summarized according to dry- and wet-season IOPs to explore these seasonal contrasts between the deep convective cores (Fig. 4c, f). In the RN regime (green box), the dry IOP suggests more prevalent samples in strongly negative Vdop for our observations and simulations, indicating that deep convective cores during the dry-season IOP tend to have more vigorous, faster-falling (larger) raindrops. In the GH regime (purple box), the dry-season IOP dominates the sampling. The observations indicate this dominance (red shade) up to 10 km altitude (the extent that observations were included), while the simulation shows this behavior up to 8 km, suggesting LES underestimation with respect to graupel/hail altitudes. In the CL regime, the observations and the simulations agree well, except that some sampling is overwhelmed by the dry-season IOP behaviors in the overlapping area. This likely indicates a shift in the presence of stronger low-level updraft velocities, consistent with the analysis in Giangrande et al. (2023).
When considering the IS regime, there are examples of agreements and discrepancies between the observations and simulations. One key agreement is that the wet IOP dominates the samples in the area of positive Vdop above 8 km altitude. This indicates that observations and simulations suggest a shift towards stronger upper-level vertical air velocity for the wet-season IOP examples than for the dry-season IOP. This is consistent with the absence of dry mid-levels and the stochastic updraft model expectations from Giangrande et al. (2023). On the other hand, the observations indicate a more dominant sampling of velocities during the wet-season IOP at around −3 m s−1 of Vdop, whereas simulations change the dominant sampling mode from wet to dry IOPs at around 7 km altitude. This is a potential bias in single-moment bulk microphysics, which tends to glaciate cloud droplets or raindrops more quickly into ice particles than double-moment schemes (e.g., Fig. 16 of Matsui et al., 2023). The observed composite also shows more dry-season-dominant frequencies in GH zones than the simulation, indicating the underestimation (overestimation) of raindrop/graupel (ice/aggregate) particles above 7 km height.
Except for this discrepancy in the IS regime, dry–wet composites of Vdop CFADs agree well between observations and simulations, suggesting that LES could successfully represent the important nature of the dry–wet contrast, i.e., dry-season convection tends to cause stronger low-level updraft velocity, generating more graupel/hail as well as vigorous raindrops accompanied by stronger low-level downdraft compared with the wet season.
To further investigate these seasonal shifts in core properties, golden cases are selected to analyze the deep convection life cycle and processes. Golden cases are two single-day simulation cases, one for the dry season and one for the wet season, representing the Vdop CFADs of each season. For this, the Vdop CFADs are constructed for each day during the wet- and dry-season IOPs, and these daily CFADs are compared to the composites of seasonal CFADs (not shown here). After day-to-day analysis of the correlation and root-mean-square errors between daily and seasonal CFADs, the convective event related to the 26 February 2014 case is selected to represent the wet-season IOP convection. In contrast, the 7 September 2014 case is chosen to represent dry-season IOP convection. Figure 5 shows a dry–wet composite of the Vdop CFAD using these two case studies. This figure compares quite well to the seasonal composite of the Vdop CFAD, having the dry convective vigor signals and model biases of the seasonal composite (Fig. 4f).
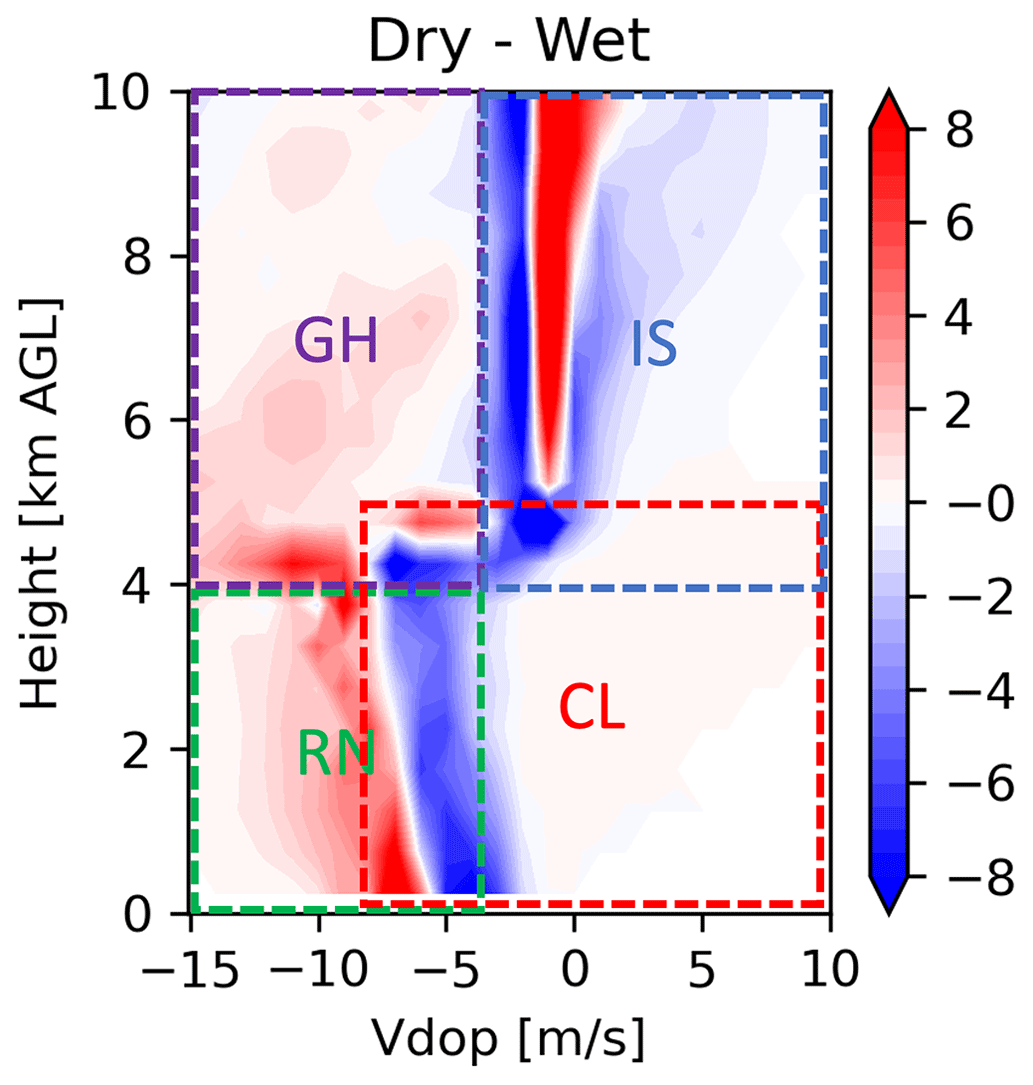
Figure 5Contoured frequency of altitude diagrams (CFADs) of simulated Vdop, differentiated for dry- and wet-season golden cases.
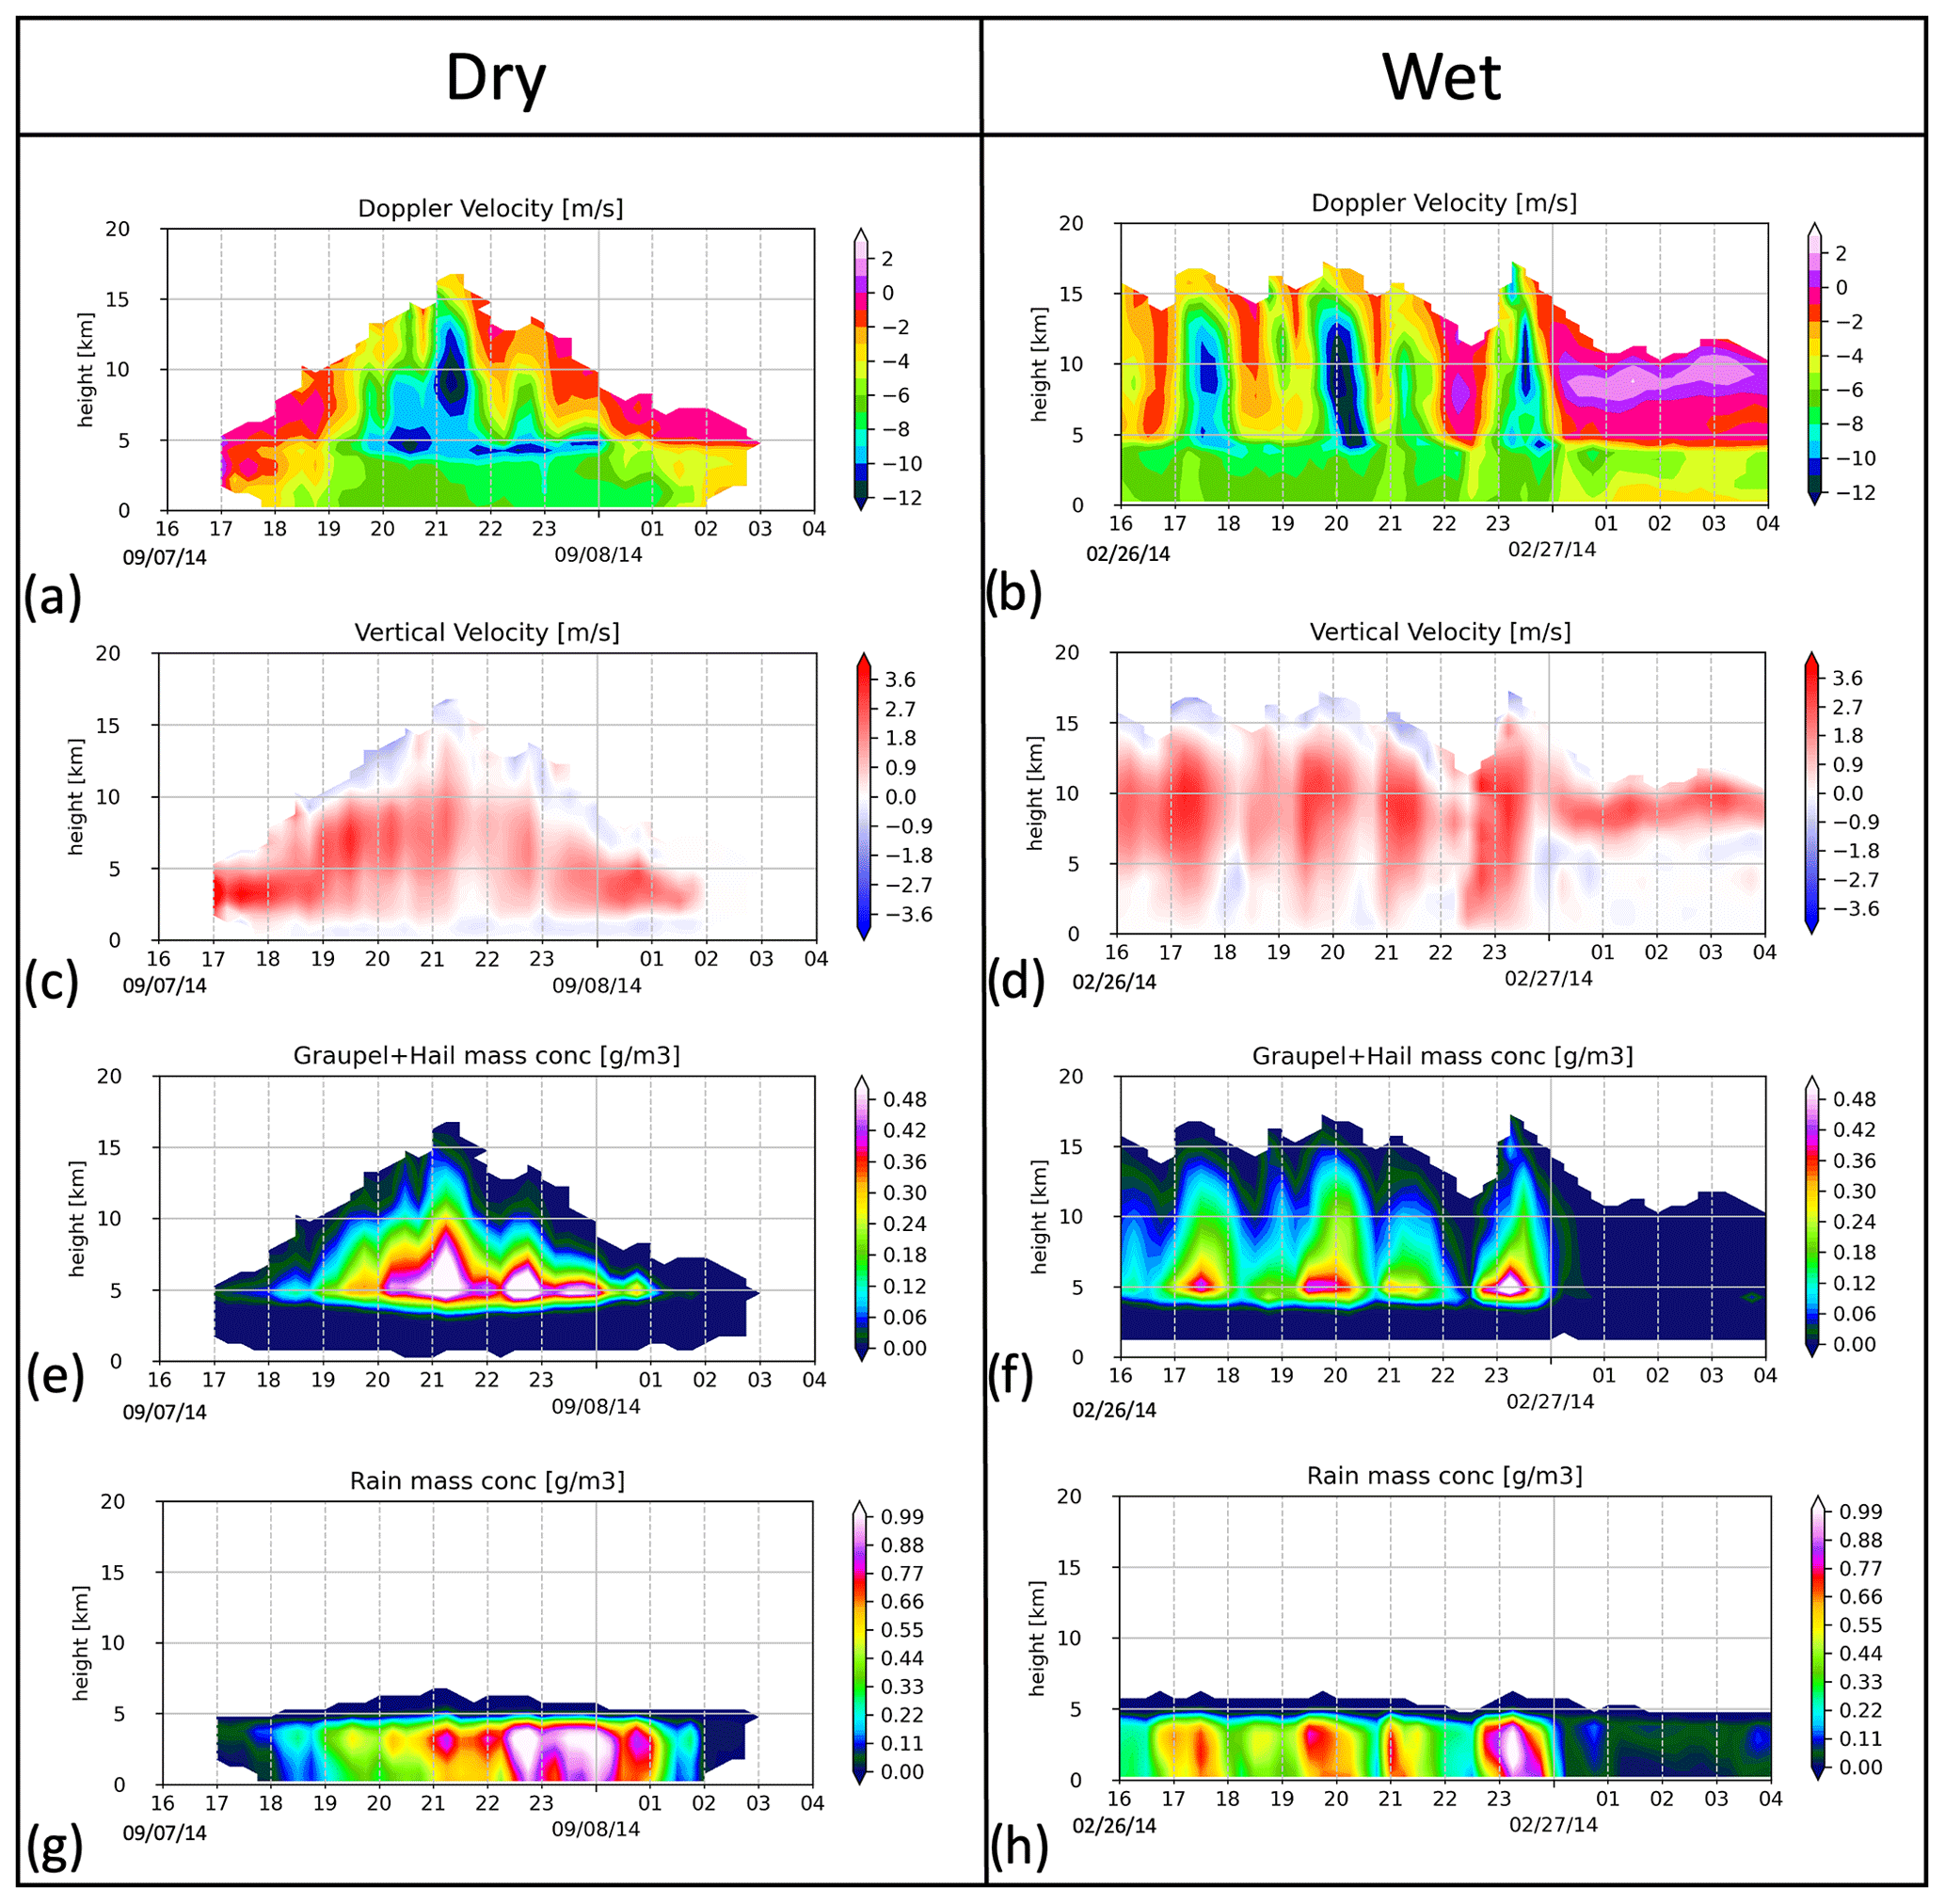
Figure 6Time series of convective core-mean (a–b) Doppler velocity, (c–d) vertical velocity, (e–f) graupel and hail mass concentrations, and (g–h) rain mass concentration profiles of convective grids from the dry- and wet-season golden cases. The date format used in the figure is mm/dd/yyyy.
In Fig. 6, we show a time series of domain-mean profiles of convective cores drawn from these dry- and wet-season golden cases, highlighting from 16:00Z (12:00 LT) of the starting day to 04:00Z (00:00 LT) of the next day. The dry-season golden event shows a clear diurnal convection cycle, peaking at 21:00–22:00Z (17:00–18:00 LT). In contrast, the wet-season golden event shows an already ongoing, continuous sequence of deep convection with several embedded strong pulses. Convective top heights reach up to 17 km for both the dry and wet events (Fig. 6a, b). Low-level positive upward vertical velocity is more ubiquitous in the dry case, while upward vertical velocity of the wet case extends to the middle-to-upper troposphere up to 15 km (Fig. 6c, d).
Dry-case graupel–hail (GH) mass concentrations peak around 21:00–23:00Z, when the convective clouds reach their deepest cloud-top heights, and the maximum GH concentration exceeds that of the wet case. Rain mass concentrations peak between 22:00 and 00:30Z on the subsequent day for the dry case, and this appears to be slightly more intense than the rainfall simulated for the wet cases. Note that the precipitation areal fraction is expected to be larger for the wet season (i.e., Giangrande et al., 2016, 2023); thus, dry-season convection is often characterized by narrow yet intense isolated convection, whereas wet-season convection is characterized by widespread moderate-to-deep convection (although with higher domain mass flux). The intense surface rainfall rates are generally correlated with the generation of graupel, frozen drops, and/or small hail particles during dry-season convection, but there are some time lags from 21:00 to 22:50Z in the dry-case convection. This is because the initial near-surface relative humidity is slightly low (∼ 80 %) around 21:00Z, and later it increases up to ∼ 96 % around 21:50Z. Thus, more surface rain evaporation likely suppresses surface precipitation during earlier convective periods. These time-series behaviors are generally consistent with the observed characteristics in the time-integrated Vdop CFADs (Fig. 5).
One key question is why larger or heavily rimed particles tend to be preferentially generated in dry-season convection compared with wet-season convection, given that both seasons indicate convection with an intense updraft velocity. This question follows previous efforts of Williams and Stanfill (2002) with respect to simulations of deep convection that contrasted land and oceanic clouds. For example, while land and ocean environments may have similar convective available potential energy (CAPE), differences in detailed potential buoyancy and vertical velocity profiles enable additional graupel/hail particles to form in continental deep convection compared with the maritime environments (Matsui et al., 2020). A Lagrangian tracking analysis is performed to examine this question for Amazon dry- and wet-season contrasts to investigate the dynamics and microphysics within cumulus thermals for these dry and wet golden events (Sect. 3.3).
3.3 Thermal tracking analysis
Thermal tracking analysis (Sect. 2.3) was conducted over 5 h periods from 19:00 to 00:00Z for the dry- and wet-season events using 1 min LES outputs. Figure 7 depicts normalized x–z cross sections of thermal properties at the moment of maximum vertical velocity in the dry and wet cases as well as dry–wet differences. Thermals typically experience development and decaying stages in their lifetime. During development, moist thermals increase their vertical velocity and size by releasing latent heat and entraining surrounding air (Morrison et al., 2021). After defining and tracking each thermal from the LESs, our normalizing procedure first defines the reference time from each thermal's lifetime based upon peak vertical air velocity (denoted as thermal maxima) and then finds a weighted average of each thermal property at the thermal maxima only. Our weights are based on the magnitude of thermal mass flux to avoid under-representing properties of less-populated but vigorous thermals. Because these heights at thermal reference time are different for each thermal in dry and wet case studies, averaging properties are somewhat biased toward thermal vertical distributions (discussed later).
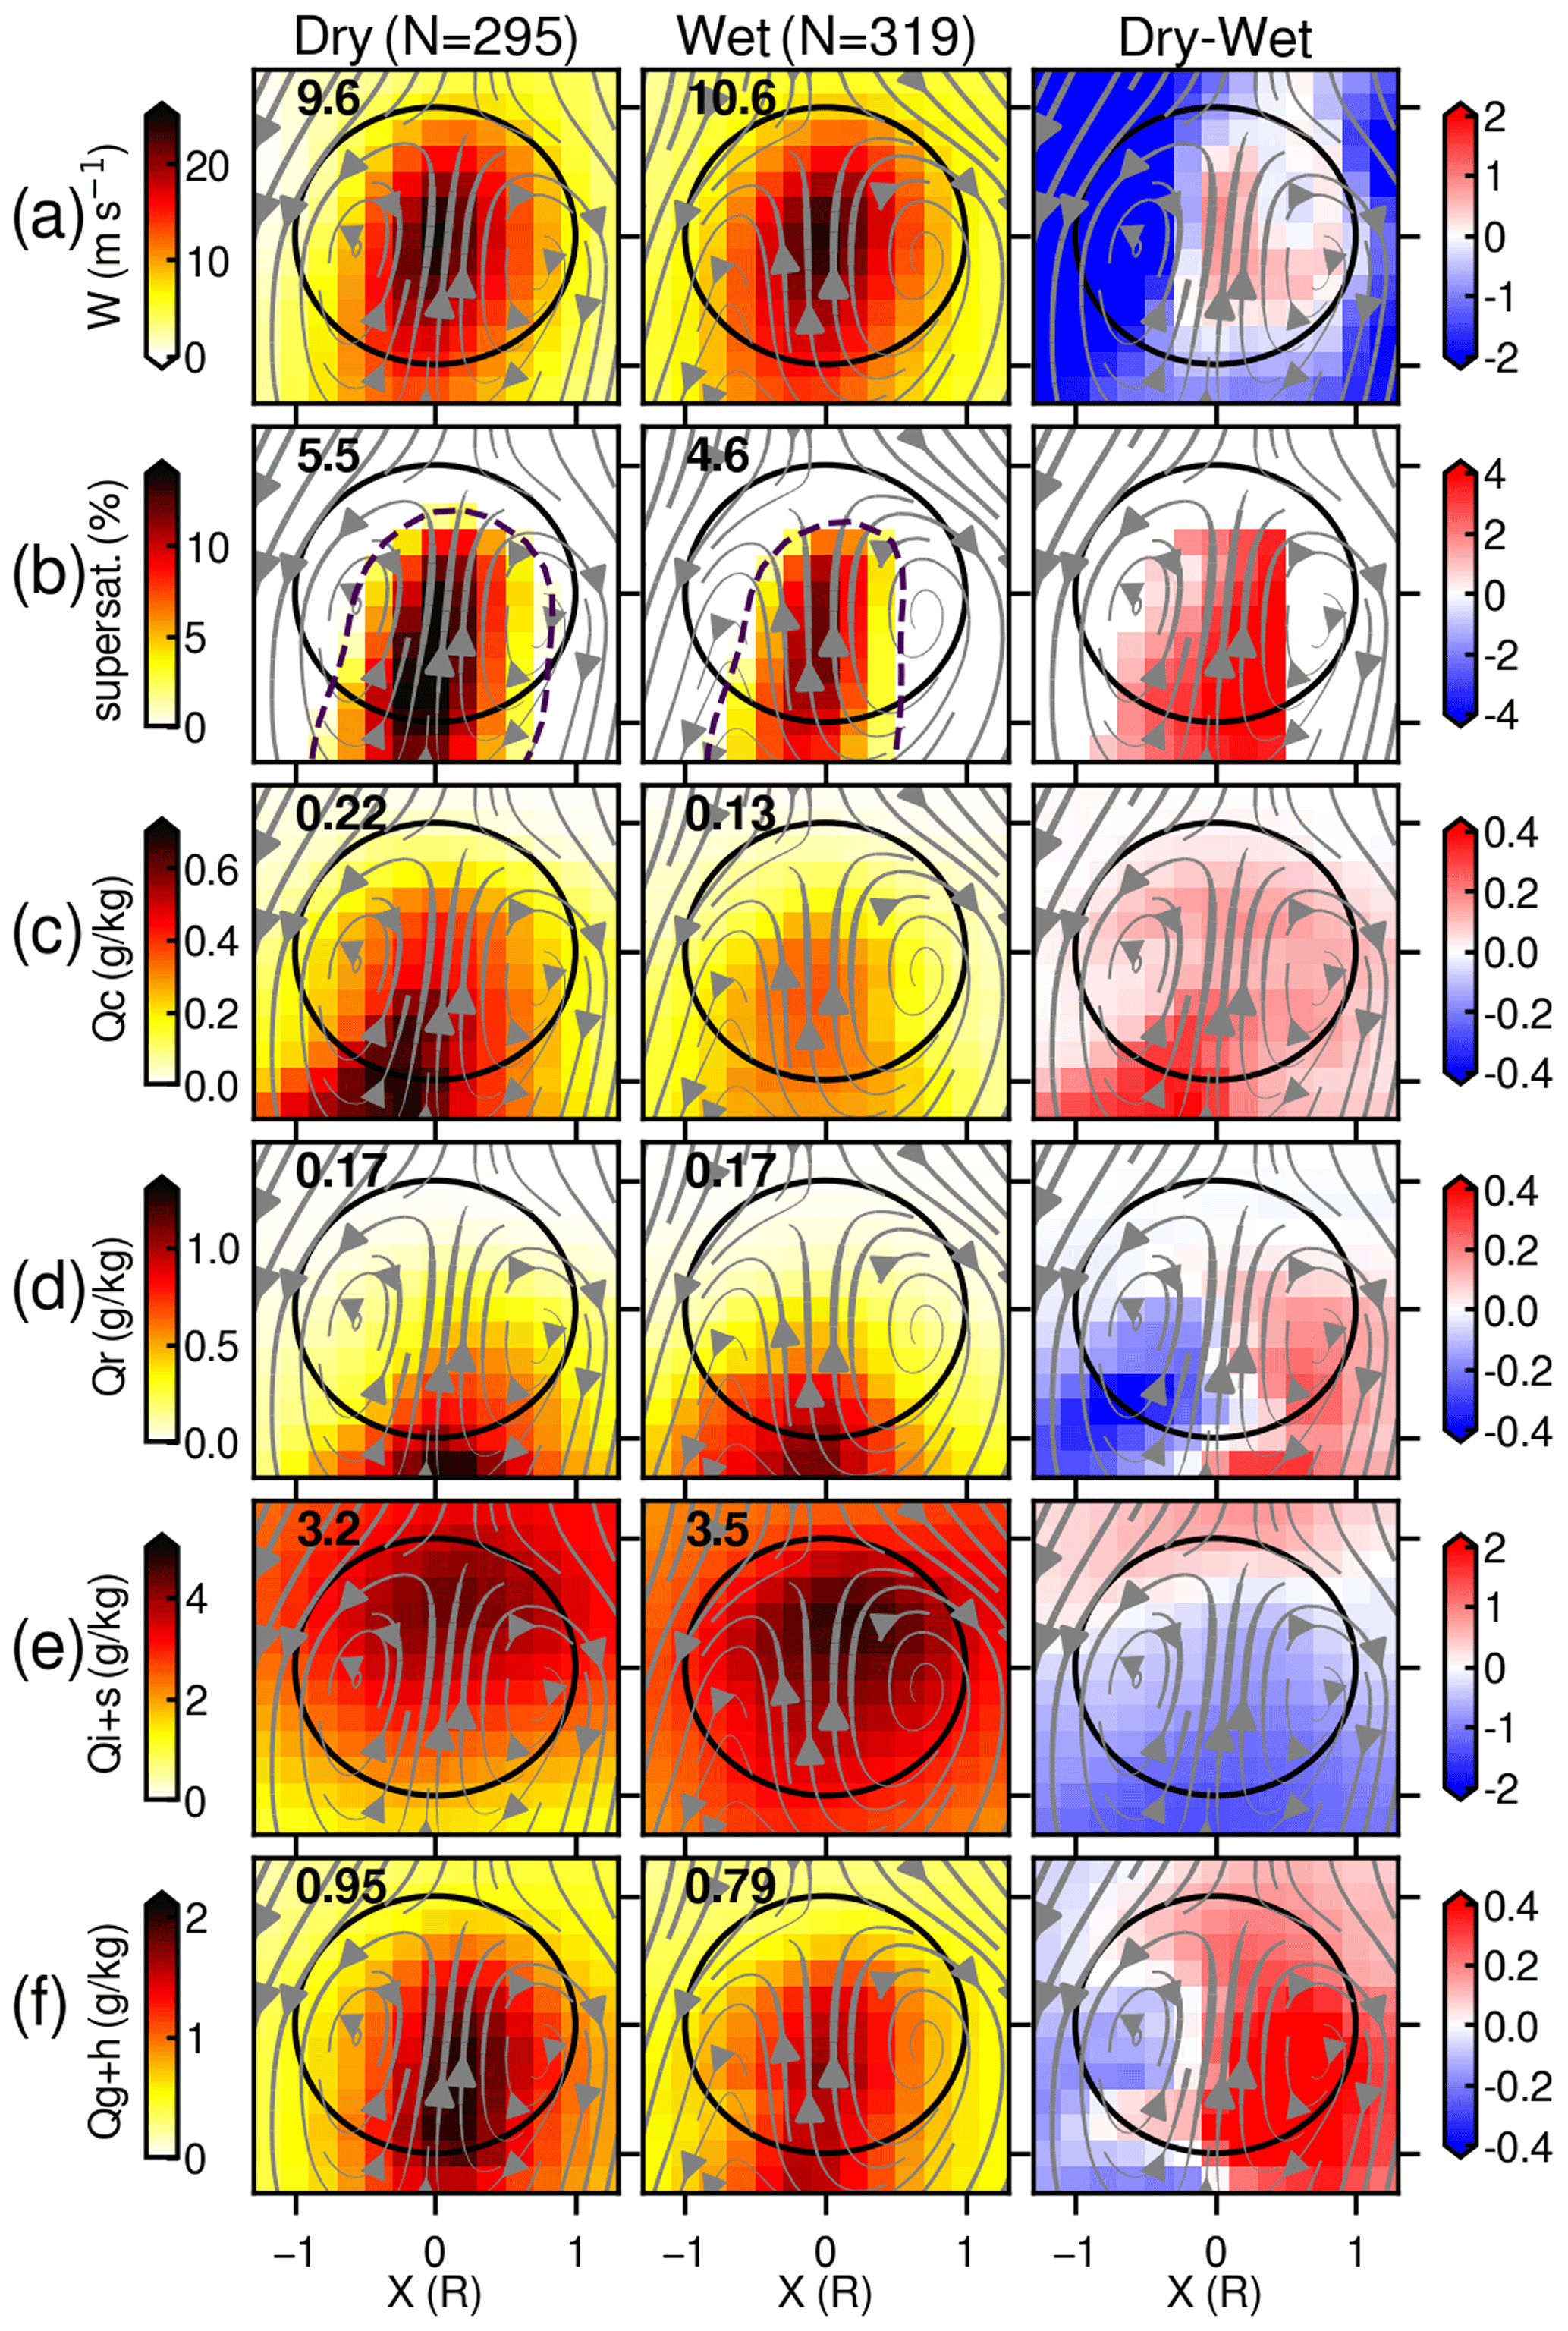
Figure 7Cross sections along the x–z plane of flux-weighted thermal values of (a) vertical velocity (W), (b) supersaturation (S), (c) cloud droplet mass concentration (Qc), (d) rain mass concentration (Qr), (e) ice and snow mass concentration (Qi+s), and (f) graupel and hail mass concentration (Qg+h) for composites of all tracked thermals at the point of their maximum vertical velocity, scaled by their radius (horizontal and vertical coordinates are in units of mean thermal radii). The left, middle, and right columns correspond to the dry-season golden case, the wet-season golden case, and the dry–wet case difference, respectively. The values in the upper left of each panel are the flux- and radius-weighted mean over all samples. Arrows indicate the average flow streamlines in the rising thermal reference frame. The dashed contour in supersaturation values corresponds to 100 % relative humidity. These are reference time (t = 0) mean values.
For example, in Fig. 7a, we plot the weighted-average peak vertical air velocity (W) for the dry-case thermal (9.6 m s−1) and the wet-case thermal (10.6 m s−1). Perhaps surprisingly, the flux- and radius-weighted average dry-case thermal is slightly slower in W than that found for the average wet case. Here, we find that the vertical air velocity of the wet-case thermal is more homogeneously distributed than its counterpart for the dry-case thermal, leading to higher weighted-mean W, despite weaker values at thermal centers (red shading in the dry–wet plot in Fig. 7a). Moreover, unexpectedly, supersaturation and the cloud droplet mixing ratio (Qc) of the dry-case thermal are elevated compared with the wet-case thermal (Fig. 6b, c), as wet-case thermals may be expected to instead have higher supersaturation and/or more condensation owing to the higher availability of water vapor (e.g., Giangrande et al., 2023).
Exploring the other classes, the rain mixing ratio (Qr) is similar between the dry-case and wet-case thermals (0.17 g kg−1), but graupel–hail concentrations (Qg+h) are significantly higher in the dry-case thermals (0.95 g kg−1) compared with the wet-case thermals (0.79 g kg−1); this latter result is consistent with previous discussions from event time series in Fig. 6e. Cloud ice and snow mixing ratio (Qi+s) values are slightly larger in the wet-case thermal (3.5 g kg−1) than in the dry-case thermal (3.2 g kg−1). While this difference is not significant, this is also potentially a surprising outcome, as dry-case deep convective clouds might otherwise be expected to be deeper/stronger and, thus, characterized by additional ice hydrometeor concentrations. However, some absence of these media may be partially explained by following the suggestions of Giangrande et al. (2020, 2023), who state that drier middle-to-upper levels in the dry season may limit peripheral precipitation aloft (i.e., enhanced evaporation). Overall, Qr and Qg+h seem to be concentrated in these composite averages downward from the thermal core due to the gravitational sedimentation process. Supersaturation and Qc, however, are also more vertically elongated than thermal properties established by Hernandez-Deckers et al. (2022) using the Weather Research and Forecasting (WRF) model for a case of scattered convection over Houston, Texas. Qi+s is more homogeneously distributed across the defined borders of thermals. Furthermore, dry–wet differences show slightly asymmetric results, particularly with respect to W, Qr, and Qg+h. These could be attributable to differences in horizontal wind shear, evidenced by a greater tilt in the thermal centerline flow in the dry case (gray streamlines), leading to greater concentrations in the tilt direction of more rapidly sedimenting quantities that are formed within thermals (i.e., Qr and Qg+h); as thermal composites are not aligned with the mean wind, such preferential outflow may not be fully captured by this analysis (i.e., asymmetric signatures could be greater or lesser along directions other than the X alignment).
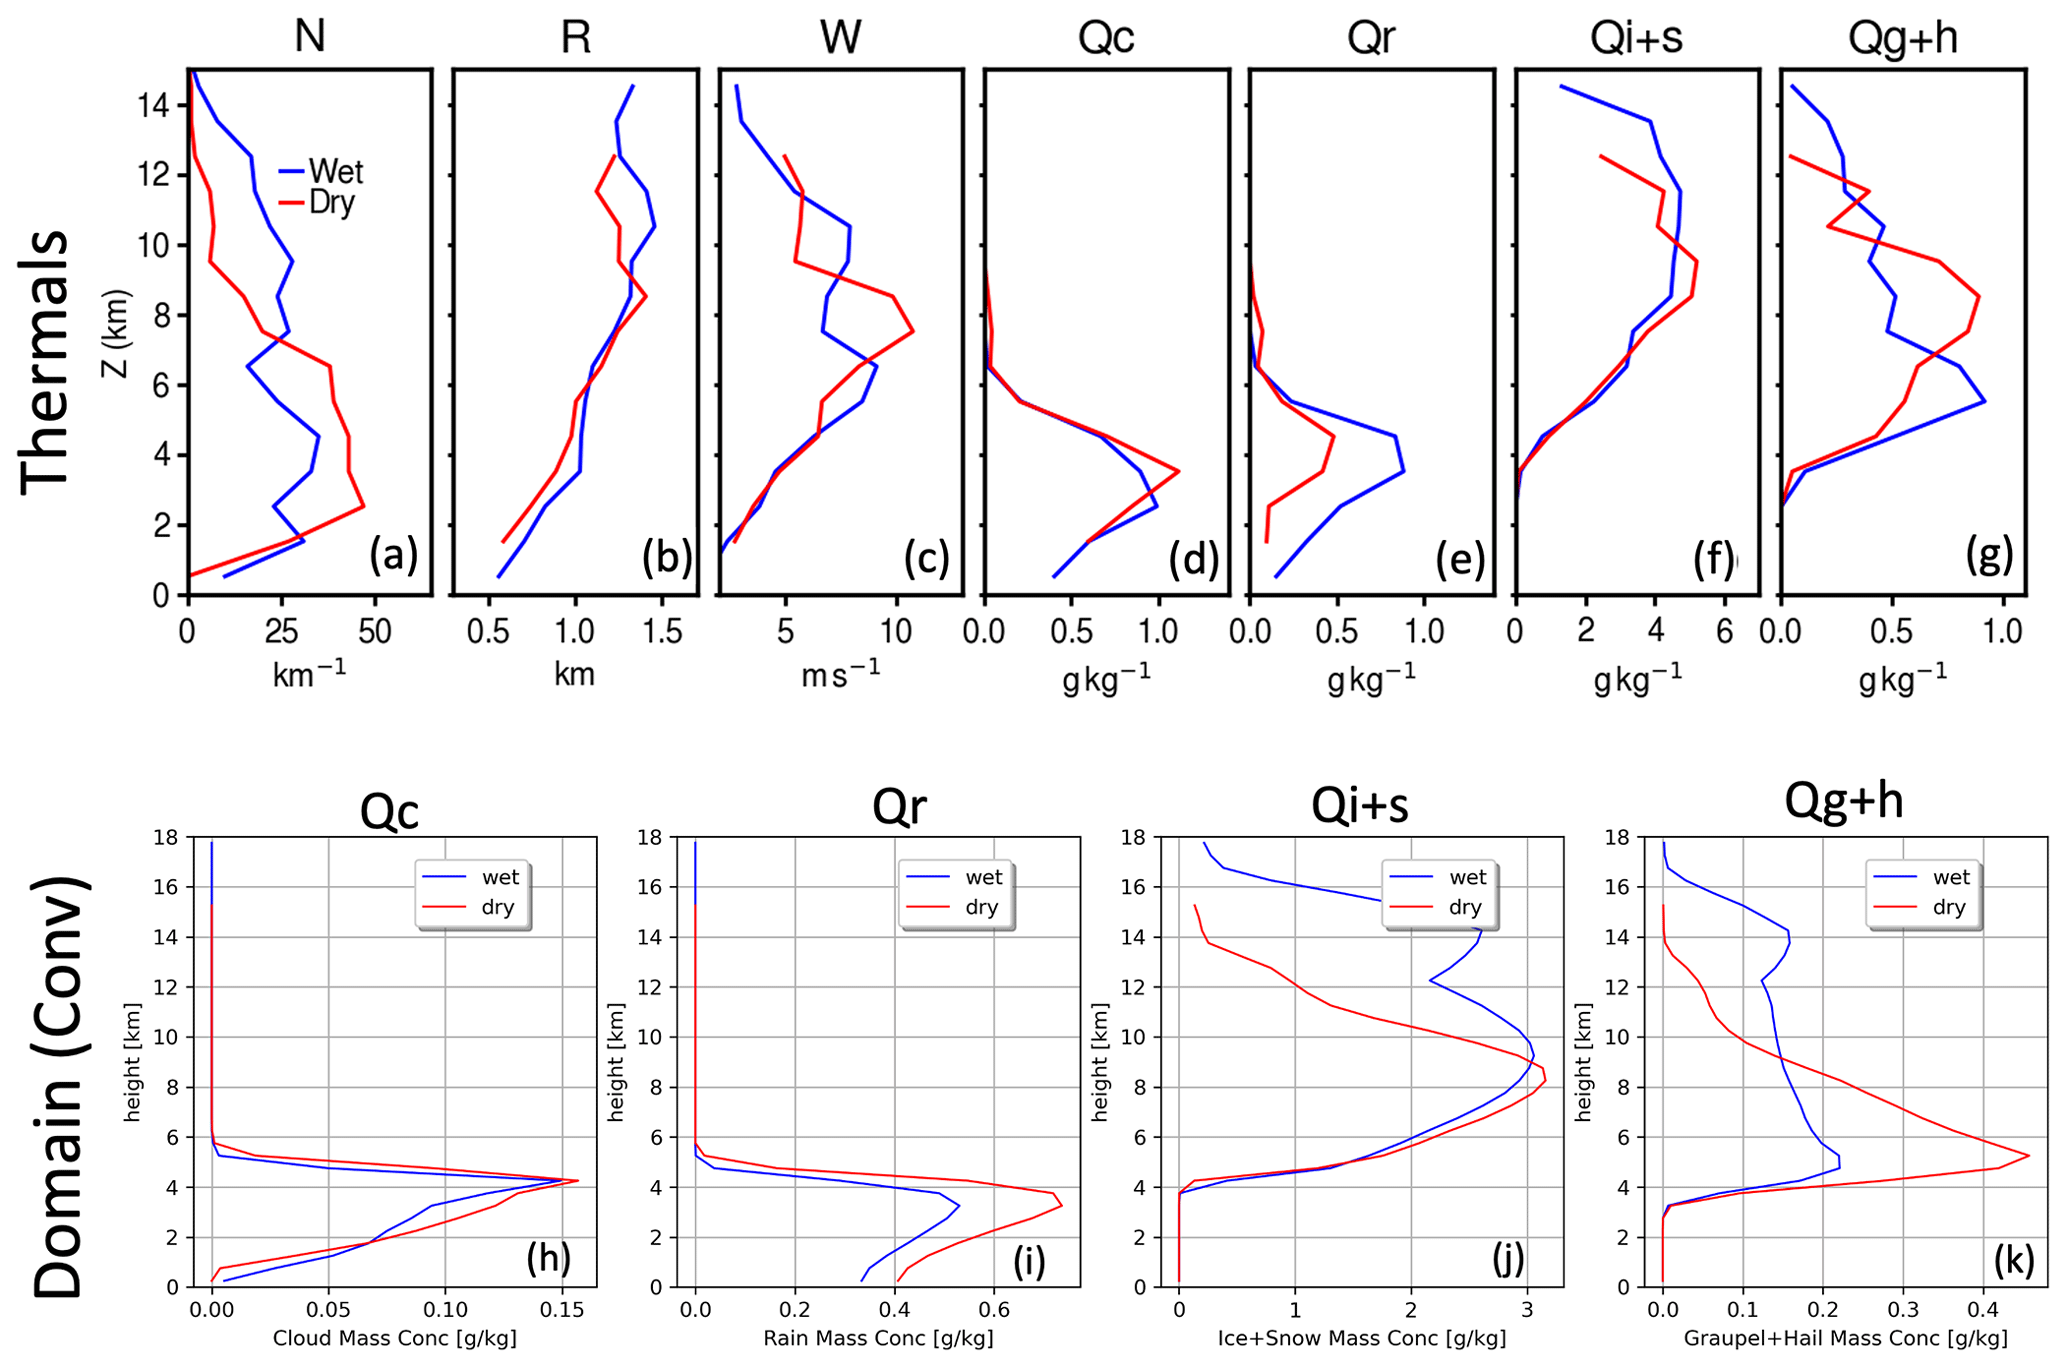
Figure 8(a–g) Vertical profiles of thermal-mean (a) number concentration (N), (b) radius (R), (c) vertical velocity (W), (d) cloud droplet mass concentration (Qc), (e) rain mass concentration (Qr), (f) ice and snow mass concentration (Qi+s), and (g) graupel and hail mass concentration (Qg+h). (h–k) Vertical profile of domain-mean (h) cloud droplet mass concentration (Qc), (i) rain mass concentration (Qr), (j) ice and snow mass concentration (Qi+s), and (k) graupel and hail mass concentration (Qg+h) of convective grids from the dry- and wet-season golden cases.
An initial leading question is why the dry-case thermals have greater cloud water and supersaturation on average. To further untangle these results in Fig. 7b and c, we derive the vertical profiles of flux-weighted mean thermal states, now including all thermal times (Fig. 8a–g). Immediately, these plots reveal striking differences between the thermal number concentration (N) profiles for dry-case and wet-case examples (Fig. 8a; the number of thermals per kilometer height within the 102 km × 12.8 km domain). For instance, dry-case convection shows a larger concentration of thermals below the 8 km height, whereas wet-case convection promotes a more homogeneous thermal concentration that extends across most heights. This behavior is somewhat reminiscent of the distribution of the difference in vertical moisture advection and potential buoyancy profiles between the parent dry- and wet-season conditions (e.g., see Figs. 1 and 2 and the discussions in Sect. 3.1). Moreover, thermal generation in our LES responds to these terms, partially from the seasonal large-scale forcing.
According to the classic similarity theory of Morton et al. (1956), the width of dry/moist thermals should increase with increases in the boundary layer depth (William and Stanfill, 2002). For the Amazon Basin, previous GoAmazon studies, such as Giangrande et al. (2017, 2023), have shown that the dry-season boundary layer height is generally deeper than that of the wet season, potentially on the order of 200 m deeper for the isolated deep convective events that they tracked. Following this logic, dry-case convection may anticipate larger thermals. However, LES thermal tracking analysis suggests that the sizes (R) of thermals upon initiation appear to be quite similar between the wet and dry events and then appear to grow at similar rates for several kilometers before the dry-case thermal size catches up with the moist size at an altitude of around 6 km, only to be overtaken again by the deeper wet-case thermals at around 9 km (Fig. 8b). Further, Fig. 8c shows the mean vertical velocity of thermals, presenting a nearly identical updraft velocity below 4 km. However, mean updraft velocity profiles above 4 km are quite different between the dry and wet cases; for example, the dry case peaks at around 8 km, whereas the wet case peaks at 6 and 10 km. This result implies that differences in moist convection between dry and wet cases are poorly characterized by thermal sizes.
The Qc in thermals also shows very similar profiles between the dry and wet cases (Fig. 8d). However, because thermal numbers of the dry case are more concentrated in the lower troposphere (Fig. 8a), the all-height mean properties of dry-case thermals are characterized by more Qc (Fig. 7c). The Qr of the wet case is nearly twice as large as the dry case (Fig. 8e); however, the normalized x–z cross section (Fig. 7d) does not show such a large difference (explained below). The Qi+s also shows similar distributions (Fig. 8f). Still, the total x–z mean Qi+s is larger in the wet case than in the dry case due to larger thermal numbers in the upper troposphere (Fig. 7e). Uniqueness appears in thermal Qg+h (Fig. 8g). While both dry and wet cases show a similar magnitude of the peak values (∼ 0.9 g kg−1), the peak height in the dry case is approximately 3 km higher than in the wet case. This Qg+h peak in the dry case coincides with the peak in the vertical velocity (Fig. 8c).
Figure 8h, i, j, and k display these hydrometeor mixing ratios averaged over the same periods, including all convective grids defined by vertical velocity greater than 1 m s−1. Vertical profiles and dry–wet differences are similar to the results in Fig. 6. However, compared with the in-thermal profile results (Fig. 8d–g), it facilitates understanding of the convective core microphysics process. First, mean in-thermal convective-grid hydrometeor concentrations are smaller than in-thermal profiles; particularly in-thermal Qc values are roughly 6 times larger than convective-grid-averaged Qc (Fig. 8d, h), suggesting that thermals are major cloud droplet generators (Hernandez-Deckers et al., 2022).
The convective-grid Qg+h of the dry case is nearly 2 times as high as that of the wet case, peaking around the melting layer (Fig. 8g, k), whereas in-thermal Qg+h shows similar peak values between the dry and wet cases. As indicated by Fig. 7g, these larger and heavier rimed particles sediment from thermals, and further collision with supercooled liquid must enhance the graupel growth during the sedimentation process, as suggested by aircraft measurements (Blyth and Latham, 1993). Thus, elevated in-thermal Qg+h in dry-case convection can have further riming growth after falling out from thermals. This vigorous growth of Qg+h in dry-case convection eventually generates vigorous raindrops after the melting process. This could explain why convective-grid Qr in the dry case is larger than that in the wet case (Fig. 8i), which is the inverse of the result for in-thermal Qr (Fig. 8e). Thus, in-thermal Qr values are not directly related to total Qr in the convective core (or surface precipitation rate) because of this cold-precipitation microphysics process in deep convection.
A second leading question is why the height at the peak value of the dry-case in-thermal Qg+h is more elevated than that of the wet-case thermal (Fig. 8g). Figure 9 shows histograms of thermal properties from the dry and wet cases. Consistent with the mean vertical profiles (Fig. 8a), more thermals are initiated below 7 km in the dry case than in the wet case (Z0; Fig. 9d). The thermal radius in the wet case is also larger than that in the dry case, regardless of shallower boundary layer depths in the wet case (Fig. 9a), consistent with R in thermal vertical profiles reaching larger sizes at most elevations in the wet case (Fig. 8b). However, here, we see that thermal vertical velocity (W; Fig. 9b), travel distance (ΔZ; Fig. 9c), and lifetime (Fig. 9e) in the dry case are all greater than in the wet case. The thermal entrainment rate is smaller in the dry case than in the wet case. These results indicate that the thermals in the dry-case deep convection can travel longer distances with an extended lifetime due to a lesser dilution.
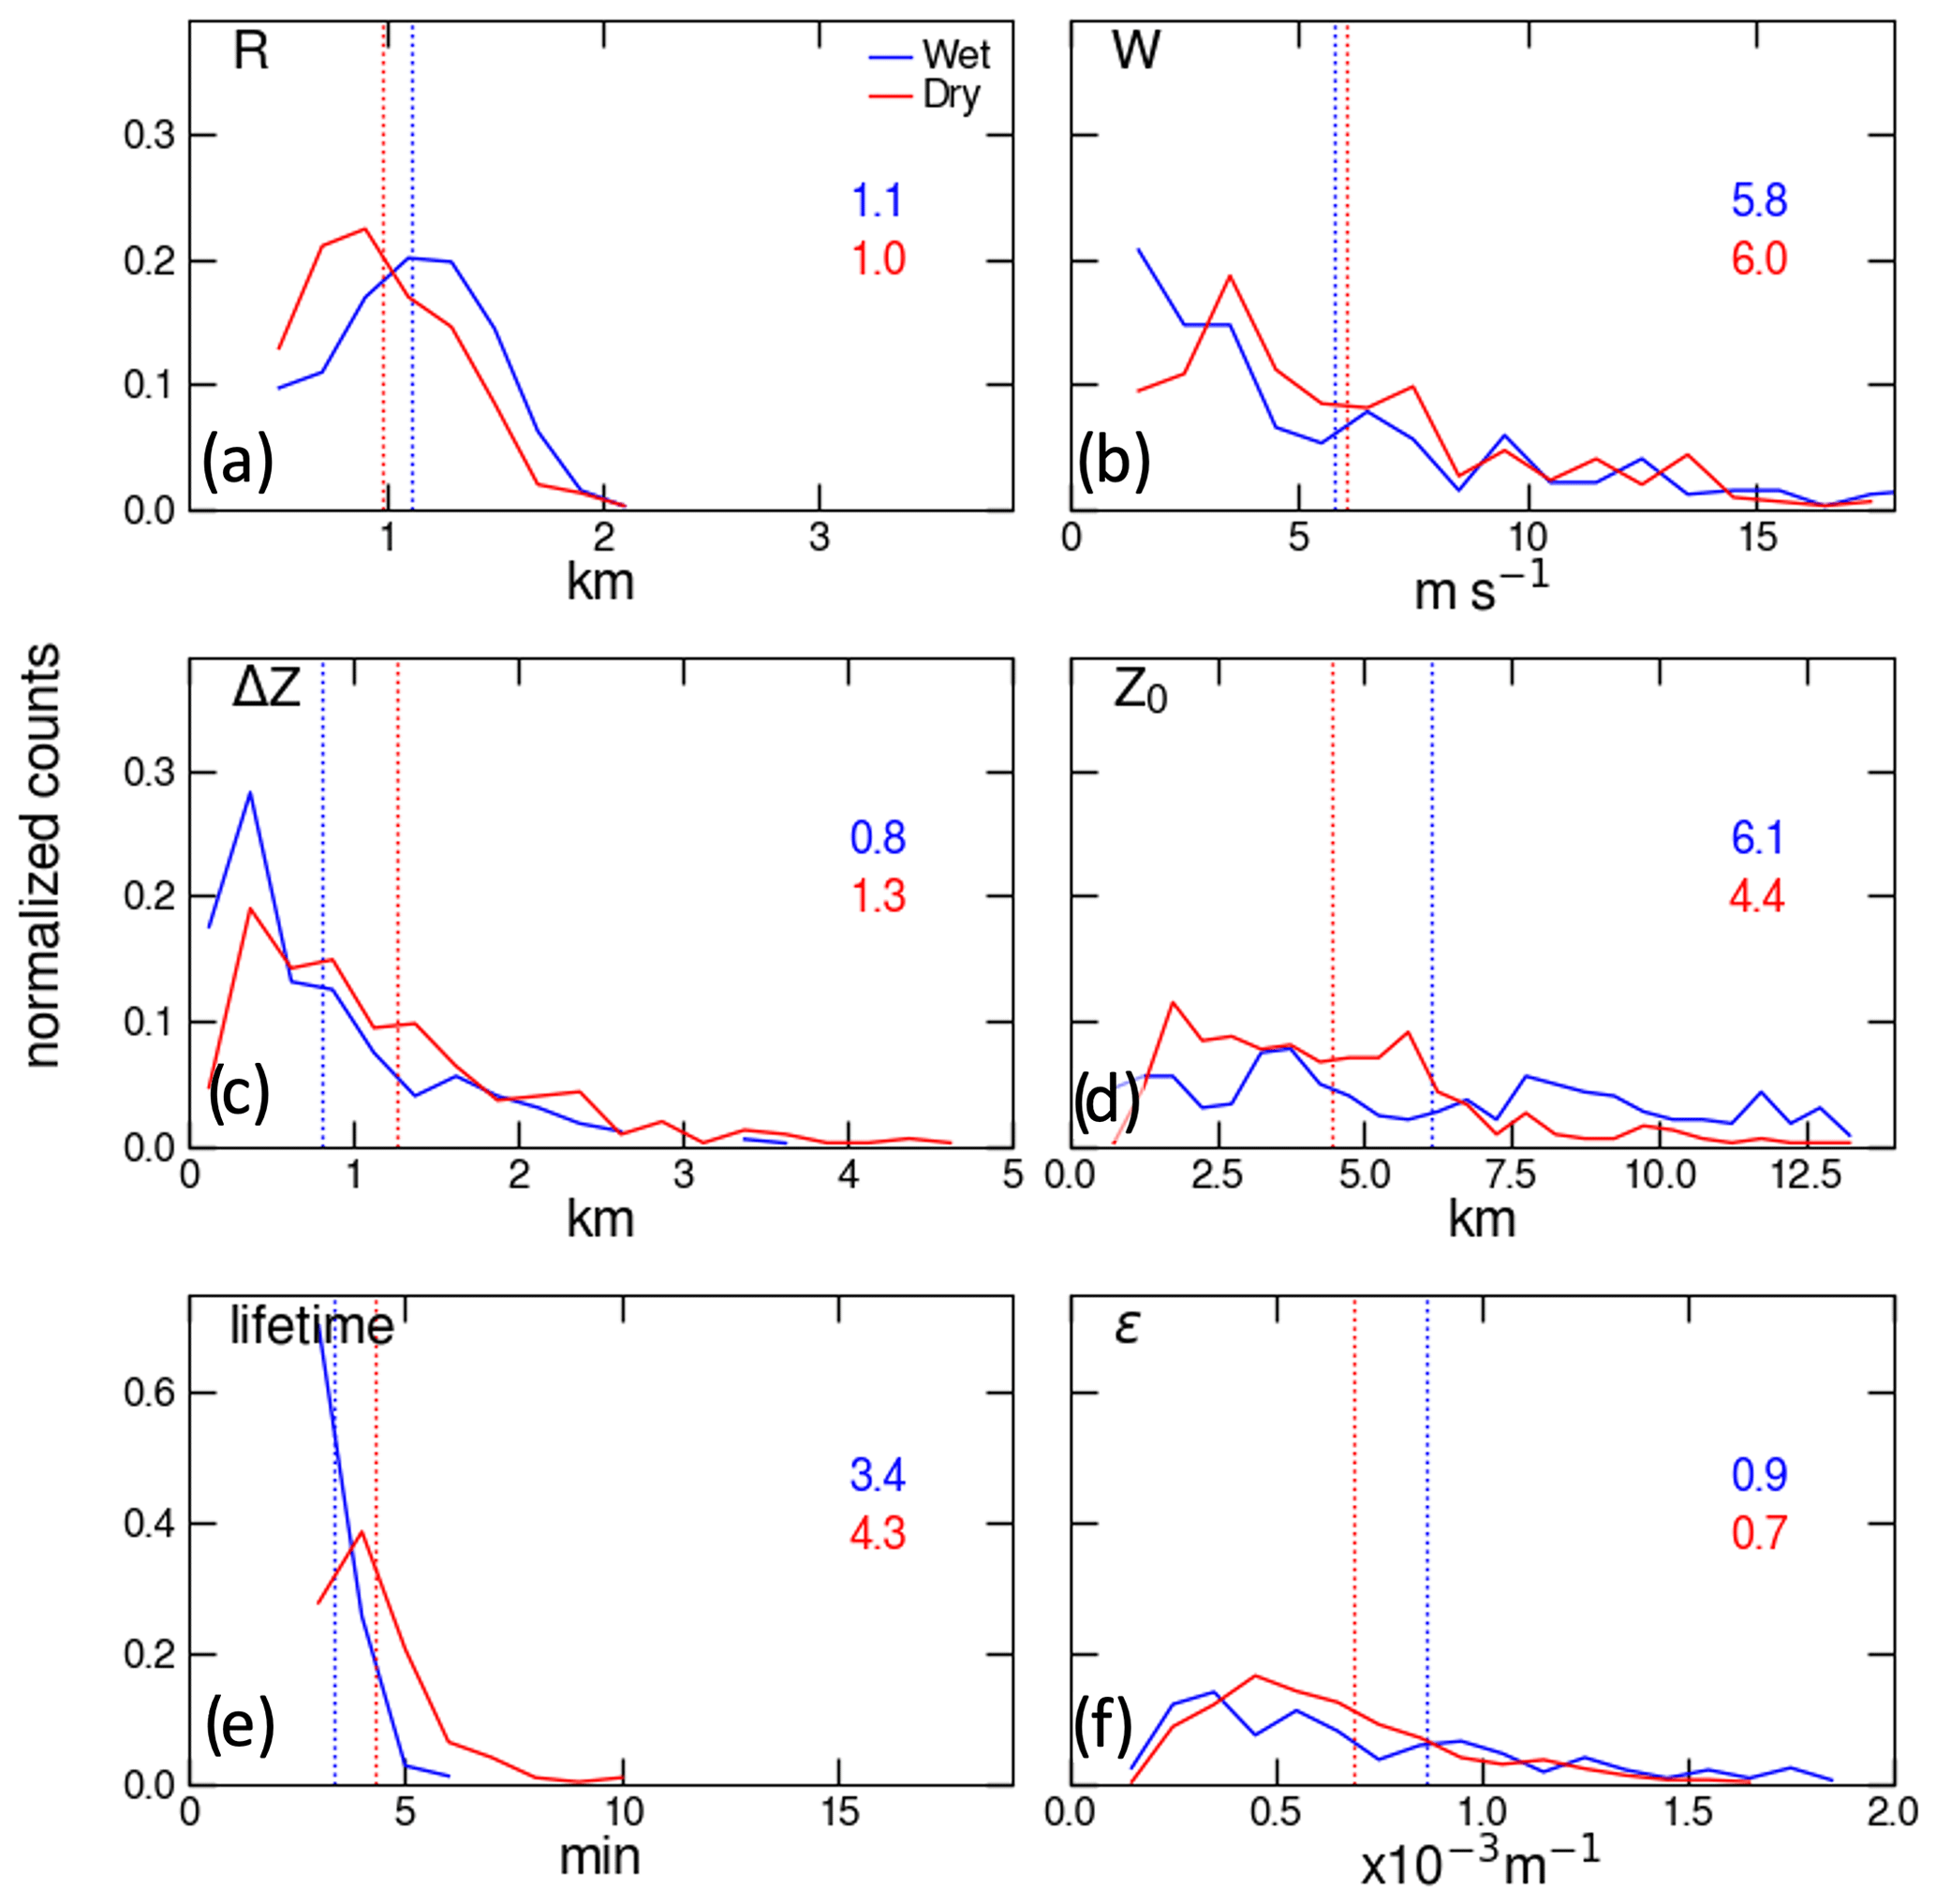
Figure 9Normalized histogram of thermal (a) radii (R), (b) vertical velocity (W), (c) travel distance (ΔZ), (d) initiated level (Z0), (e) lifetime, and (f) entrainment rate (ε) from the dry- and wet-season golden cases.
Interestingly, slightly smaller thermal radii in dry-case convection can have a lower entrainment rate than in wet-case convection. Hernandez-Deckers and Sherwood (2018) also found that the variability in thermal radius can only account for 20 % of the total variance in the thermal dilution rate, i.e., a larger thermal tends to have a lower dilution rate. This was concluded through similar thermal tracking analysis from different LESs. Therefore, thermal size is not the sole parameter determining the dilution rate.
Giangrande et al. (2023) suggested that the convective area is smaller in dry-season convection over this region. Thus, this indicates that stronger low-level buoyancy in dry-season environments can more narrowly concentrate updraft and low-level thermals in the area, thereby creating less-diluted environments, probably due to the impact of thermal drag (Romps and Charn, 2015). This is merely speculative and requires further investigation to confirm or refute. Takahashi et al. (2021) investigated cloud-scale entrainment between continental and maritime environments and found a larger dilution rate in maritime convection than in continental convection. Our results suggest that this difference in cloud dilution happens from the thermal-process level. These conditions elevate dry-case thermals and the graupel peak concentration toward higher altitudes than the wet-case convection (Fig. 7f), leading to greater graupel production.
Finally, time series of thermal properties in the x–z cross section are constructed for the dry case. For this, each thermal at its maximum W value is centered and defined as the time of zero, and prior (later) steps are represented in negative (positive) time steps. Because of the 1 min LES output, the time series from −3 to 3 encompasses 7 min of time steps. This averaging process also weighs upon the magnitude of the thermal mass flux (Hernandez-Deckers et al., 2022); thus, thermals at larger values in positive and negative time steps tend to have lower sampling numbers. Moreover, to make the composites, equal-sized thermals are sampled to characterize the mean time series of thermal properties, avoiding sampling overly small thermals, which often have no supersaturation (Hernandez-Deckers and Sherwood, 2016). This normalization procedure ends up with the result that maximum W values do not appear at the reference time (t = 0), but they better capture the evolution of the largest flux-bearing thermals (Fig. 10). We also note that a typical thermal travel distance is 1.3 km (Fig. 9c); therefore, a minority of dry-case thermals contain either no ice phase (Fig. 8e–f) or no liquid phase (Fig. 8c, d), although most contain both phases between 3 and 7 km. Note that this flux-weighting is the one way to present the results, although simple non-weighted averaging can also show similar results.
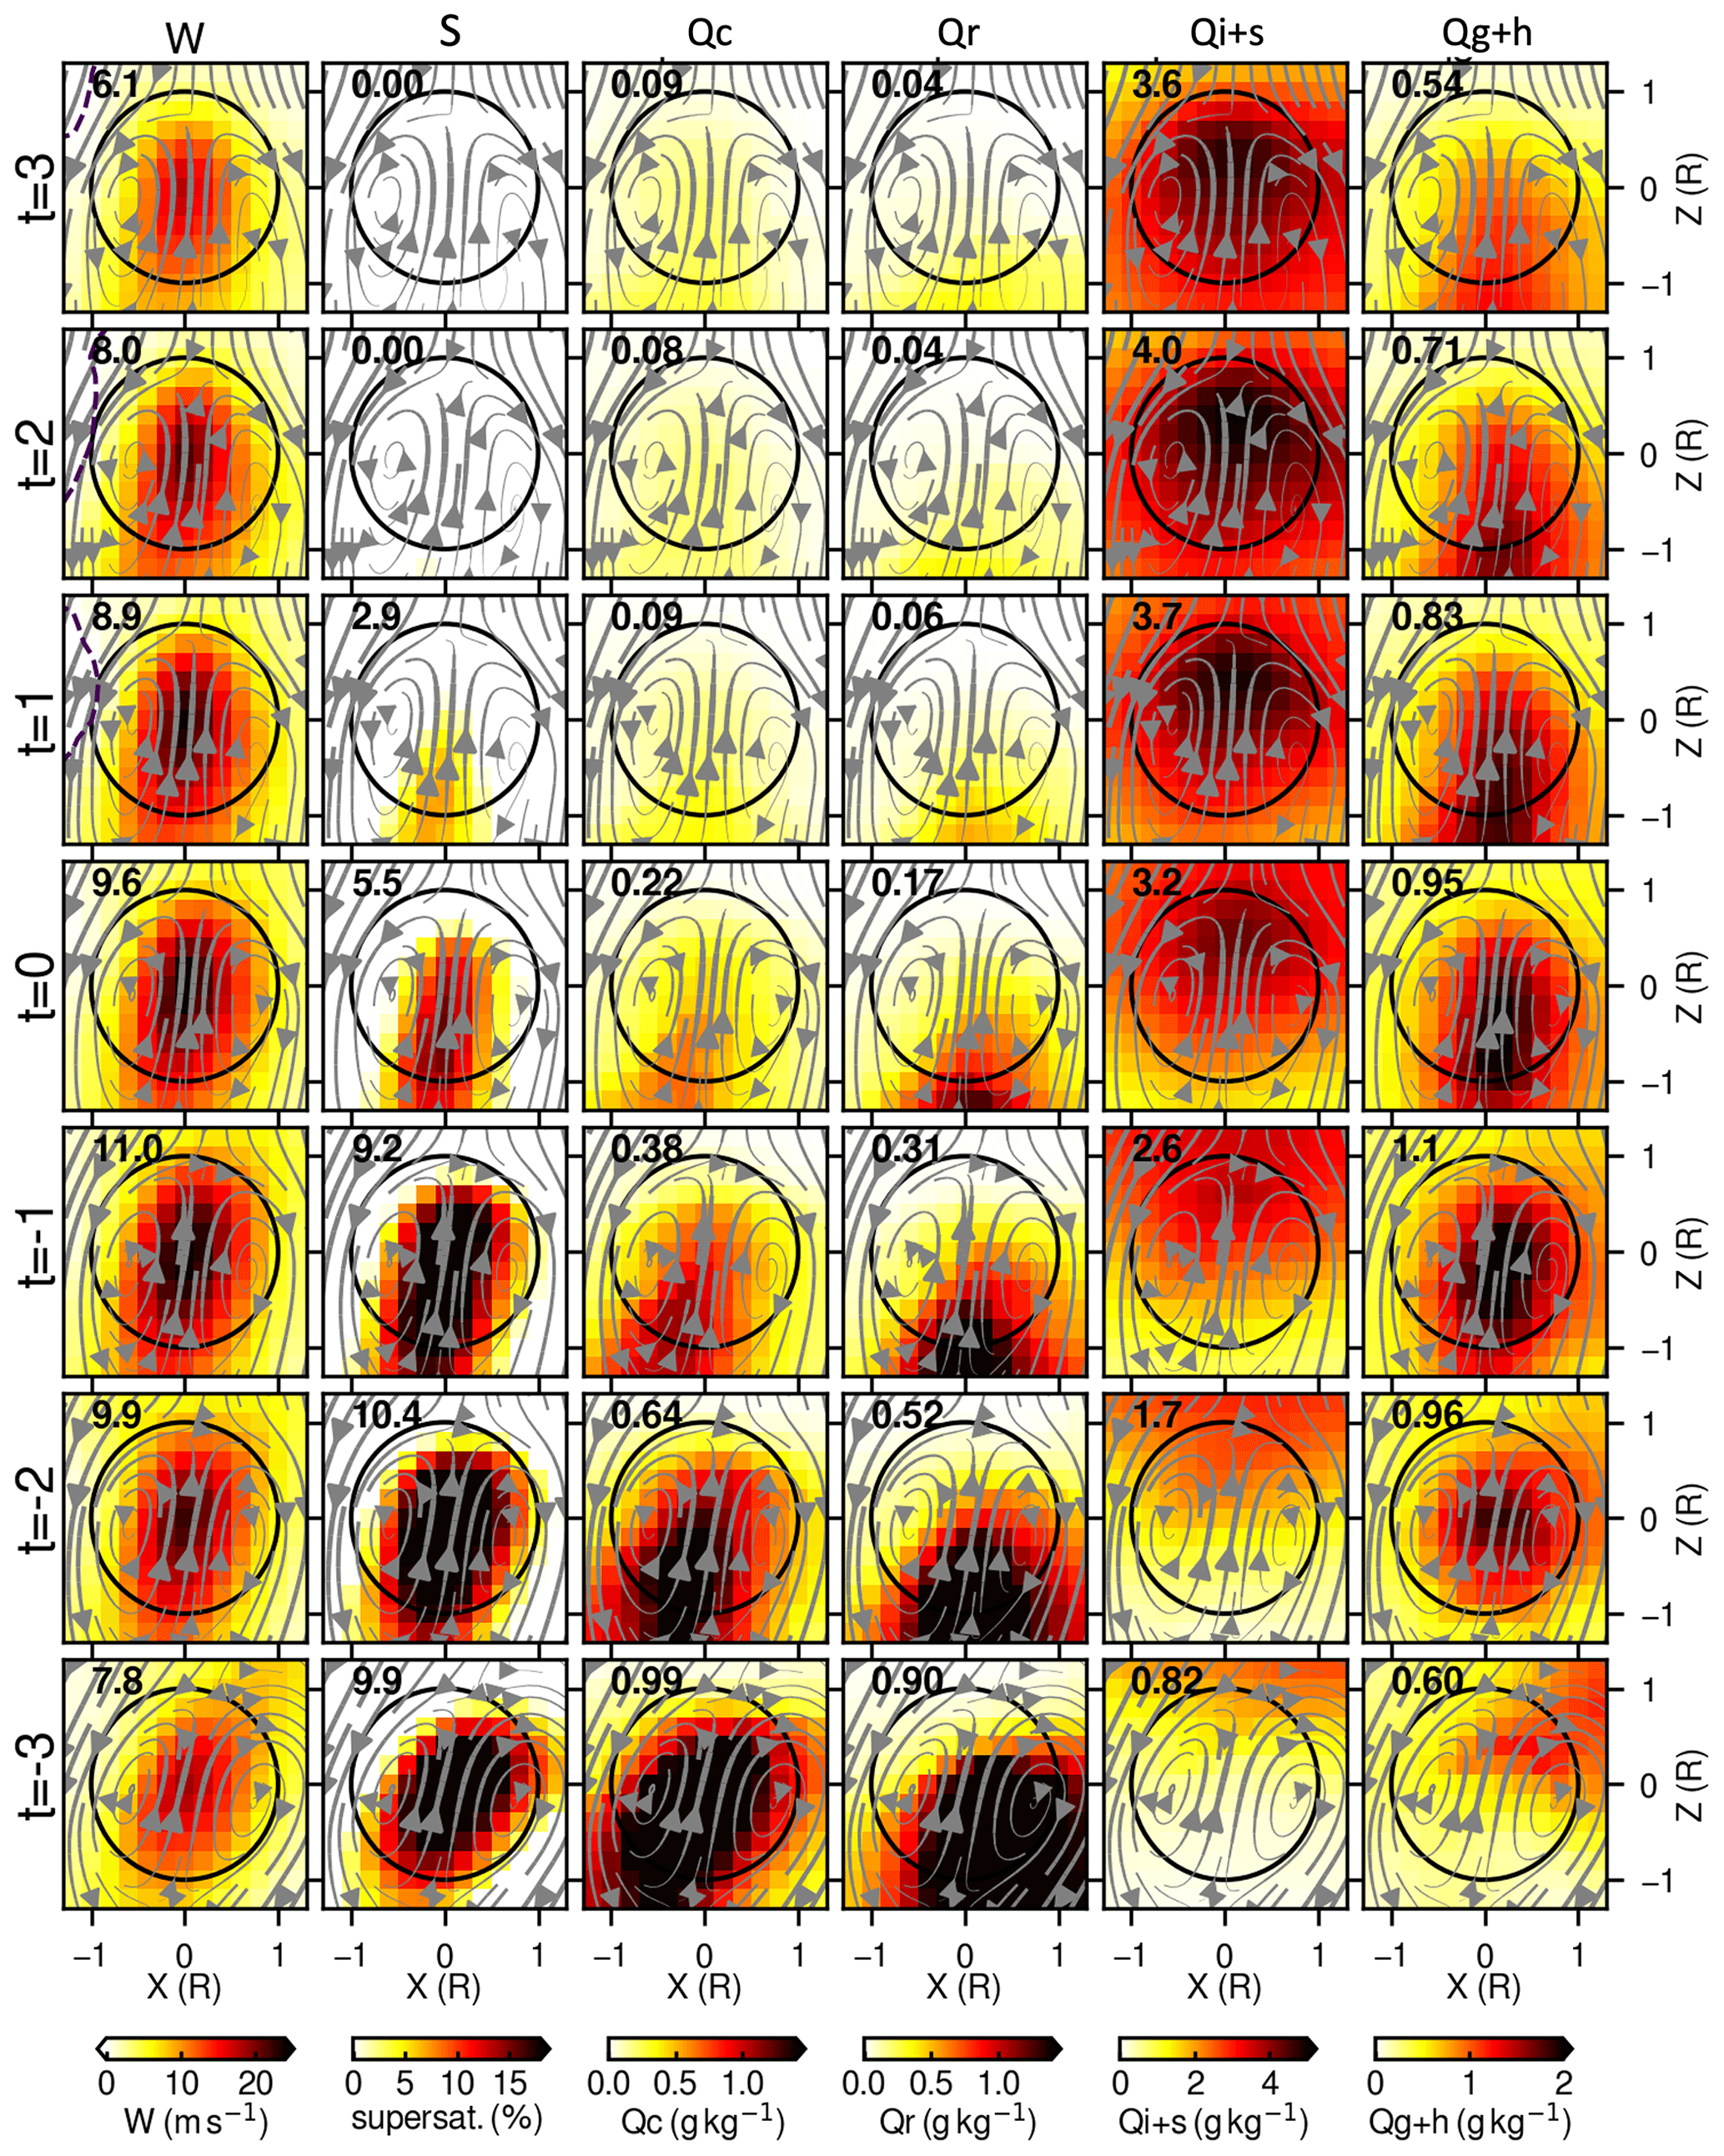
Figure 10Time series of cross sections along the x–z plane of thermal-mean values for the vertical velocity, supersaturation, cloud droplet mass concentration (Qc), rain mass concentration (Qr), ice and snow mass concentration (Qi+s), and graupel and hail mass concentration (Qg+h) for composites of all tracked thermals, scaled by their radius. The time unit is minutes.
In the dry case (Fig. 10), within thermals that experience an extended peak in W (6–11 m s−1), the average supersaturation, cloud, and rain mixing ratios peak at the earlier steps and decreases toward the end of the time steps. This indicates that a chunk of condensation heating is the main initial driver of moist thermal growth. These thermal properties are typically centered around the thermal core. In contrast, Qi+s properties are more homogeneous and less concentrated at the core of thermals, and they tend to increase toward the end of the time series. Especially, the early stages (t = −3, −2, and −1) indicate that thermals are approaching an existing ice layer, rather than generating ice around the thermal core. In the later stages (t = 1, 2, and 3), the Qi+s is weakly concentrated toward the upper thermal cores. This evolution of Qi+s suggests that thermals are not the main initiator of Qi+s at the beginning, while Qi+s is rather entrained into the thermal within the early stages of the mixed-phase zone, at least using single-moment bulk microphysics. On the other hand, once liquid saturation is no longer contributing substantially to Qc, Qi+s becomes a leading destination of the overall transfer from vapor to hydrometeor phases within thermals that remain vigorous, probably due to the Bergeron process (Bergeron, 1935). Further research is needed to investigate the ice nucleation and growth process in greater detail throughout the different stages of thermals' life cycles.
On the other hand, Qg+h increases toward the peak time of thermals (t = 0) and then starts decreasing toward the later time steps (t = 3). The spatial concentration of Qg+h also peaks around the thermal cores, similar to W, RH, Qc, and Qr. The increase in Qg+h coincides with the timing of thermal entrainment of Qi+s and a reduction in Qc and Qr for time steps between −3 and 0. This suggests that large concentrations of in-thermal Qc and Qr collide with entrained Qi+s to enhance the riming process, generating graupel and hail particles at the thermal core. Note that the 4ICE scheme only allows wet growth (collecting supercooled liquid) of graupel, while dry growth (collecting ice and aggregate) of graupel has been suppressed due to unrealistic graupel in the convective anvil (Lang et al., 2014). After the reference time step (t = 0), Qg+h decreases, most likely due to sedimentation exceeding production. As indicated by Fig. 8g and k, this spilled graupel and hail can further grow by colliding with supercooled liquid particles until melting. Taken together, this analysis also suggests that this vigorous Qg+h-generation process in the convective core does not occur via classic parcel-driven convection. Instead, these graupel and hail generation processes are most likely driven by sequential interactions of thermal ensembles and microphysical processes. Note that the time series of the wet case also shows a similar finding but is biased toward the thermals in the upper atmosphere (not shown here).
In addition to the reference time, we composited thermal properties at different altitude levels (Fig. 11). The method for sampling and compositing is the same as in Fig. 10; however, it characterizes vertical profiles of thermal composites using altitude references from 2.5 km up to 10.5 km, including the mean air temperature. Despite the different reference methods, altitude-reference plots appear to show similar patterns to time-reference plots. Vertical velocity (W) increases toward the peak level at 8.5 km, similar to the mean profile in Fig. 8c. There is strong supersaturation (S) between 4.5 and 6.5 km, which rapidly decreases above 8.5 km. The Qc, Qr, Qi+s, and Qg+h profiles also resemble thermal-mean profiles in Fig. 8d, e, f, and g, respectively. In thermal cores, Qc, Qr, and Qg+h are initially concentrated but sediment as thermals ascend. Even compared with the lifetime composite in Fig. 10, Qi+s values are more stratified horizontally, rather than toward thermal cores, particularly from 3.5 to 6.5 km, suggesting the entrainment of Qi+s within thermals at these altitudes. Simultaneously, Qc and Qr decrease while Qg+h increases at these altitudes. Because wet growth (ice collecting supercooled liquid) is the primary graupel growth process within 4ICE microphysics in the GCE (Lang et al., 2014), the droplet-loaded thermal penetration toward ice layers appears to be the important graupel/hail generation process within tropical deep convection.
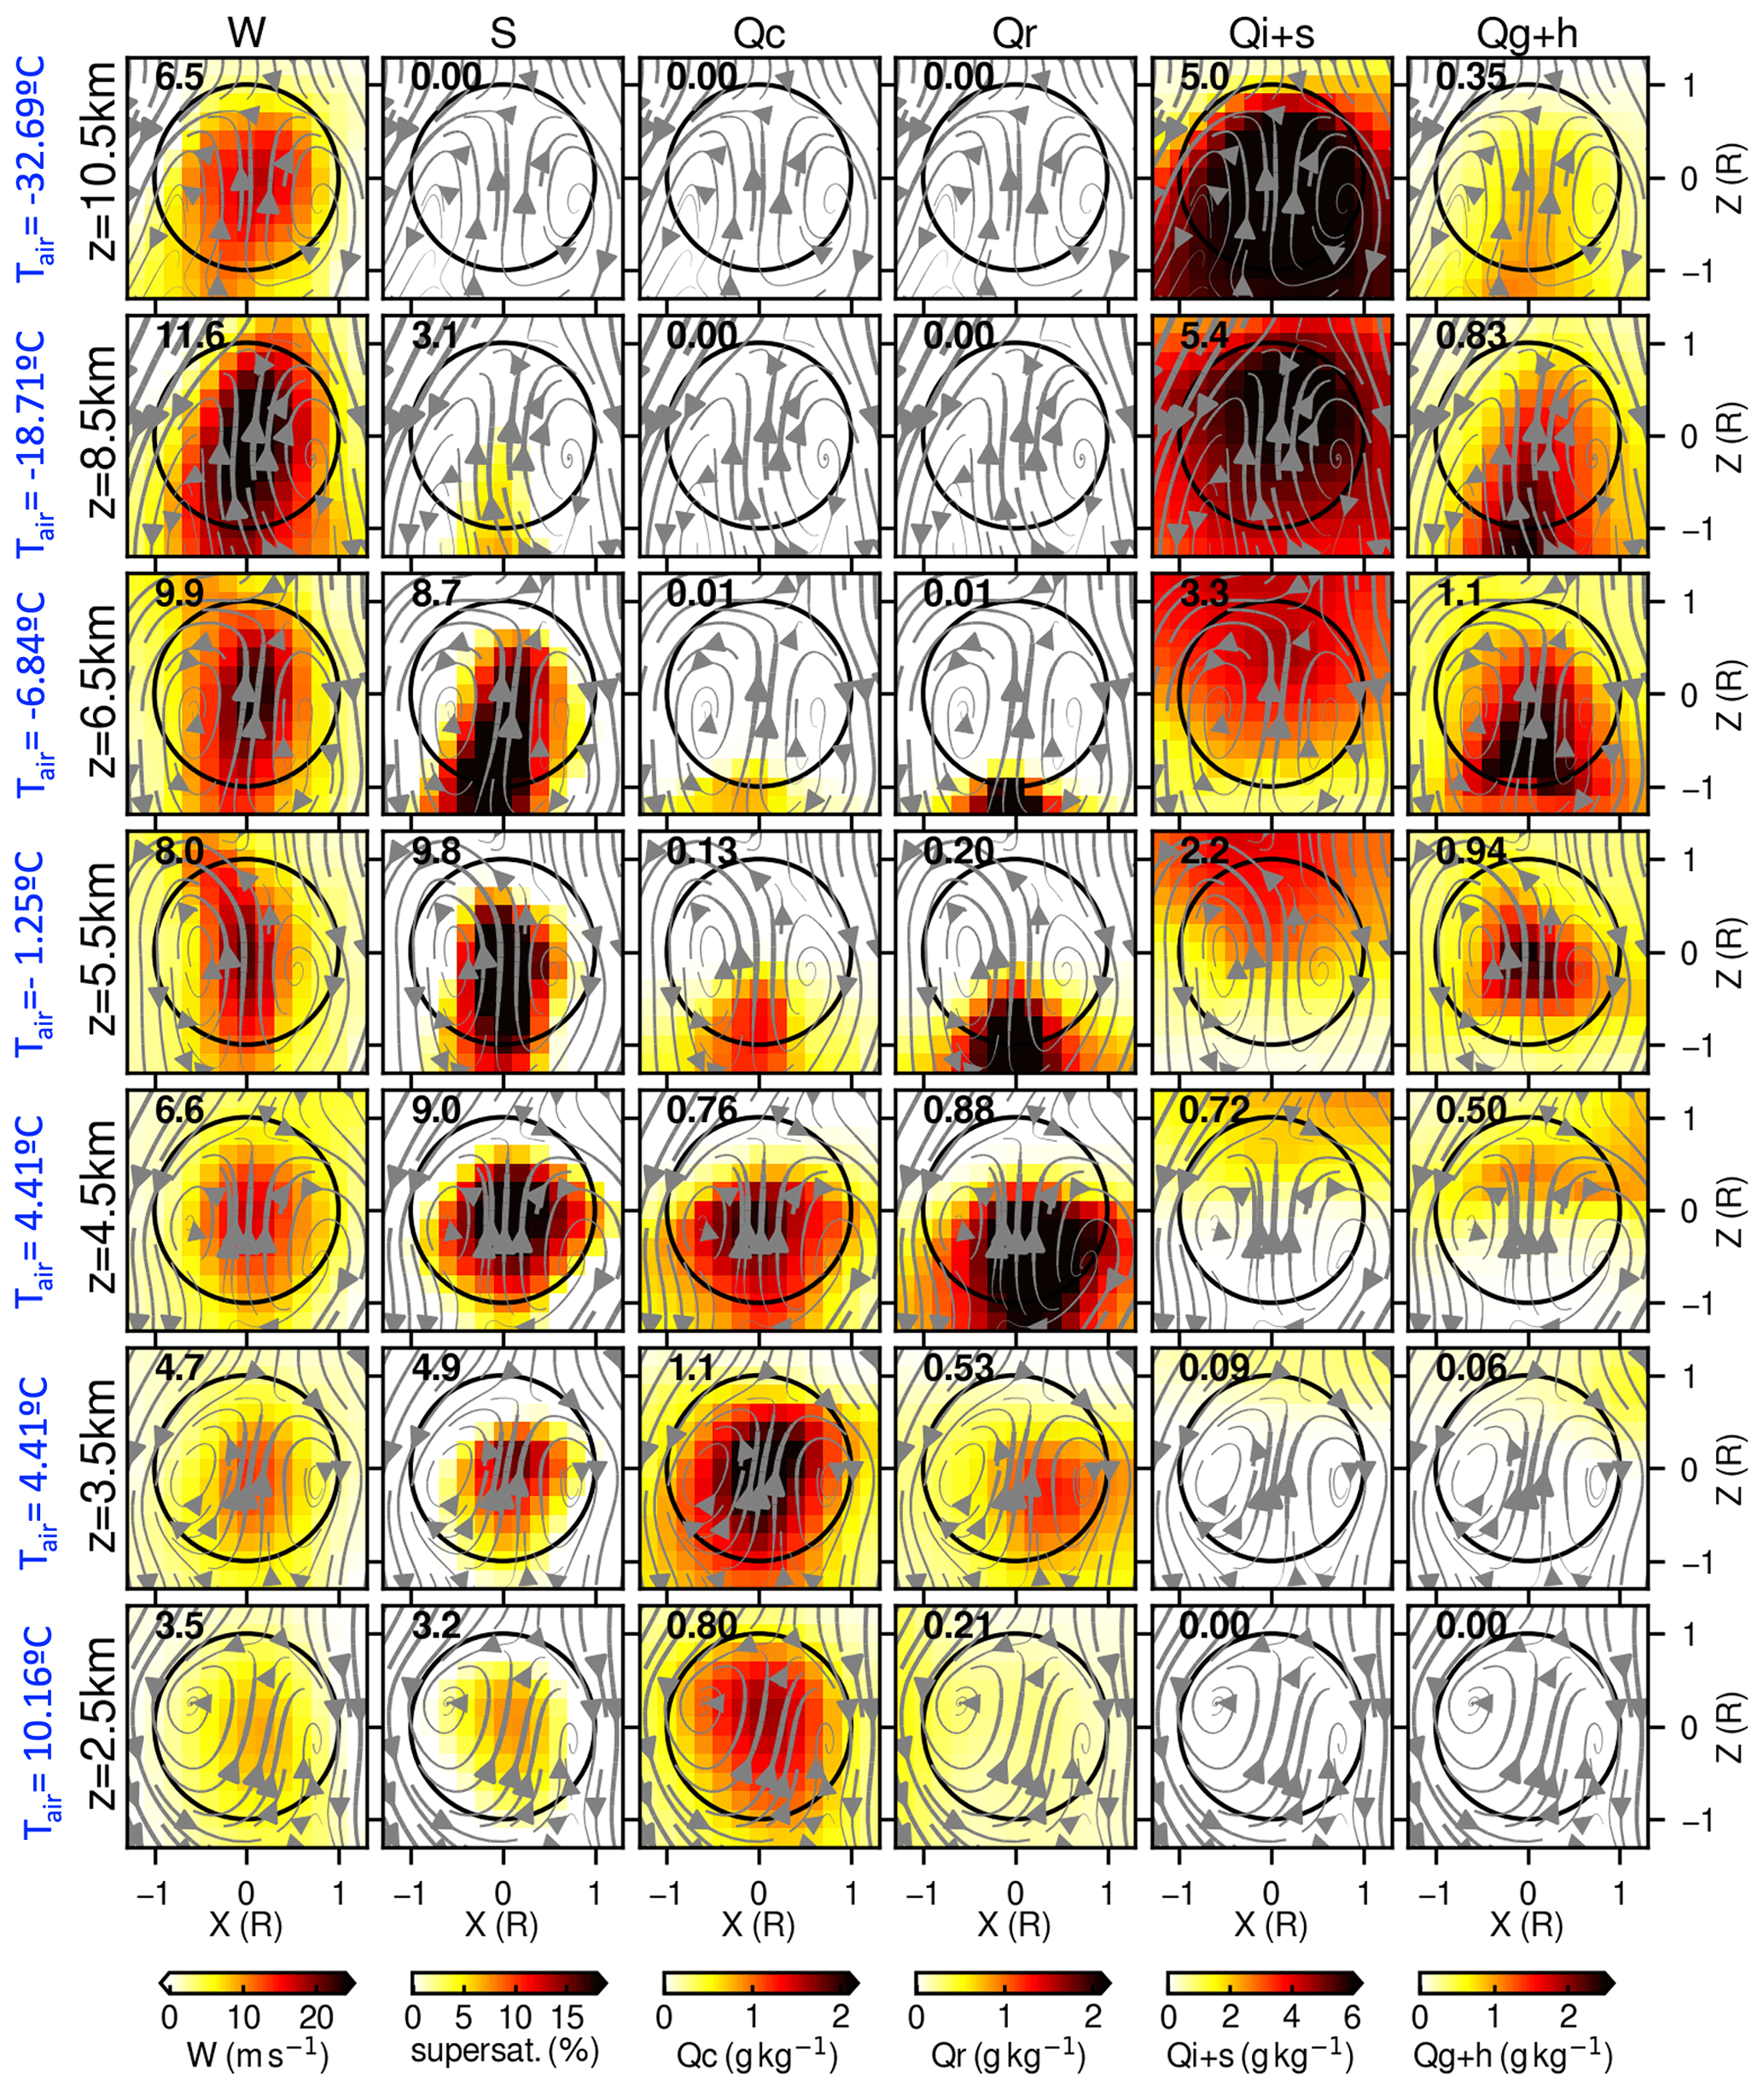
Figure 11Similar to Fig. 10 but composited at different altitude levels. Note that, for clarity, the shade scales are different from those used in Fig. 10.
We have investigated seasonal differences in the measured and simulated Vdop between the dry and wet seasons to confirm dry-season convective vigor associated with enhanced cold-precipitation (graupel and hail) processes. Tracked thermal properties from the selected case studies reveal unique updraft microphysics processes in the convective core that explain the dry–wet contrast in deep convection. To summarize our findings in graupel–hail development sequences, a thermal-driven process is proposed in the following steps (Fig. 12a):
-
Where condensation may occur within moist turbulent structures in the lower atmosphere, local moist thermals may be initiated, which are characterized by dipole vortex rings with intense vertical velocity, supersaturation, cloud droplets, and raindrops around the thermal core.
-
When moist thermals penetrate the 0 °C isothermal layer and dissipate in the mixed-phase zone, cloud droplets are detrained and gradually glaciated to form ice-particle layers.
-
As additional thermals fill with droplets at the thermal core and penetrate the glaciated mixed-phase zone, they entrain ice particles and collide with each other, generating graupel and hail embryos.
-
Once graupel and hail particles grow to a sufficient size, they start falling out from thermals and develop further by collecting supercooled droplets and ice particles during sedimentation.
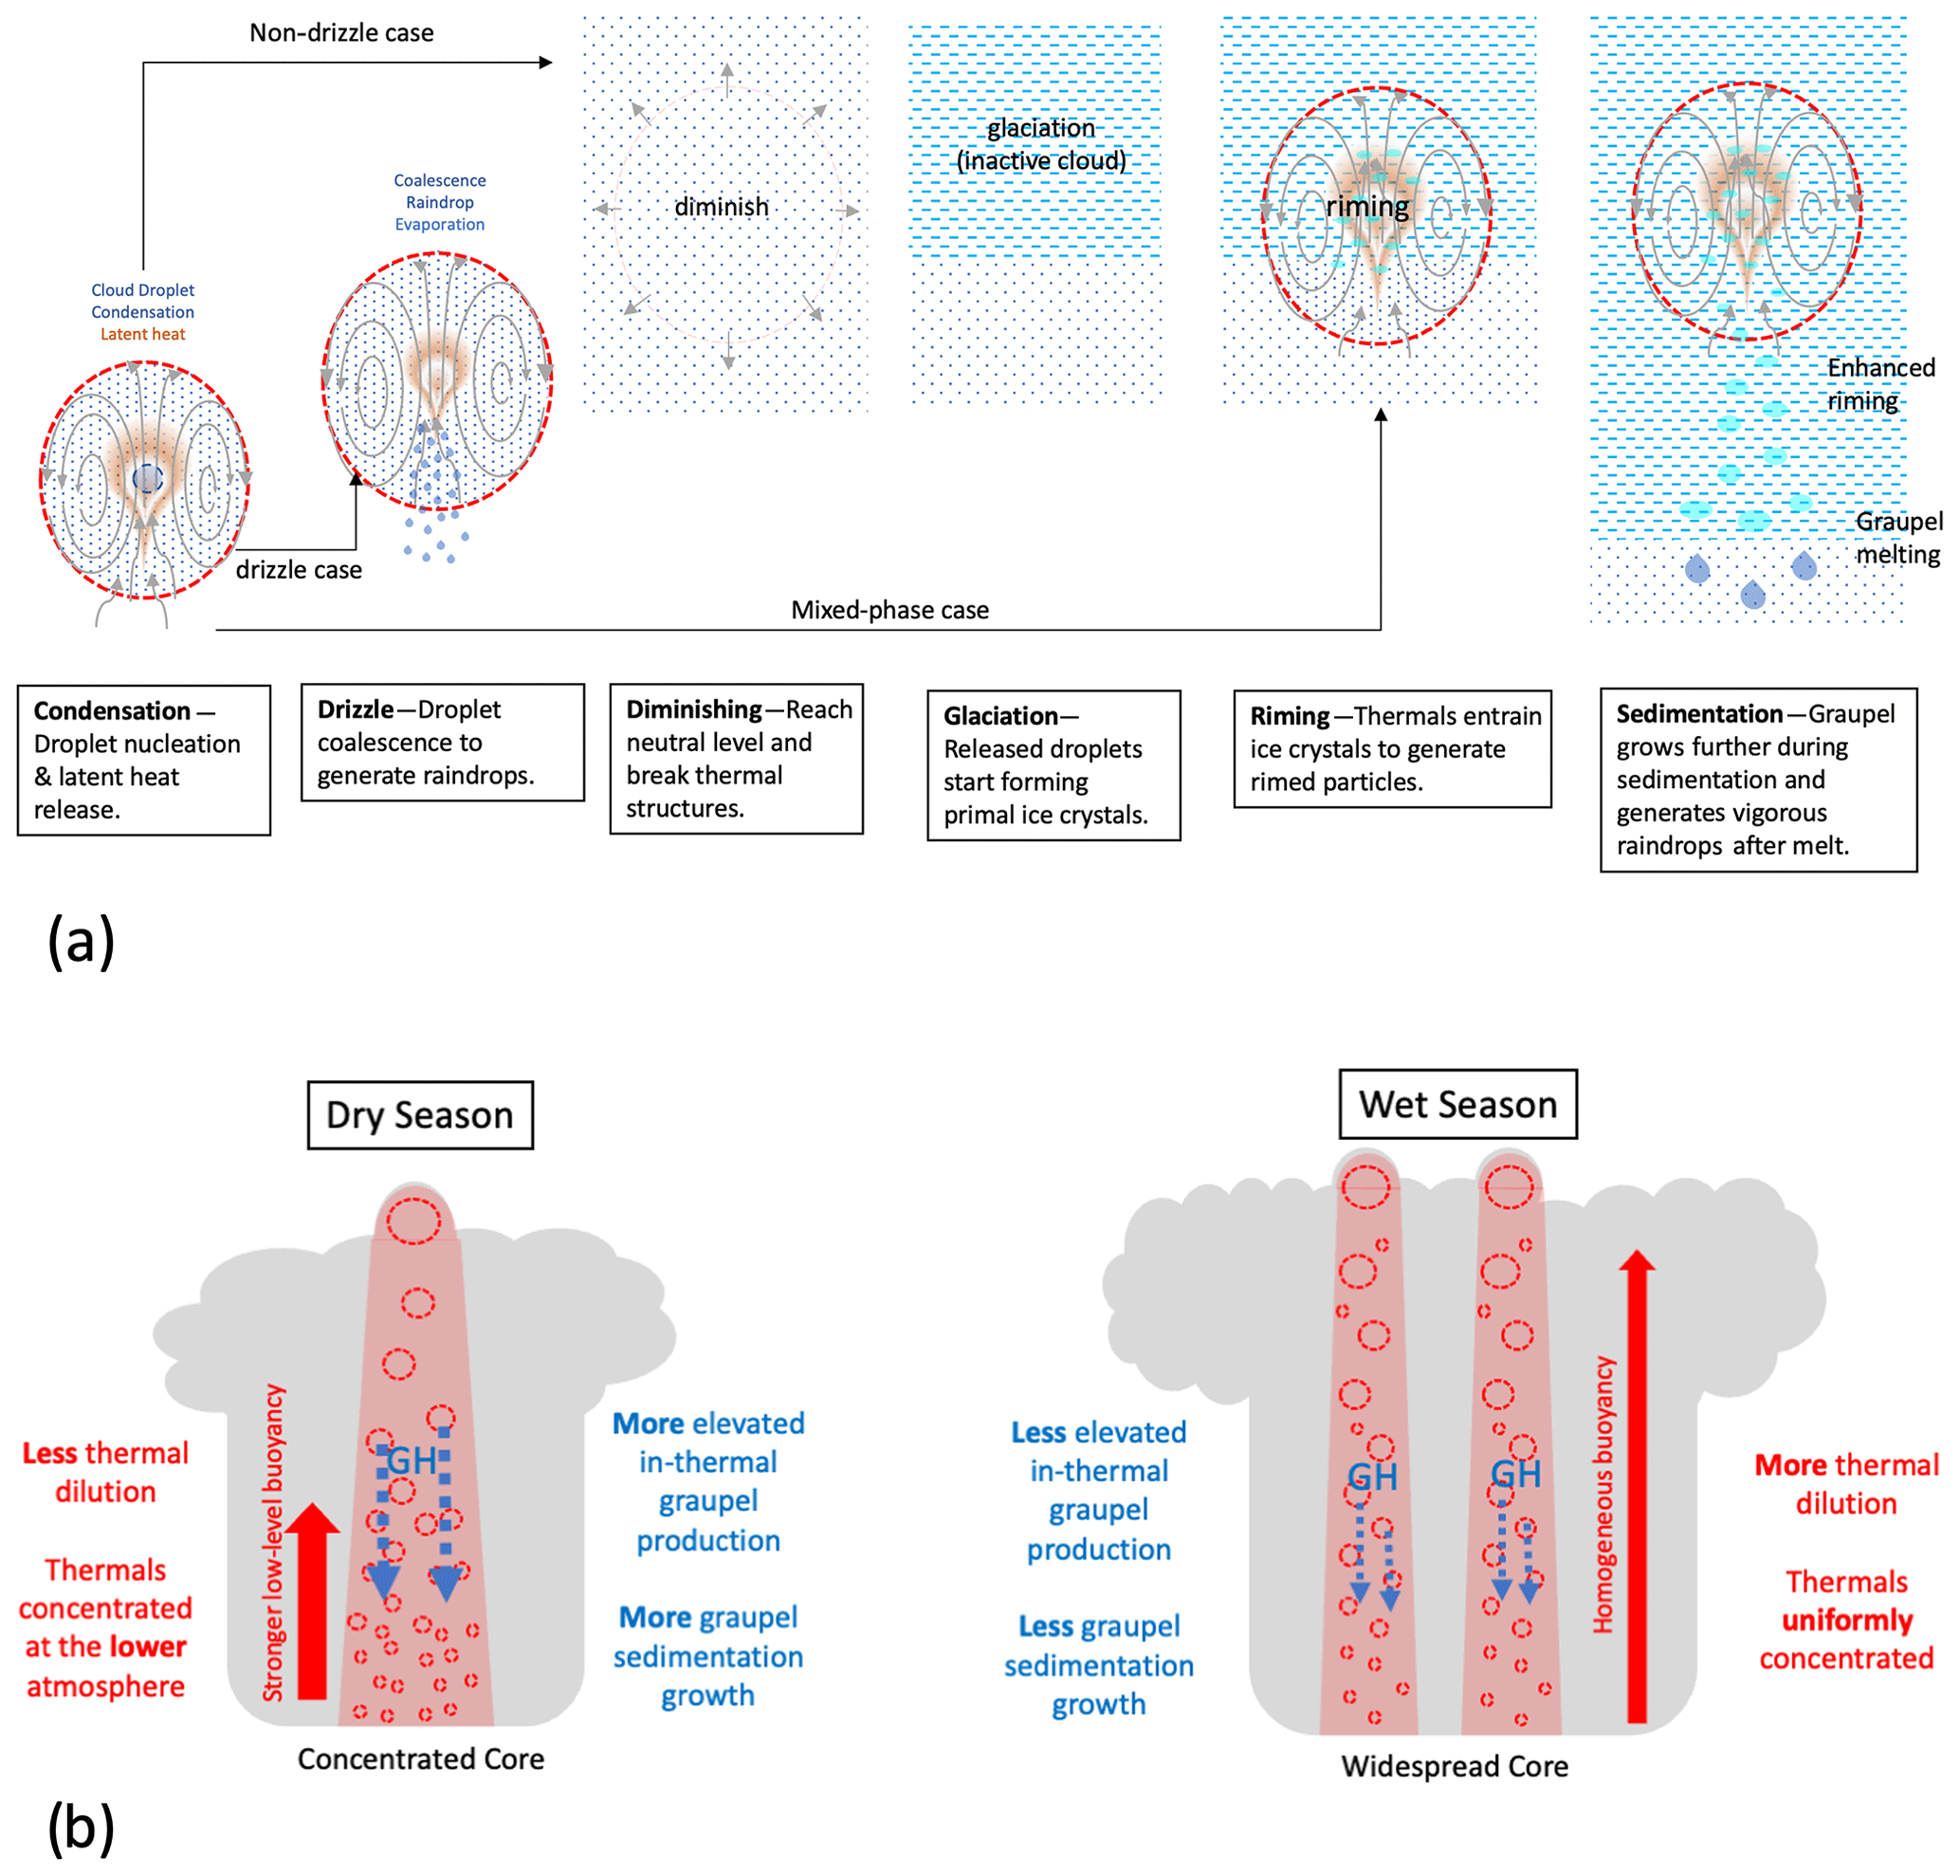
Figure 12(a) Diagram of the suggested mechanisms for generating graupel and hail through thermal processes. (b) Diagram of thermal characteristics in deep convection in the dry and wet seasons.
The process of generating ice layers (Step 3) could be the largest source of uncertainty in this study. To prove the convective vigor process, this study used the simple bulk single-moment microphysics parameterization (Lang et al., 2014; Tao et al., 2016). This parameterization tends to convert droplets into ice particles via the saturation adjustment process. Cloud droplets are glaciated much more quickly when compared to two-moment microphysics (e.g., Matsui et al., 2023). The time series and altitude-reference composite also show some ice generation within the thermal core in later life cycle stages (∼ 10 km altitude), which may be associated with the Bergeron process. Nevertheless, ice crystal formation processes remain one of the largest sources of microphysics uncertainty (Kanji et al., 2017; Korolev and Leisner, 2020) and need further investigation to establish the theory with adequate parameterization. Furthermore, updrafts passing through the melting layer containing both large drops and ice crystals (which are identified here as a source of graupel) have also been pinpointed as a leading source of secondary ice production in oceanic convection sampled extensively via aircraft (Korolev et al., 2020). Thus, all of the quantitative components of the proposed ice–graupel generation process described here remain uncertain and will be subject to future investigations via instrumental observations and more detailed numerical simulations.
Nonetheless, building on the ability of existing knowledge and simulations to reproduce some basic features of observations during GoAmazon, Fig. 12b shows a newly proposed process that can explain why dry-season convection has more graupel and intense precipitation than its wet-season counterpart in the following steps:
-
Dry-case (wet-case) convection tends to generate higher (lower) numbers of droplet-loaded thermals from the lower atmosphere because of larger potential buoyant energy at a low levels in the dry season.
-
Once an ice layer is built from initial cumulus thermal ensembles (Fig. 11a), higher (lower) numbers of droplet-loaded thermals penetrate ice layers to generate more (less) graupel and hail embryos in dry-case (wet-case) convection.
-
Individual dry-case (wet-case) thermals can rise to higher (lower) elevations via weaker (stronger) dilution with faster (slower) updraft, elevating in-thermal graupel at higher (lower) altitudes.
-
During sedimentation, graupel in dry-case (wet-case) thermals has a higher (lower) chance of growing due to the longer (shorter) distance toward the melting level.
These new processes are proposed from the golden cases for the dry and wet seasons. Further investigation with more case studies will augment our hypothesis in the future.
The “hotter” surface in the dry season must be the physical origin of step 1, similar to the L–O contrast (William and Stanfill, 2002). The dry season typically has clearer skies, less soil moisture, and stronger surface heating, leading to more turbulent heat flux and energy in the lower troposphere, even during the GoAmazon experiment (Biscaro et al., 2021; Ghate and Kollias, 2016). In contrast, the wet season is characterized by frequent precipitation and an increased release of atmospheric latent heat, with the weak surface sensible heat flux caused by soil moisture (Rocha et al., 2004). As a result, the entire troposphere experiences upward motion during the wet season, unlike its dry-season counterpart (Tang et al., 2016).
Contrary to the speculation made by William and Stanfill (2002), it has been found that stronger surface heating and a deeper planetary boundary layer during the dry season do not increase the thermal “size” based on the classic similarity theory of Morton et al. (1956). Instead, our analysis of simulations indicates that the numbers and updraft velocity profiles of cumulus thermals become more important, particularly those initiated in the lower troposphere. Even for similar CAPE, the concentration of potential buoyancy profiles in the lower troposphere can trigger more vigorous convection. This is similar to the difference between midlatitude continental and tropical maritime environments, where the midlatitude continental environment tends to have more potential buoyancy in the middle to lower troposphere, leading to continental convective vigor (Matsui et al., 2020). For this, we need to investigate boundary layer dry thermals and deep convective moist thermal seamlessly between various continental and maritime environments.
It is also hypothesized that the low-altitude concentrated cumulus thermal trains could additionally enhance the cold-precipitation process by improving the residence time of graupel and hail within the mixed-phase zone if thermal-spilled graupel and hail encounter subsequent new cumulus thermals. Previous trajectory modeling (Heymsfield, 1983) also suggested a similar mechanism for enhancing the graupel and hail residence time and growth by multiple convective cores. Heymsfield (1983) used the multi-Doppler technique to generate a three-dimensional wind field, but it needed a higher spatiotemporal resolution to characterize cumulus thermal. However, a stronger updraft core alluded to in the abovementioned study must be cumulus thermals. This investigation requires a more complex set of numerical simulations in the future.
The proposed thermal-driven invigoration process is based solely on thermodynamics and does not consider aerosols' effect on deep convection, as demonstrated by previous studies over the Amazon (William et al., 2002; Lin et al., 2006). Our choice of single-moment microphysics does not consider the variability in background aerosols with respect to initiating cloud droplets. However, this simple microphysics can generate a fundamental dry–wet contrast characterized by the Vdop statistics. This suggests that thermodynamics is the primary factor determining convective vigor, while aerosols may have a significant, although secondary, role in invigorating convection (Matsui et al., 2020). Future studies will require a higher-order-moment microphysics scheme to examine the impact of aerosols on droplet and primary ice nucleation in thermals to confirm our hypothesis that the dry–wet aerosol contrast plays a secondary role.
It is well known that severe hailstorms and large hail are more frequently observed over the central plains of North and South America (Liu and Zipser, 2015; Bang and Cecil, 2019). The hailstorms in these regions are often associated with supercells, and mesocyclones play a crucial role in the growth of very large hail by enhancing the residence time of the hail within the mixed-phase zone (e.g., Nelson, 1983; Ziegler et al., 1983). However, it is not known how a mesocyclone affects thermal-like or plume-like updraft characteristics (Morrison et al., 2020), although satellites have captured thermal-chain-like periodic overshooting signals at the top of the supercells (Borque et al., 2020). Thus, further observational and modeling investigations are required for the midlatitude regions to determine whether our proposed graupel–hail generation mechanisms can be applied.
The proposed process for graupel–hail generation and convective vigor is a time-dependent, sequential, coupled dynamics–microphysics process. Although the traditional plume-based mass flux scheme has been successful with respect to representing the moist convection process in climate models (e.g., Arakawa and Schubert, 1974), our proposed convective microphysics process is not linear and cannot be adequately represented by the traditional convective mass flux method. To represent this process, thermal-chain concepts with detailed microphysics processes must be introduced in the parameterization for large-scale models (Morrison et al., 2020). Fine-resolution simulations produce better continental convective vigor, as they can resolve thermal dynamics and microphysics (Robinson et al., 2011; Matsui et al., 2020). The mean radius of the tracked thermal in this study, conducted using a 200 m mesh LES, is around 1 km, with a maximum size of around 2 km, which is comparable to the LES study using a 65 m horizontal grid spacing (Hernandez-Deckers and Sherwood, 2016). However, due to the effective resolution being 5–10 times the actual grid spacing, cumulus thermals and graupel–hail generation processes are difficult to resolve for storm-resolving models and perhaps any coarser Eulerian-type numerical atmospheric models (Matsui et al., 2016). Conducting LESs for regional and global weather and climate models is impractical in the foreseeable future. Therefore, new types of coupled dynamics–microphysics cumulus thermal parameterization should be developed to better represent deep convection for storm-resolving and coarse-resolution weather and climate models.
New ground-based Doppler phased array radar (PAR) technology (Kollias et al., 2022b) or multi-Doppler agile scans (Kollias et al., 2022a) hold promise with respect to observing and characterizing cumulus thermals. Emerging PAR instruments have started capturing storm motion and microphysical details at spatial and temporal resolutions akin to those seen in LES output (e.g., Takahashi et al., 2019; Kikuchi et al., 2020). These new observational capabilities are necessary for refining the dynamics and microphysics in LESs, particularly for elucidating the process behind thermal-driven convective vigor. Moreover, the advent of vertical-motion estimates from high-resolution space-based radars (EarthCARE; Wehr et al., 2023; Investigation of Convective Updrafts, INCUS, https://incus.colostate.edu, last access: 16 September 2024; the Atmosphere Observing System, AOS, https://aos.gsfc.nasa.gov, last access: 16 September 2024) will soon enable the global mapping of convective updrafts. These new satellite radar measurements will generate a comprehensive global catalog detailing convective vigor and the speed of intense thermals.
The GCE LES, G-SDSU simulator, and Python plotting codes used in this paper are all available from the NCCS DataPortal (https://portal.nccs.nasa.gov/datashare/cloudlibrary/PUB_DATA/GoAmazon_ACP/Code/, NCCS, 2024a).
The RWP measurements and VARANAL LSF data are available from the Atmospheric Radiation Measurement (ARM) Data Discovery portal (https://doi.org/10.5439/1879988, Xie et al., 2024; https://doi.org/10.5439/1256461, Coulter et al., 2024). These data were obtained from the ARM Mobile Facility (AMF) at Manacapuru, Amazonas, Brazil, funded by a US Department of Energy (DOE) Office of Science User Facility managed by the Biological and Environmental Research program. The analysis data used in this paper are also available from the NCCS DataPortal (https://portal.nccs.nasa.gov/datashare/cloudlibrary/PUB_DATA/GoAmazon_ACP/Data/, NCCS, 2024b).
TM designed and performed the GCE LESs, the Vdop forward simulation, and the thermal tracking. DHD developed the thermal tracking and analysis code for the GCE LESs and prepared the Vdop figures for the thermal analysis. SEG and TSB prepared the RWP Vdop analysis. TM prepared the manuscript with contributions from all co-authors.
At least one of the (co-)authors is a member of the editorial board of Atmospheric Chemistry and Physics. The peer-review process was guided by an independent editor, and the authors also have no other competing interests to declare.
Publisher’s note: Copernicus Publications remains neutral with regard to jurisdictional claims made in the text, published maps, institutional affiliations, or any other geographical representation in this paper. While Copernicus Publications makes every effort to include appropriate place names, the final responsibility lies with the authors.
The development of GCE has been funded by the NASA GSFC Strategic Science resources (associate director for institutional planning and operation: Karen Mohr). We also thank the NASA Advanced Supercomputing (NAS) Division and Center for Climate Simulation (NCCS) (project manager at NASA HQ: Tsengdar J. Lee) for providing the computational resources to conduct the GCE and G-SDSU simulations, carry out the thermal tracking analysis, and store model outputs. The authors thank the two anonymous reviewers for improving the paper.
This research has been supported by the National Aeronautics and Space Administration (grant no. 80NSSC21K1135; project manager at NASA HQ: David B. Considine).
This paper was edited by Minghuai Wang and reviewed by two anonymous referees.
Arakawa, A. and Schubert, W. H.: Interaction of a cumulus cloud ensemble with the large–scale environment, Part I, J. Atmos. Sci., 31, 674–701, https://doi.org/10.1175/1520-0469(1974)031<0674>2.0.CO;2, 1974.
Bang, S. D. and Cecil, D. J.: Constructing a Multifrequency Passive Microwave Hail Retrieval and Climatology in the GPM Domain, J. Appl. Meteorol. Clim., 58, 1889–1904, https://doi.org/10.1175/JAMC-D-19-0042.1, 2019.
Bergeron, T.: On the physics of cloud and precipitation, Proc. 5th Assembly U.G.G.I., Lisbon, 2, 156, 1935.
Biscaro, T. S., Machado, L. A. T., Giangrande, S. E., and Jensen, M. P.: What drives daily precipitation over the central Amazon? Differences observed between wet and dry seasons, Atmos. Chem. Phys., 21, 6735–6754, https://doi.org/10.5194/acp-21-6735-2021, 2021.
Blyth, A. M. and Latham, J.: Development of ice and precipitation in New Mexican summertime cumulus clouds, Q. J. Roy. Meteor. Soc., 119, 91–120, https://doi.org/10.1002/qj.49711950905, 1993.
Blyth, A. M., Lasher-Trapp, S. G., and Cooper, W. A.: A study of thermals in cumulus clouds, Q. J. Roy. Meteor. Soc., 131, 1171–1190, https://doi.org/10.1256/qj.03.180, 2005.
Borque, P., Vidal, L., Rugna, M., Lang, T. J., Nicora, M. G., and Nesbitt, S. W.: Distinctive Signals in 1-min Observations of Overshooting Tops and Lightning Activity in a Severe Supercell Thunderstorm, J. Geophys. Res.-Atmos., 125, e2020JD032856, https://doi.org/10.1029/2020JD032856, 2020.
Chou, M.-D. and Suarez, M. J.: A solar radiation parameterization for atmospheric studies, NASA Tech. Rep. NASA/TM-1999-10460, NASA GSFC, Vol. 15, p. 38, 1999.
Chou, M.-D. and Suarez, M. J.: A thermal infrared radiation parameterization for atmospheric studies, NASA Tech. Rep. NASA/TM-2001-104606, NASA GSFC, Vol. 19, p. 55, 2001.
Coulter, R., Muradyan, P., and Martin, T.: Radar Wind Profiler (1290RWPPRECIPMOM), Atmospheric Radiation Measurement (ARM) User Facility, mao1290precipmomM1.a0, ARM [data set], https://doi.org/10.5439/1256461, 2024.
Dee, D. P., Uppala, S. M., Simmons, A. J., Berrisford, P., Poli, P., Kobayashi, S., Andrae, U., Balmaseda, M. A., Balsamo, G., Bauer, P., Bechtold, P., Beljaars, A. C. M., Bidlot, J., Bormann, N., Delsol, C., Dragani, R., Fuentes, M., Geer, A. J., Haimberger, L., and Vitart, F.: The ERA-Interim reanalysis: Configuration and performance of the data assimilation system, Q. J. Roy. Meteor. Soc., 137, 553–597, https://doi.org/10.1002/qj.828, 2011.
Dolan, B., Fuchs, B., Rutledge, S. A., Barnes, E. A., and Thompson, E. J.: Primary Modes of Global Drop Size Distributions, J. Atmos. Sci., 75, 1453–1476, https://doi.org/10.1175/JAS-D-17-0242.1, 2018.
Emanuel, K. A., Neelin, J. D., and Bretherton, C. S.: On large-scale circulations in convecting atmospheres, Q. J. Roy. Meteor. Soc., 120, 1111–1143, https://doi.org/10.1002/qj.49712051902, 1994.
Ghate, V. P. and Kollias, P.: On the Controls of Daytime Precipitation in the Amazonian Dry Season, J. Hydrometeorol., 17, 3079–3097, https://doi.org/10.1175/JHM-D-16-0101.1, 2016.
Giangrande, S. E., Luke, E. P., and Kollias, P.: Characterization of Vertical Velocity and Drop Size Distribution Parameters in Widespread Precipitation at ARM Facilities, J. Appl. Meteorol. Clim., 51, 380–391, https://doi.org/10.1175/JAMC-D-10-05000.1, 2012.
Giangrande, S. E., Collis, S., Straka, J., Protat, A., Williams, C., and Krueger, S.: A Summary of Convective-Core Vertical Velocity Properties Using ARM UHF Wind Profilers in Oklahoma, J. Appl. Meteorol. Clim., 52, 2278–2295, https://doi.org/10.1175/JAMC-D-12-0185.1, 2013.
Giangrande, S. E., Toto, T., Jensen, M. P., Bartholomew, M. J., Feng, Z., Protat, A., Williams, C. R., Schumacher, C., and Machado, L.: Convective cloud vertical velocity and mass-flux characteristics from radar wind profiler observations during GoAmazon2014/5, J. Geophys. Res.-Atmos., 121, 12891–12913, https://doi.org/10.1002/2016JD025303, 2016.
Giangrande, S. E., Feng, Z., Jensen, M. P., Comstock, J. M., Johnson, K. L., Toto, T., Wang, M., Burleyson, C., Bharadwaj, N., Mei, F., Machado, L. A. T., Manzi, A. O., Xie, S., Tang, S., Silva Dias, M. A. F., de Souza, R. A. F., Schumacher, C., and Martin, S. T.: Cloud characteristics, thermodynamic controls and radiative impacts during the Observations and Modeling of the Green Ocean Amazon (GoAmazon2014/5) experiment, Atmos. Chem. Phys., 17, 14519–14541, https://doi.org/10.5194/acp-17-14519-2017, 2017.
Giangrande, S. E., Wang, D., and Mechem, D. B.: Cloud regimes over the Amazon Basin: perspectives from the GoAmazon2014/5 campaign, Atmos. Chem. Phys., 20, 7489–7507, https://doi.org/10.5194/acp-20-7489-2020, 2020.
Giangrande, S. E., Biscaro, T. S., and Peters, J. M.: Seasonal controls on isolated convective storm drafts, precipitation intensity, and life cycle as observed during GoAmazon2014/5, Atmos. Chem. Phys., 23, 5297–5316, https://doi.org/10.5194/acp-23-5297-2023, 2023.
Grabowski, W. W. and Petch, J.: Deep Convective Clouds, in: Clouds in the Perturbed Climate System: Their Relationship to Energy Balance, MIT Press, 197–215, https://doi.org/10.7551/mitpress/9780262012874.003.0009, 2009.
Gu, J.-F., Plant, R. S., Holloway, C. E., and Muetzelfeldt, M. R.: Pressure drag for shallow cumulus clouds: From thermals to the cloud ensemble, Geophys. Res. Lett., 47, e2020GL090460, https://doi.org/10.1029/2020GL090460, 2020.
Hartmann, D. L.: Global Physical Climatology, 2nd edn., Academic Press, Cambridge, UK, https://doi.org/10.1016/C2009-0-00030-0, 2016.
Hernandez-Deckers, D. and Sherwood, S. C.: A Numerical Investigation of Cumulus Thermals, J. Atmos. Sci., 73, 4117–4136, https://doi.org/10.1175/JAS-D-15-0385.1, 2016.
Hernandez-Deckers, D. and Sherwood, S. C.: On the Role of Entrainment in the Fate of Cumulus Thermals, J. Atmos. Sci., 75, 3911–3924, https://doi.org/10.1175/JAS-D-18-0077.1, 2018.
Hernandez-Deckers, D., Matsui, T., and Fridlind, A. M.: Updraft dynamics and microphysics: on the added value of the cumulus thermal reference frame in simulations of aerosol–deep convection interactions, Atmos. Chem. Phys., 22, 711–724, https://doi.org/10.5194/acp-22-711-2022, 2022.
Heymsfield, A. J.: Case Study of a Halistorm in Colorado. Part IV: Graupel and Hail Growth Mechanisms Deduced through Particle Trajectory Calculations, J. Atmos. Sci., 40, 1482–1509, https://doi.org/10.1175/1520-0469(1983)040<1482:CSOAHI>2.0.CO;2, 1983.
Holland, G. J., John, L., McBride, R. K., Smith, D. J., Jasper, D., and Keenan, T. D.: The BMRC Australian Monsoon Experiment: AMEX, B. Am. Meteorol. Soc., 67, 1466–1472, https://doi.org/10.1175/1520-0477(1986)067<1466:TBAMEA>2.0.CO;2, 1986.
Iguchi, T., Matsui, T., Tao, W., Khain, A., Phillips, V., Kidd, C., L'Ecuyer, T., Braun, S., and Hou, A.: WRF-SBM simulations of melting layer structure in mixed-phase precipitation events observed during LPVEx, J. Appl. Meteorol. Clim., 53, 2710–2731, https://doi.org/10.1175/JAMC-D-13-0334.1, 2014.
Jeyaratnam, J., Luo, Z. J., Giangrande, S. E., Wang, D., and Masunaga, H.: A satellite-based estimate of convective vertical velocity and convective mass flux: Global survey and comparison with radar wind profiler observations, Geophys. Res. Lett., 48, e2020GL090675, https://doi.org/10.1029/2020GL090675, 2021.
Kanji, Z. A., Ladino, L. A., Wex, H., Boose, Y., Burkert-Kohn, M., Cziczo, D. J., and Krämer, M.: Overview of Ice Nucleating Particles, Meteor. Mon., 58, 1.1–1.33, https://doi.org/10.1175/AMSMONOGRAPHS-D-16-0006.1, 2017.
Keenan, T. D. and Carbone, R. E.: A Preliminary Morphology of Precipitation Systems In Tropical Northern Australia, Q. J. Roy. Meteor. Soc., 118, 283–326, https://doi.org/10.1002/qj.49711850406, 1992.
Kikuchi, H., Suezawa, T., Ushio, T., Takahashi, N., Hanado, H., Nakagawa, K., Osada, M., Maesaka, T., Iwanami, K., Yoshimi, K., and Mizutani, F.: Initial observations for precipitation cores with X-band dual polarized phased array weather radar, IEEE T. Geosci. Remote, 58, 3657–3666, https://doi.org/10.1109/TGRS.2019.2959628, 2020.
Kollias, P., Luke, E. P., Tuftedal, K., Dubois, M., and Knapp, E. J.: Agile Weather Observations using a Dual-Polarization X-band Phased Array Radar, 2022 IEEE Radar Conference (RadarConf22), 21–25 March 2022, New York City, NY, USA, 1–6, https://doi.org/10.1109/RadarConf2248738.2022.9764308, 2022a.
Kollias, P., Palmer, R., Bodine, D., Adachi, T., Bluestein, H., Cho, J., Griffin, C., Houser, J., Kirstetter, P., Kumjian, M., Kurdzo, J., Lee, W., Luke, E., Nesbitt, S., Oue, M., Shapiro, A., Rowe, A., Salazar, J., Tanamachi, R., Tuftedal, K., Wang, X., Zrnić, D., and Treserras, B.: Science Applications of Phased Array Radars, B. Am. Meteorol. Soc., 103, E2370–E2390, https://doi.org/10.1175/BAMS-D-21-0173.1, 2022b.
Korolev, A. and Leisner, T.: Review of experimental studies of secondary ice production, Atmos. Chem. Phys., 20, 11767–11797, https://doi.org/10.5194/acp-20-11767-2020, 2020.
Korolev, A., Heckman, I., Wolde, M., Ackerman, A. S., Fridlind, A. M., Ladino, L. A., Lawson, R. P., Milbrandt, J., and Williams, E.: A new look at the environmental conditions favorable to secondary ice production, Atmos. Chem. Phys., 20, 1391–1429, https://doi.org/10.5194/acp-20-1391-2020, 2020.
Lang, S. E., Tao, W.-K., Chern, J.-D., Wu, D., and Li, X.: Benefits of a fourth ice class in the simulated radar reflectivities of convective systems using a bulk microphysics scheme, J. Atmos. Sci., 71, 3583–3612, https://doi.org/10.1175/JAS-D-13-0330.1, 2014.
Lin, J. C., Matsui, T., Pielke Sr., R. A., and Kummerow, C.: Effects of biomass burning-derived aerosols on precipitation and clouds in the Amazon Basin: A satellite-based empirical study, J. Geophys. Res., 111, D19204, https://doi.org/10.1029/2005JD006884, 2006.
Liu, C. and Zipser, E. J.: The global distribution of largest, deepest, and most intense precipitation systems, Geophys. Res. Lett., 42, 3591–3595, https://doi.org/10.1002/2015GL063776, 2015.
Lucas, C., Zipser, E. J., and Lemone, M. A.: Vertical velocity in oceanic convection off tropical Australia, J. Atmos. Sci., 51, 3183–3193, https://doi.org/10.1175/1520-0469(1994)051<3183:VVIOCO>2.0.CO;2, 1994.
Martin, S., Artaxo, P., Machado, L., Manzi, A., Souza, R., Schumacher, C., Wang, J., Biscaro, T., Brito, J., Calheiros, A., Jardine, K., Medeiros, A., Portela, B., de Sá, S., Adachi, K., Aiken, A., Albrecht, R., Alexander, L., Andreae, M., Barbosa, H., Buseck, P., Chand, D., Comstock, J., Day, D., Dubey, M., Fan, J., Fast, J., Fisch, G., Fortner, E., Giangrande, S., Gilles, M., Goldstein, A., Guenther, A., Hubbe, J., Jensen, M., Jimenez, J., Keutsch, F., Kim, S., Kuang, C., Laskin, A., McKinney, K., Mei, F., Miller, M., Nascimento, R., Pauliquevis, T., Pekour, M., Peres, J., Petäjä, T., Pöhlker, C., Pöschl, U., Rizzo, L., Schmid, B., Shilling, J., Dias, M., Smith, J., Tomlinson, J., Tóta, J., and Wendisch, M. : The Green Ocean Amazon Experiment (GoAmazon2014/5) Observes Pollution Affecting Gases, Aerosols, Clouds, and Rainfall over the Rain Forest, B. Am. Meteorol. Soc., 98, 981–997, https://doi.org/10.1175/BAMS-D-15-00221.1, 2017.
Matsui, T. and Mocko, D. M.: Transpiration and Physical Evaporation: Regional and Seasonal Variability Over the Conterminous United States, in: Encyclopedia of Natural Resources, edited by: Wang, Y. Q., Taylor & Francis Group, New York, 1086 pp., ISBN 9781439852583, 2014.
Matsui, T., Ichoku, C., Randles, C., Yuan, T., da Silva, A., Colarco, P., Kim, D., Levy, R., Sayer, A., Chin, M., Giles, D., Holben, B., Welton, E., Eck, T., and Remer, L.: Current and Future Perspectives of Aerosol Research at NASA Goddard Space Flight Center, BAMS Meeting Summary, 95, ES203–ES207, https://doi.org/10.1175/BAMS-D-13-00153.1, 2014a.
Matsui, T., Santanello, J., Shi, J. J., Tao, K., Wu, D., Peters-Lidard, C., Kemp, E., Chin, M., Starr, D., Sekiguchi, M., and Aires, F.: Introducing multisensor satellite radiance-based evaluation for regional Earth System modeling, J. Geophys. Res.-Atmos., 119, 8450–8475, https://doi.org/10.1002/2013JD021424, 2014b.
Matsui, T., Chern, J., Tao, W., Lang, S., Satoh, M., Hashino, T., and Kubota, T.: On the land–ocean contrast of tropical convection and microphysics statistics derived from TRMM satellite signals and global storm-resolving models, J. Hydrometeorol., 17, 1425–1445, https://doi.org/10.1175/JHM-D-15-0111.1, 2016.
Matsui, T., Zhang, S. Q., Lang, S. E., Tao, W.-K., Liu, Y., Shige, S., and Takayabu, Y. N.: Impact of radiation frequency, precipitation radiative forcing, and radiation column aggregation on convection-permitting West African monsoon simulations, Clim. Dynam., 55, 193–213, https://doi.org/10.1007/s00382-018-4187-2, 2018.
Matsui, T., Dolan, B., Iguchi, T., Rutledge, S. A., Tao, W., and Lang, S.: Polarimetric radar characteristics of simulated and observed intense convective cores for a midlatitude continental and tropical maritime environment, J. Hydrometeorol., 21, 501–517, https://doi.org/10.1175/JHM-D-19-0185.1, 2020.
Matsui, T., Wolff, D. B., Lang, S., Mohr, K., Zhang, M., Xie, S., Tang, S., Saleeby, S. M., Posselt, D. J., Braun, S. A., Chern, D., Dolan, B., Pippitt, J. L., and Loftus, A. M.: Systematic validation of ensemble cloud-process simulations using polarimetric radar observations and simulator over the NASA Wallops Flight Facility, J. Geophys. Res.-Atmos., 128, e2022JD038134, https://doi.org/10.1029/2022JD038134, 2023.
Morrison, H., Peters, J. M., Varble, A. C., Hannah, W. M., and Giangrande, S. E.: Thermal chains and entrainment in cumulus updrafts. Part I: Theoretical description, J. Atmos. Sci., 77, 3637–3660, https://doi.org/10.1175/JAS-D-19-0243.1, 2020.
Morrison, H., Peters, J. M., and Sherwood, S. C.: Comparing Growth Rates of Simulated Moist and Dry Convective Thermals, J. Atmos. Sci., 78, 797–816, https://doi.org/10.1175/JAS-D-20-0166.1, 2021.
Morrison, H., Jeevanjee, N., Lecoanet, D., and Peters, J. M.: What controls the entrainment rate of dry buoyant thermals with varying initial aspect ratio?, J. Atmos. Sci., 80, 2711–2728, https://doi.org/10.1175/JAS-D-23-0063.1, 2023.
Morton, B. R., Taylor, G. I., and Turner, J. S.: Turbulent gravitational convection from maintained and instantaneous sources, Proc. Roy. Soc. London, 234A, 1–23, https://doi.org/10.1098/RSPA.1956.0011, 1956.
NCCS: Code, Goddard [code], https://portal.nccs.nasa.gov/datashare/cloudlibrary/PUB_DATA/GoAmazon_ACP/Code/ (last access: 16 September 2024), 2024a.
NCCS: Data, Goddard [data set], https://portal.nccs.nasa.gov/datashare/cloudlibrary/PUB_DATA/GoAmazon_ACP/Data/ (last access: 16 September 2024), 2024b.
Nelson, S. P.: The influence of storm flow structure on hail growth, J. Atmos. Sci., 40, 1965–1983, https://doi.org/10.1175/1520-0469(1983)040<1965:TIOSFS>2.0.CO;2, 1983.
Öktem, R., Romps, D. M., and Varble, A. C.: No warm-phase invigoration of convection detected during GoAmazon, J. Atmos. Sci., 80, 2345–2364, https://doi.org/10.1175/JAS-D-22-0241.1, 2023.
Peters, J. M., Morrison, H., Varble, A. C., Hannah, W. M., and Giangrande, S. E.: Thermal chains and entrainment in cumulus updrafts. Part II: Analysis of idealized simulations, J. Atmos. Sci., 77, 3661–3681, https://doi.org/10.1175/JAS-D-19-0244.1, 2020.
Pielke, R. A.: Influence of the spatial distribution of vegetation and soils on the prediction of cumulus convective rainfall, Rev. Geophys., 39, 151–177, https://doi.org/10.1029/1999RG000072, 2001.
Pope, M., Jakob, C., and Reeder, M. J.: Regimes of the North Australian wet season, J. Climate, 22, 6699–6715, https://doi.org/10.1175/2009JCLI3057.1, 2009.
Prein, A. F., Ge, M., Valle, A. R., Wang, D., and Giangrande, S. E.: Towards a unified setup to simulate mid-latitude and tropical mesoscale convective systems at kilometer-scales, Earth Space Sci., 9, https://doi.org/10.1029/2022EA002295, 2022.
Ramos-Valle, A. N., Prein, A. F., Ge, M., Wang, D., and Giangrande, S. E.: Grid spacing sensitivities of simulated mid-latitude and tropical mesoscale convective systems in the convective gray zone, J. Geophys. Res.-Atmos., 128, https://doi.org/10.1029/2022JD037043, 2023.
Robinson, F., Sherwood, S., Gerstle, D., Liu, C., and Kirshbaum, D.: Exploring the land-ocean contrast in convective vigor using islands, J. Atmos. Sci., 68, 602–618, https://doi.org/10.1175/2010JAS3558.1, 2011.
Rocha, H. R., Goulden, M., Miller, S. D., Menton, M. C., Pinto, L. D. V. O., Freitas, H. C., and Figueira, A. M. S.: Seasonality of water and heat fluxes over a tropical forest in eastern Amazonia, Ecol. Appl., 14, 22–32, 2004.
Romps, D. M. and Charn, A. B.: Sticky thermals: Evidence for a dominant balance between buoyancy and drag in cloud updrafts, J. Atmos. Sci., 72, 2890–2901, https://doi.org/10.1175/JAS-D-15-0042.1, 2015.
Sherwood, S. C., Hernández-Deckers, D., Colin, M., and Robinson, F.: Slippery thermals and the cumulus entrainment paradox, J. Atmos. Sci., 70, 2426–2442, https://doi.org/10.1175/JAS-D-12-0220.1, 2013.
Steiner, M., Houze Jr., R. A., and Yuter, S. E.: Climatological characterization of three-dimensional storm structure from operational radar and rain gauge data, J. Appl. Meteorol., 34, 1978–2007, 1995.
Stephens, G. L., Vane, D. G., Boain, R. J., Mace, G. G., Sassen, K., Wang, Z., and the CloudSat Science Team: The CloudSat mission and the A-Train: A new dimension of space-based observations of clouds and precipitation, B. Am. Meteorol. Soc., 83, 1771–1790, https://doi.org/10.1175/BAMS-83-12-1771, 2002.
Stolz, D. C., Rutledge, S. A., and Pierce, J. R.: Simultaneous influences of thermodynamics and aerosols on deep convection and lightning in the tropics, J. Geophys. Res.-Atmos., 120, 6207–6231, https://doi.org/10.1002/2014JD023033, 2015.
Sullivan, S. C. and Voigt, A.: Ice microphysical processes exert a strong control on the simulated radiative energy budget in the tropics, Commun. Earth Environ., 2, 137, https://doi.org/10.1038/s43247-021-00206-7, 2021.
Takahashi, H., Luo, Z. J., and Stephens, G. L.: Level of neutral buoyancy, deep convective outflow, and convective core: New perspectives based on 5 years of CloudSat data, J. Geophys. Res.-Atmos., 122, 2958–2969, 2017.
Takahashi, N., Ushio, T., Nakagawa, K.,, Mizutani, F., Iwanami, K., Yamaji, A., Kawagoe, T., Osada, T., Ohta, T., and Kawasaki, M.: Development of multi-parameter phased array weather radar (MP-PAWR) and early detection of torrential rainfall and tornado risk, J. Disaster Res., 14, 235–247, https://doi.org/10.20965/jdr.2019.p0235, 2019.
Takahashi, H., Luo, Z. J., and Stephens, G. L.: Revisiting the entrainment relationship of convective plumes: A perspective from global observations, Geophys. Res. Lett., 48, https://doi.org/10.1029/2020GL092349, 2021.
Tang, S., Xie, S., Zhang, Y., Zhang, M., Schumacher, C., Upton, H., Jensen, M. P., Johnson, K. L., Wang, M., Ahlgrimm, M., Feng, Z., Minnis, P., and Thieman, M.: Large-scale vertical velocity, diabatic heating and drying profiles associated with seasonal and diurnal variations of convective systems observed in the GoAmazon2014/5 experiment, Atmos. Chem. Phys., 16, 14249–14264, https://doi.org/10.5194/acp-16-14249-2016, 2016.
Tao, W.-K., Lang, S., Zeng, X., Li, X., Matsui, T., Mohr, K., Posselt, D., Chern, J., Peters-Lidard, C., Norris, P. M., Kang, I.-S., Choi, I., Hou, A., Lau, K.-M., and Yang, Y.-M.: The Goddard Cumulus Ensemble model (GCE): Improvements and applications for studying precipitation processes, Atmos. Res., 143, 392–424, https://doi.org/10.1016/j.atmosres.2014.03.005, 2014.
Tao, W.-K., Wu, D., Lang, S., Chern, J.-D., Peters-Lidard, C., Fridlind, A., and Matsui, T.: High-resolution NU-WRF simulations of a deep convective-precipitation system during MC3E: Further improvements and comparisons between Goddard microphysics schemes and observations, J. Geophys. Res.-Atmos., 121, 1278–1305, https://doi.org/10.1002/2015JD023986, 2016.
Tao, K., Iguchi, T., Lang, S., Li, X., Mohr, K., Matsui, T., and Braun, S.: Relating vertical velocity and cloud/precipitation properties: A numerical cloud ensemble modeling study of tropical convection, J. Adv. Model. Earth Syst., 14, e2021MS002677, https://doi.org/10.1029/2021MS002677, 2022.
Tokay, A. and Short, D. A.: Evidence from Tropical Raindrop Spectra of the Origin of Rain from Stratiform versus Convective Clouds, J. Appl. Meteorol. Clim., 35, 355–371, https://doi.org/10.1175/1520-0450(1996)035<0355:EFTRSO>2.0.CO;2, 1996.
Wang, D., Giangrande, S. E., Bartholomew, M. J., Hardin, J., Feng, Z., Thalman, R., and Machado, L. A. T.: The Green Ocean: precipitation insights from the GoAmazon2014/5 experiment, Atmos. Chem. Phys., 18, 9121–9145, https://doi.org/10.5194/acp-18-9121-2018, 2018.
Wang, D., Giangrande, S. E., Schiro, K., Jensen, M. P., and Houze, R. A.: The characteristics of tropical and midlatitude mesoscale convective systems as revealed by radar wind profilers, J. Geophys. Res.-Atmos., 124, 4601–4619, https://doi.org/10.1029/2018JD030087, 2019.
Wehr, T., Kubota, T., Tzeremes, G., Wallace, K., Nakatsuka, H., Ohno, Y., Koopman, R., Rusli, S., Kikuchi, M., Eisinger, M., Tanaka, T., Taga, M., Deghaye, P., Tomita, E., and Bernaerts, D.: The EarthCARE mission – science and system overview, Atmos. Meas. Tech., 16, 3581–3608, https://doi.org/10.5194/amt-16-3581-2023, 2023.
Williams, E. and Stanfill, S.: The physical origin of the land–ocean contrast in lightning activity, C. R. Phys., 3, 1277–1292, https://doi.org/10.1016/S1631-0705(02)01407-X, 2002.
Williams, E., Rosenfeld, D., Madden, N., Gerlach, J., Gears, N., Atkinson, L., Dunnemann, N., Frostrom, G., Antonio, M., Biazon, B., Camargo, R., Franca, H., Gomes, A., Lima, M., Machado, R., Manhaes, S., Nachtigall, L., Piva, H., Quintiliano, W., Machado, L., Artaxo, P., Roberts, G., Renno, N., Blakeslee, R., Bailey, J., Boccippio, D., Betts, A., Wolff, D., Roy, B., Halverson, J., Rickenbach, T., Fuentes, J., and Avelino, E.: Contrasting convective regimes over the Amazon: implications for cloud electrification, J. Geophys. Res.-Atmos., 107, 8082, https://doi.org/10.1029/2001JD000380, 2002.
Williams, E., Chan, T., and Boccippio, D.: Islands as miniature continents: Another look at the land–ocean lightning contrast, J. Geophys. Res., 109, D16206, https://doi.org/10.1029/2003JD003833, 2004.
Williams, E., Mushtak, V., Rosenfeld, D., Goodman, S., and Boccippio, D.: Thermodynamic conditions favorable to superlative thunderstorm updraft, mixed phase microphysics and lightning flash rate, Atmos. Res., 76, 288–306, https://doi.org/10.1016/j.atmosres.2004.11.009, 2005.
Williams, C. R., Barrio, J., Johnston, P. E., Muradyan, P., and Giangrande, S. E.: Calibrating radar wind profiler reflectivity factor using surface disdrometer observations, Atmos. Meas. Tech., 16, 2381–2398, https://doi.org/10.5194/amt-16-2381-2023, 2023.
Wu, J., Del Genio, A. D., Yao, M.-S., and Wolf, A. B.: WRF and GISS SCM simulations of convective updraft properties during TWP-ICE, J. Geophys. Res., 114, D04206, https://doi.org/10.1029/2008JD010851, 2009.
Xie, S., Cederwall, R. T., and Zhang, M.: Developing long-term single-column model/cloud system–resolving model forcing data using numerical weather prediction products constrained by surface and top of the atmosphere observations, J. Geophys. Res., 109, D01104, https://doi.org/10.1029/2003JD004045, 2004.
Xie, S., Tao, C., and Zhang, M.: Constrained Variational Analysis (180VARANAECMWFANARADAR), Atmospheric Radiation Measurement (ARM) User Facility, ARM [data set], https://doi.org/10.5439/1879988, 2024.
Xu, X., Sun, C., Lu, C., Liu, Y., Zhang, G. J., and Chen, Q.: Factors affecting entrainment rate in deep convective clouds and parameterizations, J. Geophys. Res.-Atmos., 126, e2021JD034881, https://doi.org/10.1029/2021JD034881, 2021.
Yanai, M., Esbensen, S., and Chu, J.: Determination of Bulk Properties of Tropical Cloud Clusters from Large-Scale Heat and Moisture Budgets, J. Atmos. Sci., 30, 611–627, https://doi.org/10.1175/1520-0469(1973)030<0611:DOBPOT>2.0.CO;2, 1973.
Yuter, S. E. and Houze Jr., R. A.: Three-dimensional kinematic and microphysical evolution of Florida cumulonimbus. Part II: Frequency distribution of vertical velocity, reflectivity, and differential reflectivity, Mon. Weather Rev., 123, 1941–1963, 1995.
Zhang, M. and Lin, J.: Constrained variational analysis of sounding data based on column-integrated budgets of mass, heat, moisture, and momentum: Approach and application to ARM measurements, J. Atmos. Sci., 54, 1503–1524, https://doi.org/10.1175/1520-0469(1997)054<1503:CVAOSD>2.0.CO;2, 1997.
Zhang, M., Lin, J., Cederwall, R. T., Yio, J. J., and Xie, S. C.: Objective analysis of ARM IOP data: Method and sensitivity, Mon. Weather Rev., 129, 295–311, https://doi.org/10.1175/1520-0493(2001)129<0295:OAOAID>2.0.CO;2, 2001.
Ziegler, C. L., Ray, P. S., and Knight, N. C.: Hail growth in an Oklahoma multicell storm, J. Atmos. Sci., 40, 1768–1791, https://doi.org/10.1175/1520-0469(1983)040<1768:HGIAOM>2.0.CO;2, 1983.
Zipser, E. J., Liu, C., Cecil, D. J., Nesbitt, S. W., and Yorty, D. P.: Where are the most intense thunderstorms on Earth?, B. Am. Meteorol. Soc., 87, 1057–1071, https://doi.org/10.1175/BAMS-87-8-1057, 2006.