the Creative Commons Attribution 4.0 License.
the Creative Commons Attribution 4.0 License.
 | 25 Sep 2024
Increasing aerosol direct effect despite declining global emissions in MPI-ESM1.2
Linnea Huusko
Thorsten Mauritsen
Anthropogenic aerosol particles partially mask global warming driven by greenhouse gases, both directly by reflecting sunlight back to space and indirectly by increasing cloud reflectivity. In recent decades, emissions of anthropogenic aerosols have declined globally and at the same time shifted from the North American and European regions, foremost to Southeast Asia. Using simulations with the Max Planck Institute Earth System Model version 1.2 (MPI-ESM1.2), we find that the direct effect of aerosols has continued to increase despite declining emissions. Concurrently, the indirect effect has diminished in approximate proportion to the emissions. In this model, which employs parameterized aerosol effects with constant regional direct effect efficiency, the enhanced efficiency of aerosol radiative forcing in emissions is associated with less cloud masking, longer atmospheric residence times, and differences in aerosol optical properties.
- Article
(3655 KB) - Full-text XML
- BibTeX
- EndNote


The state of Earth's climate is determined by the delicate balance between the incoming solar energy and the energy that Earth reflects and radiates back to space. Greenhouse gases, such as CO2, act to warm Earth by reducing the radiation emitted into space (radiative forcing), resulting in an accumulation of energy in the climate system and, consequently, an increase in the surface temperature Ts. A linear radiative balance framework can be used to study the response of temperature, ΔTs, to an applied radiative forcing, F, with the net energy balance at the top of the atmosphere, N:
where λ is the total feedback parameter of the system, which must be negative to yield a stable climate. The feedback parameter can itself be divided into the sum of the individual climate feedbacks, such as water vapour, surface albedo, cloud, and temperature feedbacks. They enhance or dampen the imbalance induced by an applied forcing. Knowledge of how anthropogenic activity affects the radiative balance is crucial for understanding how the climate may change in the future, and currently the largest contributor of uncertainty to estimates of the total anthropogenic forcing is aerosols (Forster et al., 2021).
Aerosols are small particles emitted by natural and human sources which affect the radiative balance of the climate system through direct and indirect mechanisms. Directly, they interact with solar radiation by scattering and reflecting it back to space or absorbing it (direct effect). Indirectly, they interact with clouds, for example through the Twomey effect (Twomey, 1974) by increasing the number density of droplets in clouds, making them more reflective of solar radiation (indirect effect).
Due to their short lifetime in the atmosphere, aerosols are heterogeneously distributed in space and time. The heterogeneity, together with interactions between aerosols and clouds, makes the aerosol forcing difficult to constrain and thus adds uncertainty to estimates of the total radiative imbalance of the climate system. This uncertainty poses challenges in assessing how aerosols may mask the effects of global warming caused by greenhouse gases and the trajectory of future global warming. The situation is made even more complex by the shift in dominant aerosol emission sources from Europe and North America to the Southeast Asian region, which has occurred as a result of air quality regulations in the last few decades (Smith et al., 2011).
It is therefore a community priority to narrow down the uncertainty in aerosol forcing (Bellouin et al., 2020). Multiple approaches to this end have been taken, including process understanding that is usually in the form of global models (e.g. Fiedler et al., 2023), satellite observational constraints based on internal variability or volcanic eruptions (e.g. Gryspeerdt et al., 2017; McCoy et al., 2017; Malavelle et al., 2017), or top-down approaches based on the observed global warming (Stevens, 2015; Kretzschmar et al., 2017; Booth et al., 2018). In particular, for top-down constraints it is essential to relate the historical evolution of aerosol emissions to radiative forcing.
Therefore, in the current study we separate the historical evolutions of the direct and indirect aerosol forcings in a climate model and relate these to global aerosol emissions. The effect of the regional redistribution in recent decades is investigated and the underlying mechanisms elucidated.
2.1 Max Planck Institute for Meteorology Earth System Model version 1.2 (MPI-ESM1.2) and Max Planck Institute Aerosol Climatology (MACv2-SP)
We study the historical evolution of the aerosol forcing using the state-of-the-art MPI-ESM1.2 global climate model (Mauritsen et al., 2019). MPI-ESM1.2 participated in the Coupled Model Intercomparison Project Phase 6 (CMIP6) and successfully reproduced the observed warming from pre-industrial levels (Mauritsen and Roeckner, 2020). In this study we use the coarse-resolution version of the model (CR; see Mauritsen et al., 2019) to simulate the historical period from 1850 to the present day, with input as in the CMIP6 historical scenario.
The radiative transfer scheme of MPI-ESM1.2 uses the Simple Plumes implementation of the second version of MACv2-SP to represent the aerosol impact on the radiation (Stevens et al., 2017). MACv2-SP provides a parameterization of optical properties of anthropogenic aerosols and the resulting Twomey effect (Twomey, 1974; Stevens et al., 2017). It has been designed to provide a uniform and easily controlled representation of anthropogenic aerosol perturbations for the CMIP6 framework (Eyring et al., 2016; Pincus et al., 2016). In the model, aerosol emissions are represented by nine spatial plumes that are associated with emissions from major anthropogenic source regions (Stevens et al., 2017).
The prescribed aerosol optical properties are based on ground sun-photometer measurements provided by the Max Planck Institute for Aerosol Climatology, MAC (Kinne et al., 2013), and merged onto global model background maps from AeroCom for the present-day (2005) distribution of mid-visible anthropogenic aerosol optical depths (AODs). AODs at 440, 500, and 870 nm as well as the absorbing AOD at 550 nm are considered, along with additional contributions of coarse- and fine-mode aerosol particles. To represent forcing variations from the pre-industrial (1850) to 2016, MACv2-SP uses emission inventory estimates of SO2 and NH3 from the Community Emissions Data System (CEDS). These two aerosol precursors are weighted to calculate the plume-scale factor (Stevens et al., 2017). This weighting of different aerosol emissions gives rise to a global emission unit of teragram of SO2 equivalent. We use this unit throughout our analysis. However, the effects of changes in aerosol composition over time within plumes are not considered. For instance, the “brightening” of the aerosol composition due to a reduction in the black carbon (BC) fraction relative to SO2 prior to 1970 and the opposite trend afterwards is not explicitly included in MACv2-SP (Stevens et al., 2017).
Two types of emissions are considered: industrial emissions for the plumes in Europe, North America, Australia, and East and South Asia and biomass burning emissions for the plumes in South America, the Maritime Continent, northern Africa, and southern–central Africa. These two types of emissions differ in their seasonal cycle amplitude, the single-scattering albedo (SSA), and the strength of the Twomey effect. This distinction is essential for reflecting the composition of the specific aerosol species in each plume type. The measurements suggest SSAs of 0.93 for industrial areas and 0.87 for regions dominated by seasonal biomass burning (Stevens et al., 2017). This difference accounts for the greater absorption of biomass burning aerosols and therefore for some of the global aerosol composition changes over time, even though these changes are not included in each plume.
To model the Twomey effect, Stevens et al. (2017) used satellite observations to derive a relationship between the cloud droplet number density and the fine-mode AOD. With this representation, anthropogenic aerosols cause a greater increase in cloud optical thickness when the atmospheric environment is initially pristine in terms of aerosols. A complete description of MACv2-SP can be found in Stevens et al. (2017).
There are limitations in the MACv2-SP representation of aerosol forcing, as it only takes into account the two main aerosol precursors and does not include changes in aerosol compositions over time or interactions with the atmosphere. Nevertheless, Stevens (2015) argued that this representation successfully captures the main features seen in more complex models in terms of both global signal and regional patterns. We consider these limitations throughout the study and discuss the results in that context.
2.2 Radiative forcing calculation
In the literature, various metrics have been proposed to assess the impact of a radiative perturbation on Earth's energy balance. When a perturbation is introduced into the climate system, rapid adjustments occur due to rapid stratospheric temperature change. Radiative forcing (RF) is used to quantify the radiative imbalance resulting from an applied perturbation, taking these rapid adjustments into account. The effective radiative forcing (ERF) includes further adjustments of the system, accounting for all tropospheric and land surface adjustments.
We use the partial radiative perturbation (PRP) method to calculate the radiative forcing from aerosols in the MPI-ESM1.2 simulations. In this method the radiative effect of a change in a certain state variable, for example the effect of a change in surface albedo between control and perturbed climate runs, is calculated as the difference between two radiation calls. The method was first described by Wetherald and Manabe (1988) and Colman and McAvaney (1997) and implemented in MPI-ESM1.2 by Meraner et al. (2013) and Block and Mauritsen (2013) as a two-sided version (including the backward perturbation calculation in two extra calls), as described by Klocke et al. (2013). Another version of the PRP diagnostic was also used by Mülmenstädt et al. (2019) to assess the radiative effects of aerosols in a different version of the atmospheric model component of MPI-ESM1.2.
The PRP method was designed to evaluate the respective contributions of individual forcings and feedbacks to the radiative imbalance (Eq. 1). Here, we integrated the anthropogenic aerosol perturbation provided by MACv2-SP into the PRP module of MPI-ESM1.2. This enabled us to estimate the instantaneous radiative forcing from anthropogenic aerosols independently of climate feedbacks and atmospheric adjustments. Furthermore, as MACv2-SP provides two distinct prescribed perturbations for the direct and indirect effects of aerosols, we can substitute them one at a time into the PRP method to evaluate their respective contributions. This approach allows us to conduct regular historical simulations in MPI-ESM1.2 and investigate the past evolution of anthropogenic aerosol effects on the climate system.
In the following section we present the simulated anthropogenic aerosol forcing throughout the historical period. We separate the contributions from the direct and indirect effects and show how the forcing varies depending on the locations of the aerosol emissions. Finally, we investigate the mechanisms governing regional differences in the relationship between aerosol emissions and radiative forcing.
3.1 Historical aerosol forcing
In the historical simulation, the PRP diagnostic reveals an increasingly negative forcing from aerosols throughout the century, despite the global reduction in aerosol emissions in recent decades, as shown in Fig. 1. The persistently negative trend in the total aerosol forcing is primarily driven by the direct effect, which continued to increase even after the implementation of air quality regulations in Europe and North America starting in the 1970s and 1980s. Meanwhile, the indirect effect is reduced in approximate proportion to the decreasing emissions.
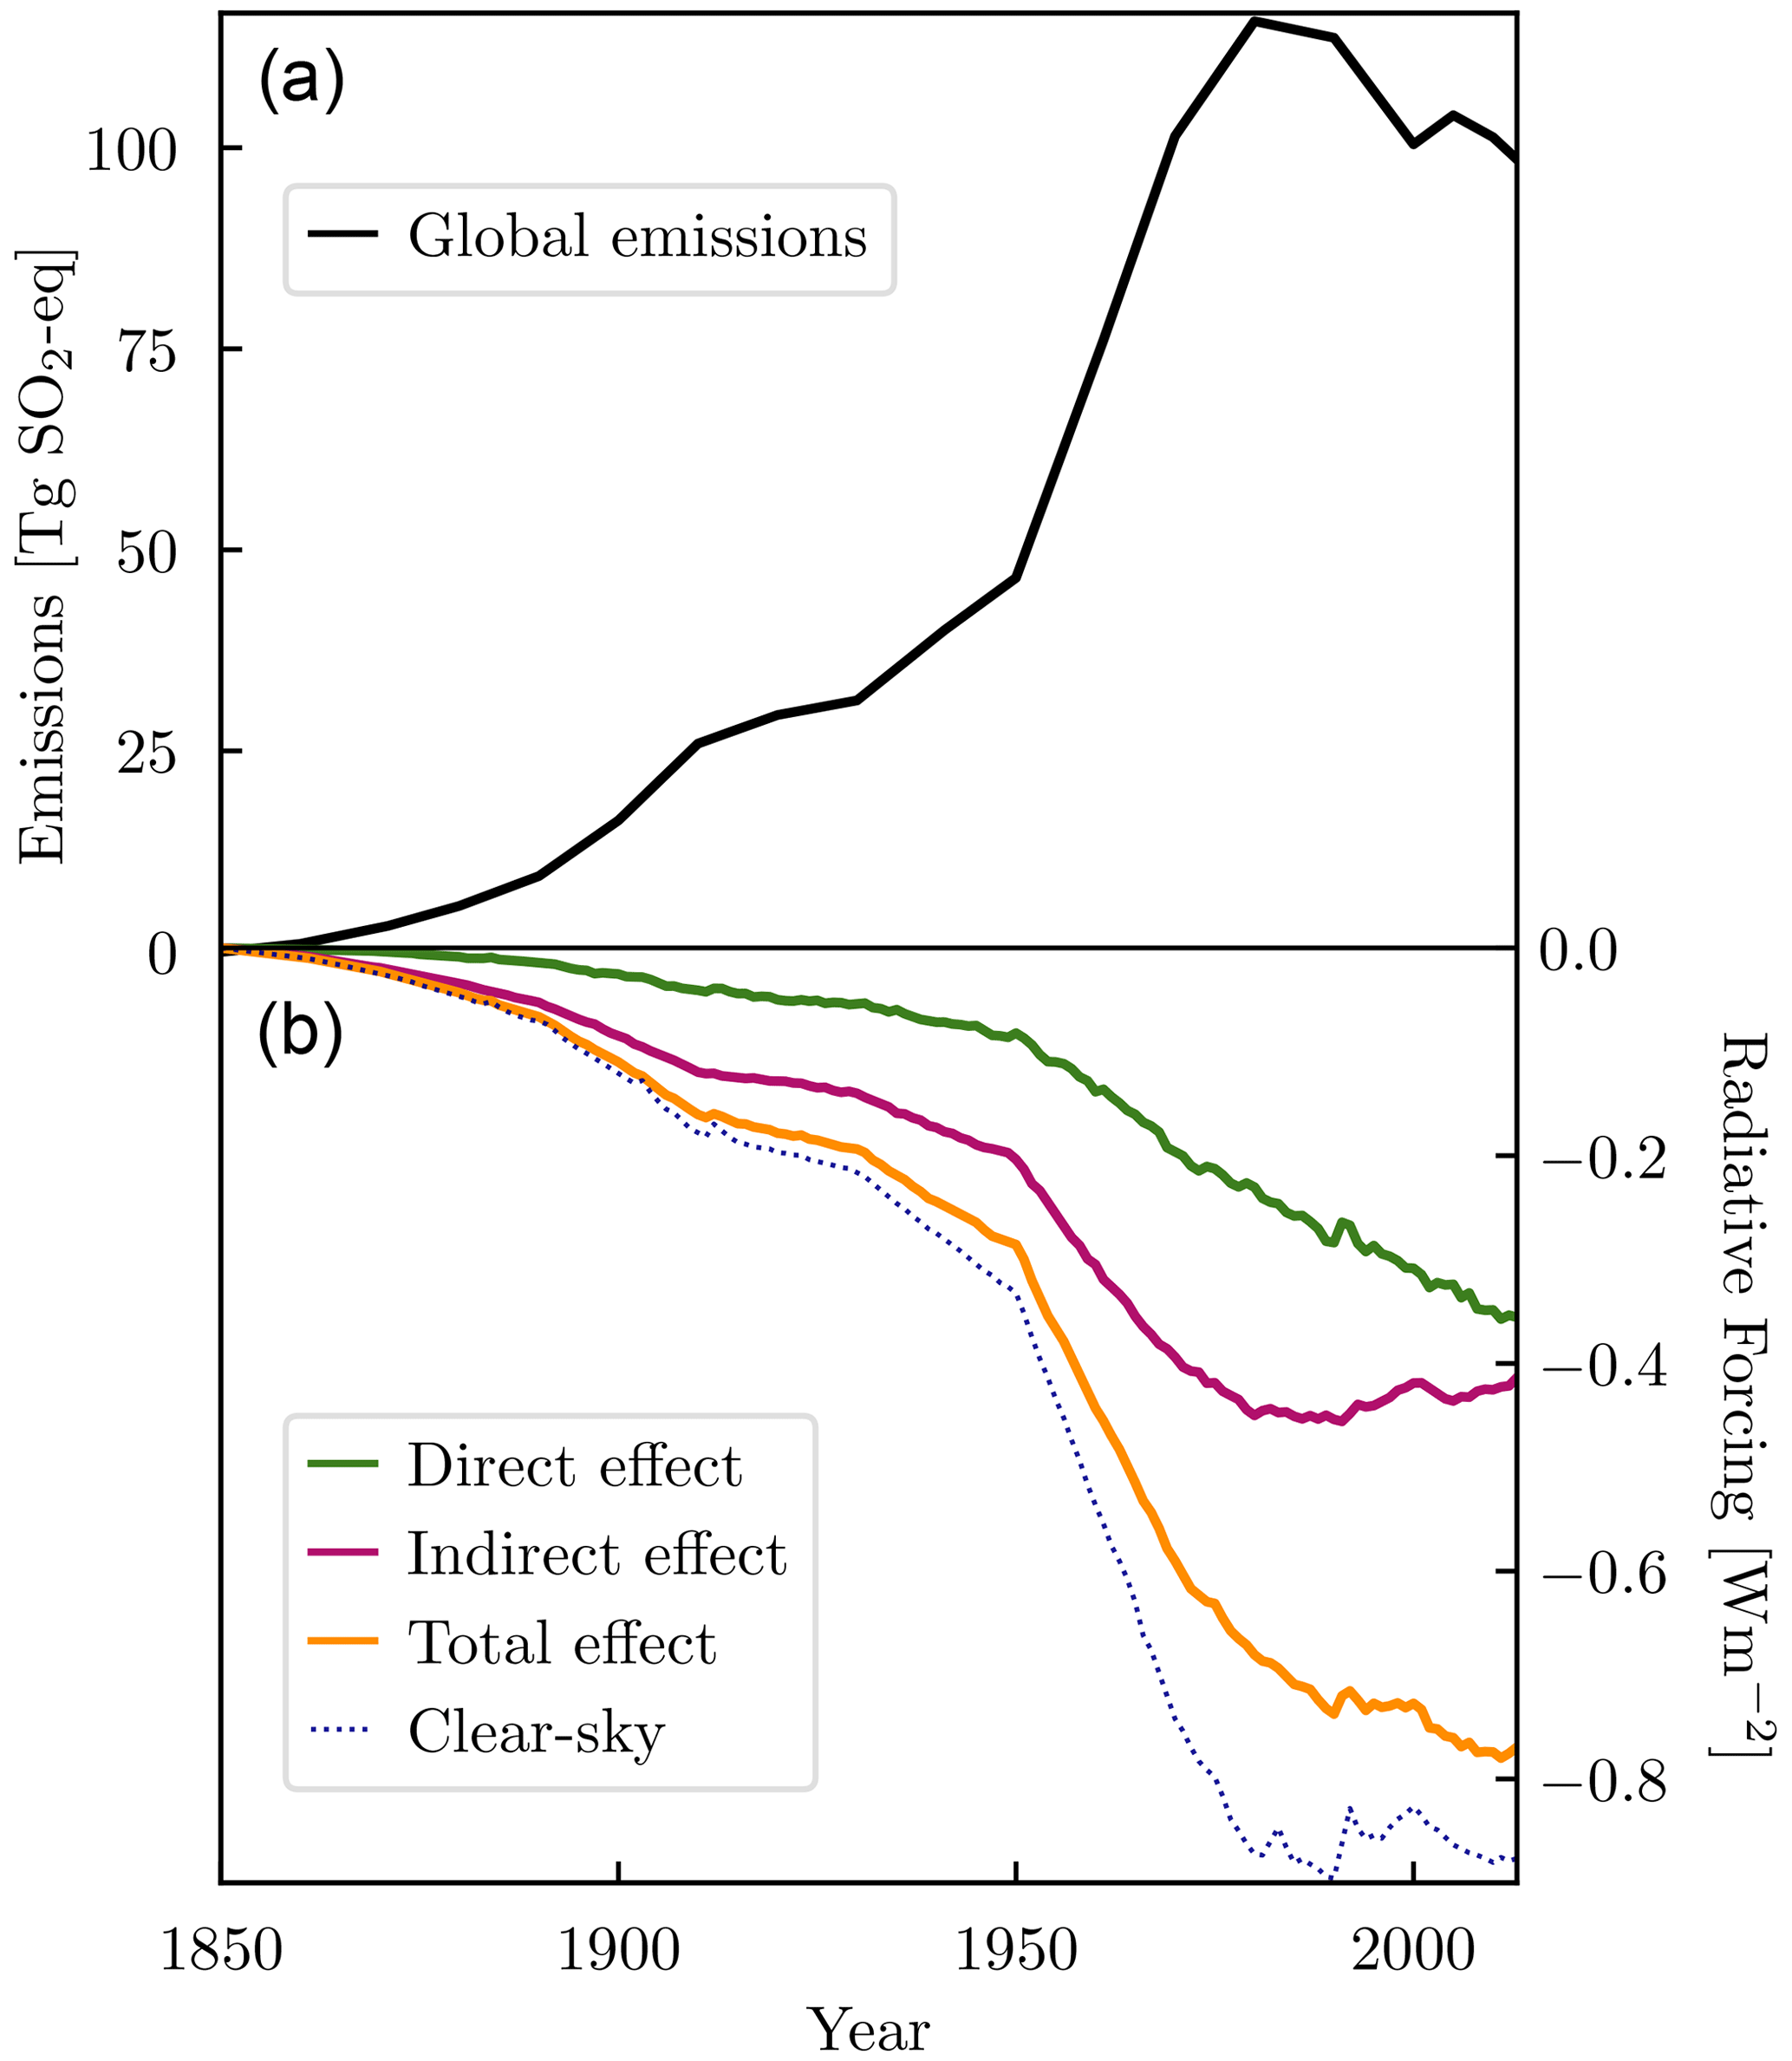
Figure 1Historical forcing from anthropogenic aerosols. Panel (a) shows the historical global emissions of aerosols, and panel (b) shows the induced radiative forcing in MPI-ESM1.2. The values are the global yearly means.
In addition to the global decrease in aerosol emissions, the period spanning from the 1970s to 2005 witnessed a shift in aerosol emission patterns. Early in the historical period global aerosol emissions were dominated by emissions from Europe and North America. In recent decades, South Asia and East Asia have become the dominant source regions. The subsequent sections investigate the role played by this geographical shift in explaining the observed inconsistency between global aerosol emissions and forcing.
3.2 Forcing from regional aerosol sources
As detailed in Sect. 2, MACv2-SP provides a parameterization for anthropogenic aerosols, incorporating nine distinct plumes that represent various anthropogenic emission regions. To assess the aerosol forcing from each of these regions throughout the historical period, we substituted one plume at a time into the PRP calculation. Figure 2 shows the resulting forcing values from each region against the corresponding aerosol emissions in teragram of SO2 equivalent. Regressing the induced forcing against the associated emission level, we obtain a value of the regional aerosol efficiency in Watt per square metre per teragram of SO2 equivalent. For all the regressions shown in Fig. 2, the coefficients of determination R2 fall within 89 %–99 % confidence. This implies that the calculated efficiencies are consistent with emission levels and thus with time.
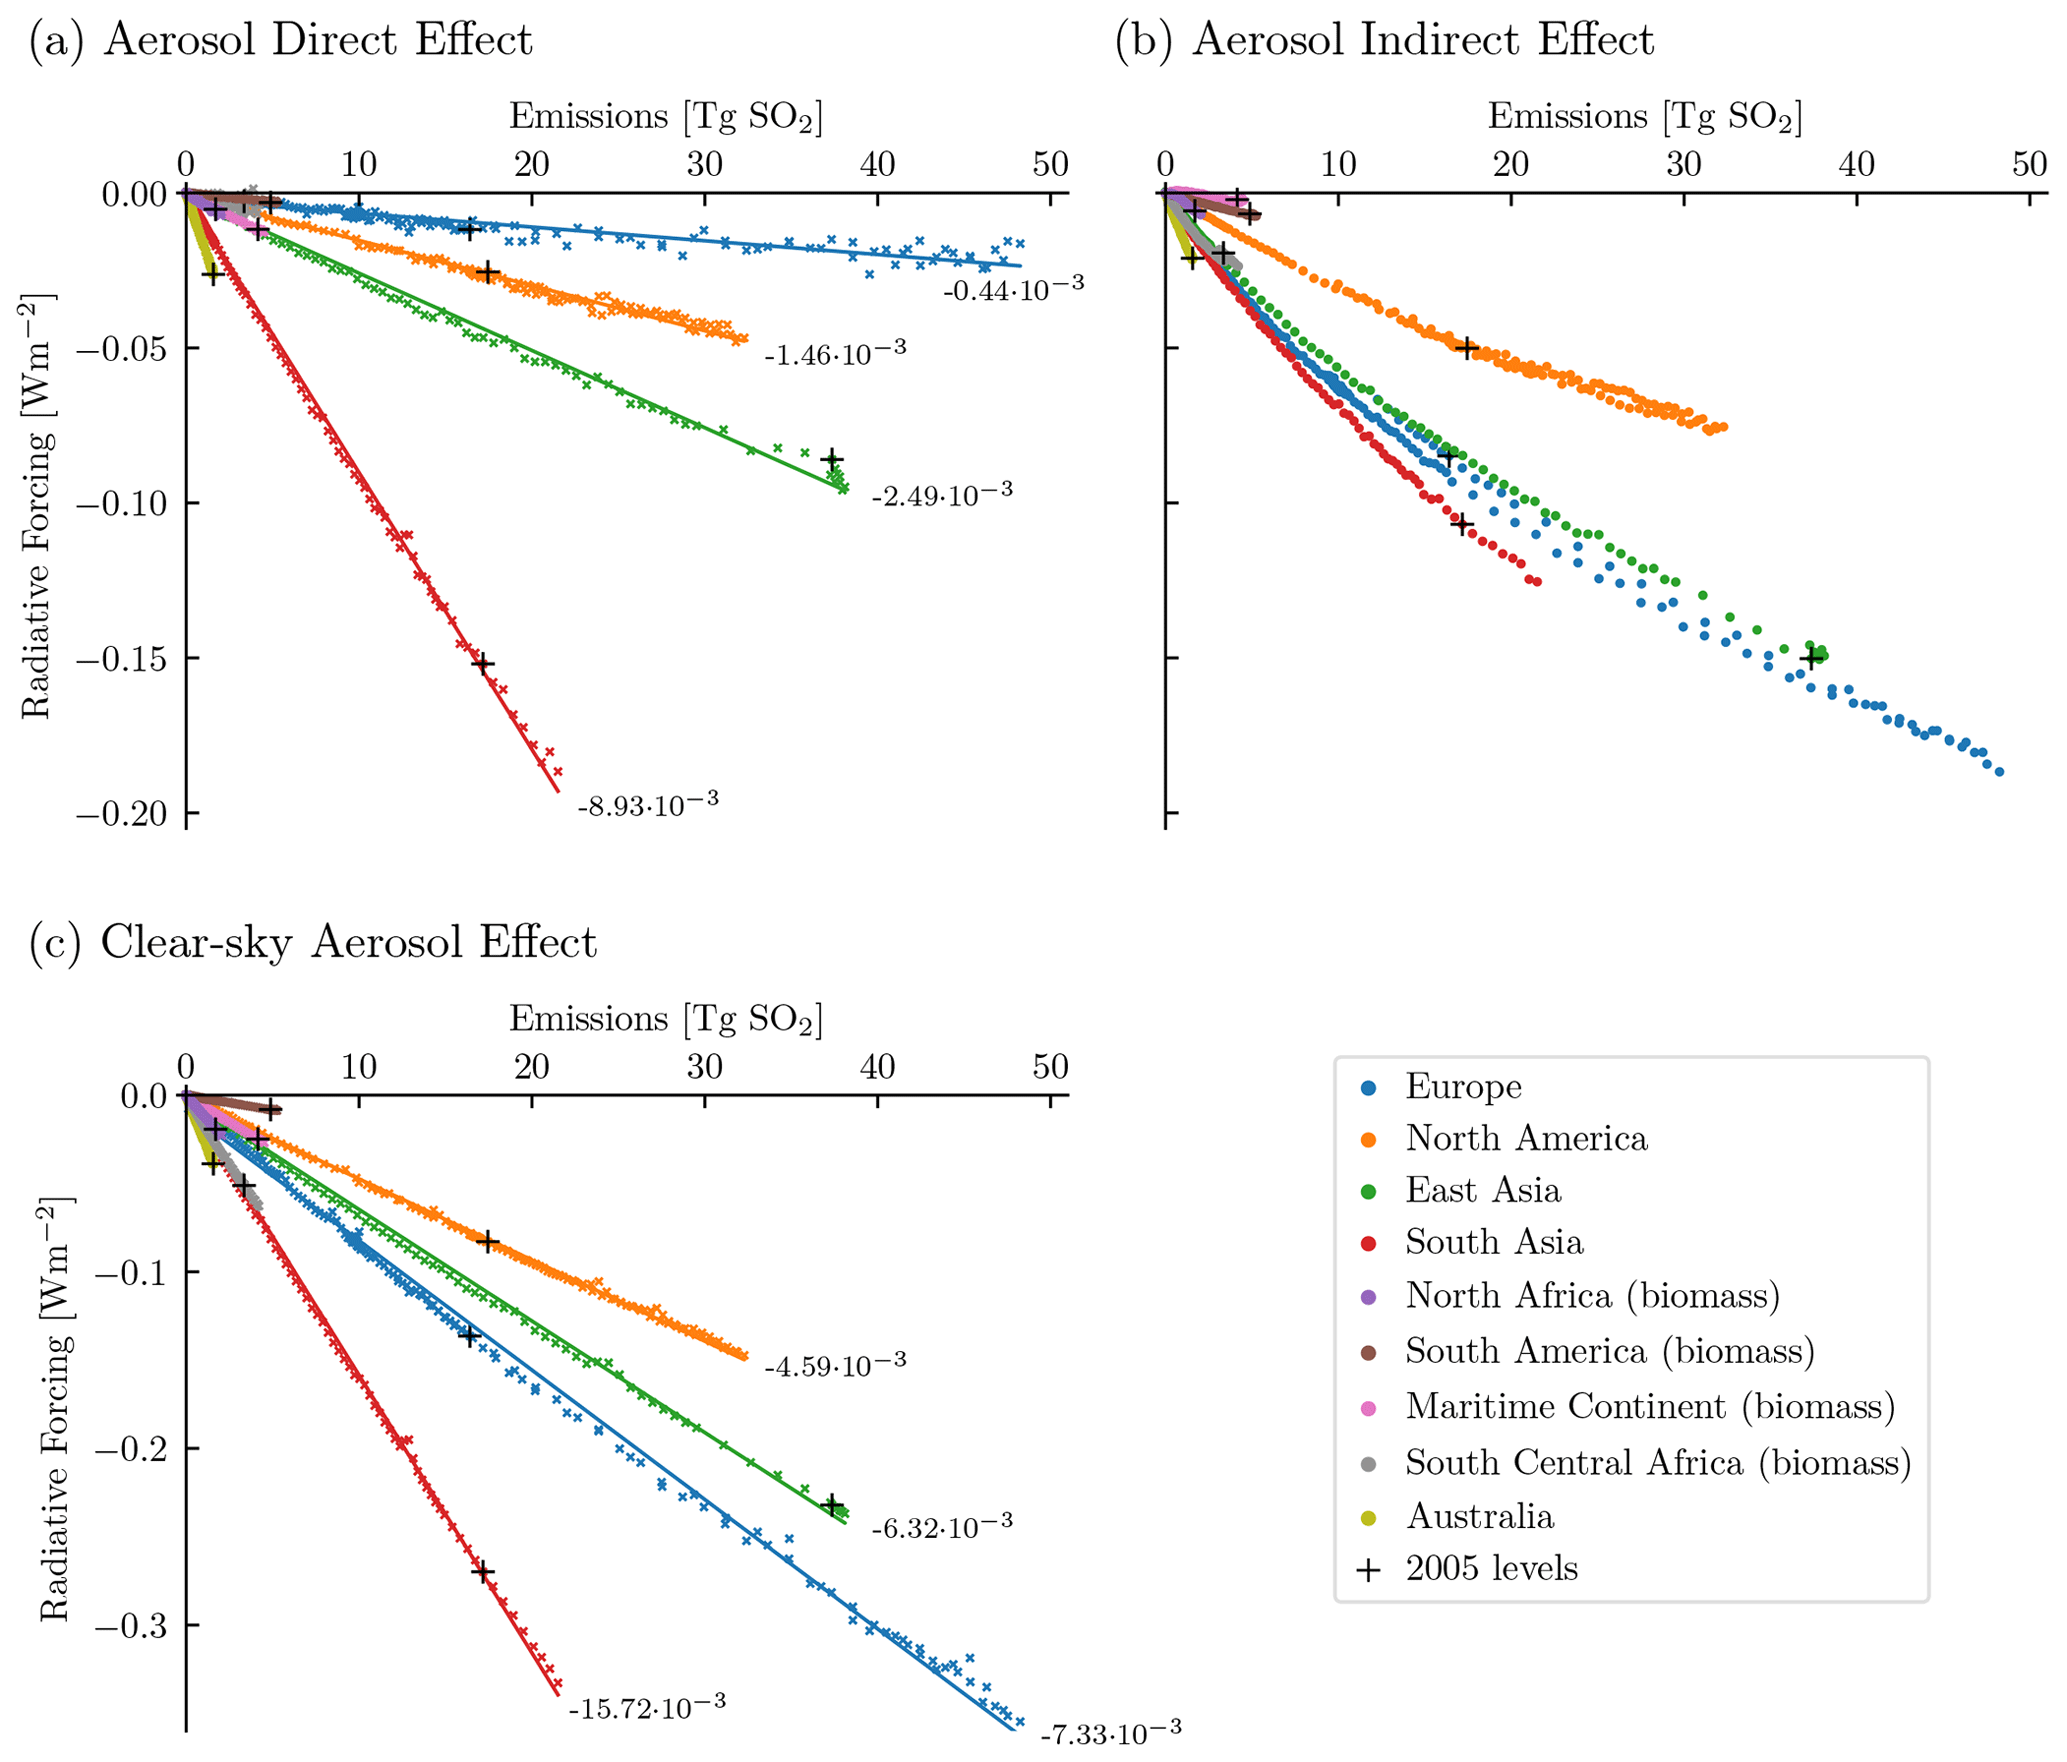
Figure 2Aerosol forcing from individual emission regions against regional emission levels. The values are global yearly means for each year from 1850 to 2013 separated into the direct (a) and indirect (b) effects. Panel (c) shows the clear-sky aerosol effect. The numbers annotated in panels (a) and (c) are the efficiencies in Watt per square metre per teragram of SO2 equivalent for the major emission regions, based on linear regression (89 %–99 % confidence). The black crosses indicate the emission levels and the resulting radiative forcing for the individual sources for the reference year of 2005.
Using our PRP method, we calculate the relationship between forcing and emissions for each individual plume. Significant trends in forcing as they relate to emissions are observed (Fig. 2). Quaas et al. (2022) demonstrate the relationship between clear-sky aerosol ERF trends and trends in sulfate precursors, noting significant declines in major source regions from North America, Europe, and East Asia, alongside increases in India and its surrounding regions (which we refer to as South Asia). These findings align with our results across the four major industrial regions. Furthermore, Quaas et al. (2022) support the idea that trends in sulfate precursors are driving aerosol forcing increases, which is consistent with our results as the aerosol forcing in MACv2-SP is predominantly driven by sulfate emissions (Stevens et al., 2017).
In Fig. 2a, we observe significant variability in the efficiency of the direct effect among major industrial regions, such as Europe, North America, and East and South Asia. Notably, South Asia exhibits an efficiency 20 times greater than Europe, representing the most substantial difference in efficiency across these regions. On the other hand, Fig. 2b shows a relatively more consistent relationship between forcing and emissions across the regions for the indirect effect.
The variation in regional aerosol efficiency explains the persistent increase in the global direct effect despite decreasing emissions. Regions with higher efficiencies have a more substantial impact on the global direct effect despite emitting fewer aerosols. This effect becomes particularly important when considering the shift in aerosol patterns from 1980 to 2005. During this period, aerosol emissions shifted from Europe and North America to South and East Asia, where the efficiency is higher. Consequently, despite reduced global emissions during this period, the global aerosol forcing continued to increase. It is important to note that the discrepancy in aerosol efficiencies across the emission regions is observed for the year 2005, where the present-day aerosol climatology (see Sect. 2.1) is applied directly. The subsequent sections delve into the mechanisms that underlie these modelled regional variations in efficiency.
3.3 All-sky and clear-sky aerosol forcing
We examine the outcomes of the PRP performed under both all-sky and clear-sky conditions. The results show that under all-sky conditions the direct effect primarily causes a radiative forcing in the vicinity of emission sources (see Fig. 3c). In contrast, the indirect effect is more pronounced over remote regions (see Fig. 3b) and is larger than the direct effect on the global average. These results are in line with Huusko et al. (2022), who used a different method for estimating the spatial patterns of the aerosol direct and indirect effects in MPI-ESM1.2.
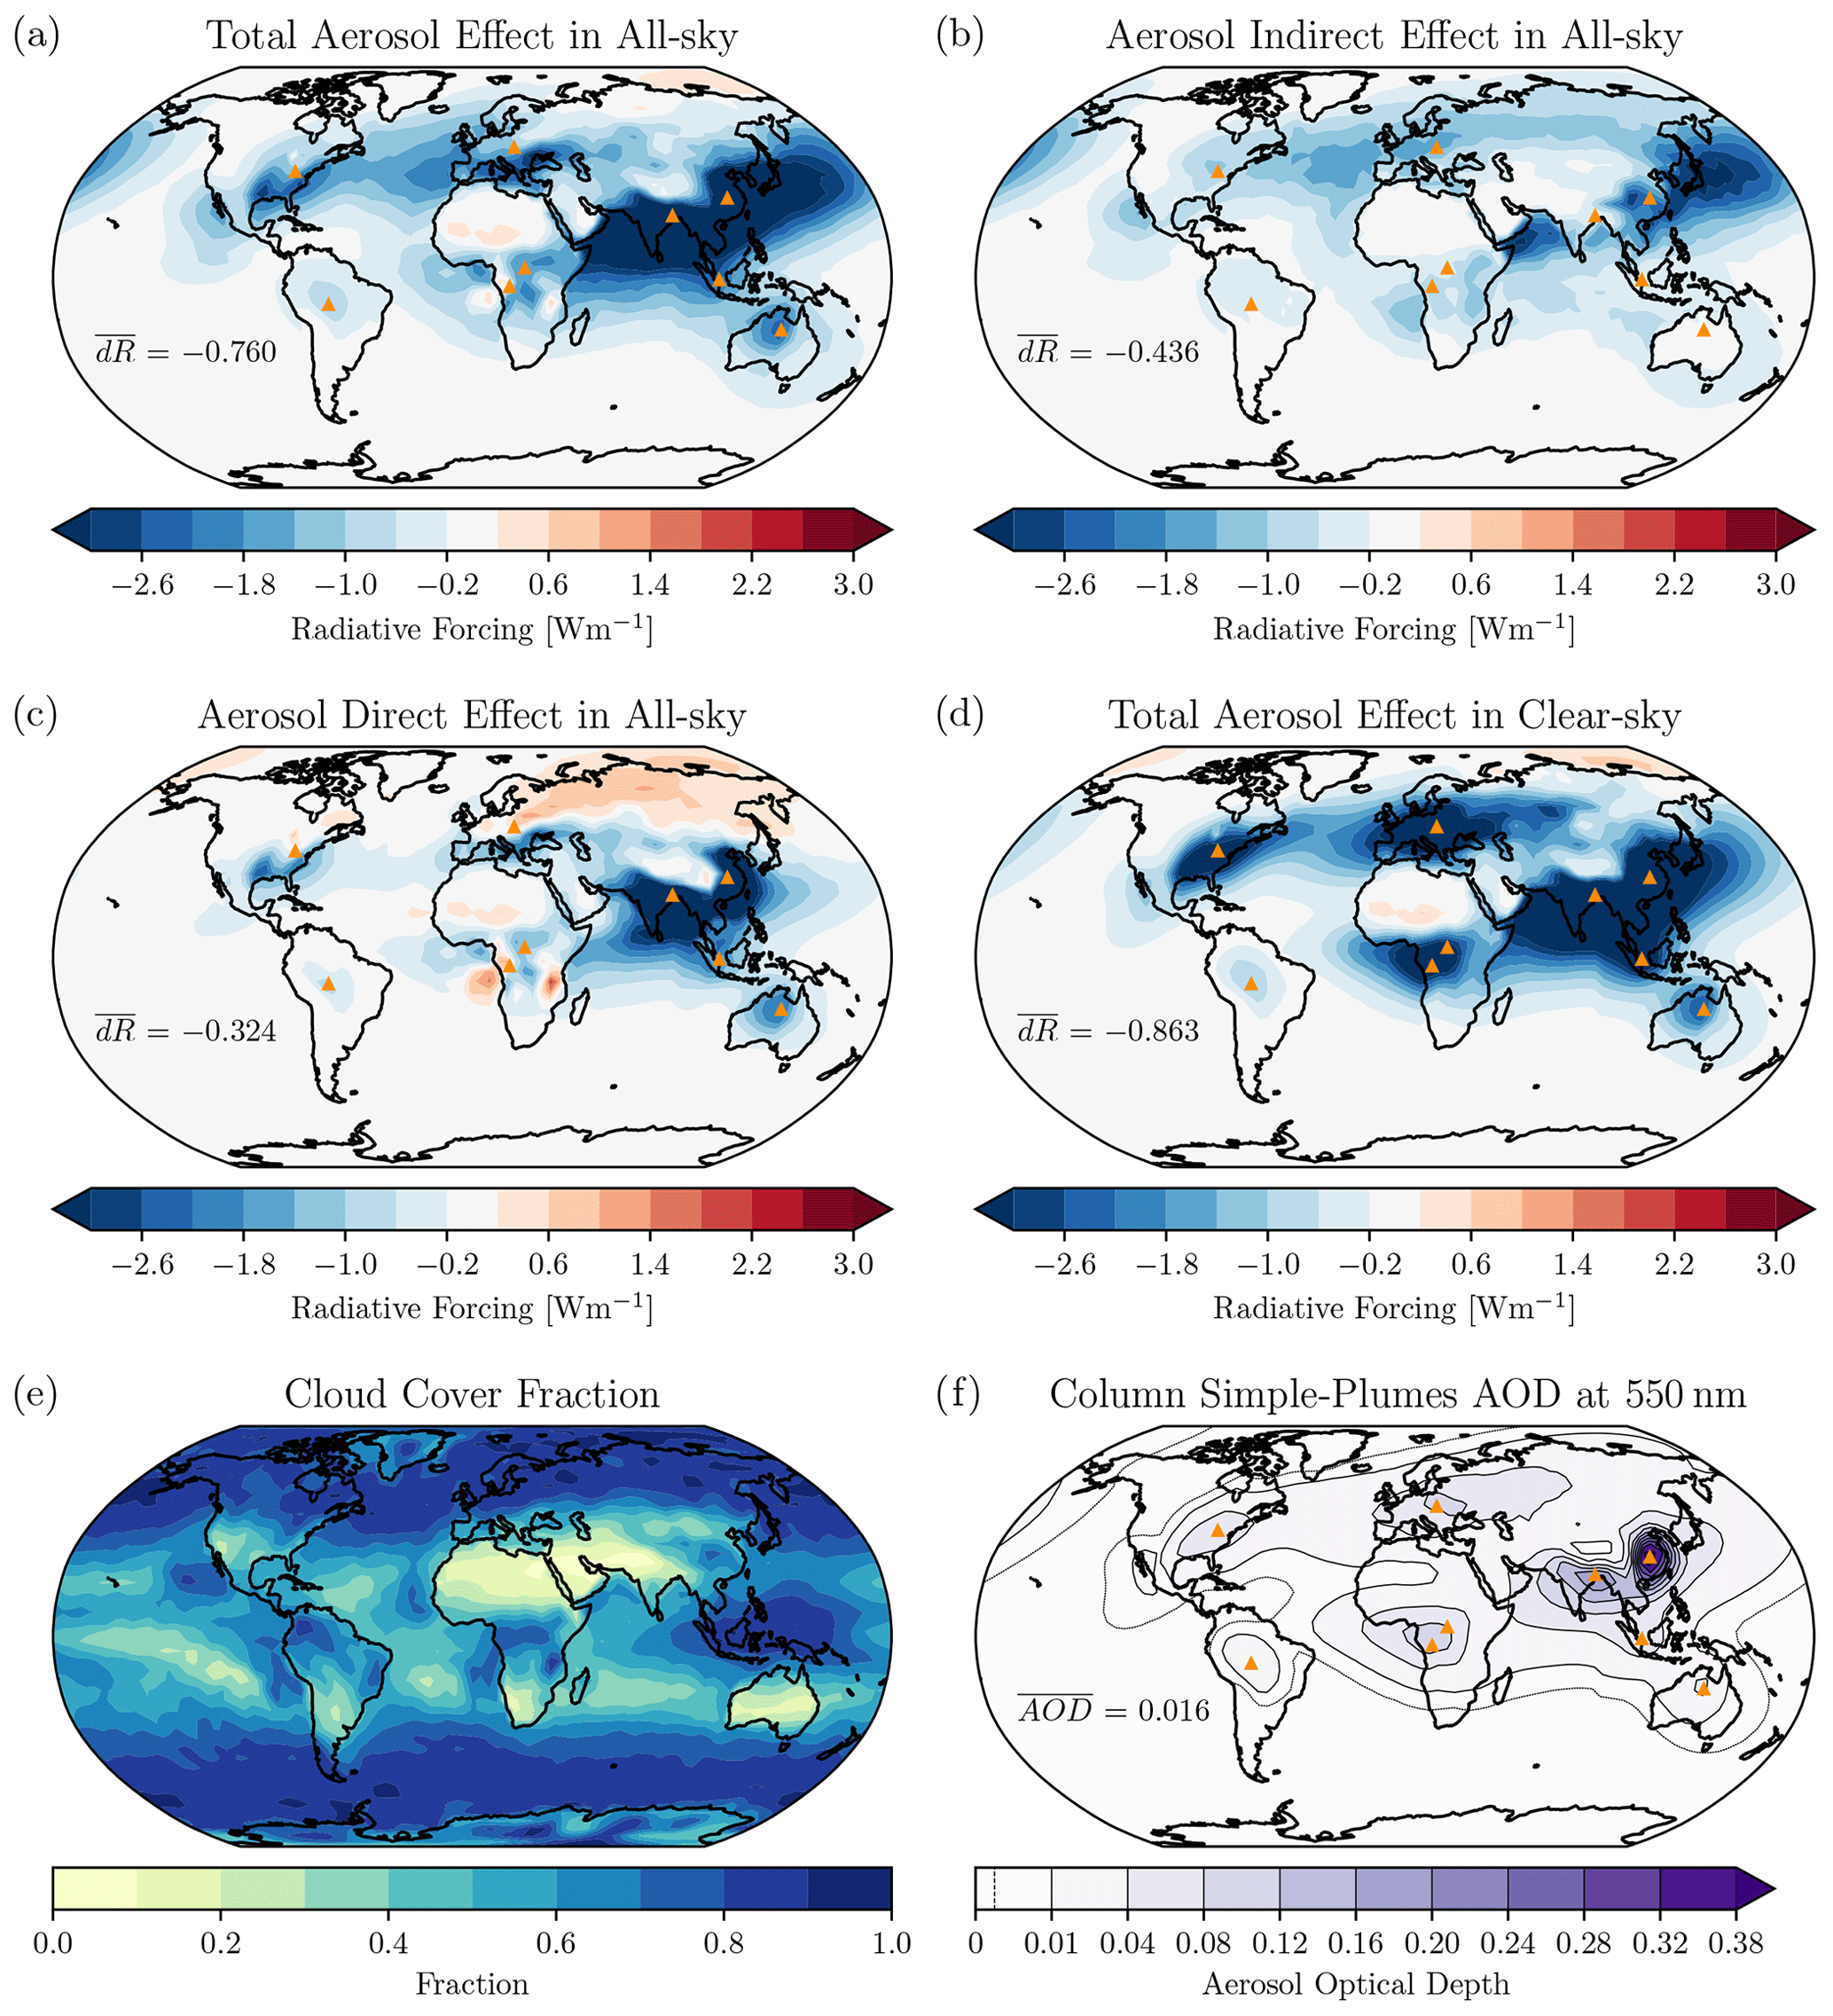
Figure 3Present-day (2005) spatial pattern (yearly mean) of (a) the total aerosol forcing, separated into (b) the indirect effect and (c) the direct effect. (d) The clear-sky aerosol effect. (e) The cloud cover fraction. Panel (f) shows the column aerosol optical depth at 550 nm from the MACv2-SP parameterization, with the dashed line showing the low-AOD-value contour (0.0025). Values annotated on the maps are global means.
The clear-sky global aerosol forcing surpasses the all-sky global total aerosol forcing (including direct and indirect effects; see Fig. 1). It is essential to note that under clear-sky conditions only the direct effect applies. Interestingly, the clear-sky aerosol forcing is more than twice as large as the direct effect observed under all-sky conditions. This pattern remains consistent across all the emission regions, with clear-sky aerosol forcing consistently exceeding the all-sky direct effect (see Fig. 2a and c). Under all-sky conditions, the presence of extensive cloud cover locally results in positive forcing from the direct effect of aerosols (see Fig. 3c and e), as the presence of clouds below aerosols moderates the net effect of aerosol scattering while amplifying the net effect of aerosol absorption (Li et al., 2022; Bellouin et al., 2020). With single-scattering albedos of 0.93 and 0.87 for industrial and biomass burning emissions, respectively, in the model (Stevens et al., 2017), absorption prevails in the presence of clouds, resulting in a positive direct effect of aerosols.
In addition, in regions with persistent cloud systems, the negative forcing from the indirect effect and the positive direct effect tend to balance each other out (see Fig. 3a and e). This mechanism has significant implications for regional emission efficiencies. In particular, it explains why Europe, which exhibits a weak efficiency under all-sky conditions (Fig. 2a) due to a positive direct effect at high latitudes (Fig. 3), demonstrates greater efficiency under clear-sky conditions (Fig. 2c). Looking at clear-sky conditions significantly narrows the gap in regional efficiencies. In South Asia, the efficiency under clear-sky conditions is only 2.1 times greater than in Europe, which is significantly lower than the difference of a factor of 20 observed in the all-sky direct effect. The most pronounced difference under clear-sky conditions is seen between South Asia and North America, with South Asia showing an efficiency 3.2 times greater than North America.
The influence of cloud cover on the direct effect of anthropogenic aerosols emerges as the main factor influencing regional efficiency. This largely explains the consistent increase in negative aerosol forcing despite reduced emissions in the last few decades. As the modelled cloud cover is less persistent at the emission sources in the South and East Asian regions compared to Europe, the shift in aerosol patterns results in an enhanced global direct effect. The indirect effect instead induces a forcing in remote regions downstream of emissions. The strength of this effect follows the global emissions despite the shift in the emission pattern. The increase in aerosol efficiency resulting from the shift in aerosol spatial patterns is critical for explaining the increase in aerosol forcing between the mid-1970s and the mid-2000s, despite similar emission levels. However, the disparity in emission efficiencies between the regions remains substantial even under clear-sky conditions. The following sections investigate other factors contributing to these regional differences.
3.4 MACv2-SP aerosol representation and regional variation
MACv2-SP has been designed to simplify the representation of anthropogenic aerosols in climate models using a straightforward parameterization. It provides monthly mean aerosol optical depth (AOD) values based on ground measurements, representing the 2005 spatial distribution. To get the spatial pattern in other years, the 2005 pattern is scaled with estimates of historical emissions (see Sect. 2.1 and Stevens et al., 2017). The measured AOD values are influenced by the rate of aerosol removal at a given location, so even though aerosol interactions with the atmosphere are not represented in MACv2-SP, removal processes may be implicitly recorded. In consequence, the AOD values in the model may not always be directly proportional to the regional emission levels. For example, wet deposition is the dominant sink of sulfate aerosols from industrial sources (Textor et al., 2006), and this deposition mechanism is particularly prominent over the coasts of eastern North America and East Asia (Rodhe et al., 2002), causing a relatively small AOD per unit of emissions there.
Figure 4a shows the clear-sky aerosol forcing against the corresponding AOD for each region. This representation noticeably reduces the difference in aerosol efficiency between regions compared to Fig. 2c, indicating that AOD is a better predictor of aerosol forcing than emissions. For instance, the efficiency of South Asia is 1.3 times greater than that of Europe when measured in Watt per square metre per unit of optical depth, whereas it was 2.1 times greater when measured in Watt per square metre per unit of emissions (in teragram of SO2 equivalent). Interestingly, when considering AOD levels, both Asian regions exhibit similar efficiencies, which is not the case when considering emissions. A possible explanation for this is that strong wet deposition in East Asia contributes to the removal of aerosols (Rodhe et al., 2002), resulting in a lower AOD per unit of emissions and thus a weaker direct effect in this region. Conversely, South Asia exhibits weaker wet deposition (Rodhe et al., 2002), allowing for greater forcing per unit of emissions.
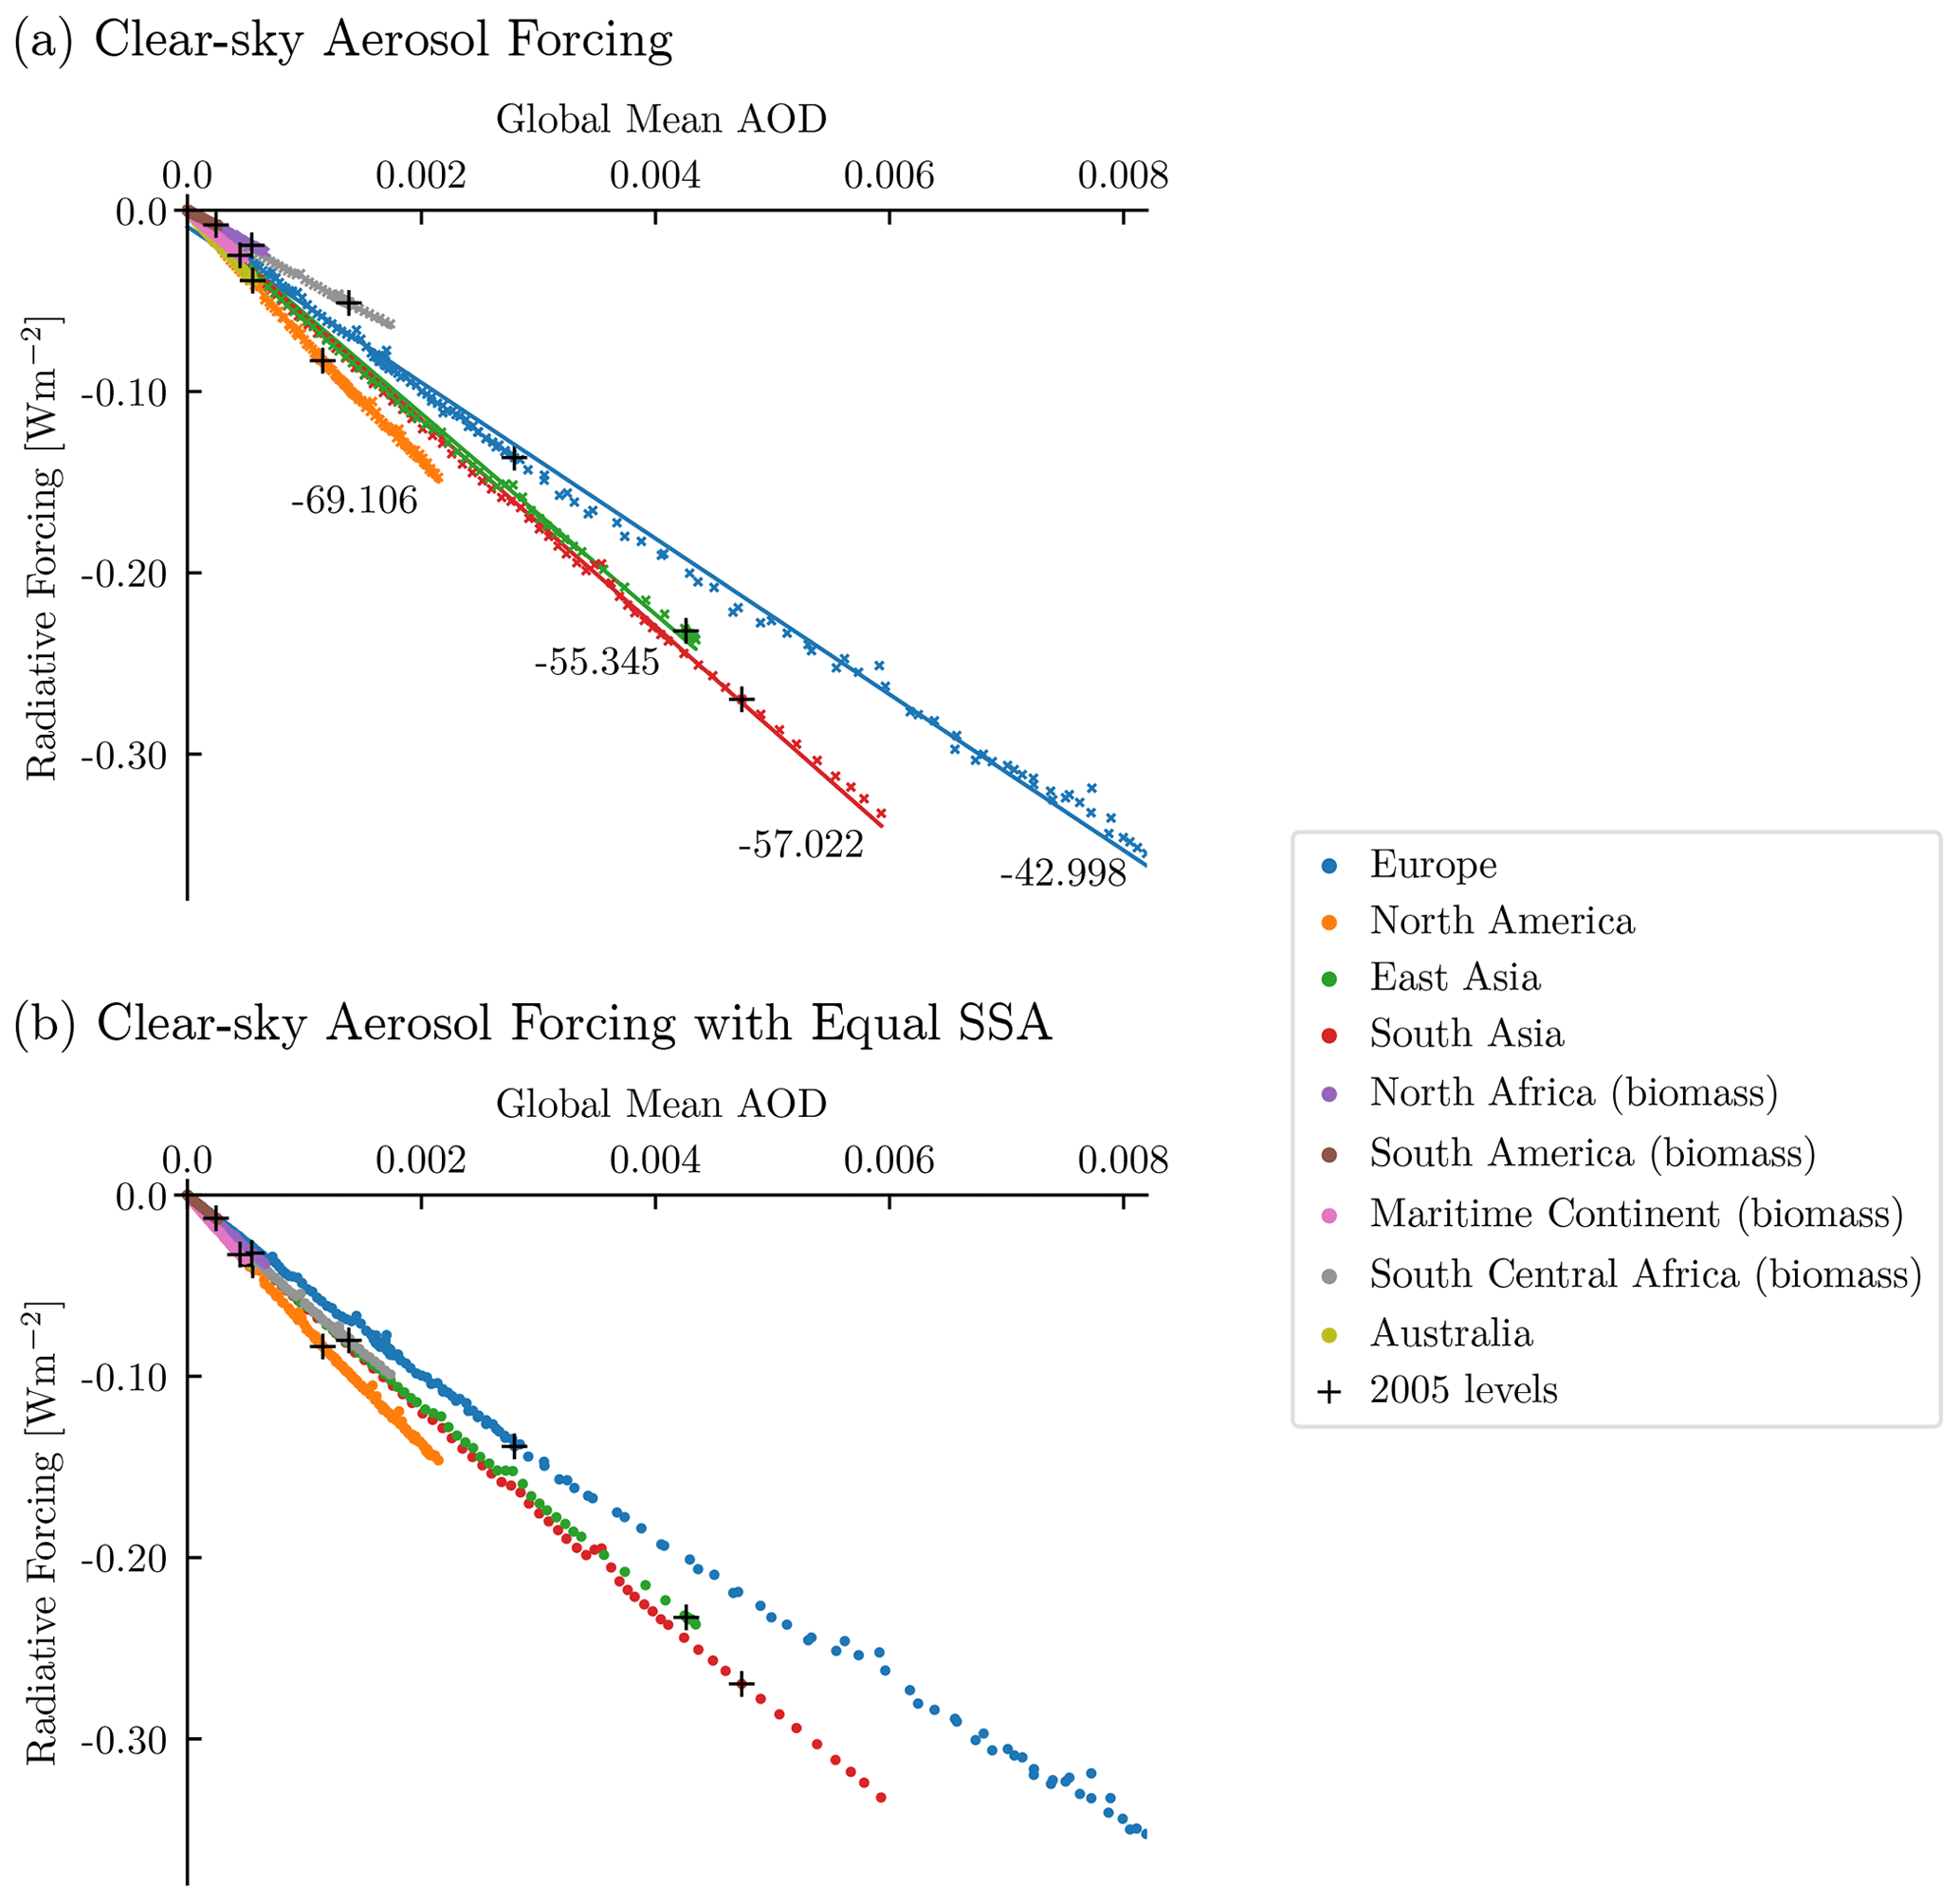
Figure 4Aerosol forcing from individual emission regions against regional-column aerosol optical depth. The plots are global yearly means for each year from 1850 to 2013, with panel (a) showing the clear-sky aerosol effect. Panel (b) shows the same but in a new experiment in which the single-scattering albedo was set to the same value for all the sources. Values annotated in the plots are the efficiencies in Watt per square metre per unit of optical depth of the major emission regions, based on linear regression. The black crosses indicate the emission levels and the resulting radiative forcing for the individual sources for the reference year of 2005.
This difference in aerosol removal patterns is the second most important explanation for the continued increase in aerosol forcing despite reduced emissions. The shift in aerosol patterns from Europe and North America to the Southeast Asian regions, with weaker wet deposition, prolongs the residence time of aerosols in the atmosphere, consequently enhancing the aerosol efficiency. In the last section, we suggest additional explanations for the remaining minor differences in aerosol efficiency between regions.
3.5 Aerosol single-scattering and surface albedo
The distinction between industrial and biomass aerosol emissions primarily affects the SSA parameter provided by MACv2-SP, which is 0.93 for industrial burning and 0.87 for biomass burning (Stevens et al., 2017). This distinction is made to account for the important differences in properties between industrial and biomass burning aerosols and to fit the 2005 aerosol climatology (see Sect. 2.1 and Stevens et al., 2017). We observe that the greater shortwave absorption by biomass burning aerosols results in weaker efficiencies when compared to industrial regions. Figure 4b is similar to Fig. 4a but with data from a new simulation where the SSA was set to the same value (0.93) for all sources, substantially reducing the spread for the biomass burning source regions. This demonstrates the influence of aerosol properties on the aerosol efficiency and thus the influence of the aerosol climatology used. It is important to note that the influence of SSA holds true under all-sky conditions as well, as SSA defines the ratio of scattering efficiency to total extinction efficiency. However, it plays a relatively minor role in the total global mean discrepancy between emissions and aerosol forcing, given that biomass burning regions have relatively lower emissions and forcing compared to industrial sources.
It is important to note that, despite this distinction in aerosol composition between industrial and biomass burning plumes, changes in aerosol composition over time are not represented in MACv2-SP (see Sect. 2.1). It can be argued that this may have implications for the evolution of the aerosol efficiency over time in this study. For example, as mentioned in Sect. 2.1, the increase in the black carbon fraction after 1970 should contribute to a decrease in the aerosol efficiency, which contradicts our results. However, this increase in the black carbon fraction is accompanied by a decrease in emissions from European and North American industrial plumes and an increase in emissions from Asian industrial plumes. Our results indicate that the increase in aerosol efficiency is primarily driven by the South Asian regions, which exhibit greater efficiency compared to other regions. Importantly, South Asia's aerosol composition has remained consistent since 1980 (Stevens et al., 2017), suggesting that its efficiency has likely remained stable over recent decades. In our study, South Asia has been the primary driver of aerosol efficiency since the onset of the global decline in aerosol emissions. Given this region's dominant role and the consistency of its aerosol composition, we conclude that incorporating temporal changes in aerosol composition would have a minimal impact on our findings. Consequently, such changes are unlikely to explain the observed global discrepancy between global aerosol emissions and the total direct effect.
Some spread still remains between the regions, suggesting that other mechanisms also influence the efficiency. For example, the influence of anthropogenic aerosols on the radiative balance depends on the nature of the underlying surface (Li et al., 2022), suggesting that the remaining differences in clear-sky efficiency among emission regions may be partly associated with differences in surface albedo between the regions.
We have investigated the relationship between aerosol emissions and radiative forcing in the MPI-ESM1.2 global climate model. Our results reveal an increase in global mean aerosol radiative forcing in recent decades, despite a global reduction in aerosol emissions. This increase is driven primarily by the direct effect, while the indirect effect remains more consistent with the emission levels. The increase in the direct effect is associated with regional shifts in emissions. Historically, Europe and North America have been the primary sources of aerosol emissions, but since the 1970s emissions have shifted to South and East Asia, where the radiative forcing per unit of emissions is larger.
The primary mechanism driving the disparity between global aerosol emissions and radiative forcing is the masking effect of clouds. Mid- to high-latitude regions, characterized by substantial cloud cover, exhibit enhanced aerosol absorption relative to scattering, resulting in a weaker negative or even positive direct effect. The recent shift in aerosol emissions to South and East Asia, where the cloud cover is less extensive, has led to a more negative global mean aerosol direct effect.
Other significant contributors include the regional variation in aerosol residence time within the atmosphere. Atmospheric conditions in South Asia with weaker removal processes, such as wet deposition, as compared to North America, allow aerosol particles to stay in the atmosphere longer, causing a greater efficiency in terms of radiative forcing per unit of emissions. Furthermore, the optical properties of the aerosol particles themselves can influence the forcing efficiency per unit of emissions. In recent decades, emerging biomass burning source regions have led to the emission of greater quantities of absorbing aerosols, which act to dampen the negative direct effect. Nevertheless, since the biomass burning emissions are relatively small compared to those from industrial sources, this has not offset the global negative increase in the direct effect. Furthermore, although the MACv2-SP parametrization does not include changes in aerosol composition over time, the greater efficiency and stable aerosol composition of the emerging South Asian region suggest that these changes are unlikely to influence the discrepancy observed in our findings. However, this has to be confirmed by similar studies in more explicit aerosol–climate models where changes in aerosol composition over time are included.
When compared to other global climate models, MPI-ESM1.2 has a relatively weak total aerosol forcing (Mauritsen et al., 2019), and Fiedler et al. (2023) found that the range of aerosol forcing among CMIP6 models is primarily influenced by the strength of the indirect effect. Our findings imply that models with a weaker indirect effect relative to the direct effect may exhibit a radiative forcing that is less consistent with global emissions, while models with a strong indirect effect are likely to have greater consistency between their aerosol forcing and emissions. This can help explain the variety in the evolution of the aerosol effective radiative forcing throughout the historical period in CMIP6 observed by Fiedler et al. (2023). The results of this study show that, in an ESM with a reasonable representation of the historical evolution of aerosol forcing, it is possible to have a trend in the direct radiative effect from aerosols that diverges from the trend of emissions. Based on the physical mechanisms explained here, we argue that this effect may be realistic. However, we encourage similar studies to verify whether this continuous increase in the direct effect can also be found in other models.
For the source code of MPI-ESM1.2, please refer to Mauritsen et al. (2019). Additionally, the specific parts of the code that were modified and developed for this study, as well as the model outputs and Python scripts used in producing the figures presented therein, are accessible through Zenodo at https://doi.org/10.5281/zenodo.10161509 (Hermant et al., 2023).
AH conducted the simulations and analysis and wrote most of the paper. All the authors contributed to the research and writing.
The contact author has declared that none of the authors has any competing interests.
Publisher’s note: Copernicus Publications remains neutral with regard to jurisdictional claims made in the text, published maps, institutional affiliations, or any other geographical representation in this paper. While Copernicus Publications makes every effort to include appropriate place names, the final responsibility lies with the authors.
The computational resources were provided by the National Academic Infrastructure for Supercomputing in Sweden (NAISS).
This project was funded by the Swedish e-Science Research Centre (SeRC), the European Research Council (ERC) (grant no. 770765), the European Union's Horizon 2020 research and innovation programme (grant nos. 820829, 101003470 and 101137680), and the Swedish Research Council (VR) (grant no. 2022-03262). The computational resources provided by NAISS were partially funded by VR (grant no. 2022-06725).
The publication of this article was funded by the Swedish Research Council, Forte, Formas, and Vinnova.
This paper was edited by Kostas Tsigaridis and reviewed by two anonymous referees.
Bellouin, N., Quaas, J., Gryspeerdt, E., Kinne, S., Stier, P., Watson-Parris, D., Boucher, O., Carslaw, K. S., Christensen, M., Daniau, A.-L., Dufresne, J.-L., Feingold, G., Fiedler, S., Forster, P., Gettelman, A., Haywood, J. M., Lohmann, U., Malavelle, F., Mauritsen, T., McCoy, D. T., Myhre, G., Mülmenstädt, J., Neubauer, D., Possner, A., Rugenstein, M., Sato, Y., Schulz, M., Schwartz, S. E., Sourdeval, O., Storelvmo, T., Toll, V., Winker, D., and Stevens, B.: Bounding Global Aerosol Radiative Forcing of Climate Change, Rev. Geophys., 58, e2019RG000660, https://doi.org/10.1029/2019RG000660, 2020. a, b
Block, K. and Mauritsen, T.: Forcing and feedback in the MPI-ESM-LR coupled model under abruptly quadrupled CO2, J. Adv. Model. Earth Sy., 5, 676–691, https://doi.org/10.1002/jame.20041, 2013. a
Booth, B. B. B., Harris, G. R., Jones, A., Wilcox, L., Hawcroft, M., and Carslaw, K. S.: Comments on “Rethinking the Lower Bound on Aerosol Radiative Forcing”, J. Climate, 31, 9407–9412, https://doi.org/10.1175/JCLI-D-17-0369.1, 2018. a
Colman, R. A. and McAvaney, B. J.: A study of general circulation model climate feedbacks determined from perturbed sea surface temperature experiments, J. Geophys. Res.-Atmos., 102, 19383–19402, https://doi.org/10.1029/97jd00206, 1997. a
Eyring, V., Bony, S., Meehl, G. A., Senior, C. A., Stevens, B., Stouffer, R. J., and Taylor, K. E.: Overview of the Coupled Model Intercomparison Project Phase 6 (CMIP6) experimental design and organization, Geosci. Model Dev., 9, 1937–1958, https://doi.org/10.5194/gmd-9-1937-2016, 2016. a
Fiedler, S., van Noije, T., Smith, C. J., Boucher, O., Dufresne, J.-L., Kirkevåg, A., Olivié, D., Pinto, R., Reerink, T., Sima, A., and Schulz, M.: Historical Changes and Reasons for Model Differences in Anthropogenic Aerosol Forcing in CMIP6, Geophys. Res. Lett., 50, e2023GL104848, https://doi.org/10.1029/2023gl104848, 2023. a, b, c
Forster, P., Storelvmo, T., Armour, K., Collins, W., Dufresne, J.-L., Frame, D., Lunt, D., Mauritsen, T., Palmer, M., Watanabe, M., Wild, M., and Zhang, H.: The Earth’s Energy Budget, Climate Feedbacks, and Climate Sensitivity, Climate Change 2021: The Physical Science Basis. Contribution of Working Group I to the Sixth Assessment Report of the Intergovernmental Panel on Climate Change, edited by: Masson-Delmotte, V., Zhai, P., Pirani, A., Connors, S. L., Péan, C., Berger, S., Caud, N., Chen, Y., Goldfarb, L., Gomis, M. I., Huang, M., Leitzell, K., Lonnoy, E., Matthews, J. B. R., Maycock, T. K., Waterfield, T., Yelekçi, O., Yu, R., and Zhou, B., 923–1054, https://doi.org/10.1017/9781009157896.009, 2021. a
Gryspeerdt, E., Quaas, J., Ferrachat, S., Gettelman, A., Ghan, S., Lohmann, U., Morrison, H., Neubauer, D., Partridge, D. G., Stier, P., Takemura, T., Wang, H., Wang, M., and Zhang, K.: Constraining the Instantaneous Aerosol Influence on Cloud Albedo, P. Natl. Acad. Sci. USA, 114, 4899–4904, https://doi.org/10.1073/pnas.1617765114, 2017. a
Hermant, A., Huusko, L., and Mauritsen, T.: Source code and model outputs for “Increasing Aerosol Direct Effect Despite Declining Global Emissions”, Zenodo [code and data set], https://doi.org/10.5281/zenodo.10161509, 2023. a
Huusko, L., Modak, A., and Mauritsen, T.: Stronger Response to the Aerosol Indirect Effect Due To Cooling in Remote Regions, Geophys. Res. Lett., 49, e2022GL101184, https://doi.org/10.1029/2022gl101184, 2022. a
Kinne, S., O'Donnel, D., Stier, P., Kloster, S., Zhang, K., Schmidt, H., Rast, S., Giorgetta, M., Eck, T. F., and Stevens, B.: MAC-v1: A new global aerosol climatology for climate studies, J. Adv. Model. Earth Sy., 5, 704–740, https://doi.org/10.1002/jame.20035, 2013. a
Klocke, D., Quaas, J., and Stevens, B.: Assessment of different metrics for physical climate feedbacks, Clim. Dynam., 41, 1173–1185, https://doi.org/10.1007/s00382-013-1757-1, 2013. a
Kretzschmar, J., Salzmann, M., Mülmenstädt, J., Boucher, O., and Quaas, J.: Comment on “Rethinking the Lower Bound on Aerosol Radiative Forcing”, J. Climate, 30, 6579–6584, https://doi.org/10.1175/JCLI-D-16-0668.1, 2017. a
Li, J., Carlson, B. E., Yung, Y. L., Lv, D., Hansen, J., Penner, J. E., Liao, H., Ramaswamy, V., Kahn, R. A., Zhang, P., Dubovik, O., Ding, A., Lacis, A. A., Zhang, L., and Dong, Y.: Scattering and absorbing aerosols in the climate system, Nature Reviews Earth and Environment, 3, 363–379, https://doi.org/10.1038/s43017-022-00296-7, 2022. a, b
Malavelle, F. F., Haywood, J. M., Jones, A., Gettelman, A., Clarisse, L., Bauduin, S., Allan, R. P., Karset, I. H. H., Kristjánsson, J. E., Oreopoulos, L., Cho, N., Lee, D., Bellouin, N., Boucher, O., Grosvenor, D. P., Carslaw, K. S., Dhomse, S., Mann, G. W., Schmidt, A., Coe, H., Hartley, M. E., Dalvi, M., Hill, A. A., Johnson, B. T., Johnson, C. E., Knight, J. R., O'Connor, F. M., Partridge, D. G., Stier, P., Myhre, G., Platnick, S., Stephens, G. L., Takahashi, H., and Thordarson, T.: Strong Constraints on Aerosol – Cloud Interactions from Volcanic Eruptions, Nature, 546, 485–491, https://doi.org/10.1038/nature22974, 2017. a
Mauritsen, T. and Roeckner, E.: Tuning the MPI-ESM1.2 Global Climate Model to Improve the Match With Instrumental Record Warming by Lowering Its Climate Sensitivity, J. Adv. Model. Earth Sy., 12, e2019MS002037, https://doi.org/10.1029/2019ms002037, 2020. a
Mauritsen, T., Bader, J., Becker, T., Behrens, J., Bittner, M., Brokopf, R., Brovkin, V., Claussen, M., Crueger, T., Esch, M., Fast, I., Fiedler, S., Fläschner, D., Gayler, V., Giorgetta, M., Goll, D. S., Haak, H., Hagemann, S., Hedemann, C., Hohenegger, C., Ilyina, T., Jahns, T., de-la Cuesta, D. J., Jungclaus, J., Kleinen, T., Kloster, S., Kracher, D., Kinne, S., Kleberg, D., Lasslop, G., Kornblueh, L., Marotzke, J., Matei, D., Meraner, K., Mikolajewicz, U., Modali, K., Möbis, B., Müller, W. A., Nabel, J. E. M. S., Nam, C. C. W., Notz, D., Nyawira, S.-S., Paulsen, H., Peters, K., Pincus, R., Pohlmann, H., Pongratz, J., Popp, M., Raddatz, T. J., Rast, S., Redler, R., Reick, C. H., Rohrschneider, T., Schemann, V., Schmidt, H., Schnur, R., Schulzweida, U., Six, K. D., Stein, L., Stemmler, I., Stevens, B., Storch, J.-S., Tian, F., Voigt, A., Vrese, P., Wieners, K.-H., Wilkenskjeld, S., Winkler, A., and Roeckner, E.: Developments in the MPI-M Earth System Model version 1.2 (MPI-ESM1.2) and Its Response to Increasing CO2, J. Adv. Model. Earth Sy., 11, 998–1038, https://doi.org/10.1029/2018ms001400, 2019. a, b, c, d
McCoy, D. T., Bender, F. A.-M., Mohrmann, J. K. C., Hartmann, D. L., Wood, R., and Grosvenor, D. P.: The Global Aerosol-cloud First Indirect Effect Estimated Using MODIS, MERRA, and AeroCom, J. Geophys. Res.-Atmos., 122, 1779–1796, https://doi.org/10.1002/2016JD026141, 2017. a
Meraner, K., Mauritsen, T., and Voigt, A.: Robust increase in equilibrium climate sensitivity under global warming, Geophys. Res. Lett., 40, 5944–5948, https://doi.org/10.1002/2013gl058118, 2013. a
Mülmenstädt, J., Gryspeerdt, E., Salzmann, M., Ma, P.-L., Dipu, S., and Quaas, J.: Separating radiative forcing by aerosol–cloud interactions and rapid cloud adjustments in the ECHAM–HAMMOZ aerosol–climate model using the method of partial radiative perturbations, Atmos. Chem. Phys., 19, 15415–15429, https://doi.org/10.5194/acp-19-15415-2019, 2019. a
Pincus, R., Forster, P. M., and Stevens, B.: The Radiative Forcing Model Intercomparison Project (RFMIP): experimental protocol for CMIP6, Geosci. Model Dev., 9, 3447–3460, https://doi.org/10.5194/gmd-9-3447-2016, 2016. a
Quaas, J., Jia, H., Smith, C., Albright, A. L., Aas, W., Bellouin, N., Boucher, O., Doutriaux-Boucher, M., Forster, P. M., Grosvenor, D., Jenkins, S., Klimont, Z., Loeb, N. G., Ma, X., Naik, V., Paulot, F., Stier, P., Wild, M., Myhre, G., and Schulz, M.: Robust evidence for reversal of the trend in aerosol effective climate forcing, Atmos. Chem. Phys., 22, 12221–12239, https://doi.org/10.5194/acp-22-12221-2022, 2022. a, b
Rodhe, H., Dentener, F., and Schulz, M.: The Global Distribution of Acidifying Wet Deposition, Environ. Sci. Technol., 36, 4382–4388, https://doi.org/10.1021/es020057g, 2002. a, b, c
Smith, S. J., van Aardenne, J., Klimont, Z., Andres, R. J., Volke, A., and Delgado Arias, S.: Anthropogenic sulfur dioxide emissions: 1850–2005, Atmos. Chem. Phys., 11, 1101–1116, https://doi.org/10.5194/acp-11-1101-2011, 2011. a
Stevens, B.: Rethinking the Lower Bound on Aerosol Radiative Forcing, J. Climate, 28, 4794–4819, https://doi.org/10.1175/jcli-d-14-00656.1, 2015. a, b
Stevens, B., Fiedler, S., Kinne, S., Peters, K., Rast, S., Müsse, J., Smith, S. J., and Mauritsen, T.: MACv2-SP: a parameterization of anthropogenic aerosol optical properties and an associated Twomey effect for use in CMIP6, Geosci. Model Dev., 10, 433–452, https://doi.org/10.5194/gmd-10-433-2017, 2017. a, b, c, d, e, f, g, h, i, j, k, l, m, n
Textor, C., Schulz, M., Guibert, S., Kinne, S., Balkanski, Y., Bauer, S., Berntsen, T., Berglen, T., Boucher, O., Chin, M., Dentener, F., Diehl, T., Easter, R., Feichter, H., Fillmore, D., Ghan, S., Ginoux, P., Gong, S., Grini, A., Hendricks, J., Horowitz, L., Huang, P., Isaksen, I., Iversen, I., Kloster, S., Koch, D., Kirkevåg, A., Kristjansson, J. E., Krol, M., Lauer, A., Lamarque, J. F., Liu, X., Montanaro, V., Myhre, G., Penner, J., Pitari, G., Reddy, S., Seland, Ø., Stier, P., Takemura, T., and Tie, X.: Analysis and quantification of the diversities of aerosol life cycles within AeroCom, Atmos. Chem. Phys., 6, 1777–1813, https://doi.org/10.5194/acp-6-1777-2006, 2006. a
Twomey, S.: Pollution and the planetary albedo, Atmos. Environ., 8, 1251–1256, https://doi.org/10.1016/0004-6981(74)90004-3, 1974. a, b
Wetherald, R. T. and Manabe, S.: Cloud Feedback Processes in a General Circulation Model, J. Atmos. Sci., 45, 1397–1416, https://doi.org/10.1175/1520-0469(1988)045<1397:cfpiag>2.0.co;2, 1988. a