the Creative Commons Attribution 4.0 License.
the Creative Commons Attribution 4.0 License.
 | 24 Sep 2024
Automated compound speciation, cluster analysis, and quantification of organic vapors and aerosols using comprehensive two-dimensional gas chromatography and mass spectrometry
Xuan Zheng
Shuwen Guo
Lewei Zeng
Ting Chen
Bohan Yang
Shupei Xiao
Qiongqiong Wang
Zhiyuan Li
Yan You
Shaojun Zhang
Ye Wu
The advancement of analytical techniques, such as comprehensive two-dimensional gas chromatography coupled with mass spectrometry (GC×GC–MS), enables the efficient separation of complex organics. Developing innovative methods for data processing and analysis is crucial to unlock the full potential of GC×GC–MS in understanding intricate chemical mixtures. In this study, we proposed an innovative method for the semi-automated identification and quantification of complex organic mixtures using GC×GC–MS. The method was formulated based on self-constructed mass spectrum patterns and the traversal algorithms and was applied to organic vapor and aerosol samples collected from the tailpipe emissions of heavy-duty diesel vehicles and the ambient atmosphere. Thousands of compounds were filtered, speciated, and clustered into 26 categories, including aliphatic and cyclic hydrocarbons, aromatic hydrocarbons, aliphatic oxygenated species, phenols and alkylphenols, and heteroatom-containing species. The identified species accounted for over 80 % of all the eluted chromatographic peaks at the molecular level. A comprehensive analysis of quantification uncertainty was undertaken. Using representative compounds, quantification uncertainties were found to be less than 37.67 %, 22.54 %, and 12.74 % for alkanes, polycyclic aromatic hydrocarbons (PAHs), and alkyl-substituted benzenes, respectively, across the GC×GC space, excluding the first and the last time intervals. From a source apportionment perspective, adamantane was clearly isolated as a potential tracer for heavy-duty diesel vehicle (HDDV) emissions. The systematic distribution of nitrogen-containing compounds in oxidized and reduced valences was discussed, and many of them served as critical tracers for secondary nitrate formation processes. The results highlighted the benefits of developing self-constructed models for the enhanced peak identification, automated cluster analysis, robust uncertainty estimation, and source apportionment and achieving the full potential of GC×GC–MS in atmospheric chemistry.
- Article
(2886 KB) - Full-text XML
-
Supplement
(1355 KB) - BibTeX
- EndNote


Improved sampling strategies, coupled with innovative measurement techniques, are imperative to capture the dynamic nature of atmospheric chemistry, particularly in the context of climate change and health risks (Franklin et al., 2023, 2022; Huo et al., 2021; Phillips et al., 2018). Comprehensive two-dimensional gas chromatography coupled with mass spectrometry (GC×GC–MS) has emerged as a powerful tool for compound detection and identification, benefiting from the combination of two columns with orthogonal selectivity (Alam et al., 2013; Franklin et al., 2022).
Despite its capabilities, GC×GC–MS encounters formidable challenges in data analysis, which can be extremely complicated and demanding. Efforts have been made to handle the deluge of data generated by GC×GC–MS. Traditionally, mass spectra were deconvoluted and compared to spectra from the National Institute of Standards and Technology (NIST) library for peak identification with pre-defined criteria (Guo et al., 2016; Piotrowski et al., 2018). Retention indices (RIs) were further introduced to distinguish homologous compounds with resembling mass spectra. A pioneering and instructive work for searching criteria to classify GC×GC peaks was published in 2003 (Welthagen et al., 2003). Welthagen et al. (2003) incorporated the mass fragmentation patterns to classify compounds in atmospheric aerosol samples. Compounds belonging to the same chemical group are related to one another in the GC×GC space and are distributed in a structured pattern. They successfully identified seven groups of compounds, including alkanes, alkenes and cycloalkanes, alkyl-substituted benzenes, alkyl-substituted polar benzenes, hydrated naphthalenes and alkenyl benzenes, alkylated naphthalenes, and alkane acids, occupying more than 60 % of the total peak area. This work set a good example of how user-defined rules could facilitate the identification of specific compound groups.
Recent advances in chemometric tools for GC×GC–MS analysis involving machine learning and deep learning renovate multi-dimensional chromatography fields (Stefanuto et al., 2021). Bendik et al. (2021) developed a programming suite for high-confidence and fast compound identification using GC×GC coupled with time-of-flight mass spectrometry (ToF-MS) (Bendik et al., 2021). He et al. (2022a, b) extracted featured mass spectrometric information of the intermediate-volatility and semi-volatile organic compounds (I/SVOCs) by integrating algorithmic approaches into GC×GC–MS data (He et al., 2022a, b). A novel pixel-based multiway principal component analysis method was employed in Song et al. (2023) to identify key tracers during incense burning (Song et al., 2023). Nevertheless, interpreting GC×GC–MS data requires advanced computational tools and expertise, and the investigation of unknown compounds remains challenging due to the inadequate validation procedures, overreliance on manual data processing, limited access to computational resources, and the insufficient expertise in handling complex chromatographic data effectively.
Bridging this gap requires further development of sophisticated algorithms and analytical approaches to unlock the full potential of GC×GC. This study proposes a bottom-up method for cluster analysis and quantification of organic vapors and aerosols within complex atmospheric mixtures. The scripts were initiated with the recognition of the common mass spectral features of specific species and were tailored to a wide range of compound clusters. The scripts were then trained, iterated, and optimized using real sample data until robust outputs were achieved. The new strategy reduces the ambiguity often associated with identifying compounds in complex mixtures.
The proliferation of heavy-duty diesel vehicles (HDDVs) has raised significant concerns due to their increasing role in freight transport and in various industrial operations (Yan et al., 2022; Cheng et al., 2022). Despite their low retention rate, HDDVs release substantial amounts of particulate matter, nitrogen oxides, ammonia, and carbon monoxide into the atmosphere compared to other vehicle types (Wang et al., 2023; Silva et al., 2023; Chang et al., 2022; Stanimirova et al., 2023; Hamilton and Harley, 2021; Kruve et al., 2014). To address this, gas and aerosol samples were collected from representative HDDV tailpipes and the ambient environment and then analyzed using GC×GC–MS. The proposed bottom-up method was employed for a comprehensive analysis of the complex organic mixtures, resulting in the identification of 26 compound categories, including hydrocarbons in multiple forms, oxygenated components, and species containing heteroatoms. Over 80 % of all the chromatographic peaks were identified and assigned to a compound cluster using the proposed method, leaving a minor portion of organic matrix unresolved. Different compound clusters occupied separate positions in the GC×GC space, and distinctive distribution patterns within diverse samples and their contribution fractions were revealed. Quantification uncertainties were addressed thoroughly, and the significant potential deviation when using n-alkanes as semi-quantification surrogates was highlighted. Overall, integrating automated algorithms with GC×GC data analysis holds significant implications for advancing our understanding of atmospheric chemistry, improving secondary organic aerosol (SOA) estimation, and guiding the formulation of environmental policies.
2.1 Sample collection, treatment, and instrumental analysis
For the collection of HDDV tailpipe emissions, chassis dynamometer experiments were conducted at the China Automotive Technology & Research Center (CATARC) in Guangzhou, China. Exhaust emissions from HDDVs were diluted in a constant volume sampler (CVS, CVS-ONE-MV-HE, Horiba), following the China heavy-duty commercial vehicle test cycle for tractor trailer (CHTC-TT) driving cycles. Two HDDVs equipped with the selective catalytic reduction (SCR) system were recruited. The two HDDVs met the China IV national emission standard and were manufactured in 2021. More information is summarized in Table S1 in the Supplement. The average temperature in the sampling train was precisely controlled at 47 °C, while airflow, relative humidity, and pressure were monitored simultaneously. The speed trace and characteristics of CHTC-TT are shown in Fig. S1 in the Supplement.
Gaseous exhausts were collected using two adsorbent thermal desorption (TD) tubes in series (Tenax TA, C1-AXXX-5003, Markes International) after passing through a Teflon filter. Particulate exhausts were deposited on a 47 mm quartz filter (Grade QM-A, Whatman). Ambient PM2.5 filter samples were collected on the rooftop of a five-story building on the campus of Shenzhen University (22.60° N, 114.00° E) during November 2023 in western Shenzhen, approximately 25 m above the ground. The sampling site was surrounded by the campus, residential areas, greenbelts, and a golf park, as shown in Fig. S2 in the Supplement. Previous studies demonstrated that the PM2.5 concentration in this area represented the average pollution scheme in Shenzhen (Huang et al., 2018; Yu et al., 2020). The sampling strategy followed a regular schedule of one 24 h sample every day using a high-volume sampler (Th-1000c II, Wuhan Tianhong Environmental Protection Industry Co., Ltd). In total, 55 TA tube samples (including 11 field blank samples), 20 HDDV aerosol samples (including 3 field blank samples), and 6 ambient aerosol samples (including 1 blank sample) were collected. The list of ambient samples and the relevant PM concentrations are listed in Table S2 in the Supplement. The sorbent tubes were well sealed and stored dry at room temperature, and quartz filters were frozen at −18 °C before analysis. All sampling materials were pre-baked thoroughly to remove potential carbonaceous contamination.
TD samples were injected with 2 µL of deuterated internal standard (IS) mixing solution through a mild N2 blow (CSLR, Markes International). The list of deuterated ISs is shown in Table S3 in the Supplement. A precise portion of 1 cm2 (1 cm×1 cm) filter sample was isolated and cut into strips. They were spiked with 2 µL of IS mixing solution and inserted into a passivated quartz tube. All TD samples and quartz tubes were loaded onto a thermal desorption autosampler (ULTRA-xr, Markes International), thermally desorbed (UNITY-xr, Markes International), and subjected to GC×GC separation (Agilent 8890, Agilent Technologies; Solid State Modulator1810, J&X Technologies) and mass spectrometry detection (Agilent 5977B, Agilent Technologies).
The thermal desorption system heated the TD tubes to 320 °C (quartz tubes to 330 °C) for 20 min, while the trap remained at 20 °C. Following tube desorption, the trap temperature was raised to 330 °C (340 °C for quartz tubes) for 5 min at the maximum heating rate, and the vaporized analytes were purged into the first GC column with a desorb split flow of 6 mL min−1. Separation of the analytes was carried out using a DB-5ms capillary column (, Agilent Technologies) as the primary column and a DB-17ms capillary column (, Agilent Technologies) as the secondary column. The modulation column consisted of a VF-1ms capillary column (, Agilent Technologies) connected to the first column and an Ultimate Plus Deactivated Fused Silica tubing (0.6 m×0.25 mm, Agilent Technologies) connected to the second column.
Initially, the GC oven was set at 50 °C for 3 min, followed by a gradual increase at a rate of 5 °C min−1 until it reached 310 °C, where it was maintained for an additional 5 min. The entry and exit hot zones were set +10 °C higher than the GC oven temperature, while the trap zone was maintained at −50 °C. The modulation cycle had a period of 4 s. Carrier gas flow was set at 1.2 mL min−1. The MS had an integer resolution and was conducted in electron impact positive (EI+) mode (70 eV). It was operated over a range of 20–350 amu, and the temperature of the transfer line, ion source, and MS quadrupole was 300, 250, and 170 °C, respectively.
2.2 Data collection, alignment, and parsing
GC×GC–MS data acquisition was performed using Enhanced MassHunter (version 10.0, Agilent Technologies) and SSCenter (version 2.4.0.0, J&X Technologies). All data utilized to develop and test the scripts were processed by Canvas Browser (version 2.5, J&X Technologies), which included baseline correction, mass spectra deconvolution, and peak smoothing. Baseline correction and peak smoothing enhanced the signal-to-noise ratio () and improved overall data quality.
Chromatographic peaks were filtered using the following criteria: baseline noise=150 and . For each individual sample, after isolating all compounds of interest, a peak table was exported with first retention time (RT) and second RT, peak area, peak height, peak width, and deconvoluted mass spectra, arranged in first RT sequential order. These quantitative variables were further processed for targeted and non-targeted “omics”-oriented analysis.
As expected, the chromatographic variables experienced RT shifts due to column degradation, routine maintenance (e.g., cutting column), and system fluctuations (e.g., variations in carrier gas pressure). The initial tolerance for RT shifts in adaptive cluster matching was set at one period of modulation in the first dimension and 0.1 s in the second dimension. Additionally, a 2D shift cluster consisting of C16D34, C24D50, and C32D66 was configured, with the merit of correcting the second RT shift. Data correction or data alignment is critical for accurate and consistent peak integration.
2.3 Algorithmic development
EI spectra are typically characterized by a molecular ion (M+) peak plus a collection of fragment ion peaks. The M+ may dominate the mass spectrum in some cases (e.g., unsubstituted polycyclic aromatic hydrocarbons (PAHs)), but more frequently it presents at a relatively low intensity. The EI spectra are highly comparable among different instrument systems and experimental conditions, making them an excellent measure for identifying compounds. The characteristic ions and their relative intensities depend on the intrinsic nature of the targeted compounds, necessitating knowledge of basic rules and common fragmentation routes to interpret EI mass spectra. Figure 1 illustrates the workflow for establishing computational strategies for robust and reproducible GC×GC–MS data processing.
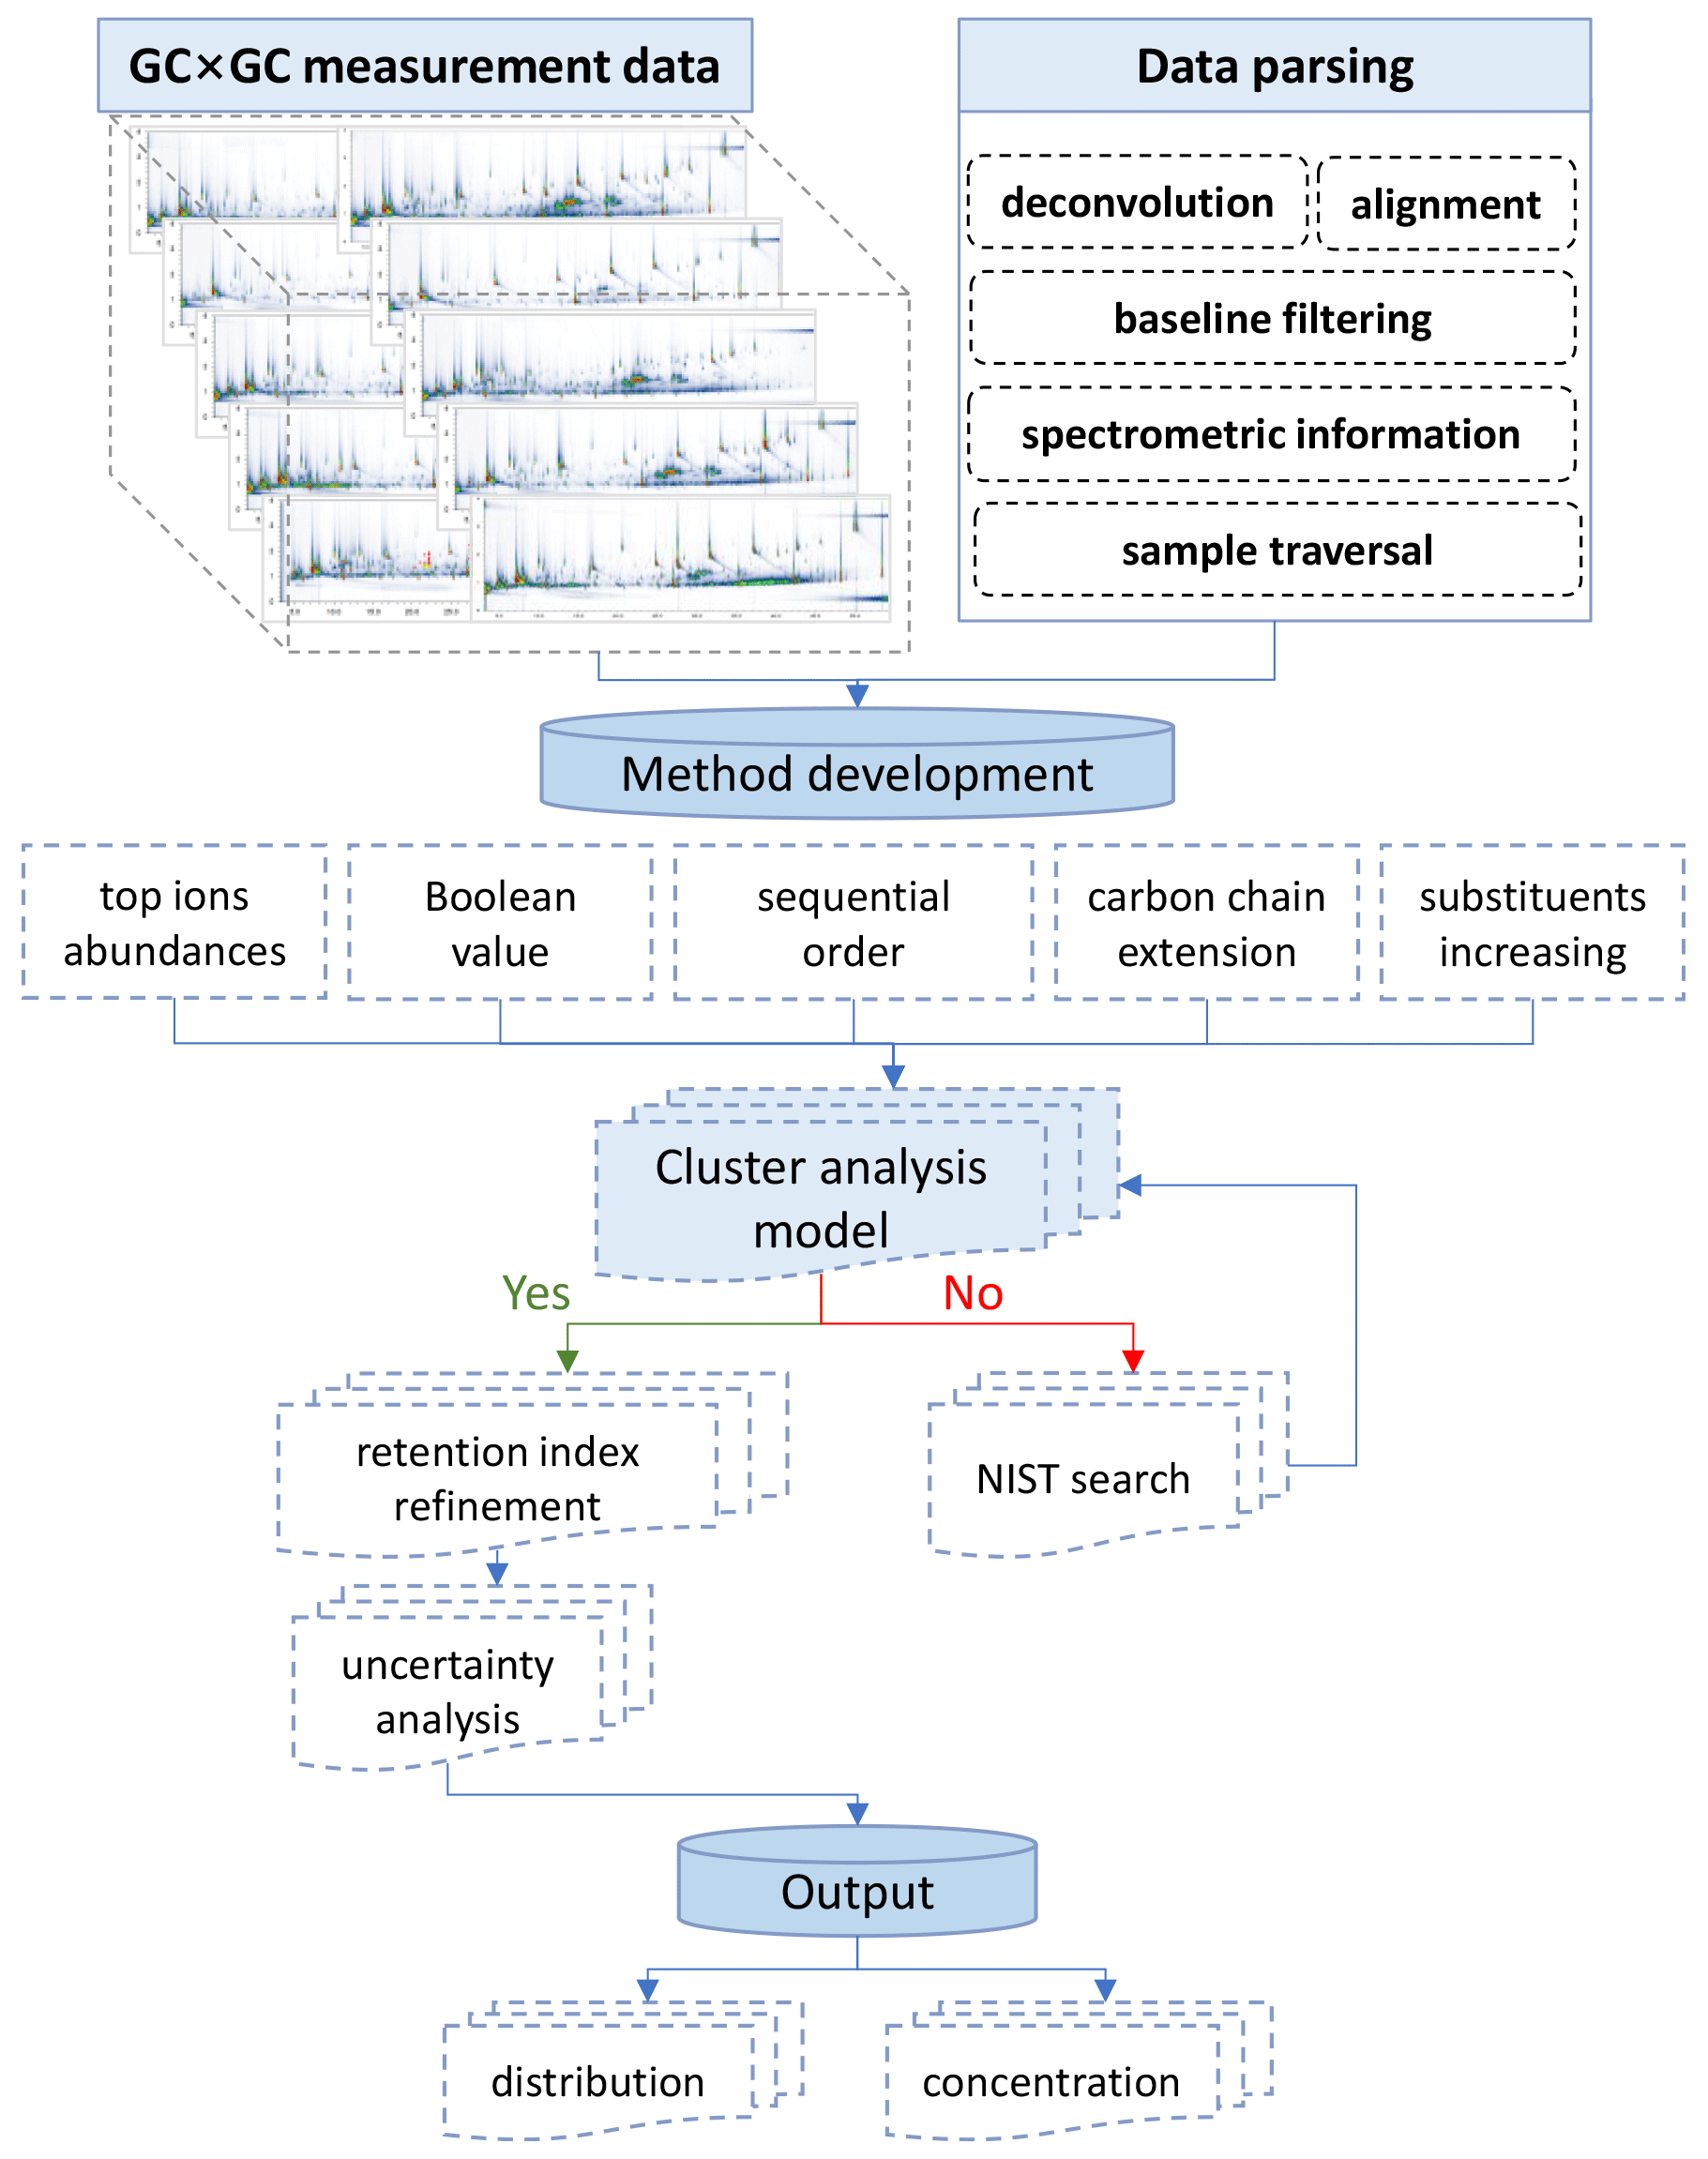
Figure 1Flow diagram illustrating the multistep data processing for establishing computational strategies for cluster analysis and quantification of organic vapors and aerosols using GC×GC–MS data.
Functional groups significantly affect the fragmentation patterns observed in mass spectrometry, and some ions are typical of given structures. Isotopic peaks (e.g., hydrogen and chlorine) provide additional information about the molecules (Du and Angeletti, 2006; Fernandez-de-Cossio et al., 2004). These pieces of information form the foundation for building up the model for cluster analysis, which is addressed in greater detail in the Supplement (Sect. S1). These indicative reaction schemes have been incorporated into the model development. Each critical step of model construction and validation is described thoroughly. The quantitative variables in the data alignment table, combining the chromatographic and MS information, are properly exploited and determine the overall speciation capacities.
Traditionally, compound identification relies on the electron ionization-based fragmentogram and the deconvoluted mass spectra. Empirically, one-by-one compound identification can be greatly intervened by neighboring peaks, especially those with similar structures, and can introduce considerable uncertainties. A good example is the assignment of homologous n-alkanes, of which the fragmentograms bear a close resemblance (Fig. S6 in the Supplement). In such cases, the similarity score (the measure of similarity between the observed mass spectrum and the NIST library hit) could be erroneously inflated to 850 (out of 999) or higher. In contrast, cluster analysis involves the comprehensive analysis of a specific type of compounds on a large scale, aiming to provide a holistic understanding of the distribution and transformation of the specific compound cluster being investigated.
Due to the complexity and remarkable peak capacities, sophisticated and detailed scripts for cluster identification were constructed. Heteroatom-containing species, e.g., amides and amines, were carefully examined. The scripts began by recognition of the common mass spectra features of compound cluster of interest and are addressed in more detail in the following descriptive framework:
-
the Boolean value of characteristic ions
-
the intensity sequence of abundant ions in the whole spectra
-
the retention time window restriction for certain compound groups
-
the pattern of mass spectrometry variation with the increased number of substituents or the extension of the carbon chain
-
an iteration framework that involved repetitive cycles among all the tested samples.
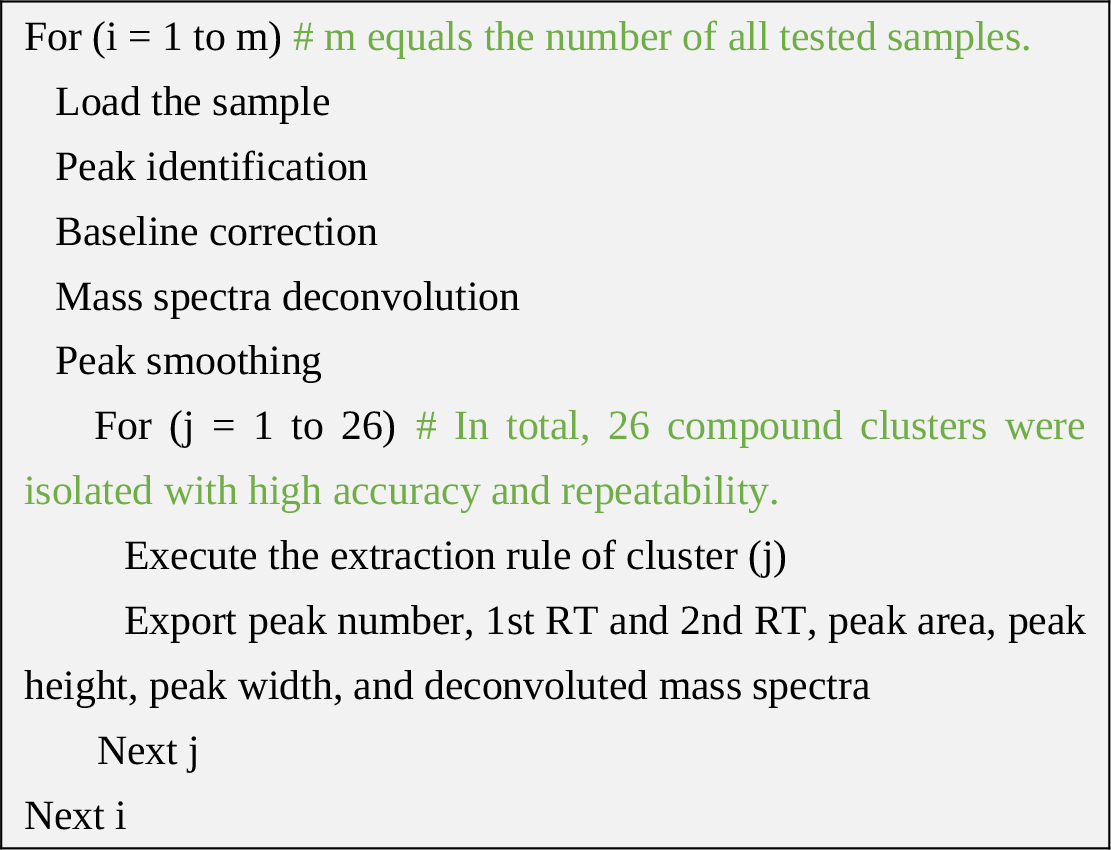
The scripts were then trained, iterated, and optimized incorporating real sample data, and the parameters were adjusted accordingly until a robust output was achieved. The extractor function built into the Canvas software was activated, and all the scripts were imported to facilitate automated cluster analysis. The scripts parsed all the files in the given directory into the required structure and generated three reports in the form of PDF, CSV, and BMP. The CSV file contained key information including the compound name, compound cluster, first and second RTs, and peak area (based on total ion current (TIC)).
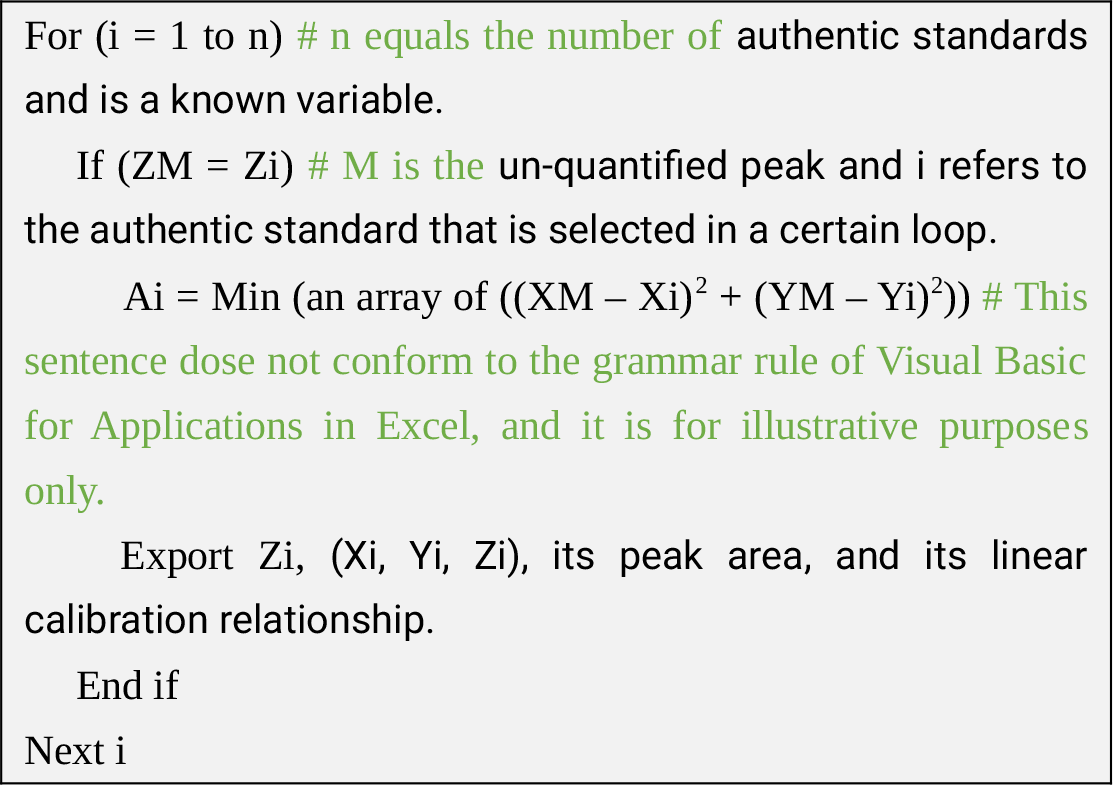
Once exported, the peaks were further processed for quantification/semi-quantification following the steps below. First, calibration curves were prepared by spiking different volumes of the standard solution mixture onto the blank TD tubes and blank filters, respectively. Peak area ratios, i.e., peak area of authentic standards over that of the internal standards, were used to build the linear relationship, with the merit of correcting system fluctuations. The selection of authentic standards prioritized their wide distribution across the entire chromatogram space, ranging from high to low volatility and weak to strong polarity, and meanwhile encompassing a broader range of functional groups and heteroatoms. The distribution and performance of all authentic standards are summarized in Table S4 in the Supplement and Fig. S7 in the Supplement. Second, for the unquantified peaks, their complied information (X, Y, Z), corresponding to first RT, second RT, and compound cluster, is looped through the list of all authentic standards in the following descriptive pseudo-codes until the optimal authentic standard to semi-quantify the target peak is exported. It should be emphasized that the unquantified peak and the corresponding authentic standard to semi-quantify it must belong to the same group due to their physicochemical similarities.
2.4 Quality assurance/control and uncertainty evaluation
It is common for thermal decomposition to occur in analytical methods involving heating processes, potentially leading to the erroneous detection of compounds that are either not present in real samples or present in low concentrations. Such artifacts need careful scrutiny, and the availability of authentic standards covering the GC×GC space range is essential for validation. Nevertheless, the possibility that some observed analytes are decomposition products cannot be entirely ruled out. Peaks of ISs were traced across all samples to monitor the variations across several modules, and the results are presented in Fig. S8 in the Supplement. Excellent stability was clearly observed, demonstrating the robustness of the testing system. Strong linear correlations were achieved for this set of authentic standards between the peak area ratio and the spiked mass, with Pearson's R ranging from 0.97 to 0.99.
3.1 Overall performance of the algorithm and compound identification
The optimization of component identification remains challenging, and this work involves converting known chemical compounds into molecular descriptors and utilizing cluster analysis to predict the relationship between these descriptors and structural information. After continuous trials to improve reliability and data processing speed, a final solution of 26 compound clusters stands out with high accuracy and repeatability:
-
aliphatic hydrocarbons, including n-/i-alkanes and alkenes;
-
cycloalkanes;
-
alkyl-substituted benzenes, including C1–C6 alkyl-substituted benzenes;
-
adamantanes;
-
hopanes;
-
2–5-ring PAHs;
-
acids;
-
aliphatic alcohols;
-
aliphatic aldehydes and ketones;
-
oxy-PAHs;
-
phthalates;
-
phenols and alkyl-substituted phenols;
-
phenol ethers;
-
amides;
-
amines;
-
pyridines;
-
nitro compounds, including organic nitrates and organic nitrites.
Validation of the model output using field diesel samples has been conducted and has shown high estimation accuracy and integrity. Generally, over 82 % of the peaks have been successfully classified and assigned to the corresponding compound groups, and their distribution in an example GC×GC plot is shown in Fig. 2. To confirm the tentatively identified heteroatom groups, their raw chromatogram, mass spectra, and chemical structures of representative species are displayed in Figs. S10–S16 in the Supplement. Less than 18 % of the chromatographic peaks were identified as unresolved components. Aliphatic hydrocarbons were generally located in the lowest positions in the GC×GC space, except for column bleedings (Figs. 2a–c and S9 in the Supplement), and their second RT drifted less than 1 s from the far-left to the far-right side. Nitrogen-containing compounds in oxidized and reduced valences, including amides, amines, pyridines, and nitro compounds, were resolved simultaneously under respective filtering rules and occupied slightly higher positions in the GC×GC space (Fig. 2f). Amines and pyridines, being more volatile, eluted at early stages, whereas nitro compounds and amides eluted at middle and late stages sequentially. Due to their high volatility, C2–C6 alkyl-substituted benzenes also appeared at the beginning of the GC×GC space and predominantly partitioned into the gas phase. Their second RTs were comparable to those of pyridines and amides, with a negligible drift in second RT. Aliphatic oxygen-containing compounds, including acids, alcohols, and ketones, were found to be in the middle region and covered a wide volatility range. There, aliphatic oxygen-containing compounds affect the acidity of the atmosphere, participate in aqueous phase reactions, and contribute significantly to the formation of SOA (Cope et al., 2021; Xu et al., 2022). Phenols with one or more hydroxyl groups attached to an aromatic benzene ring were observed in the middle of the GC×GC space. Oxy-PAHs and PAHs were present in the upper middle of the GC×GC space, with their volatility range extending towards the low volatility end. A clear trend tilting towards the upper-right corner was observed, suggesting that aromaticity plays a significant role in the retention in the secondary dimension.
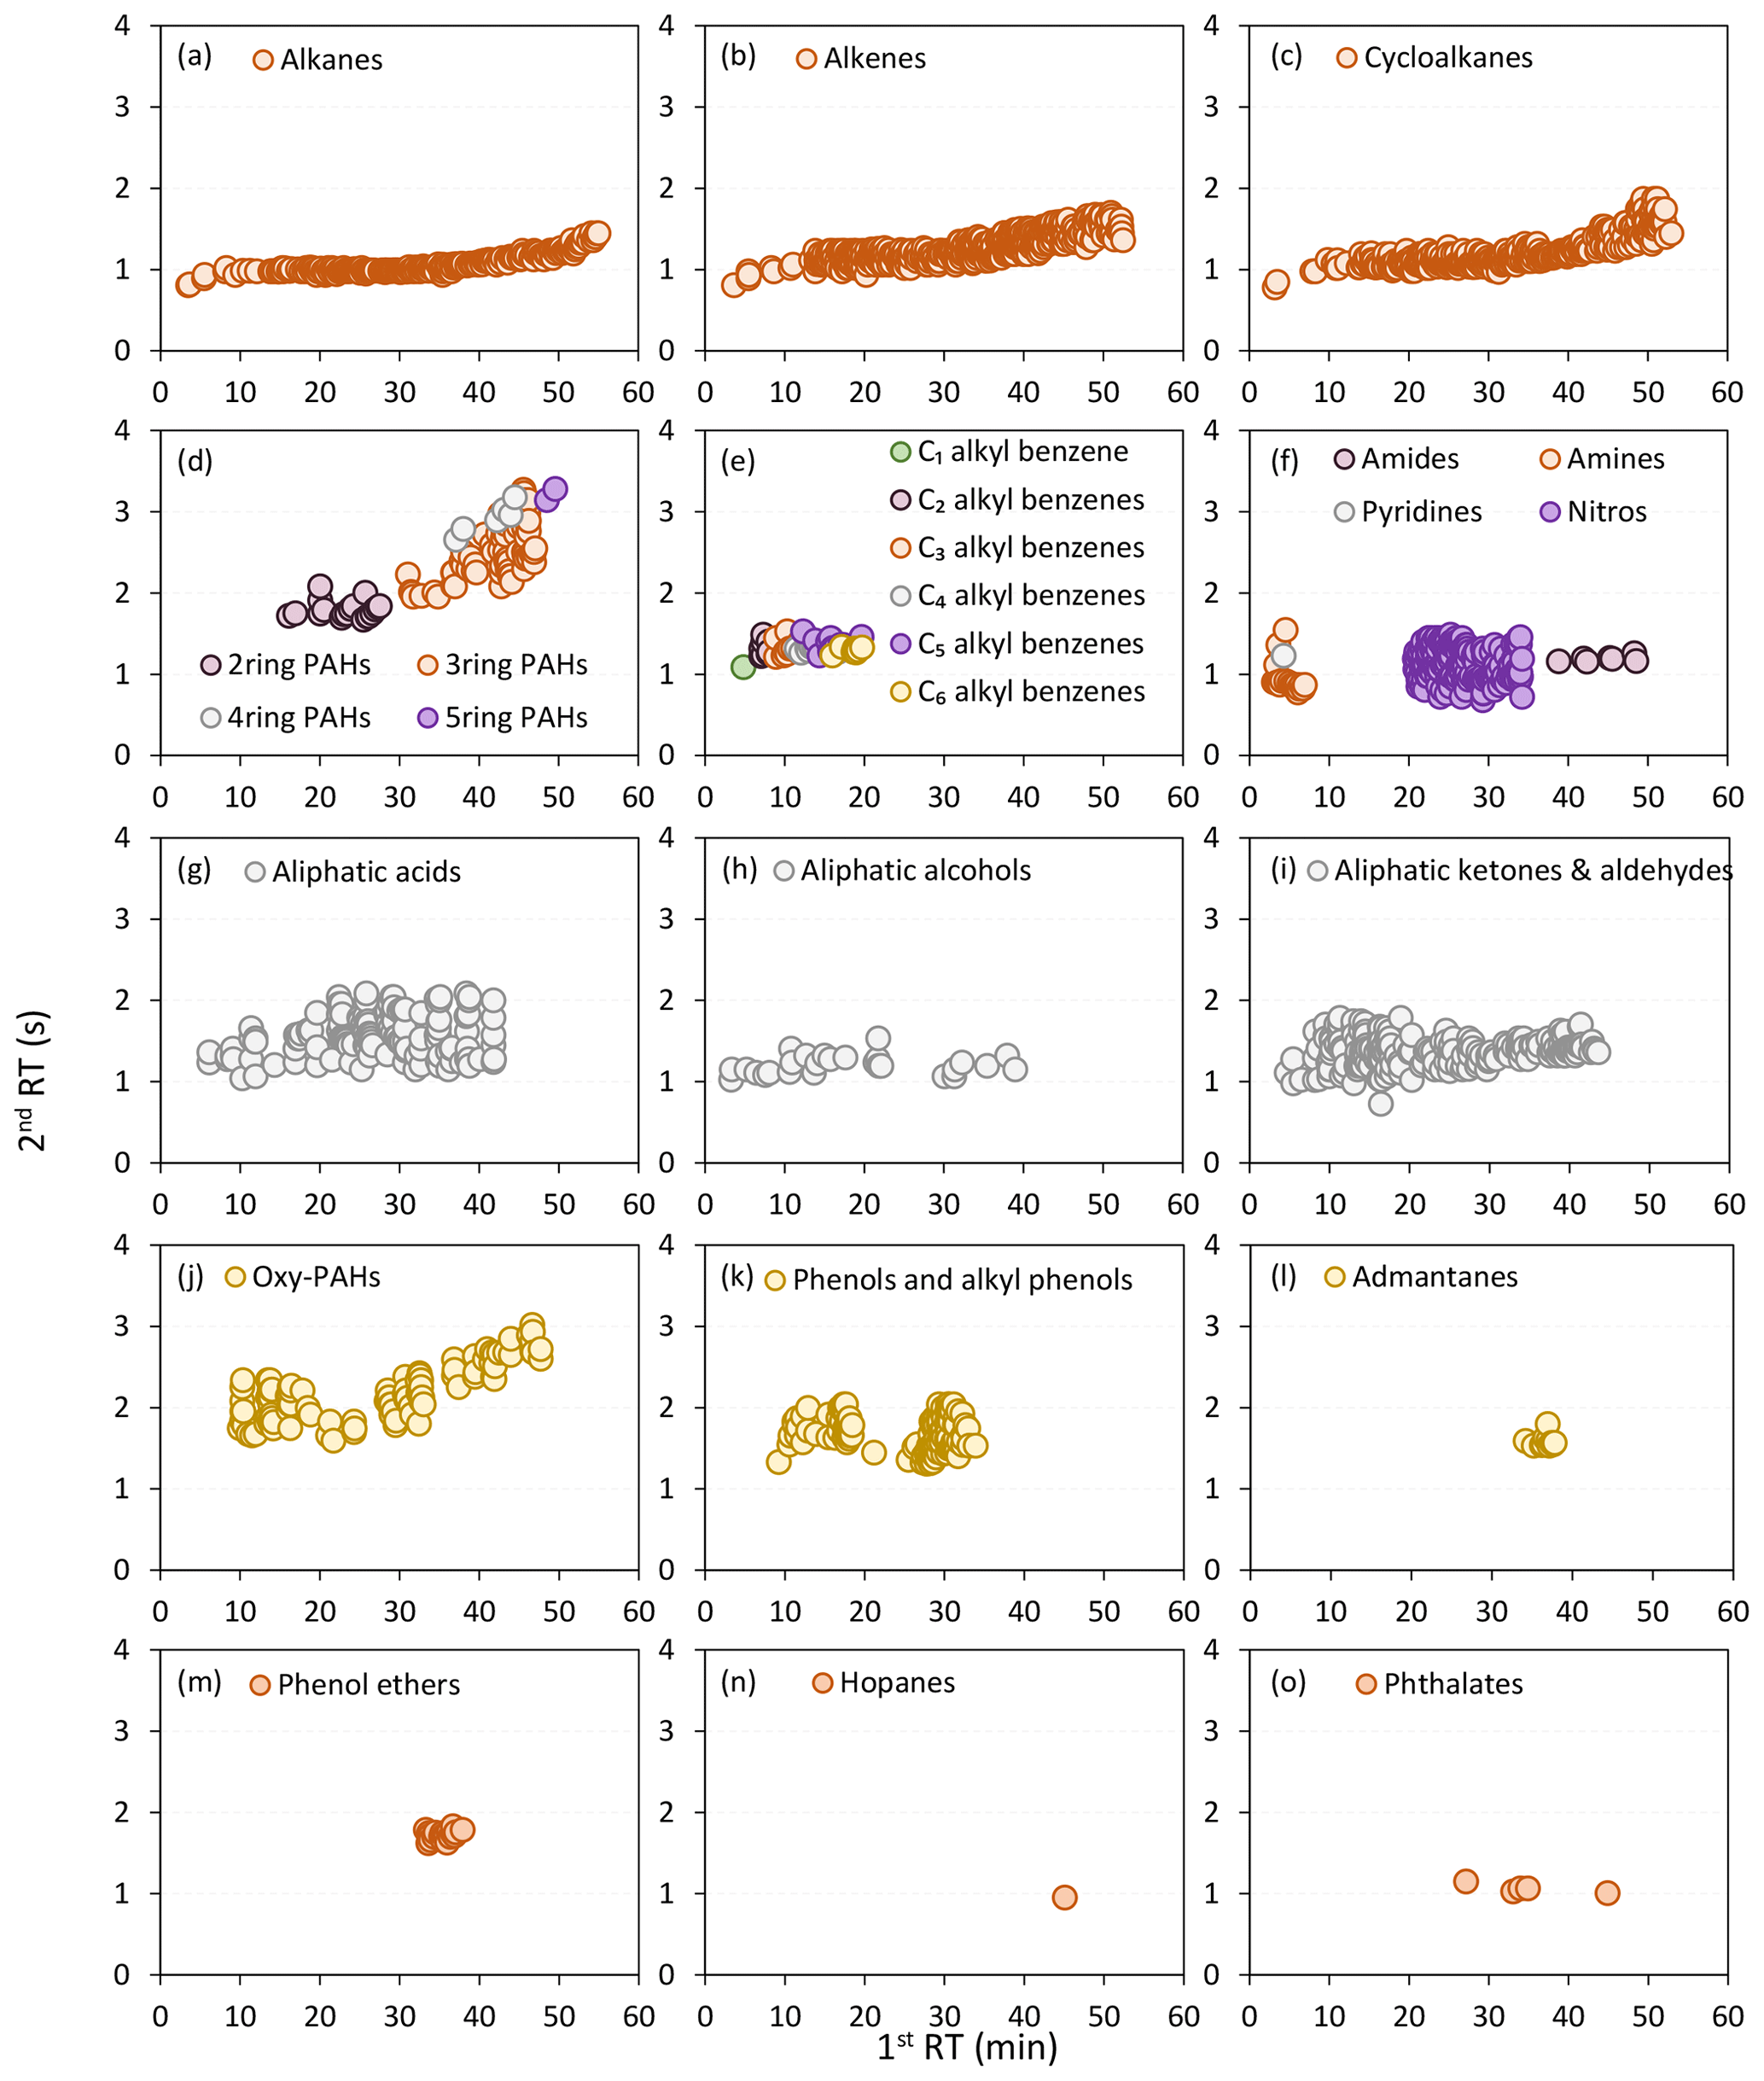
Figure 2The distribution of the 26 compound groups in an example GC×GC plot. For clear visualization, different compound groups are displayed separately, except for 2–5-ring PAHs, C2–C6 alkyl-substituted benzenes, and nitrogen-containing species. Nitro compounds include organic nitrates and organic nitrites, due to the co-existence of the characteristic ions at 30 (NO+) and 46 ().
3.2 Estimation of the uncertainty associated with the (semi-)quantification
We conducted a systematic evaluation of the model output, and the results are shown in Figs. 3 and 4. To address this issue comprehensively and accurately, we selected three types of standards including C7–C37 n-alkanes, C2–C6 alkyl-substituted benzenes, and 2–4-ring PAHs, representing a full range of polarities and functionalities. The quantification deviation was computed according to the principles of the model. Chromatographic peaks were quantified either by their authentic standards or the surrogates within the same compound category after being classified into 1 of the 26 compound classes. For example, if the mass spectrum of a chromatographic peak resembled the pattern of the compound class of alkanes, it would be assigned to the alkane group and quantified by its authentic standard if available or by the n-alkane (n-alkane serving as the semi-quantification surrogate in this case) that was closest to it spatially. Similarly, if the mass spectrum of a chromatographic peak followed the pattern of Cx alkyl-substituted benzenes, it would be assigned to the Cx alkyl-substituted benzene group and quantified by its authentic standard if available or by the alkyl-substituted benzene (with alkyl-substituted benzenes serving as the semi-quantification surrogate) that was closest to it spatially. In light of this explanation, the deviation of the slopes of the calibration curves of any pair of adjacent authentic standards within the same compound category was computed to represent the ceiling of the semi-quantification uncertainty. Uncertainties are calculated using Eq. (1):
where Sp and Ss are the slopes of the previous and subsequent compounds, respectively.
The slopes increased rapidly from 3.13 (C7 n-alkane) to 8.21 (C9 n-alkane), fluctuated slightly from 8.85 to 11.8 in the range of C9 to C27 n-alkanes, and decreased gradually after C28 n-alkane to the end of C37 n-alkane. Throughout the volatility range of C9–C37 n-alkanes, uncertainties were less than 37.67 %, except for one interval between C8 and C9 n-alkanes, where the quantification deviation reached 142 %. A similar trend was observed for PAHs, with uncertainties less than 22.54 %, except for the first and last intervals, where the quantification deviations were 55.44 % and 81.59 %, respectively, as shown in Fig. 3. Stable responses of C2–C6 alkyl-substituted benzenes were monitored, and the uncertainties were less than 12.74 %. In other words, for any given peak, it would be quantified or semi-quantified by one authentic standard, and the upper limit of quantification uncertainty, originating from any pair of adjacent authentic standards, was as discussed earlier.
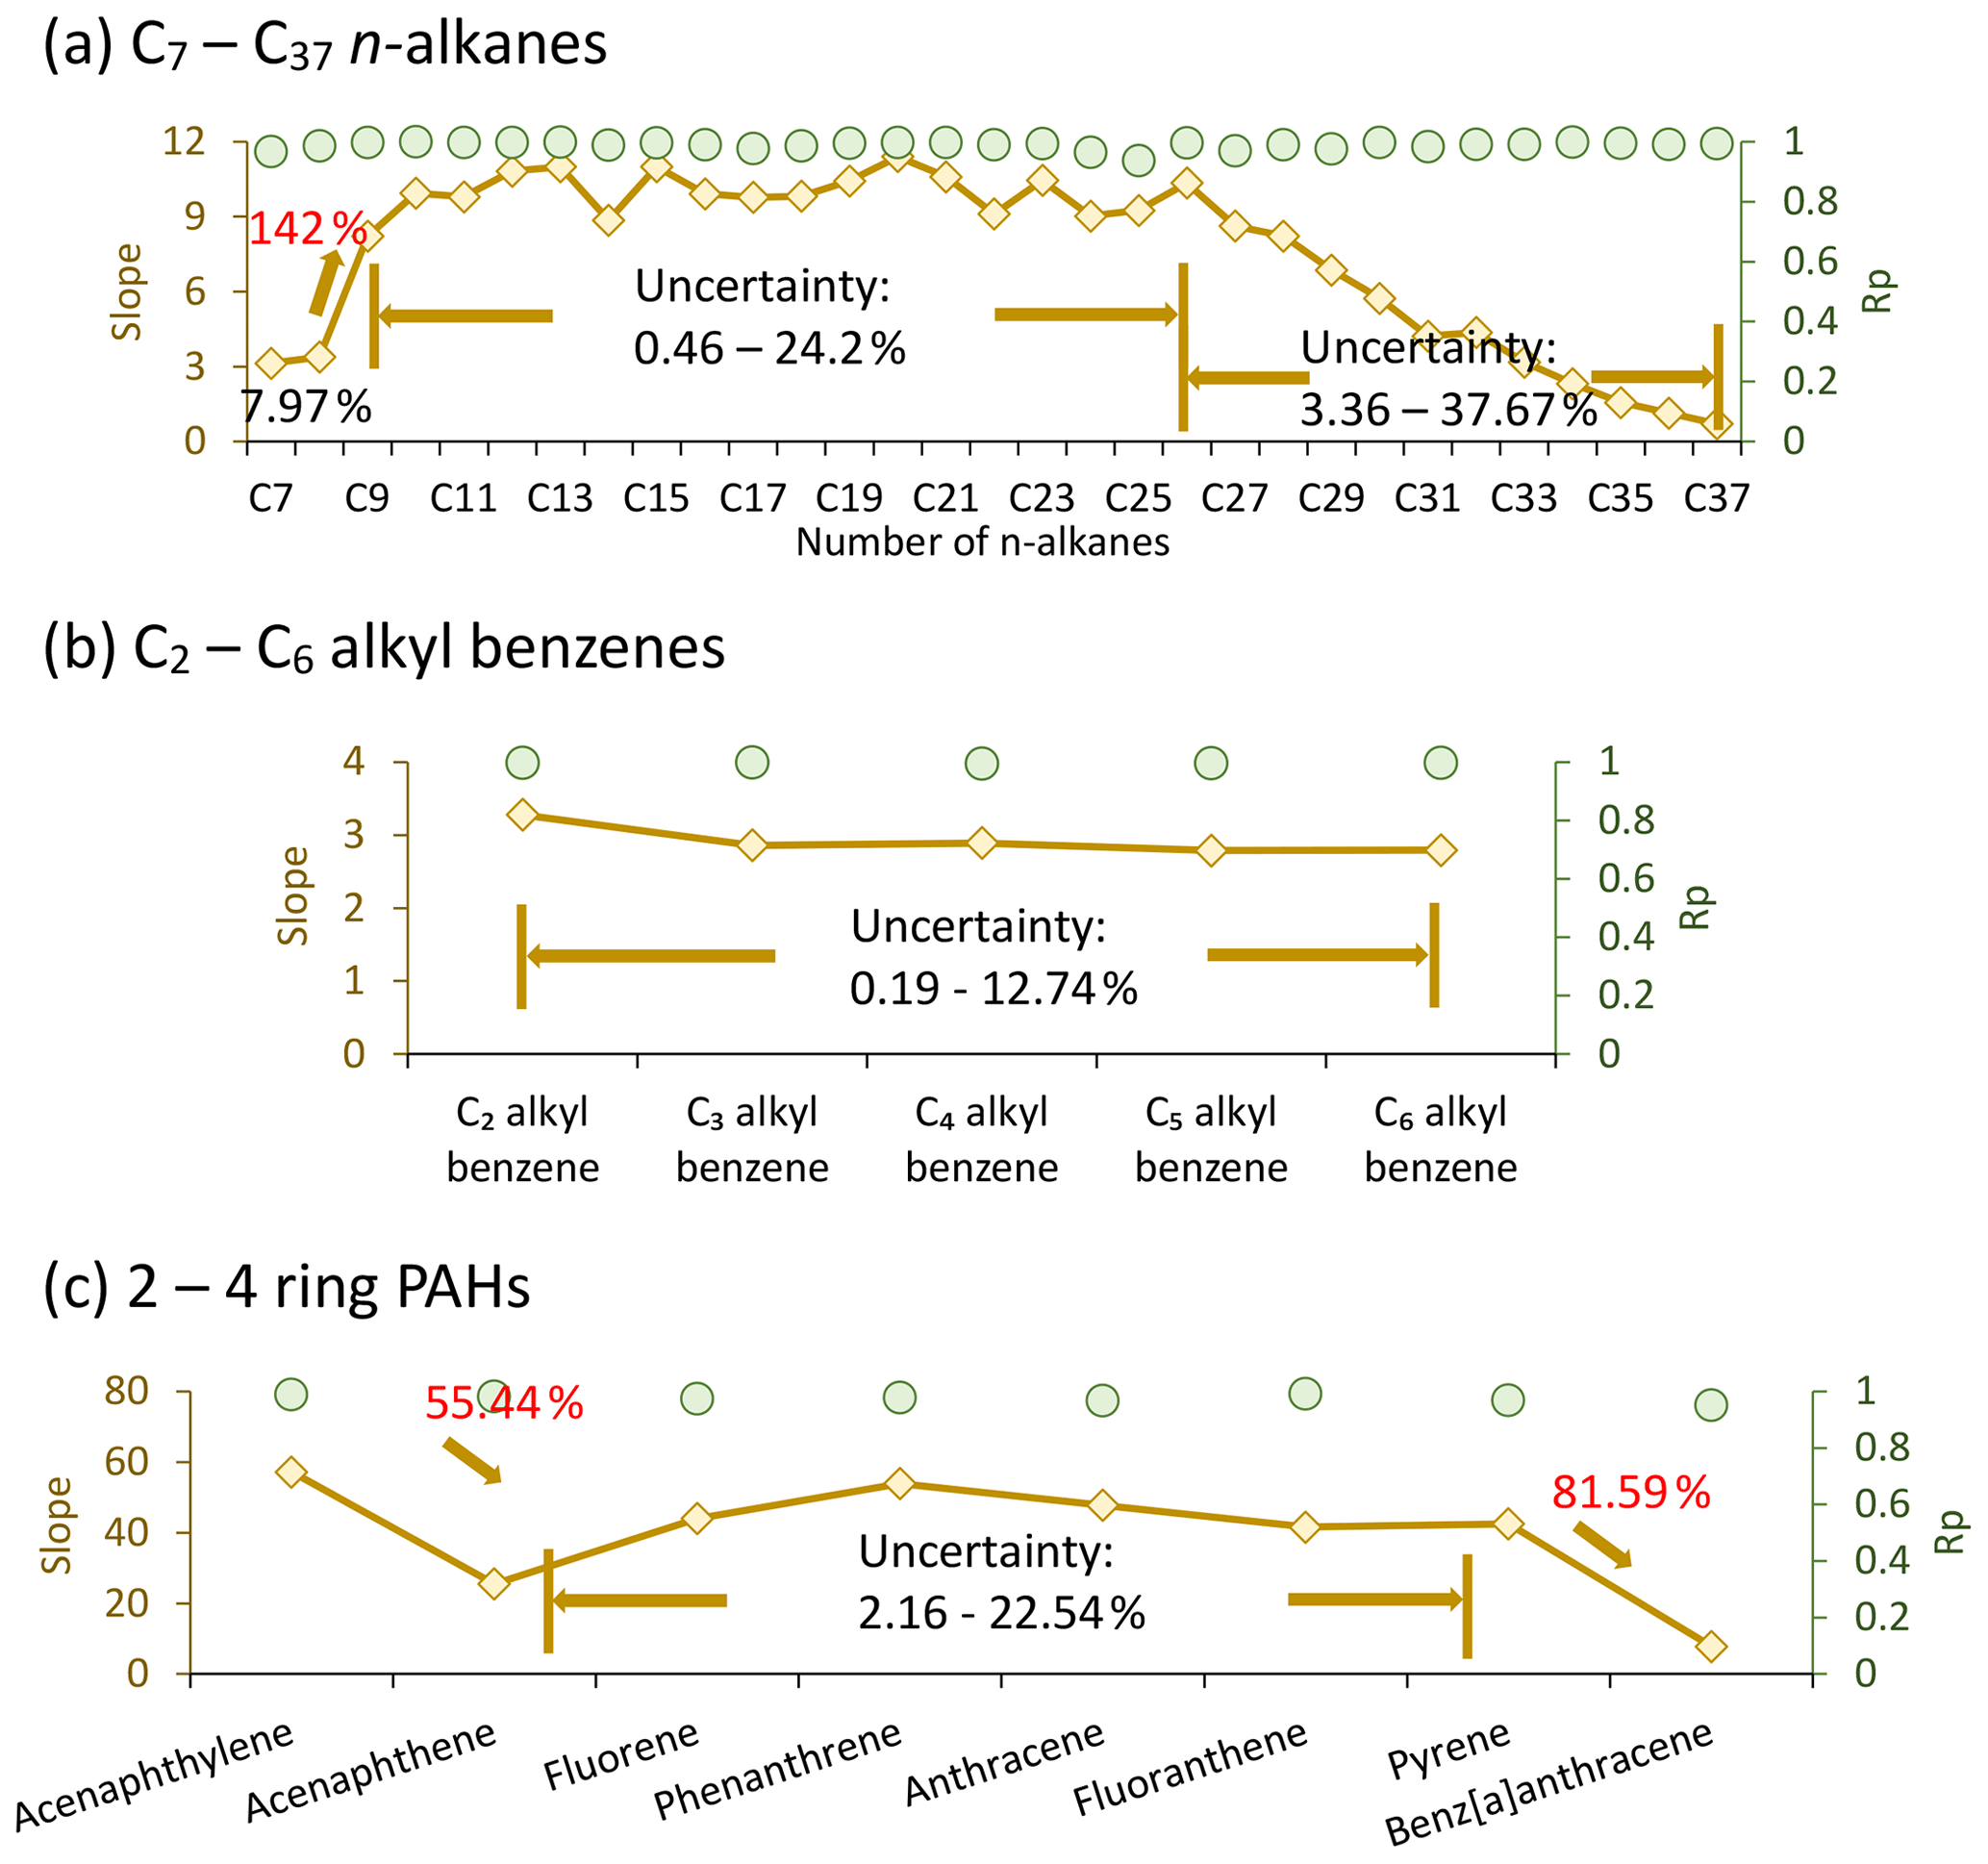
Figure 3Slope and Pearson correlation variation of (a) C7–C37 n-alkanes, (b) C2–C6 alkyl-substituted benzenes, and (c) 2–4-ring PAHs. Brown diamonds represent slopes of different species and reference the left axis. Green circles denote the Pearson correlation of individual species and reference the right axis. Pearson correlation values for n-alkanes, C2–C6 alkyl-substituted benzenes, and 2–4-ring PAHs range from 0.936 to 0.999, 0.994 to 0.998, and 0.952 to 0.992, respectively. Uncertainties are computed using the equation provided in the main text.
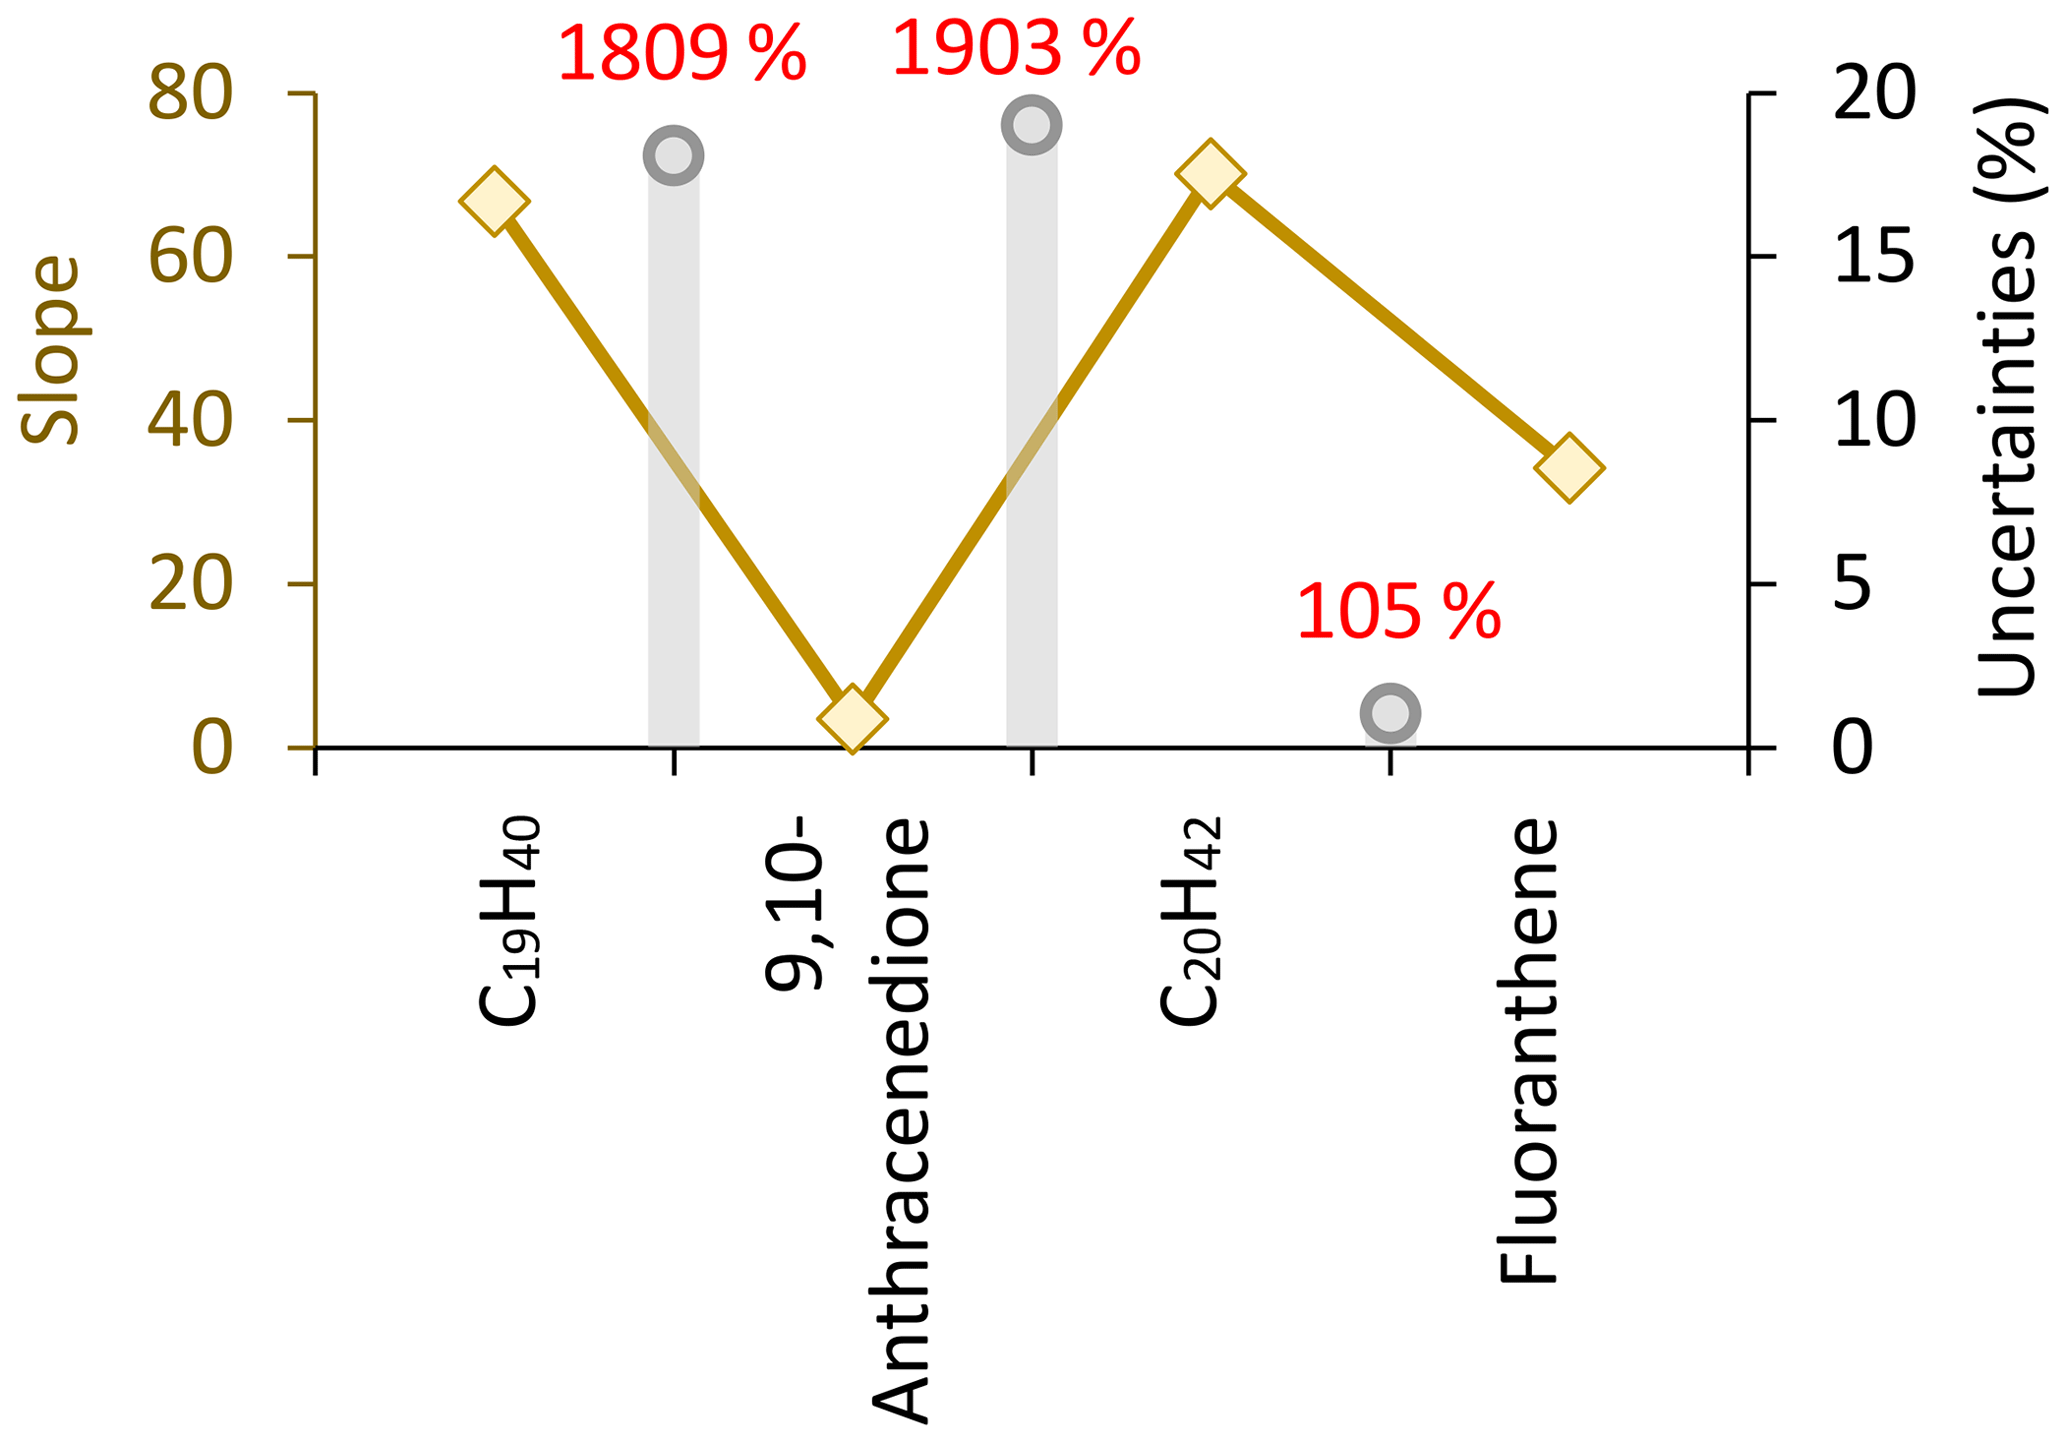
Figure 4Slope and uncertainty estimation for example compounds with close first RTs and different second RTs: C19H40 (first RT=34.6 min, second RT=1.03 s), 9,10-anthracenedione (first RT=36.07 min, second RT=3.85 s), C20H42 (first RT=36.54 min, second RT=1.07 s), and fluoranthene (first RT=37.00 min, second RT=3.04 s). Brown diamonds represent the slopes of different species and reference the left axis. Gray bars denote the uncertainty estimation for these compounds and reference the right axis.
It is reasonable that the uncertainty ranges of alkyl-substituted benzenes were less than those of n-alkanes and PAHs, given that alkyl-substituted benzenes eluted early in the front half, whereas alkanes and PAHs covered the entire volatility range. These trends illustrated that the responses of GC×GC to the analysts were sensitive to the volatility distribution, with accurate quantification being more reliable in the middle region. This also highlighted the utility of introducing more authentic standards and the benefits of enriching compound categories. It can be speculated that the quantification uncertainty would be further reduced with the addition of more standard compounds.
Furthermore, we explored the uncertainty estimation of dividing the whole chromatogram into bins based on retention time, and all the species in the same bin were quantified, referring to the mass-to-signal responses of the Cn n-alkanes (Zhao et al., 2015, 2014). This approach corrected the signal variation of hydrocarbons in the GC–MS and was widely adopted for quantifying unresolved complex mixtures (UCMs) (Shen et al., 2023; Zhao et al., 2022). We chose four types of standards belonging to different compound categories with similar first RTs and different second RTs, including C19H40 (first RT=34.6 min, second RT=1.03 s), 9,10-anthracenedione (first RT=36.07 min, second RT=3.85 s), C19H40 (first RT=36.54 min, second RT=1.07 s), and fluoranthene (first RT=37.00 min, second RT=3.04 s), and assessed the deviation of slopes between each pair of the standards. Results shown in Fig. 4 indicate that the deviation between the three pairs of standards was 1809 % (C19 n-alkane vs. 9,10-anthracenedione), 1903 % (9,10-anthracenedione vs. C20 n-alkane), and 105 % (C20 n-alkane vs. fluoranthene), respectively. Quantitative errors in measuring unidentified chromatographic peaks using n-alkane responses could reach 3 orders of magnitude, especially for oxygen-containing species. Errors in quantifying aromatic components, e.g., PAHs, also exceeded 100 % in some cases.
3.3 Cluster analysis in organic vapor and aerosol samples
The model was applied to organic vapor samples from HDDV tailpipe emissions (referred to as HDDV vapors), aerosol samples from HDDV tailpipe emissions (referred to as HDDV aerosols), and atmospheric aerosol samples (referred to as ambient aerosols) for cluster analysis. The results are shown in Fig. S17 in the Supplement, which displays the distribution of the top few species with a contribution fraction exceeding 5 %, and in Fig. 5, which shows the mass stacking. Overall, the identified chromatographic peaks accounted for 85 %, 82 %, and 99 % for HDDV vapors, HDDV aerosols, and ambient aerosol samples, respectively. The unidentified peaks were less than 20 % and are addressed in greater detail in the Supplement (Sect. S2).
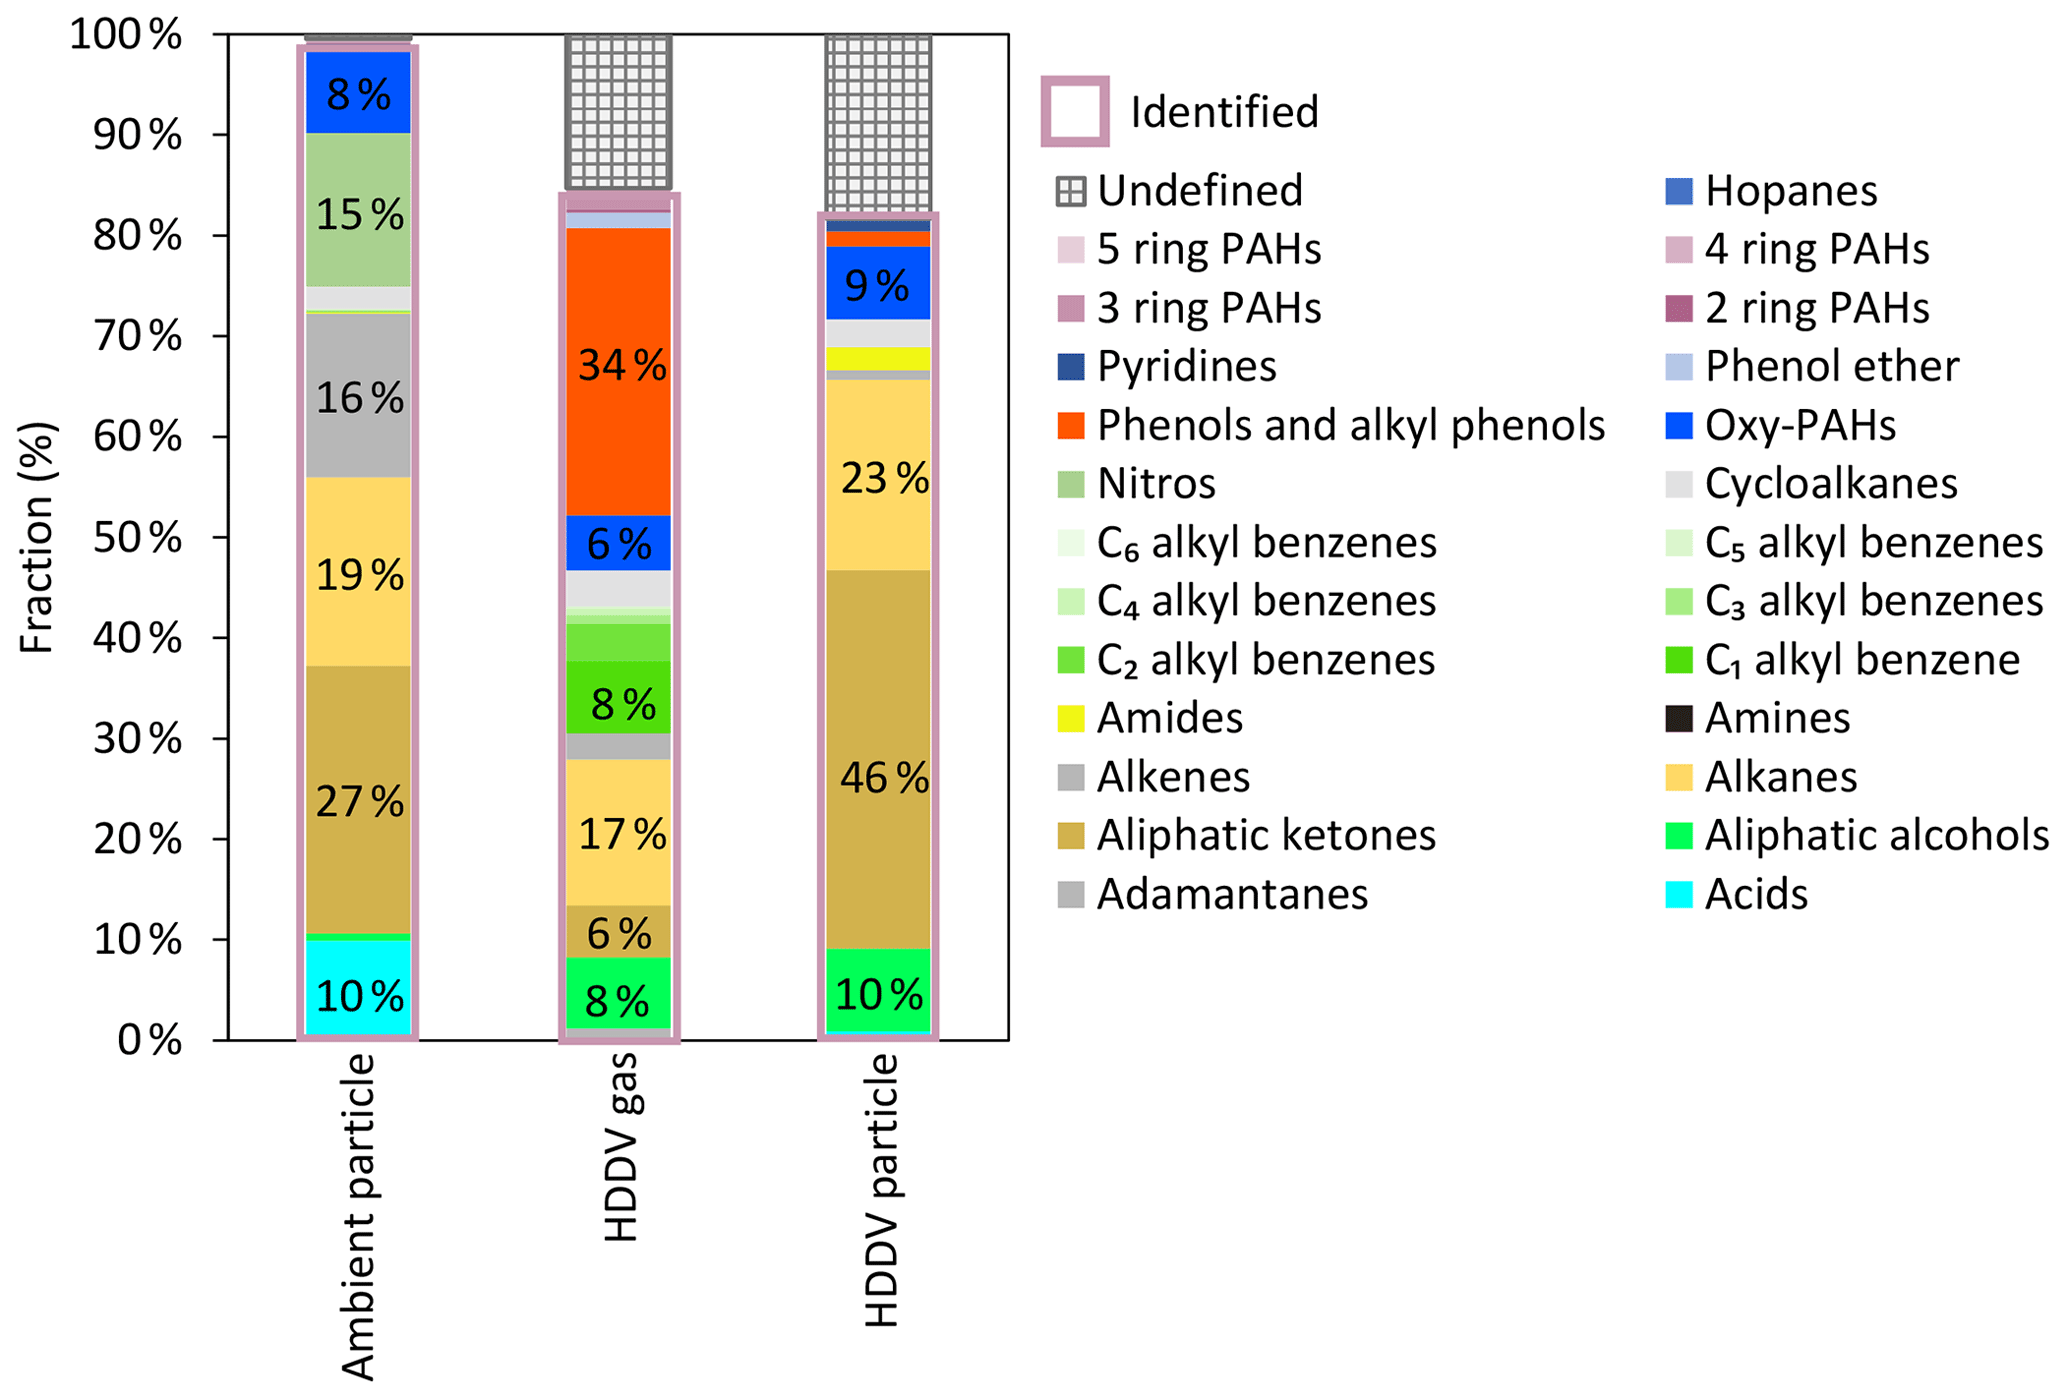
Figure 5Fractional distributions of different compound clusters in ambient aerosol samples, HDDV tailpipe vapors, and HDDV tailpipe aerosols. Numbers labeled on each column represent the fractions of the top few groups in different samples. Identified clusters are outlined in light purple.
Distinct cluster distribution features can be extracted. For ambient aerosol samples, aliphatic ketones were the most abundant cluster, contributing 27 % of all the peak signals, followed by alkanes and alkenes. A notable fraction of 15.2 % of nitro compounds was observed exclusively in ambient samples, indicating significant secondary nitrate formation processes under atmospheric conditions. Aliphatic acids and oxy-PAHs were also detected at high levels, with the top six groups accounting for over 95 % of the total classified peak signals. Minor but non-negligible fractions included cycloalkane, aliphatic alcohols, and phenols and alkyl-substituted phenols.
Similarly, aliphatic ketones ranked first for HDDV aerosol samples, with mass intensity reaching 46 % of the total signals, followed by alkanes. Aliphatic alcohols and oxy-PAHs were also detected at high levels, and the top four groups accounted for over 88 % of the total classified peak signals. Cycloalkanes, amides, phenols and alkyl-substituted phenols, and alkenes were compound clusters with lower abundance, ranging from 1 % to 4 %.
For HDDV vapors, the most abundant group was phenols and alkyl-substituted phenols, constituting 34 % of the total peak signals. Compared with previous results, where the most abundant group was reported to be alkanes (Wang et al., 2022; Alam et al., 2019), the adoption of the innovative model contributed to resolving the oxygenated fractions and reduced inaccuracies in SOA simulation due to the lack of species information. The compound cluster is confirmed by (1) the retention time window, including first RT and second RT, and (2) the mass spectra. Detailed information is displayed in Fig. S16. The second RTs of the identified phenols and alkyl-substituted phenols range from 1.45 to 1.78 s, well above the hydrocarbon regions, where the second RTs fall within the range of approximately 1.0 to 1.15 s. Their mass spectra also feature the typical phenol ions at , 107, 121, 135, 149, and 191. Alkanes ranked as the second top species, followed by C1 alkyl-substituted benzene. C1–C6 alkyl-substituted benzenes were negligible in both ambient and HDDV aerosol samples but were present in notable abundance in HDDV vapor samples. This distribution aligned with their placement in the GC×GC plot, indicating they were relatively volatile species and partitioned predominantly into the gas phase. Oxy-PAHs and aliphatic ketones contributed 6 % of the total identified peak intensities, followed by minor fractions, including C2 alkyl-substituted benzene, cycloalkanes, and alkenes.
The model output illustrates the overall distribution of compound clusters in various gas and aerosol samples, providing comparative insights. Carboxylic acids indicated a higher oxidation state than other compound clusters and were exclusively observed at a notable level in ambient samples compared with “freshly emitted” source samples. The oxidation state of dominant compounds in HDDV samples was comparatively low. For example, a significant ketone fraction was observed in HDDV samples, with the majority partitioning into the aerosol phase due to the long carbon chain skeleton and thus low volatility. Phenols and alkyl-substituted phenols were the leading species in HDDV gas samples. He et al. (2022a) reported that the oxygenated I/SVOCs accounted for over 20 % of the total I/SVOC mass in HDDV tailpipe emissions (He et al., 2022a). With the refinement and improvement of model performance, e.g., further splitting mixed mixtures, the oxygenated fraction was elevated to over 50 %.
This study highlighted the systematic presence and distribution of nitrogen-containing compounds in both oxidized valences (including nitro compounds) and reduced valences (including amides, amines, and pyridines). Among them, amines and amides were key precursors for new particle formation processes in a polluted atmosphere (Saeki et al., 2022; Cai et al., 2021), and pyridines, with the nitrogen atom in the aromatic ring, were readily dissolved in water, participating in the global nitrogen cycle in ecosystems (Kosyakov et al., 2020). Nitro compounds, which include a wide range of organic compounds with NO or NO2 substituents, served as critical tracers for secondary nitrate formation processes. Amines and pyridines were volatile species occupying the early section of the GC×GC space, while nitro compounds and amides were distributed in the middle and rear space. Individual nitrogen-containing species were present at trace levels under atmospheric conditions and were difficult to detect. Moreover, authentic standards or high-resolution mass spectrometry were required to identify and quantify each compound (Zhang et al., 2018). With the establishment of an algorithmic solution, we were able to conduct a comprehensive scan of nitrogen-containing compound clusters.
In addition to common features, specific compounds were identified in separate samples and could potentially serve as markers or tracers for primary emissions. Adamantane and its derivatives, with the fusion of three cyclohexane rings (chemical structure and mass spectrum shown in Fig. S18a in the Supplement), are natural products in petroleum (Stout and Douglas, 2004). They were volatile and had previously been isolated using GC×GC-ToF-MS in crude oil (Wang et al., 2013). Adamantanes were observed in HDDV vapor samples, contributing 1.4 % to the identified peaks. Hopane (chemical structure and mass spectrum shown in Fig. S18b) is also a natural product in petroleum and bitumen and serves as an important marker for vehicle emissions due to its persistency and stability (He et al., 2022b; Wong et al., 2021). Hopane was reported to survive heat treatment up to 460 °C and was exclusively detected in HDDV aerosol samples, with an intensity fraction of 0.3 % (Wu and Geng, 2016).
We presented an innovative method for optimizing the separation and identification of organic vapors and aerosols, focusing on establishing molecular descriptors and cluster analysis algorithms. The model outputs were validated using field samples with high accuracy and integrity. Less than 20 % of the peaks were unresolved components. The retention patterns of various compound groups and their distribution in the GC×GC plot were resolved, and the influence of functional groups on fragmentation was thoroughly addressed. We also provided a comprehensive analysis of the quantification uncertainties of this new approach and highlighted the significant quantitative errors when using n-alkanes as semi-quantification surrogates. This model was applied to various types of field samples, and the results revealed distinctive distribution patterns of compound clusters and contribution fractions, providing valuable insights into the compositions of organic vapors and aerosols and offering potential markers for specific emission sources.
Compound speciation in atmospheric chemistry continues to be a dynamic and challenging field. Speciated compounds enable models to consider the diversity of organic species and dynamic chemical transformations in the atmosphere, contributing to more accurate SOA simulation results. This approach also allows for a more refined description of the dispersion of pollutants, thereby assisting in the development of localized air quality management strategies as we strive for a more accurate and comprehensive understanding of atmospheric chemistry.
The measurement data and codes used in this study are available on request.
The supplement related to this article is available online at: https://doi.org/10.5194/acp-24-10655-2024-supplement.
XH: conceptualization, formal analysis, model development, data validation, writing – original draft, funding acquisition; XZ: writing – reviewing and editing, project administration, supervision, funding acquisition; SG: experiment; LZ, TC, BY, and SX: experiment; QW, ZL, YY, SZ, and YW: data validation, writing – reviewing and editing.
The contact author has declared that none of the authors has any competing interests.
Publisher's note: Copernicus Publications remains neutral with regard to jurisdictional claims made in the text, published maps, institutional affiliations, or any other geographical representation in this paper. While Copernicus Publications makes every effort to include appropriate place names, the final responsibility lies with the authors.
The authors acknowledge the financial support of the National Natural Science Foundation of China (grant nos. 42105100, 51978404, and 42261160645), the Scientific Research Fund at Shenzhen University (grant nos. 868-000001032089 and 827-000907), the Shenzhen Outstanding Science and Technology Innovation Program (grant no. RCBS20231211090534051), and the Macao Science and Technology Development Fund (grant no. 0023/2022/AFJ).
This paper was edited by Ivan Kourtchev and reviewed by Yutong Liang and one anonymous referee.
Alam, M. S., West, C. E., Scarlett, A. G., Rowland, S. J., and Harrison, R. M.: Application of 2D-GCMS reveals many industrial chemicals in airborne particulate matter, Atmos. Environ., 65, 101–111, 2013.
Alam, M. S., Zeraati-Rezaei, S., Xu, H. M., and Harrison, R. M.: Characterization of Gas and Particulate Phase Organic Emissions (C9-C37) from a Diesel Engine and the Effect of Abatement Devices, Environ. Sci. Technol., 53, 11345–11352, 2019.
Bendik, J., Kalia, R., Sukumaran, J., Richardot, W. H., Hoh, E., and Kelley, S. T.: Automated high confidence compound identification of electron ionization mass spectra for nontargeted analysis, J. Chromatogr. A, 1660, 462656, https://www.ncbi.nlm.nih.gov/pubmed/34798444 (last access: 20 September 2024), 2021.
Cai, R. L., Yan, C., Worsnop, D. R., Bianchi, F., Kerminen, V. M., Liu, Y. C., Wang, L., Zheng, J., Kulmala, M., and Jiang, J. K.: An indicator for sulfuric acid-amine nucleation in atmospheric environments, Aerosol Sci. Tech., 55, 1059–1069, 2021.
Chang, Y. H., Cheng, K., Kuang, Y. Q., Hu, Q. Y., Gao, Y. Q., Huang, R. J., Huang, C., Walters, W. W., and Lehmann, M. F.: Isotopic Variability of Ammonia (δ15N-NH3) Slipped from Heavy-Duty Vehicles under Real-World Conditions, Environ. Sci. Tech. Let., 9, 726–732, 2022.
Cheng, S. F., Zhao, Y. B., Zhang, B. B., Peng, P., and Lu, F.: Structural decomposition of heavy-duty diesel truck emission contribution based on trajectory mining, J. Clean. Prod., 380, 135172, https://doi.org/10.1016/j.jclepro.2022.135172, 2022.
Cope, J. D., Abellar, K. A., Bates, K. H., Fu, X., and Nguyen, T. B.: Aqueous Photochemistry of 2-Methyltetrol and Erythritol as Sources of Formic Acid and Acetic Acid in the Atmosphere, ACS Earth and Space Chemistry, 5, 1265–1277, https://doi.org/10.1021/acsearthspacechem.1c00107, 2021.
Du, P. and Angeletti, R. H.: Automatic deconvolution of isotope-resolved mass spectra using variable selection and quantized peptide mass distribution, Anal. Chem., 78, 3385–3392, 2006.
Fernandez-de-Cossio, J., Gonzalez, L. J., Satomi, Y., Betancourt, L., Ramos, Y., Huerta, V., Besada, V., Padron, G., Minamino, N., and Takao, T.: Automated interpretation of mass spectra of complex mixtures by matching of isotope peak distributions, Rapid Commun. Mass Sp., 18, 2465–2472, 2004.
Franklin, E. B., Amiri, S., Crocker, D., Morris, C., Mayer, K., Sauer, J. S., Weber, R. J., Lee, C., Malfatti, F., Cappa, C. D., Bertram, T. H., Prather, K. A., and Goldstein, A. H.: Anthropogenic and Biogenic Contributions to the Organic Composition of Coastal Submicron Sea Spray Aerosol, Environ. Sci. Technol., 56, 16633–16642, 2022.
Franklin, E. B., Yee, L. D., Wernis, R., Isaacman-VanWertz, G., Kreisberg, N., Weber, R., Zhang, H., Palm, B. B., Hu, W., Campuzano-Jost, P., Day, D. A., Manzi, A., Artaxo, P., Souza, R. A. F., Jimenez, J. L., Martin, S. T., and Goldstein, A. H.: Chemical Signatures of Seasonally Unique Anthropogenic Influences on Organic Aerosol Composition in the Central Amazon, Environ. Sci. Technol., 57, 6263–6272, 2023.
Guo, Q., Yu, J., Yang, K., Wen, X., Zhang, H., Yu, Z., Li, H., Zhang, D., and Yang, M.: Identification of complex septic odorants in Huangpu River source water by combining the data from gas chromatography-olfactometry and comprehensive two-dimensional gas chromatography using retention indices, Sci. Total Environ., 556, 36–44, 2016.
Hamilton, S. D. and Harley, R. A.: High-Resolution Modeling and Apportionment of Diesel-Related Contributions to Black Carbon Concentrations, Environ. Sci. Technol., 55, 12250–12260, 2021.
He, X., Zheng, X., You, Y., Zhang, S., Zhao, B., Wang, X., Huang, G., Chen, T., Cao, Y., He, L., Chang, X., Wang, S., and Wu, Y.: Comprehensive chemical characterization of gaseous I/SVOC emissions from heavy-duty diesel vehicles using two-dimensional gas chromatography time-of-flight mass spectrometry, Environ. Pollut., 305, 119284, https://www.ncbi.nlm.nih.gov/pubmed/35436508 (last access: 20 September 2024), 2022a.
He, X., Zheng, X., Zhang, S., Wang, X., Chen, T., Zhang, X., Huang, G., Cao, Y., He, L., Cao, X., Cheng, Y., Wang, S., and Wu, Y.: Comprehensive characterization of particulate intermediate-volatility and semi-volatile organic compounds (I/SVOCs) from heavy-duty diesel vehicles using two-dimensional gas chromatography time-of-flight mass spectrometry, Atmos. Chem. Phys., 22, 13935–13947, https://doi.org/10.5194/acp-22-13935-2022, 2022b.
Huang, X.-F., Zou, B.-B., He, L.-Y., Hu, M., Prévôt, A. S. H., and Zhang, Y.-H.: Exploration of PM2.5 sources on the regional scale in the Pearl River Delta based on ME-2 modeling, Atmos. Chem. Phys., 18, 11563–11580, https://doi.org/10.5194/acp-18-11563-2018, 2018.
Huo, Y., Guo, Z., Li, Q., Wu, D., Ding, X., Liu, A., Huang, D., Qiu, G., Wu, M., Zhao, Z., Sun, H., Song, W., Li, X., Chen, Y., Wu, T., and Chen, J.: Chemical Fingerprinting of HULIS in Particulate Matters Emitted from Residential Coal and Biomass Combustion, Environ. Sci. Technol., 55, 3593–3603, 2021.
Kosyakov, D. S., Ul'yanovskii, N. V., Latkin, T. B., Pokryshkin, S. A., Berzhonskis, V. R., Polyakova, O. V., and Lebedev, A. T.: Peat burning – An important source of pyridines in the earth atmosphere, Environ. Pollut., 266, 115109, https://www.ncbi.nlm.nih.gov/pubmed/32622216 (last access: 20 September 2024), 2020.
Kruve, A., Kaupmees, K., Liigand, J., and Leito, I.: Negative electrospray ionization via deprotonation: predicting the ionization efficiency, Anal. Chem., 86, 4822–4830, 2014.
Phillips, K. A., Yau, A., Favela, K. A., Isaacs, K. K., McEachran, A., Grulke, C., Richard, A. M., Williams, A. J., Sobus, J. R., Thomas, R. S., and Wambaugh, J. F.: Suspect Screening Analysis of Chemicals in Consumer Products, Environ. Sci. Technol., 52, 3125–3135, 2018.
Piotrowski, P. K., Weggler, B. A., Yoxtheimer, D. A., Kelly, C. N., Barth-Naftilan, E., Saiers, J. E., and Dorman, F. L.: Elucidating Environmental Fingerprinting Mechanisms of Unconventional Gas Development through Hydrocarbon Analysis, Anal. Chem., 90, 5466–5473, 2018.
Saeki, K., Ikari, K., Yokoi, H., Ohira, S. I., Okochi, H., and Toda, K.: Biogenic Diamines and Their Amide Derivatives Are Present in the Forest Atmosphere and May Play a Role in Particle Formation, ACS Earth and Space Chemistry, 6, 421–430, 2022.
Shen, X., Che, H., Yao, Z., Wu, B., Lv, T., Yu, W., Cao, X., Hao, X., Li, X., Zhang, H., and Yao, X.: Real-World Emission Characteristics of Full-Volatility Organics Originating from Nonroad Agricultural Machinery during Agricultural Activities, Environ. Sci. Technol., 57, 10308–10318, 2023.
Silva, L. F. M., De La Cruz, A. R. H., Nunes, A. H. M., and Gioda, A.: Real-Time Monitoring of Nitrogen Oxides Emission Factors Using Sensors in the Exhaust Pipes of Heavy Vehicles in the Metropolitan Region of Rio de Janeiro, J. Brazil. Chem. Soc., 35, e-20230170, https://doi.org/10.21577/0103-5053.20230170, 2023.
Song, K., Tang, R., Zhang, J., Wan, Z., Zhang, Y., Hu, K., Gong, Y., Lv, D., Lu, S., Tan, Y., Zhang, R., Li, A., Yan, S., Yan, S., Fan, B., Zhu, W., Chan, C. K., Yao, M., and Guo, S.: Molecular fingerprints and health risks of smoke from home-use incense burning, Atmos. Chem. Phys., 23, 13585–13595, https://doi.org/10.5194/acp-23-13585-2023, 2023.
Stanimirova, I., Rich, D. Q., Russell, A. G., and Hopke, P. K.: A long-term, dispersion normalized PMF source apportionment of PM2.5 in Atlanta from 2005 to 2019, Atmos. Environ., 312, 120027, https://www.sciencedirect.com/science/article/pii/S1352231023004533 (last access: 20 September 2024), 2023.
Stefanuto, P.-H., Smolinska, A., and Focant, J.-F.: Advanced chemometric and data handling tools for GC×GC-TOF-MS Application of chemometrics and related advanced data handling in chemical separations, TrAC-Trend. Anal. Chem., 139, 116251, https://doi.org/10.1016/j.trac.2021.116251, 2021.
Stout, S. A. and Douglas, G. S.: Diamondoid hydrocarbons – Application in the chemical fingerprinting of natural gas condensate and gasoline, Environ. Forensics, 5, 225–235, 2004.
Wang, A. Q., Yuan, Z. B., Liu, X. H., Wang, M. L., Yang, J., Sha, Q. E., and Zheng, J. Y.: Measurement-based intermediate volatility organic compound emission inventory from on-road vehicle exhaust in China, Environ. Pollut., 310, https://doi.org/10.1016/j.envpol.2022.119887, 2022.
Wang, G. L., Shi, S. B., Wang, P. R., and Wang, T. G.: Analysis of diamondoids in crude oils using comprehensive two-dimensional gas chromatography/time-of-flight mass spectrometry, Fuel, 107, 706–714, 2013.
Wang, H., Zhang, S. J., Wu, X. M., Wen, Y. F., Li, Z. H., and Wu, Y.: Emission Measurements on a Large Sample of Heavy-Duty Diesel Trucks in China by Using Mobile Plume Chasing, Environ. Sci. Technol., 57, 15153–15161, 2023.
Welthagen, W., Schnelle-Kreis, J., and Zimmermann, R.: Search criteria and rules for comprehensive two-dimensional gas chromatography-time-of-flight mass spectrometry analysis of airborne particulate matter, J. Chromatogr. A, 1019, 233–249, 2003.
Wong, Y. K., Huang, X. H. H., Cheng, Y. Y., and Yu, J. Z.: Estimating primary vehicular emission contributions to PM2.5 using the Chemical Mass Balance model: Accounting for gas-particle partitioning of organic aerosols and oxidation degradation of hopanes, Environ. Pollut., 291, 118131, https://doi.org/10.1016/j.envpol.2021.118131, 2021.
Wu, L. L. and Geng, A. S.: Differences in the thermal evolution of hopanes and steranes in free and bound fractions, Org. Geochem., 101, 38–48, 2016.
Xu, B., Zhang, G., Gustafsson, O., Kawamura, K., Li, J., Andersson, A., Bikkina, S., Kunwar, B., Pokhrel, A., Zhong, G., Zhao, S., Li, J., Huang, C., Cheng, Z., Zhu, S., Peng, P., and Sheng, G.: Large contribution of fossil-derived components to aqueous secondary organic aerosols in China, Nat. Commun., 13, 5115, https://www.ncbi.nlm.nih.gov/pubmed/36045131 (last access: 20 September 2024), 2022.
Yan, J. Z., Wang, G., Chen, S. Y., Zhang, H., Qian, J. Q., and Mao, Y. X.: Harnessing freight platforms to promote the penetration of long-haul heavy-duty hydrogen fuel-cell trucks, Energy, 254, 124225, https://doi.org/10.1016/j.energy.2022.124225, 2022.
Yu, D., Tan, Z., Lu, K., Ma, X., Li, X., Chen, S., Zhu, B., Lin, L., Li, Y., Qiu, P., Yang, X., Liu, Y., Wang, H., He, L., Huang, X., and Zhang, Y.: An explicit study of local ozone budget and NOx-VOCs sensitivity in Shenzhen China, Atmos. Environ., 224, 117304, https://doi.org/10.1016/j.atmosenv.2020.117304, 2020.
Zhang, Y., Li, R., Fang, J., Wang, C., and Cai, Z.: Simultaneous determination of eighteen nitro-polyaromatic hydrocarbons in PM(2.5) by atmospheric pressure gas chromatography-tandem mass spectrometry, Chemosphere, 198, 303–310, 2018.
Zhao, Y., Hennigan, C. J., May, A. A., Tkacik, D. S., de Gouw, J. A., Gilman, J. B., Kuster, W. C., Borbon, A., and Robinson, A. L.: Intermediate-volatility organic compounds: a large source of secondary organic aerosol, Environ. Sci. Technol., 48, 13743–137550, 2014.
Zhao, Y., Nguyen, N. T., Presto, A. A., Hennigan, C. J., May, A. A., and Robinson, A. L.: Intermediate Volatility Organic Compound Emissions from On-Road Diesel Vehicles: Chemical Composition, Emission Factors, and Estimated Secondary Organic Aerosol Production, Environ. Sci. Technol., 49, 11516–11526, 2015.
Zhao, Y., Tkacik, D. S., May, A. A., Donahue, N. M., and Robinson, A. L.: Mobile Sources Are Still an Important Source of Secondary Organic Aerosol and Fine Particulate Matter in the Los Angeles Region, Environ. Sci. Technol., 56, 15328–15336, 2022.