the Creative Commons Attribution 4.0 License.
the Creative Commons Attribution 4.0 License.
 | 24 Jan 2024
Expanding the simulation of East Asian super dust storms: physical transport mechanisms impacting the western Pacific
Steven Soon-Kai Kong
Saginela Ravindra Babu
Sheng-Hsiang Wang
Stephen M. Griffith
Jackson Hian-Wui Chang
Ming-Tung Chuang
Neng-Huei Lin
Dust models are widely applied over the East Asian region for the simulation of dust emission, transport, and deposition. However, due to the uncertainties in estimates of dust transport, these methods still lack the necessary precision to capture the complexity of transboundary dust events. This study demonstrates an improvement in the Community Multiscale Air Quality (CMAQ) model dust treatment during long-range transport of dust from northwestern China to the South China Sea (SCS). To accomplish this, we considered a super dust storm (SDS) event in March 2010 and evaluated the dust scheme by including adjustments to the recent calibration (Dust_Refined_1) and bulk density (Dust_Refined_2) refinements individually and in combination (Dust_Refined_3). The Dust_Refined_3 normalized mean bias of PM10 was −30.65 % for the 2010 SDS event, which was lower in magnitude compared to Dust_Refined_1 (−41.18 %) and Dust_Refined_2 (−49.88 %). Indeed, Dust_Refined_3 improved the simulated aerosol optical depth (AOD) value during significant dust cases, e.g., in March 2005, March 2006, and April 2009. Dust_Refined_3 also showed more clearly that, in March 2010, a “double plume” (i.e., one plume originating from the Taiwan Strait and the other from the western Pacific) separated by the Central Mountain Range (CMR) of Taiwan affected dust transport on the island of Dongsha in the SCS. On 15–21 April 2021, both CMAQ simulations and satellite data highlighted the influence of Typhoon Surigae on dust transport to downwind Taiwan and the western Pacific Ocean (WPO). The CMAQ Dust_Refined_3 simulations further revealed that many dust aerosols were removed over the WPO due to Typhoon Surigae. Hence, the model indicated a near-zero dust particle concentration over the WPO, which was significantly different from previous dust transport episodes over the Taiwan region. Therefore, our study suggested an effective method to improve dust management of CMAQ under unique topographical and meteorological conditions.
- Article
(14618 KB) - Full-text XML
-
Supplement
(1562 KB) - BibTeX
- EndNote


Dust storms are a major source of dust aerosols and particles in outdoor air pollution, with significant health, environmental, and ecological impacts adjacent to and downwind of dust source regions, especially in the East Asian region (Shao and Dong, 2006; Griffin and Kellogg, 2004; Yao et al., 2021). Likewise, dust aerosols can significantly affect Earth's climate through direct and indirect influences on the radiation balance of the atmosphere (S. Chen et al., 2017; Huang et al., 2014; Dong et al., 2019). The Gobi desert (GD) in northern China and Mongolia and the Taklamakan Desert (TD) in western China are dust storm hotspot regions in East Asia. Several studies have reported on the impacts of this East Asian Dust (EAD), particularly the effects during springtime on air quality and air pollution over source regions (e.g., northern China) and over downwind regions such as Korea, Japan, and Taiwan (Bian et al., 2011; Han et al., 2012; Guo et al., 2017; Jing et al., 2017; Dong et al., 2016; Jiang et al., 2018; Kong et al., 2021, 2022; Tan et al., 2017; Uno et al., 2017). Fugitive dust can be dispersed over thousands of kilometers; thus, regional and large-scale meteorological conditions play a crucial role in the transport of these dust particles during dust storms.
A series of dust storms (15 March, 27 March, and 15 April) occurred over the Gobi area in the spring of 2021, including one of the largest dust storms in the past decade (15 March, the “3.15” dust storm hereafter). This severe dust storm turned the sky into sepia over Beijing (Sullivan, 2021), with maximum PM10 concentrations reaching up to 7400 µg m−3. A few studies investigated the origin, transport processes, and impact of the “3.15” dust storm on air quality by multisource observations and numerical modeling (Liang et al., 2022; Gui et al., 2022; Jin et al., 2022; He et al., 2022). Gui et al. (2022) reported the detailed spatial, temporal, and vertical evolution of the “3.15” dust storm and 27 March (“3.27” dust storm) events by utilizing satellite dust optical depths, lidar dust extinction profiles, visibility measurements, and RGB Himawari imagery. Further, Jin et al. (2022) described the dust source, aerosol optical, microphysical, and radiative properties together with meteorological drivers of the three events in spring 2021. Even though past studies of milder dust storm events have shown impacts as far afield as the Taiwan region (Kong et al., 2021, 2022), most of the studies regarding 2021 super dust storm (SDS) events were focused on the impact and transport over China and eastern downwind parts of Asia. None of the studies reported the transport of dust from these events to the South China Sea (SCS), including Taiwan, and chemical-transport modeling of these events was also limited.
On the other hand, several numerical modeling studies have been conducted to simulate the March 2010 SDS event (Bian et al., 2011; He et al., 2022; Li et al., 2011; Zhao et al., 2011; Lin et al., 2012; Park et al., 2012; Chow et al., 2014; C. Chen et al., 2017). Fortuitously, this SDS event was also detected (Wang et al., 2011, 2012) over Dongsha (i.e., Pratas Island, 20∘42′52′′ N, 116∘43′51′′ E) in the northern SCS during the Dongsha Experiment (http://aerosol.atm.ncu.edu.tw, last access: 18 January 2024), which as part of the 7-SEAS (Seven South East Asian Studies; http://7-seas.gsfc.nasa.gov, last access: 18 January 2024, Lin et al., 2013) project was designed to investigate the weather–aerosol interaction over Southeast Asia. Although the SDS arrival at Dongsha was only described based on ground-measuring and satellite imagery (Wang et al., 2011, 2012), these studies showed the possibility of transporting dust aerosol from northwestern China to the SCS boundary layer. However, a detailed high-resolution numerical modeling system is needed to clarify the movement of the SDS aerosols in the region.
In our previous studies (Kong et al., 2021, 2022), we simulated moderate-intensity dust events at the surface and at higher altitudes over the Taiwan region by using the Weather Research and Forecasting-Community Multiscale Air Quality (WRF-CMAQ) model. Recognizing the opportunity to model SDS events impacting Taiwan and the SCS, in this study we utilized the WRF-CMAQ model with the latest windblown dust treatment to characterize the transport mechanism of the SDS events over these downwind regions. As the notable amount of atmospheric mineral received by SCS over the past years that influences the oceanic ecosystem, a more detailed investigation regarding long-range transport of dust episodes over the region can be vital (Duce et al., 1991; Wang et al., 2012). The present paper is organized as follows. The methodology of the WRF-CMAQ model setup and the dust treatment calibration are discussed in Sect. 2. The results and discussion are presented in Sect. 3. Finally, the summary and conclusions obtained from the present study are summarized in Sect. 4.
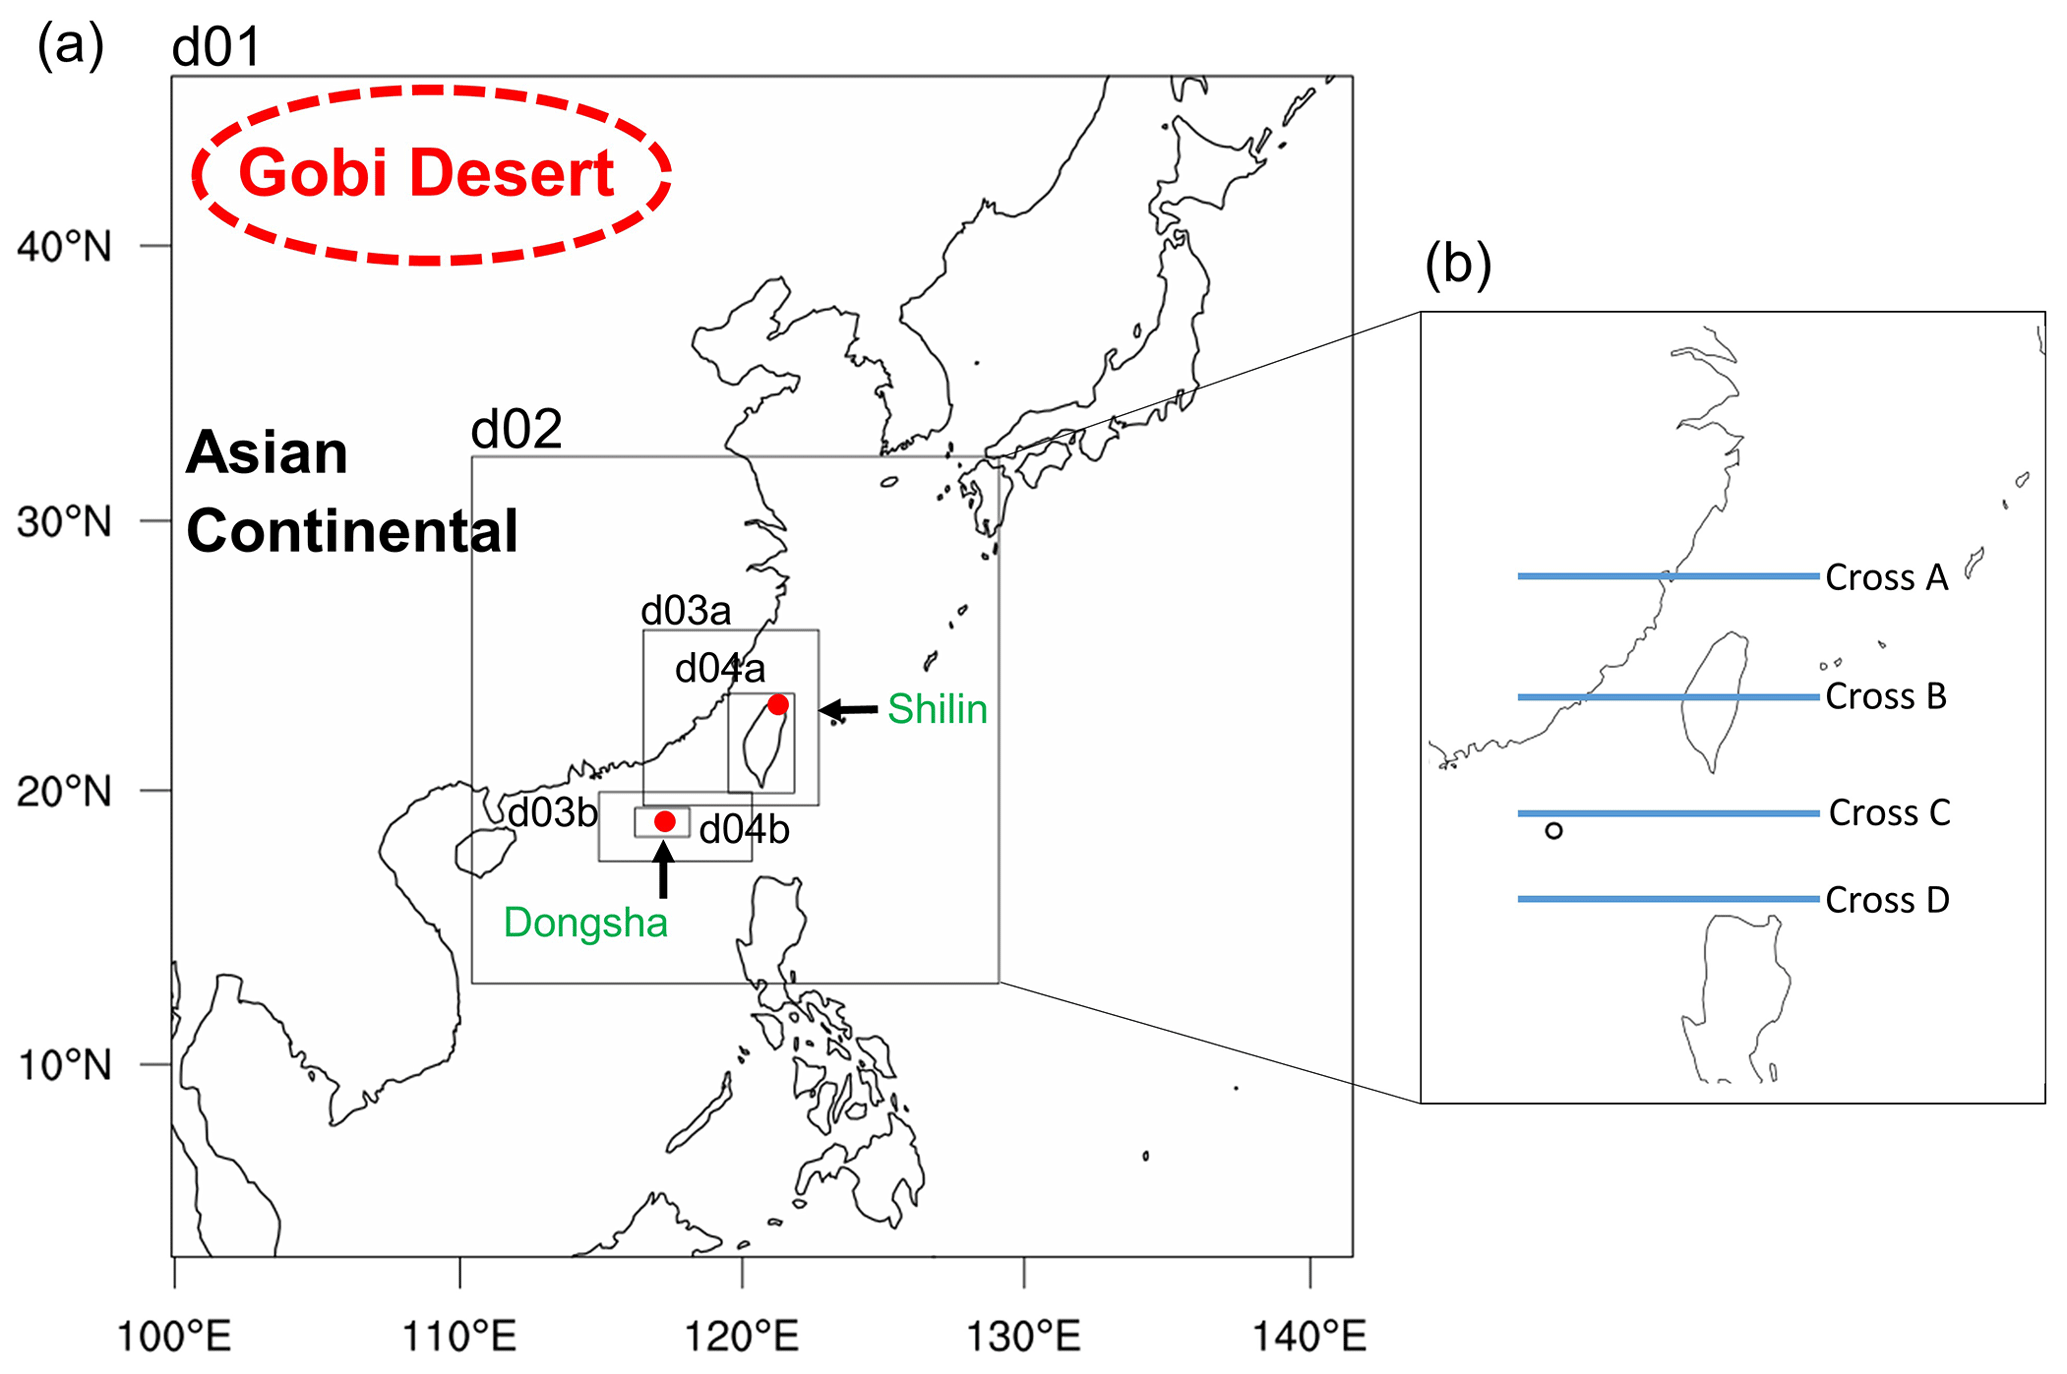
Figure 1(a) Modeling domain configuration used in the present study. The red dots represent the locations of the observation sites at Shilin and Dongsha. (b) The blue lines represent the transects that the dust plumes crossed and that are discussed in Sect. 3.
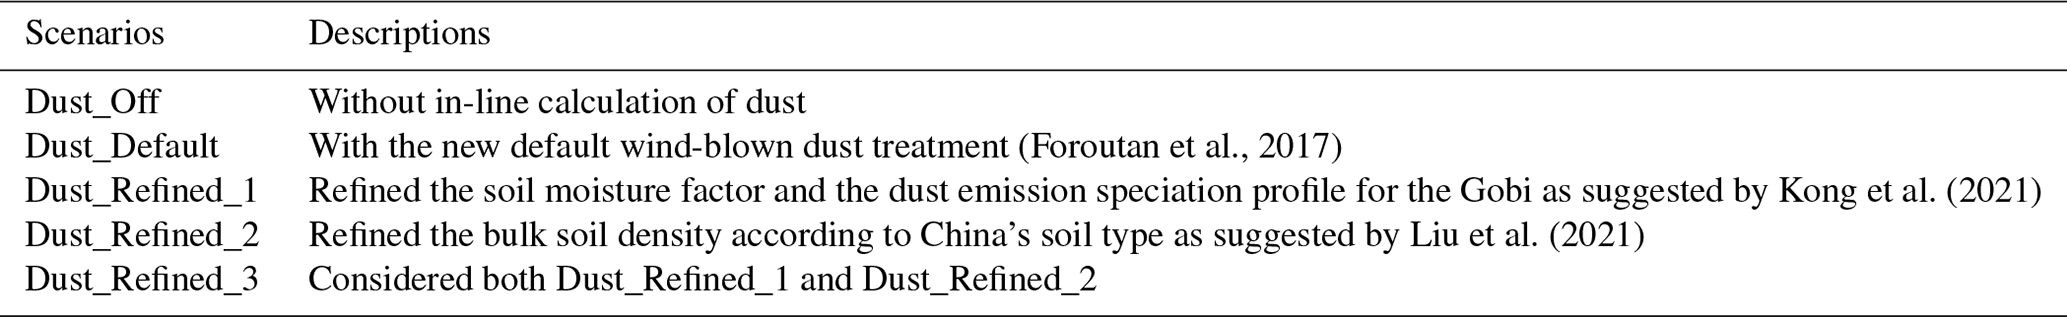
Table 1Summary of the design of the simulations used in the present study.
2.1 WRF-CMAQ model setup and dust treatment calibration
CMAQ is a state-of-the-art air quality model developed by the United States Environmental Protection Agency – USEPA (Appel et al., 2013) – that distinguishes 19 chemical species within dust particles, thus providing a detailed description of dust mineralogy (Dong et al., 2016). Heterogenous chemistry between the gas phase and aerosol phase also occurs (e.g., mechanisms) and can affect the dust chemical composition; thus, the gas-phase module is also activated in the model. This work utilized WRF v3.9.1 for the meteorological field prediction and CMAQ v5.3.3 to simulate the transport of SDS on 18–24 March 2010 and several well-known severe dust storms, e.g., on 17–19 March 2005, 18–20 March 2006, 25–27 April 2009, and 13–21 April 2021 (Wang et al., 2012; Jin et al., 2022). The modeling domain was set up to cover East Asia (d01), including the Gobi, with a resolution of 81 km and nested toward Taiwan at resolutions of 27 km (d02), 9 km (d03a), and 3 km (d04a) (Fig. 1a). The nesting of Dongsha with 9 km and 3 km resolutions (d03b and d04b) was set up to specifically capture the long-range transport over the SCS. The model consisted of 40 vertical layers, with 8 layers below ∼ 1 km altitude, 13 layers below ∼ 3 km altitude, and 27 layers covering the upper layer to ∼ 21 km. The initial and lateral boundary conditions of the model were constructed using the National Centers for Environmental Prediction (NCEP) Final Analyses (FNL) reanalysis dataset on a 1∘ × 1∘ grid. The data assimilation was conducted by grid nudging in all the domains. The CB06 gas-phase chemical mechanism and the AERO7 aerosol module model were implemented in CMAQ for the present study.
Anthropogenic emission inventories in East Asia were obtained from the MICS-Asia (Model Inter-Comparison Study for Asia) Phase III emission inventory (Li et al., 2017). Biogenic emissions for Taiwan were prepared by the Biogenic Emission Inventory System version 3.09 (BEIS3, Vukovich and Pierce, 2002) and, for regions outside Taiwan, by the Model of Emissions of Gases and Aerosols from Nature v2.1 (MEGAN, Guenther et al., 2012). TEDS 9.0 (Taiwan Emission Database System, TWEPA, 2011; https://erdb.epa.gov.tw/,last access: 18 January 2024) was used for domain 4 (d04a) covering the Taiwan region for the years 2005, 2006, 2009, and 2010, and TEDS 10.0 (TWEPA, 2021; https://erdb.epa.gov.tw/, last access: 18 January 2024) was used for the year 2021. Since domain d04b was specifically downscaled to Dongsha, no anthropogenic emissions were applied for the region.
Table 2Statistical index for PM10 concentrations on 19–23 March 2010 for Taiwan (Shilin, Pinzhen, Hsinchu, Xitun, Xinying, Zhuoyin, Daliao) and Dongsha.
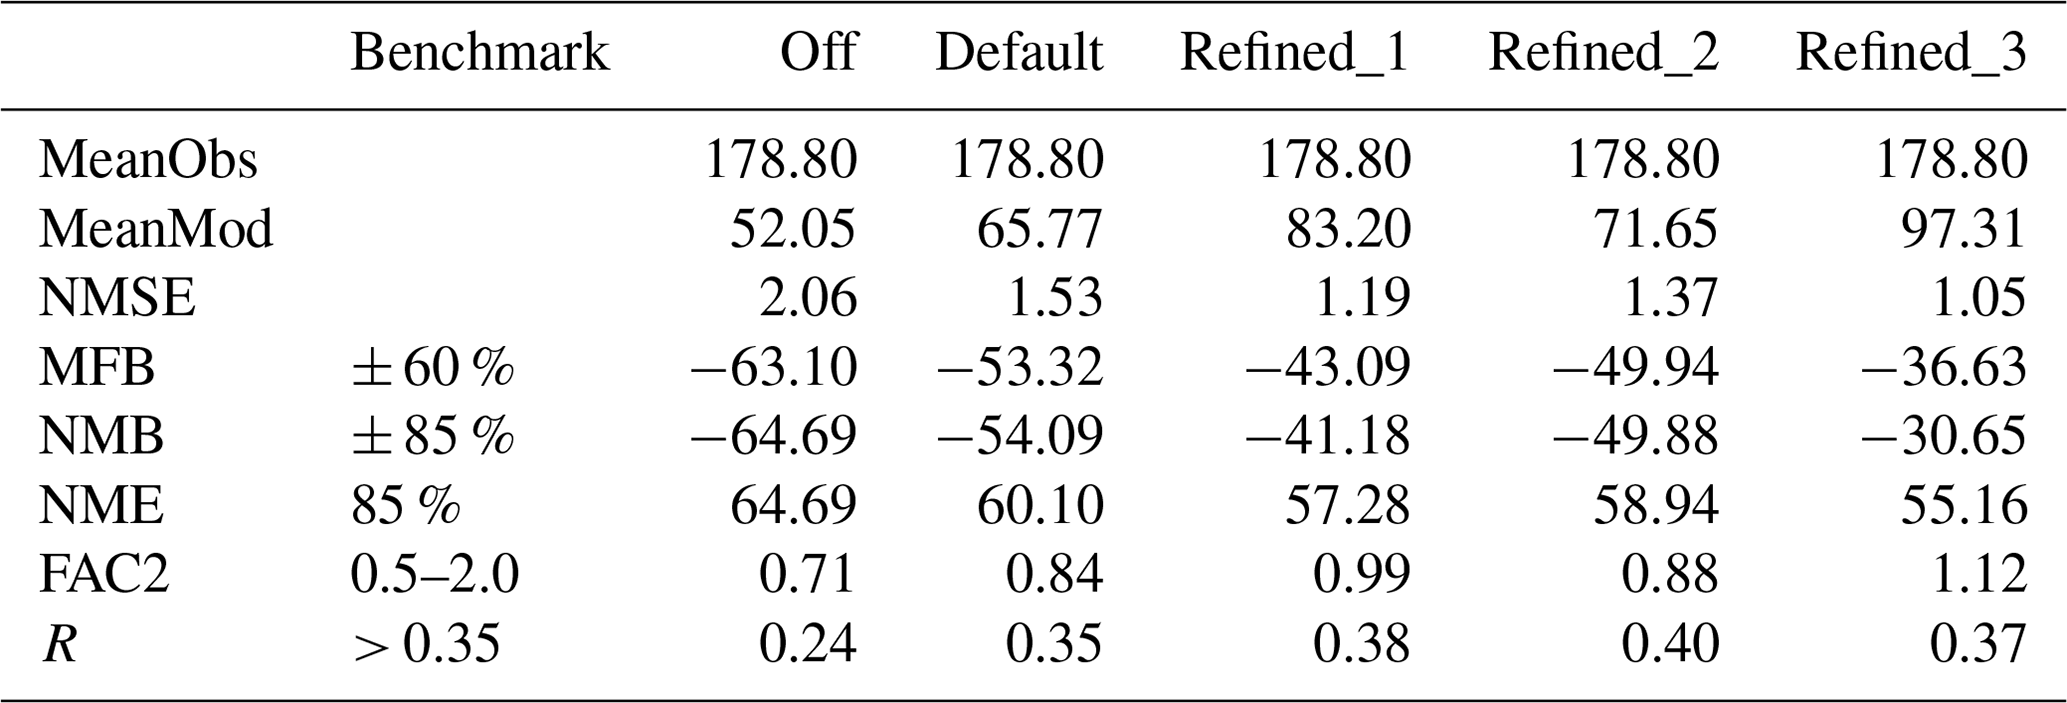
Note the definition of the statistical formulas. NMSE: normalized mean square error; MNB: mean normalized bias; NMB: normalized mean bias; NME: normalized mean error; FAC2: factor of 2; R: correlation coefficient.
Five simulation scenarios, i.e., Dust_Off, Dust_Default, Dust_Refined_1, Dust_Refined_2, and Dust_Refined_3, are presented and described in Table 1. The inline dust treatment was not included in Dust_Off. For Dust_Default, wind speed, soil texture, and surface roughness length were integrated based on the scheme by Foroutan et al. (2017). The performance of Dust_Off and Dust_Default in simulating a moderate dust episode was compared by Kong et al. (2021), but this comparison has not been investigated for a super dust storm. This comparison provides important information as CMAQ is often run for air quality purposes but with only Dust_Off or Dust_Default; however, dust influence on those observation data would be underestimated when using these basic schemes, and thus reporting this performance could be useful to later studies. The latest dust treatment over East Asia proposed by Kong et al. (2021) was implemented in the Dust_Refined_1 scenario, which reduced the soil moisture at the surface and revised the source-dependent species profile. The bulk soil density (ρb) should be revised to represent the real soil type in China, which is represented by Dust_Refined_2 (Liu et al., 2021). As the default bulk soil density (ρb) is set to 1000 kg m−3 in CMAQ for all the soil types, the soil condition in China is not specifically represented in the Dust_Default and Refined_1 scenarios. Hence, the ρb values of sand, loam, sandy clay loam, and clay were revised as 1550, 1350, 1450, and 1300 kg m−3, respectively, for Dust_Refined_2 (Yu et al., 2015; Liu et al., 2021). Finally, Dust_Refined_3 combined the Dust_Refined_1 and Dust_Refined_2 schemes.
2.2 Measurements at the downwind sites
The Dongsha Experiment included multiple platforms of instruments, such as the NASA/GSFC/COMMIT (Chemical, Optical, and Microphysical Measurements of In-situ Troposphere; http://smartlabs.gsfc.nasa.gov, last access: 18 January 2024) mobile observatory, the Taiwan Environmental Protection Administration (TEPA) mobile facility, and a lidar system (EZ-Lidar; Leosphere Co.), of which detailed information can be found in the literature (Wang et al., 2011). Briefly, continuous PM10 and PM2.5 mass concentrations were measured by a Tapered Element Oscillating Microbalance (TEOM; model 1400 ab; R&P Co.), which draws in air to a sample filter and changes the oscillation frequency of a calibrated tapered element. This change in frequency is then converted to a particle mass based on the restoring force constant of the tapered element. Moreover, a VAISALA WXT520 meteorological sensor was specifically set up at Dongsha for the field campaign. It was used to measure weather conditions near the surface, such as horizontal wind speed, wind direction, and precipitation. The dataset from the Dongsha Experiment was used to validate the CMAQ model precision during the dust storm event in March 2010. In addition, the hourly PM10 concentration datasets from the Cape Fuguei, Shilin, Pingzhen, Hsinchu, Xitun, Xinying, Zuoying, and Daliao sampling sites in Taiwan were obtained from the website of the Taiwan Environmental Protection Agency (https://data.epa.gov.tw/, last access: 18 January 2024).
2.3 Reanalysis products and satellite measurements
The Modern Era Retrospective-analysis for Research and Application version 2 (MERRA-2, Gelaro et al., 2017) reanalysis data were used in this study to demonstrate the spatiotemporal distribution of dust and to compare it with the air quality model, irrespective of the cloud cover. MERRA-2 is a NASA reanalysis (0.5∘ × 0.625∘ resolution) utilizing the Goddard Earth Observing System Data Assimilation System Version 5 (GEOS-5) and assimilates remotely sensed data. In addition, the level-3 MODIS aerosol optical depth (AOD) at 550 nm (MYD08) was used. The daily MODIS data were obtained from the AQUA platform with 1∘ × 1∘ resolution. Apart from this, we used daily mean merged precipitation data from the Global Precipitation Mission (GPM) satellite in the present study. MERRA-2 data can be accessed through the NASA Goddard Earth Sciences Data Information 135 Services Center (GES DISC; https://disc.gsfc.nasa.gov/, last access: 18 January 2024), while the MODIS and GPM datasets were downloaded from GIOVANNI's official website (https://giovanni.gsfc.nasa.gov/giovanni/, last access: 18 January 2024).
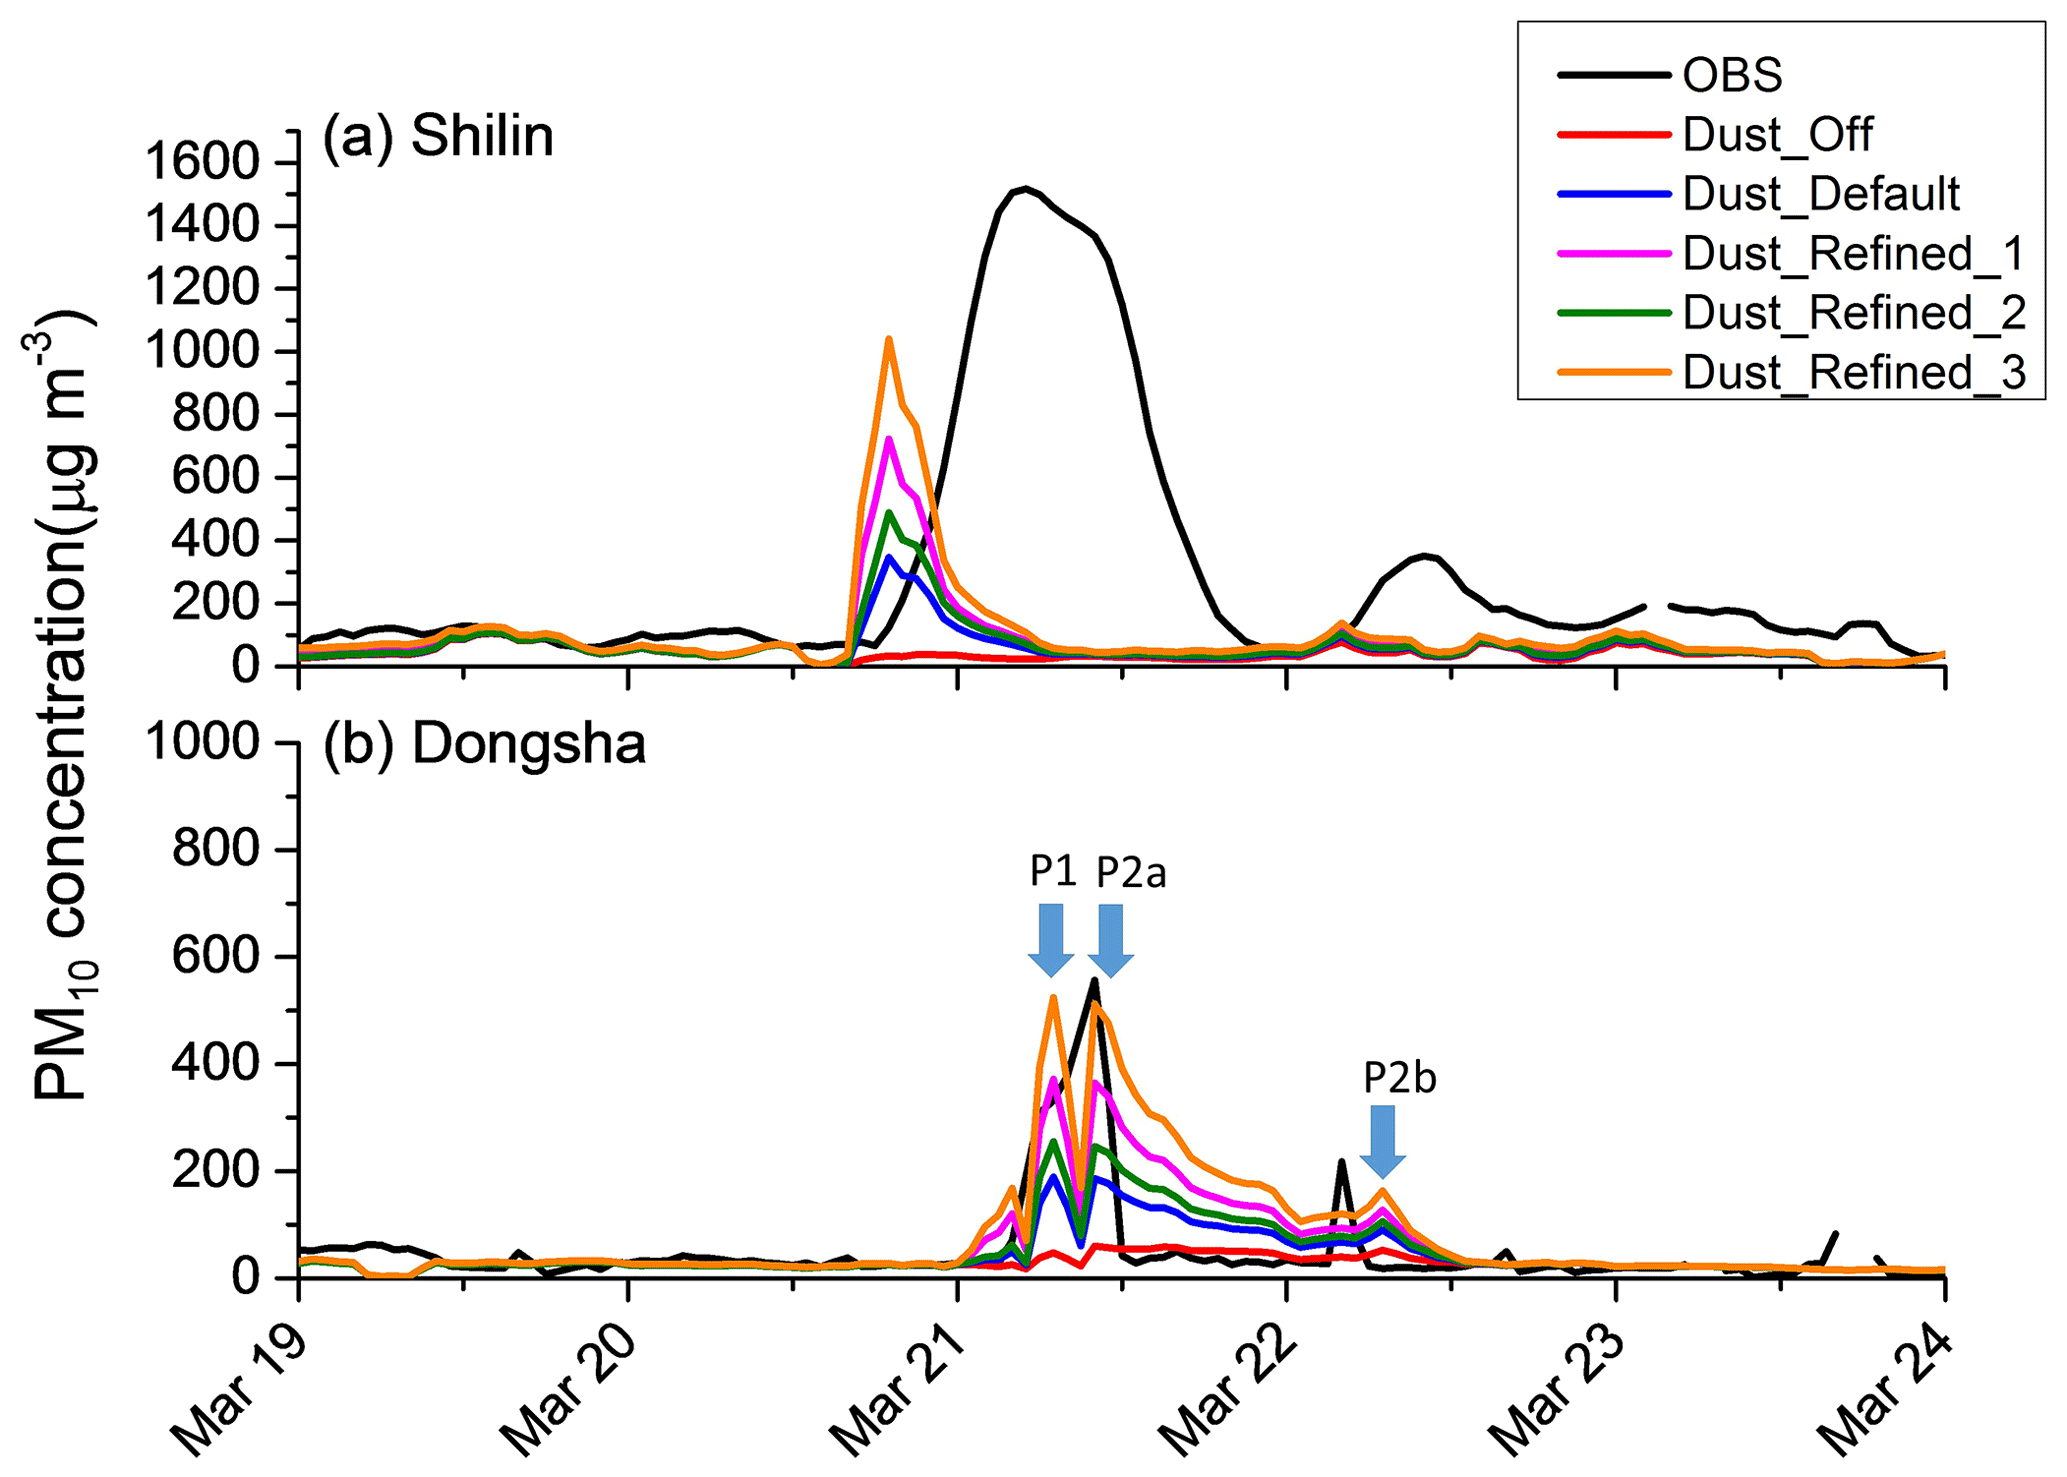
Figure 2Time series of observed and simulated PM10 concentrations over the Shilin site and Dongsha on 19–23 March 2010. P1, P2a, and P2b show the peak values of the simulated PM10 concentrations in the Dust_Refined_3 scenario.
3.1 CMAQ model evaluation
The statistical analysis of the CMAQ PM10 modeling performance for the March 2010 SDS event is shown in Table 2. The threshold of the statistical index is based on Emery et al. (2001). DUST_Off and DUST_Default were similarly underestimated (normalized mean bias (NMB) = −64.69 % and −54.09 %, respectively) compared with the observed values, which is consistent with the results of Dong et al. (2016) and Kong et al. (2021) that simulated moderate-intensity dust events. The Dust_Refined_1 and Dust_Refined_2 simulations exhibited improved accuracy (NMB = −41.18 % and −49.88 %, respectively), highlighting the importance of revising the dust treatment before simulating the SDS event over a downwind region (Kong et al., 2021). Moreover, the NMB for Refined_1 was lower than that for Refined_2, suggesting that simply calibrating the bulk soil density is not as effective as calibrating for soil moisture fraction and dust emission speciation. Eventually, Dust_Refined_3 resulted in the best performance (NMB = −30.65 %). Our results indicate the importance of including both calibration methods in order to reduce the model uncertainty.
Figure 2 shows the in situ and CMAQ-simulated PM10 concentrations at Shilin station (representing northern Taiwan) and Dongsha (representing the northern South China Sea region) on 19–24 March 2010. In both locations, the Dust_Off trend vastly underestimated the observations, whereas Dust_Default showed increased PM10 concentrations but still resulted in an underestimation. The maximum PM10 concentration at Shilin reached 1517 µg m−3. The CMAQ model predicted a peak PM10 concentration of 1040.8 µg m−3 and thus was 45.8 % lower than the observation result. At Dongsha, Dust_Refined_1 generated a higher peak PM10 value (371.6 µg m−3) compared to Dust_Refined_2 (255.3 µg m−3). Likewise, Dust_Refined_3 generated a peak concentration of 524.4 µg m−3, the highest among all of the simulation scenarios and only 5.9 % lower than the maximum observed PM10 concentration of 557.0 µg m−3.
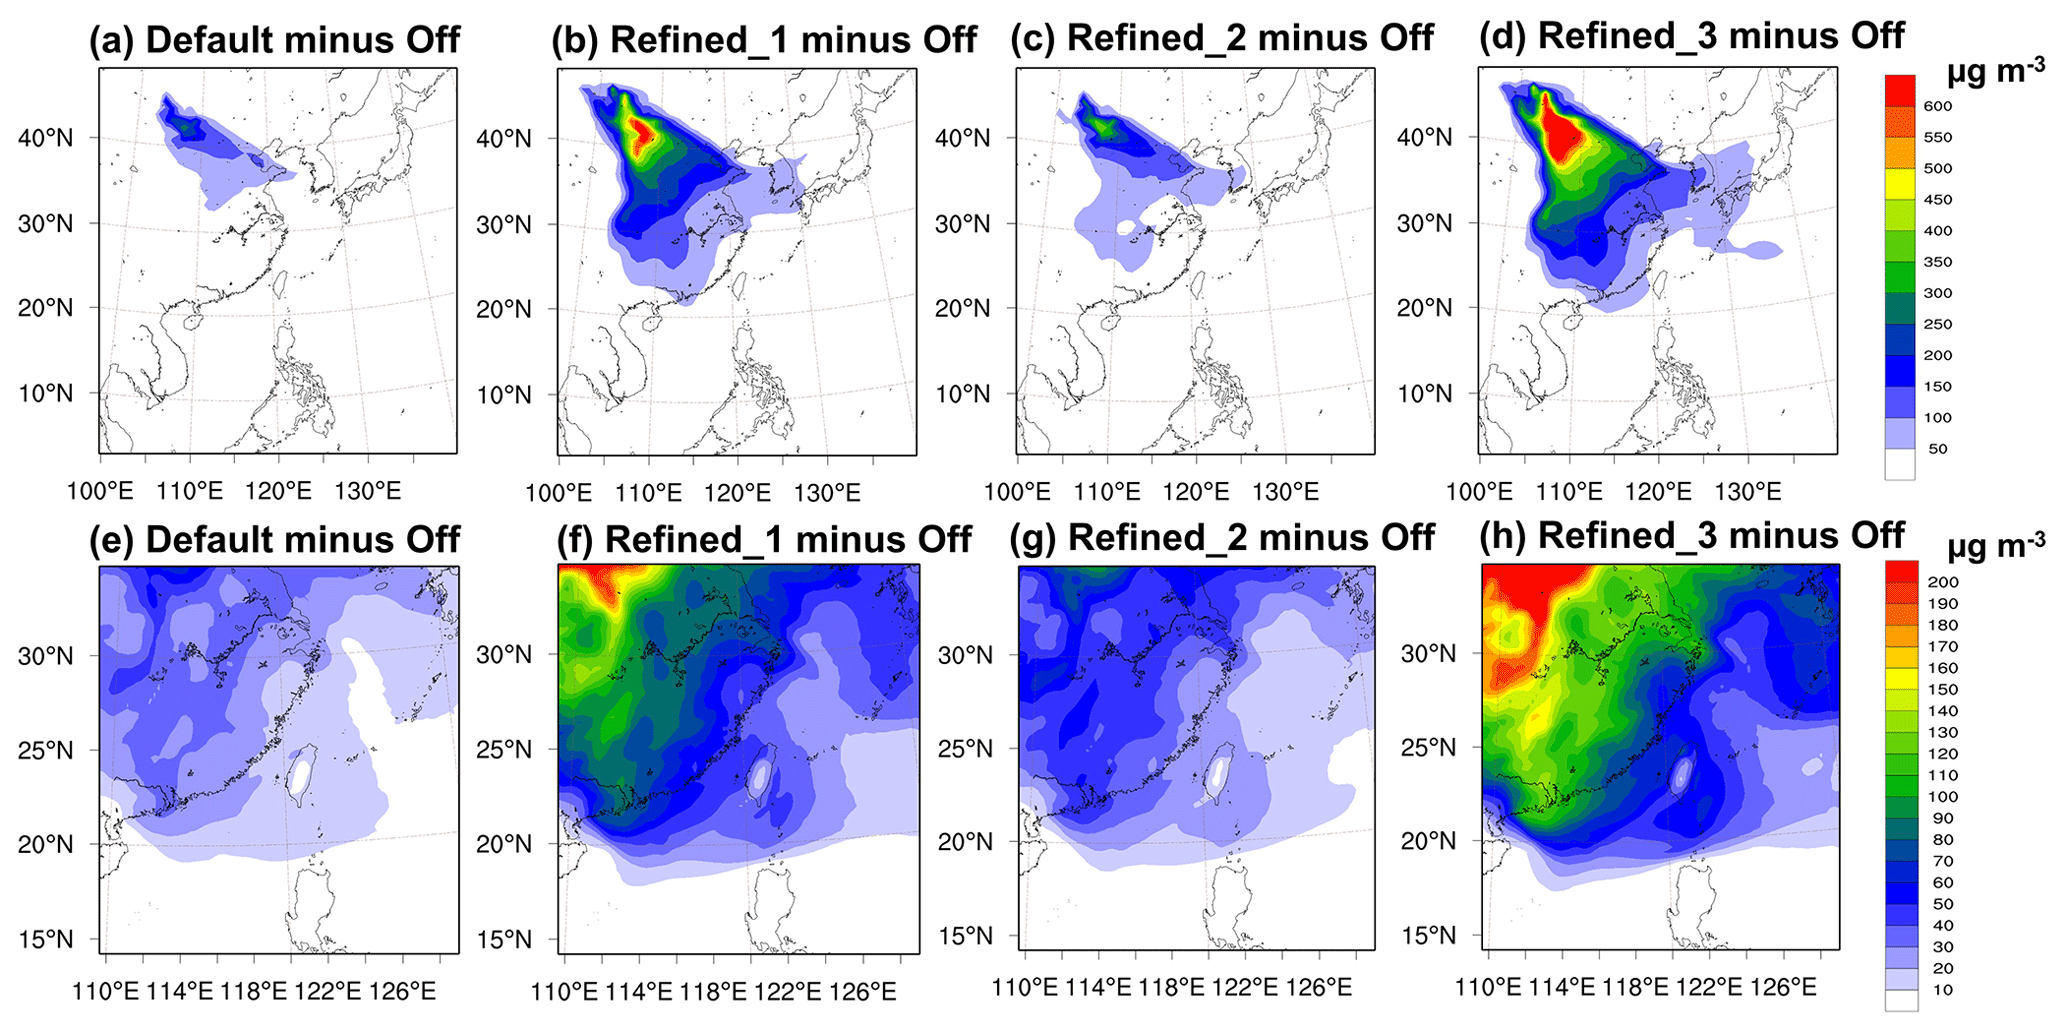
Figure 3The difference in the daily average modeled PM10 concentrations over d01 (a–d) and d02 (e–h) between Dust_Off, Dust_Default, Dust_Refined_1, Dust_Refined_2, and Dust_Refined_3, respectively.
Daily average modeled PM10 concentration differences between Dust_Off and other simulations over the East Asian region on 19–23 March 2010 are shown in Fig. 3, with the corresponding mean simulation in Fig. S1 in the Supplement. Dust_Default showed PM10 concentration differences of approximately 200 µg m−3 over the source region of northwestern China. Dust_Refined_1 exhibited a difference of ∼ 600 µg m−3 over the source region, which was greater than Dust_Refined_2. Overall, Dust_Refined_3 produced a > 600 µg m−3 difference, which was the highest among the simulations. This result was further verified over the downwind region, where high PM10 concentrations were observed in the Taiwan and SCS regions (Fig. 3h). Further, we plotted MERRA-2 surface dust concentrations on 20–21 March 2010 that are shown in Fig. S2. The MERRA-2 data indicated that the dust plume only impacted Taiwan but did not arrive at the SCS. Our model, on the other hand, clearly (apparently) simulated the arrival of the dust plume at Dongsha, which is consistent with 7-SEAS Dongsha Experiment-measured PM10. Hence, this effort emphasizes the importance of utilizing high-resolution simulations for depicting dust pollutant transport episodes. Besides that, the wind components play an important role in dust transport. Generally, the model-simulated wind speeds were more than 2 m s−1 greater than MERRA-2 wind speeds across much of East Asia during the SDS event in March 2010 (Fig. S3). Throughout the dust plume arrival in the SCS region, the simulated wind speeds were 8–12 m s−1, while those from MERRA-2 had a much lower magnitude or were nearly zero. As a result, the current study emphasizes the importance of the wind dataset for depicting transboundary dust events over the region.
Table 3CMAQ AOD evaluation against MODIS daily observation with NMB for the multiple simulation scenarios during the dust storm episodes of Mar2005 (16–20 March 2005), Mar2006 (17–21 March 2006), Apr2009 (24–28 April 2009), and Mar2010 (19–23 March 2010).
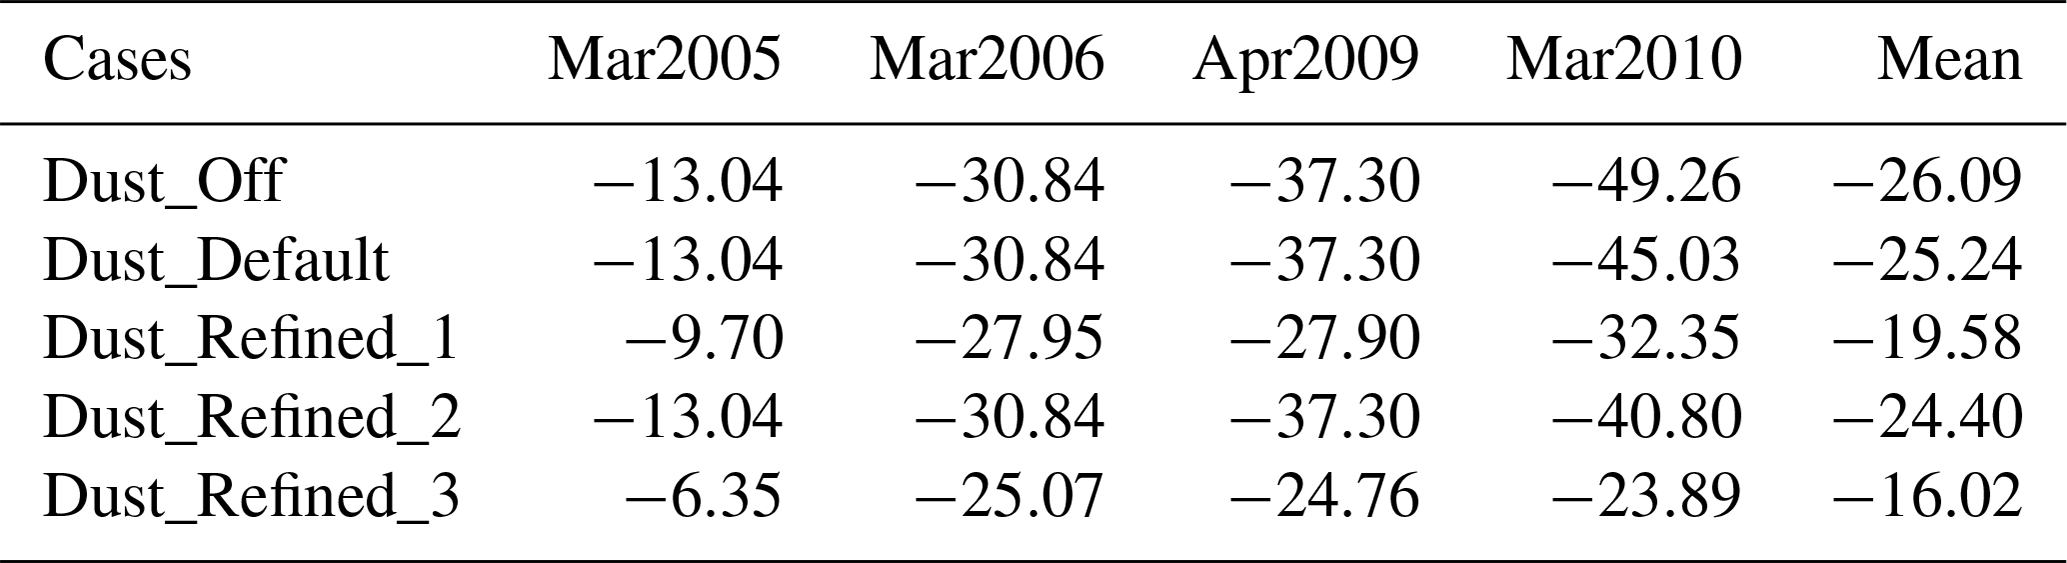
In order to re-emphasize the precision of the dust treatment, we then implemented our calibration method for other dust storm episodes that transported dust from northern Taiwan toward southern Taiwan, which were documented by Wang et al. (2012). Hence, we carried out the 3 d averaged sensitivity test over the East Asian region, estimated from d01 for four other notable dust storm cases: 17–19 March 2005, 18–20 March 2006, 25–27 April 2009, and 20–22 March 2010 (Table 3). Generally, DUST_Refined_3 performed well in simulating AOD over the East Asian region throughout the four strong dust storm events. The average AOD value of DUST_Refined_3 yielded an NMB of −16.02 %, which was markedly better than DUST_Off (−26.09 %), DUST_Default (−25.24 %), DUST_Refined_1 (−19.58 %), and DUST_Refined_2 (−24.40 %). Improvement of the modeled AOD by approximately 10 % was comparable to the result suggested by Dong et al. (2016). The temporal and spatial distribution of CMAQ AOD showed that DUST_Refined_3 can modestly capture the dust storm pattern as compared to the MODIS daily average AOD (Fig. S4). These results suggested that DUST_refined_3 should be used for calibration as it successfully uplifts the dust aerosol in the source region and simulates the notable dust cases over the East Asian region.
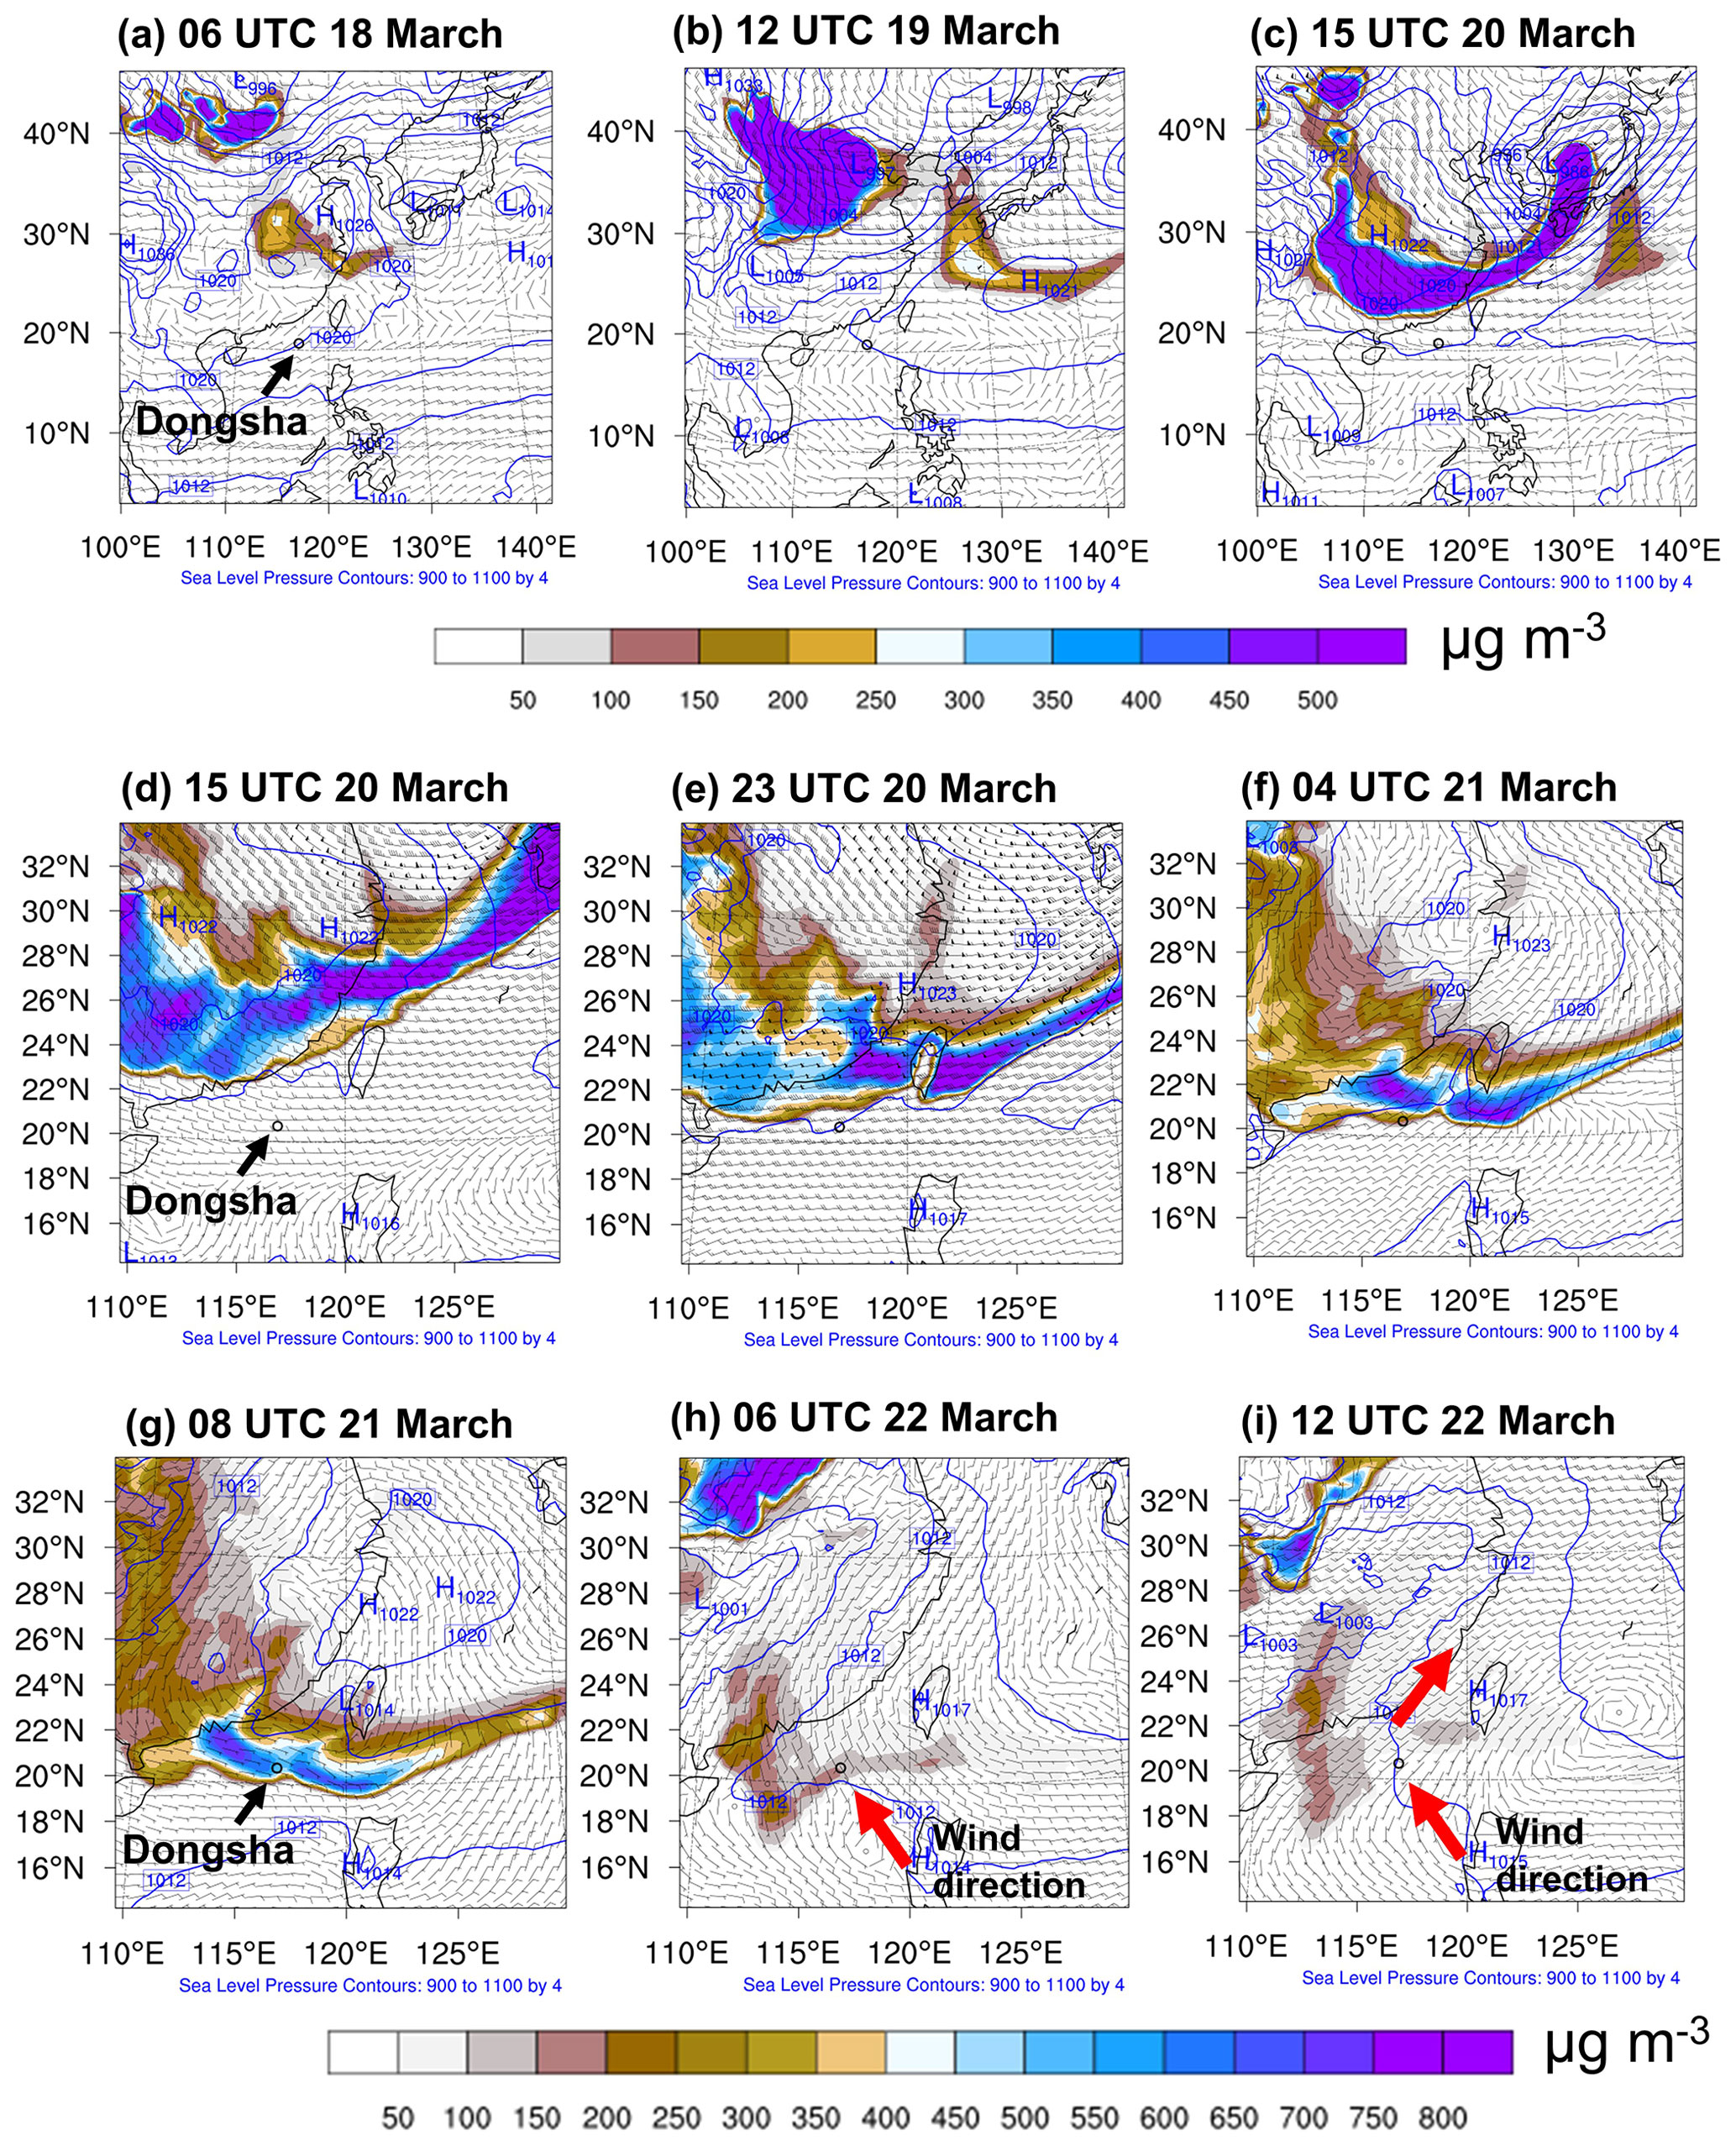
Figure 4Spatial distribution of the simulated dust aerosol during the March 2010 episode over East Asia within domain 1 (d01) at (a) 06:00 UTC on 18 March, (b) 12:00 UTC on 19 March, and (c) 15:00 UTC on 20 March as well as domain 2 (d02) at (d) 15:00 UTC on 20 March, (e) 23:00 UTC on 20 March, (f) 04:00 UTC on 21 March, (g) 08:00 UTC on 21 March, (h) 06:00 UTC on 22 March, and (i) 12:00 UTC on 22 March. The location of Dongsha is indicated with a black dot. The red arrows highlight the wind direction.
3.2 Role of the Central Mountain Range (CMR) in dust transport
Figure 4 shows the spatial distribution of CMAQ-estimated PM10 concentrations in Dust_Refined_3 simulations over East Asia during the March 2010 event. A low-pressure system of approximately 996 hPa over northwestern China was associated with the uplifting of dust (Fig. 4a). As shown in Fig. 4b, a strong pressure gradient led to strong wind speed generation, thus pushing the dust aerosol to move in a southeasterly direction (Song et al., 2019; Kong et al., 2022). The dust arrived in massive concentrations in transboundary regions such as southern China, Japan, Korea, and Taiwan, consistent with previous studies (Lin et al., 2012; Bian et al., 2011) (Fig. 4c). Moreover, the CMAQ PM10 spatial distribution in Dust_Refined_3 simulations depicted the dust transport over Taiwan and Dongsha displayed in Fig. 4d–i. At 15:00 UTC on 20 March, one dust cloud reached the surface in the Taiwan region (Fig. 4d) and split into two particular dust plumes due to the CMR located in central Taiwan (Fig. 4e). At 04:00 UTC on 21 March, the first dust plume arrived at Dongsha, followed by the second 4 h later (Fig. 4f and g). The model result suggested that the separated dust plumes originated from two different directions, the first one from the Taiwan Strait (P1) and the second one from the western Pacific Ocean (P2a) (Fig. 2). Meanwhile, the measured PM10 concentration at Dongsha showed two peak values, at 15:00 UTC on 21 March and at 04:00 UTC on 22 March 2010, respectively. The trends of the observed Dongsha peak value were consistent with the CMAQ model results, where the model exhibited a clear PM10 peak at 06:00 UTC on 22 March 2010 (P2b in Fig. 2b). The “tail” of the dust plume swept over the South China Sea, including Dongsha, due to the easterlies and the northeasterly wind (red arrow in Fig. 4h). Then, the dust cloud gradually dissipated, leaving Dongsha and moving to southern China (Fig. 4i).
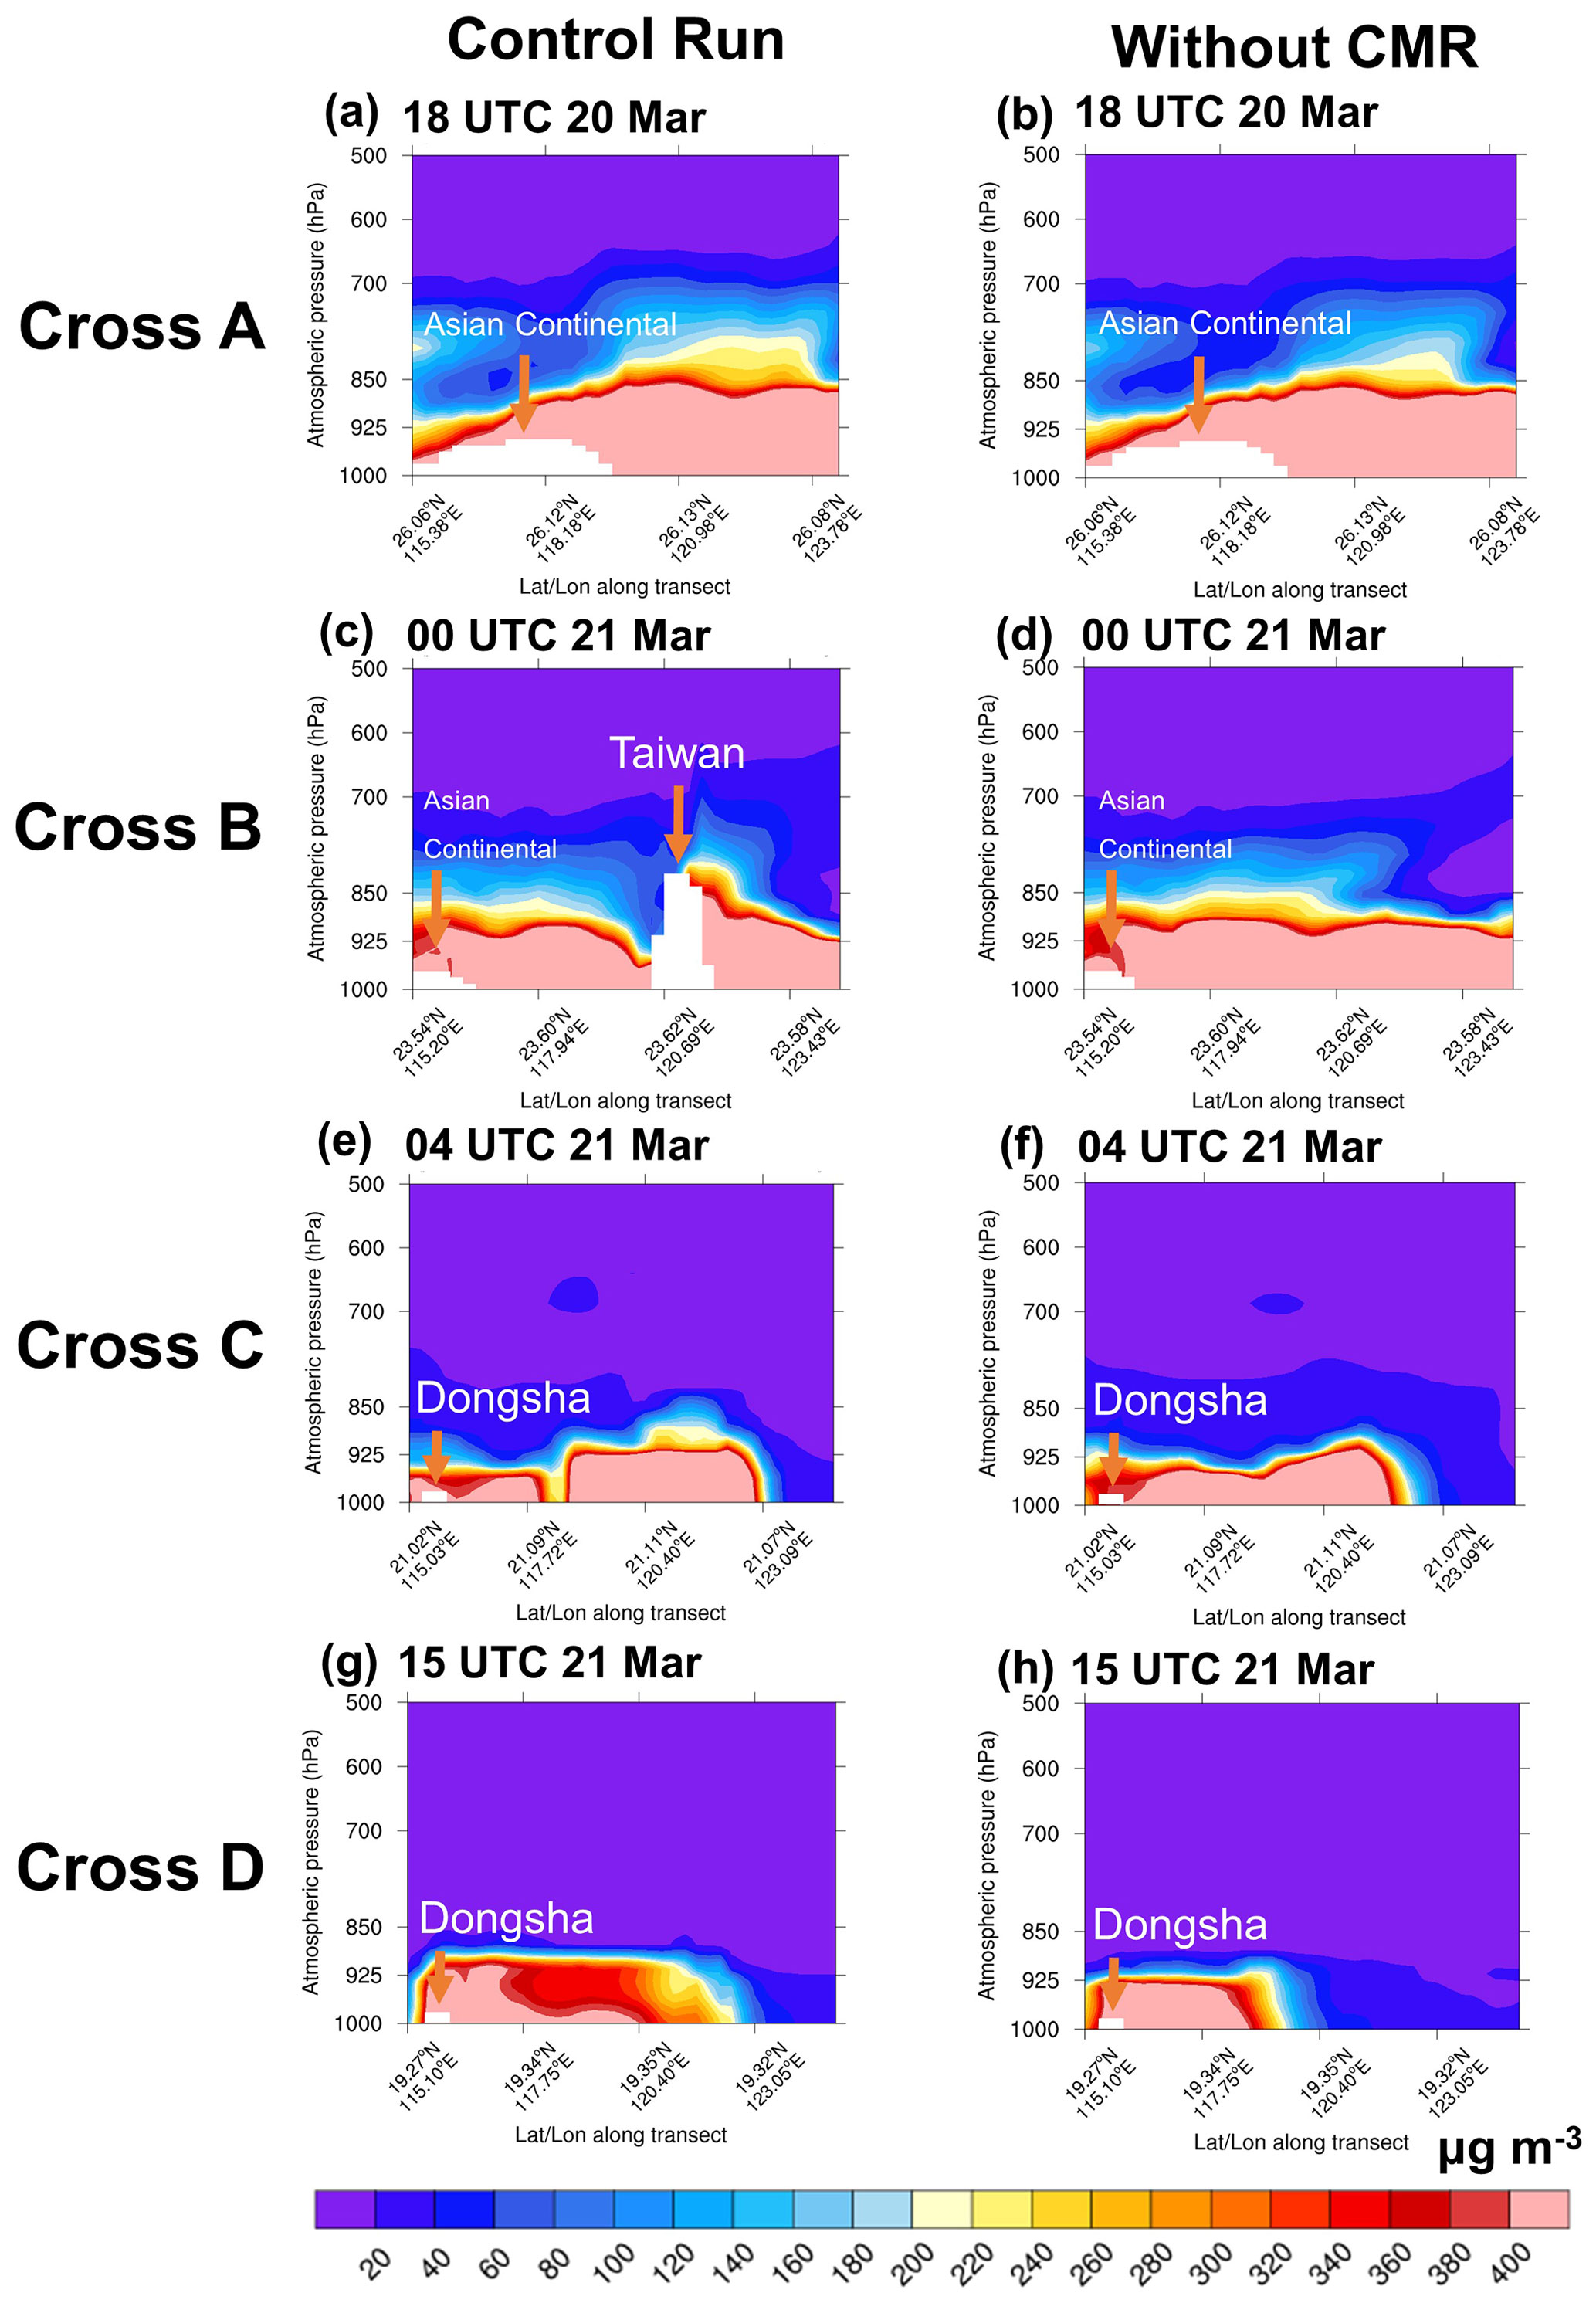
Figure 5Vertical profile of the simulated dust aerosol for the CMAQ simulation of (a, c, e, g) the control run and (b, d, f, h) without the CMR at (a, b) 18:00 UTC on 20 March, (c, d) 00:00 UTC on 21 March, (e, f) 04:00 UTC on 21 March, and (g, h) 15:00 UTC on 21 March 2010.
To better understand the role of the CMR in the SDS transport over the SCS and Dongsha, we carried out another simulation by removing the CMR and setting a zero altitude for the whole of Taiwan within WRF. We then examined the vertical profiles of the PM10 simulation by categorizing the model depiction into Cross A, Cross B, Cross C, and Cross D (Fig. 1b). The multiple cross-sectional lines indicated the vertical dust pattern at different stages or locations, such as the dust arrival at the East China Sea (Cross A), in central Taiwan (Cross B), and at the front (Cross C) and backward (Cross D) of Dongsha across the South China Sea. At 18:00 UTC on 20 March, preceding arrival in Taiwan, both simulations with and without the CMR showed the same pattern of PM10 over the East China Sea (ECS) (Fig. 5a and b). At 00:00 UTC on 21 March, the CMR of Taiwan effectively separated the dust cloud into two parts as shown in the control run (Fig. 5c), which is not seen in the simulation without the CMR (Fig. 5d). Due to the role of the CMR, CMAQ simulations indicated two dust plumes arriving in Dongsha (Cross C, Fig. 5e). Meanwhile, only one single plume was presented by the simulation without the CMR (Fig. 5f). At 15:00 UTC on 21 March, both dust plumes were merged together and transported to the westerly and northwesterly directions with respect to the easterly wind (Fig. 5g).
The role of the CMR has been discussed in the literature, as it alters the strength of frontal systems as they pass by Taiwan (Chien and Kuo, 2006). Also, due to the channel effect between the Wuyi Mountains in southeastern China and the CMR in Taiwan, the air flow is forced to accelerate and causes high-intensity wind speeds through the Taiwan Strait (Lin et al., 2012). Thus, the differential wind speeds over the Taiwan Strait and eastern Taiwan, owing to the CMR, apparently caused uneven “double plumes” over the Taiwan region.
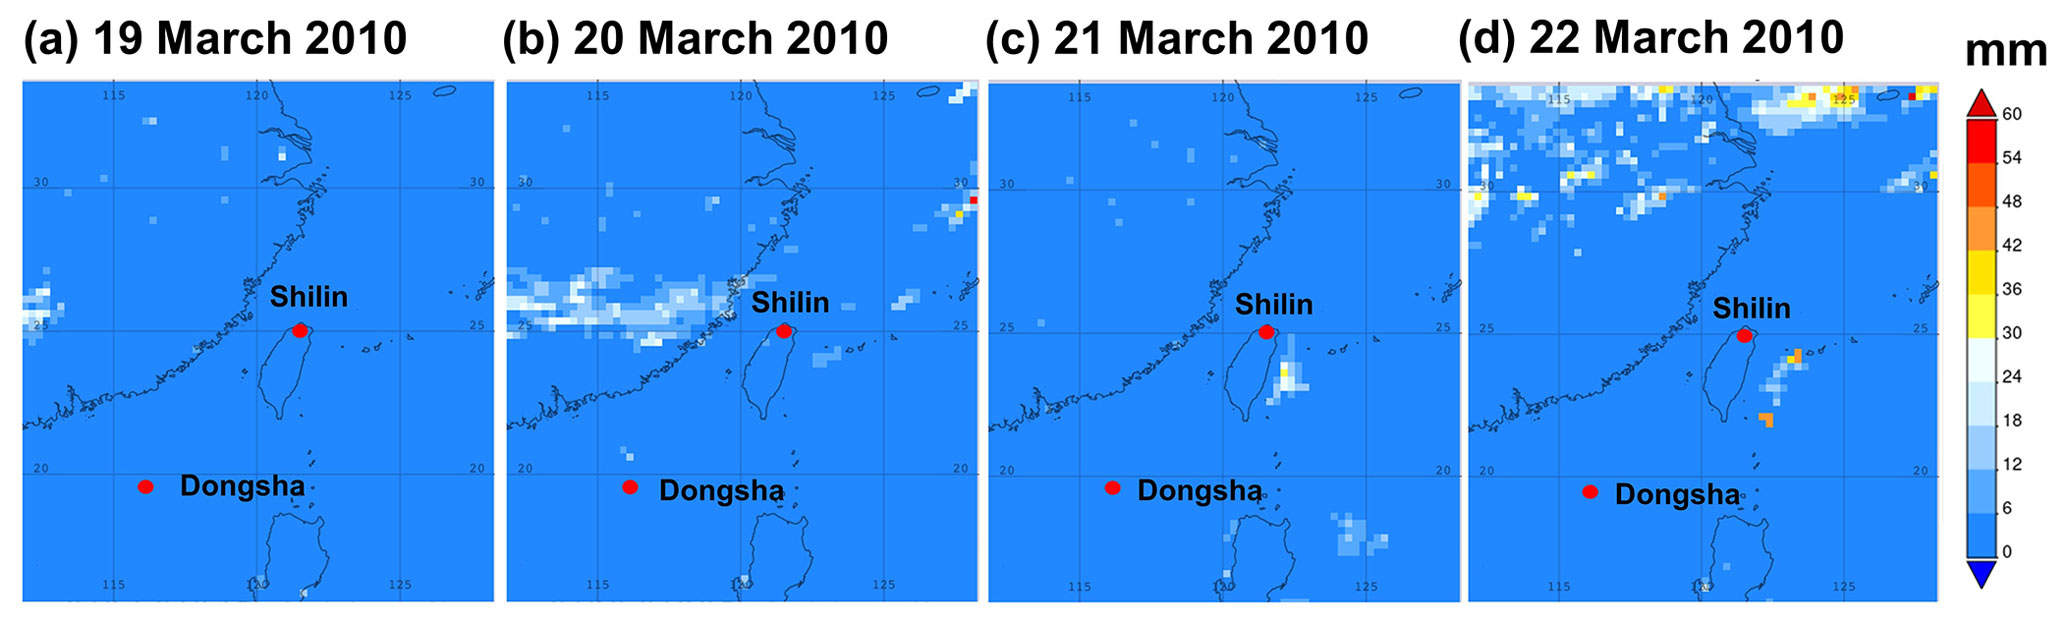
Figure 6Spatial distribution of daily mean merged precipitation data from the Global Precipitation Mission (GPM) satellite over the study region on 19–22 March 2010. The red dots represent the locations of the observation sites at Shilin and Dongsha.
3.3 Role of the meteorological conditions in dust transport
The observed PM10 over Dongsha (Fig. 2b) shows two separate peaks on 20 and 22 March, consistent with the reports of Wang et al. (2011). Our observed data showed minimal PM10 concentrations between the two peaks, even though no precipitation was recorded over the site (Fig. S4). Figure 6 shows the daily precipitation over the downwind region. As discussed in Sect. 3.2, abundant dust aerosol was transported through the Taiwan Strait and the western Pacific Ocean before arriving at Dongsha. On 19–20 March 2010, no rainfall was captured by the satellite data over both marine regions, resulting in the high PM10 concentration of the first peak (Fig. 6a and b). On the other hand, from 21 to 22 March 2010, heavy rainfall occurred in eastern Taiwan around the western Pacific Ocean (Fig. 6c and d). Based on the GPM satellite dataset, precipitation in the region may have washed away dust aerosols before reaching the SCS and Dongsha, resulting in lower PM10 concentrations.
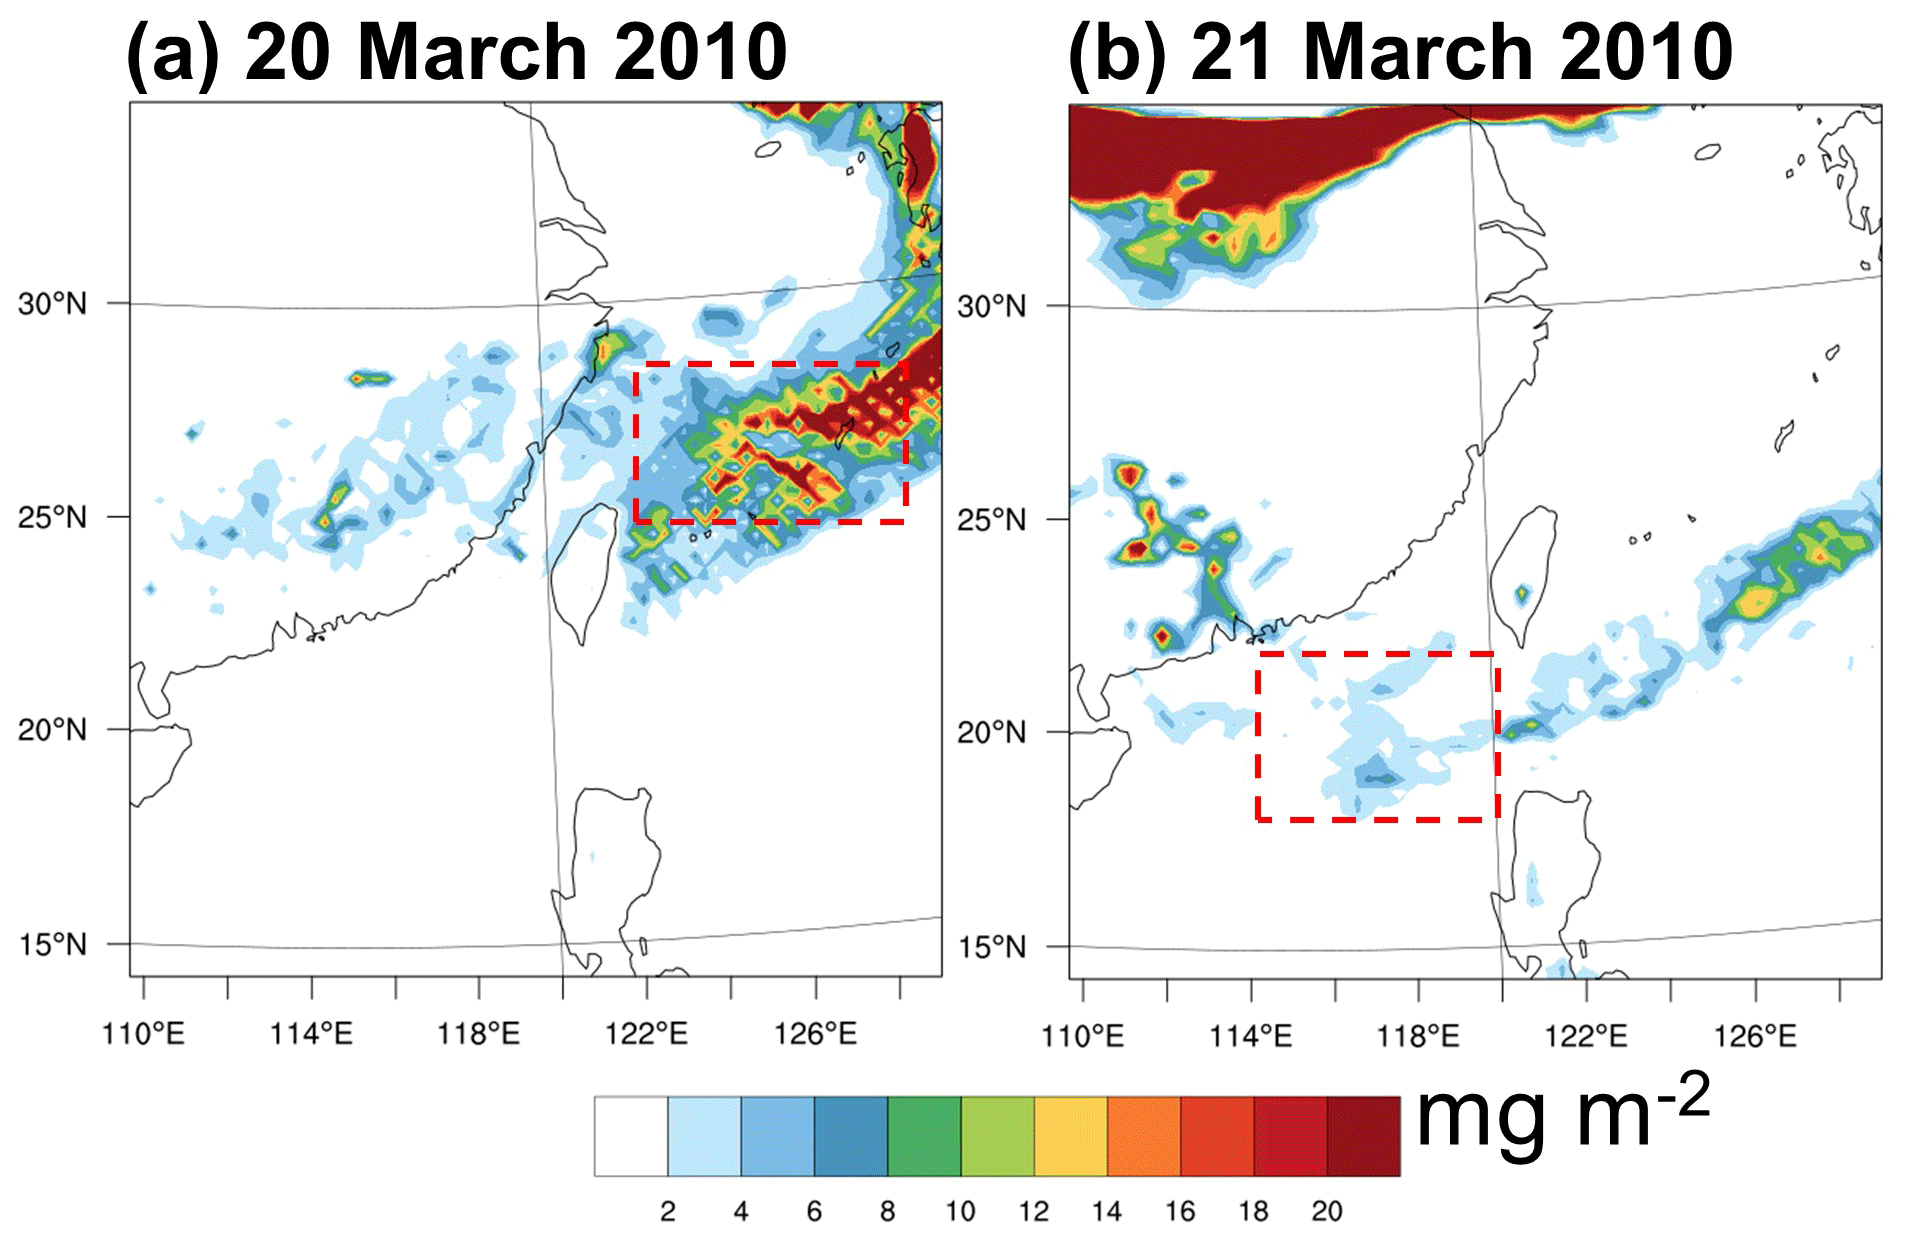
Figure 7Spatial distribution of the simulated wet deposition on (a) 20 March 2010 and (b) 21 March 2010.
Regarding the importance of precipitation and wet deposition during the dust transport over the downwind areas (Li et al., 2011; Kong et al., 2021), the spatial distribution of the modeled wet deposition is shown in Fig. 7. Obviously, wet deposition was more intense over the ECS than over the SCS, with ∼ 20 and ∼ 6 mg m−2, respectively. However, in Fig. 2, the modeled PM10 concentration over Shilin (northern Taiwan) was more underestimated than that at Dongsha (SCS). This situation may be related to differences in the wet deposition magnitude over the different marine boundary layers. Revising the CMAQ model deposition mechanism over the marine boundary layer was vital, as highlighted in our previous study (Kong et al., 2021). In the present work, we again suggest the possibility of deposition flux variability over a different part of the marine boundary region (ECS vs. SCS), which was not mentioned by Kong et al. (2021).
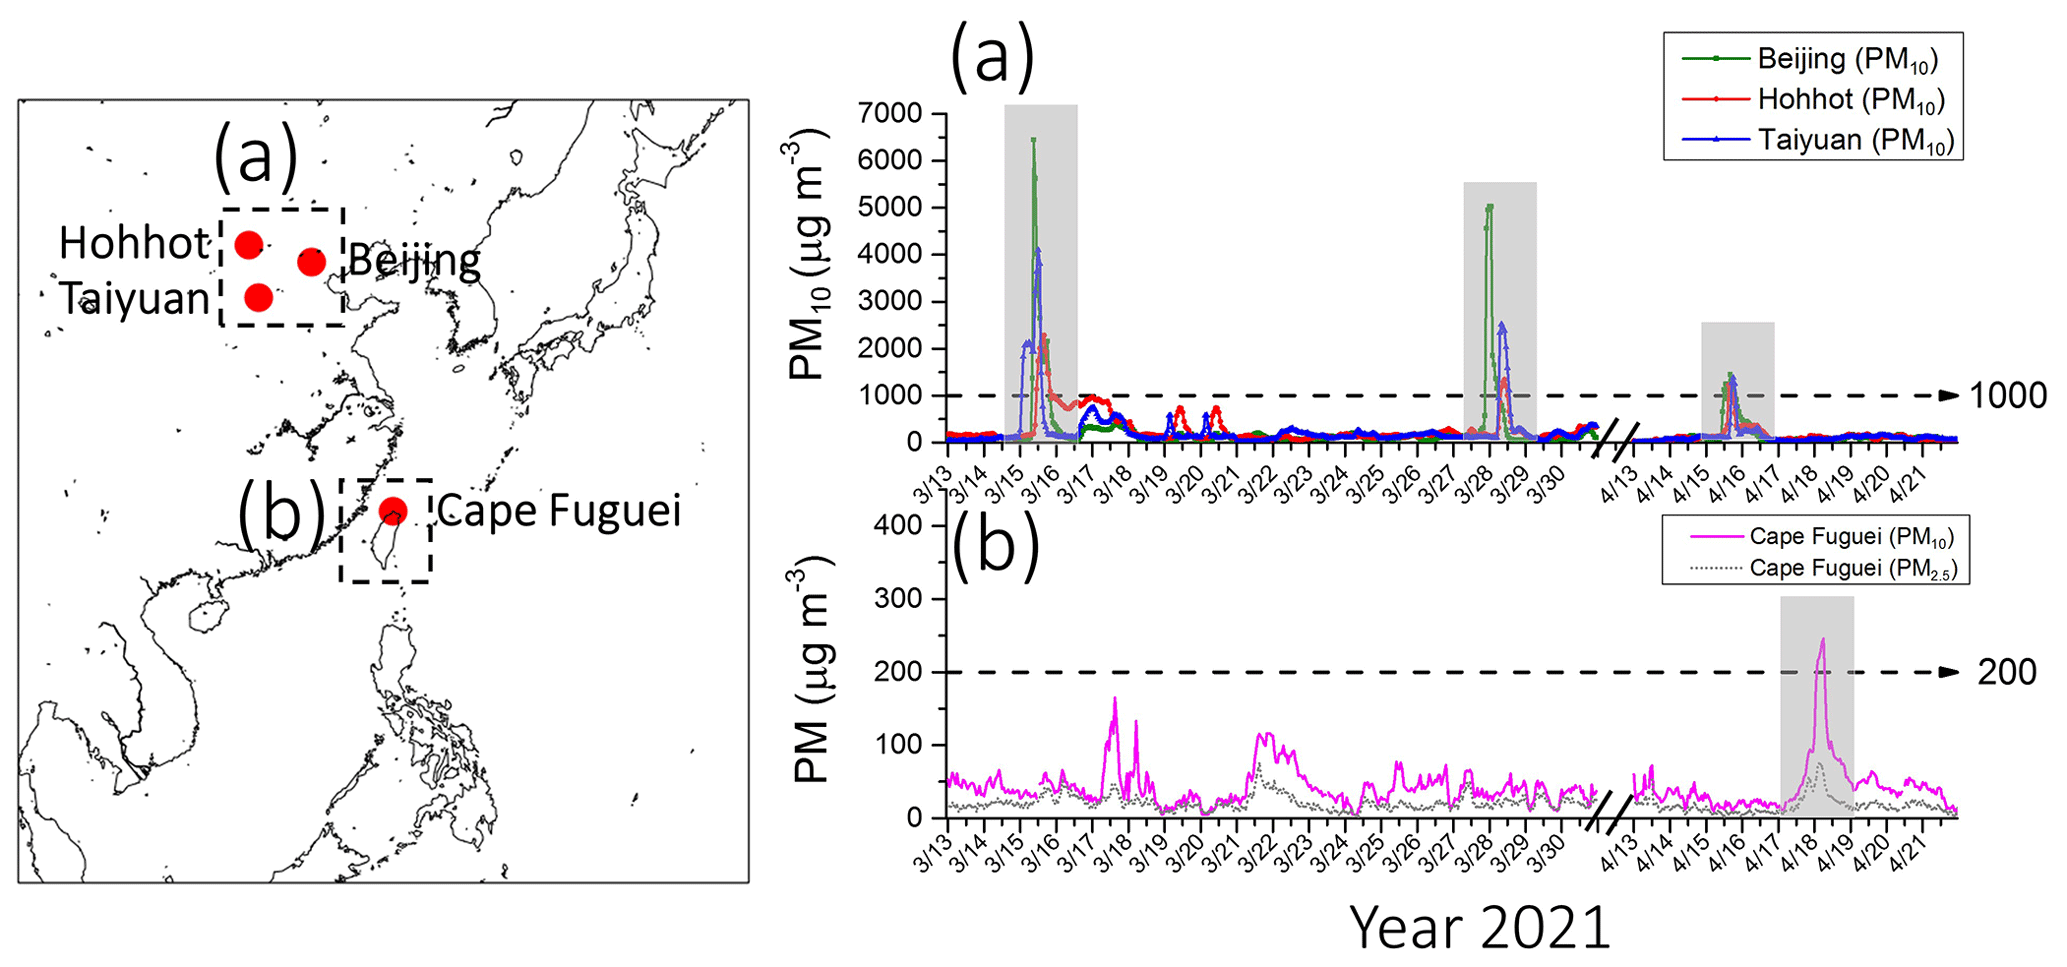
Figure 8Time series of the observed PM10 concentrations over the source region including (a) Beijing, Hohhot, and Taiyuan and the observed PM10 and PM2.5 at (b) Cape Fuguei during spring 2021.
3.4 Role of a typhoon in a dust storm event in April 2021
Several studies have discussed the multiple dust storms over China in the spring of 2021 and the associated dust emissions, transport and deposition, and radiative impact (Jin et al., 2022; Gui et al., 2022; He et al., 2022; Liang et al., 2022; Tang et al., 2022). However, these studies only analyzed the incident over the continental region. The SDS in transboundary areas, especially across the ocean marine boundary layer, has not been closely tracked. As shown in Fig. 8a, in the year 2021, three intensive dust storms occurred on 14–18 March, 27–30 March, and 15–17 April over China, which contained the primary dust source region in each event (https://www.aqistudy.cn/, last access: 18 January 2024). In the cities of northern China, including Beijing, Hohhot, and Taiyuan, the observed hourly PM10 concentrations vastly exceeded 1000 µg m−3. Figure 8b shows the PM10 and PM2.5 time series over Cape Fuguei (a background site in northern Taiwan) during the spring of 2021 (https://data.epa.gov.tw/, last access: 18 January 2024). Three PM10 peaks of 165, 116, and 246 µg m−3 were observed at 07:00 UTC on 17 March, 13:00 UTC on 22 March, and 22:00 UTC on 18 April 2021, respectively. According to the Hybrid Single-Particle Lagrangian Integrated Trajectory model (HYSPLIT) backward trajectory, the dust plumes arriving on 22 March and 18 April originated from the Gobi (Fig. S6). The event on 17 March was from southern Japan, passed through the marine boundary layer, and may have been due to local dust pollution from the local beach area. In other words, out of three significant East Asian dust storms, one reached Taiwan and caused air quality degradation over the region. The sudden increase in PM10 mass concentration that exceeded 200 µg m−3 indicated the high possibility of an SDS (Song et al., 2022).
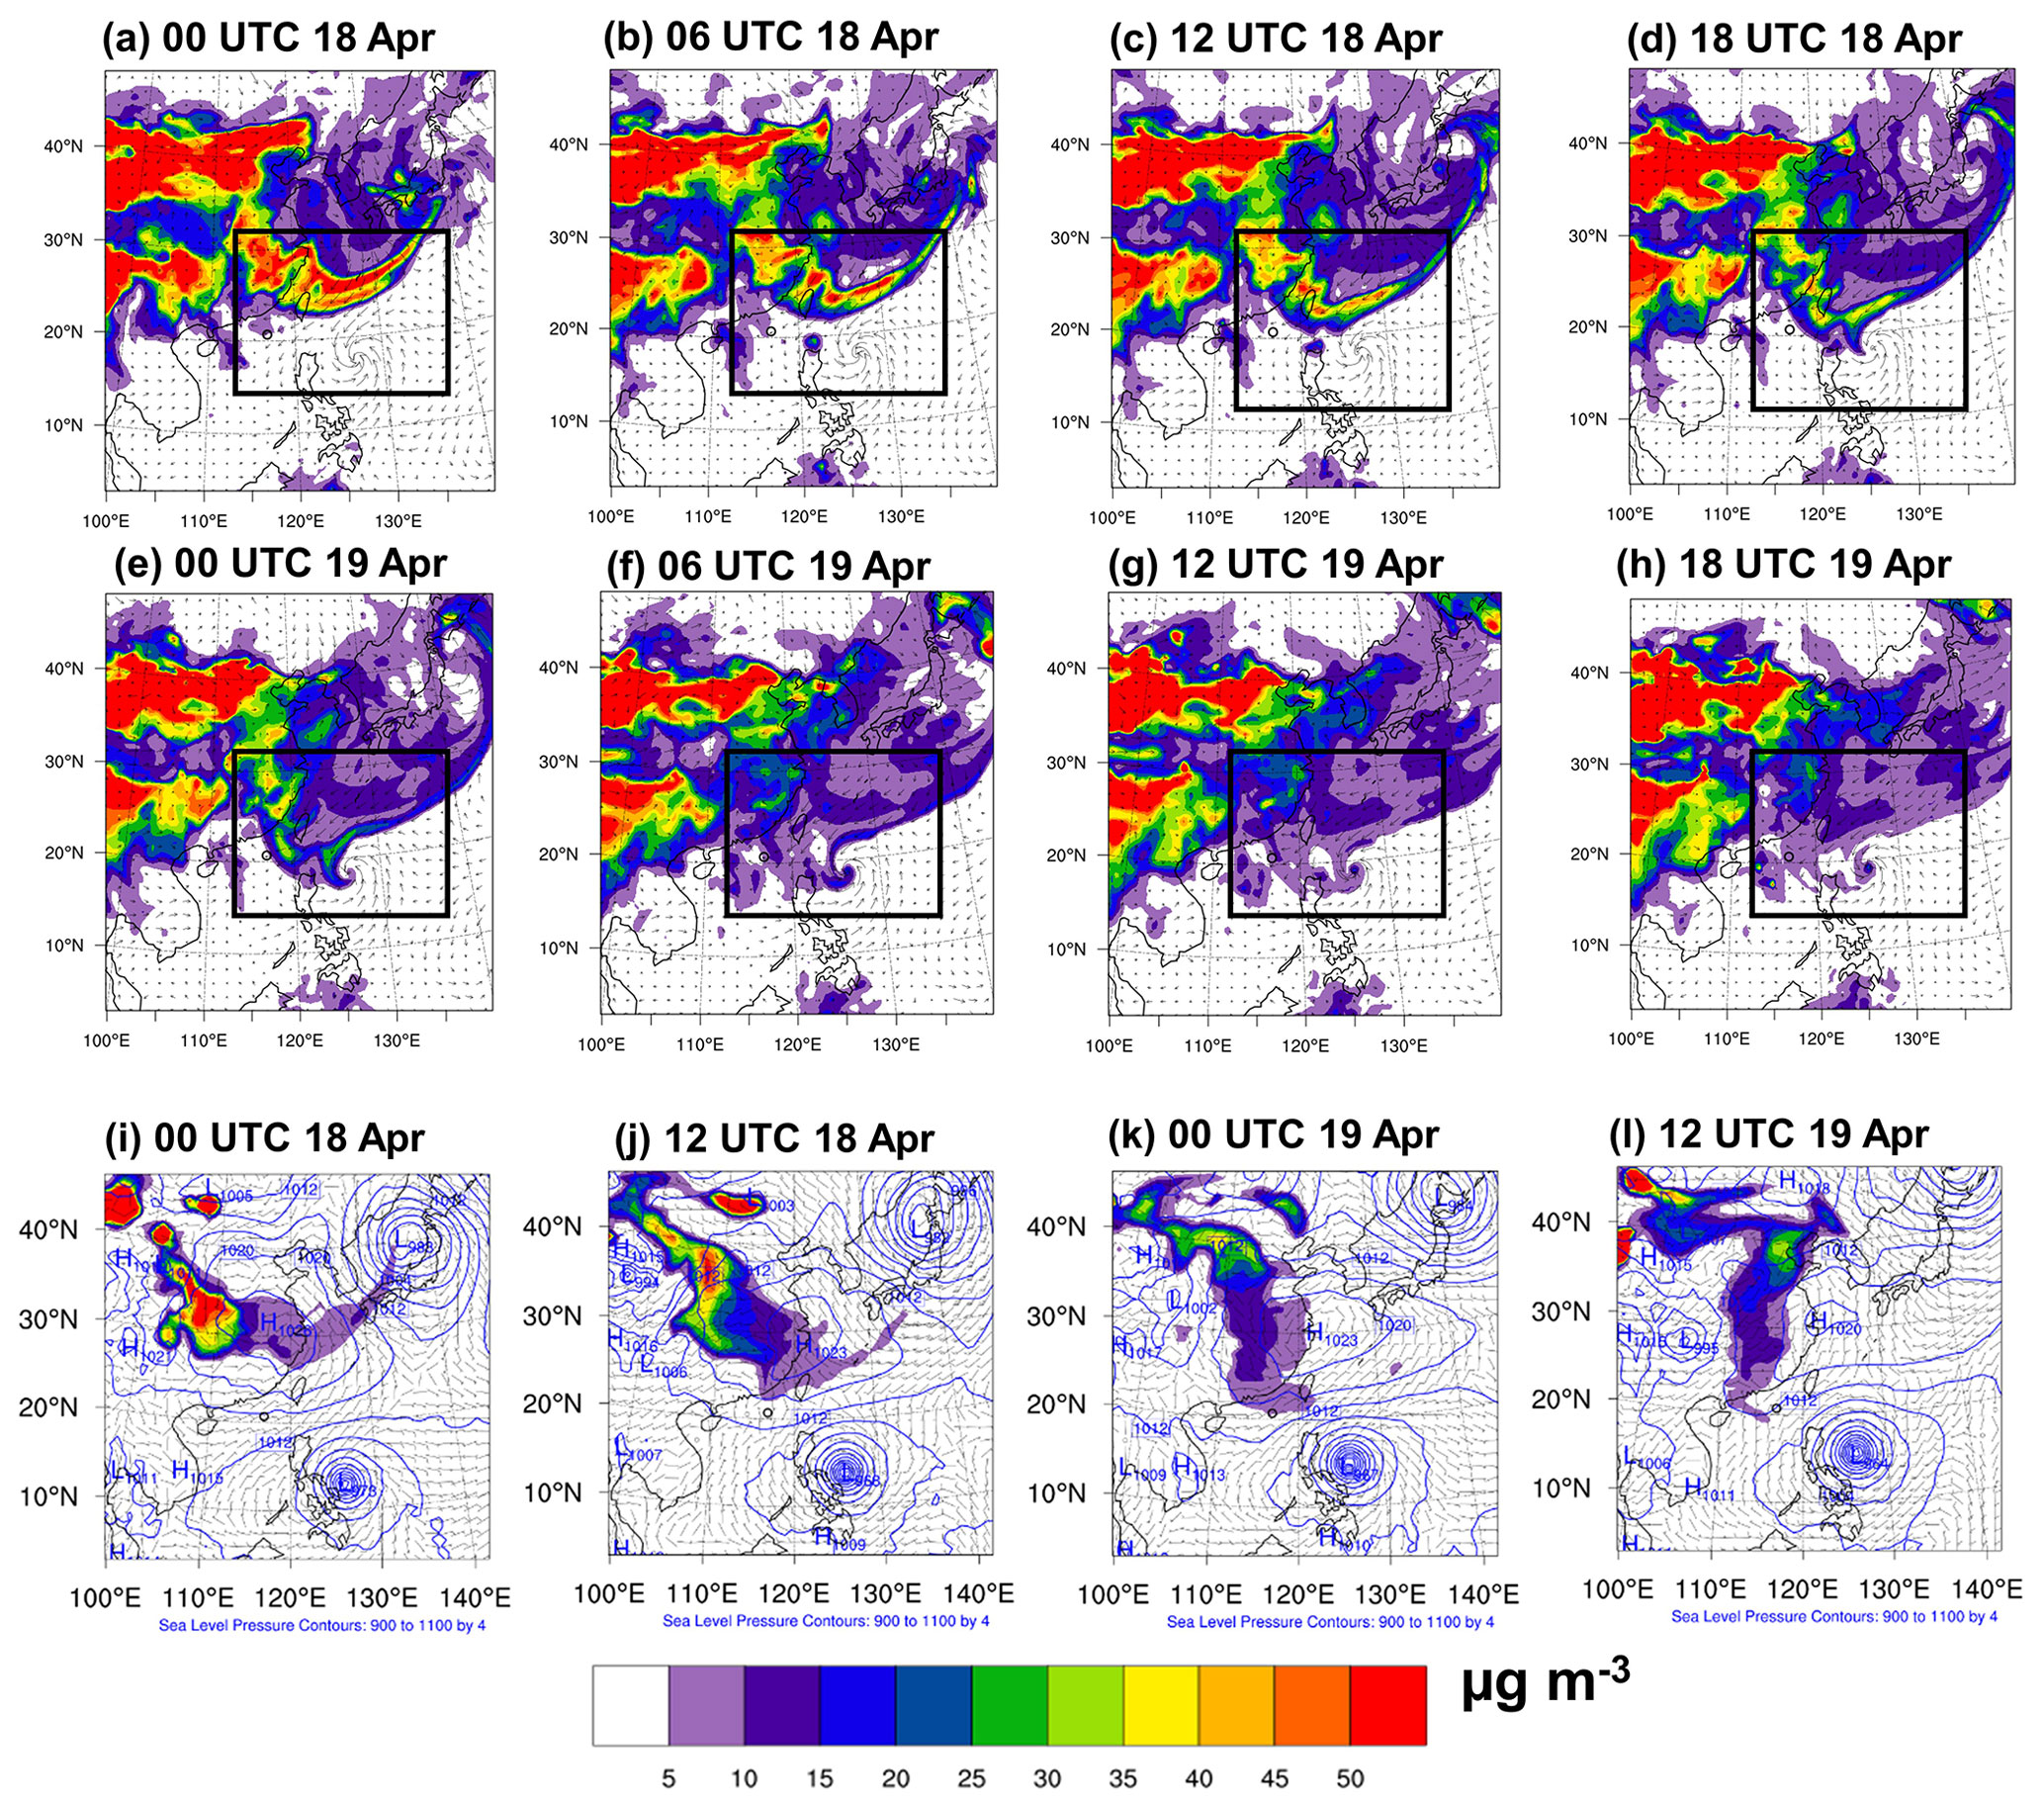
Figure 9Spatial distribution of the MERRA-2 surface dust mass concentrations over the western North Pacific Ocean (shown in the black rectangular box) at (a) 00:00 UTC on 18 April, (b) 06:00 UTC on 18 April, (c) 12:00 UTC on 18 April, (d) 18:00 UTC on 18 April, (e) 00:00 UTC on 19 April, (f) 06:00 UTC on 19 April, (g) 12:00 UTC on 19 April, and (h) 18:00 UTC on 19 April 2021. The CMAQ surface dust mass concentrations at (i) 00:00 UTC on 18 April, (j) 12:00 UTC on 18 April, (k) 00:00 UTC on 19 April, and (l) 12:00 UTC on 19 April 2021.
Figure S7 shows the spatial distribution of AOD at 550 nm over East Asia from MERRA-2 reanalysis data and CMAQ Dust_Refined_3 simulations. Generally, the model reproduced well the dust transport pattern shown by MERRA-2 reanalysis data during the dust event on 18 April. Figure 9 shows the spatial distribution of surface dust mass concentrations over East Asia on 18–19 April 2021. At 00:00 UTC on 18 April, the dust cloud arrived in Taiwan and approached the SCS. Meanwhile, Typhoon Surigae, located east of the Philippines, accelerated and pulled a significant amount (up to 50 µg m−3) of dust toward and into the typhoon's center (Fig. 9b–e). Eventually, the dust mass concentrations around the typhoon decreased (Fig. 9f–h), while another fraction of the dust plume passed through Taiwan and the Taiwan Strait and was transported further toward the SCS.
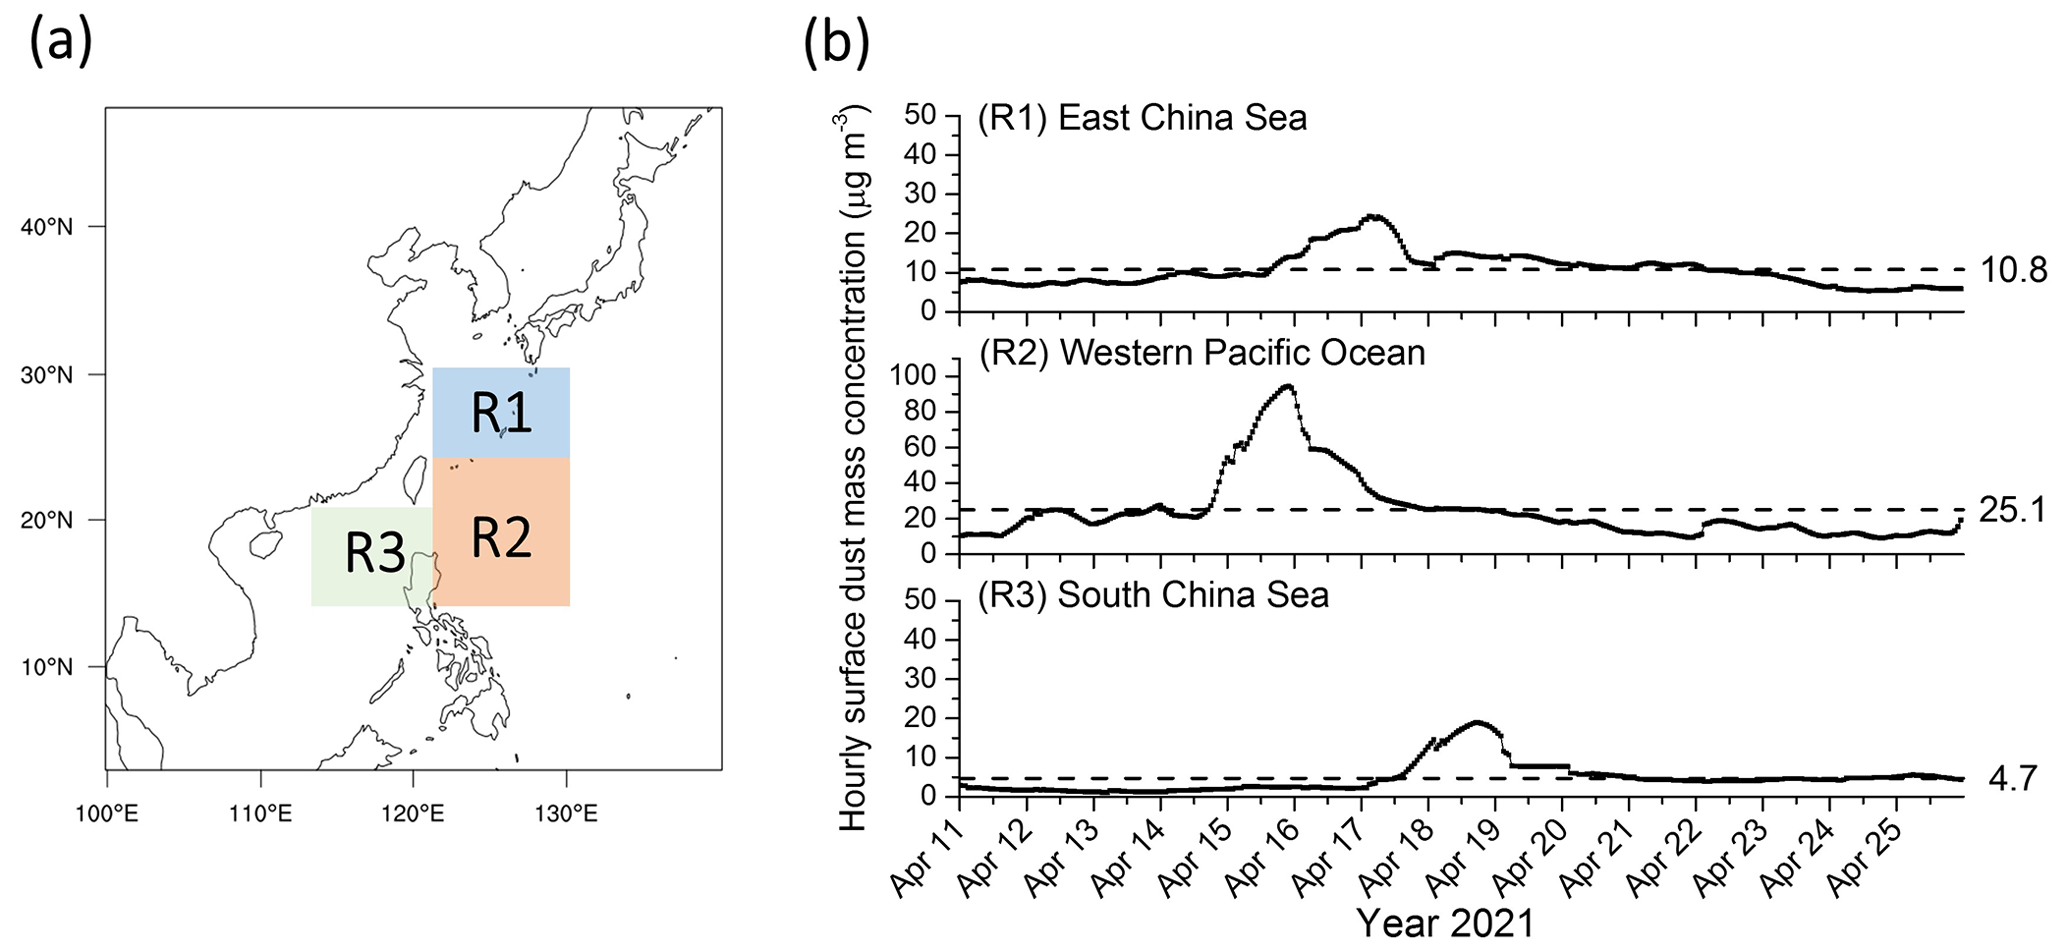
Figure 10MERRA-2 hourly averaged dust mass concentrations over (a) R1: East China Sea, R2: western Pacific Ocean, and R3: South China Sea during (b) 11–25 April 2021. The black dashed line indicates the mean of the dust mass concentration.
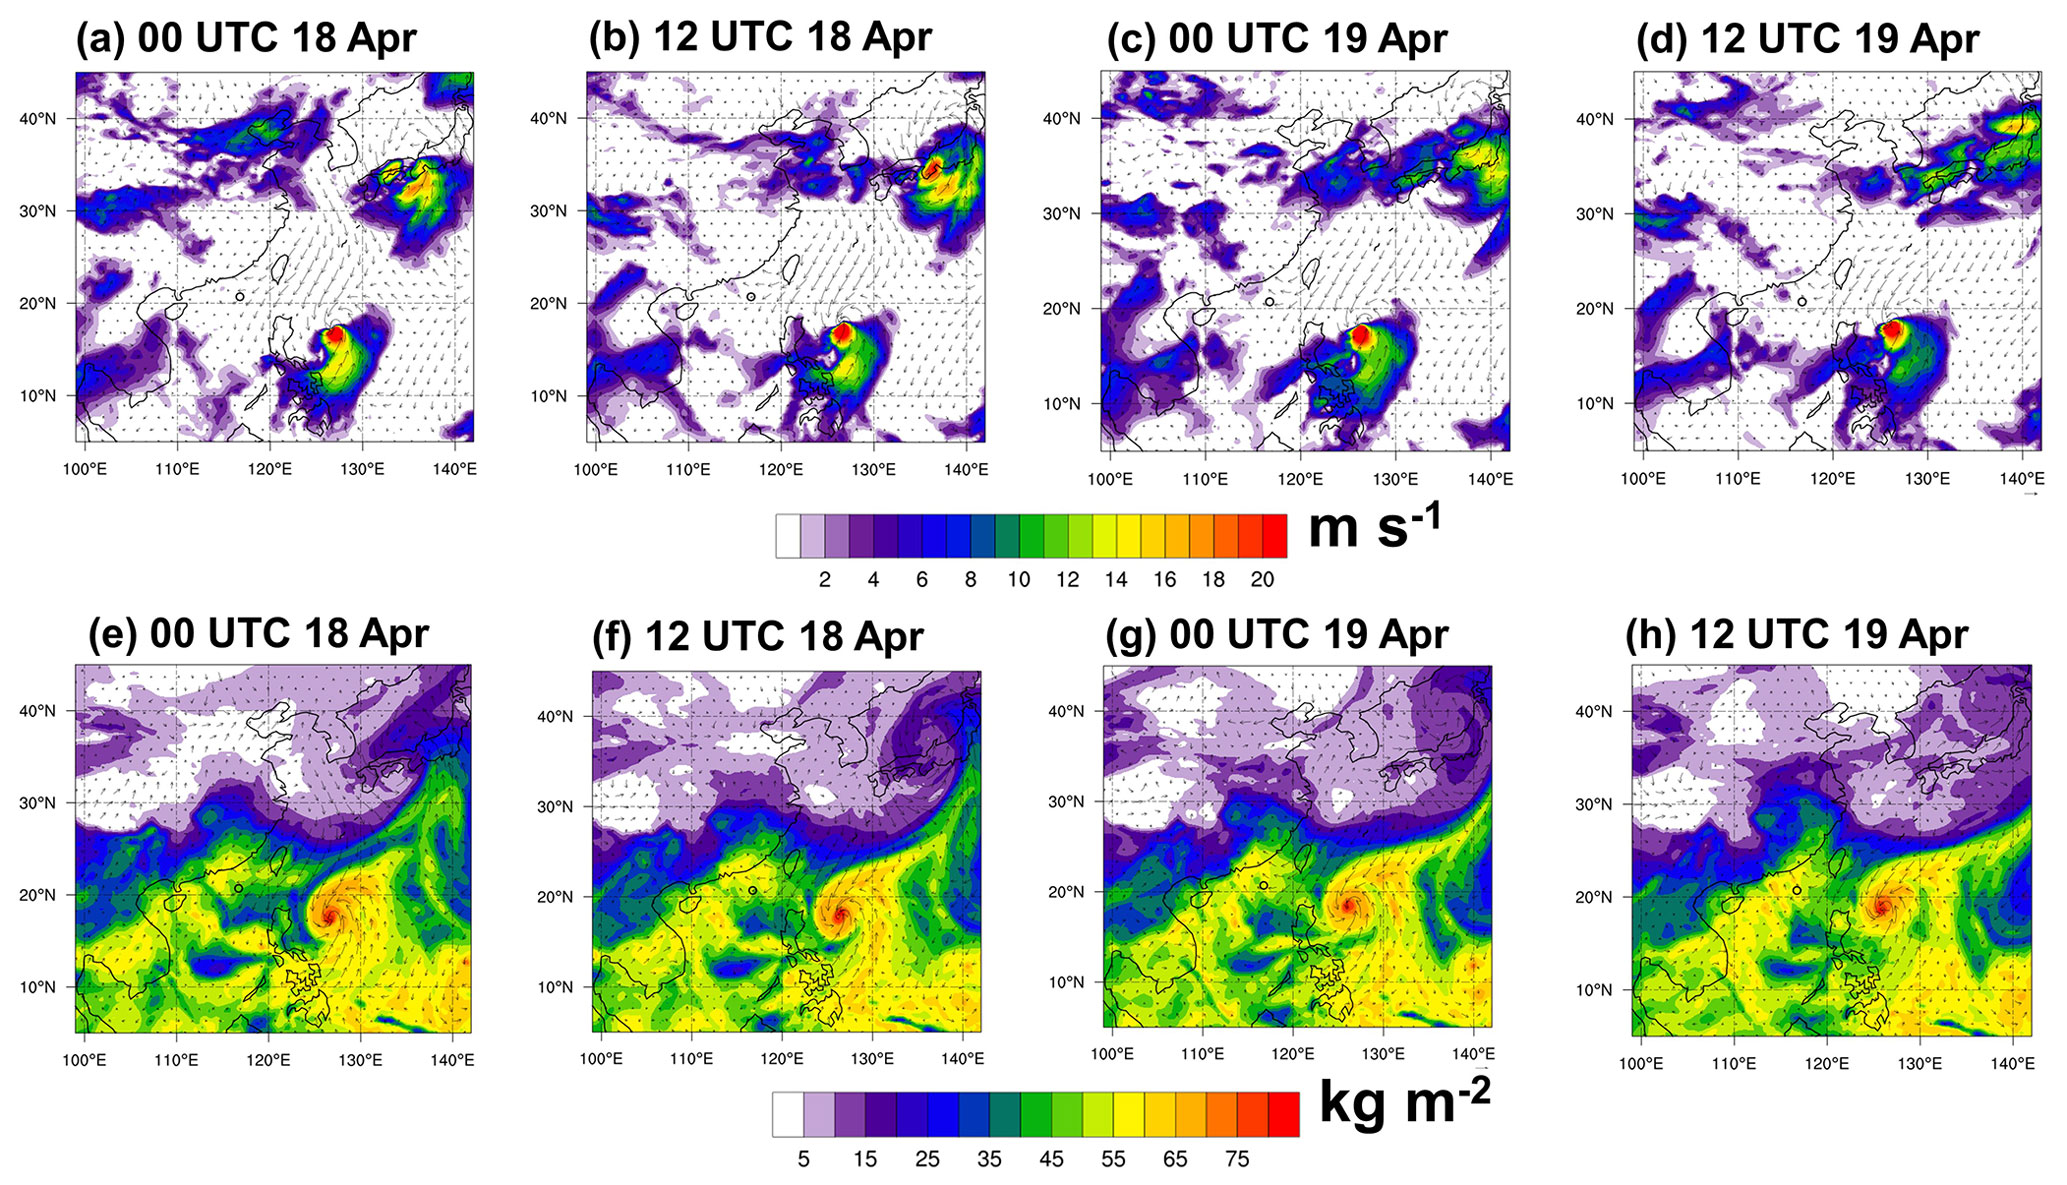
Figure 11Spatial distribution of the MERRA-2 (a–d) wind speed and (e–h) total precipitation water vapor at (a, e) 00:00 UTC on 18 April, (b, f) 12:00 UTC on 19 April, (c, g) 00:00 UTC on 19 April, and (d, h) 12:00 UTC on 19 April 2021.
The influence of the typhoon system on the dust aerosol can be further quantified by comparing the MERRA-2 hourly averaged dust mass concentration over the ECS, western Pacific Ocean (WPO), and SCS (Fig. 10). The difference between the maximum values and the mean averaged (11–25 April 2021) dust mass concentrations was highest over the WPO (69.2 µg m−3) compared to the ECS and SCS (13.6 and 14.2 µg m−3), indicating remarkable dust removal by the typhoon. The peripheral circulation on the southern side of the typhoon played a role in directing dust aerosol toward the WPO and away from the ECS and SCS (Fig. 11a–d). This situation was due to the extreme wind speed and the cyclonic rotation of the typhoon. The total precipitable water vapor shown by MERRA-2 was intense around the eye of the typhoon, and the dust aerosol was shown to be washed out as it passed through this area of the typhoon (Fig. 11e–h). Moreover, the intensity of the total precipitation was associated with the dust pattern (Li et al., 2011; Kong et al., 2021), as areas with more precipitation (i.e., near the center) also contained lower dust concentrations (Fig. 9d and e).
As a result, the abnormal transport pattern can be attributed to the high-pressure system in mainland China pushing the dust aerosol toward the downwind region (Chuang et al., 2008; Kong et al., 2021), while the typhoon system over the western Pacific Ocean accelerated transport of the dust plume southward (Fig. 9i). CMAQ captured quite well the long-range transport of dust toward the SCS and Dongsha, where the plume passed through the Taiwan Strait (Fig. 9j–l). However, no dust aerosol was found over the western Pacific Ocean, and the redirection of the dust plume by the typhoon, as illustrated by the MERRA-2 data, was not reproduced by the model.
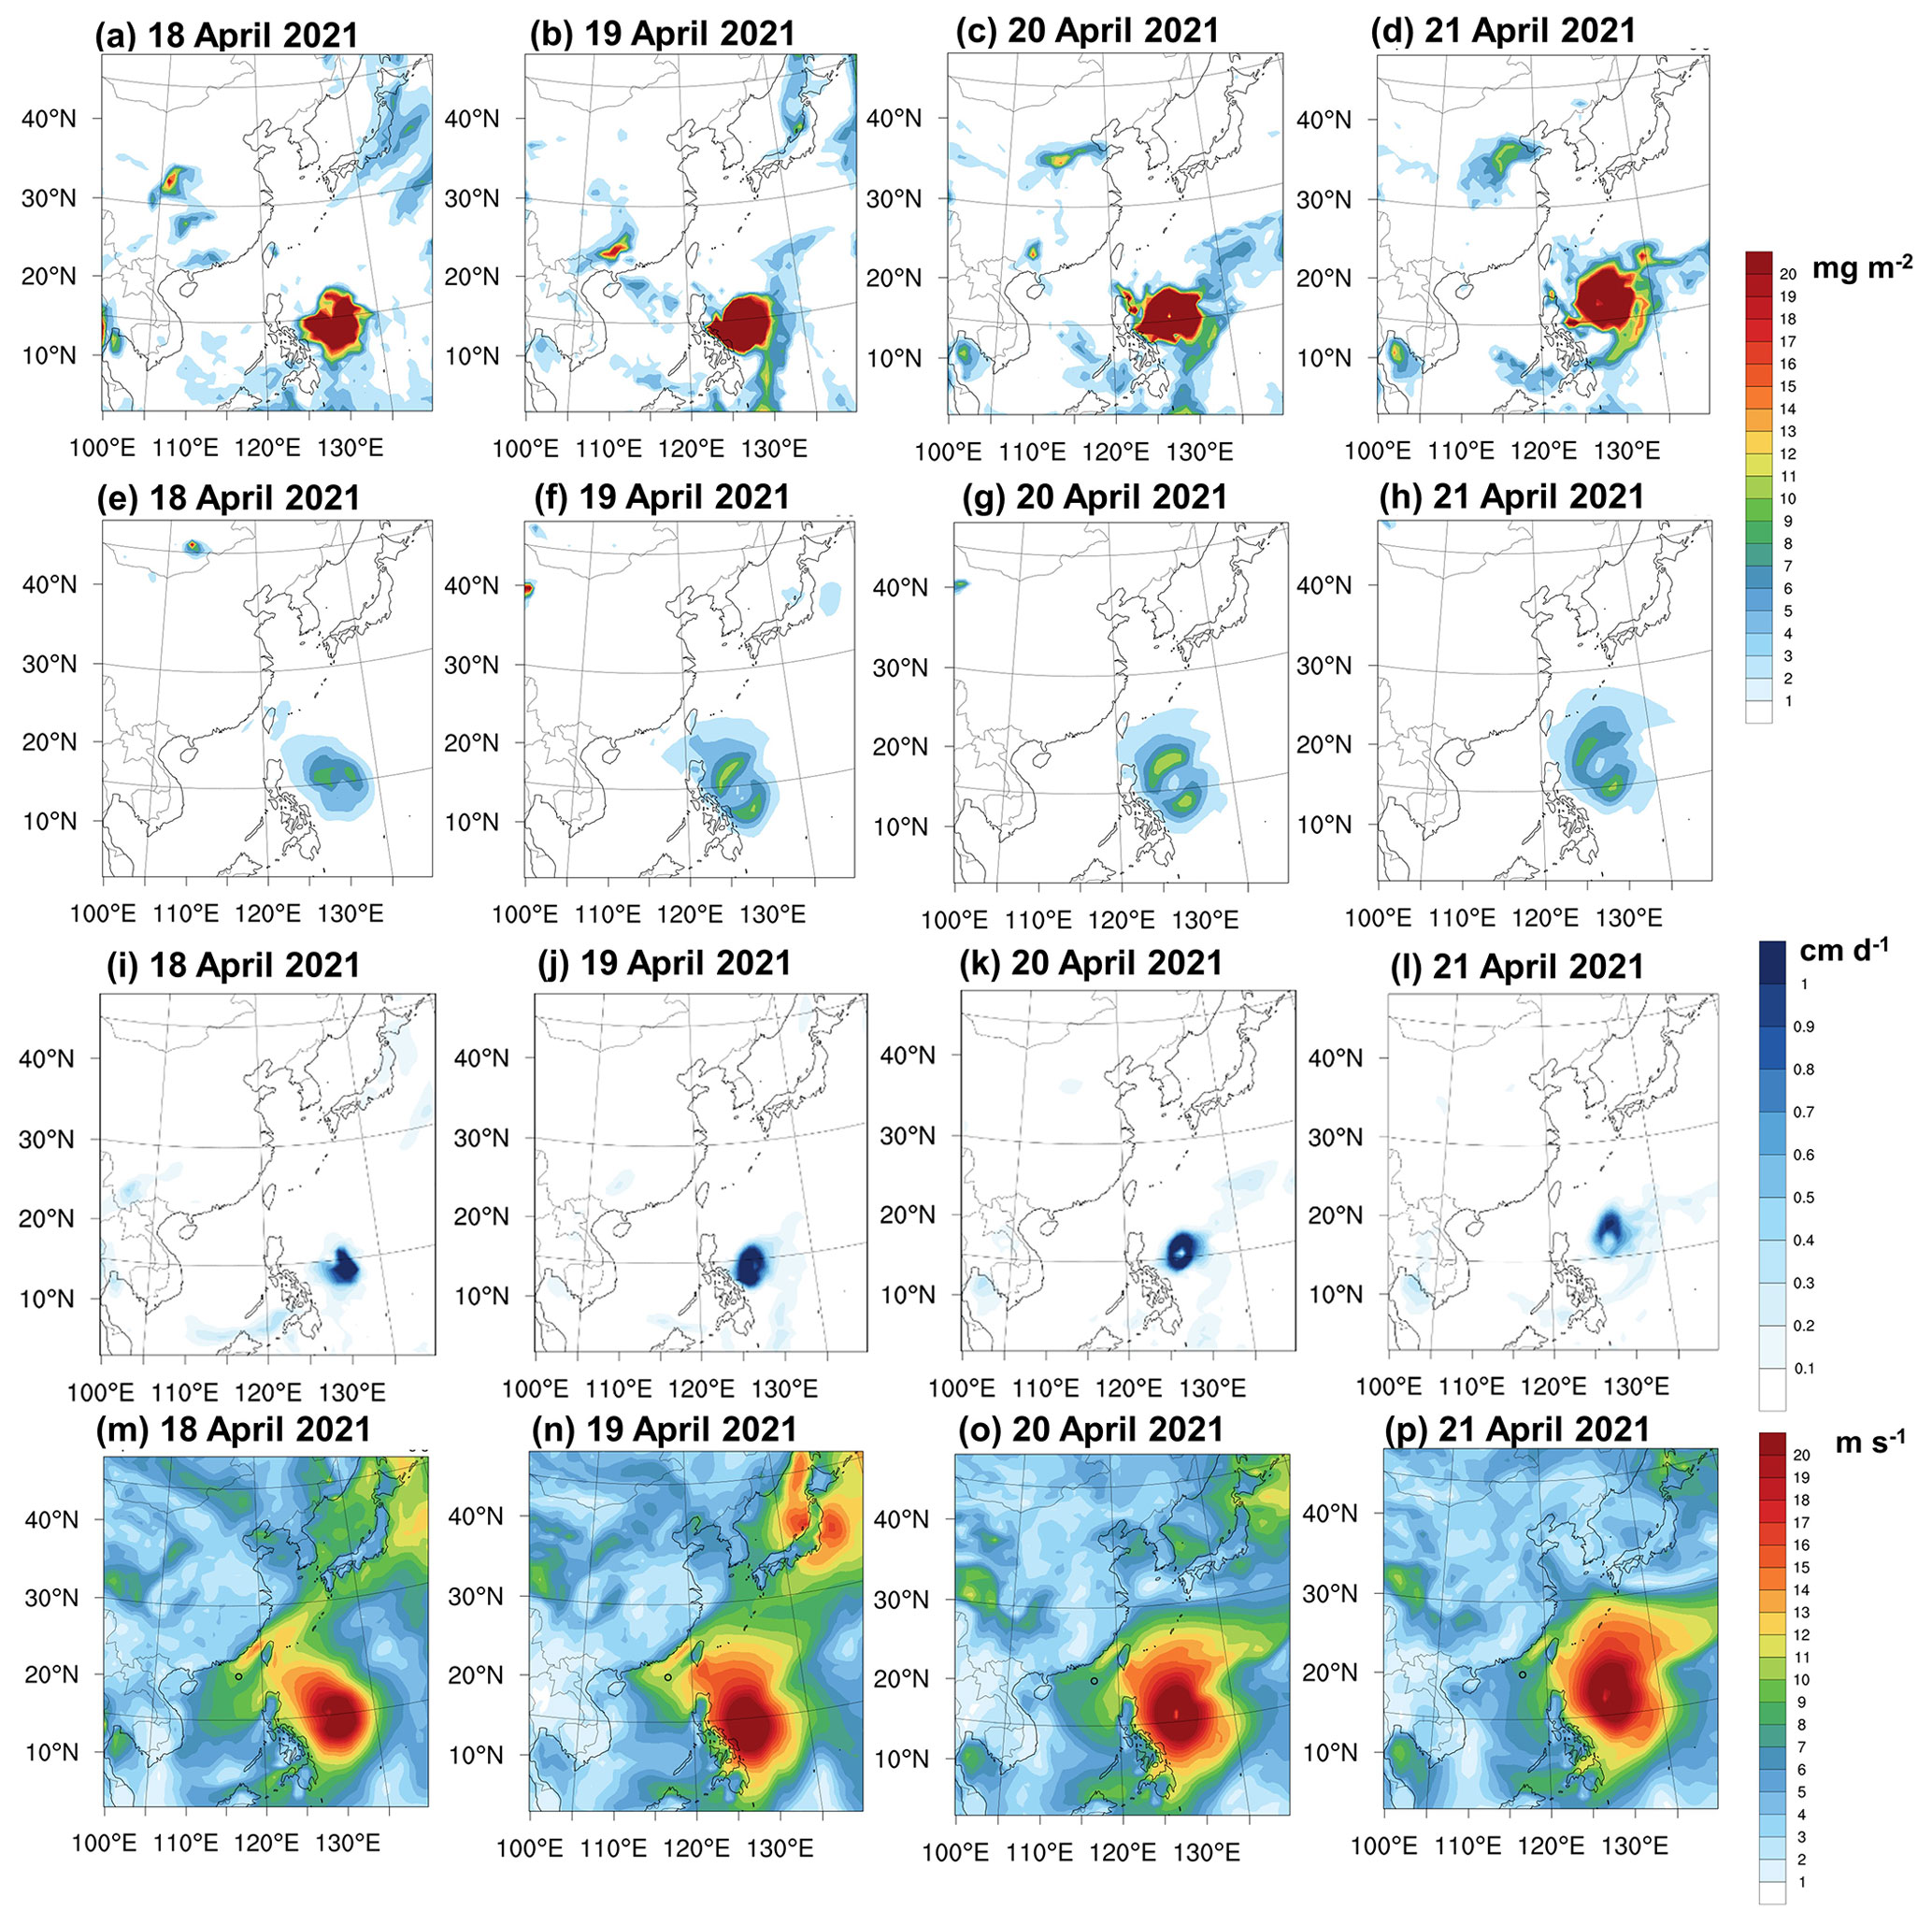
Figure 12Spatial distribution of the simulated (a–d) wet deposition, (e–h) dry deposition, (i–l) average daily precipitation, and (m–p) daily mean wind speed on (a, e, i, m) 18 April, (b, f, j, n) 19 April, (c, g, k, o) 20 April, and (d, h, i, p) 21 April 2021.
Figure 12a–d show the CMAQ daily dust wet deposition over East Asia, where a cluster of wet deposition was heavily distributed over the eastern Philippines. This large deposition flux could be related to the heavy rainfall from the typhoon (Fig. 12i–l). Also, a similar pattern was found for the dry deposition over the region but with less intensity compared to the wet deposition (Fig. 12e–h). Nevertheless, the dry deposition was spread widely over the western Pacific Ocean, consistent with the daily mean wind speed over the region (Fig. 12m–p). Hence, the low dust concentration (< 5 µg m−3) over the WPO as predicted by CMAQ may have been driven by dry deposition associated with the extreme wind speed triggered by the typhoon system.
Tropical cyclones (typhoons or hurricanes) normally occur over the WPO during the summer and fall seasons and tend to impact air quality and enhance the rainfall over the region (Lin et al., 2011, 2021; Lam et al., 2018). Typhoons have been shown to increase aerosols over central Taiwan and create strong easterly flow, causing stable weather conditions and weak wind speeds on the lee side of the CMR, i.e., in western Taiwan (Lin et al., 2021). The present study highlights the ability of a typhoon to remove dust aerosol that has been transported thousands of kilometers from northwestern China. This enhanced wet deposition flux is consistent with Kong et al. (2021), who showed the influence of a rainfall belt for increasing dust deposition over the ECS.
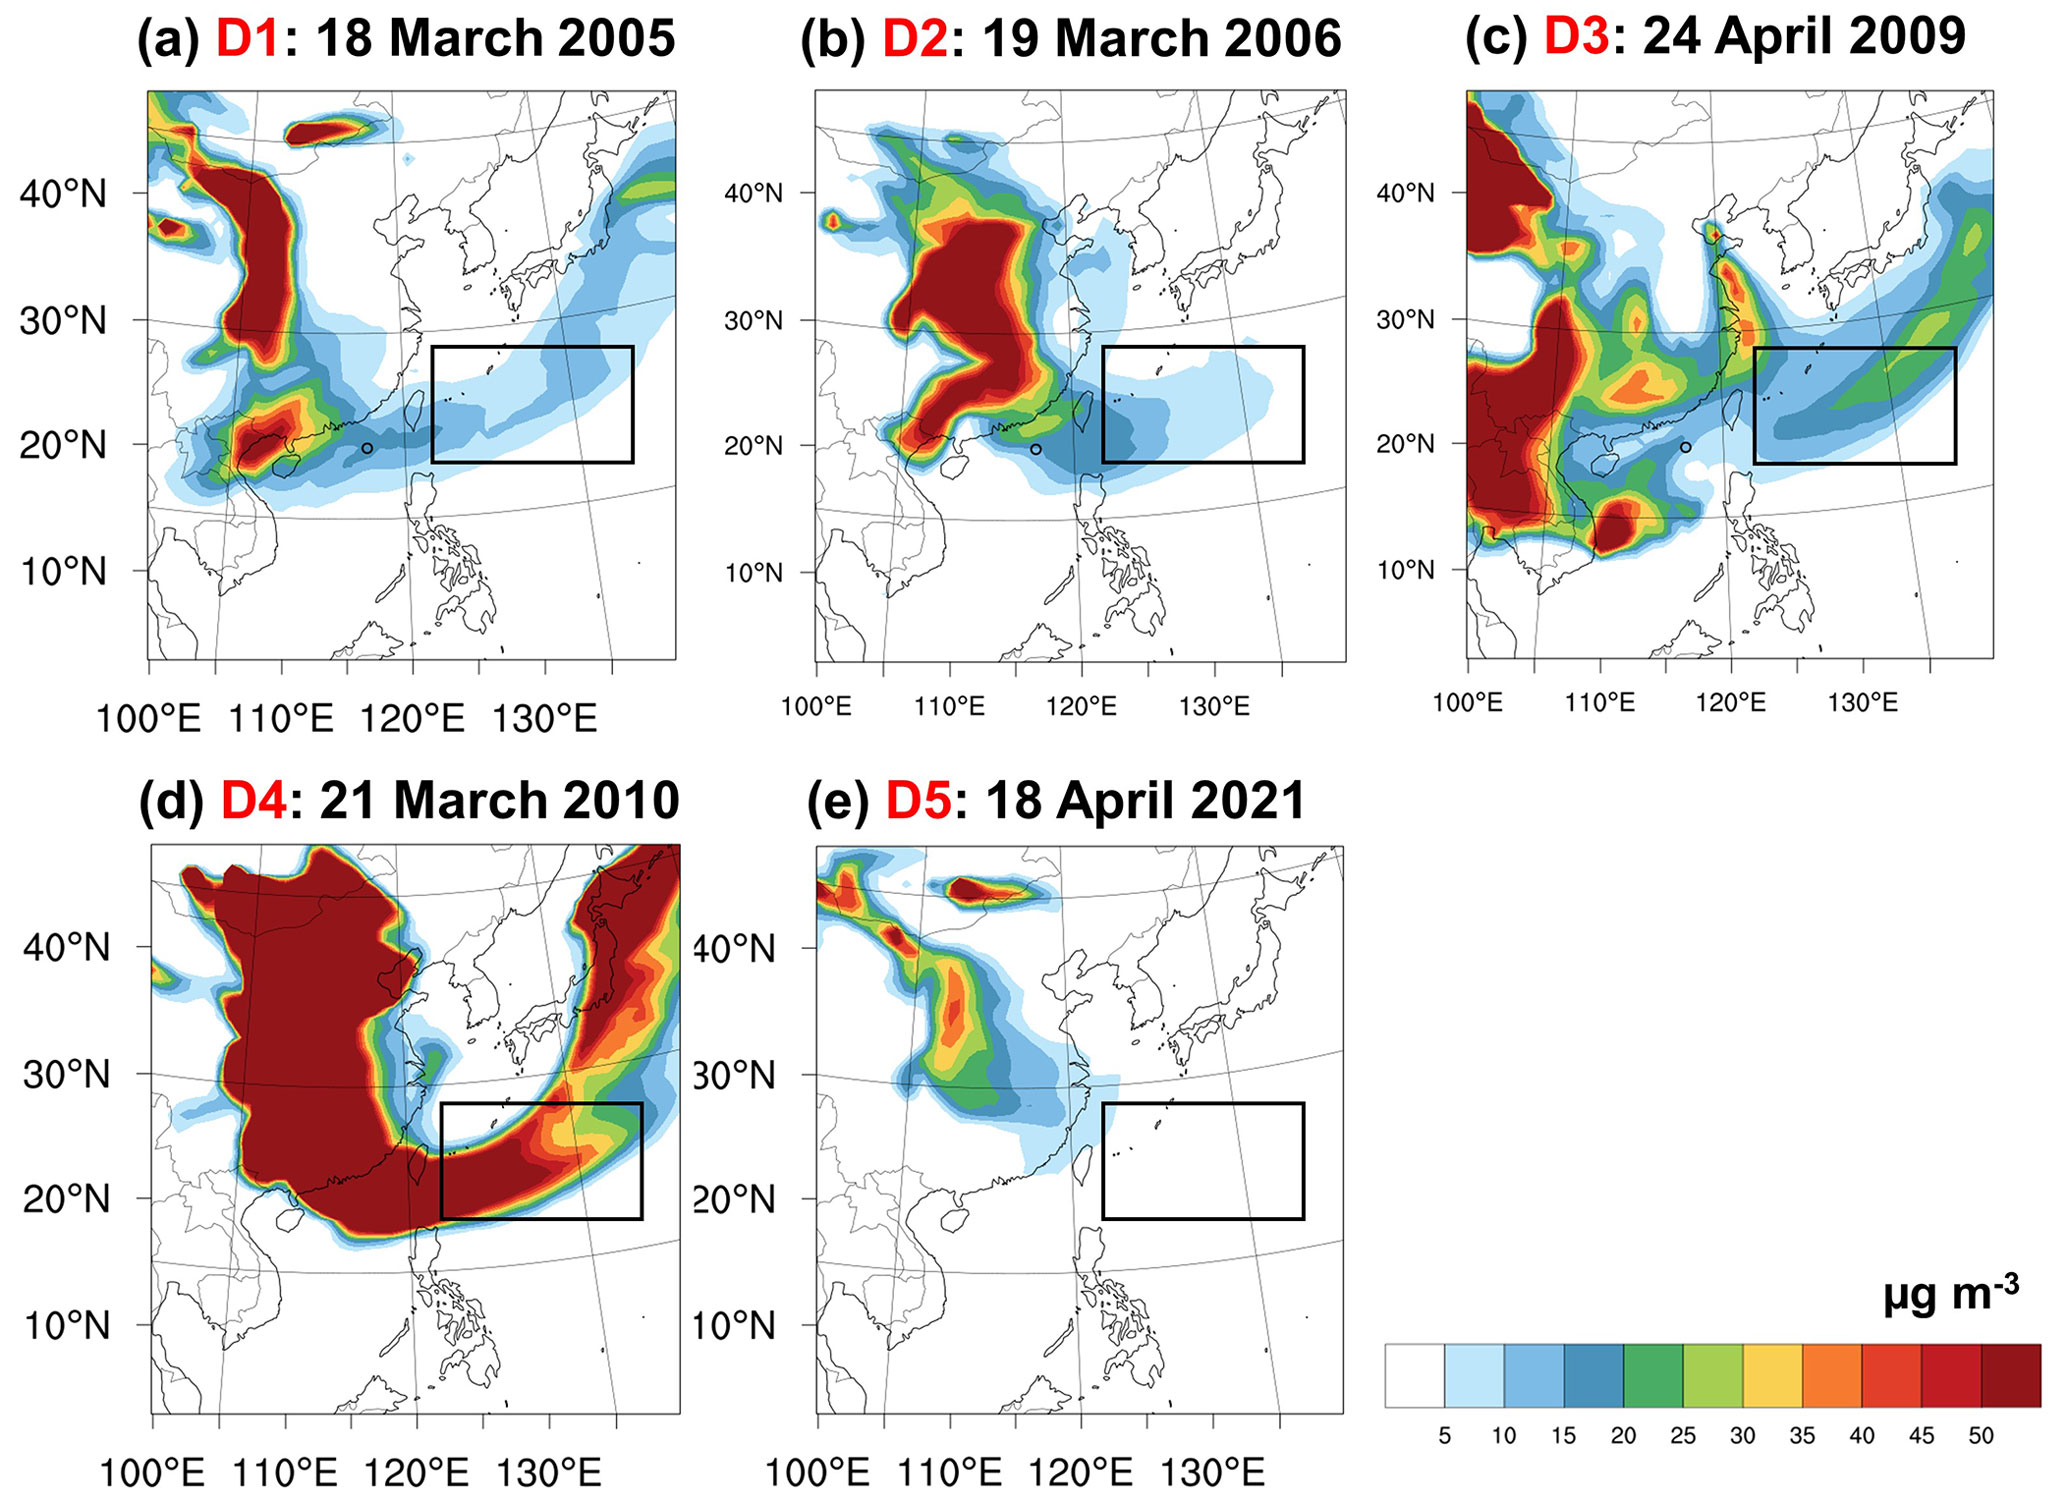
Figure 13Simulated daily mean surface dust mass concentrations for (a) D1: 18 March 2005, (b) D2: 19 March 2006, (c) D3: 24 April 2009, (d) D4: 21 March 2010, and (e) D5: 18 March 2021.
The daily mean surface dust mass concentrations on 18 March 2005 (D1), 19 March 2006 (D2), 24 April 2009 (D3), 21 March 2010 (D4), and 18 April 2021 (D5) are displayed in Fig. 13. Episode D4 was a more intense dust plume compared to D1, D2, D3, and D5, as D4 was the SDS, while the other episodes were just the regular dust storm (Wang et al., 2012; Wang et al., 2021). Episodes D1–D4 revealed a common or typical dust transport pattern with the initial dust arrival at the ECS and then the Taiwan Strait and WPO. However, in episode D5, the dust plume was only distributed over the ECS and Taiwan Strait, and near-zero dust concentration was observed over the WPO. Hence, we revealed the influence of a typhoon on dust transport patterns over East Asia and highlighted the associated excessive rainfall as an extraordinary, albeit irregular, removal mechanism over the WPO. As a result of this variable transport pattern, the accuracy of the dust model in simulating the dust event encountered a large degree of uncertainty, which is compounded by uncertainties in the dust emission scheme and dust removal process (Kong et al., 2021; He et al., 2022). For instance, dust emission in the source region can vary due to the different calibration methods, showing that the use of the dust scheme is not straightforward, and extensive testing should be carried out in order to achieve a better model performance. As the improved NMB with the refined dust simulation still shows a degree of model underestimation, a calibration process to resolve the aerosol removal mechanism may be the most impactful in closing this gap. Moreover, over the downwind region, the specific meteorological situation including the wind speed, rainfall distribution, and extreme weather pattern could impact the transport pattern and further influence the dust model precision.
Dust storm outbreaks in East Asia are an irregular occurrence but can rapidly deteriorate air quality over a wide swath of the continent, causing severe health and environmental problems. Long-range transport of East Asian dust to the South China Sea and the source emission, transport pattern, and deposition that facilitate these episodes have been largely overlooked. In this study, we combined ground observations from the 7-SEAS Dongsha Experiment, MERRA-2 reanalysis, and MODIS satellite images for evaluation and improvement of the CMAQ dust model for the cases of EAD reaching the Taiwan region, including Dongsha in the northern South China Sea.
We improved the dust treatment in the CMAQ model by implementing a refined aerosol profile, the soil moisture fraction (Kong et al., 2021), and the bulk density of different soil types (Liu et al., 2021). Based on the latest refined dust model, we simulated the long-range transport of a super dust storm (SDS) on 18–24 March 2010 and several significant dust storm events on 17–19 March 2005, 18–20 March 2006, 25–27 April 2009, and 15–21 April 2021, and we detailed their respective transport mechanisms. For the 2010 March SDS, our model suggested that the dust simulation over Taiwan and Dongsha was optimized with the dust scheme considering all the calibration methods, which is Dust_Refined_3 that provided the best NMB (−30.65 %) compared to the calibration recommended by Kong et al. (2021) (−41.18 %) and Liu et al. (2021) (−49.88 %). The SDS transport mechanism over Dongsha in the South China Sea was influenced by the CMR in Taiwan. A “double-plume” effect was proposed; i.e., the dust plume split, with a portion passing through the Taiwan Strait (western side of the CMR) and the other through the western Pacific Ocean region (eastern side of the CMR). Also, the Dust_Refined_3 treatment provided an optimized AOD simulation value for the significant dust cases in March 2005, March 2006, April 2009, and March 2010.
In spring 2021, multiple East Asian dust storms occurred over the region after a period of relative infrequency of nearly 12 years. One episode reached northern Taiwan and deteriorated the ambient air quality, resulting in a maximum PM10 concentration of 246 µg m−3. In contrast to previous dust episodes that have reached the Taiwan region, both the satellite dataset and the model result illustrated a “double synoptic pattern” driven by a high-pressure system over the continent and a typhoon system in the western Pacific Ocean. The dust plume was pushed by the high-pressure system toward Taiwan and at the same time by Typhoon Surigae, resulting in the dust cloud splitting and a portion drawn in by the typhoon circulation toward its center. This unique mechanism appeared to be accompanied by increased dry or wet deposition of the dust particles over the WPO.
MERRA-2 data are available online through the NASA Goddard Earth Sciences Data Information Services Center (GES DISC; https://disc.gsfc.nasa.gov, Gelaro et al., 2017). MODIS data used in this study are available at https://doi.org/10.5067/MODIS/MYD08_M3.006 (Platnick et al., 2015). The GPM dataset was downloaded from GIOVANNI's official website at https://doi.org/10.5067/GPM/IMERGDF/DAY/07 (Huffman et al., 2023). The observational data at Dongsha can be ordered by contacting the corresponding authors.
The supplement related to this article is available online at: https://doi.org/10.5194/acp-24-1041-2024-supplement.
SSKK: conceptualization; data curation; formal analysis; investigation; methodology; software; validation; visualization; writing – original draft; writing – review and editing. SRB: conceptualization; investigation; methodology; formal analysis; writing – review and editing. SHW: formal analysis; data curation. SMG: writing – review and editing. JHWC: data curation and software. MTC: data curation. GRS: funding acquisition; resources. NHL: conceptualization; visualization; supervision; funding acquisition; resources; writing – review and editing.
The contact author has declared that none of the authors has any competing interests.
Publisher's note: Copernicus Publications remains neutral with regard to jurisdictional claims made in the text, published maps, institutional affiliations, or any other geographical representation in this paper. While Copernicus Publications makes every effort to include appropriate place names, the final responsibility lies with the authors.
We acknowledge the staff at Dongsha and EPA Taiwan for the provision of the ground-based measurement datasets. We are also thankful to MERRA-2 and MODIS for the satellite product.
This research has been supported by the Ministry of Science and Technology, Taiwan (grant no. NSTC111-2811-M-008-069).
This paper was edited by N'Datchoh Evelyne Touré and reviewed by Ian Chang and one anonymous referee.
Appel, K. W., Pouliot, G. A., Simon, H., Sarwar, G., Pye, H. O. T., Napelenok, S. L., Akhtar, F., and Roselle, S. J.: Evaluation of dust and trace metal estimates from the Community Multiscale Air Quality (CMAQ) model version 5.0, Geosci. Model Dev., 6, 883–899, https://doi.org/10.5194/gmd-6-883-2013, 2013.
Bian, H., Tie, X., Cao, J., Ying, Z., Han, S., and Xue, Y.: Analysis of a severe dust storm event over China: Application of the WRF-dust model, Aerosol Air Qual. Res., 11, 419–428, https://doi.org/10.4209/aaqr.2011.04.0053, 2011.
Chen, C., Mao, Z., Tang, F., Han, G., and Jiang, Y.: Declining riverine sediment input impact on spring phytoplankton bloom off the Yangtze River Estuary from 17-year satellite observation, Cont. Shelf Res., 135, 86–91, https://doi.org/10.1016/j.csr.2017.01.012, 2017.
Chen, S., Huang, J., Kang, L., Wang, H., Ma, X., He, Y., Yuan, T., Yang, B., Huang, Z., and Zhang, G.: Emission, transport, and radiative effects of mineral dust from the Taklimakan and Gobi deserts: comparison of measurements and model results, Atmos. Chem. Phys., 17, 2401–2421, https://doi.org/10.5194/acp-17-2401-2017, 2017.
Chien, F.-C. and Kuo, Y.-H.: Topographic Effects on a Wintertime Cold Front in Taiwan, Mon. Weather Rev., 134, 3297–3316, https://doi.org/10.1175/mwr3255.1, 2006.
Chow, K. C., Su, L., Fung, J. C. H., Ma, H., and Lau, A. K. H.: Numerical modeling of a strong dust event over the south China region in March 2010, Meteorol. Atmos. Phys., 126, 119–138, https://doi.org/10.1007/s00703-014-0338-0, 2014.
Chuang, M. T., Fu, J. S., Jang, C. J., Chan, C. C., Ni, P. C., and Lee, C. T.: Simulation of long-range transport aerosols from the Asian Continent to Taiwan by a Southward Asian high-pressure system, Sci. Total. Environ., 406, 168–179, https://doi.org/10.1016/j.scitotenv.2008.07.003, 2008.
Dong, X., Fu, J. S., Huang, K., Tong, D., and Zhuang, G.: Model development of dust emission and heterogeneous chemistry within the Community Multiscale Air Quality modeling system and its application over East Asia, Atmos. Chem. Phys., 16, 8157–8180, https://doi.org/10.5194/acp-16-8157-2016, 2016.
Dong, X., Fu, J. S., Huang, K., Zhu, Q., and Tipton, M.: Regional Climate Effects of Biomass Burning and Dust in East Asia: Evidence From Modeling and Observation, Geophys. Res. Lett., 46, 11490–11499, https://doi.org/10.1029/2019GL083894, 2019.
Duce, R. A., Liss, P. S., Merrill, J. T., Atlas, E. L., BuatMenard, P., Hicks, B. B., Miller, J. M., Prospero, J. M., Arimoto, R., Church, T. M., Ellis, W., Galloway, J. N., Hansen, L., Jickells, T. D., Knap, A. H., Reinhardt, K. H., Schneider, B., Soudine, A., Tokos, J. J., Tsunogai, S., Wollast, R., and Zhou, M.: The atmospheric input of trace species to the world ocean, Global Biogeochem. Cy., 5, 193–259, https://doi.org/10.1029/91GB01778, 1991.
Emery, C., Tai, E., and Yarwood, G.: Enhanced meteorological modeling and performance evaluation for two Texas ozone episodes, Prepared for the Texas Natural Resource Conservation Commission, Prepared by ENVIRON International Corp, Novato, CA, 2001.
Foroutan, H., Young, J., Napelenok, S., Ran, L., Appel, K. W., Gilliam, R. C., and Pleim, J. E.: Development and evaluation of a physics-based wind blown dust emission scheme implemented in the CMAQ modelling system, J. Adv. Model. Earth Sy., 9, 585–608, https://doi.org/10.1002/2016MS000823, 2017.
Gelaro, R., McCarty, W., Suárez, M. J., Todling, R., Molod, A., Takacs, L., Randles, C. A., Darmenov, A., Bosilovich, M. G., Reichle, R., Wargan, K., Coy, L., Cullather, R., Draper, C., Akella, S., Buchard, V., Conaty, A., da Silva, A. M., Gu, W., Kim, G. K., Koster, R., Lucchesi, R., Merkova, D., Nielsen, J. E., Partyka, G., Pawson, S., Putman, W., Rienecker, M., Schubert, S. D., Sienkiewicz, M., and Zhao, B.: The modern-era retrospective analysis for research and applications, version 2 (MERRA-2), J. Climate, 30, 5419–5454, https://doi.org/10.1175/JCLI-D-16-0758.1, 2017 (data available at: https://disc.gsfc.nasa.gov, last access: 8 June 2023).
Griffin, D. and Kellogg, C.: Dust Storms and Their Impact on Ocean and Human Health: Dust in Earth's Atmosphere, EcoHealth, 1, 284–295, https://doi.org/10.1007/s10393-004-0120-8, 2004.
Guenther, A. B., Jiang, X., Heald, C. L., Sakulyanontvittaya, T., Duhl, T., Emmons, L. K., and Wang, X.: The Model of Emissions of Gases and Aerosols from Nature version 2.1 (MEGAN2.1): an extended and updated framework for modeling biogenic emissions, Geosci. Model Dev., 5, 1471–1492, https://doi.org/10.5194/gmd-5-1471-2012, 2012.
Gui, K., Yao, W., Che, H., An, L., Zheng, Y., Li, L., Zhao, H., Zhang, L., Zhong, J., Wang, Y., and Zhang, X.: Record-breaking dust loading during two mega dust storm events over northern China in March 2021: aerosol optical and radiative properties and meteorological drivers, Atmos. Chem. Phys., 22, 7905–7932, https://doi.org/10.5194/acp-22-7905-2022, 2022.
Guo, J., Lou, M., Miao, Y., Wang, Y., Zeng, Z., Liu, H., He, J., Xu, H., Wang, F., Min, M., and Zhai, P.: Trans-Paci fi c transport of dust aerosols from East Asia: Insights gained from multiple observations and modeling, Environ. Pollut., 230, 1030–1039, https://doi.org/10.1016/j.envpol.2017.07.062, 2017.
Han, X., Ge, C., Tao, J., Zhang, M., and Zhang, R.: Air quality modeling for a strong dust event in East Asia in March 2010, Aerosol Air Qual. Res., 12, 615–628, https://doi.org/10.4209/aaqr.2011.11.0191, 2012.
He, Y., Yi, F., Yin, Z., Liu, F., Yi, Y., and Zhou, J.: Mega Asian dust event over China on 27–31 March 2021 observed with space-borne instruments and ground-based polarization lidar, Atmos. Environ., 285, 119238, https://doi.org/10.1016/j.atmosenv.2022.119238, 2022.
Huang, J., Wang, T., Wang, W., Li, Z., and Yan, H.: Climate effects of dust aerosols over East Asian arid and semiarid regions, J. Geophys. Res.-Atmos., 119, 398–416, https://doi.org/10.1002/2014JD021796, 2014.
Huffman, G. J., Stocker, E. F., Bolvin, D. T., Nelkin, E. J., and Jackson, T.: GPM IMERG Final Precipitation L3 1 day 0.1 degree × 0.1 degree V07, edited by: Savtchenko, A., Greenbelt, MD, Goddard Earth Sciences Data and Information Services Center (GES DISC) [data set], https://doi.org/10.5067/GPM/IMERGDF/DAY/07, 2023.
Jiang, N., Dong, Z., Xu, Y., Yu, F., Yin, S., Zhang, R., and Tang, X.: Characterization of PM10 and PM2.5 source profiles of fugitive dust in Zhengzhou, China, Aerosol Air Qual. Res., 18, 314–329, https://doi.org/10.4209/aaqr.2017.04.0132, 2018.
Jin, J., Pang, M., Segers, A., Han, W., Fang, L., Li, B., Feng, H., Lin, H. X., and Liao, H.: Inverse modeling of the 2021 spring super dust storms in East Asia, Atmos. Chem. Phys., 22, 6393–6410, https://doi.org/10.5194/acp-22-6393-2022, 2022.
Jing, Y., Zhang, P., Chen, L., and Xu, N.: Integrated analysis of dust transport and budget in a severe asian dust event, Aerosol Air Qual. Res., 17, 2390–2400, https://doi.org/10.4209/aaqr.2017.05.0170, 2017.
Kong, S. S.-K., Fu, J. S., Dong, X., Chuang, M.-T., Chel, M., Ooi, G., Huang, W.-S., Griffith, S. M., Kumar, S., and Lin, N.-H.: Sensitivity analysis of the dust emission treatment in CMAQv5.2.1 and its application to long-range transport over East Asia, Atmos. Environ., 257, 118441, https://doi.org/10.1016/j.atmosenv.2021.118441, 2021.
Kong, S. S.-K., Pani, S. K., Griffith, S. M., Ou-Yang, C.-F., Babu, S. R., Chuang, M.-T., Ooi, M. C. G., Huang, W.-S., Sheu, G.-R., and Lin, N.-H.: Distinct transport mechanisms of East Asian dust and the impact on downwind marine and atmospheric environments, Sci. Total Environ., 827, 154255, https://doi.org/10.1016/j.scitotenv.2022.154255, 2022.
Lam, Y. F., Cheung, H. M., and Ying, C. C.: Impact of tropical cyclone track change on regional air quality, Sci. Total Environ., 610–611, 1347–1355, https://doi.org/10.1016/j.scitotenv.2017.08.100, 2018.
Li, J., Han, Z., Zhang, R., and Asia, E.: Model study of atmospheric particulates during dust storm period in March 2010 over East Asia, Atmos. Environ., 45, 3954–3964, https://doi.org/10.1016/j.atmosenv.2011.04.068, 2011.
Li, M., Zhang, Q., Kurokawa, J.-I., Woo, J.-H., He, K., Lu, Z., Ohara, T., Song, Y., Streets, D. G., Carmichael, G. R., Cheng, Y., Hong, C., Huo, H., Jiang, X., Kang, S., Liu, F., Su, H., and Zheng, B.: MIX: a mosaic Asian anthropogenic emission inventory under the international collaboration framework of the MICS-Asia and HTAP, Atmos. Chem. Phys., 17, 935–963, https://doi.org/10.5194/acp-17-935-2017, 2017.
Liang, L., Han, Z., Li, J., Xia, X., Sun, Y., Liao, H., Liu, R., and Liang, M.: Emission , transport , deposition , chemical and radiative impacts of mineral dust during severe dust storm periods in March 2021 over East Asia, Sci. Total Environ., 852, 158459, https://doi.org/10.1016/j.scitotenv.2022.158459, 2022.
Lin, C.-Y., Hsu, H.-m., Sheng, Y.-F., Kuo, C.-H., and Liou, Y.-A.: Mesoscale processes for super heavy rainfall of Typhoon Morakot (2009) over Southern Taiwan, Atmos. Chem. Phys., 11, 345–361, https://doi.org/10.5194/acp-11-345-2011, 2011.
Lin, C.-Y., Sheng, Y.-F., Chen, W.-N., Wang, Z., Kuo, C.-H., Chen, W.-C., and Yang, T.: The impact of channel effect on Asian dust transport dynamics: a case in southeastern Asia, Atmos. Chem. Phys., 12, 271–285, https://doi.org/10.5194/acp-12-271-2012, 2012.
Lin, C.-Y., Sheng, Y.-F., Chen, W.-C., Chou, C. C. K., Chien, Y.-Y., and Chen, W.-M.: Air quality deterioration episode associated with a typhoon over the complex topographic environment in central Taiwan, Atmos. Chem. Phys., 21, 16893–16910, https://doi.org/10.5194/acp-21-16893-2021, 2021.
Lin, N.-H., Tsay, S.-C., Maring, H. B., Yen, M.-C., Sheu, G.- R., Wang, S.-H., Chi, K. H., Chuang, M.-T., Ou-Yang, C.- F., Fu, J. S., Reid, J. S., Lee, C.-T., Wang, L.-C., Wang, J.- L., Hsu, C. N., Sayer, A. M., Holben, B. N., Chu, Y.- C., Nguyen, X. A., Sopajaree, K., Chen, S.-J., Cheng, M.- T., Tsuang, B.-J., Tsai, C.-J., Peng, C.-M., Schnell, R. C., Conway, T., Chang, C.-T., Lin, K.-S., Tsai, Y. I., Lee, W.- J., Chang, S.-C., Liu, J.-J., Chiang, W.-L., Huang, S.-J., Lin, T.-H., and Liu, G.-R.: An overview of regional experiments on biomass burning aerosols and related pollutants in Southeast Asia: From BASE-ASIA and the Dongsha Experiment to 7-SEAS, Atmos. Environ., 78, 1–19, https://doi.org/10.1016/j.atmosenv.2013.04.066, 2013.
Liu, S., Xing, J., Sahu, S. K., Liu, X., Liu, S., Jiang, Y., Zhang, H., Li, S., Ding, D., Chang, X., and Wang, S.: Wind-blown dust and its impacts on particulate matter pollution in Northern China: Current and future scenarios, Environ. Res. Lett., 16, 114041, https://doi.org/10.1088/1748-9326/ac31ec, 2021.
Park, S., Choe, A., and Park, M.: A simulation of Asian dust events in March 2010 by using the ADAM2 model, Theor. Appl. Climatol., 107, 491–503, https://doi.org/10.1007/s00704-011-0494-9, 2012.
Platnick, S., Hubanks, P., Meyer, K., and King, M. D.: MODIS Atmosphere L3 Monthly Product (08_L3), NASA MODIS Adaptive Processing System, Goddard Space Flight Center [data set], https://doi.org/10.5067/MODIS/MYD08_M3.006, 2015.
Shao, Y. and Dong, C. H.: A review on East Asian dust storm climate, modelling and monitoring, Global Planet. Change, 52, 1–22, https://doi.org/10.1016/j.gloplacha.2006.02.011, 2006.
Song, L., Bi, X., Zhang, Z., Li, L., Dai, Q., Zhang, W., Li, H., Wang, X., Liang, D., and Feng, Y.: Impact of sand and dust storms on the atmospheric environment anits source in tianjin- china, Sci. Total Environ., 825, 153980, https://doi.org/10.1016/j.scitotenv.2022.153980, 2022.
Song, P., Fei, J., Li, C., and Huang, X.: Simulation of an Asian Dust Storm Event in May 2017, Atmosphere, 10, 135, https://doi.org/10.3390/atmos10030135, 2019.
Sullivan, H.: Beijing hit by third sandstorm in five weeks, https://www.theguardian.com/world/2021/apr/16/beijing-hit-by-third-sandstorm-in-just-over-a-month (last access: 25 June 2021).
Tan, S., Li, J., Che, H., Chen, B., and Wang, H.: Transport of East Asian dust storms to the marginal seas of China and the southern North Pacific in spring 2010, Atmos. Environ., 148, 316–328, https://doi.org/10.1016/j.atmosenv.2016.10.054, 2017.
Tang, W., Dai, T., Cheng, Y., Wang, S., and Liu, Y.: A Study of a Severe Spring Dust Event in 2021 over East Asia with WRF-Chem and Multiple Platforms of Observations, Remote Sens.-Basel, 14, 3795, https://doi.org/10.3390/rs14153795, 2022.
Uno, I., Osada, K., Yumimoto, K., Wang, Z., Itahashi, S., Pan, X., Hara, Y., Yamamoto, S., and Nishizawa, T.: Importance of long-range nitrate transport based on long-term observation and modeling of dust and pollutants over East Asia, Aerosol Air Qual. Res., 17, 3052–3064, https://doi.org/10.4209/aaqr.2016.11.0494, 2017.
Vukovich, J. and Pierce, T.: The Implementation of BEIS3 within the SMOKE modeling framework, Proc. 11th International Emission Inventory Conference: Emission Inventories – Partnering for the Future, Atlanta, GA, US EPA, CD-ROM, 10.7, 2002.
Wang, J., Gui, H., An, L., Hua, C., Zhang, T., and Zhang, B.: Modeling for the source apportionments of PM10 during sand and dust storms over East Asia in 2020, Atmos. Environ., 267, 118768, https://doi.org/10.1016/j.atmosenv.2021.118768, 2021.
Wang, S., Tsay, S., Lin, N., Hsu, N. C., Bell, S. W., Li, C., Ji, Q., Jeong, M., Hansell, R. A., Welton, E. J., Holben, B. N., Sheu, G., Chu, Y., Chang, S., Liu, J., and Chiang, W.: First detailed observations of long-range transported dust over the northern South China Sea, Atmos. Environ., 45, 4804–4808, https://doi.org/10.1016/j.atmosenv.2011.04.077, 2011.
Wang, S. H., Hsu, N. C., Tsay, S. C., Lin, N. H., Sayer, A. M., Huang, S. J., and Lau, W. K. M.: Can Asian dust trigger phytoplankton blooms in the oligotrophic northern South China Sea?, Geophys. Res. Lett., 39, L05811, https://doi.org/10.1029/2011GL050415, 2012.
Yao, W., Gui, K., Wang, Y., Che, H., and Zhang, X.: Identifying the dominant local factors of 2000–2019 changes in dust loading over East Asia, Sci. Total Environ., 777, 146064, https://doi.org/10.1016/j.scitotenv.2021.146064, 2021.
Yu, C., Kamboj, S., Wang, C., and Cheng, J.: Data Collection Handbook to Support Modeling Impacts of Radioactive Material in Soil and Building Structures, Alexandria, VA: Argonne National Laboratory, https://doi.org/10.2172/1224969, 2015.
Zhao, J., Zhang, F., Xu, Y., Chen, J., Yin, L., Shang, X., and Xu, L.: Chemical Characteristics of Particulate Matter during a Heavy Dust Episode in a Coastal City, Xiamen, 2010, Aerosol Air Qual. Res., 299–308, https://doi.org/10.4209/aaqr.2010.09.0073, 2011.