the Creative Commons Attribution 4.0 License.
the Creative Commons Attribution 4.0 License.
 | 18 Sep 2024
Distinctive aerosol–cloud–precipitation interactions in marine boundary layer clouds from the ACE-ENA and SOCRATES aircraft field campaigns
Xiaojian Zheng
Xiquan Dong
Timothy Logan
Yuan Wang
The aerosol–cloud–precipitation interactions within the cloud-topped marine boundary layer (MBL) are examined using aircraft in situ measurements from Aerosol and Cloud Experiments in the Eastern North Atlantic (ACE-ENA) and Southern Ocean Clouds, Radiation, Aerosol Transport Experimental Study (SOCRATES) field campaigns. SOCRATES clouds exhibit a larger number concentration and smaller cloud droplet effective radius (148.3 cm−3 and 8.0 µm) compared to ACE-ENA summertime (89.4 cm−3 and 9.0 µm) and wintertime clouds (70.6 cm−3 and 9.8 µm). The ACE-ENA clouds, especially during the winter, feature stronger drizzle formation via droplet growth through enhanced collision–coalescence that is attributed to a relatively cleaner environment and deeper cloud layer. Furthermore, the aerosol–cloud interaction (ACI) indices from the two aircraft field campaigns exhibit distinct sensitivities, indicating different cloud microphysical responses to aerosols. The ACE-ENA winter season features relatively fewer aerosols, which are more likely activated into cloud droplets under the conditions of sufficient water vapor availability and strong turbulence. The enriched aerosol loading during ACE-ENA summer and SOCRATES generally leads to smaller cloud droplets competing for the limited water vapor and exhibiting a stronger ACI. Notably, the precipitation susceptibilities are stronger during the ACE-ENA than during the SOCRATES campaigns. The in-cloud drizzle behavior significantly alters sub-cloud cloud condensation nuclei (CCN) budgets through the coalescence-scavenging effect and, in turn, impacts the ACI assessments. The results of this study can enhance understanding and aid in future model simulation and assessment of the aerosol–cloud interaction.
- Article
(4686 KB) - Full-text XML
-
Supplement
(1680 KB) - BibTeX
- EndNote


Marine boundary layer (MBL) clouds substantially impact the Earth's climate system (Dong and Minnis, 2023). Sustained by large-scale subsidence and cloud-top longwave radiative cooling, MBL clouds, typically located beneath the temperature inversion at the MBL top, persistently reflect the incoming solar radiation and modulate the radiative balance (Albrecht et al., 1995; Wood et al., 2015; Dong et al., 2023). The climatic significance of MBL cloud radiative effects, which remains largely uncertain (IPCC, 2023), is closely linked to cloud microphysical properties that are substantially influenced by surrounding aerosol conditions (Chen et al., 2014; Feingold and McComiskey, 2016). Observational evidence demonstrates that cloud microphysical responses to aerosols, defined as the aerosol–cloud interaction (ACI), can be typically viewed as decreased cloud droplet effective radii (rc) and increased number concentrations (Nc) with more aerosol intrusion under conditions of comparable cloud water content (Feingold and McComiskey, 2016). The ACIs have been extensively investigated by different observational platforms, such as aircraft (Hill et al., 2009; Diamond et al., 2018; Gupta et al., 2022), ground-based and satellite observations (Painemal et al., 2020; Zhang et al., 2022; Zheng et al., 2022a), and model simulations (Wang et al., 2020; Christensen et al., 2023) over different maritime regions like the southeastern Pacific (Painemal and Zuidema, 2011), northeastern Pacific (Braun et al., 2018), southeastern Atlantic (Gupta et al., 2022), and eastern North Atlantic (Zheng et al., 2022a).
Furthermore, a larger number of small cloud droplets can sometimes extend cloud longevity and spatial coverage and modulate the precipitation processes in the MBL clouds, reflecting the cloud adjustments to aerosol disturbances (Albrecht, 1989; Bellouin et al., 2020). Precipitation, particularly in the form of drizzle, is common in MBL clouds (Wood et al., 2015; Wu et al., 2020), and the turbulence forced by stratocumulus cloud-top radiative cooling can increase the cloud liquid water path and contribute to drizzle production (Ghate and Cadeddu, 2019; Ghate et al., 2021). The drizzle formation and growth processes are deeply entwined with the MBL aerosols and dynamics. Frequent aerosol intrusions in the MBL have been found to lower the efficiency of collision–coalescence, which results in the suppression of precipitation frequency and strength. Such a phenomenon can be quantified and assessed via the cloud precipitation susceptibility (Feingold and Seibert, 2009; Lu et al., 2009; Sorooshian et al., 2009; Duong et al., 2011). The assessments of precipitation susceptibility are examined to be under the influences of methodology (Terai et al., 2012), cloud morphology (Sorooshian et al., 2009; Jung et al., 2016), ambient aerosol concentrations (Duong et al., 2011; Jung et al., 2016; Gupta et al., 2022), and cloud thickness (Terai et al., 2012; Jung et al., 2016; Gupta et al., 2022). The in-cloud turbulence and wind shear can effectively enhance the collision–coalescence efficiency, stimulate drizzle formation and growth, and consequently lead to an enhanced precipitation rate and amount (Chen et al., 2011; Wu et al., 2017). Cloud-top entrainment of drier and warmer air can potentially deplete small cloud droplets and shrink large droplets via evaporation, thereby impacting cloud-top microphysical processes, depending on the homogeneous or inhomogeneous mixing regimes (Lehmann et al., 2009; Jia et al., 2019).
Conversely, precipitation has been shown to exert a substantial influence on the MBL aerosol and cloud condensation nuclei (CCN) budget through the coalescence-scavenging effect. The coalescence scavenging refers to the process in which cloud or drizzle droplets, containing aerosol particles inside, merge with each other. Upon the collision–coalescence of cloud droplets, the dissolved aerosol masses within the cloud droplets also collide and merge into a larger aerosol core, leading to larger aerosol particles upon droplet evaporation. The sub-cloud aerosols are then replenished into the cloud layer, experiencing growth within the cloud through cloud and drizzle droplet collision–coalescence and subsequently falling and evaporating outside the cloud again. Eventually, the residual aerosols undergoing this cloud-processing cycle will gradually decrease in number concentration and increase in size (Flossmann et al., 1985; Feingold et al., 1996; Hudson and Noble, 2020; Hoffmann and Feingold, 2023). In addition, the drizzle drops, upon falling out of the cloud base, can result in net reductions in sub-cloud aerosols and CCN budgets via precipitation-scavenging processes (Wood, 2006; Zheng et al., 2022b). Quantitative estimates of these effects remain ambiguous and inconclusive, which are subject to multiple factors such as aerosol physicochemical characteristics, cloud morphology, and MBL dynamics and thermodynamics conditions (Sorooshian et al., 2009; Duong et al., 2011; Diamond et al., 2018; Brunke et al., 2022). Thus, more studies on the aforementioned processes regarding MBL aerosols and clouds over different maritime regions are warranted to pursue an in-depth understanding of aerosol–cloud–precipitation interactions (ACPIs).
The eastern North Atlantic (ENA) is a desirable region for exploring MBL clouds in the mid-latitude, with Graciosa island in the Azores (39.09° N, 28.03° W) representing a focal point for studies of ACPIs. Located between the mid-latitude and subtropical climate zones, Graciosa island is subject to the meteorological influence of both the Icelandic Low and the Azores High and the influence of aerosols ranging from pristine marine air masses to those heavily influenced by continental emissions from North America and northern Europe (Logan et al., 2014; Wood et al., 2015; Wang et al., 2020). Addressing the need for sustained research into the MBL clouds, the recent Aerosol and Cloud Experiments in the Eastern North Atlantic (ACE-ENA) aircraft campaign (J. Wang et al., 2022) was conducted in the summer (June and July) 2017 (ACE-ENA Sum) and winter (January and February) 2018 (ACE-ENA Win). During these two intensive operation periods (IOPs) of ACE-ENA, the research aircraft accrued abundant in situ measurements of aerosols, clouds, and drizzle properties, providing invaluable resources for studying the ACI and ACPI processes. During the summer, the Azores is located at the eastern part of the high-pressure system, while during the winter, the center of the Azores High shifts to the eastern Atlantic and is primarily located directly over the Azores (Mechem et al., 2018; J. Wang et al., 2022). Furthermore, both ACE-ENA Sum and ACE-ENA Win IOPs featured anomalously strong high-pressure systems compared to the 20-year climatology, as shown in Fig. S1 in the Supplement. This meteorological pattern is favorable for the prevailing and persistent stratocumulus clouds observed during ACE-ENA, especially during the winter IOP, where the enhanced large-scale subsidence can lead to stronger and sharper temperature inversions above the stratocumulus-topped MBL (Rémillard and Tselioudis, 2015; Jensen et al., 2021; Marcovecchio et al., 2023). The ACE-ENA Sum is characterized by anomalously low MBL heights and substantial MBL decoupling (Miller et al., 2022; J. Wang et al., 2022). The winter IOP was under the frequent impacts of the mid-latitude systems and prevalent precipitation-generated cold pools featured, where evaporative cooling alters the thermodynamical structure of the MBL, sustains and enhances turbulence mixing, and hence contributes to dynamical perturbations that can influence the behavior of the MBL (Terai and Wood, 2013; Zuidema et al., 2017; Jenson et al., 2021; J. Wang et al., 2022; Smalley et al., 2024). In recent years, many observational studies based on ACE-ENA data have focused on the seasonal contrasts of the aerosol distributions and sources (Y. Wang et al., 2021b; Zawadowicz et al., 2021), the cloud and drizzle microphysics vertical distributions (Wu et al., 2020a; Zheng et al., 2022b), and the impacts of MBL conditions on the cloud structure and morphology (Jensen et al., 2021). However, they seldom analyze the comprehensive interactions between aerosol, clouds, and precipitation.
Over the Southern Ocean (SO), the Southern Ocean Clouds, Radiation, Aerosol Transport Experimental Study (SOCRATES) field campaign (McFarquhar et al., 2021) was conducted during the austral summer (January and February 2018), which marks another valuable piece of the MBL cloud research. The SO, being one of the cloudiest regions globally, is predominantly influenced by naturally produced aerosols originating from oceanic sources due to its remoteness, where the anthropogenic and biomass-burning aerosols exert minimal influence over the region (McCoy et al., 2021; Sanchez et al., 2021; Twohy et al., 2021; Zhang et al., 2023). The aerosol budget in this region is primarily shaped by biological aerosols, which nucleate from the oxidation products of dimethyl sulfide (DMS) emissions, and by sea spray aerosols. Hence, the SO provides an unparalleled natural laboratory for discerning the influence of these natural aerosol emissions on the MBL clouds under a pre-industrial natural environment. The summertime SO region, particularly near the SOCRATES focus area, is characterized by more frequent closed-cell mesoscale cellular convection structures (Danker et al., 2022; Lang et al., 2022). Furthermore, the MBL clouds over the SO predominantly consist of supercooled liquid water droplets which coexist with mixed- and ice-phase processes (Y. Wang et al., 2021a; Xi et al., 2022), while the precipitation phases are examined to be primarily dominated by liquid hydrometeors (Tansey et al., 2022; Kang et al., 2024). The in situ measurements collected from SOCRATES have cultivated many studies on aerosols, clouds, and precipitation over the SO using both in situ measurements and model simulations (McCoy et al., 2020; Altas et al., 2020; D'Alessandro et al., 2021) and provide an opportunity to study the liquid cloud processes under a colder climate. As shown in Fig. S1c, our composite analysis of the synoptic pattern shows that the SOCRATES cloud cases used in this study are located ahead of the anomalously strong thermal ridge and behind the thermal trough, providing an environment favorable to closed cellular MBL cloud structures (McCoy et al., 2017; Lang et al., 2022). Since the region of selected SOCRATES cloud cases crosses a larger latitudinal zone and is under a more consistent influence of mid-latitude cyclone systems than the ACE-ENA during the summer IOP, the cloud sampling periods used in this study majority reside in the closed-cell MBL stratocumulus decks.
The cloud cases selected from the ACE-ENA and SOCRATES campaigns share similar cloud morphology (stratocumulus), while experiencing different aerosol sources and meteorological conditions. A synergistic approach that compares data from these different field campaigns can provide valuable insights to the community regarding the dominant physical processes of the interactions between aerosols, clouds, and precipitation under the influence of different MBL dynamic and thermodynamic conditions. This study targets the similarities and differences in the MBL aerosol, cloud, and drizzle properties, their distribution and evolution, and, more appealingly, the ACIs and ACPIs between the two campaigns. The data and methods used in this study are introduced in Sect. 2. The aerosol and CCN properties in the above- and sub-cloud regimes, as well as the vertical distributions of MBL cloud and drizzle properties, are examined in Sect. 3. The ACI, precipitation susceptibility and drizzle impacts on the sub-cloud aerosols and CCN (ACPI) are discussed in Sect. 4. Finally, the results are summarized, and the importance of this study is discussed in Sect. 5.
2.1 Cloud and drizzle properties
The in situ measurements of MBL cloud properties are temporally synchronized to 1 Hz resolution, corresponding to approximately 100 m (5 m) of the horizontal (vertical) sampling. The sampling locations of the selected cases are indicated by the white dots in Fig. S1. The Fast Cloud Droplet Probe (FCDP) on board the aircraft during ACE-ENA can detect droplets with diameter (Dp) ranging from 1.5 to 50 µm, with the size bins of the probe between 1 and 3 µm (Glienke and Mei, 2020). SOCRATES used a similar cloud droplet probe (CDP) to measure droplets from 2 to 50 µm at a 2 µm probe size bin width. Both ACE-ENA and SOCRATES leverage the 2D-S Stereo Probe (2DS) to discern droplets with diameters from 5 to 1280 µm (Lawson et al., 2006; Glienke and Mei, 2019). The 2DS in situ measurements are used as additional screening to eliminate the ice particles with diameters larger than 200 µm. Moreover, the University of Washington Ice–Liquid Discriminator product, which is a machine-learning-based single-particle-phase classification of the 2DS images (Atlas et al., 2021), is used to identify small ice crystals when available. Through these three datasets, we can tease out the ice-dominated period to the highest extent possible and focus on the liquid cloud processes and ACI during SOCRATES (Y. Wang et al., 2021).
Although these in situ measurements can provide “ground-truth” datasets, their uncertainties must be properly analyzed, and the data quality must be controlled before being applied to scientific studies. The uncertainties in the FCDP in sizing and concentration are approximately 30 % and 20 %, respectively (Baumgardner et al., 2017). Considering the significant uncertainty in the concentration of smaller particles from a photodiode probe such as 2DS (Baumgardner and Korolev, 1997; Wang et al., 2021), a diameter of 40 µm is used as the demarcation line between cloud droplets and drizzle drops (Wood, 2005). Then the droplet number concentrations in the overlapping size bin between FCDP and 2DS are redistributed, assuming a gamma distribution, and thereby a complete size spectrum of cloud and drizzle can be merged from FCDP and 2DS measurements. Hence, the cloud and drizzle microphysical properties can be calculated.
The cloud droplet number concentration (Nc) is given by
The cloud droplet effective radius (rc; Hansen and Travis, 1974) is given by
The cloud liquid water content (LWCc) can be calculated by
where ρw is water density.
Similarly, the drizzle drop number concentration (Nd) and liquid water content (LWCd) can be calculated using the size distribution from 40 to 1280 µm. Particularly, the drizzle mean mass diameter (Dmmd) is given by
This quantity is chosen because the Dmmd denotes the diameter of average mass (the third-moment average) of the drizzle size distribution, which provides the link between the number concentration and the mass concentration of drizzle droplets in a sample (Hinds, 1999).
Adapting the method in Zheng et al. (2022b), the cloud base precipitation rate (RCB) is given by
In order to match the unit conversion, the Dp,mm is the diameter in units of millimeters; n(Dp,mm) is the drizzle number concentration in every size bin with a unit of m3 mm−1; and U∞(Dp,mm) is the terminal velocity in a given size bin, which is calculated from the full Reynolds number theory as in Pruppacher and Klett (2010).
The combined threshold of Nc>5 cm−3 and LWCc>0.01 g m−3 is used for determining the valid cloud samples and cloud boundaries (Wood, 2005; Zheng et al., 2022b). The complete cloud vertical profiles from sub-cloud to the above-cloud are selected during the ACE-ENA and SOCRATES IOPs, in which the flight strategy includes sawtooth and spiral cloud transects and ramping cloud sampling. The precipitation conditions are determined by whether samples of Nd>0.001 cm−3 exist below the cloud base height. In total, the selected numbers of cloud (precipitating cloud) profiles are 18 (13), 26 (13), and 28 (24) for ACE-ENA Sum, ACE-ENA Win, and SOCRATES, respectively. The detailed selected cloud profiles, with their cloud-base heights (zt), cloud-top heights (zb), and cloud thicknesses (), are listed in Table S1 in the Supplement, along with the cloud profile macrophysics.
Furthermore, the assessments of ACI are significantly impacted by the MBL dynamic and thermodynamic conditions. Jones et al. (2011) suggested that the MBL would be in a well-mixed and coupled condition when the difference in the liquid water potential temperature (θL) and total water mixing ratio (qt) between the bottom of MBL and the inversion layer is less than 0.5 K and 0.5 g kg−1, respectively. The cases selected for this study feature both coupled and decoupled MBL conditions, particularly during ACE-ENA Sum, which is characterized by anomalously low MBL heights and substantial MBL decoupling. Previous studies found that under decoupled conditions the aerosols, CCN, and moisture sources near the surface are disconnected from the cloud layer aloft, hence exerting a much less effective impact on cloud microphysics (Zheng et al., 2022a; Christensen et al., 2023; Su et al., 2024). Therefore, we adapt and modify the metric in Jones et al. (2011) to calculate the sub-cloud coupled layer in order to quantify the degree to which aerosols and CCN-measured sub-cloud are in a well-mixed state and can represent the actual interaction (or contact) with the cloud layer. In this study, the qt and θL at the cloud base are calculated, and then their vertical variations are examined, starting from the altitude of the cloud base (zb) and looking downward. As such, the coupled point height (zcp) is defined as the altitude where the downward vertical changes in qt and θL exceed 0.5 K and 0.5 g kg−1, respectively. Hence, the coupled layer thickness () is defined as the layer between the cloud-top height (zt) and coupled point height (zcp); hence, the selection of the aerosols and CCN within the below-cloud part of the coupled layer can be viewed as being in contact with the cloud. An example of the coupled layer identification is shown in Fig. S2. Therefore, the degree of MBL decoupling (Dcp) can be quantified as the ratio of the coupled point height (zcp) to the cloud base height (zb), where . As shown in Table S1, the ACE-ENA Sum features, with the highest degree of decoupling (averaged Dcp=0.504) compared to the ACE-ENA Win (Dcp=0.370) and SOCRATES (Dcp=0.277).
2.2 Aerosol properties
The total aerosol number concentrations (Na) from ACE-ENA and SOCRATES are measured by the airborne condensation particle counter (CPC) models 3772 and 3760A, which count the number of aerosols with a diameter (Dp) larger than 3 and 11 nm, respectively (Kuang and Mei, 2020; UCAR/NCAR, 2022). Additionally, the Passive Cavity Aerosol Spectrometer Probe (PCASP) on board the ACE-ENA aircraft is capable of sizing the aerosol with Dp, ranging from 0.1 to 3.2 µm (Goldberger, 2020). The ultra-high-sensitivity aerosol spectrometer (UHSAS) measures the size-resolved aerosol distribution from 0.06 to 1.0 µm during SOCRATES (Uin and Goldberger, 2020). Therefore, the number concentrations of accumulation mode aerosols (NACC; 0.1–1 µm) can be discerned from the PCASP and UHSAS aerosol size distributions. Aitken mode aerosols (NAit, <0.1 µm) from ACE-ENA are retrieved by the Fast Integrated Mobility Spectrometer (FIMS), which can size the aerosol down to 9 nm (Olfert et al., 2008), while the NAit from SOCRATES is limited to 0.06–0.1 µm due to the limitation of UHSAS. As for the CCN measurements, the ACE-ENA utilized the dual-column CCN counter at two constant supersaturation levels of 0.15 % and 0.35 % (Uin and Mei, 2019), while the CCN number concentration (NCCN) during SOCRATES was measured under various supersaturation levels from 0.06 % to 0.87 %, using a scanning CCN counter (Roberts and Nenes, 2005). In this study, NCCN at 0.35 % supersaturation (NCCN 0.35 %) is used to ensure a direct comparison between ACE-ENA and SOCRATES. The aerosol measurements are in the temporal resolution of 1 Hz. Note that the aerosol and CCN data are quality-controlled by removing the data point where the Nc+Nd value is greater than 5 cm−3 or Nd value is greater than 0.01 cm−3 to filter out the contamination of the cloud droplets and drizzle water splashing.
The sub-cloud aerosols and CCN are selected within the below-cloud-base part of the coupled layer, which is described in Sect. 2.1, in order to better assess aerosol–cloud interactions. The above-cloud aerosols and CCN are selected between the cloud top and 200 m above. Note that the selection criteria of 200 m above the cloud top would inevitably induce uncertainty in the cloud-top ACI assessment, depending on the vertical trend of the individual aerosol profile. Over the southeastern Atlantic, Gupta et al. (2021) conducted an analysis focusing particularly on the differing impacts when biomass-burning aerosols are in contact with marine stratocumulus cloud tops, using 100 m above as the demarcation, compared to when they are separated by various distances and found that significant differences were observed in cloud microphysics, owing to different droplet evaporation and nucleation, compared to profiles in which aerosols and cloud layer are separated. That result is in agreement with the modeling sensitivity study over the eastern North Atlantic by Wang et al. (2020), who found that aerosol plumes can exert impacts on the cloud-top microphysics only when they are in close contact with the cloud layer. During much of the ACE-ENA campaign, nearly constant (and sometimes decreasing) vertical atmospheric profiles of aerosol concentration were observed within a few hundred meters above the cloud top. Aerosol intrusions due to long-range transport, particularly during the summer season, were observed to induce an elevated aerosol layer in higher altitudes that was not in contact with the cloud layer. The frequent new-particle-formation events during SOCRATES significantly alter the free-troposphere Aitken mode aerosol budget, but the aerosols would need to further subside to impact the cloud (McCoy et al., 2021; Zhang et al., 2023). Note that from previous studies on ACE-ENA and SOCRATES, the aerosol vertical profiles within ∼200 m above the cloud layers are typically found to have less variation (Wang et al., 2020; Wang et al., 2021; McCoy et al., 2021; Zhang et al., 2023), hence representing the aerosol layers in contact with the cloud. Hence, the 200 m criterion used in this study provides a sufficient sample size population for statistical analysis.
3.1 Aerosols and CCN in above- and sub-cloud regimes
The probability density functions (PDFs) of aerosols, CCN, and cloud microphysical properties from selected cases during the ACE-ENA and SOCRATES field campaigns are presented in Fig. 1. Notably, the Na, NAcc, and NCCN 0.35 % values from SOCRATES are the highest among the three IOPs, followed by the ACE-ENA Sum and ACE-ENA Win, as illustrated in both the above-cloud (Fig. 1a–c) and sub-cloud regimes (Fig. 1d–f). Such variations can be linked to the different aerosol sources in the ACE-ENA and SOCRATES regions, especially during the summer and winter seasons over the Azores.
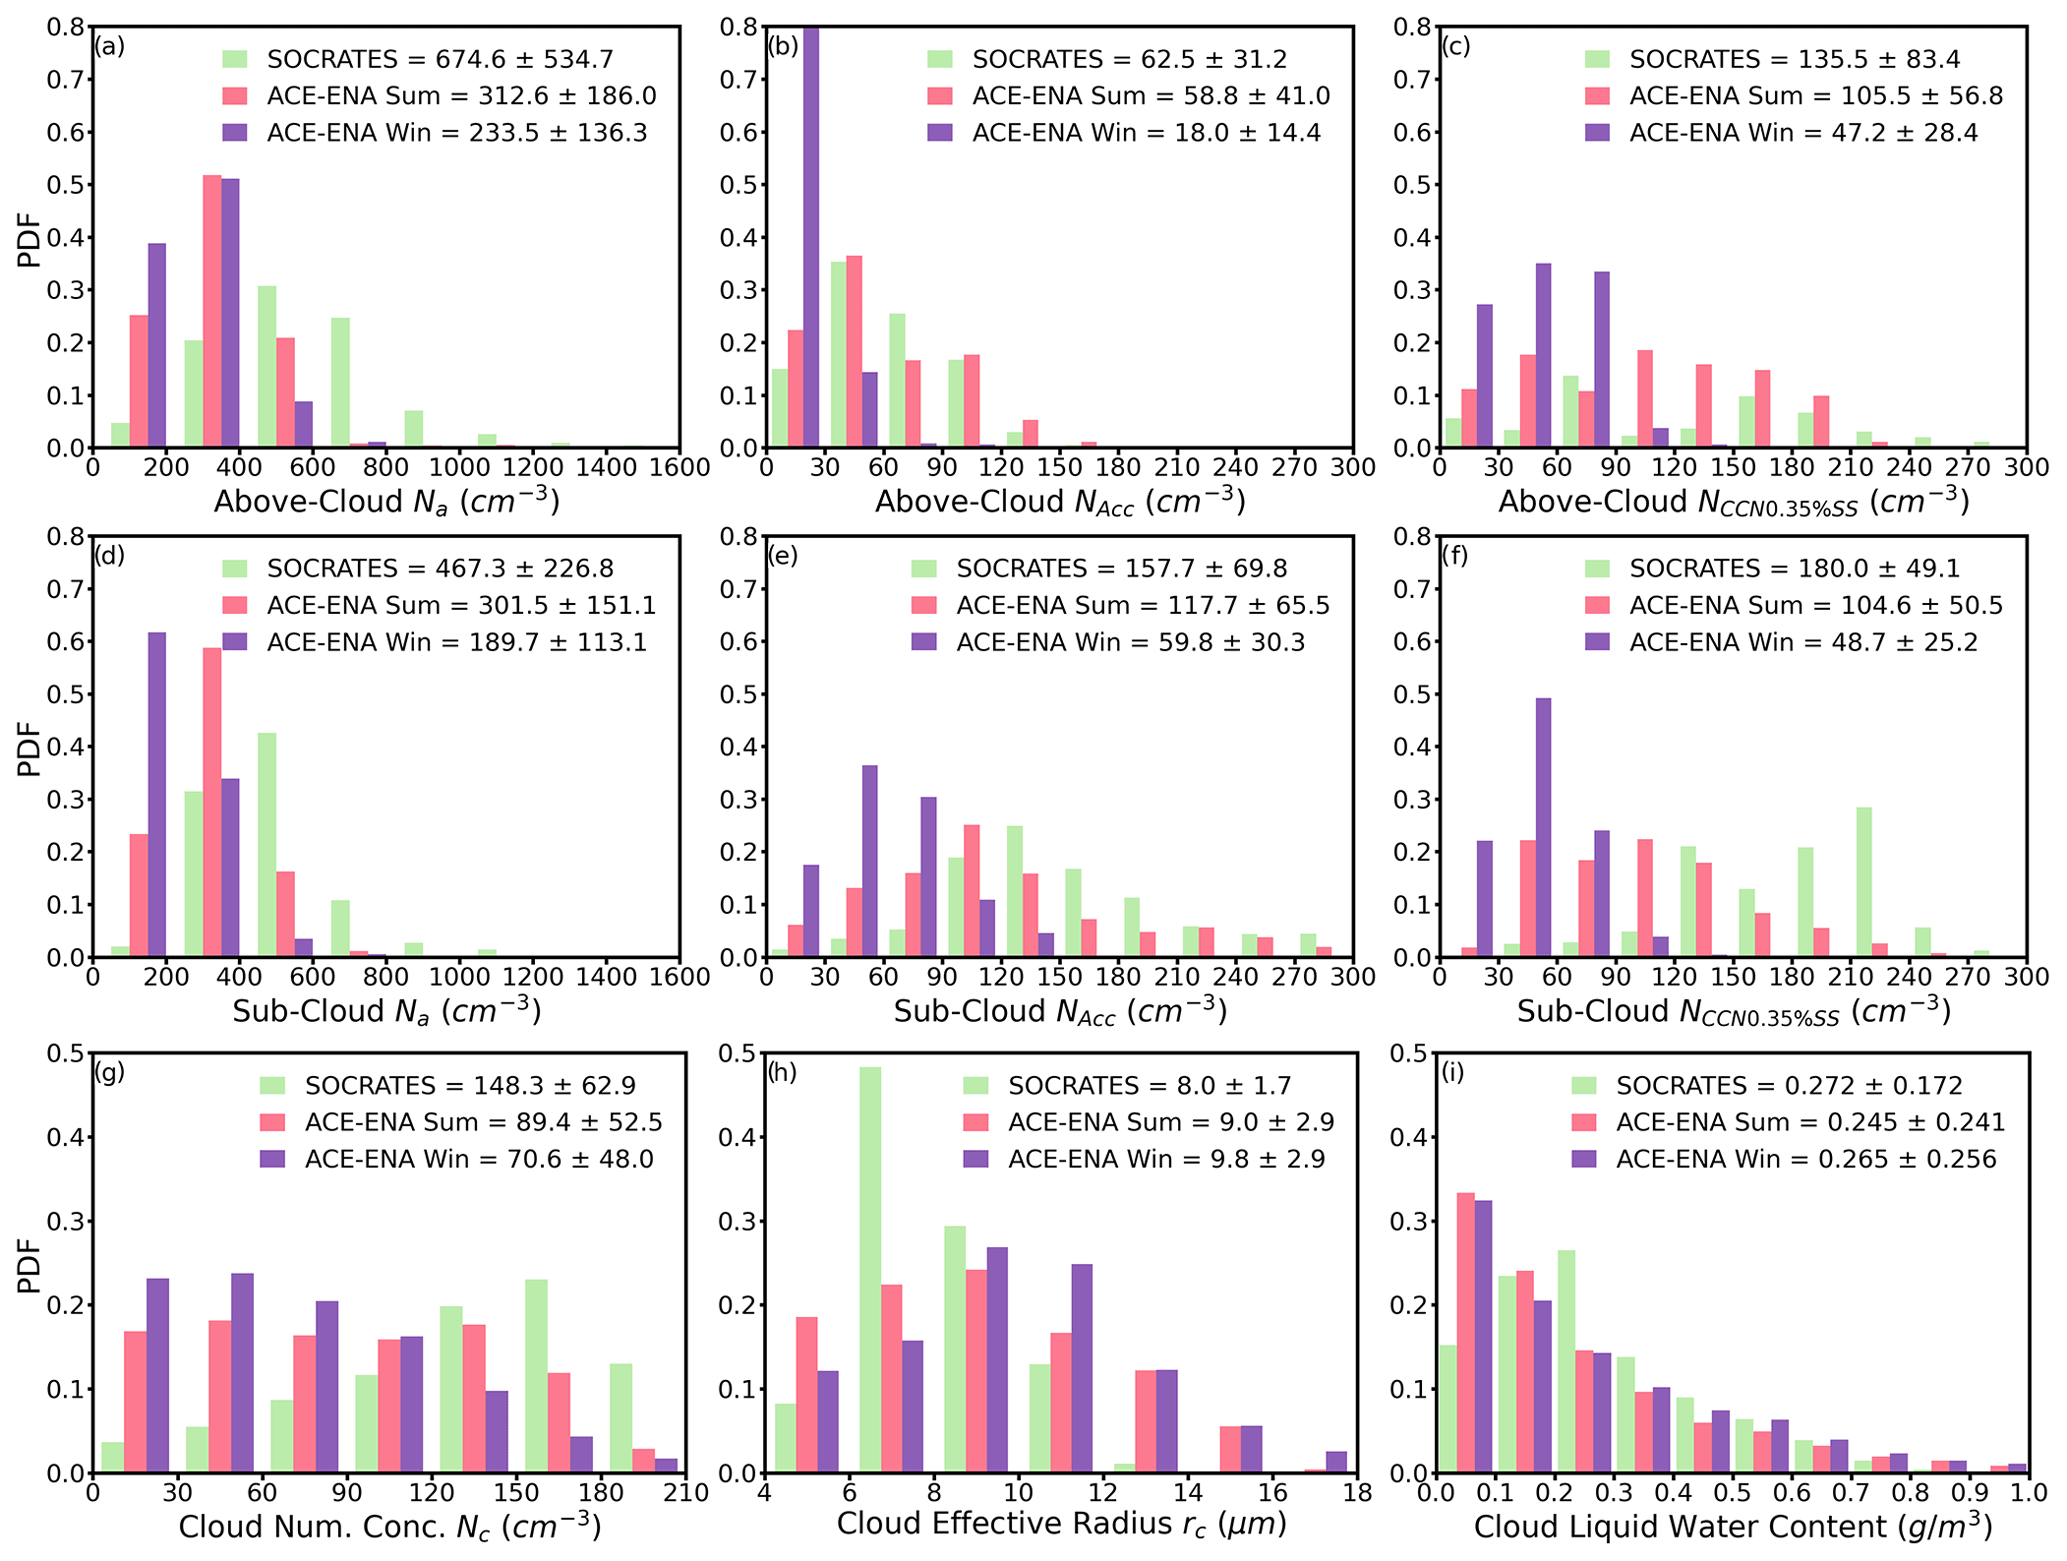
Figure 1Probability density functions (PDFs) of Na, NACC, and NCCN 0.35 % in the above-cloud (a–c) and sub-cloud (d–f) regimes and the cloud microphysical properties of Nc (g), rc (h), and LWCc (f) within the cloud layer. The statistical metrics in the legends denote the mean and standard deviation values for all samples in three IOPs. The ACE-ENA Sum, ACE-ENA Win, and SOCRATES values are color-coded in pink, purple, and green, respectively.
In the SOCRATES region, according to the previous studies involving back-trajectory analyses, dominant air masses within the MBL primarily originate from the south or from the west, skirting the Antarctic coast (Zhang et al., 2023). While the air masses above the MBL follow a similar transport pathway, they can also originate from the tip of southern Africa and be transported southeast along the warm conveyor belt (McCoy et al., 2021). Above-cloud aerosol NCCN 0.35 % values analyzed during SOCRATES (674.6 cm−3) are primarily constituted by the Aitken mode aerosols because the mean NAcc is only 62.5 cm−3. Previously, McCoy et al. (2021) reported average NCCN 0.35 % values of 680.69, 546.28, and 465.05 cm−3 for the mid-troposphere and above- and below-cloud for the multiple SOCRATES cases, respectively. For individual cases, the above-cloud aerosols vary from 200 to over 1000 particles per cubic centimeter (McCoy et al., 2021; Zhang et al., 2023). These aerosols are predominantly produced from the oxidation of biogenic gases, notably dimethyl sulfide (DMS) emitted by marine biological productivity (Sanchez et al., 2021; McCoy et al., 2020). The rising air currents in the MBL transport these particles into the free troposphere with dominant aerosol population over the SO (McCoy et al., 2021; Sanchez et al., 2021). Hence, it reinforces the notion that the SO represents a pre-industrial marine environment, where the influence of anthropogenic and biomass-burning aerosols is mostly negligible (McCoy et al., 2020, 2021).
Conversely, the ENA region experiences aerosols of varied origins, spanning maritime air masses to those heavily influenced by continental emissions from North America or northern Europe, especially during the summer season (Logan et al., 2014; Wang et al., 2020). The summer air mass back-trajectories within the MBL strongly feature recirculating flow around the Azores High. During the wintertime, however, the air masses predominantly originate in the free troposphere, are transported above the MBL, and are then further entrained to the MBL by large-scale subsidence, indicating less influence from continental pollution (Y. Wang et al., 2021b). During the ACE-ENA Sum, the MBL is enriched by sulfate and carbonaceous particles (Y. Wang et al., 2021b; Zawadowicz et al., 2021). This enhancement is attributed both to local generation from DMS and to the long-range transport from the continental air masses, resulting in the mean Na of 312.6 cm−3 and 301.5 cm−3 for above- and sub-cloud regimes, respectively. The ACE-ENA Win exhibits the lowest aerosol and CCN concentrations, which are predominantly sourced from local maritime influences and coupled with reduced continental air mass intrusions (Zheng et al., 2018; Y. Wang et al., 2021b).
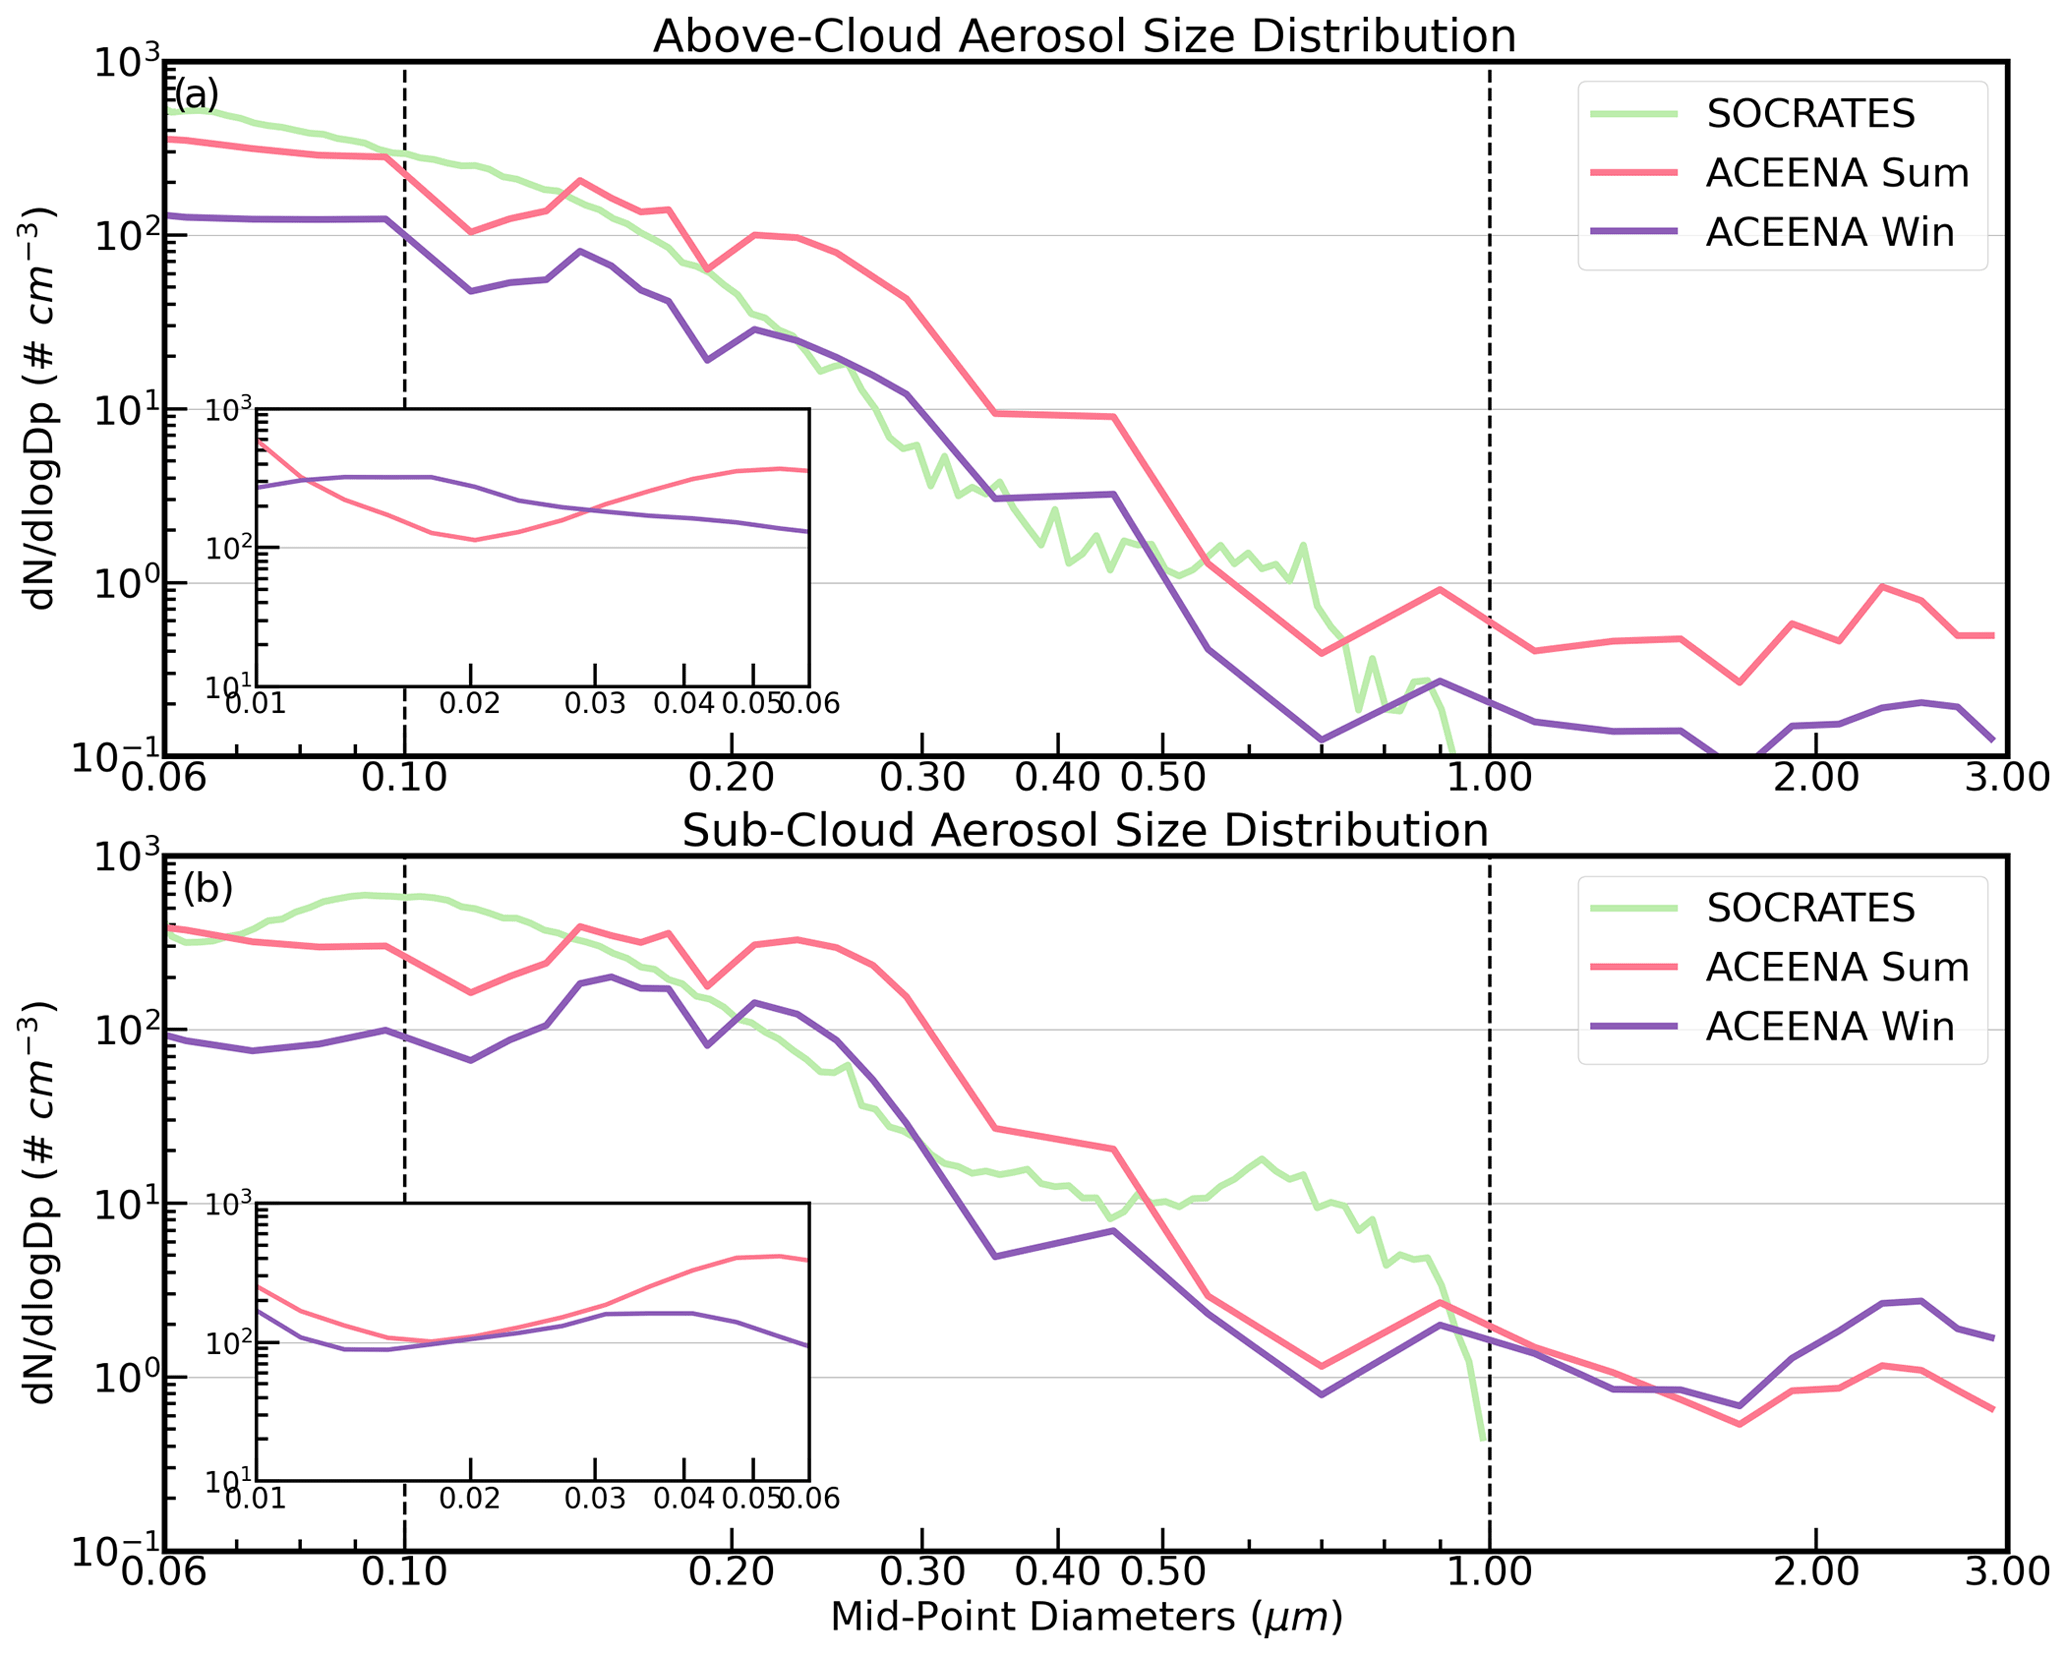
Figure 2Aerosol size distributions (Dp=0.06–3 µm) for above-cloud (a) and sub-cloud (b) regimes. The vertical dashed line at Dp=0.1 µm and at Dp=1 µm denotes the demarcations between accumulation mode, Aitken mode, and coarse mode aerosols. The inner plots denote a smaller range of Aitken mode size distribution (Dp=0.01–0.06 µm) available from ACE-ENA. The ACE-ENA Sum, ACE-ENA Win, and SOCRATES values are color-coded in pink, purple, and green, respectively.
Figure 1a and d reveal that there are more above-cloud Na values during the three IOPs than sub-cloud values, especially during SOCRATES. The higher above-cloud Na values from the three IOPs are primarily contributed by Aitken mode aerosols because their corresponding NAcc values are much lower (Fig. 1a and b). It is interesting to note that the above-cloud NCCN 0.35 % values exceed the NAcc values for all three IOPs (Fig. 1b and c), implying that a significant fraction of Aitken mode aerosols can be activated to become CCN, corroborating findings from earlier studies (McCoy et al., 2021; Zheng et al., 2021). For the sub-cloud regime, the Na values for SOCRATES and ACE-ENA Win are ∼70 %–80 % of their corresponding above-cloud values, and the Na during ACE-ENA Sum is almost identical to its above-cloud value. Notice that the sub-cloud NAcc values from the three IOPs are more than double the above-cloud NAcc values, and most of the sub-cloud accumulation mode aerosol can be activated to become CCN at supersaturation (SS) of 0.35 %. It is interesting to note that the higher NCCN 0.35 % at the sub-cloud layer during SOCRATES may partially be a result of aerosols being positively impacted by cloud dynamic processes (Fig. 1e and f), which is suggested by previous studies (McCoy et al., 2021; Zhang et al., 2023) and will be further discussed in the following paragraphs.
To further investigate the above- and sub-cloud aerosol properties from the three IOPs, the aerosol droplet size distributions are analyzed in Fig. 2. It is evident that SOCRATES aerosols have the highest concentrations of Aitken mode particles (Dp=0.06–0.1 µm, given that the <0.06 µm is not available from UHSAS) for the above- and sub-cloud regimes. McCoy et al. (2021) and Zheng et al. (2021) identified analogous origins and formations of the above-cloud Aitken mode aerosols over the SO and ENA regions and concluded that these aerosols primarily originate from the nucleation of photo-oxidation products of DMS, notably H2SO4 and methanesulfonic acid (MSA), in the free troposphere. The differential concentrations can be ascribed to the fact that sea surface DMS concentrations in the SO are generally higher than those in the ENA region (Aumont et al., 2002; Zhang et al., 2023). Moreover, DMS emissions in the ENA during the summer season surpass those during winter (Zawadowicz et al., 2021). For the accumulation mode aerosols (0.1–1 µm), the NAcc values for both above- and sub-cloud regimes during SOCRATES decrease monotonically with particle size. The results in Fig. 2 further support the finding that Aitken mode aerosols are dominant over the SO. The NAcc values during ACE-ENA show slight uplifts for the small accumulation mode aerosols (<0.3 µm), particularly during the summer, reflecting the signal of potential long-range transport of fine-mode aerosols (Wang et al., 2020; Y. Wang et al., 2021b). Consequently, such a comparison reinforces the notion that the SO represents a largely pre-industrial marine environment for which the influence of anthropogenic and biomass-burning aerosols is minimal (McCoy et al., 2020, 2021; Zhang et al., 2023).
When contrasting the aerosol size distributions in the sub-cloud regime (Fig. 2b) with those in the above-cloud regime, the influence of cloud processing on aerosols is discernibly non-trivial, particularly under the cloud-topped MBL conditions examined in this study. The free tropospheric aerosols can be entrained and contribute to the population of Aitken mode aerosols within the MBL, and the sub-cloud aerosols can also be subject to the influence of new particle formation in the upper MBL, though they are arguably less effective than those within the free troposphere (Zheng et al., 2021). Additionally, in-cloud Brownian capture can lead to a substantial reduction in Aitken mode aerosols (Hudson et al., 2015; Wyant et al., 2022), providing the rationale for the observed decrease in Aitken mode aerosols from the above- to sub-cloud regime, especially for particles smaller than 0.07 µm. In addition, cloud chemical processing, such as the aqueous-phase condensation of sulfuric gas onto the aerosol cores inside the cloud droplets, is particularly pronounced during the transitioning of Aitken mode aerosols to accumulation mode aerosols (Hudson et al., 2015; Zhang et al., 2023).
The larger Aitken mode aerosols (>0.07 µm) in the above- and sub-cloud regimes can effectively grow to accumulation mode aerosols through coagulation and water vapor diffusional growth (Covert et al., 1996), contributing to the elevated accumulation mode aerosol distribution and increased NAcc in the sub-cloud regime. These processes are evident by the decrease in the critical supersaturations from above-cloud (between 0.35 %–0.4 %) to sub-cloud regimes (between 0.3 %–0.35 %) during SOCRATES (Fig. S3) because the aerosol droplet sizes are enlarged and more readily become CCN. Furthermore, the collision–coalescence combines mixtures of large and small cloud droplets and results in the sub-cloud aerosol residuals shifting towards the larger size upon the drizzle droplet evaporation below the cloud. This partially elucidates the observed increase in the tail-end of the accumulation mode aerosol distribution for all three IOPs. The elevation in the sub-cloud coarse mode aerosols observed for both ACE-ENA IOPs (as seen in Fig. 2) can be attributed to the evaporation of collision–coalescence-enlarged drizzle droplets and the intrusion of sea spray aerosols (e.g., sea salt), as illustrated and analyzed based on a summertime case study that exhibits the signal of cloud-processing aerosols (Zheng et al., 2022b), and the long-term aerosol physicochemical properties over the ARM-ENA ground-based observatory (Zheng et al., 2018), particularly during the winter season where the production of sea spray aerosol is prevalent.
3.2 Distribution of bulk cloud microphysical properties
The PDFs of MBL cloud microphysical properties (Nc,rc, and LWCc) derived from aircraft in situ measurements from the three IOPs are shown in Fig. 1g–i. The mean microphysical properties for the individual cloud profiles are listed in Table S2. SOCRATES has the highest sub-cloud aerosols and CCN and subsequently feature a larger number of smaller cloud droplets, given the highest Nc (148.3 cm−3) and smallest rc (8 µm) values among the three IOPs. These results have further confirmed and reassured our understanding of the aerosol first indirect effect in which a larger population of aerosols induces a higher number concentration of small cloud droplets under constrained liquid water content conditions, and thus, the MBL clouds reflect more incoming solar radiation (Twomey, 1977). The ACE-ENA Win clouds feature the fewest Nc (70.6 cm−3) and largest rc (9.8 µm) values, while the Nc and rc (89.4 cm−3 and 9 µm) during ACE-ENA Sum fall between the SOCRATES and ACE-ENA Win values. Considering the aerosol competing effect against the available water vapor, the relatively abundant aerosols in SOCRATES might account for the observed narrower rc distribution, which peaks between 6–10 µm. SOCRATES has a lower-cloud layer water vapor mixing ratio (figure not shown) compared to ACE-ENA because the SO region has been observed to contain less precipitable water vapor than the ENA region due to the colder sea surface temperatures (Marcovecchio et al., 2023). Therefore, the aerosol and cloud properties in Fig. 1 promise a further examination of the different cloud microphysical responses to aerosols via the ACI process. Note that the NCCN 0.35 % values are lower than Nc values during the ACE-ENA Win, which is also confirmed in previous studies (J. Wang et al., 2022; Wang et al., 2023). This interesting phenomenon can potentially be attributed to a combination of factors, including lower MBL aerosol sources, stronger in-cloud coalescence-scavenging depletion of sub-cloud aerosols, and the aircraft snapshots capturing the equilibrium states of aerosols and cloud due to enhanced aerosol activations induced by stronger updrafts during the ACE-ENA Win (J. Wang et al., 2022). This thereby compels further investigation into the potential impacts of precipitation on the MBL CCN budget, which is further discussed in Sect. 4.
3.3 Vertical distributions of cloud and drizzle microphysics
The vertical distributions of the cloud and drizzle microphysical properties within the cloud layer from the three IOPs are shown in Fig. 3. To ensure the representativeness of the vertical profiles, all of the in-cloud samples are vertically smoothed using a triangular moving average method and are inverse-distance-weighted in every 50 m moving altitude window. Furthermore, the altitude is then normalized by , where zi=0 denotes the cloud base, and zi=1 denotes the cloud top. Consistent with previous discussions on the bulk microphysics distribution, the mean Nc values from SOCRATES are consistently higher than ACE-ENA Sum and ACE-ENA Win for the entire cloud layer, with a slight increase ranging from the cloud base to the upper–middle part (zi≈0.85) and then decreasing toward the cloud top (Fig. 3a). All rc values from the three IOPs show a near-linear increase from cloud base to top, with the smallest values observed during SOCRATES and the largest values observed during ACE-ENA Win (Fig. 3b).
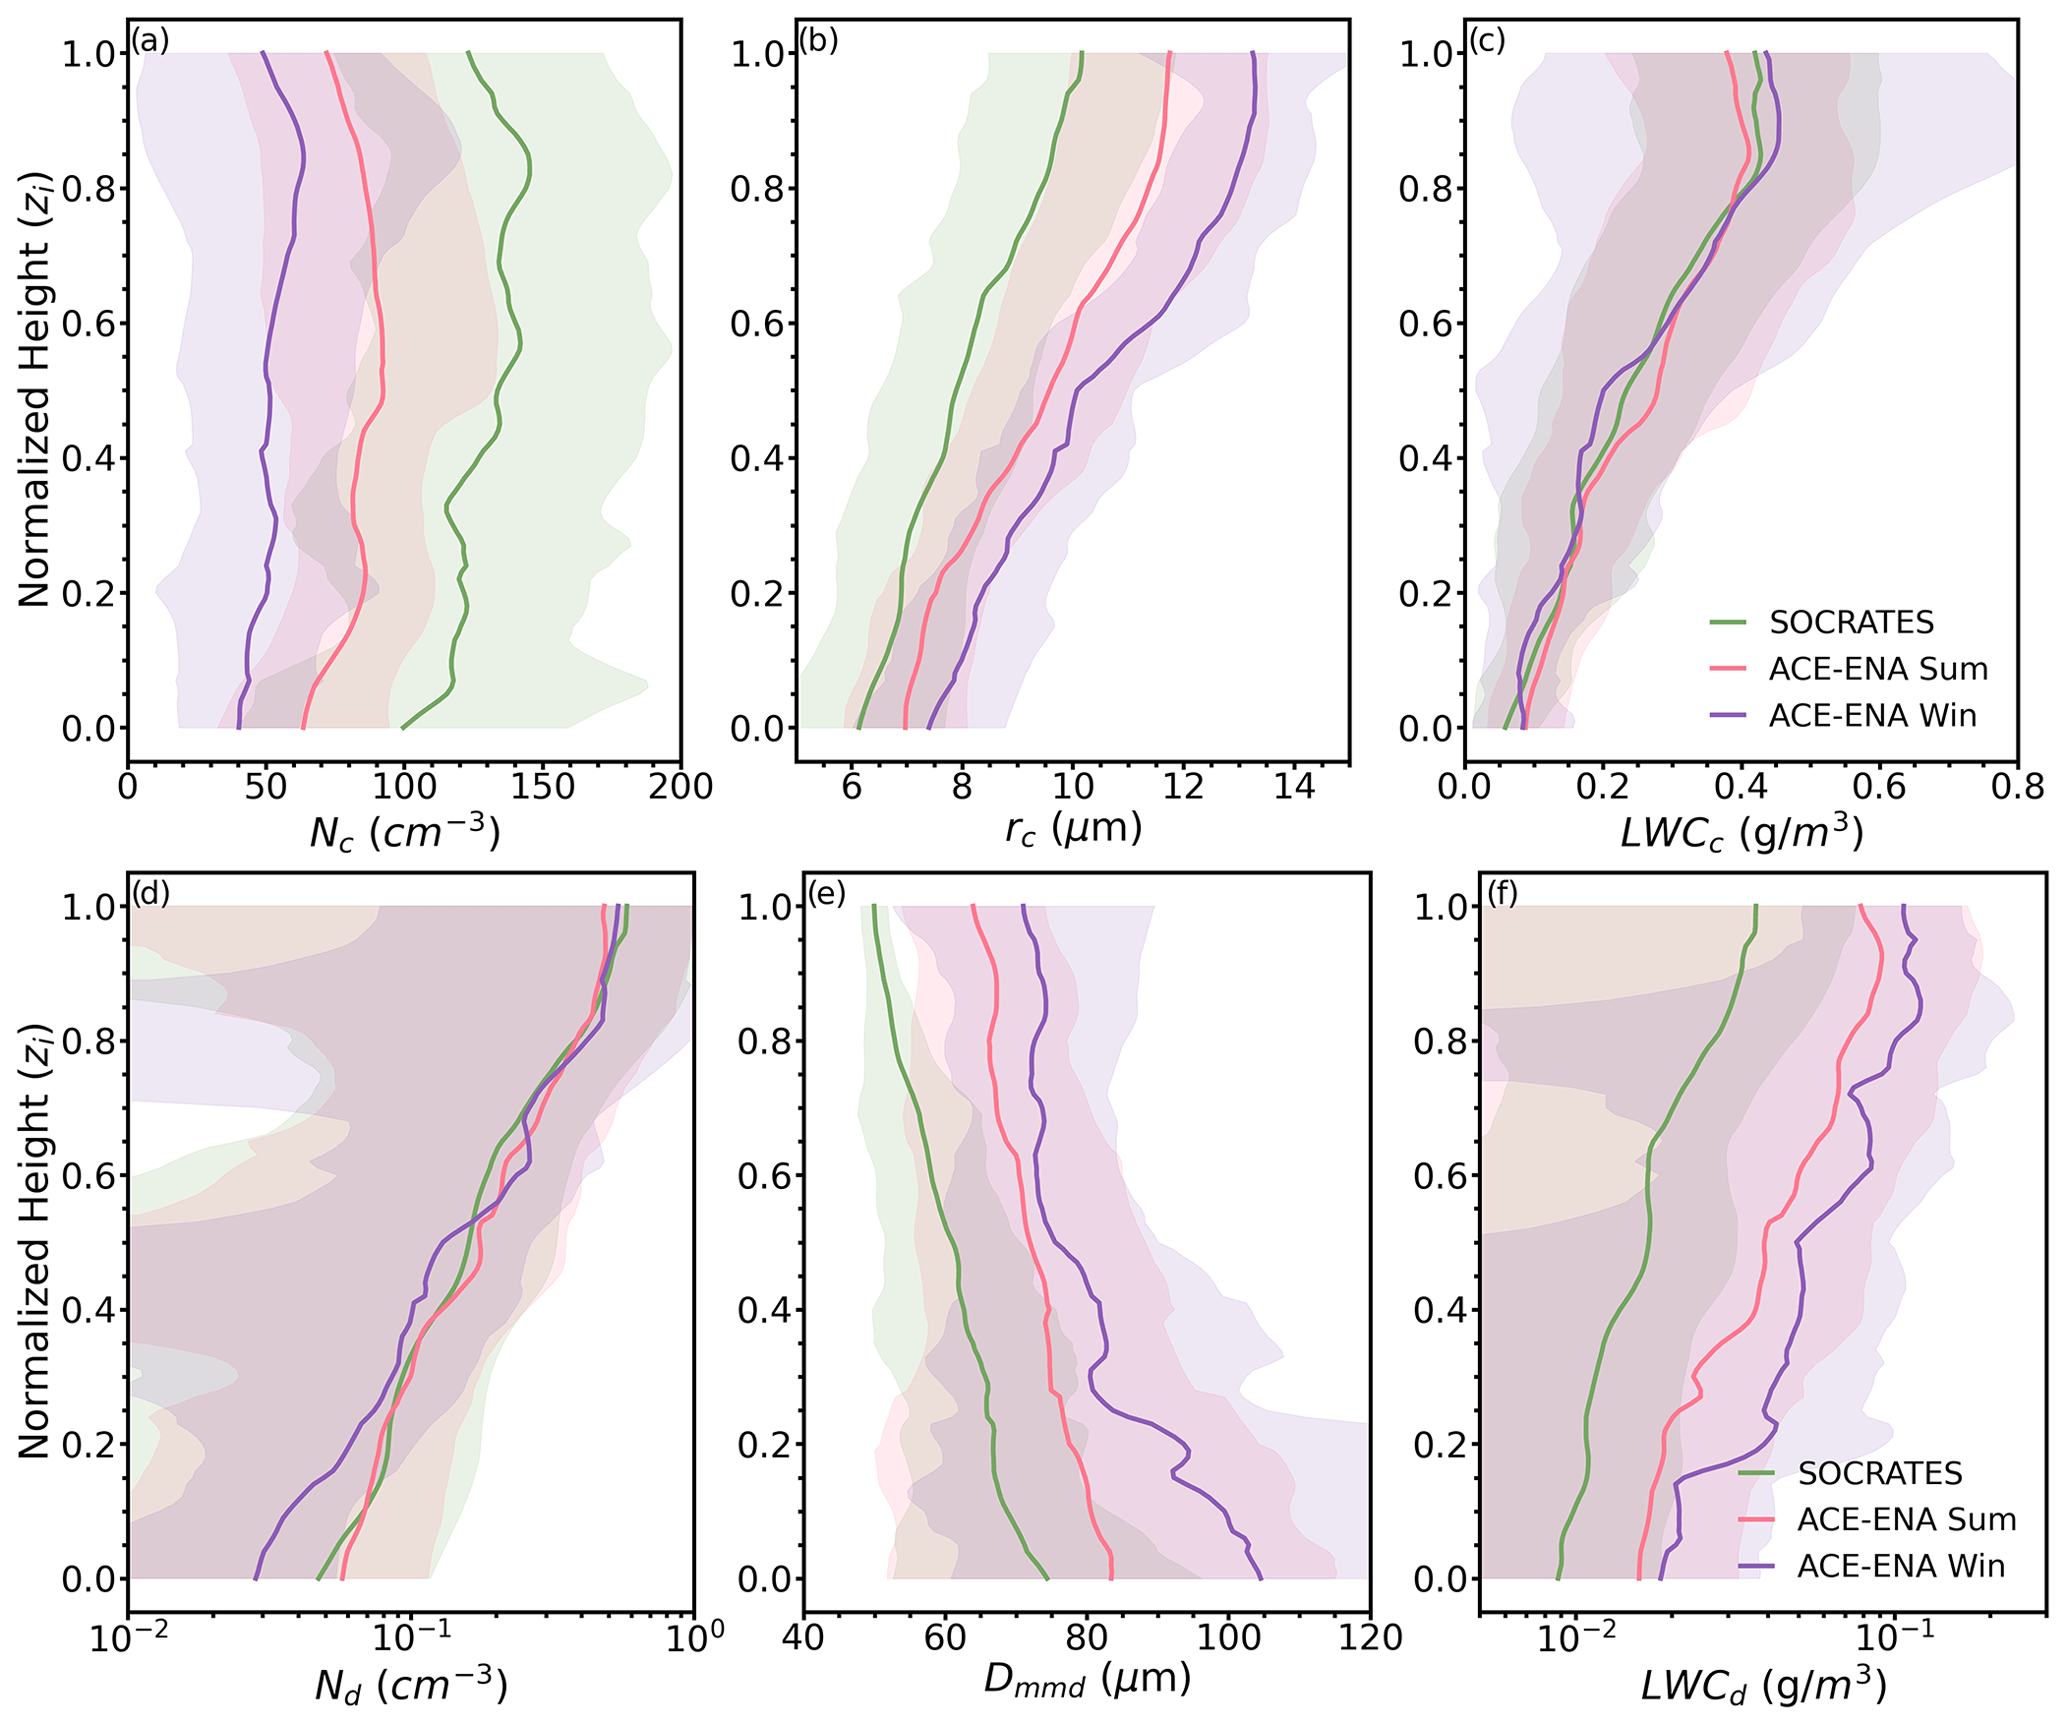
Figure 3Vertical distributions of Nc (a), rc (b), LWCc (c), Nd (d), Dmmd (e), and LWCd (f). Here the zi=0 denotes the cloud base, and zi=1 denotes the cloud top. Shaded areas denote the inter-cloud-case standard deviations. The ACE-ENA Sum, ACE-ENA Win, and SOCRATES values are color-coded in pink, purple, and green, respectively.
The warmer and drier air near the cloud top entrains into the cloud layer and further mixes downward, often resulting in the evaporation of small cloud droplets and the shrinking of droplet sizes, which oppose condensational growth (Desai et al., 2021). Decreases in both Nc and LWCc and the reduced growth of rc near the cloud-top (zi>0.85) support signals of cloud-top entrainment mixing during all three IOPs. It is interesting to note that the rc values from SOCRATES increase monotonically from the cloud base to the top, while the rc values from both ACE-ENA Sum and ACE-ENA Win increase until zi≈0.8 and then remain nearly constant, although all of their Nc values (at zi≈0.8) decrease towards the cloud top. When dry air entrainment occurs at the cloud top, some of the upper-level smaller cloud droplets will evaporate, leading to decreases in Nc (Fig. 3a). As a result, the nearly constant rc values (at zi>0.8) might represent the equilibrium balance between two competing processes, namely cloud droplet condensational and collision–coalescence growths and the entrainment-mixing evaporation effects.
Carrying the distinct discrepancies in the mean values for all layers, the Nc and rc values from ACE-ENA Sum and ACE-ENA Win clouds experienced similar vertical evolutions to SOCRATES. The increases in rc (δrc) from cloud base to cloud top are 4.03, 4.78, and 5.85 µm, with percentage increases of 66 %, 68 %, and 79 %, for SOCRATES, ACE-ENA Sum, and ACE-ENA Win, respectively. Even though, theoretically, the condensational growth effect would be more pronounced on smaller cloud droplets due to their smaller surface area (Wallace and Hobbs, 2006), SOCRATES exhibits the thickest mean cloud thickness but experienced the least rc increase among the three IOPs. This suggests that high-aerosol loading limits the overall growth of the cloud droplet size distribution (DSD) in SOCRATES clouds, while in contrast, the ACE-ENA Win clouds show the strongest rc increase. This comparison indicates different cloud microphysical responses to aerosol perturbations in the three IOPs, which will be further discussed in Sect. 4.1. The LWCc values from the three IOPs are comparable to each other. The vertical distributions of MBL cloud microphysical properties examined in this study are in good agreement with the previous studies conducted on these two field campaigns (Wu et al., 2020a; Y. Wang et al., 2021a; Wang et al., 2022, 2023). Cloud adiabaticity is a key parameter as it provides insight into the degree of mixing and microphysical processes occurring within clouds. The sub-adiabatic conditions indicate that the LWCc is less than what would be expected in an adiabatic scenario, often due to processes such as in-cloud collision–coalescence and entrainment mixing (Hill et al., 2009; Braun et al., 2018; Gao et al., 2020; Wu et al., 2020b). In addition, the cloud adiabaticity is defined as fad= LWCc/LWCad, where LWCad denotes adiabatic LWC (Wu et al., 2020b). As shown in Fig. S4, the clouds from all three IOPs feature certain levels of sub-adiabaticity above the cloud base. Considering the inter-cloud-layer mean fad, the campaign mean fad values are 0.689±0.229, 0.542±0.143, and 0.490±0.207 for SOCRATES, ACE-ENA Sum, and ACE-ENA Win, respectively.
To quantitatively evaluate the impact of the cloud-top entrainment-mixing rate on cloud droplets, we adapt the method of Albrecht et al. (2016), where the cloud-top entrainment rate (we) can be expressed as
where the turbulence kinetic energy (TKE) dissipation coefficient Aσ is empirically taken as 26 as in Albrecht et al. (2016), and the Riσ is the buoyancy Richardson number calculated by . σw denotes the standard deviation of the vertical velocities taken near the cloud top (zi>0.9), and h is the MBL height. θ0 is the reference potential temperature, and Δθv is the virtual potential temperature difference across the temperature inversion layer above the cloud. Given the valid cloud-top virtual potential temperature and vertical velocity measurements for the selected cloud cases, the averaged we values are 0.570±0.834, 0.581±0.560, and 0.960±1.127 cm s−1 for SOCRATES, ACE-ENA Sum, and ACE-ENA Win, respectively. The stronger we during ACE-ENA Win might be induced by the generally weaker cloud-top inversions and stronger near-cloud-top turbulence (Fig. 5a), compared to the summertime when the ENA is dominated by the large-scale high-pressure system (Ghate et al., 2021). Within the above-cloud inversion layer, the temperature (water vapor mixing ratio) differences ΔT (Δq) are 1.76 K (−1.75 g kg−1), 1.54 K (−1.66 g kg−1), and 1.48 K (−1.09 g kg−1) for SOCRATES, ACE-ENA Sum, and ACE-ENA Win, respectively. The virtual potential temperature differences Δθv are 4.90, 5.16, and 3.82 K, for SOCRATES, ACE-ENA Sum, and ACE-ENA Win, respectively, indicating relatively drier entrained air masses during SOCRATES and ACE-ENA Sum. Considering the near-cloud-top proportion of cloud where the LWCc experienced decrease, the difference in LWCc (between the cloud-top value and the upper–middle cloud maximum for the mean profiles) for the ACE-ENA Sum (−0.032 g m−3) is higher than the reductions in ACE-ENA Win (−0.018 g m−3) and SOCRATES (−0.009 g m−3), although the we for ACE-ENA Sum is comparable to SOCRATES and much lower than ACE-ENA Win values. The warmer and drier entrained air can partially contribute to the greater LWCc reduction and the lower fad (0.39) during the ACE-ENA Sum than those during the ACE-ENA Win (fad=0.45) and SOCRATES (fad=0.66) near the cloud top (Fig. S4). For the three IOPs, the Nc and LWCc values exhibit stable trends from the cloud base, followed by noticeable decreases near the cloud-top mixing zone, while the changes in rc trends near the cloud top were not as dramatic as the others. Such characteristics of the cloud microphysics vertical profiles indicate the signal of inhomogeneous mixing, which occurs when dry and warm air mixes unevenly and slowly with the cloud air, hence partially evaporating the cloud droplets (Lehmann et al., 2009; Lu et al., 2011). The results are consistent with previous research results regarding stratocumulus clouds over multiple field campaigns (Brenguier et al., 2011; Jia et al., 2019) and with the findings for selected cases during ACE-ENA (Yeom et al., 2021) and SOCRATES (Sanchez et al., 2020). The near-cloud-top rc profiles (zi>0.8) for the ACE-ENA cases exhibit fewer increases compared to SOCRATES, which could possibly be attributed to more effective mixing due to the stronger entrainment rate, particularly during ACE-ENA Win, eventually reaching a smaller equilibrium in terms of mean sizes.
Figure 3d–f illustrate the normalized profiles of MBL drizzle microphysical properties. The Nd values from the three IOPs mimic each other, which all maximize at the cloud top and then monotonically decrease toward the cloud base (Fig. 3d), while their LWCd values follow a similar trend, albeit with relatively large differences (Fig. 3f). In contrast to the Nd and LWCd trends, the Dmmd values gradually increase from cloud top to cloud base (Fig. 3e), making physical sense since the drizzle droplets are typically formed near the cloud top and continuously grow via a collision–coalescence process while falling. The ACE-ENA Win drizzle Dmmd and LWCd values are distinctively larger than those in ACE-ENA Sum and SOCRATES. It is interesting to note that near the cloud top (zi>0.9), ACE-ENA Win has comparable Nd but much larger Dmmd than the other two IOPs, suggesting that there were more larger drizzle embryos formed from large cloud droplets (Fig. 3b) during ACE-ENA Win. It is noteworthy that the Dmmd in the region in the lower-half of the ACE-ENA Win clouds experienced rapid growth from ∼80 to ∼105 µm (Fig. 3e), and this increment of ∼25 µm contributed to most of theDmmd growth from cloud top to cloud base (33.5 µm), indicating a stronger warm-rain process during the winter.
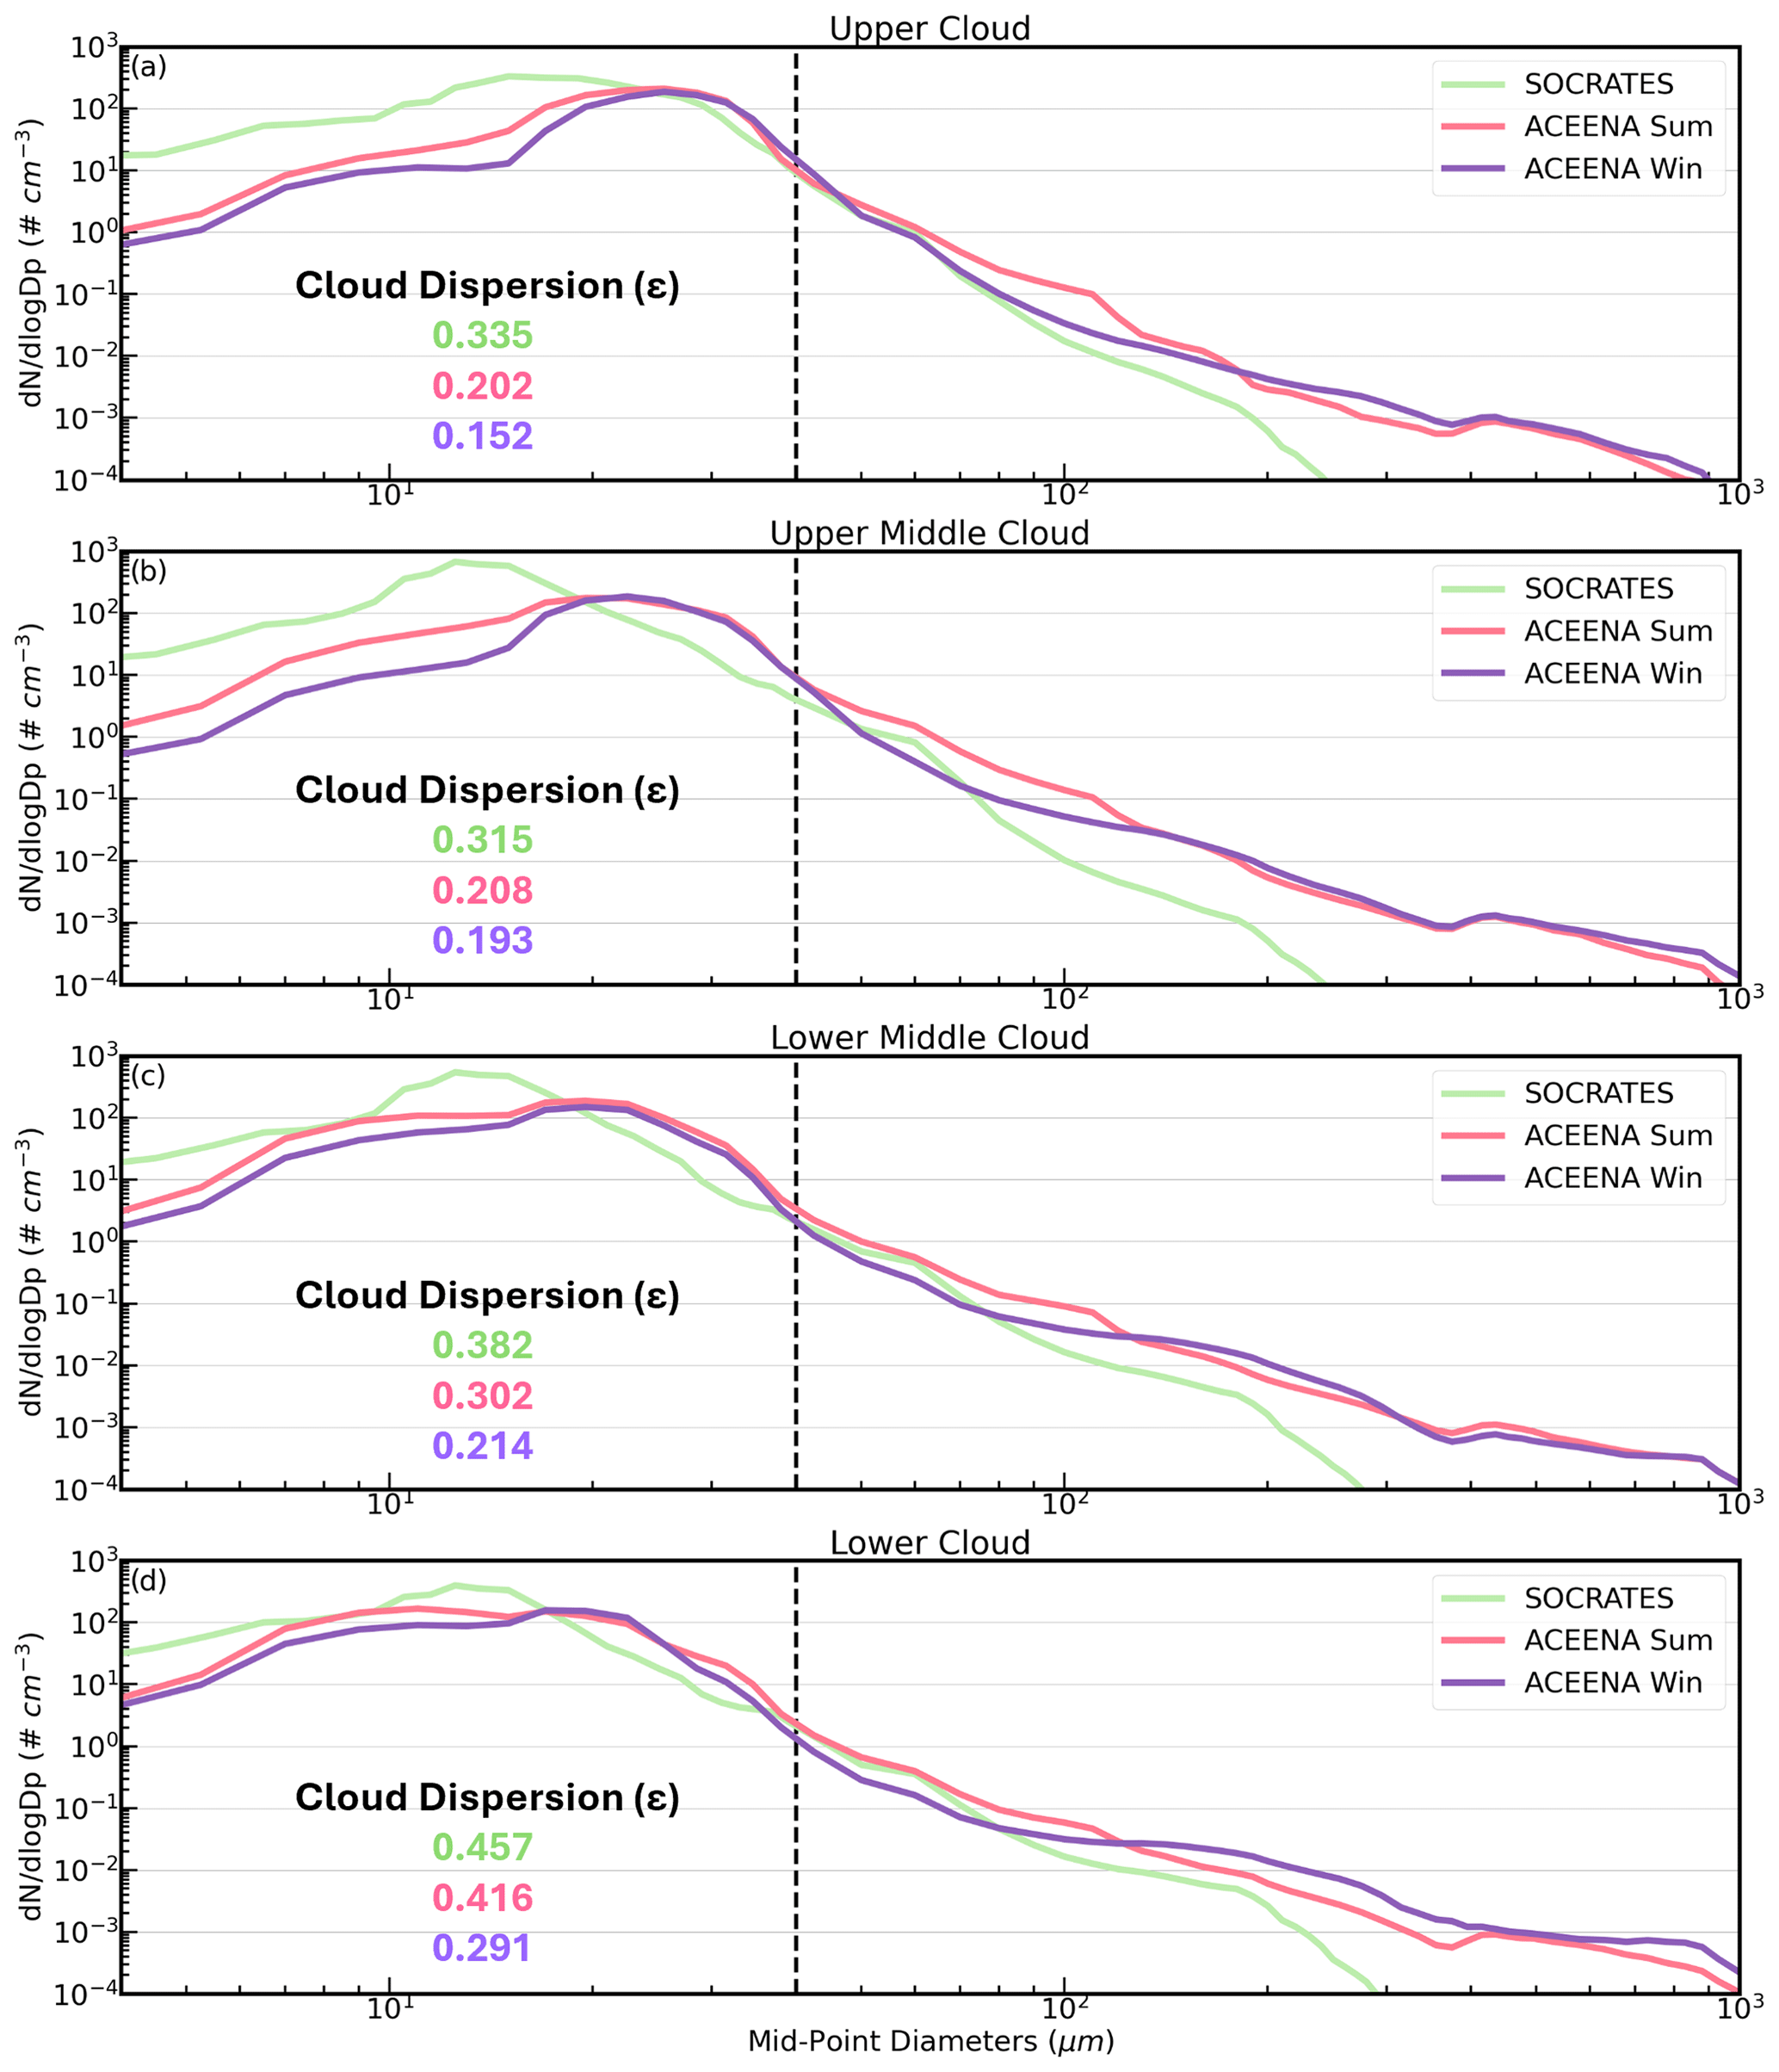
Figure 4Cloud and drizzle size distributions for (a) upper cloud (zi>0.8), (b) upper–middle cloud (), (c) lower–middle cloud (), and (d) lower cloud (zi<0.2). The vertical dashed line at Dp=40 µm denotes the demarcation between cloud droplets and drizzle drops. The ACE-ENA Sum, ACE-ENA Win, and SOCRATES values are color-coded in pink, purple, and green, respectively.
In order to further analyze the cloud-to-drizzle conversion processes, the cloud and drizzle DSDs are categorized into four segments, based on their relative position within the cloud layer, as follows (Fig. 4): upper cloud (zi>0.8; Fig. 4a), upper–middle cloud (; Fig. 4b), lower–middle cloud (; Fig. 4c), and lower cloud (zi<0.2, Fig. 4d). The cloud DSDs (Dp<40 µm) from the three IOPs gradually shift towards larger sizes, moving from the lower- to the upper-cloud regions. This is accompanied by the narrowing of the cloud DSD ranges, as evidenced by the decline in the relative dispersion of cloud droplets (ϵ), which is defined as the ratio between the standard deviation and the mean radius of the distribution. At the lower portion of the cloud (Fig. 4d), the relatively greater value of ϵ represents the co-existence of the newly formed small cloud droplets from recently activated CCN and the sedimentation of larger droplets from the upper sections of the cloud. In addition, the discrepancies in ϵ between the three IOPs may be attributed to the sub-cloud aerosol differences, which essentially resided in different microphysical regimes. Y. Wang et al. (2021a) stated that higher aerosol loading would lead to increased ϵ due to the water vapor competition effect, supporting the discrepancy between SOCRATES and ACE-ENA Sum, which can be categorized as a water-vapor-limited regime. Meanwhile, ACE-ENA Win exhibits the characteristics of an aerosol-limited regime in which the cloud DSDs tend to be narrower than in the water-limited regime, due to enhanced droplet growth, and the ϵ values further decrease with height via the condensational narrowing effect (J. Chen et al., 2018).
Notably, for the four cloud portions from cloud base to cloud top, the skewness of summer (winter) cloud DSDs is 0.627 (0.271), 0.358 (0.175), 0.098 (−0.063), and −0.362 (−0.554), respectively. The cloud DSDs during ACE-ENA Win exhibit a more pronounced negative skew (to the left) than those during ACE-ENA Sum, which can be partially attributed to the activation of more sub-cloud coarse mode aerosols becoming larger cloud embryos, as demonstrated in Fig. 2. These coarse mode aerosols, whether from the primary production of sea spray or the residuals of evaporated drizzle drops, are more easily activated (or re-activated) into larger cloud droplets when they intrude (or recirculate) into the cloud layer (Hudson and Noble, 2020; Hoffmann and Feingold, 2023). Nevertheless, it is challenging to pinpoint the actual origins of coarse mode aerosols from the perspective of aircraft observational snapshots, thus requiring further numerical modeling work. Ascending within the cloud, the process of water vapor condensation perpetually pushes the DSD towards larger sizes, culminating in a more negatively skewed DSD. Concurrently, the cloud-top entrainment mixing plays a pivotal role in minimizing ϵ in the upper-cloud region, as elaborated by Lu et al. (2023).
In the upper region of the cloud (Fig. 4a), the ACE-ENA Win clouds contain more cloud droplets close to 40 µm, although the mean Nc is lower. This scenario is conducive to the formation of larger drizzle embryos compared to summertime clouds, as depicted in Fig. 3e. In comparison, the SOCRATES clouds feature a pronounced log-normal DSD compared to during ACE-ENA, as the DSDs peak at Dp∼15 µm throughout the cloud, and subsequently, the lack of larger cloud droplets results in the smaller drizzle embryos near the cloud top. As the newly formed drizzle drops descend and continuously grow through the collision–coalescence process, the drizzle DSDs (Dp> 40 µm) are noticeably broadened. From upper- to lower-cloud regions, the longer tails of the drizzle DSDs expand at the cost of smaller drizzle drops and cloud droplets via the collision–coalescence process. The clouds observed during ACE-ENA, especially in wintertime, contain more larger drizzle drops (Dp>200 µm) than SOCRATES, which is reflected in the distinct differences in the vertical Dmmd, as shown in Fig. 3e.
It has been intensively studied that in-cloud turbulence can stimulate collision–coalescence and consequently enhance the drizzle evolution processes (Pinsky et al., 2007; Grabowski and Wang, 2013; Wu et al., 2017; S. Chen et al., 2018). The turbulence strength is characterized by the turbulence kinetic energy (TKE), which is calculated as
where the turbulent perturbations of vertical () and horizontal ( and ) components are calculated as the simple moving variance in a 10 s window centered at the measurement time, without window weighting function, using 1 Hz data for all three IOPs. The w data are confined to an absolute aircraft roll angle of less than 5° (Cooper et al., 2016). Given the average aircraft ground speed of ∼140 m s−1 and vertical speed of ∼5 m s−1 (Atlas et al., 2020), the smallest resolved wavelength is 140 m. Hence, within the 10 s moving window, the ∼50 m in the integral vertical range is able to resolve the eddies up to ∼1400 m in size and preserve the potential of capturing the inertial subrange.
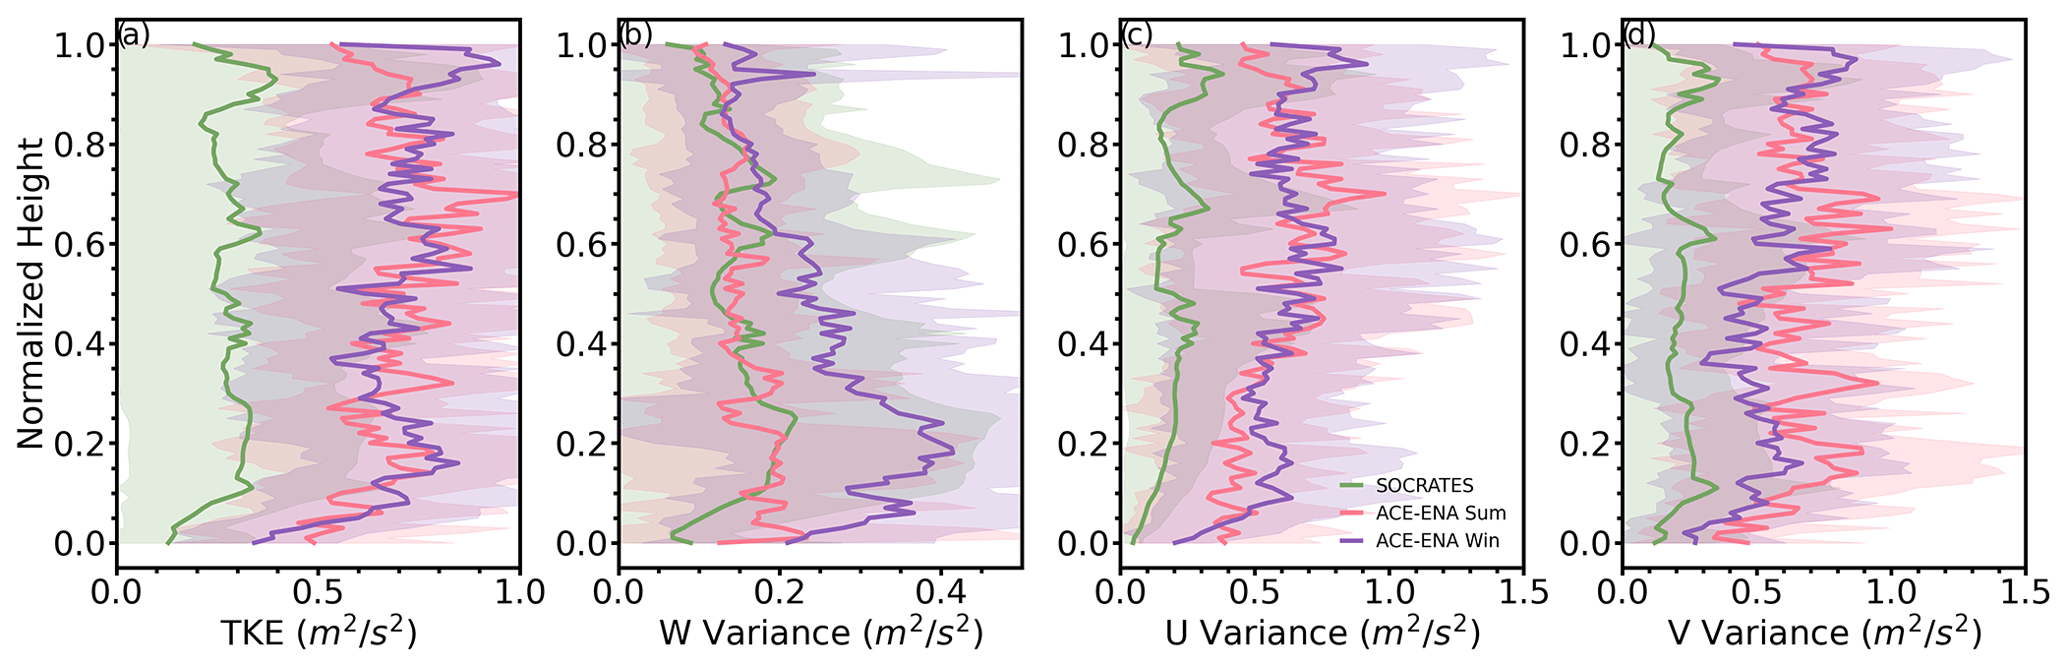
Figure 5Vertical distributions of in-cloud TKE (a), (b), (c), and (d). Shaded areas denote the inter-cloud-case standard deviations. The ACE-ENA Sum, ACE-ENA Win, and SOCRATES values are color-coded in pink, purple, and green, respectively.
As shown in Fig. 5, the vertical wind variances (Fig. 5b) in ACE-ENA Win (layer mean of 0.244 m2 s−2) are generally higher than those in ACE-ENA Sum (0.153 m2 s−2) and SOCRATES (0.147 m2 s−2), while the horizontal wind variances (Fig. 5c and d) are comparable between ACE-ENA Sum and ACE-ENA Win but much higher than SOCRATES, resulting in higher TKE during ACE-ENA. Note that the higher near the cloud top corresponds to the stronger entrainment rate in ACE-ENA Win. Near the cloud top, turbulence effectively enhances coalescence between the larger cloud droplets, primarily by increasing the relative velocities between droplets (Magaritz-Ronen et al., 2016; Ghate and Cadeddu, 2019), and this is especially true for the vertical component of TKE. The horizontal turbulence components, the and , can also play a role in mixing the ambient air masses and contribute to the broadening of DSD (Wu et al., 2017). The use of TKE provides an illustration of how the in-cloud turbulence during ACE-ENA is stronger than that observed during SOCRATES. That being said, the quantitative evaluation of the turbulent enhancement of collision–coalescence requires access to the eddy dissipation rate, as typically used in model parameterizations (Grabowski and Wang, 2013; Witte et al., 2019). The smallest scales resolvable with the 1 Hz measurement used in this study are on the order of 140 m, thus capturing only the larger-scale end of the inertial subrange and larger turbulent motions. Consequently, the ability to resolve smaller eddies and turbulent structures, crucial for understanding the energy cascade within the inertial subrange, is limited by coarse spatial and temporal resolutions and aliasing issues (Siebert et al., 2010; Muñoz-Esparza et al., 2018; Kim et al., 2022). Therefore, to fully resolve the spectrum of turbulence and quantitatively examine the energy dissipation and mixing processes, access to higher-frequency measurements is required to capture smaller eddies within the inertial subrange (Siebert et al., 2010; Lu et al., 2011; Wacławczyk et al., 2017). Additionally, further quantifying the entrainment-mixing mechanisms also requires high-frequency eddy dissipation and accurate examination of the mixing timescale (Lehmann et al., 2009; Lu et al., 2011) for individual profiles. Though currently beyond the scope of this study, utilizing the high-rate measurements of velocities available from SOCRATES (at 25 Hz) and ACE-ENA (at 20 Hz) to explore those mechanisms further will be of interest to future investigations.
Drizzle formation and evolution in the ACE-ENA Win clouds are noticeably stronger than in the other two IOPs, which could be attributed to multiple factors. First, the ambient aerosols and CCN during winter are substantially fewer, featuring clean environments that promote the formation of generally larger cloud droplets due to the availability of more water content per droplet. Larger cloud droplets are more likely to collide and coalesce into drizzle drops, leading to relatively heavier precipitation (Chen et al., 2011; Duong et al., 2011; Mann et al., 2014). Furthermore, deeper cloud layers with a mean thickness of (392.4 m) during ACE-ENA Win were observed when compared to the ACE-ENA Sum clouds (336.3 m). In a thicker cloud layer with sufficient turbulence, the residence times of large cloud droplets and drizzle drops would become longer, and the chance of collision–coalescence growth could be effectively increased by recirculating the drizzle drops (Brost et al., 1982; Feingold et al., 1996; Magaritz et al., 2009; Ghate et al., 2021). Additionally, the prevalence of winter season precipitation–evaporation-induced MBL cold pools disturbs the MBL thermodynamics and contributes to turbulent mixing (Zuidema et al., 2017) and can provide a strong dynamical forcing perturbation to the warm-rain process (Jenson et al., 2021; J. Wang et al., 2022; Smalley et al., 2024). The physical hypotheses from previous studies could potentially serve as the explanation for the phenomena that the ACE-ENA Win drizzle DSD is sufficiently broadened, and the Dmmd is enlarged toward the cloud base. In comparison, although SOCRATES exhibits even thicker clouds (487.4 m), the drizzle processes are seemingly suppressed by the much higher ambient aerosol and CCN concentrations.
4.1 Cloud microphysical responses on aerosols
The impacts of aerosol loading on cloud microphysical properties can be assessed by the aerosol–cloud interaction (ACI) index, which can be quantified as both
and
which emphasizes the cloud microphysical responses to CCN via the relative logarithmic change in Nc and rc to the change in NCCN 0.35 % (Feingold et al., 2003; McComiskey et al., 2009). Physically, the ACI process involves aerosols intruding into the cloud layer, activating as cloud droplets, and subsequently altering cloud DSD and dispersion (Zheng et al., 2022a, b) under varying water vapor conditions. Therefore, the cloud microphysical responses within the lower region of the cloud are assessed, which is the first stage in which the sub-cloud CCN can directly interact with the cloud droplets. Furthermore, the similarity in the vertical integral of LWCc (as shown in Fig. 3c) provides comparable liquid water between three IOPs for the assessment of newly generated cloud embryos from activated CCN because the ACIr is normally assessed under a fixed liquid water (Zheng et al., 2020).
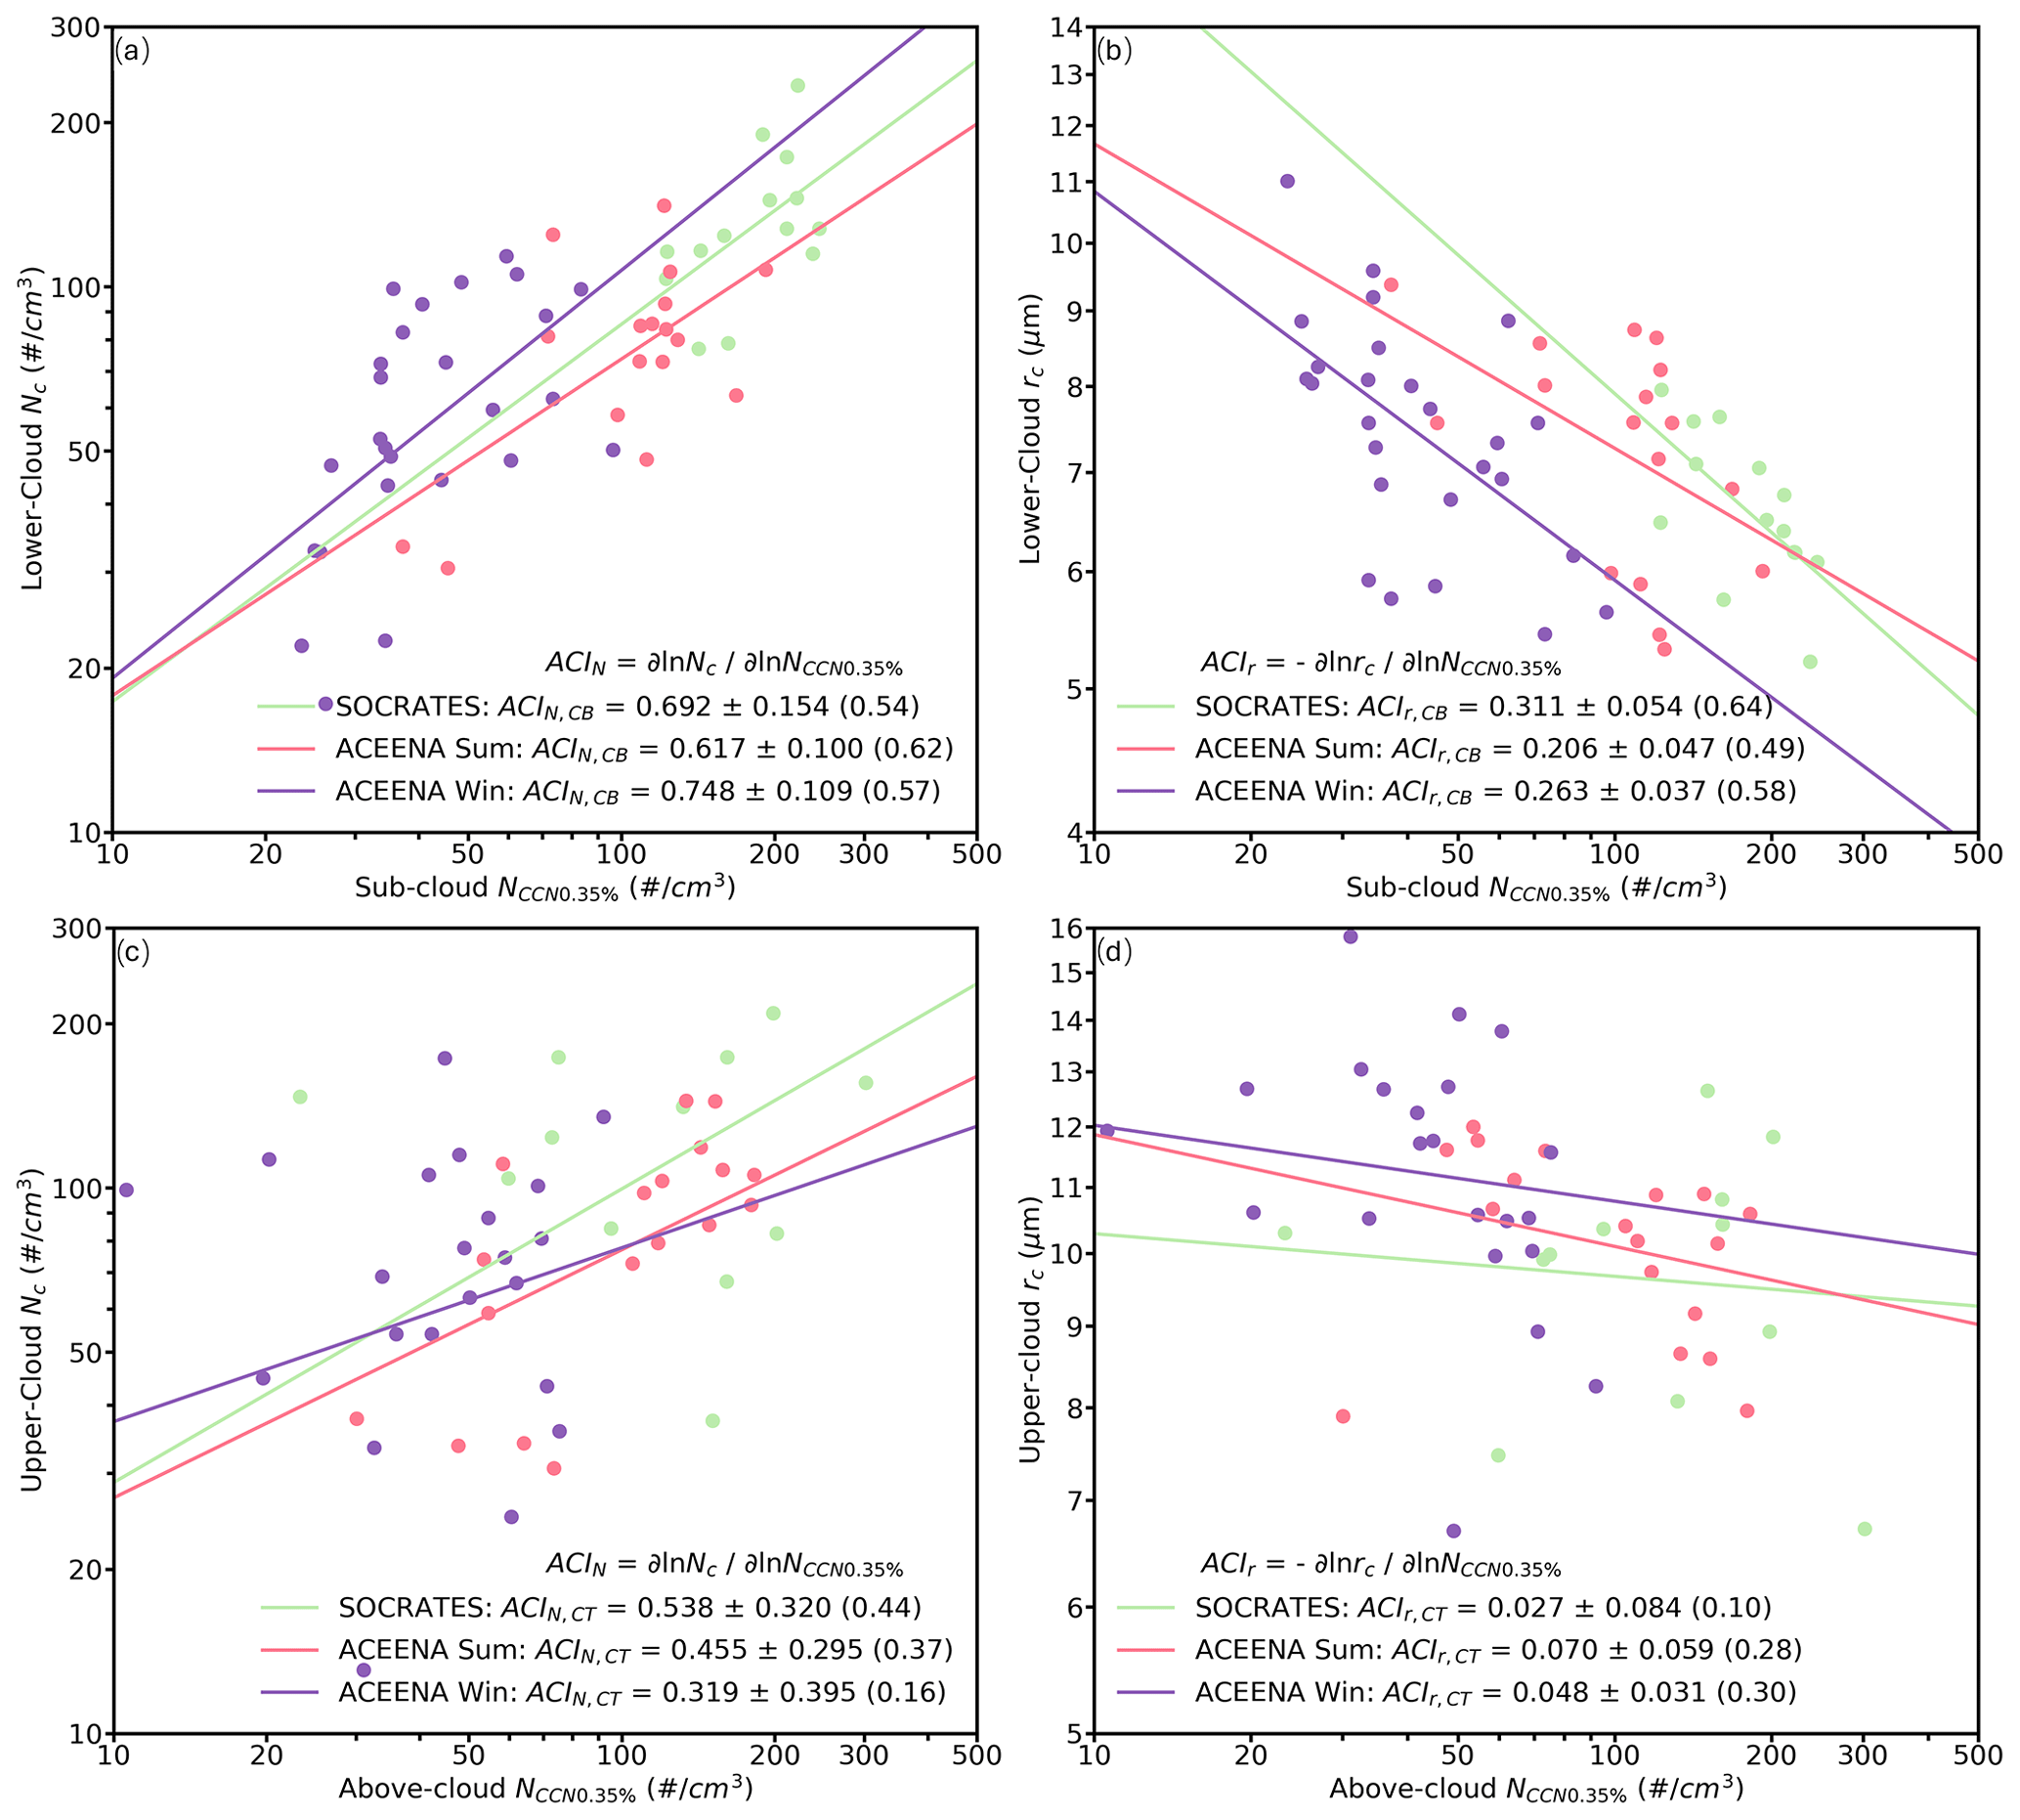
Figure 6Scatterplots of the (a) Nc and (b) rc at the lower cloud (zi<0.2) against the sub-cloud NCCN 0.35 % and the (c) Nc and (d) rc at the upper cloud (zi>0.8) against the above-cloud NCCN 0.35 %. The statistical metrics in the legends denote the ACI values and standard errors and the absolute values of correlation coefficients (in parentheses). The ACE-ENA Sum, ACE-ENA Win, and SOCRATES values are color-coded in pink, purple, and green, respectively.
Considering all the cases from three IOPs with available CCN measurements (some cases without CCN measurements during SOCRATES), the Nc and rc values at the lower cloud (zi<0.2) are plotted against the sub-cloud NCCN 0.35 % in Fig. 6a and b, and the ACI indices are calculated as ACIN,CB and ACIr,CB (CB denoting the assessment near the cloud base). The ACI indices from three IOPs are in the ACI range of the previous studies in MBL clouds (Twohy et al., 2005; Lu et al., 2009; Diamond et al., 2018) using aircraft in situ measurements. Note that the availability of valid sub-cloud measurements inevitably limits the sample size, especially for SOCRATES, as shown in Table S2. As shown in Fig. 6a, the ACIN,CB for ACE-ENA Win (0.748) is higher than ACE-ENA Sum (0.617), indicating that Nc is more sensitive to the sub-cloud NCCN 0.35 % during the winter. In other words, aerosols intruding into the cloud layer are easily activated to become cloud droplets. The Nc sensitivity for the SOCRATES cloud (0.692) lies between the two ACE-ENA IOPs. The ACIN,CB values from three IOPs are generally higher than the ACIN values from the layer mean Nc against the sub-cloud NCCN 0.35 % (not shown). Previous studies have shown that the enhanced vertical turbulence (updraft velocity) can effectively facilitate CCN replenishment into the cloud layer (Hu et al., 2021; Zheng et al., 2022a, b) and increase the actual in-cloud supersaturation (Brunke et al., 2022), thus leading to a more efficient cloud droplet formation, enhancing the ACIN,CB. By correlating the mean TKE values with the CCN activation ratio () for all individual cloud cases, the three IOPs show moderate but statistically significant correlation coefficients of 0.36, 0.55, and 0.51 for ACE-ENA Sum, ACE-ENA Win, and SOCRATES, respectively. This result reinforces the notion that the CCN activation fractions, particularly during the ACE-ENA Win, are significantly correlated with in-cloud turbulence intensities. Furthermore, more coarse mode aerosols during ACE-ENA Win are also favorable to the activation efficiency (Dusek et al., 2006).
As for the rc responses to CCN (Fig. 6b), the typical Twomey effect, where more CCN compete against available water vapor and result in smaller cloud droplets, is evident by different cloud susceptibility between the three IOPs. SOCRATES features a higher ACIr,CB (0.311), suggesting that an increase in NCCN 0.35 % can result in a significant decrease in rc compared to ACE-ENA Sum (0.206) and ACE-ENA Win (0.263). Although the absolute range of variation for rc during SOCRATES is smaller, the slope is much deeper (Fig. 6b). Recall that the sub-cloud NCCN 0.35 % during SOCRATES is generally higher than ACE-ENA and contains more small-sized aerosols (as indicated in Fig. 2b). Consequently, after activation, the lower part of the cloud exhibits a higher number of smaller cloud droplets for SOCRATES, as shown in Fig. 4d. Therefore, as more CCN intrudes into the cloud, the competition for water vapor among newly activated cloud droplets becomes more pronounced, given the similar water availability. In contrast, the presence of larger cloud droplets near the cloud base, whether activated from coarse-mode aerosols or remaining as residuals from collision–coalescence, would elevate the rc, especially under the relatively lesser CCN condition, hence inevitably dampening the ACIr,CB during ACE-ENA. However, a more comprehensive investigation into the cloud microphysical responses to CCN intrusions under a larger range of various water supply conditions, and further untangling the ACI from the meteorological influences, will require additional aircraft cases from more field campaigns. Examples include the VAMOS Ocean–Cloud–Atmosphere–Land Study (VOCALS; Wood et al., 2011), the Cloud System Evolution in the Trades (CSET; Albrecht et al., 2019), the ObseRvations of CLouds above Aerosols and their intEractionS (ORACLES; Redemann et al., 2021), and the Aerosol Cloud meTeorology Interactions oVer the western ATlantic Experiment (ACTIVATE; Sorooshian et al., 2019). Note that the ACIr,CB values in Fig. 6b are also larger than the results from the layer mean rc against sub-cloud NCCN 0.35 %, since the layer mean microphysics is more subject to the cloud droplet evolution processes such as condensational growth and collision–coalescence.
To investigate the ACI indices at the upper level of the cloud, the Nc and rc values at the upper cloud (zi>0.8) are plotted against the above-cloud NCCN 0.35 % in Fig. 6c and d, and the ACI indices are calculated as ACIN,CT and ACIr,CT (denoting the assessments near the cloud top). Compared to the ACIN,CB and ACIr,CB, the ACIN,CT and ACIr,CT are much weaker, especially for ACIr,CT, as the near-cloud-top droplets are too large for above-cloud aerosols to exert a significant influence on rc (Diamond et al., 2018; Gupta et al., 2022). The weaker cloud-top Nc dependence on the NCCN 0.35 % could be due to the legacy of the sub-cloud CCN impacts on Nc being conveyed to the cloud top. This occurs because free-tropospheric aerosols and CCN can be entrained into the MBL before and during the cloud process, as observed in the assessment of inter-cloud cases. Note that the LWCc values near the cloud top for the three IOPs are not comparable to each other, which might also induce uncertainty in the near-cloud-top ACI assessment. These weaker relationships support the notion that although the aerosols entrained into the upper-cloud region can affect the cloud microphysics to a certain degree, the effects are less pronounced than those from the sub-cloud aerosols (Diamond et al., 2018; Wang et al., 2020) because the MBL cloud Nc and rc variations are dominated by the condensational growth, collision–coalescence, and entrainment-mixing processes near the cloud top.
4.2 Precipitation susceptibility
The precipitation susceptibility relies on the assessment of relative responses in the precipitation rate to the change in Nc (Feingold and Seibert, 2009; Sorooshian et al., 2009), which is defined as
where the RCB is the cloud base precipitation rate calculated in Sect. 2 (Eq. 5). By incorporating all the cloud cases, including both precipitating and non-precipitating clouds (the RCB can also be calculated based on the drizzle DSD near the cloud base), the So value accounts for the impact of cloud droplets on the potential precipitation ability of the cloud (Terai et al., 2012).
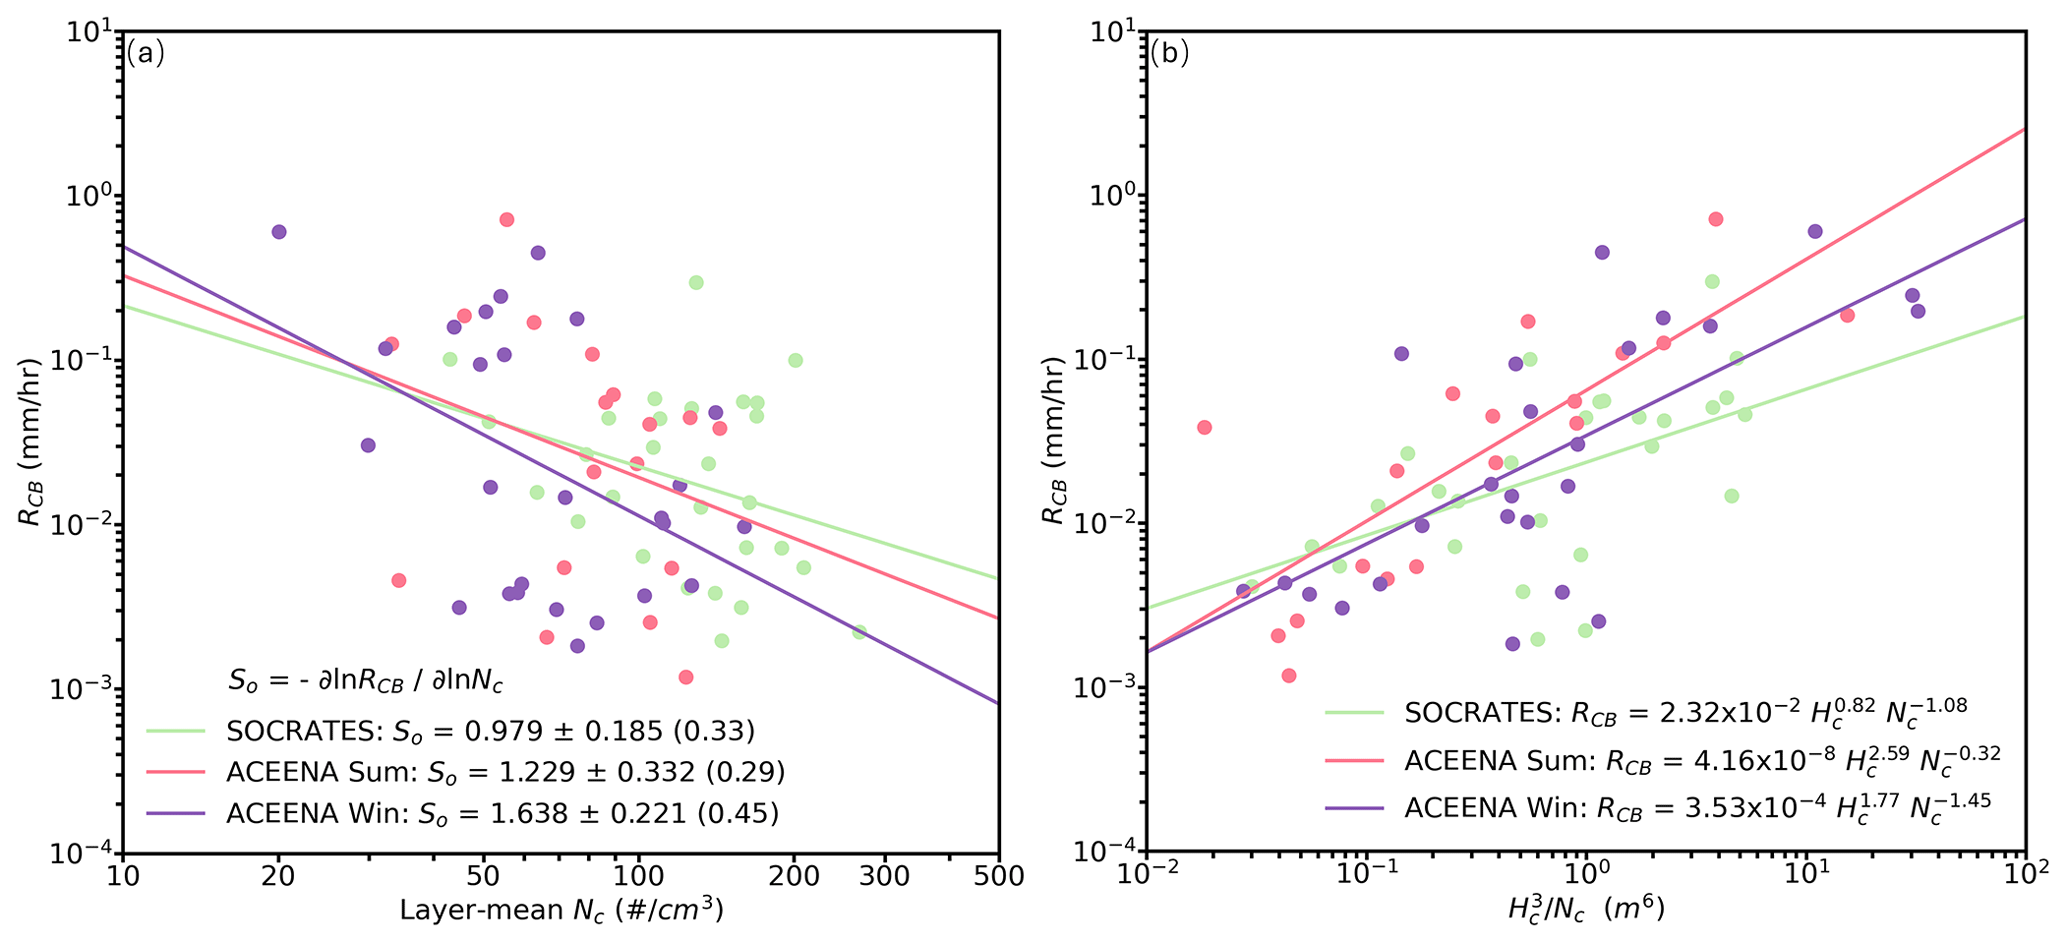
Figure 7Scatterplots of the cloud base precipitation rate RCB against the (a) layer mean Nc and (b) . The ACE-ENA Sum, ACE-ENA Win, and SOCRATES values are color-coded in pink, purple, and green, respectively.
As shown in Fig. 7a, the RCB values generally have a negative correlation with increased layer mean Nc for all three IOPs. The So values are 0.979, 1.229, and 1.638, with the absolute values of correlation coefficients being 0.33, 0.29, and 0.45 for SOCRATES, ACE-ENA Sum, and ACE-ENA Win, respectively. The regression relationships are statistically significant, with p<0.05 for all three IOPs. These correlation coefficient values fall within the reasonable range found in previous studies on precipitation susceptibility in the MBL stratus and stratocumulus clouds (Jung et al., 2016; Gupta et al., 2022) and indicate statistically significant dependences of RCB on Nc. A previous study by Terai et al. (2012) found that the So values decrease with the increasing cloud thickness over the southeastern Pacific, and Jung et al. (2016) found that the So is more pronounced within the medium deep clouds with thicknesses of ∼300–400 m in the MBL stratocumulus over the eastern Pacific. Gupta et al. (2022) found that the So values are generally higher under low ambient Na conditions in the southeastern Atlantic MBL. In this study, RCB for the ACE-ENA Win is more susceptible to the layer mean Nc than the ACE-ENA Sum and SOCRATES, which can be partially attributed to the existence of more larger drizzle drops (as shown in Fig. 4d) near the cloud base in ACE-ENA Win. As previously discussed, the ACE-ENA Win featured enhanced collision–coalescence, suggested by the stronger in-cloud turbulence, and a possible drizzle-recirculating process, as indicated by the previous study. And such mechanisms might explain the low Nc conditions with more larger drizzle drops, leading to the increase in So values during ACE-ENA Win. In comparison, the aerosol of SOCRATES is largely composed of fine Aitken mode aerosol, which results in smaller cloud droplets. Thus, collision–coalescence is ineffective during SOCRATES, which leads to the relatively narrower drizzle DSDs, where the warm-rain processes are suppressed, and, in turn, diminishing the sensitivity of RCB to Nc (Stevens and Feingold, 2009; Fan et al., 2020; Gupta et al., 2022).
It is well known that the RCB values can be parameterized or predicted by assuming an approximate relation with Nc and cloud thickness (Hc), which is usually parameterized in the form of (Lu et al., 2009; Kang et al., 2024). Following the same method, we derive the relationships from three IOPs in Fig. 7b, where the RCB are positively (negatively) proportional to the Hc (Nc), with the exponential parameters in the range of the typical values in the MBL clouds (Comstock et al., 2004; van Zanten et al., 2005; Lu et al., 2009). The statistical coefficient of determination (R2) values of RCB against Hc (Nc) are 0.696 (0.177), 0.419 (0.212), and 0.165 (0.295) for the ACE-ENA Sum, ACE-ENA Win, and SOCRATES, respectively, suggesting that the RCB in ACE-ENA clouds may be more determined by Hc, while the RCB in SOCRATES clouds could be less dependent on both Hc and Nc. Note that the relationship for the SOCRATES values in this study reveals a similar RCB dependence on Nc but a smaller dependence on the cloud thickness than the study by Kang et al. (2024), who concluded a relationship of , based on the rain rate retrieved from radar and lidar measurements and the aerosol concentration also from SOCRATES. The discrepancies are possibly due to the different sample selections and different methods in the RCB calculation. Note that the mean cloud thicknesses of ACE-ENA Sum (336.3 m), ACE-ENA Win (392.4 m), and SOCRATES (487.4 m), are within the thickness range found to exhibit stronger So (Terai et al., 2012; Jung et al., 2016; Gupta et al., 2022).
4.3 Drizzle impacts on sub-cloud CCN and implication to ACI
Multiple studies on the MBL clouds have concluded that the in-cloud drizzle formation and evolution processes can effectively impact the sub-cloud CCN budgets via the coalescence-scavenging effect (Wood, 2006; Diamond et al., 2018; Zheng et al., 2022b; Zhang et al., 2023). Drizzle drops are formed and grow via the collision–coalescence process by collecting cloud droplets and small drizzle drops, resulting in the consumption of CCN (the precursor of cloud droplet), but in the meantime, the in-cloud Nc can be continuously buffered by the sub-cloud CCN replenishment. Although the sub-cloud aerosols (especially in large size) would be added if the drizzle fell and evaporated outside the cloud, the increment cannot compensate for the loss. Therefore, the net result of the whole process is usually presented as the depletion of sub-cloud CCN residuals, and such a drizzle modulation on the CCN budget could be substantial in moderate-to-light drizzles or even non-precipitating clouds, depending on the collision–coalescence efficiency (Feingold et al., 1996; Wood, 2006; Kang et al., 2022).
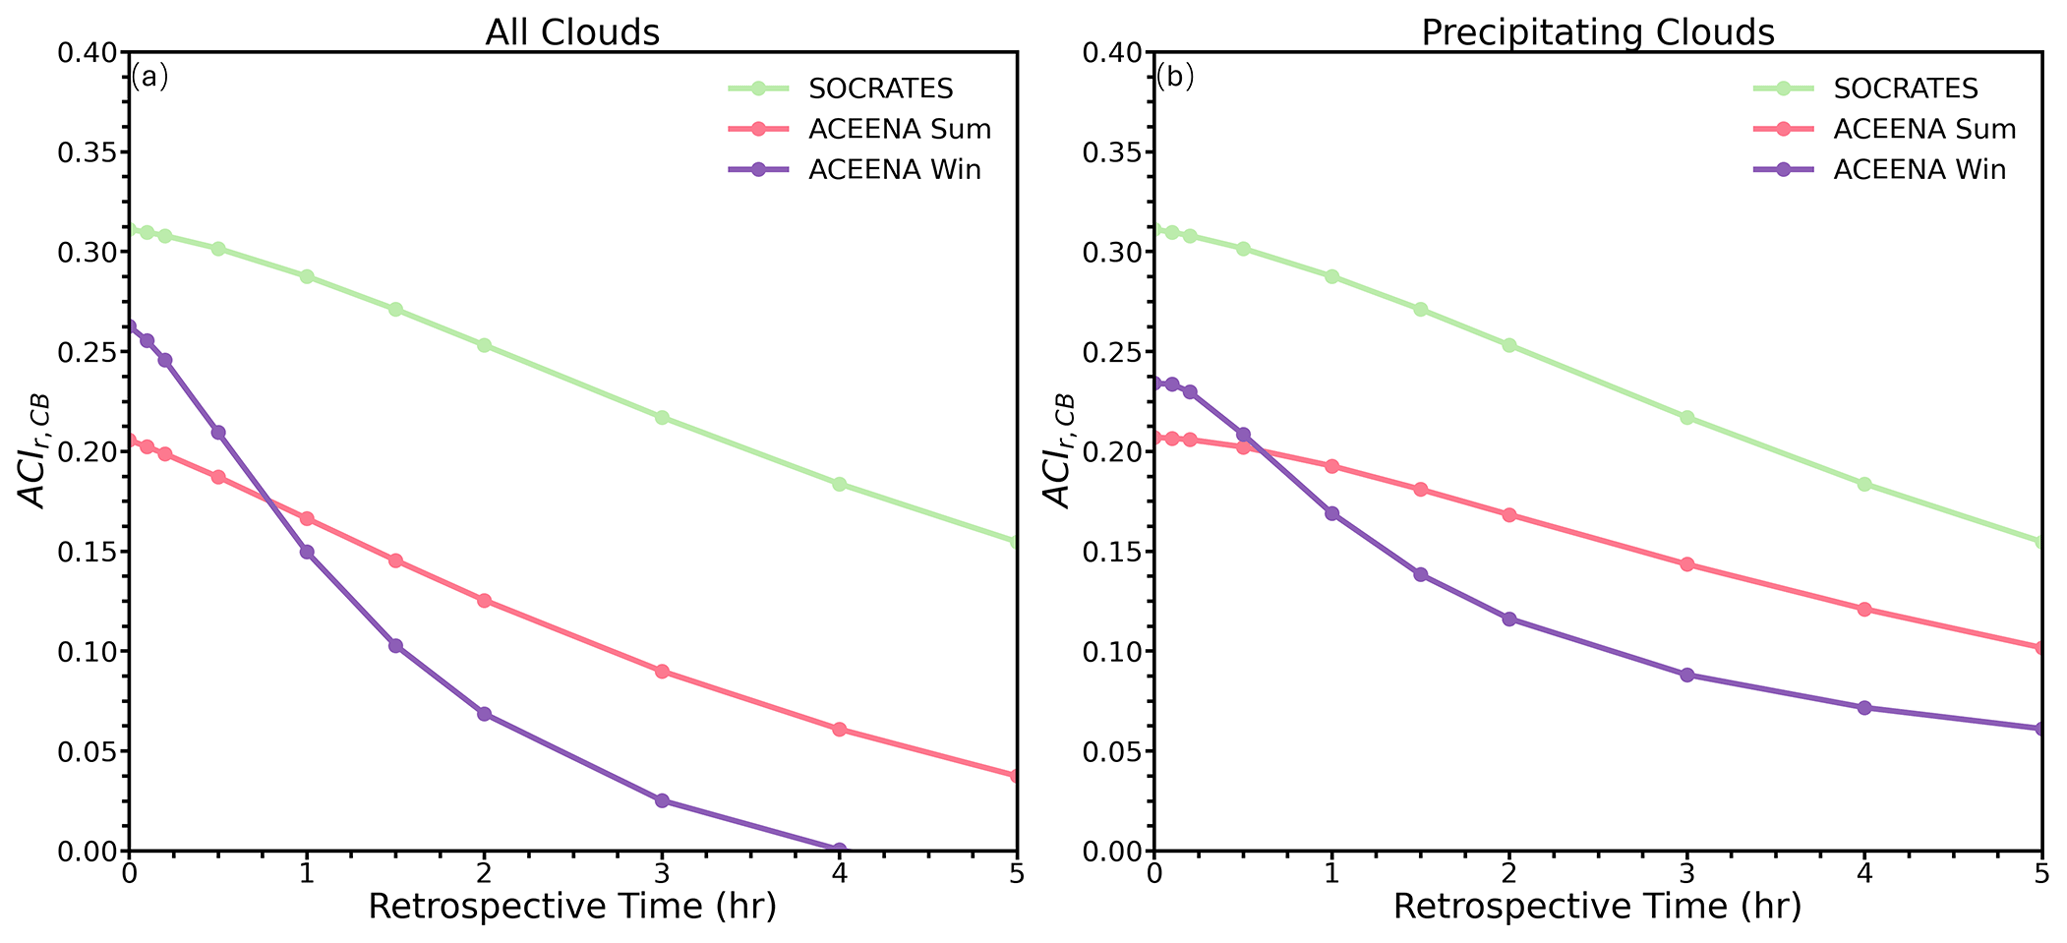
Figure 8ACIr,CB as a function of the sub-cloud NCCN 0.35 % retrospective time for (a) all clouds and (b) precipitating clouds.
The CCN loss rate due to the coalescence-scavenging effect can be calculated as
where the constant K (2.25 m2 kg−1) denotes the drizzle collection efficiency (Wood, 2006; Diamond et al., 2018). Hc is cloud thickness, and Hcp is the coupled layer thickness to ensure that the change in the cloud layer can be sufficiently conveyed throughout the layer. The calculated CCN loss rate for individual cases is listed in Table S2. Considering all cloud (precipitating cloud) scenarios, the mean CCN loss rates are ( ), ( ), and ( ) for ACE-ENA Sum, ACE-ENA Win, and SOCRATES, respectively. As the results indicate, the ACE-ENA clouds experience a more substantial sub-cloud CCN loss than SOCRATES, especially in wintertime-precipitating clouds. Recall that the assessment of ACIr,CB relies on the relative changes in rc and NCCN, while the different LCCN for individual cases can result in the shrinking of the NCCN variation ranges (imagine the abundant CCN are depleted by the coalescence scavenging). In other words, the given change in rc corresponds to a narrowed change in NCCN. Mathematically speaking, the assessment of ACIr,CB depends on the ratio of the numerator (change in rc) and the denominator (change in NCCN). Under the circumstances of substantial cloud-processing to the aerosols, the altered sub-cloud CCN budgets are reflected as a smaller denominator, versus the less altered numerator, and are hence mathematically presented as an enlarged ACIr,CB. Therefore, the coalescence-scavenging effect can not only deplete the sub-cloud CCN but also quantitatively amplify the assessment of cloud microphysics susceptibilities (Feingold et al., 1999; Duong et al., 2011; Jung et al., 2016; Zheng et al., 2022b). In order to examine the potential impact of the aforementioned processes on the ACI assessment, a sensitivity analysis is conducted by simply retrospecting the sub-cloud NCCN 0.35 % according to their LCCN. For each retrospective time step ΔT, the rc values are held unchanged, and the retrospective NCCN 0.35 % values for individual cloud cases are given by , and then the ACIr,CB can be recalculated. Note that assuming a constant rc value over time inevitably induces uncertainty and biases, as it does not consider the microphysical processes affecting the cloud droplet mean size. However, previous numerical experiments show that the noticeable impact on the cloud mean radius through collision–coalescence necessitates a high degree of CCN depletion, and the quantified percentage changes in droplet mean sizes are several times smaller than the changes in CCN depletion (Feingold et al., 1996). Hence, the retrospective method, from an observational snapshot point of view, provides a direction that enables the assessment of ACIr,CB as if before the sub-cloud aerosols and CCN are scavenged by in-cloud coalescence-scavenging and precipitation-scavenging processes.
As shown in Fig. 8, the ACIr,CB values tend to decrease with the retrospective time, which indicates the retrospective CCN variation range is enlarged and counteracting the coalescence-scavenging amplification. The detailed illustration of the different ACIr,CB calculated from the scattered rc and sub-cloud NCCN 0.35 % is shown in Fig. S5. Note that the ACIr,CB decreasing rates for the precipitating clouds (Fig. 8b) are not as strong as for all clouds because the non-precipitating clouds have smaller LCCN largely due to weaker collision–coalescence. Hence, the retrospective period used here might quickly exceed the actual time of cloud-processing to become effective on aerosol and CCN. In other words, the actual time needed to trace back to the sub-cloud CCN concentration before they were cloud-processed is shorter than the retrospective time tested here in Fig. 8. This results in the faster decrease in ACIr,CB in the non-precipitating cloud. The retrospective of the sub-cloud CCN budget will yield an alternative assessment of ACI, assuming that the drizzle processes have not yet significantly impacted the sub-cloud CCN budget, especially for the assessment under the precipitating clouds. However, examining the exact precipitating timing is challenging since the aircraft provides a snapshot of the cloud and aerosol information. Thus, this retrospective study only provides a possible direction, and the result should be interpreted with caution.
Based on the aircraft in situ measurements during ACE-ENA and SOCRATES, the vertical distributions and the evolutions of the aerosol, cloud, and drizzle properties are investigated under cloud-topped MBL environments. The aerosols and CCN from SOCRATES are the highest among the three IOPs, followed by ACE-ENA Sum, and ACE-ENA Win, in descending order, in both above- and sub-cloud regimes. The differences can be attributed to the differences in aerosol size distributions between ACE-ENA and SOCRATES, which are largely due to the aerosol sources in those regions. SOCRATES features the pre-industrial natural environment enriched by aerosols from marine biological productivity and without the contamination of anthropogenic aerosols, while the ACE-ENA features the aerosols from varied sources, including maritime and continental emissions, with distinct seasonal variations. Examining the aerosol size distributions in sub-cloud versus above-cloud regimes manifests the significant influence of cloud processing on aerosols. According to previous studies, physical processing like in-cloud Brownian capture can reduce Aitken mode aerosols, while the chemical processes transform Aitken mode aerosols to larger sizes, moving them toward the accumulation mode. In addition, the in-cloud coalescence processes could also shift sub-cloud aerosol residuals to larger sizes, as multiple aerosols combine into a single aerosol core inside the cloud droplet during collision–coalescence. Those physical mechanisms could potentially explain the observed increase in the tail of the aerosol size distribution for all IOPs, and it will be of interest for future research to prove such hypotheses.
As for the cloud and drizzle properties, the SOCRATES clouds feature a larger number of smaller cloud droplets than the ACE-ENA Sum and ACE-ENA Win clouds, with the rc growth (and percent increases), from cloud base to top, being 4.03 µm (66 %), 4.78 µm (68 %), and 5.85 µm (79 %) for SOCRATES, ACE-ENA Sum, and ACE-ENA Win, respectively. The cloud-top entrainment mixing is evident in the observed decline in both Nc and LWCc near the cloud top. The mean cloud-top entrainment rates (we) are 0.570±0.834, 0.581±0.560, and 0.960±1.127 cm s−1 for SOCRATES, ACE-ENA Sum, and ACE-ENA Win, respectively. The strongest we during ACE-ENA Win is a result of weaker cloud-top inversions and stronger near-cloud-top turbulence. The values of the TKE for three IOPs are generally within the ranges of previous studies (Atlas et al., 2020; Ghate et al., 2021). For drizzle vertical distribution, Nd values from the three IOPs all exhibit decreases from cloud top to cloud base, while Dmmd are in opposite directions with a maximum at the cloud base. The ACE-ENA Win clouds feature more prominent drizzle formation and evolution owing to the combined effects of relatively cleaner environment, deeper cloud layer, and slightly stronger in-cloud vertical turbulence, which is speculated to substantially enhance the collision–coalescence and the drizzle re-circulating processes, compared to the other two IOPs. Satellite retrievals of droplet number concentration heavily rely on the adiabatic cloud assumption and are usually given as a constant of fad=0.8; the in situ observational evidence found in this study further confirms the unrealistic nature of this assumption. It will be of interest to utilize multiple aircraft measurements (campaigns) to explore the variability in MBL cloud and drizzle microphysical properties over different marine regions. This can help examine potential predictors for fad, which will aid in satellite-based retrievals and aerosol–cloud interaction assessments (Painemal and Zuidema, 2011; Grosvenor et al., 2018; Painemal et al., 2021).
Comparing the seasonality of the cloud-base precipitation rate (RCB) during ACE-ENA, there are more cases with large observed RCB during the winter season, which is consistent with J. Wang et al. (2022). Notably, the sensitivity of RCB to Nc is more pronounced for the ACE-ENA during both winter (with precipitation susceptibility So=1.638) and summer (So=1.229) compared to SOCRATES (So=0.979). This could possibly be hypothesized as the result of turbulence-driven in-cloud droplet interactions, which could result in much higher RCB induced by larger drizzle drops near the cloud base for ACE-ENA, especially under low Nc conditions. Furthermore, RCB can be approximated by a relationship involving Nc and Hc, as suggested in prior research. The relationships established in this study indicate that the So in ACE-ENA clouds can be partially determined by Hc, while in SOCRATES clouds the So is less influenced by Hc and Nc. Based on the physical mechanisms found in the previous study, a possible hypothesis can be leveraged to explain the observed results. That is, the combination of a deeper cloud layer and relatively lower ambient aerosol concentration, eventually leading to stronger drizzle production and evolution during ACE-ENA, especially during the winter season, results in more robust precipitation susceptibility. And further numerical simulations and experiments are warranted to prove this hypothesis. Note that considering the combined factors of aerosol loadings, cloud morphology and thicknesses, and the assessment methodology, the derived So values in this study are generally higher (or close to the upper end) compared to previous studies (Lu et al., 2009; Duong et al., 2011; Terai et al., 2012; Jung et al., 2016; Gupta et al., 2022).
The investigations of the ACI via the ACIN,CB and ACIr,CB indices reveal that during the ACE-ENA Win, Nc is more sensitive to changes in NCCN 0.35 %, indicating that aerosols more readily activate to become cloud droplets compared to those in the ACE-ENA Sum, which is consistent with the previous assessment by J. Wang et al. (2022) on the seasonal dependency of the relationship between Nc and aerosols. One influencing factor is the strong dynamic mechanism that speeds up the infusion of CCN into the cloud layer, thus aiding droplet formation. The moderate but statistically significant correlation coefficients between the CCN activation fractions and the TKE agree with a previous study that found the local activation fraction of CCN to be strongly associated with increased updrafts (Hu et al., 2021). Furthermore, the presence of larger aerosols during ACE-ENA Win enhances the droplet activation process. The SOCRATES IOP highlights a higher ACIr,CB, indicating a pronounced decrease in rc with increasing NCCN 0.35 %. The ACIr,CB in ACE-ENA is dampened by the presence of more larger cloud droplets near the cloud base, particularly under relatively higher NCCN 0.35 %. However, the combined effect of the relatively cleaner environment and sufficient water vapor results in stronger cloud microphysical responses during the ACE-ENA wintertime than in the summertime. Note that the ACI indices from this study lie in the higher end of the ACI ranges estimated via remote sensing (McComiskey et al., 2009; Dong et al., 2015; Zheng et al., 2022a), possibly because the aircraft assessment of ACI is based on measurements where the aerosols are in direct contact with the cloud layer. Arguably, the assessment of Nc responses to NCCN 0.35 % would inevitably be affected by the collision–coalescence process near the cloud base, where, simultaneously, the CCN replenishment buffers the Nc, and the collision–coalescence process depletes Nc. Hence, finding a layer where these two effects maintain a dynamic balance in Nc might aid in a more accurate assessment and more fundamental understanding of the ACI, which might be revealed by the large eddy simulations or parcel model simulations.
Additionally, the in-cloud drizzle formation and evolution processes significantly influence the sub-cloud CCN budgets via the coalescence-scavenging effect, which can potentially exaggerate the assessment of cloud microphysics susceptibilities. Based on the CCN loss rate (LCCN) from ACE-ENA and SOCRATES, a sensitivity analysis is performed focusing on retrospectively adjusting the sub-cloud CCN according to their LCCN. Results showed that this adjustment led to a decreased ACIr,CB, highlighting the significance of the coalescence-scavenging process on the ACI assessment. However, due to the fact that aircraft only provide a snapshot of the clouds and aerosol information, determining the precise drizzle timing for the individual cloud is challenging. Hence, findings from this retrospective approach provide only a direction or theory and should be taken cautiously. Nevertheless, pursuing further modeling experiments on this matter may be worthwhile. For example, the exact drizzling time could be pinpointed within a model using an Eulerian framework or traced using a Lagrangian framework. Nevertheless, the CCN adjustment could more accurately reflect the true characteristics of the cloud and the MBL CCN budget, potentially aiding in a more precise assessment of ACI. Therefore, future research would focus on model simulations of MBL clouds from ACE-ENA and SOCRATES and further assess the modeled ACI under the observational constraints, as well as the continuous development of the warm rain microphysical parameterizations, in order to aid in the better represent the MBL clouds in multiple regions.
The ACE-ENA field campaign data can be accessed from the U.S. Department of Energy Atmospheric Radiation Measurement data archive (https://www.arm.gov/research/campaigns/aaf2017ace-ena, ACE-ENA, 2023). The SOCRATES field campaign data are publicly archived on the National Center for Atmospheric Research (NCAR) Earth Observing Laboratory (https://data.eol.ucar.edu/master_lists/generated/socrates/, SOCRATES, 2023).
The supplement related to this article is available online at: https://doi.org/10.5194/acp-24-10323-2024-supplement.
The original idea of this study was discussed by XZ, XD, and BX. XZ performed the analyses and wrote the paper. XZ, XD, BX, TL, and YW participated in further scientific discussions and provided substantial comments on and edits to the paper.
At least one of the (co-)authors is a member of the editorial board of Atmospheric Chemistry and Physics. The peer-review process was guided by an independent editor, and the authors also have no other competing interests to declare.
Publisher's note: Copernicus Publications remains neutral with regard to jurisdictional claims made in the text, published maps, institutional affiliations, or any other geographical representation in this paper. While Copernicus Publications makes every effort to include appropriate place names, the final responsibility lies with the authors.
This work has been supported by the National Science Foundation (NSF; grant nos. AGS-2031750, AGS-2031751, and AGS-20211752) at the University of Arizona, Texas A&M University, and Stanford University, respectively. The authors sincerely thank the investigators and mentors from the ACE-ENA and SOCRATES field campaigns for making the data publicly available. The authors extend their special thanks to the editor, Tak Yamaguchi, and two anonymous reviewers for their constructive comments and suggestions which helped to improve the paper.
This research has been supported by the National Science Foundation (grant nos. AGS-2031750, AGS-2031751, and AGS-20211752).
This paper was edited by Tak Yamaguchi and reviewed by two anonymous referees.
ACE-ENA: Aerosol and Cloud Experiments in the Eastern North Atlantic: Campaign Datasets, Atmospheric Radiation Measurement (ARM) User Facility, ACE-ENA [data set], https://www.arm.gov/research/campaigns/aaf2017ace-ena (last access: 13 August 2023), 2023.
Albrecht B. A.: Aerosols, Cloud Microphysics, and Fractional Cloudiness, Science, 245, 1227–1230, https://doi.org/10.1126/science.245.4923.1227, 1989.
Albrecht, B. A., Bretherton, C. S., Johnson, D., Scubert, W. H., and Frisch, A. S.: The Atlantic Stratocumulus Transition Experiment—ASTEX, B. Am. Meteorol. Soc., 76, 889–904, https://doi.org/10.1175/1520-0477(1995)076<0889:Taste>2.0.Co;2, 1995.
Albrecht, B., Fang, M., and Ghate, V.: Exploring Stratocumulus Cloud-Top Entrainment Processes and Parameterizations by Using Doppler Cloud Radar Observations, J. Atmos. Sci., 73, 729–742, https://doi.org/10.1175/JAS-D-15-0147.1, 2016.
Albrecht, B., Ghate, V., Mohrmann, J., Wood, R., Zuidema, P., Bretherton, C., Schwartz, C., Eloranta, E., Glienke, S., Donaher, S., Sarkar, M., McGibbon, J., Nugent, A. D., Shaw, R. A., Fugal, J., Minnis, P., Paliknoda, R., Lussier, L., Jensen, J., Vivekanandan, J., Ellis, S., Tsai, P., Rilling, R., Haggerty, J., Campos, T., Stell, M., Reeves, M., Beaton, S., Allison, J., Stossmeister, G., Hall, S., and Schmidt, S.: Cloud System Evolution in the Trades (CSET): Following the Evolution of Boundary Layer Cloud Systems with the NSF–NCAR GV, B. Am. Meteorol. Soc., 100, 93–121, https://doi.org/10.1175/BAMS-D-17-0180.1, 2019.
Atlas, R., Mohrmann, J., Finlon, J., Lu, J., Hsiao, I., Wood, R., and Diao, M.: The University of Washington Ice–Liquid Discriminator (UWILD) improves single-particle phase classifications of hydrometeors within Southern Ocean clouds using machine learning, Atmos. Meas. Tech., 14, 7079–7101, https://doi.org/10.5194/amt-14-7079-2021, 2021.
Atlas, R. L., Bretherton, C. S., Blossey, P. N., Gettelman, A., Bardeen, C., Lin, P., and Ming, Y.: How Well Do Large-Eddy Simulations and Global Climate Models Represent Observed Boundary Layer Structures and Low Clouds Over the Summertime Southern Ocean?, J. Adv. Model. Earth Sy., 12, e2020MS002205, https://doi.org/10.1029/2020MS002205, 2020.
Aumont, O., Belviso, S., and Monfray, P.: Dimethylsulfoniopropionate (DMSP) and dimethylsulfide (DMS) sea surface distributions simulated from a global three-dimensional ocean carbon cycle model, J. Geophys. Res.-Oceans, 107, 4-1–4-19, https://doi.org/10.1029/1999JC000111, 2002.
Baumgardner, D. and Korolev, A.: Airspeed Corrections for Optical Array Probe Sample Volumes, J. Atmos. Ocean. Tech., 14, 1224–1229, 1997.
Baumgardner, D., Abel, S. J., Axisa, D., Cotton, R., Crosier, J., Field, P., Gurganus, C., Heymsfield, A., Korolev, A., Krämer, M., Lawson, P., McFarquhar, G., Ulanowski, Z., and Um, J.: Cloud Ice Properties: In Situ Measurement Challenges, Meteor. Mon., 58, 9.1–9.23, 2017.
Bellouin, N., Quaas, J., Gryspeerdt, E., Kinne, S., Stier, P., Watson-Parris, D., Boucher, O., Carslaw, K. S., Christensen, M., Daniau, A. L., Dufresne, J. L., Feingold, G., Fiedler, S., Forster, P., Gettelman, A., Haywood, J. M., Lohmann, U., Malavelle, F., Mauritsen, T., McCoy, D. T., Myhre, G., Mülmenstädt, J., Neubauer, D., Possner, A., Rugenstein, M., Sato, Y., Schulz, M., Schwartz, S. E., Sourdeval, O., Storelvmo, T., Toll, V., Winker, D., and Stevens, B.: Bounding Global Aerosol Radiative Forcing of Climate Change, Rev. Geophys., 58, e2019RG000660, https://doi.org/10.1029/2019RG000660, 2020.
Braun, R. A., Dadashazar, H., MacDonald, A. B., Crosbie, E., Jonsson, H. H., Woods, R. K., Flagan, R. C., Seinfeld, J. H., and Sorooshian, A.: Cloud Adiabaticity and Its Relationship to Marine Stratocumulus Characteristics Over the Northeast Pacific Ocean, J. Geophys. Res.-Atmos., 123, 13790–13806, https://doi.org/10.1029/2018jd029287, 2018.
Brenguier, J.-L., Burnet, F., and Geoffroy, O.: Cloud optical thickness and liquid water path – does the k coefficient vary with droplet concentration?, Atmos. Chem. Phys., 11, 9771–9786, https://doi.org/10.5194/acp-11-9771-2011, 2011.
Brost, R. A., Wyngaard, J. C., and Lenschow, D. H.: Marine Stratocumulus Layers. Part II: Turbulence Budgets, J. Atmos. Sci., 39, 818–836, 1982.
Brunke, M. A., Cutler, L., Urzua, R. D., Corral, A. F., Crosbie, E., Hair, J., Hostetler, C., Kirschler, S., Larson, V., Li, X.-Y., Ma, P.-L., Minke, A., Moore, R., Robinson, C. E., Scarino, A. J., Schlosser, J., Shook, M., Sorooshian, A., Lee Thornhill, K., Voigt, C., Wan, H., Wang, H., Winstead, E., Zeng, X., Zhang, S., and Ziemba, L. D.: Aircraft Observations of Turbulence in Cloudy and Cloud-Free Boundary Layers Over the Western North Atlantic Ocean From ACTIVATE and Implications for the Earth System Model Evaluation and Development, J. Geophys. Res.-Atmos., 127, e2022JD036480, https://doi.org/10.1029/2022JD036480, 2022.
Chen, J., Liu, Y., Zhang, M., and Peng, Y.: Height Dependency of aerosol–cloud Interaction Regimes, J. Geophys. Res.-Atmos., 123, 491–506, https://doi.org/10.1002/2017JD027431, 2018.
Chen, S., Yau, M. K., and Bartello, P.: Turbulence Effects of Collision Efficiency and Broadening of Droplet Size Distribution in Cumulus Clouds, J. Atmos. Sci., 75, 203–217, https://doi.org/10.1175/JAS-D-17-0123.1, 2018.
Chen, Y.-C., Christensen, M. W., Stephens, G. L., and Seinfeld, J. H.: Satellite-based estimate of global aerosol–cloud radiative forcing by marine warm clouds, Nat. Geosci., 7, 643–646, https://doi.org/10.1038/ngeo2214, 2014.
Chen, Y.-C., Xue, L., Lebo, Z. J., Wang, H., Rasmussen, R. M., and Seinfeld, J. H.: A comprehensive numerical study of aerosol–cloud-precipitation interactions in marine stratocumulus, Atmos. Chem. Phys., 11, 9749–9769, https://doi.org/10.5194/acp-11-9749-2011, 2011.
Christensen, M. W., Ma, P.-L., Wu, P., Varble, A. C., Mülmenstädt, J., and Fast, J. D.: Evaluation of aerosol–cloud interactions in E3SM using a Lagrangian framework, Atmos. Chem. Phys., 23, 2789–2812, https://doi.org/10.5194/acp-23-2789-2023, 2023.
Comstock, K. K., Wood, R., Yuter, S. E., and Bretherton, C. S.: Reflectivity and rain rate in and below drizzling stratocumulus, Q. J. Roy. Meteor. Soc., 130, 2891–2918, https://doi.org/10.1256/qj.03.187, 2004.
Cooper, W. A., Friesen, R. B., Hayman, M., Jensen, J., Lenschow, D. H., Romashkin, P., Schanot, A., Spuler, S., Stith, J., and Wolff, C.: Characterization of Uncertainty in Measurements of Wind from the NSF/NCAR Gulfstream V Research Aircraft (No. NCAR/TN-528+STR), NCAR Technical Notes, NCAR, https://doi.org/10.5065/D60G3HJ8, 2016.
Covert, D. S., Kapustin, V. N., Bates, T. S., and Quinn, P. K.: Physical properties of marine boundary layer aerosol particles of the mid-Pacific in relation to sources and meteorological transport, J. Geophys. Res.-Atmos., 101, 6919–6930, https://doi.org/10.1029/95JD03068, 1996.
D'Alessandro, J. J., McFarquhar, G. M., Wu, W., Stith, J. L., Jensen, J. B., and Rauber, R. M.: Characterizing the Occurrence and Spatial Heterogeneity of Liquid, Ice, and Mixed Phase Low-Level Clouds Over the Southern Ocean Using in Situ Observations Acquired During SOCRATES, J. Geophys. Res.-Atmos., 126, e2020JD034482, https://doi.org/10.1029/2020JD034482, 2021.
Danker, J., Sourdeval, O., McCoy, I. L., Wood, R., and Possner, A.: Exploring relations between cloud morphology, cloud phase, and cloud radiative properties in Southern Ocean's stratocumulus clouds, Atmos. Chem. Phys., 22, 10247–10265, https://doi.org/10.5194/acp-22-10247-2022, 2022.
Desai, N., Liu, Y., Glienke, S., Shaw, R. A., Lu, C., Wang, J., and Gao, S.: Vertical Variation of Turbulent Entrainment Mixing Processes in Marine Stratocumulus Clouds Using High-Resolution Digital Holography, J. Geophys. Res.-Atmos., 126, e2020JD033527, https://doi.org/10.1029/2020JD033527, 2021.
Diamond, M. S., Dobracki, A., Freitag, S., Small Griswold, J. D., Heikkila, A., Howell, S. G., Kacarab, M. E., Podolske, J. R., Saide, P. E., and Wood, R.: Time-dependent entrainment of smoke presents an observational challenge for assessing aerosol–cloud interactions over the southeast Atlantic Ocean, Atmos. Chem. Phys., 18, 14623–14636, https://doi.org/10.5194/acp-18-14623-2018, 2018.
Dong, X. and Minnis, P.: Stratus, Stratocumulus, and Remote Sensing, in: Fast Processes in Large‐Scale Atmospheric Models, in: Geophysical Monograph Series, Wiley, 141–199, https://doi.org/10.1002/9781119529019.ch6, 2023.
Dong, X., Schwantes, A. C., Xi, B., and Wu, P.: Investigation of the marine boundary layer cloud and CCN properties under coupled and decoupled conditions over the Azores, J. Geophys. Res.-Atmos., 120, 6179–6191, https://doi.org/10.1002/2014JD022939, 2015.
Dong, X., Zheng, X., Xi, B., and Xie, S.: A Climatology of Midlatitude Maritime Cloud Fraction and Radiative Effect Derived from the ARM ENA Ground-Based Observations, J. Climate, 36, 531–546, https://doi.org/10.1175/JCLI-D-22-0290.1, 2023.
Duong, H. T., Sorooshian, A., and Feingold, G.: Investigating potential biases in observed and modeled metrics of aerosol–cloud-precipitation interactions, Atmos. Chem. Phys., 11, 4027–4037, https://doi.org/10.5194/acp-11-4027-2011, 2011.
Dusek, U., Frank, G. P., Hildebrandt, L., Curtius, J., Schneider, J., Walter, S., Chand, D., Drewnick, F., Hings, S., Jung, D., Borrmann, S., and Andreae, M. O.: Size Matters More Than Chemistry for Cloud-Nucleating Ability of Aerosol Particles, Science, 312, 1375–1378, https://doi.org/10.1126/science.1125261, 2006.
Fan, C., Wang, M., Rosenfeld, D., Zhu, Y., Liu, J., and Chen, B.: Strong Precipitation Suppression by Aerosols in Marine Low Clouds, Geophys. Res. Lett., 47, e2019GL086207, https://doi.org/10.1029/2019GL086207, 2020.
Feingold, G. and McComiskey, A.: ARM's Aerosol–Cloud–Precipitation Research (Aerosol Indirect Effects), Meteor. Mon., 57, 22.21–22.15, https://doi.org/10.1175/AMSMONOGRAPHS-D-15-0022.1, 2016.
Feingold, G. and Siebert, H.: Cloud – Aerosol Interactions from the Micro to the Cloud Scale, from the Strungmann Forum Report, Clouds in the Perturbed Climate System: Their Relationship to Energy Balance, Atmospheric Dynamics, and Precipitation, 2, edited by: Heintzenberg, J. and Charlson, R. J., MIT Press, ISBN 978-0-262-01287-4, 2009.
Feingold, G., Kreidenweis, S. M., Stevens, B., and Cotton, W. R.: Numerical simulations of stratocumulus processing of cloud condensation nuclei through collision-coalescence, J. Geophys. Res.-Atmos., 101, 21391–21402, https://doi.org/10.1029/96JD01552, 1996.
Feingold, G., Frisch, A. S., Stevens, B., and Cotton, W. R.: On the relationship among cloud turbulence, droplet formation and drizzle as viewed by Doppler radar, microwave radiometer and lidar, J. Geophys. Res.-Atmos., 104, 22195–22203, https://doi.org/10.1029/1999JD900482, 1999.
Feingold, G., Eberhard, W. L., Veron, D. E., and Previdi, M.: First measurements of the Twomey indirect effect using ground-based remote sensors, Geophys. Res. Lett., 30, 1287, https://doi.org/10.1029/2002GL016633, 2003.
Flossmann, A. I., Hall, W. D., and Pruppacher, H. R.: A Theoretical Study of the Wet Removal of Atmospheric Pollutants. Part I: The Redistribution of Aerosol Particles Captured through Nucleation and Impaction Scavenging by Growing Cloud Drops, J. Atmos. Sci., 42, 583–606, https://doi.org/10.1175/1520-0469(1985)042<0583:ATSOTW>2.0.CO;2, 1985.
Gao, S., Lu, C., Liu, Y., Mei, F., Wang, J., Zhu, L., and Yan, S.: Contrasting Scale Dependence of Entrainment-Mixing Mechanisms in Stratocumulus Clouds, Geophys. Res. Lett., 47, e2020GL086970, https://doi.org/10.1029/2020GL086970, 2020.
Ghate, V. P. and Cadeddu, M. P.: Drizzle and Turbulence Below Closed Cellular Marine Stratocumulus Clouds, J. Geophys. Res.-Atmos., 124, 5724–5737, https://doi.org/10.1029/2018JD030141, 2019.
Ghate, V. P., Cadeddu, M. P., Zheng, X., and O'Connor, E.: Turbulence in the Marine Boundary Layer and Air Motions below Stratocumulus Clouds at the ARM Eastern North Atlantic Site, J. Appl. Meteorol. Clim., 60, 1495–1510, https://doi.org/10.1175/JAMC-D-21-0087.1, 2021.
Glienke, S. and Mei, F.: Two-dimensional stereo (2D-S) probe instrument handbook, DOE/SC-ARM-TR-233, https://www.arm.gov/publications/tech_reports/handbooks/doe-sc-arm-tr-233.pdf (last access: 17 September 2024), 2019.
Glienke, S. and Mei, F.: Fast cloud droplet probe (FCDP)instrument handbook, DOE/SC-ARM-TR-238, https://www.arm.gov/publications/tech_reports/handbooks/doe-sc-arm-tr-238.pdf (last access: 17 September 2024), 2020.
Goldberger, L.: Passive cavity aerosol spectrometer probe aboard aircraft (PCASP-AIR) with signal processing package 200 instrument handbook, DOE/SC-ARM-TR-241, https://www.arm.gov/publications/tech_reports/handbooks/doe-sc-arm-tr-241.pdf (last access: 17 September 2024), 2020.
Grabowski, W. W. and Wang, L.-P.: Growth of Cloud Droplets in a Turbulent Environment, Annu. Rev. Fluid Mech., 45, 293–324, https://doi.org/10.1146/annurev-fluid-011212-140750, 2013.
Grosvenor, D. P., Sourdeval, O., Zuidema, P., Ackerman, A., Alexandrov, M. D., Bennartz, R., Boers, R., Cairns, B., Chiu, J. C., Christensen, M., Deneke, H., Diamond, M., Feingold, G., Fridlind, A., Hünerbein, A., Knist, C., Kollias, P., Marshak, A., McCoy, D., Merk, D., Painemal, D., Rausch, J., Rosenfeld, D., Russchenberg, H., Seifert, P., Sinclair, K., Stier, P., van Diedenhoven, B., Wendisch, M., Werner, F., Wood, R., Zhang, Z., and Quaas, J.: Remote Sensing of Droplet Number Concentration in Warm Clouds: A Review of the Current State of Knowledge and Perspectives, Rev. Geophys., 56, 409–453, https://doi.org/10.1029/2017RG000593, 2018.
Gupta, S., McFarquhar, G. M., O'Brien, J. R., Delene, D. J., Poellot, M. R., Dobracki, A., Podolske, J. R., Redemann, J., LeBlanc, S. E., Segal-Rozenhaimer, M., and Pistone, K.: Impact of the variability in vertical separation between biomass burning aerosols and marine stratocumulus on cloud microphysical properties over the Southeast Atlantic, Atmos. Chem. Phys., 21, 4615–4635, https://doi.org/10.5194/acp-21-4615-2021, 2021.
Gupta, S., McFarquhar, G. M., O'Brien, J. R., Poellot, M. R., Delene, D. J., Miller, R. M., and Small Griswold, J. D.: Factors affecting precipitation formation and precipitation susceptibility of marine stratocumulus with variable above- and below-cloud aerosol concentrations over the Southeast Atlantic, Atmos. Chem. Phys., 22, 2769–2793, https://doi.org/10.5194/acp-22-2769-2022, 2022.
Hansen, J. E. and Travis, L. D.: Light scattering in planetary atmospheres, Space Sci. Rev., 16, 527–610, https://doi.org/10.1007/BF00168069,1974.
Hill, A. A., Feingold, G., and Jiang, H.: The Influence of Entrainment and Mixing Assumption on Aerosol–Cloud Interactions in Marine Stratocumulus, J. Atmos. Sci., 66, 1450–1464, https://doi.org/10.1175/2008JAS2909.1, 2009.
Hinds, W. C.: Aerosol Technology, Properties, Behaviour, and Measurement of Airborne Particles, John Wiley & Sons Inc., New York., 1999.
Hoffmann, F. and Feingold, G.: A Note on Aerosol Processing by Droplet Collision-Coalescence, Geophys. Res. Lett., 50, e2023GL103716, https://doi.org/10.1029/2023GL103716, 2023.
Hu, A. Z., Igel, A. L., Chuang, P. Y., and Witte, M. K.: Recognition of Inter-Cloud Versus Intra-Cloud Controls on Droplet Dispersion With Applications to Microphysics Parameterization, J. Geophys. Res.-Atmos., 126, e2021JD035180, https://doi.org/10.1029/2021JD035180, 2021.
Hudson, J. G. and Noble, S.: CCN Spectral Shape and Cumulus Cloud and Drizzle Microphysics, J. Geophys. Res.-Atmos., 125, e2019JD031141, https://doi.org/10.1029/2019JD031141, 2020.
Hudson, J. G., Noble, S., and Tabor, S.: Cloud supersaturations from CCN spectra Hoppel minima, J. Geophys. Res.-Atmos., 120, 3436–3452, https://doi.org/10.1002/2014JD022669, 2015.
IPCC – Intergovernmental Panel on Climate Change: Climate Change 2021 – The Physical Science Basis: Working Group I Contribution to the Sixth Assessment Report of the Intergovernmental Panel on Climate Change, Cambridge University Press, ISBN 9781009157896, https://doi.org/10.1017/9781009157896, 2023.
Jensen, M. P., Ghate, V. P., Wang, D., Apoznanski, D. K., Bartholomew, M. J., Giangrande, S. E., Johnson, K. L., and Thieman, M. M.: Contrasting characteristics of open- and closed-cellular stratocumulus cloud in the eastern North Atlantic, Atmos. Chem. Phys., 21, 14557–14571, https://doi.org/10.5194/acp-21-14557-2021, 2021.
Jia, H., Ma, X., and Liu, Y.: Exploring aerosol–cloud interaction using VOCALS-REx aircraft measurements, Atmos. Chem. Phys., 19, 7955–7971, https://doi.org/10.5194/acp-19-7955-2019, 2019.
Jones, C. R., Bretherton, C. S., and Leon, D.: Coupled vs. decoupled boundary layers in VOCALS-REx, Atmos. Chem. Phys., 11, 7143–7153, https://doi.org/10.5194/acp-11-7143-2011, 2011.
Jung, E., Albrecht, B. A., Sorooshian, A., Zuidema, P., and Jonsson, H. H.: Precipitation susceptibility in marine stratocumulus and shallow cumulus from airborne measurements, Atmos. Chem. Phys., 16, 11395–11413, https://doi.org/10.5194/acp-16-11395-2016, 2016.
Kang, L., Marchand, R. T., Wood, R., and McCoy, I. L.: Coalescence Scavenging Drives Droplet Number Concentration in Southern Ocean Low Clouds, Geophys. Res. Lett., 49, e2022GL097819, https://doi.org/10.1029/2022GL097819, 2022.
Kang, L., Marchand, R. T., and Wood, R.: Stratocumulus Precipitation Properties Over the Southern Ocean Observed From Aircraft During the SOCRATES Campaign, J. Geophys. Res.-Atmos., 129, e2023JD039831, https://doi.org/10.1029/2023JD039831, 2024.
Kim, S.-H., Kim, J., Kim, J.-H., and Chun, H.-Y.: Characteristics of the derived energy dissipation rate using the 1 Hz commercial aircraft quick access recorder (QAR) data, Atmos. Meas. Tech., 15, 2277–2298, https://doi.org/10.5194/amt-15-2277-2022, 2022.
Kuang, C. and Mei, F.: Condensation Particle Counter (CPC) Instrument Handbook – Airborne Version, DOE/SCARM-TR-227, https://www.arm.gov/publications/tech_reports/handbooks/doe-sc-arm-tr-227.pdf (last access: 17 September 2024), 2020.
Lang, F., Ackermann, L., Huang, Y., Truong, S. C. H., Siems, S. T., and Manton, M. J.: A climatology of open and closed mesoscale cellular convection over the Southern Ocean derived from Himawari-8 observations, Atmos. Chem. Phys., 22, 2135–2152, https://doi.org/10.5194/acp-22-2135-2022, 2022.
Lawson, R. P., O'Connor, D., Zmarzly, P., Weaver, K., Baker, B., Mo, Q. X., and Jonsson, H.: The 2D-S (Stereo) probe: Design and preliminary tests of a new airborne, high-speed, high-resolution particle imaging probe, J. Atmos. Ocean. Tech., 23, 1462–1477, https://doi.org/10.1175/JTECH1927.1, 2006.
Lehmann, K., Siebert, H., and Shaw, R. A.: Homogeneous and inhomogeneous mixing in cumulus clouds: dependence on local turbulence structure, J. Atmos. Sci., 66, 3641–3659, https://doi.org/10.1175/2009JAS3012.1, 2009.
Logan, T., Xi, B., and Dong, X.: Aerosol properties and their influences on marine boundary layer cloud condensation nuclei at the ARM mobile facility over the Azores, J. Geophys. Res.-Atmos., 119, 4859–4872, https://doi.org/10.1002/2013JD021288, 2014.
Lu, C., Liu, Y., and Niu, S.: Examination of turbulent entrainment-mixing mechanisms using a combined approach, J. Geophys. Res., 116, D20207, https://doi.org/10.1029/2011JD015944, 2011.
Lu, C., Zhu, L., Liu, Y., Mei, F., Fast, J. D., Pekour, M. S., Luo, S., Xu, X., He, X., Li, J., and Gao, S.: Observational study of relationships between entrainment rate, homogeneity of mixing, and cloud droplet relative dispersion, Atmos. Res., 293, 106900, https://doi.org/10.1016/j.atmosres.2023.106900, 2023.
Lu, M.-L., Sorooshian, A., Jonsson, H. H., Feingold, G., Flagan, R. C., and Seinfeld, J. H.: Marine stratocumulus aerosol–cloud relationships in the MASE-II experiment: Precipitation susceptibility in eastern Pacific marine stratocumulus, J. Geophys. Res.-Atmos., 114, D24203, https://doi.org/10.1029/2009JD012774, 2009.
Magaritz, L., Pinsky, M., Krasnov, O., and Khain, A.: Investigation of Droplet Size Distributions and Drizzle Formation Using A New Trajectory Ensemble Model. Part II: Lucky Parcels, J. Atmos. Sci., 66, 781–805, https://doi.org/10.1175/2008JAS2789.1, 2009.
Magaritz-Ronen, L., Pinsky, M., and Khain, A.: Drizzle formation in stratocumulus clouds: effects of turbulent mixing, Atmos. Chem. Phys., 16, 1849–1862, https://doi.org/10.5194/acp-16-1849-2016, 2016.
Mann, J. A. L., Christine Chiu, J., Hogan, R. J., O'Connor, E. J., L'Ecuyer, T. S., Stein, T. H. M., and Jefferson, A.: Aerosol impacts on drizzle properties in warm clouds from ARM Mobile Facility maritime and continental deployments, J. Geophys. Res.-Atmos., 119, 4136–4148, https://doi.org/10.1002/2013JD021339, 2014.
Marcovecchio, A. R., Xi, B., Zheng, X., Wu, P., Dong, X., and Behrangi, A.: What Are the Similarities and Differences in Marine Boundary Layer Cloud and Drizzle Microphysical Properties During the ACE-ENA and MARCUS Field Campaigns?, J. Geophys. Res.-Atmos., 128, e2022JD037109, https://doi.org/10.1029/2022JD037109, 2023.
McComiskey, A., Feingold, G., Frisch, A. S., Turner, D. D., Miller, M. A., Chiu, J. C., Min, Q., and Ogren, J. A.: An assessment of aerosol–cloud interactions in marine stratus clouds based on surface remote sensing, J. Geophys. Res.-Atmos., 114, D09203, https://doi.org/10.1029/2008JD011006, 2009.
McCoy, I. L., Wood, R., and Fletcher, J. K.: Identifying Meteorological Controls on Open and Closed Mesoscale Cellular Convection Associated with Marine Cold Air Outbreaks, J. Geophys. Res.-Atmos., 122, 11678–11702, https://doi.org/10.1002/2017JD027031, 2017.
McCoy, I. L., McCoy, D. T., Wood, R., Regayre, L., Watson-Parris, D., Grosvenor, D. P., Mulcahy, J. P., Hu, Y., Bender, F. A. M., Field, P. R., Carslaw, K. S., and Gordon, H.: The hemispheric contrast in cloud microphysical properties constrains aerosol forcing, P. Natl. Acad. Sci. USA, 117, 18998–19006, https://doi.org/10.1073/pnas.1922502117, 2020.
McCoy, I. L., Bretherton, C. S., Wood, R., Twohy, C. H., Gettelman, A., Bardeen, C. G., and Toohey, D. W.: Influences of Recent Particle Formation on Southern Ocean Aerosol Variability and Low Cloud Properties, J. Geophys. Res.-Atmos., 126, e2020JD033529, https://doi.org/10.1029/2020JD033529, 2021.
McFarquhar, G. M., Bretherton, C. S., Marchand, R., Protat, A., DeMott, P. J., Alexander, S. P., Roberts, G. C., Twohy, C. H., Toohey, D., Siems, S., Huang, Y., Wood, R., Rauber, R. M., Lasher-Trapp, S., Jensen, J., Stith, J. L., Mace, J., Um, J., Järvinen, E., Schnaiter, M., Gettelman, A., Sanchez, K. J., McCluskey, C. S., Russell, L. M., McCoy, I. L., Atlas, R. L., Bardeen, C. G., Moore, K. A., Hill, T. C. J., Humphries, R. S., Keywood, M. D., Ristovski, Z., Cravigan, L., Schofield, R., Fairall, C., Mallet, M. D., Kreidenweis, S. M., Rainwater, B., D'Alessandro, J., Wang, Y., Wu, W., Saliba, G., Levin, E. J. T., Ding, S., Lang, F., Truong, S. C. H., Wolff, C., Haggerty, J., Harvey, M. J., Klekociuk, A. R., and McDonald, A.: Observations of Clouds, Aerosols, Precipitation, and Surface Radiation over the Southern Ocean: An Overview of CAPRICORN, MARCUS, MICRE, and SOCRATES, B. Am. Meteorol. Soc., 102, E894–E928, https://doi.org/10.1175/BAMS-D-20-0132.1, 2021.
Mechem, D. B., Wittman, C. S., Miller, M. A., Yuter, S. E., and de Szoeke, S. P.: Joint Synoptic and Cloud Variability over the Northeast Atlantic near the Azores, J. Appl. Meteorol. Clim., 57, 1273–1290, https://doi.org/10.1175/JAMC-D-17-0211.1, 2018.
Miller, M. A., Mages, Z., Zheng, Q., Trabachino, L., Russell, L. M., Shilling, J. E., and Zawadowicz, M. A.: Observed Relationships Between Cloud Droplet Effective Radius and Biogenic Gas Concentrations in Summertime Marine Stratocumulus Over the Eastern North Atlantic, Earth Space Sci., 9, e2021EA001929, https://doi.org/10.1029/2021EA001929, 2022.
Muñoz-Esparza, D., Sharman, R. D., and Lundquist, J. K.: Turbulence Dissipation Rate in the Atmospheric Boundary Layer: Observations and WRF Mesoscale Modeling during the XPIA Field Campaign, Mon. Weather Rev., 146, 351–371, https://doi.org/10.1175/MWR-D-17-0186.1, 2018.
Olfert, J. S., Kulkarni, P., and Wang, J.: Measuring aerosol size distributions with the fast integrated mobility spectrometer, J. Aerosol Sci., 39, 940–956, https://doi.org/10.1016/j.jaerosci.2008.06.005, 2008.
Painemal, D. and Zuidema, P.: Assessment of MODIS cloud effective radius and optical thickness retrievals over the Southeast Pacific with VOCALS-REx in situ measurements, J. Geophys. Res.-Atmos., 116, D24206, https://doi.org/10.1029/2011JD016155, 2011.
Painemal, D., Chang, F.-L., Ferrare, R., Burton, S., Li, Z., Smith Jr., W. L., Minnis, P., Feng, Y., and Clayton, M.: Reducing uncertainties in satellite estimates of aerosol–cloud interactions over the subtropical ocean by integrating vertically resolved aerosol observations, Atmos. Chem. Phys., 20, 7167–7177, https://doi.org/10.5194/acp-20-7167-2020, 2020.
Painemal, D., Spangenberg, D., Smith Jr., W. L., Minnis, P., Cairns, B., Moore, R. H., Crosbie, E., Robinson, C., Thornhill, K. L., Winstead, E. L., and Ziemba, L.: Evaluation of satellite retrievals of liquid clouds from the GOES-13 imager and MODIS over the midlatitude North Atlantic during the NAAMES campaign, Atmos. Meas. Tech., 14, 6633–6646, https://doi.org/10.5194/amt-14-6633-2021, 2021.
Pinsky, M. B., Khain, A. P., and Shapiro, M.: Collisions of Cloud Droplets in a Turbulent Flow. Part IV: Droplet Hydrodynamic Interaction, J. Atmos. Sci., 64, 2462–2482, https://doi.org/10.1175/JAS3952.1, 2007.
Pruppacher, H. R. and Klett, J. D.: Microphysics of Clouds and Precipitation, Springer, 954 pp., https://doi.org/10.1007/978-0-306-48100-0, 2010.
Redemann, J., Wood, R., Zuidema, P., Doherty, S. J., Luna, B., LeBlanc, S. E., Diamond, M. S., Shinozuka, Y., Chang, I. Y., Ueyama, R., Pfister, L., Ryoo, J.-M., Dobracki, A. N., da Silva, A. M., Longo, K. M., Kacenelenbogen, M. S., Flynn, C. J., Pistone, K., Knox, N. M., Piketh, S. J., Haywood, J. M., Formenti, P., Mallet, M., Stier, P., Ackerman, A. S., Bauer, S. E., Fridlind, A. M., Carmichael, G. R., Saide, P. E., Ferrada, G. A., Howell, S. G., Freitag, S., Cairns, B., Holben, B. N., Knobelspiesse, K. D., Tanelli, S., L'Ecuyer, T. S., Dzambo, A. M., Sy, O. O., McFarquhar, G. M., Poellot, M. R., Gupta, S., O'Brien, J. R., Nenes, A., Kacarab, M., Wong, J. P. S., Small-Griswold, J. D., Thornhill, K. L., Noone, D., Podolske, J. R., Schmidt, K. S., Pilewskie, P., Chen, H., Cochrane, S. P., Sedlacek, A. J., Lang, T. J., Stith, E., Segal-Rozenhaimer, M., Ferrare, R. A., Burton, S. P., Hostetler, C. A., Diner, D. J., Seidel, F. C., Platnick, S. E., Myers, J. S., Meyer, K. G., Spangenberg, D. A., Maring, H., and Gao, L.: An overview of the ORACLES (ObseRvations of Aerosols above CLouds and their intEractionS) project: aerosol–cloud–radiation interactions in the southeast Atlantic basin, Atmos. Chem. Phys., 21, 1507–1563, https://doi.org/10.5194/acp-21-1507-2021, 2021.
Rémillard, J. and Tselioudis, G.: Cloud Regime Variability over the Azores and Its Application to Climate Model Evaluation, J. Climate, 28, 9707–9720, https://doi.org/10.1175/JCLI-D-15-0066.1, 2015.
Roberts, G. C. and Nenes, A.: A Continuous-Flow Streamwise Thermal-Gradient CCN Chamber for Atmospheric Measurements, Aerosol Sci. Tech., 39, 206–221, https://doi.org/10.1080/027868290913988, 2005.
Sanchez, K. J., Roberts, G. C., Diao, M., and Russell, L. M.: Measured Constraints on Cloud Top Entrainment to Reduce Uncertainty of Nonprecipitating Stratocumulus Shortwave Radiative Forcing in the Southern Ocean, Geophys. Res. Lett., 47, e2020GL090513, https://doi.org/10.1029/2020GL090513, 2020.
Sanchez, K. J., Roberts, G. C., Saliba, G., Russell, L. M., Twohy, C., Reeves, J. M., Humphries, R. S., Keywood, M. D., Ward, J. P., and McRobert, I. M.: Measurement report: Cloud processes and the transport of biological emissions affect southern ocean particle and cloud condensation nuclei concentrations, Atmos. Chem. Phys., 21, 3427–3446, https://doi.org/10.5194/acp-21-3427-2021, 2021.
Siebert, H., Shaw, R. A., and Warhaft, Z.: Statistics of Small-Scale Velocity Fluctuations and Internal Intermittency in Marine Stratocumulus Clouds, J. Atmos. Sci., 67, 262–273, https://doi.org/10.1175/2009JAS3200.1, 2010.
Smalley, M. A., Witte, M. K., Jeong, J.-H., and Chinita, M. J.: A climatology of cold pools distinct from background turbulence at the Eastern North Atlantic observations site, EGUsphere [preprint], https://doi.org/10.5194/egusphere-2024-1098, 2024.
SOCRATES: Southern Ocean Clouds, Radiation, Aerosol Transport Experimental Study Campaign Dataset, Earth Observing Laboratory [data set], https://data.eol.ucar.edu/master_lists/generated/socrates/ (last access: 13 August 2023), 2023.
Sorooshian, A., Feingold, G., Lebsock, M. D., Jiang, H., and Stephens, G. L.: On the precipitation susceptibility of clouds to aerosol perturbations, Geophys. Res. Lett., 36, L13803, https://doi.org/10.1029/2009GL038993, 2009.
Sorooshian, A., Anderson, B., Bauer, S. E., Braun, R. A., Cairns, B., Crosbie, E., Dadashazar, H., Diskin, G., Ferrare, R., Flagan, R. C., Hair, J., Hostetler, C., Jonsson, H. H., Kleb, M. M., Liu, H., MacDonald, A. B., McComiskey, A., Moore, R., Painemal, D., Russell, L. M., Seinfeld, J. H., Shook, M., Smith, W. L., Thornhill, K., Tselioudis, G., Wang, H., Zeng, X., Zhang, B., Ziemba, L., and Zuidema, P.: Aerosol–Cloud–Meteorology Interaction Airborne Field Investigations: Using Lessons Learned from the U. S. West Coast in the Design of ACTIVATE off the U. S. East Coast, B. Am. Meteorol. Soc., 100, 1511–1528, https://doi.org/10.1175/BAMS-D-18-0100.1, 2019.
Stevens, B. and Feingold, G.: Untangling aerosol effects on clouds and precipitation in a buffered system, Nature, 461, 607–613, https://doi.org/10.1038/nature08281, 2009.
Su, T., Li, Z., Henao, N. R., Luan, Q., and Yu, F.: Constraining effects of aerosol–cloud interaction by accounting for coupling between cloud and land surface, Science Advances, 10, eadl5044, https://doi.org/10.1126/sciadv.adl5044, 2024.
Tansey, E., Marchand, R., Protat, A., Alexander, S. P., and Ding, S.: Southern Ocean Precipitation Characteristics Observed From CloudSat and Ground Instrumentation During the Macquarie Island Cloud & Radiation Experiment CRE): April 2016 to March 2017, J. Geophys. Res.-Atmos., 127, e2021JD035370, https://doi.org/10.1029/2021JD035370, 2022.
Terai, C. R. and Wood, R.: Aircraft observations of cold pools under marine stratocumulus, Atmos. Chem. Phys., 13, 9899–9914, https://doi.org/10.5194/acp-13-9899-2013, 2013.
Terai, C. R., Wood, R., Leon, D. C., and Zuidema, P.: Does precipitation susceptibility vary with increasing cloud thickness in marine stratocumulus?, Atmos. Chem. Phys., 12, 4567–4583, https://doi.org/10.5194/acp-12-4567-2012, 2012.
Twohy, C. H., Petters, M. D., Snider, J. R., Stevens, B., Tahnk, W., Wetzel, M., Russell, L., and Burnet, F.: Evaluation of the aerosol indirect effect in marine stratocumulus clouds: Droplet number, size, liquid water path, and radiative impact, J. Geophys. Res.-Atmos., 110, D08203, https://doi.org/10.1029/2004JD005116, 2005.
Twohy, C. H., DeMott, P. J., Russell, L. M., Toohey, D. W., Rainwater, B., Geiss, R., Sanchez, K. J., Lewis, S., Roberts, G. C., Humphries, R. S., McCluskey, C. S., Moore, K. A., Selleck, P. W., Keywood, M. D., Ward, J. P., and McRobert, I. M.: Cloud-Nucleating Particles Over the Southern Ocean in a Changing Climate, Earth's Future, 9, e2020EF001673, https://doi.org/10.1029/2020EF001673, 2021.
Twomey, S.: The Influence of Pollution on the Shortwave Albedo of Clouds, J. Atmos. Sci., 34, 1149–1152, https://doi.org/10.1175/1520-0469(1977)034<1149:TIOPOT>2.0.CO;2, 1977.
UCAR/NCAR – Earth Observing Laboratory: SOCRATES: Low Rate (LRT – 1 sps) Navigation, State Parameter, and Microphysics Flight-Level Data, Version 1.4, UCAR/NCAR —Earth Observing Laboratory [data set], https://doi.org/10.5065/D6M32TM9, 2022.
Uin, J. and Goldberger, L.: Ultra-High-Sensitivity Aerosol Spectrometer Aboard Aircraft (UHSAS-AIR) Instrument Handbook, DOE/SCARM-TR-250, from: https://www.arm.gov/publications/tech_reports/handbooks/doe-sc-arm-tr-250.pdf (last access: 17 September 2024), 2020.
Uin, J. and Mei, F.: Cloud condensation nuclei particle counter instrument handbook – airborne version, DOE/SCARM-TR-225, https://www.arm.gov/publications/tech_reports/handbooks/doe-sc-arm-tr-225.pdf (last access: 17 September 20204), 2019.
vanZanten, M. C., Stevens, B., Vali, G., and Lenschow, D. H.: Observations of Drizzle in Nocturnal Marine Stratocumulus, J. Atmos. Sci., 62, 88–106, https://doi.org/10.1175/JAS-3355.1, 2005.
Wacławczyk, M., Ma, Y.-F., Kopeć, J. M., and Malinowski, S. P.: Novel approaches to estimating the turbulent kinetic energy dissipation rate from low- and moderate-resolution velocity fluctuation time series, Atmos. Meas. Tech., 10, 4573–4585, https://doi.org/10.5194/amt-10-4573-2017, 2017.
Wallace, J. M. and Hobbs, P. V.: Atmospheric Science: An Introductory Survey, in: 2nd Edn., Academic Press/Elsevier, 483 pp., ISBN 978-0-12-732951-2, 2006.
Wang, J., Wood, R., Jensen, M. P., Chiu, J. C., Liu, Y., Lamer, K., Desai, N., Giangrande, S. E., Knopf, D. A., Kollias, P., Laskin, A., Liu, X., Lu, C., Mechem, D., Mei, F., Starzec, M., Tomlinson, J., Wang, Y., Yum, S. S., Zheng, G., Aiken, A. C., Azevedo, E. B., Blanchard, Y., China, S., Dong, X., Gallo, F., Gao, S., Ghate, V. P., Glienke, S., Goldberger, L., Hardin, J. C., Kuang, C., Luke, E. P., Matthews, A. A., Miller, M. A., Moffet, R., Pekour, M., Schmid, B., Sedlacek, A. J., Shaw, R. A., Shilling, J. E., Sullivan, A., Suski, K., Veghte, D. P., Weber, R., Wyant, M., Yeom, J., Zawadowicz, M., and Zhang, Z.: Aerosol and Cloud Experiments in the Eastern North Atlantic (ACE-ENA), B. Am. Meteorol. Soc., 103, E619–E641, https://doi.org/10.1175/BAMS-D-19-0220.1, 2022.
Wang, Y., Zheng, X., Dong, X., Xi, B., Wu, P., Logan, T., and Yung, Y. L.: Impacts of long-range transport of aerosols on marine-boundary-layer clouds in the eastern North Atlantic, Atmos. Chem. Phys., 20, 14741–14755, https://doi.org/10.5194/acp-20-14741-2020, 2020.
Wang, Y., Zhao, C., McFarquhar, G. M., Wu, W., Reeves, M., and Li, J.: Dispersion of Droplet Size Distributions in Supercooled Non-precipitating Stratocumulus from Aircraft Observations Obtained during the Southern Ocean Cloud Radiation Aerosol Transport Experimental Study, J. Geophys. Res.-Atmos., 126, e2020JD033720, https://doi.org/10.1029/2020JD033720, 2021a.
Wang, Y., Zheng, G., Jensen, M. P., Knopf, D. A., Laskin, A., Matthews, A. A., Mechem, D., Mei, F., Moffet, R., Sedlacek, A. J., Shilling, J. E., Springston, S., Sullivan, A., Tomlinson, J., Veghte, D., Weber, R., Wood, R., Zawadowicz, M. A., and Wang, J.: Vertical profiles of trace gas and aerosol properties over the eastern North Atlantic: variations with season and synoptic condition, Atmos. Chem. Phys., 21, 11079–11098, https://doi.org/10.5194/acp-21-11079-2021, 2021b.
Wang, Y., Zheng, X., Dong, X., Xi, B., and Yung, Y. L.: Insights of warm-cloud biases in Community Atmospheric Model 5 and 6 from the single-column modeling framework and Aerosol and Cloud Experiments in the Eastern North Atlantic (ACE-ENA) observations, Atmos. Chem. Phys., 23, 8591–8605, https://doi.org/10.5194/acp-23-8591-2023, 2023.
Witte, M. K., Chuang, P. Y., Ayala, O., Wang, L.-P., and Feingold, G.: Comparison of Observed and Simulated Drop Size Distributions from Large-Eddy Simulations with Bin Microphysics, Mon. Weather Rev., 147, 477–493, https://doi.org/10.1175/MWR-D-18-0242.1, 2019.
Wood, R.: Drizzle in Stratiform Boundary Layer Clouds. Part I: Vertical and Horizontal Structure, J. Atmos. Sci., 62, 3011–3033, https://doi.org/10.1175/JAS3529.1, 2005.
Wood, R.: Rate of loss of cloud droplets by coalescence in warm clouds, J. Geophys. Res.-Atmos., 111, D21205, https://doi.org/10.1029/2006JD007553, 2006.
Wood, R., Mechoso, C. R., Bretherton, C. S., Weller, R. A., Huebert, B., Straneo, F., Albrecht, B. A., Coe, H., Allen, G., Vaughan, G., Daum, P., Fairall, C., Chand, D., Gallardo Klenner, L., Garreaud, R., Grados, C., Covert, D. S., Bates, T. S., Krejci, R., Russell, L. M., de Szoeke, S., Brewer, A., Yuter, S. E., Springston, S. R., Chaigneau, A., Toniazzo, T., Minnis, P., Palikonda, R., Abel, S. J., Brown, W. O. J., Williams, S., Fochesatto, J., Brioude, J., and Bower, K. N.: The VAMOS Ocean–Cloud-Atmosphere-Land Study Regional Experiment (VOCALS-REx): goals, platforms, and field operations, Atmos. Chem. Phys., 11, 627–654, https://doi.org/10.5194/acp-11-627-2011, 2011.
Wood, R., Wyant, M., Bretherton, C. S., Rémillard, J., Kollias, P., Fletcher, J., Stemmler, J., de Szoeke, S., Yuter, S., Miller, M., Mechem, D., Tselioudis, G., Chiu, J. C., Mann, J. A. L., O'Connor, E. J., Hogan, R. J., Dong, X., Miller, M., Ghate, V., Jefferson, A., Min, Q., Minnis, P., Palikonda, R., Albrecht, B., Luke, E., Hannay, C., and Lin, Y.: Clouds, Aerosols, and Precipitation in the Marine Boundary Layer: An Arm Mobile Facility Deployment, B. Am. Meteorol. Soc., 96, 419–440, https://doi.org/10.1175/BAMS-D-13-00180.1, 2015.
Wu, P., Dong, X., Xi, B., Liu, Y., Thieman, M., and Minnis, P.: Effects of environment forcing on marine boundary layer cloud-drizzle processes, J. Geophys. Res.-Atmos., 122, 4463–4478, https://doi.org/10.1002/2016JD026326, 2017.
Wu, P., Dong, X., and Xi, B.: A Climatology of Marine Boundary Layer Cloud and Drizzle Properties Derived from Ground-Based Observations over the Azores, J. Climate, 33, 10133–10148, https://doi.org/10.1175/JCLI-D-20-0272.1, 2020.
Wyant, M. C., Bretherton, C. S., Wood, R., Blossey, P. N., and McCoy, I. L.: High Free-Tropospheric Aitken-Mode Aerosol Concentrations Buffer Cloud Droplet Concentrations in Large-Eddy Simulations of Precipitating Stratocumulus, J Adv. Model. Earth Sy., 14, e2021MS002930, https://doi.org/10.1029/2021MS002930, 2022.
Xi, B., Dong, X., Zheng, X., and Wu, P.: Cloud phase and macrophysical properties over the Southern Ocean during the MARCUS field campaign, Atmos. Meas. Tech., 15, 3761–3777, https://doi.org/10.5194/amt-15-3761-2022, 2022.
Yeom, J. M., Yum, S. S., Shaw, R. A., La, I., Wang, J., Lu, C., Liu, Y., Mei, F., Schmid, B., and Matthews, A.: Vertical Variations of Cloud Microphysical Relationships in Marine Stratocumulus Clouds Observed During the ACE-ENA Campaign, J. Geophys. Res.-Atmos., 126, e2021JD034700, https://doi.org/10.1029/2021JD034700, 2021.
Zawadowicz, M. A., Suski, K., Liu, J., Pekour, M., Fast, J., Mei, F., Sedlacek, A. J., Springston, S., Wang, Y., Zaveri, R. A., Wood, R., Wang, J., and Shilling, J. E.: Aircraft measurements of aerosol and trace gas chemistry in the eastern North Atlantic, Atmos. Chem. Phys., 21, 7983–8002, https://doi.org/10.5194/acp-21-7983-2021, 2021.
Zhang, J., Zhou, X., Goren, T., and Feingold, G.: Albedo susceptibility of northeastern Pacific stratocumulus: the role of covarying meteorological conditions, Atmos. Chem. Phys., 22, 861–880, https://doi.org/10.5194/acp-22-861-2022, 2022.
Zhang, X., Dong, X., Xi, B., and Zheng, X.: Aerosol Properties and Their Influences on Marine Boundary Layer Cloud Condensation Nuclei over the Southern Ocean, Atmosphere-Basel, 14, 1246, https://doi.org/10.3390/atmos14081246, 2023.
Zheng, G., Wang, Y., Aiken, A. C., Gallo, F., Jensen, M. P., Kollias, P., Kuang, C., Luke, E., Springston, S., Uin, J., Wood, R., and Wang, J.: Marine boundary layer aerosol in the eastern North Atlantic: seasonal variations and key controlling processes, Atmos. Chem. Phys., 18, 17615–17635, https://doi.org/10.5194/acp-18-17615-2018, 2018.
Zheng, G., Wang, Y., Wood, R., Jensen, M. P., Kuang, C., McCoy, I. L., Matthews, A., Mei, F., Tomlinson, J. M., Shilling, J. E., Zawadowicz, M. A., Crosbie, E., Moore, R., Ziemba, L., Andreae, M. O., and Wang, J.: New particle formation in the remote marine boundary layer, Nat. Commun., 12, 527, https://doi.org/10.1038/s41467-020-20773-1, 2021.
Zheng, X., Xi, B., Dong, X., Logan, T., Wang, Y., and Wu, P.: Investigation of aerosol–cloud interactions under different absorptive aerosol regimes using Atmospheric Radiation Measurement (ARM) southern Great Plains (SGP) ground-based measurements, Atmos. Chem. Phys., 20, 3483–3501, https://doi.org/.5194/acp-20-3483-2020, 2020.
Zheng, X., Dong, X., Ward, D. M., Xi, B., Wu, P., and Wang, Y.: aerosol–cloud-Precipitation Interactions in a Closed-cell and Non-homogenous MBL Stratocumulus Cloud, Adv. Atmos. Sci., 39, 2107–2123, https://doi.org/10.1007/s00376-022-2013-6, 2022a.
Zheng, X., Xi, B., Dong, X., Wu, P., Logan, T., and Wang, Y.: Environmental effects on aerosol–cloud interaction in non-precipitating marine boundary layer (MBL) clouds over the eastern North Atlantic, Atmos. Chem. Phys., 22, 335–354, https://doi.org/10.5194/acp-22-335-2022, 2022b.
Zuidema, P., Torri, G., Muller, C., and Chandra, A.: A Survey of Precipitation-Induced Atmospheric Cold Pools over Oceans and Their Interactions with the Larger-Scale Environment, Surv. Geophys., 38, 1283–1305, https://doi.org/10.1007/s10712-017-9447-x, 2017.
- Abstract
- Introduction
- Data and methods
- Aerosol, cloud, and drizzle properties of selected cases
- Aerosol–cloud–precipitation interactions (ACPIs)
- Summary and conclusions
- Data availability
- Author contributions
- Competing interests
- Disclaimer
- Acknowledgements
- Financial support
- Review statement
- References
- Supplement