the Creative Commons Attribution 4.0 License.
the Creative Commons Attribution 4.0 License.
 | 24 Jan 2024
Aircraft-based mass balance estimate of methane emissions from offshore gas facilities in the southern North Sea
Anke Roiger
Alina Fiehn
Alan M. Gorchov Negron
Eric A. Kort
Stefan Schwietzke
Ignacio Pisso
Amy Foulds
James Lee
James L. France
Anna E. Jones
Dave Lowry
Rebecca E. Fisher
Langwen Huang
Jacob Shaw
Prudence Bateson
Stephen Andrews
Stuart Young
Pamela Dominutti
Tom Lachlan-Cope
Alexandra Weiss
Grant Allen
Atmospheric methane (CH4) concentrations have more than doubled since the beginning of the industrial age, making CH4 the second most important anthropogenic greenhouse gas after carbon dioxide (CO2). The oil and gas sector represents one of the major anthropogenic CH4 emitters as it is estimated to account for 22 % of global anthropogenic CH4 emissions. An airborne field campaign was conducted in April–May 2019 to study CH4 emissions from offshore gas facilities in the southern North Sea with the aim of deriving emission estimates using a top-down (measurement-led) approach. We present CH4 fluxes for six UK and five Dutch offshore platforms or platform complexes using the well-established mass balance flux method. We identify specific gas production emissions and emission processes (venting and fugitive or flaring and combustion) using observations of co-emitted ethane (C2H6) and CO2. We compare our top-down estimated fluxes with a ship-based top-down study in the Dutch sector and with bottom-up estimates from a globally gridded annual inventory, UK national annual point-source inventories, and operator-based reporting for individual Dutch facilities. In this study, we find that all the inventories, except for the operator-based facility-level reporting, underestimate measured emissions, with the largest discrepancy observed with the globally gridded inventory. Individual facility reporting, as available for Dutch sites for the specific survey date, shows better agreement with our measurement-based estimates. For all the sampled Dutch installations together, we find that our estimated flux of (122.9 ± 36.8) kg h−1 deviates by a factor of 0.64 (0.33–12) from reported values (192.8 kg h−1). Comparisons with aircraft observations in two other offshore regions (the Norwegian Sea and the Gulf of Mexico) show that measured, absolute facility-level emission rates agree with the general distribution found in other offshore basins despite different production types (oil, gas) and gas production rates, which vary by 2 orders of magnitude. Therefore, mitigation is warranted equally across geographies.
- Article
(2967 KB) - Full-text XML
- BibTeX
- EndNote


Atmospheric CH4 mole fractions have more than doubled since 1750 due to human activity and continue to rise (Saunois et al., 2020). According to the NOAA Global Monitoring Laboratory, globally averaged atmospheric CH4 is estimated to have experienced the most dramatic annual increase in 2021 since the beginning of measurements in 1984 (Lan et al., 2022). With a factor 80–83 times stronger global warming potential over a 20-year time horizon compared to CO2, CH4 is the second most important anthropogenic greenhouse gas after CO2 and contributes 16 % to the effective radiative forcing of well-mixed greenhouse gases over 1750–2019 (Forster et al., 2021). Considering its short lifetime of around a decade, CH4 bears a high potential for mitigation strategies in order to reach the aim of the UNFCCC Paris Agreement to abate climate warming (Nisbet et al., 2019). Recently, the European Union and the UK signed up to the Global Methane Pledge with the aim of cutting global CH4 emissions by at least 30 % from 2020 levels by 2030 (European Commission, United States of America, 2021).
The oil and gas sector has been estimated to account for 22 (18–27) % of global anthropogenic CH4 emissions (bottom-up 2017; Saunois et al., 2020). On board offshore oil and gas platforms, CH4 is emitted during routine operations for safety and operational reasons (e.g. shutdown or start-up of equipment during production) by either controlled venting or flaring, i.e. the release of gas or burning of gas. In the latter case, CO2 is released simultaneously, with the CH4 CO2 emission ratio dependent on the flaring efficiency. According to the United Kingdom Continental Shelf (UKCS) Flaring and Venting Report (OGA, 2020), in 2019 a total of 2600 metric tonnes (t) of CH4 was emitted in the southern North Sea and the minor Irish Sea region, of which 74 % came from venting, 13 % came from turbines and engines, 10 % came from fugitive emissions (e.g. from leaky valves or compressors), and 3 % came from flaring. Carbon dioxide emission was 0.8 Mt in the same year, arising mainly from turbines and engines (95 %), with minor contributions of flaring (4 %) and venting (0.01 %). Flaring accounts for 87 % and venting 13 % of the total CO2 and CH4 emissions from venting and flaring. Flaring emissions consist of 99 % CO2 and 1 % CH4 and venting emissions consist of 98 % CH4 and 2 % CO2. Dutch CH4 emissions from the extraction of crude oil and natural gas on the Netherlands Continental Shelf (PRTR, 2019) amounted to 6500 t in 2019, of which 98 % came from venting, 1.6 % from the usage of natural gas (e.g. as fuel for combustion), and 0.2 % from flaring. Carbon dioxide emission was 1.1 Mt with a share of 99 % from usage of natural gas, 0.8 % from flaring, and 0.2 % from venting. Flaring accounts for 33 % and venting for 67 % of the total CO2 and CH4 emissions from venting and flaring. Flaring emissions consisted of 99.7 % CO2 and 0.3 % CH4, and venting emissions were 89 % CH4 and 11 % CO2.
In Europe the UK is the second largest and the Netherlands the third largest natural gas producer after Norway (Eurostat, 2020). Most of the UK offshore dry gas production takes place in the southern North Sea region, which comprises 81 dry gas fields with 181 installations. In 2019, 11.1×10⁹ Nm3 (norm cubic meter) of dry gas was produced (OGA, 2019). In comparison, the Dutch offshore gas production was 9.8×10⁹ Nm3 from 180 offshore gas fields located in the southern North Sea (NLOG, 2019).
Several studies indicate that bottom-up inventories underestimate emissions from the oil and gas industry (MacKay et al., 2021; Saunois et al., 2020; Gorchov Negron et al., 2020; Schwietzke et al., 2016; Pétron et al., 2014). Unintended leaks can significantly contribute to CH4 emissions (Varon et al., 2019; Pandey et al., 2019; Lee et al., 2018; Zavala-Araiza et al., 2017; Conley et al., 2016; Lyon et al., 2015). Top-down emission estimates from direct measurements close to sources can help to independently validate bottom-up estimates in inventory data. Better understanding, monitoring, and verification of CH4 emissions associated with oil and gas operations are crucial parts of the European Methane Strategy (European Commission, 2020).
Studies on measurements of CH4 emissions from offshore platforms are still rare. Ship-based measurements were conducted in the US Gulf of Mexico (Yacovitch et al., 2020), in South-East Asia (Nara et al., 2014), and in the North Sea (Riddick et al., 2019; Hensen et al., 2019). CH4 emissions from the vicinity of three UK gas platforms in the southern North Sea measured by Riddick et al. (2019) are 17.6–20.5 kg h−1. In this study, observations were taken on board small boats at an altitude of ∼ 2.5 m (above sea level – a.s.l.). The measurements relied on a Gaussian plume model to estimate the vertical resolution of a plume, resulting in a total uncertainty of 45 %. Hensen et al. (2019) determined CH4 fluxes around five Dutch facilities in the southern North Sea using a combination of measurements taken at 35 m a.s.l., a Gaussian plume model, and a tracer-release experiment. The results range from 10 to 194 kg h−1.
In contrast to ship-based measurements, the mobility of aircraft allows for sampling of emission plumes both horizontally and vertically, and thus airborne measurements provide more detailed information on marine boundary layer conditions, which are known to be complex. To the best of our knowledge, the only airborne measurements around offshore facilities conducted so far took place in the Sureste Basin, Mexico (Zavala-Araiza et al., 2021), in the US Gulf of Mexico (Gorchov Negron et al., 2020), in the Norwegian Sea (Foulds et al., 2022; Roiger et al., 2015), and in the North Sea (Lee et al., 2018; Cain et al., 2017). Lee et al. (2018) determined CH4 fluxes higher than 4500 kg h−1 arising from an uncontrolled CH4 blow-out around one installation in the central North Sea.
Our paper is organized as follows. In Sect. 2, we briefly introduce the aircraft instrumentation and sampling strategy applied during the field campaign in the southern North Sea. We describe the mass balance method used for the calculation of CH4 fluxes and give an overview of the emission inventories. In Sect. 3, we discuss our measurements and compare the estimated fluxes with the annualized Global Fuel Exploitation Inventory (GFEI) (Scarpelli and Jacob, 2019), UK annually reported data in the UK National Atmospheric Emissions Inventory (NAEI) and the UK Environmental and Emissions Monitoring System database (EEMS), and individual reporting by operators of the sampled Dutch platforms. Additionally, we compare our estimated fluxes with ship-based measurements, which were taken around the sampled Dutch platforms in 2018 (Hensen et al., 2019). Finally, we place the findings in a wider context by comparing them with results from aircraft observations in two other offshore regions (Norwegian Sea, Foulds et al., 2022; Gulf of Mexico, Gorchov Negron et al., 2020).
2.1 The 2018/2019 campaign in the southern North Sea
In April–May 2019 airborne measurements of emissions from offshore installations in the southern North Sea were conducted within the framework of the United Nations Climate & Clean Air Coalition (UN CCAC) objective to help characterize global CH4 emissions arising from the oil and gas industry. In a previously conducted campaign in 2018, regional survey flights were performed for method development purposes. In 2019, the flight strategy was adapted in order to sample emissions from dedicated installations, which were chosen because of available inventory emission estimates (UK sites, NAEI) and previous shipborne measurements (NL sites, Hensen et al., 2019). France et al. (2021) describe the instrument payload and the sampling strategy for both campaigns. Here we extend this study with a quantification of CH4 emissions for the studied offshore platforms in 2019.
Figure 1 depicts the flight patterns for 2019. A total of five flights were conducted in the southern North Sea region. Both UK and Dutch sites of offshore gas facilities were surveyed. One flight (F326) was aborted due to poor weather conditions. Platform positions were taken from the Oil and Gas Authority (OGA) for the UK sites and the Dutch Oil and Gas Portal (NLOG) for the Dutch sites. Multiple vertically stacked transects in a 2-D plane were flown downwind of the targeted platforms to fully capture the vertical extent of a plume. Measurements were made at distances varying from 2 to 7 km from the facilities at altitudes between 45 and 1300 m a.s.l. The flights took place in the afternoon hours, when the boundary layer was expected to be well-mixed. The boundary layer height was determined from abrupt changes in the observed potential temperature gradient which mark the boundary layer top, using meteorological data sampled during the vertical profiling of the aircraft.
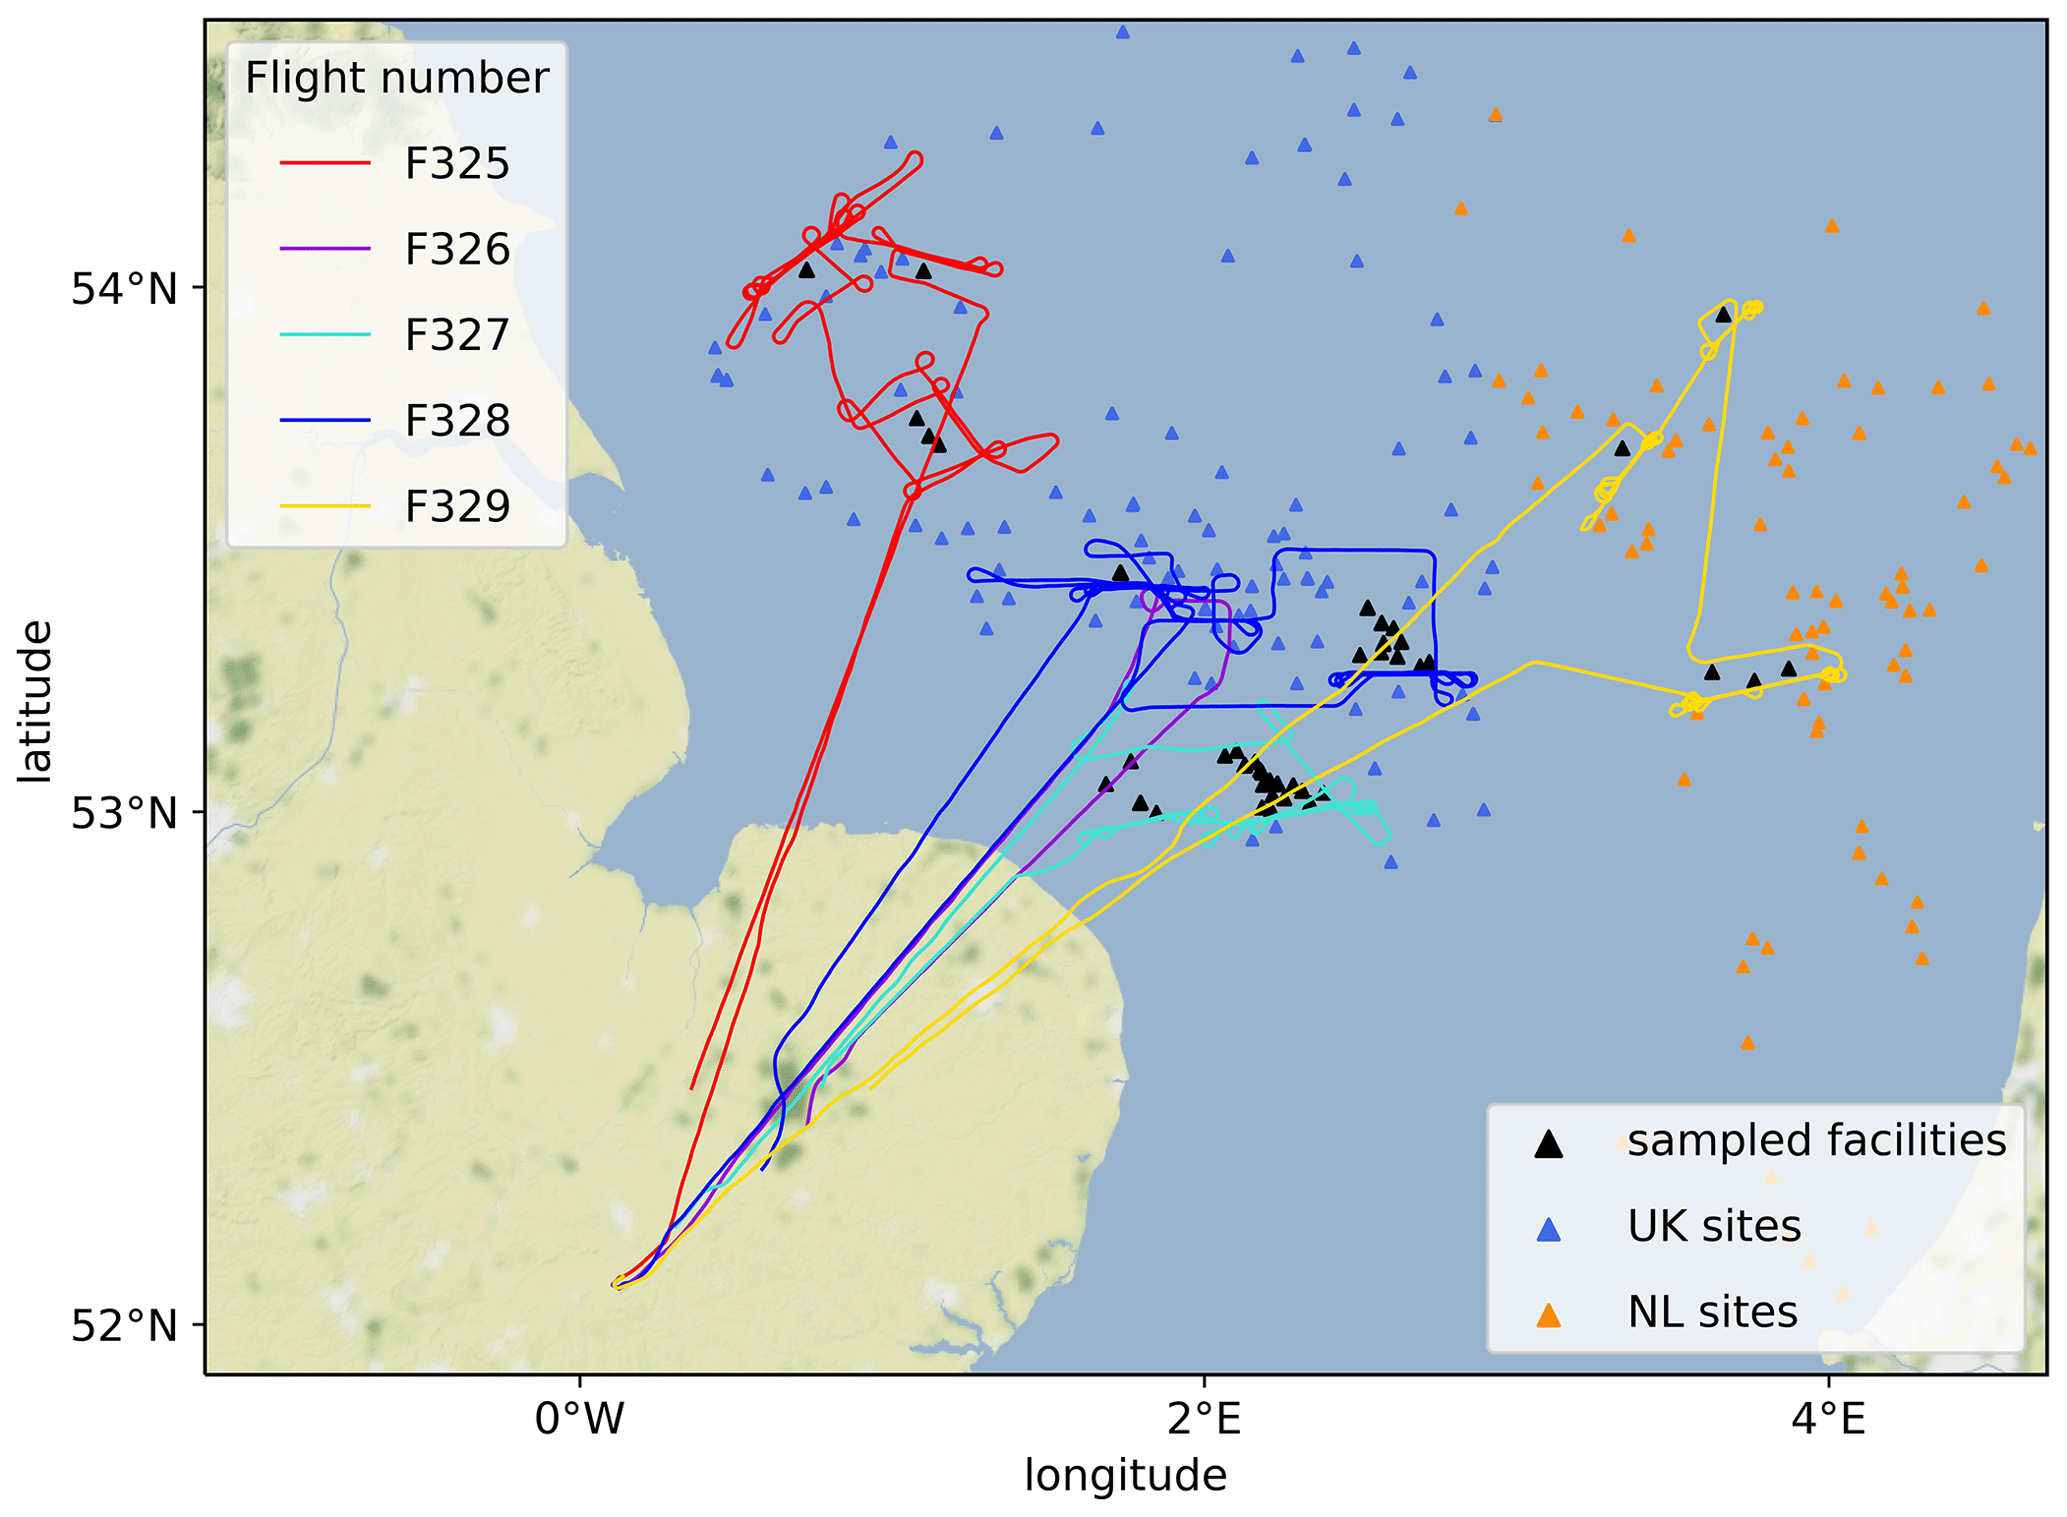
Figure 1Aircraft tracks for the 2019 campaign in the southern North Sea (lines). Locations of all offshore facilities in the UK (blue markers) and Dutch (orange markers) regions and the sampled facilities (black markers).
The DHC6 Twin Otter research aircraft, operated by the British Antarctic Survey (BAS), was equipped with several instruments to collect in situ data of atmospheric trace gases. A Picarro G2311-f 10 Hz analyser measured dry-air CH4 and CO2 mole fractions at a response time of 0.4 s and at a precision of 1.2 ppb (1σ at 1 Hz) for CH4. A tuneable infrared laser direct absorption spectrometer (TILDAS, Aerodyne Research Inc.) was deployed to detect C2H6 (response time < 2 s; precision 50 ppt over 10 s) (Yacovitch et al., 2014). To assess boundary layer physics, sensors for temperature, pressure, humidity, and 3-D wind were mounted at the front nose of the aircraft. An NOAA Best Air Turbulence probe was installed at the boom of the aircraft and provided wind measurements at a resolution of 50 Hz (Weiss et al., 2011; Garman et al., 2006). More details on the instrumentation and its calibration procedures are given in France et al. (2021).
2.2 Flux calculation method
We apply the mass balance method to determine the amount of CH4 emitted by the platforms or multi-platform complexes and passing through a 2-D vertical plane downwind (e.g. Pitt et al., 2019; Klausner et al., 2020; O'Shea et al., 2014). For the flux calculation, measured wind speeds in the target region are required to be relatively steady. In general, the mass balance method is applied with the approximation that the plume is vertically well-mixed within the planetary boundary layer. However, to reduce the uncertainty of this approximation under the given meteorological conditions, we conduct horizontal transects at several altitudes to get a higher resolution of the dispersed plume in the vertical. Thereby, we subdivide the 2D vertical plane into discrete mixing layers to account for a possible non-uniformly spread plume. Equation (1) is used to derive the CH4 flux (unit mass per time) across each individual horizontal transect i within the plane, followed by an integration over the vertical plume extent:
ΔCi represents the difference in CH4 mole fractions measured inside (Ci) and outside (C0) the plume (). The background mole fractions C0 during the time of flight through the plume are individually calculated for each transect. Thereby we use the average CH4 mole fractions over a 30 s time span on either side of the plume and interpolate linearly in between to account for any drift in the background. CH4 mole fractions are converted to a CH4 mass density by applying the ideal gas law, i.e. multiplication by molar mass M, the ideal gas constant R, and the measured pressure pi and temperature Ti. The CH4 mass density is then multiplied by the average wind speed V⊥ perpendicular to the flight track, which is calculated from the measured average wind speed, wind direction, and aircraft heading over all the transects. Finally, the CH4 flux for each single transect is obtained by multiplying by the plume width Δxi and the vertical depth of each mixing layer Di. The enhancement measured in each transect is assumed for a layer reaching halfway to the next upper or lower transect. We use all the horizontal transects for the flux calculation with the highest transect, where enhancements are found, as the upper plume boundary. In the case where CH4 enhancements were detected up to the highest transect of the aircraft, we use the boundary layer height as the maximal upper plume boundary assuming that the entrainment flux is small. The boundary layer height is inferred from inspection of the vertical gradient of the potential temperature, which is calculated using the in situ measured meteorological parameters (Stull, 1988). In the case of enhanced CH4 being detected in the lowest transect, the surface is assumed to be the lower plume boundary.
As a result, the bulk net CH4 flux through the plane Fluxtotal is the sum over the fluxes Fluxi calculated for each transect i where CH4 was enhanced:
Our flux calculation method is similar to the method applied by Foulds et al. (2022) but differs slightly in the calculation of ΔCi. Foulds et al. (2022) calculate the background CH4 mole fractions over a greater time period (50 s) due to a more variable CH4 background seen in the Norwegian continental shelf. In Appendix A, the CH4 flux calculation is illustrated by using observations of platform P1 on 30 April 2019. Detailed information on the uncertainty calculation method is provided in Appendix B.
2.3 Emission inventories
In our comparison with bottom-up estimates, we refer to a globally gridded annual inventory based on IPCC Tier-1 methods (IPCC, 2006), UK national point-source inventories, and facility-level reporting by Dutch operators.
2.3.1 Globally gridded annual inventory of CH4 emissions from fossil fuel exploitation
The Global Fuel Exploitation Inventory (GFEI) (Scarpelli and Jacob, 2019) is a globally gridded 0.1∘ × 0.1∘ inventory containing CH4 emissions arising from fossil fuel exploitation for the year 2019. National emission totals, which are based on country-specific emission factors, are reported to the UNFCCC (United Nations Framework Convention on Climate Change) and are used in the inventory for spatial downscaling to the locations of potential sources (Scarpelli et al., 2020). Thereby, global data sets for oil and gas infrastructure are used. The UK UNFCCC reporting for emissions from the offshore oil and gas exploitation is based on the UK Environmental and Emissions Monitoring System (EEMS) database (Brown et al., 2023), and the Dutch reporting is based on the Dutch Pollutant Release and Transfer Register (Honig et al., 2022). In the UNFCCC-reported data, fugitive emissions are already categorized into sub-sectors, whereas venting and flaring emissions are reported as totals. Thus, the latter are disaggregated by the inventory to the sub-sectors using IPCC Tier-1 methods (IPCC, 2006). As a result, the inventory resolves the different fossil fuel sectors (oil, gas, coal) and the associated sub-sectors (distribution (fugitive), exploration (fugitive + venting + flaring), processing (fugitive, flaring), production (fugitive, flaring), storage (fugitive), and transmission (fugitive, venting)). We compare our emission estimates with the GFEI v2 data set for total global fuel exploitation for gas from the Harvard Dataverse (Scarpelli and Jacob, 2019). Thereby, we take the inventory data given for each grid cell (Mt km−2) and calculate the emission from the grid cell area.
2.3.2 UK annual point-source inventories
The UK EEMS database is the environmental database of the UK oil and gas industry maintained by the Offshore Petroleum Regulator for Environment and Decommissioning (OPRED) and the UK Department for Business, Energy & Industrial Strategy (BEIS). It provides annual data from measurements and calculations made for single offshore installations based on reported data from operators. According to the EEMS atmospheric emission calculations (OPRED (BEIS), 2008), monitoring systems of emitted gases are rare at offshore installations. Where no direct measurement data are available, the emission is calculated by the inventory multiplying activity data (e.g. fuel consumption or flow to flare and venting stacks) by locally derived or default emission factors, which are mainly taken from the literature. Inventory sources for CH4 and CO2 are differentiated into engines, heaters, and turbines for either diesel, fuel oil, or gas consumption; total fugitive emissions; gas flaring from maintenance, routine, or upsets and other; and total gas venting and emissions from ship oil loading. The latest EEMS data are available for 2018 and 2019.
The UK National Atmospheric Emissions Inventory (NAEI) is an emission database listing all UK point sources and is provided by BEIS. For offshore oil and gas installations it is based on the Emissions Trading Scheme (ETS) data set for combustion and flaring sources and on the EEMS inventory for fugitives, venting, and other sources such as oil loading (with combustion and flaring data only used if not available in ETS) (Brown et al., 2023; Glen Thistlethwaite, Technical director of NAEI, personal communication, 2023). The inventory compilation process includes quality checks against other reporting systems such as the Petroleum Production Reporting System (PPRS), which also reports venting, flaring, and gas use data. In the NAEI, emission data are aggregated for all platforms associated with a certain oil or gas field. Offshore emission data are available for CH4 and for CO2. The fluxes observed in this study arise from installations within a certain field and are compared to the inventory data from 2018.
2.3.3 Facility-level reporting by platform operators for the survey date
For the sampled Dutch sites, facility-level operator-based reporting on CH4 emission was provided after the flights. The OGMP 2.0 level of the reporting corresponds to level 3, i.e. using generic emission factors for individual source types. The reporting comprises information on the status of the installation (producing or offline on an hourly basis), the total amount of gas produced, and CH4 and CO2 emissions on the survey day, including additional information on emission types and sources (venting, flaring, and fugitives). Such information was unavailable for the UK facilities upon request via the trade association Oil & Gas UK.
The flight conditions during the flights selected for this study were generally good, with moderate wind speeds (3–8 m s−1). The number of horizontal transects conducted downwind of the sampled installations and used for the flux calculation range from four to nine. For one flight the flux calculation for two installations was not successful due to a poorly defined plume. As a result, CH4 emission fluxes have been determined for six UK and five Dutch facilities sampled during flight surveys on 30 April, 2 May, and 6 May 2019 using the mass balance method described above. The installations, for which the flux calculation was successful, comprise 15 % of the UK dry gas production (OGA, 2019) in the southern North Sea region and 6 % of the Dutch offshore dry gas production (NLOG, 2019) in 2019. Under the prevailing conditions found during the three flights, the level of detection, which is a result of the maximum uncertainty of all measured flux calculation parameters (wind speed V⊥, layer depth Di, CH4 enhancement ΔCi, pressure pi, temperature Ti, and plume width Δxi), is 0.3 kg h−1 (2σ). No CH4 enhancement was detected downstream of 4 out of 11 specifically targeted platforms (P3, P5, P6, and P9 in Table 1). In addition, a number of several other platforms were passed downwind with no indication of CH4 enhancements. These observations are listed in Appendix E.
Table 1Observed CH4 fluxes for the UK and Dutch sites from this study and emissions from annual reporting from the UK National Atmospheric Emissions Inventory (NAEI, 2018), the UK Environmental and Emissions Monitoring System database (EEMS, 2018/2019), and the Global Fuel Exploitation Inventory (GFEI, 2019). For 4 out of the 11 targeted installations, emissions are measured to be below the level of detection (LoD, 0.3 kg h−1). Data from individual operator-based reporting on the specific survey date were available only for the Dutch sites. Information on emission processes is given for venting (“vent”), fugitives (“fug”), and flaring (“flar”). Results from a ship-based top-down study (Hensen et al., 2019) are listed for four out of the five sampled Dutch sites. NA stands for not available and n/a stands for not applicable.
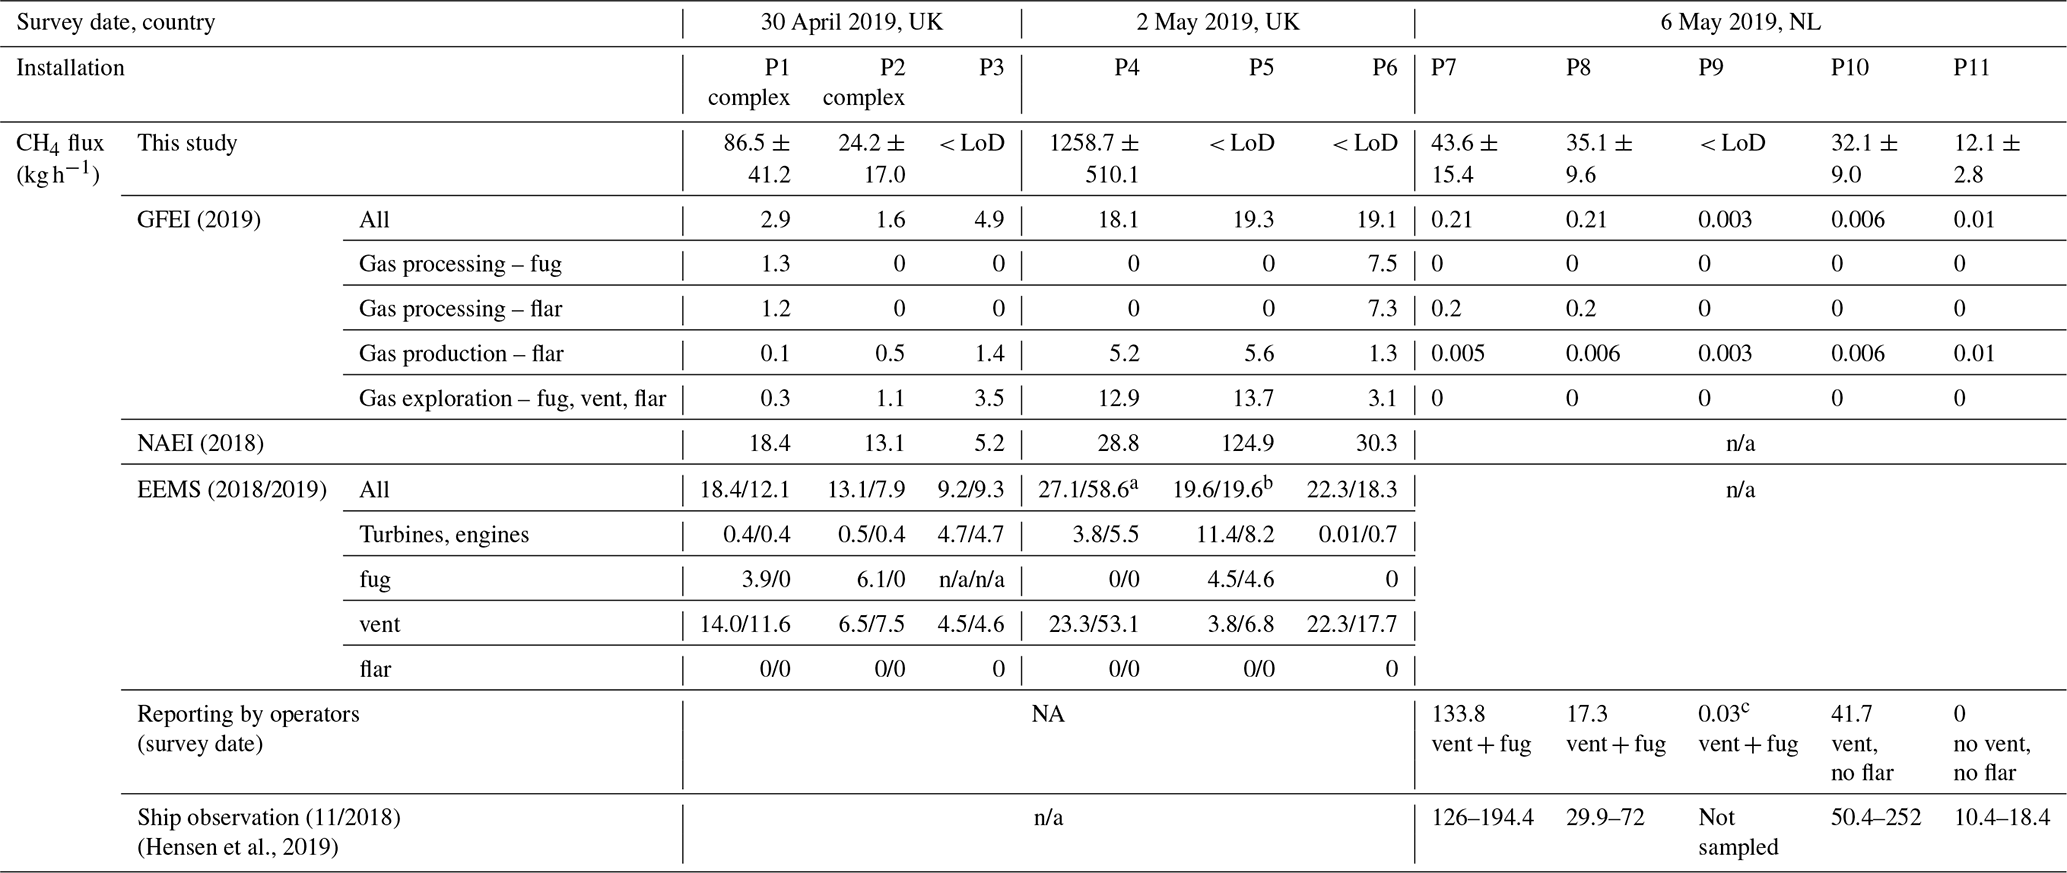
a Reporting for 2 (2018) and 1 (2019) platforms out of 19 platforms. b Reporting for 1 (2018 and 2019) platform out of 15 platforms. c P9: offline (no dry gas production).
In this section we compare our measured CH4 fluxes with reported emissions and ship-based measurements for the Dutch sites. Further, we present observed correlations between CH4, C2H6, and CO2.
3.1 Comparison of calculated and reported CH4 fluxes
In the following, the top-down results of the 2019 measurements are compared to the most recent available bottom-up estimates from globally gridded and national point-source annual inventories from the years 2018 (NAEI, EEMS) and 2019 (EEMS, GFEI) and to daily operator-based facility-level reporting. We also compare our results to a ship-based top-down study conducted by Hensen et al. (2019) for the sampled Dutch sites. Observation-based top-down methods only provide “snapshot” emission estimates representing emissions only for the times of the measurements. This means that, (a) to allow for a comparison, the yearly inventory data need to be scaled to the temporal resolution of the measurement (or vice versa), and (b) a detailed one-to-one comparison is hampered, which is especially true for cases when observations are made during times of non-typical operational conditions and for intermittent emissions (Foulds et al., 2022; Chen et al., 2022). Therefore, for the comparison with inventories, a set of snapshot measurements around a group of sites, which represent a distribution of emissions in a region, is preferred over a one-to-one comparison (Tullos et al., 2021).
Figure 2 and Table 1 show the estimated top-down CH4 fluxes along with the reported bottom-up fluxes for all the sampled installations P1–P11. Typically, one installation denotes a platform for drilling, accommodation, and production. P3 consists of three platforms, and P6 has one central platform with three satellite platforms. P4 and P5, both multi-platform complexes, have two central platforms with a compression unit and a terminal and several more producing platforms around. P4 consists of 2 central platforms, 6 platforms for production, and 3 wellhead platforms (19 platforms in total). P5 has 2 central platforms, 4 platforms for production, and 3 wellhead platforms (15 platforms in total). Emissions in both regions are the same magnitude and range from 12.1 to 86.5 kg h−1. Only the multi-platform complex P4 stands out with higher emissions (1258.7 kg h−1). The relative uncertainties of the determined fluxes range from 23 % to 70 %, with the wind measurements as the main contributors (> 90 %).
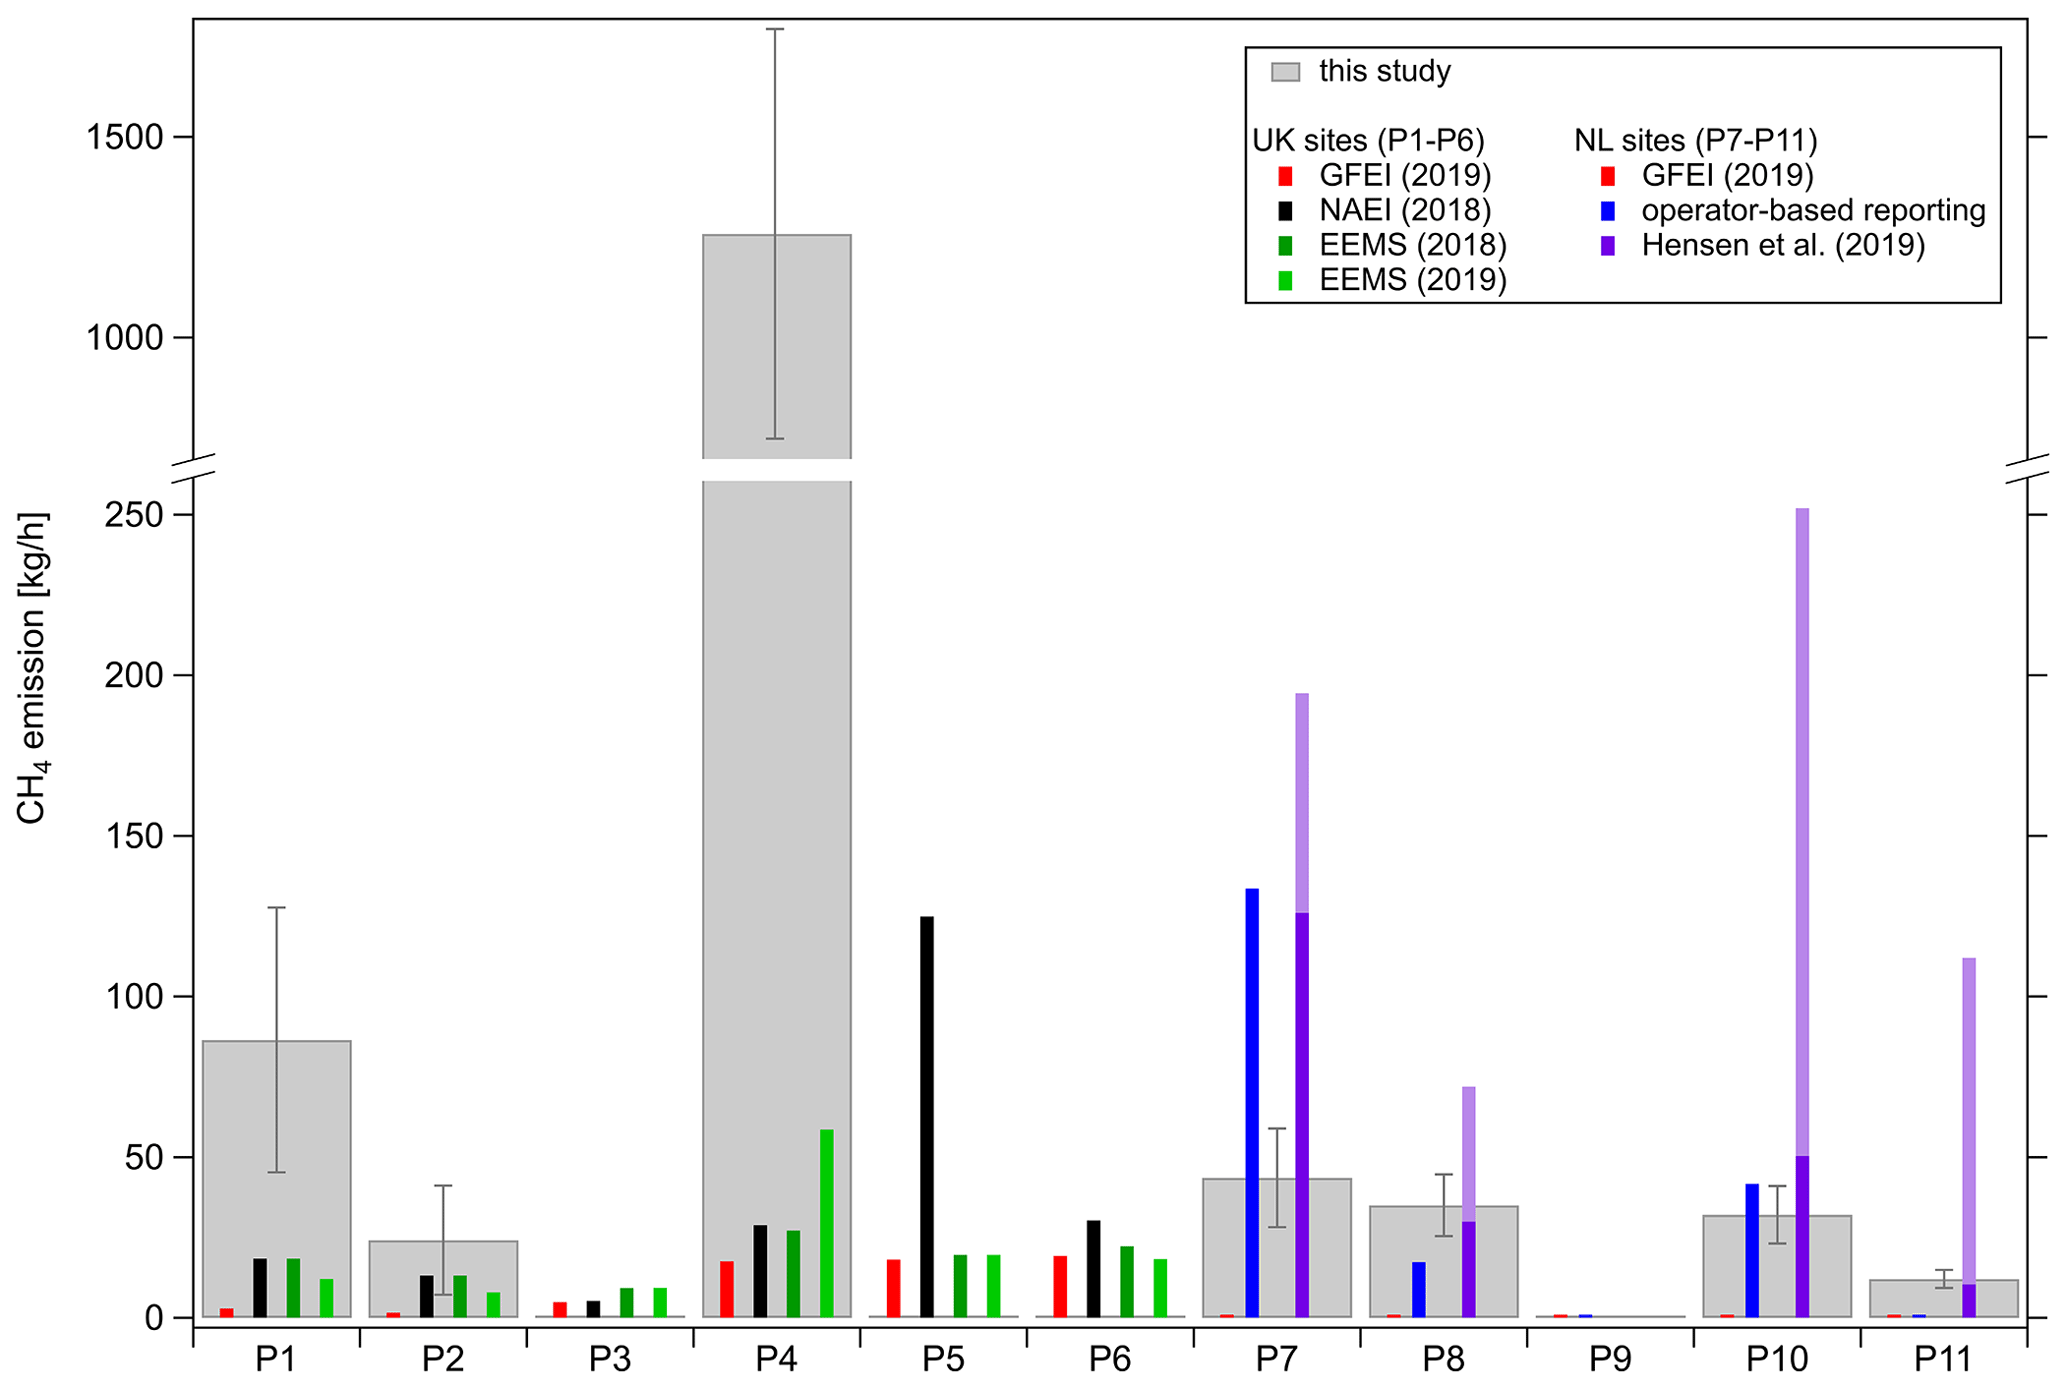
Figure 2Comparison of calculated CH4 fluxes from this study (grey) for UK sites (P1–P6) and Dutch sites (P7–P11) to the Global Fuel Exploitation Inventory (GFEI; red), the UK National Atmospheric Emissions Inventory (NAEI; black), and the UK Environmental and Emissions Monitoring System database (EEMS; dark green for 2018; light green for 2019), together with reported fluxes from operators (blue) and a ship-based top-down study (range in light purple; minimal flux in dark purple) for the Dutch sites (Hensen et al., 2019). The inventory annual emission data are converted to hourly emissions. For 4 out of the 11 targeted installations, no downwind enhancements were detected (P3, P5, P6, P9). GFEI (2019) emission data for P7–P11 and operator-based reporting for P9 and P11 are smaller than 0.3 kg h−1. Operator-reported values were not available for the UK sites.
3.1.1 Comparison to a globally gridded annual inventory (Tier 1)
We compare our estimated fluxes with the GFEI v2 for 2019, which contains total CH4 emissions from fossil fuel exploitation and a distribution of emissions per sub-sector. The platforms surveyed in this study are considered to be processing, production, and exploration sites by the inventory. As an example, the total CH4 emissions reported for P1 (2.9 kg h−1) break down to 44 % estimated to arise from fugitives during gas processing, 43 % from flaring during gas processing, 10 % from exploration (fugitives + venting + flaring emissions), and 4 % from flaring during production. According to the inventory, UK emissions are fugitive, venting, and flaring emissions, whereas emissions at the Dutch sites arise only from flaring. For all the sampled installations, operations other than exploration, production, and processing are claimed to emit no CH4.
Compared to the GFEI v2 data set for the total CH4 emissions from gas exploitation, the measured fluxes of (1369.4 ± 568.3) kg h−1 are 21 times higher than the GFEI data (65.9 kg h−1) for all the sampled UK facilities on aggregate. However, the highest-emitting UK site (P4 complex) is identified as the highest emitter by the GFEI as well. The factor by which measured emissions around the Dutch sites are underestimated by the GFEI is an order of magnitude higher compared to the UK sites: the measured fluxes ((122.9 ± 36.8) kg h−1)) are 279 times higher than the GFEI data (0.44 kg h−1) on aggregate for all the sites. This high discrepancy points to the weaknesses in using global inventories for field-specific emission characterizations, especially when compared with snapshot measurement studies. However, similarly to the UK sites, the two platforms (P7, P8) with the highest emissions measured are correctly identified by the GFEI as the highest emitters.
For the sampled installations in this study, Dutch GFEI data are 2 orders of magnitude smaller compared to UK GFEI data. GFEI relies on UNFCCC-reported emissions. Using the UNFCCC GHG Data Interface (UNFCCC, 2022), Dutch annual CH4 fugitive emissions from the natural gas energy production sector and reported for the year 2019 are 14 times smaller compared to the UK equivalent. Further, in contrast to UK reporting, no data are reported for the natural gas sub-sectors exploration, production, and processing. Thus, GFEI values for the Dutch sites can only arise from UNFCCC-reported total venting and flaring emissions, since those are disaggregated by the inventory to the sub-sectors. For the sampled Dutch sites in this study, the inventory gives only flaring emissions from production and processing. Therefore, the UNFCCC-reported Dutch emissions, which the inventory is based on, could explain the high discrepancy between the GFEI Dutch and UK values.
A related study of 21 oil and gas facilities in the Norwegian Sea finds a better agreement of the GFEI v1, which gives emissions for 2016, with the measured fluxes, being only a factor of 1.4 higher on aggregate for all the platforms (Foulds et al., 2022). Similarly to the Dutch UNFCCC reporting, the Norwegian UNFCCC reporting does not show emissions for the natural gas sub-sectors exploration, production, and processing. Considering that Foulds et al. (2022) sampled both oil- and gas-producing installations, the better agreement could possibly be attributed to UNFCCC-reported emissions for the oil sector.
3.1.2 Comparison to UK annual point-source inventories
The annual estimates of the UK national point-source inventories NAEI and EEMS are smaller than the fluxes measured during this study. The measured fluxes for P1 and P4 are underestimated, while P2 agrees with both inventories within uncertainties. For 2018 the measurement-derived fluxes are factors of ∼ 6 (NAEI; 220 kg h−1) and ∼ 12 (EEMS; 109.7 kg h−1) higher cumulatively for all the sampled facilities. However, EEMS emission data for 2019 agree slightly better with the observations made in 2019: top-down estimates are a factor of ∼ 11 higher compared to the EEMS-reported data (125.8 kg h−1). Most CH4 emissions of sampled installations and reported by EEMS are attributed to venting (35 %–96 %) besides emissions arising from the operation of turbines and engines (0.1 %–50 %). It is worth noting that, for all the platforms listed in EEMS, zero flaring emissions are reported. During the flights, no visible flaring was observed. Nevertheless, flaring is stated to have a share of 3 % of the southern North Sea region's total CH4 emissions in 2019 (OGA, 2020). The Global Gas Flare Catalog 2019 from the Earth Observation Group at the Payne Institute for Public Policy (Elvidge et al., 2015, 2013), which uses Visible Infrared Imaging Radiometer Suite (VIIRS) data, shows flaring in the North Sea region. However, for the sampled installations, no flaring is observed in 2019, which confirms the inventories' zero flaring claim, at least for the sampled installations.
As discussed in Sect. 2, EEMS data are fed into the NAEI, and hence we expect that NAEI 2018 reported values to be the same as or higher than the EEMS 2018 data. A comparison between NAEI data and EEMS data from 2018 shows that NAEI numbers are consistent with EEMS for two (P1, P2) and higher than EEMS data for three (P4, P5, P6) UK platforms. However, for P3, the NAEI-reported value is smaller compared to EEMS 2018. This could either indicate an error in the EEMS reporting or that the emissions of P3, which consists of three platforms, are misallocated in the NAEI.
In EEMS, emissions are listed for one specific platform, also in the case of multi-platform complexes (P4, P5). Those platforms might be interpreted as being representative platforms with the reported emissions being aggregated emissions for the complex. Regarding the multi-platform complex P4, we used the FLEXPART (FLEXible PARTicle) dispersion model (Pisso et al., 2019) to attribute the measured emission plumes to individual platforms located within the complex (see Appendix C). The platforms that the observed fluxes were attributed to do not match the (representative) platforms listed in EEMS 2018/2019.
The discrepancy with the UK national inventories detected in this study is higher than that reported in previous airborne studies of other offshore regions. Zavala-Araiza et al. (2021) estimated offshore CH4 emissions in the Sureste Basin, Mexico, to be more than an order of magnitude lower than the values given in the Mexican greenhouse gas emission inventory. Gorchov Negron et al. (2020) generated an airborne-measurement-based inventory comprising offshore facilities located in the US Gulf of Mexico. They showed that, for shallow-water facilities, CH4 emissions are more than a factor of 2 higher than the estimate of the U.S. Environmental Protection Agency Greenhouse Gas Inventory (EPA GHGI) and the Gulfwide Offshore Activity Data System (GOADS) inventory.
3.1.3 Comparison to facility-level reporting by platform operators for the survey date
As expected, the smallest discrepancy between top-down and bottom-up estimates exists for the comparison to emission data of individual facilities provided by platform operators for the specific survey day. Operator-based reporting was only available for the five sampled Dutch installations (P7–P11). The facility-level estimates deviate by up to a factor of ∼ 12 compared to the reporting, where two out of the five facilities (P7, P10) are overestimated and another two facilities underestimated (P8, P11). P9 is reported as offline on the survey day, which agrees with the measurements showing no elevated CH4, C2H6, and CO2. According to the operators, CH4 emissions arise from venting and fugitives for four out of the five installations (P7–P10). P10 is reported as offline during the time of flight, while emissions are still measured and are smaller than the reported venting CH4 emissions. For P11, no venting or flaring was recorded, although CH4 was detected during the measurements conducted downstream. The measured emissions might be attributed to fugitives, which are not excluded by the operator in this case. Flaring emissions are explicitly excluded for only two out of the five installations (P10, P11). For P7–P9, flaring emissions could contribute though. For all the sampled Dutch installations together, we find that our estimated flux of (122.9 ± 36.8) kg h−1 deviates by a factor of 0.64 (ranging from 0.33 to 12 for the individual facilities) from the reported values (192.8 kg h−1). A comparison to operator-reported data for offshore installations in the Norwegian Sea by Foulds et al. (2022) shows that, although there are deviations for individual facilities, reported data agree similarly well on aggregate for a larger sample size (18 facilities) with the measured fluxes being smaller than reported emissions by a factor of 0.8 (ranging from 0.1 to 22 for the individual facilities).
3.1.4 Comparison to a ship-based top-down study
The planning for the flight on 6 May 2019 around the Dutch installations relied on a ship-based top-down study conducted by the Netherlands Organisation for Applied Scientific Research (TNO) in 2018 (Hensen et al., 2019). With the aim of deriving CH4 emission fluxes, measurements were taken at distances of up to ∼ 3 km downwind of 33 platforms in November 2018. CH4 was measured with a TILDAS spectrometer (Aerodyne Research, Inc.) and a Picarro instrument, where the inlet was installed at 35 m a.s.l. The results shown in Table 1 were obtained by combining the measurements with a Gaussian plume model and a tracer-release experiment. The derived fluxes range from 10 to 252 kg h−1. For P8 and P11 our fluxes are within the range of the determined fluxes from the ship-based study, whereas in the cases of P7 and P10 our measured fluxes are smaller. For the studied four Dutch facilities, on aggregate, our measured fluxes, (122.9 ± 36.8) kg h−1, are smaller with respect to the ship-based measurements (216.7–536.8 kg h−1) and deviate by factors of 0.23–0.57.
3.2 Correlation between CH4 and C2H6 for all the platforms
For all the sampled installations for which enhanced CH4 was detected, we observe clear correlations with co-emitted C2H6, which is an indicator of fossil fuel emissions (Lowry et al., 2020; Peischl et al., 2018; Hausmann et al., 2016; Smith et al., 2015). C2H6-to-CH4 ratios of fossil fuels depend on the type of field or reservoir (gas, gas condensate, oil). Since the southern North Sea region contains predominantly dry gas fields with relatively low gas condensate (wet gas) production, we expect low C2H6-to-CH4 ratios ranging from 1 % to 5 % (dry gas) and from 5 % to 10 % (gas condensate) (Xiao et al., 2008; Jones et al., 2000) or from 1 % to 6 % (dry gas) and > 6 % (wet gas) (Yacovitch et al., 2014). We calculate an C2H6-to-CH4 ratio for each transect from the integrated plume area of the respective CH4 and C2H6 enhancements and take the average over all the transects for each sampled installation. As an example for the calculation, Fig. A2b in Appendix A shows the simultaneous enhancements in C2H6 and CH4 for peak 5 of P1. The measured values range from 2.5 % to 7.8 % for all the installations. We compare the measured ratios to reported values from the OGA Shell/ExxonMobil Geochemistry Database for Southern North Sea (OGA, 2017) for the UK sites and the NLOG for the Dutch sites (for all the measured and reported values, see Table D1 in Appendix D). Compared to the measured ratios, the reporting underestimates the measurements for P7 and P10, overestimates the measured value for P11, but is consistent for P4 and P8. In general, the observed and reported ratios match for the dry gas and gas condensate binary categorization.
3.3 Correlation between CH4 and CO2 for selected platforms
Enhanced CO2 mole fractions accompanied the CH4 enhancements at five installations (P1, P2, P4, P7, P10), indicating a combustion source from either flared CH4 or other combustion sources such as turbines or engines. For P8 and P11, C2H6 was enhanced, while no CO2 enhancement was observed (< LoD). Figure 3 shows the time series for a transect flown downwind of P1 with simultaneous enhancements in CH4, CO2, and C2H6 mole fractions as examples of the observed plumes. The CO2 flux is determined from the gradient of a linear regression between the CO2 and CH4 enhancements since both species are detected by the same instrument (Picarro Analyser). Figure A2a in Appendix A shows the CH4-to-CO2 scatterplot for P1. For three of the platforms (P1, P4, P10), CH4 and CO2 were well-correlated, and CO2 fluxes have been determined.
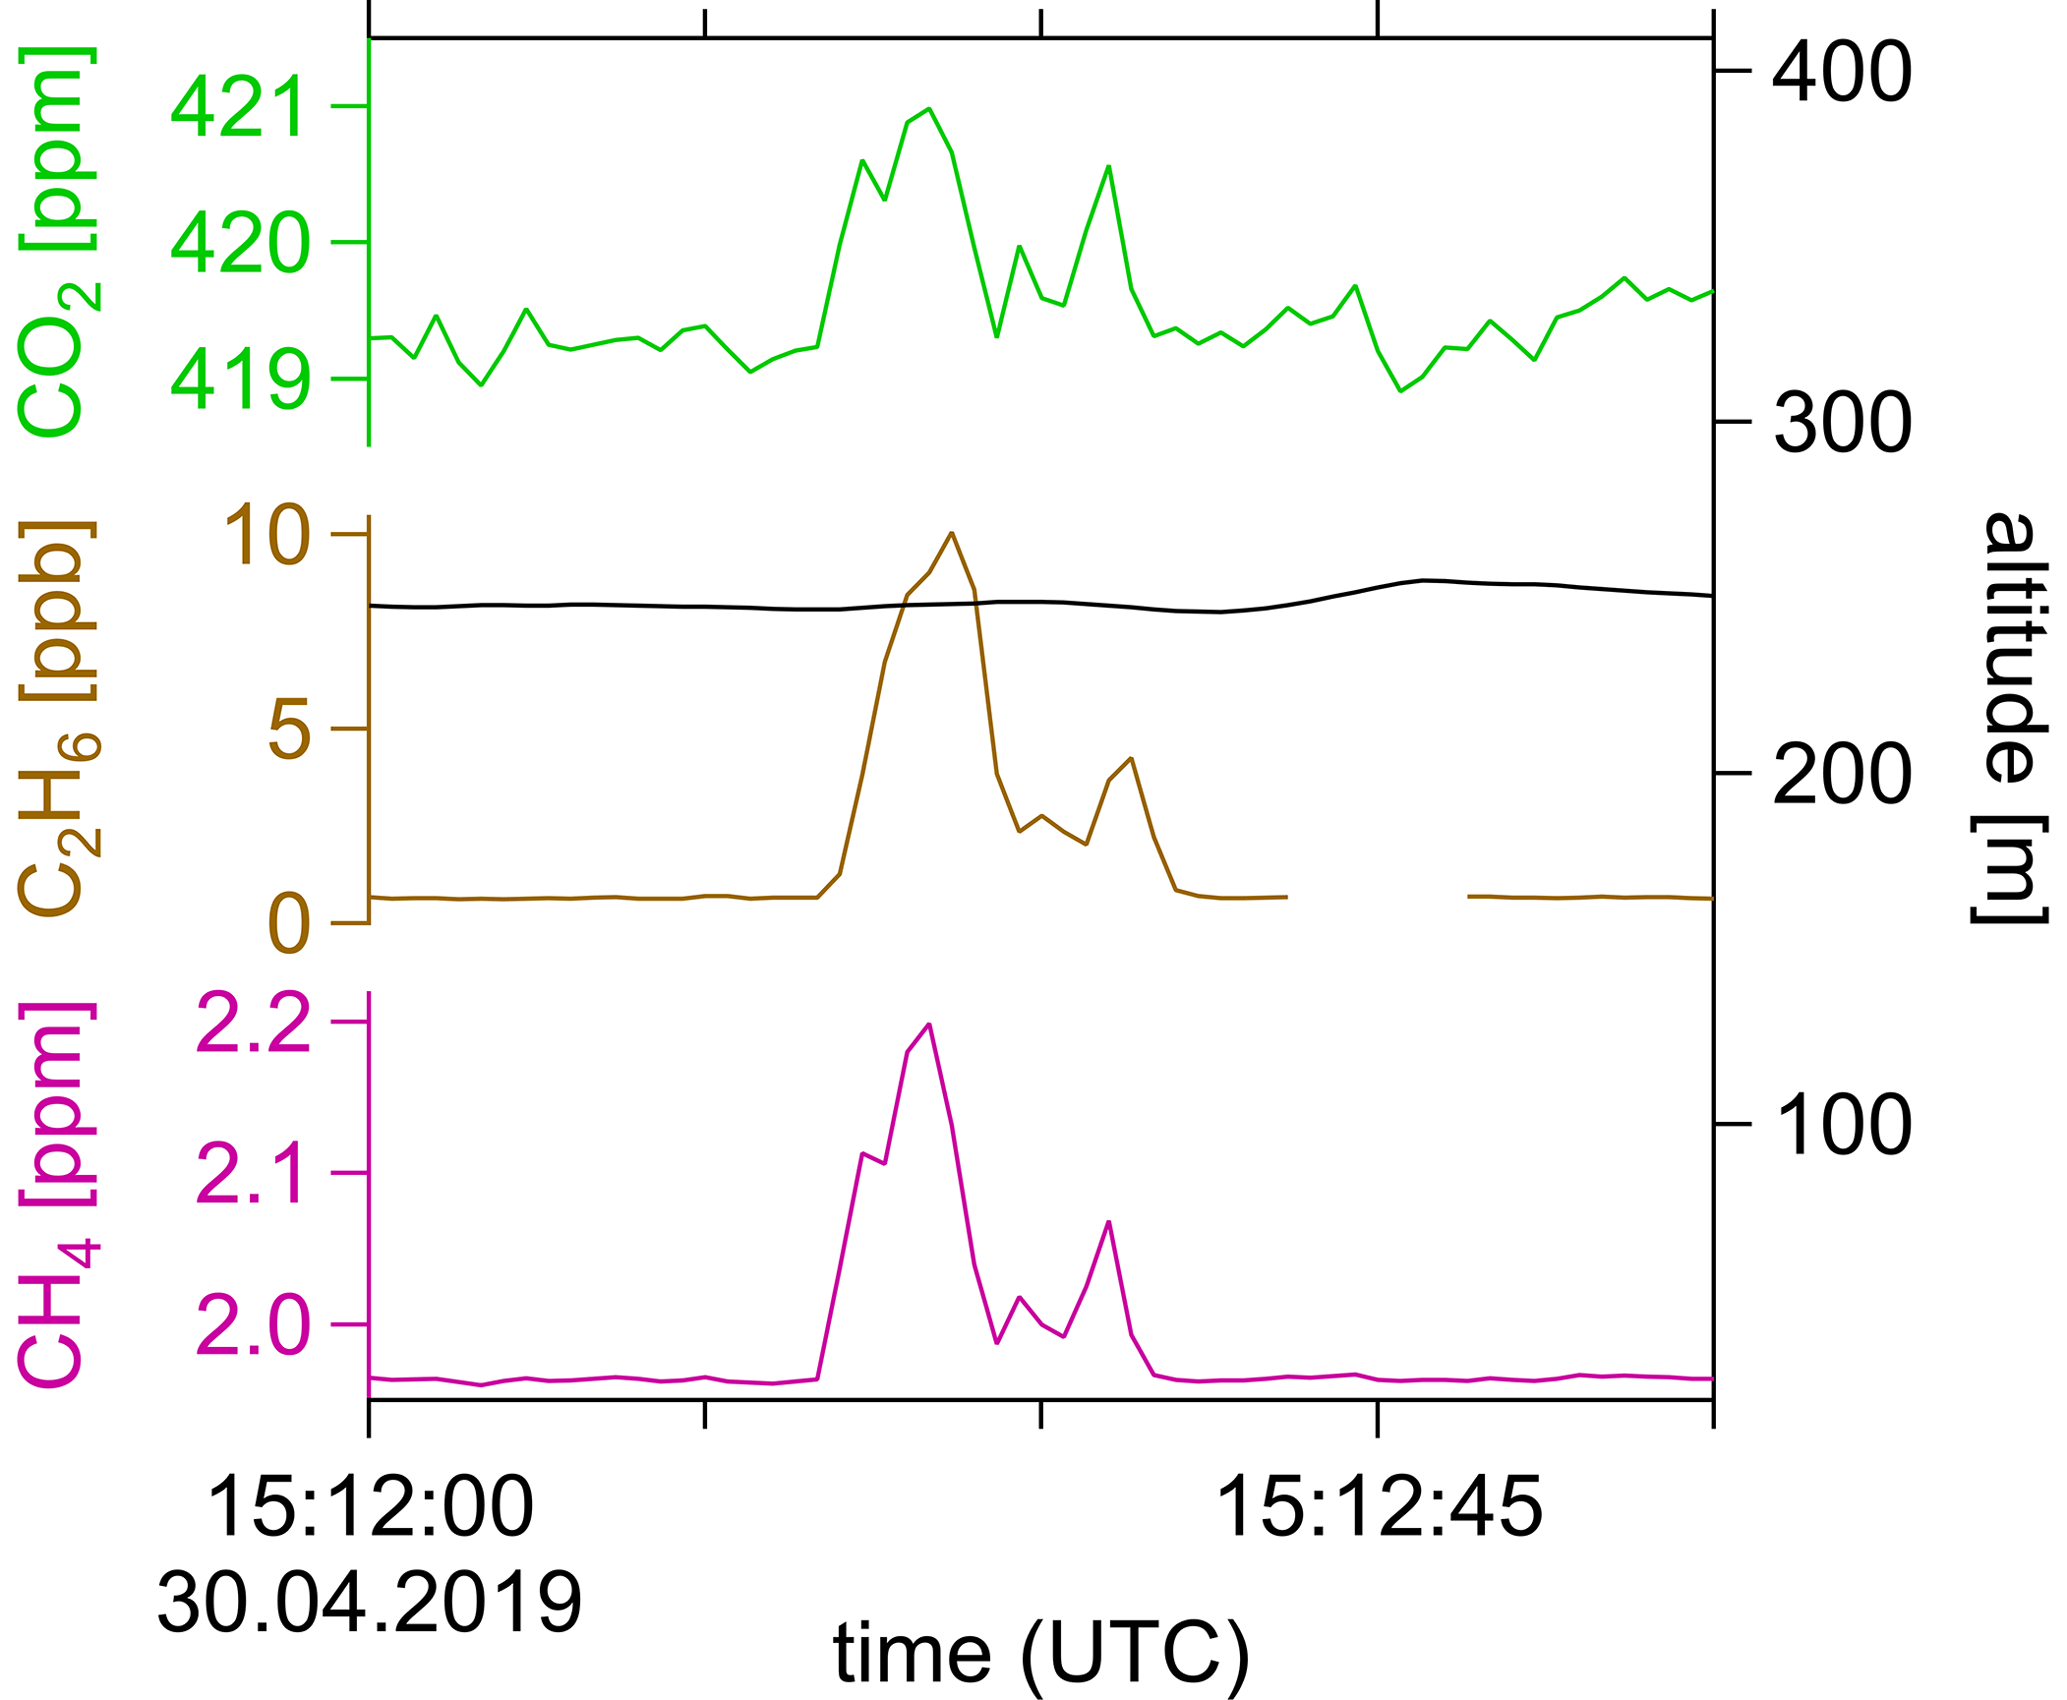
Figure 3Time series (1 Hz) of a transect at 250 m altitude downwind of P1: coinciding elevations in CO2 (green), C2H6 (brown), and CH4 (magenta) mole fractions. C2H6 is a tracer for fossil fuel emission and CO2 indicates a combustion source.
Table D1 in Appendix D shows the measured CO2 fluxes along with inventory emission data from the UK point-source inventories NAEI and EEMS and the Dutch operator data. For P1, EEMS 2018 and 2019 overestimate emissions, while the NAEI states lower emissions but matches within the uncertainties. Likewise, EEMS 2019 agrees within the uncertainties with the measured CO2 fluxes from P4, while both NAEI and EEMS 2018 underestimate emissions. According to EEMS, which categorizes emissions into turbines or engines, fugitives, venting, and flaring, CO2 emissions arise mainly from the combustion of diesel and gas in turbines and engines. Only for the platform complex P5 are minor emissions from fugitives and venting listed. In EEMS, flaring emissions are zero for all the UK platforms. This is inconsistent with data from the UK Oil and Gas Authority, which report that 4 % of the CO2 emissions in the SNS region are supposed to arise from flaring in 2019 (OGA, 2020). From the number of CO2 and CH4 flaring emissions in 2019 in the SNS and the Irish Sea region given in the Flaring and Venting Report (OGA, 2020), the unburnt fraction, i.e. the ratio of unburnt CH4 to CO2 from flaring emissions, is 6.4 %. If we calculate this ratio for the sampled CH4 and CO2 plumes on the UK platforms, we get higher ratios: 12.4 % (P1) and 14.7 % (P4). This means that either there is no flaring on the platform or, if some flaring occurred, there were additional CH4 fugitive or venting sources. Compared to Dutch operator data, we find that, around two Dutch platforms (P8, P11), no simultaneously emitted CO2 was detected, although Dutch operator data state CO2 emission on the survey date. For P10 we derive a CO2 flux half the size of the emissions reported for the survey date. Dutch operator data explicitly exclude flaring sources for P10 and P11 (see Table 1) and list only combustion sources such as turbines and engines. To sum up, from the measured total emissions, we cannot clearly differentiate flaring from other combustion sources. However, if there were any flaring sources, there must have been additional fugitive or venting CH4 sources according to the measured CH4-to-CO2 ratios.
3.4 Loss rates
In this section we determine loss rates, i.e. the ratio of gas lost to the atmosphere to dry gas production rates. We calculate the amount of gas lost to the atmosphere from the determined CH4 emission rates and the CH4 mol percentage from the OGA Shell/ExxonMobil Geochemistry Database for Central North Sea (OGA, 2017) for the UK sites and from the operator data for the Dutch sites. UK production rates are given as monthly values by OGA (2019). We include production from upstream fields with only subsea wells and no platform infrastructure. Dutch production data were provided by Dutch operators for the specific survey day. For three UK facilities (P3, P5, P6), no emissions were detected, although they were producing during the month of the survey. According to the Dutch operator, P9 did not produce on the survey day, and we did not detect a plume either.
The determined loss rates for the Dutch and UK sites are smaller than 1.0 %, except for P4, which shows a higher loss rate of 3.1 % (see Appendix E for the individual production rates and loss rates). Besides the fact that P4 is a multi-platform complex and is relatively old, i.e. producing for 50 years, there is no indication of abnormal activities on the survey date.
3.4.1 Comparison with airborne studies in other regions (Norwegian Sea, northern Gulf of Mexico)
Figure 4 depicts the determined CH4 emission rates and production rates from this study compared to the results obtained in two other airborne studies conducted by Foulds et al. (2022) in the Norwegian Sea and Gorchov Negron et al. (2020) in the northern Gulf of Mexico.
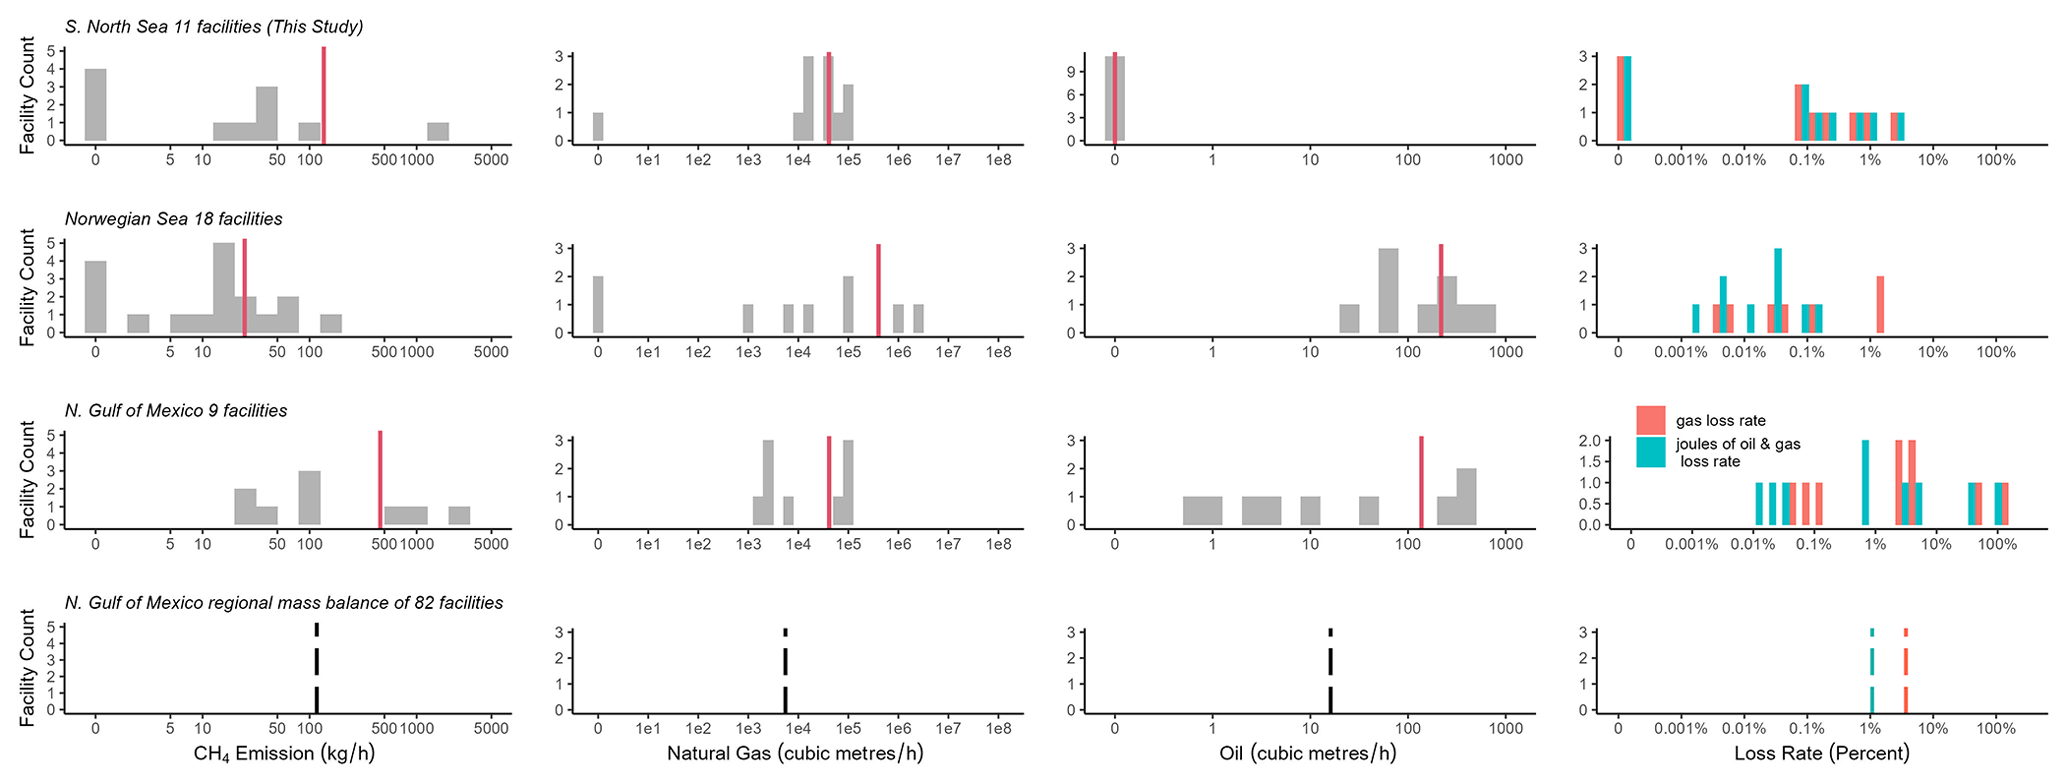
Figure 4Comparison of measured CH4 emission rates (first column) as well as the corresponding natural gas (second column) and oil (third column) production rates and loss rates (fourth column) in the southern North Sea (this study) with two other airborne studies conducted in the Norwegian Sea (Foulds et al., 2022) and in the northern Gulf of Mexico (Gorchov Negron et al., 2020). Red lines denote the respective average values. The dotted lines show the average value obtained in a regional mass balance in the northern Gulf of Mexico. The facility count does not include satellite structures.
The CH4 emission fluxes for individual facilities, i.e. rates, calculated in this study compare with the emission rates determined in the Norwegian Sea and in the northern Gulf of Mexico (see the left side of Fig. 4). The emission rate of P4 is as high as the emissions measured around similar infrastructure types in the northern Gulf of Mexico, i.e. multi-platform complexes in shallow water, which equally show emission rates higher than 500 kg h−1. In the gulf, an inconstant temporal variability of those infrastructure types was seen, which might correspond to the non-detectable emissions of the multi-platform complex P5. Comparing the average absolute emission rates per facility (red vertical lines), the lowest average emission rates were determined around 18 facilities in the Norwegian Sea (24 kg h−1) and the highest emission rates around 9 facilities in the gulf (457 kg h−1), with a factor of 19 difference. Our average emission estimate in the southern North Sea is 136 kg h−1 and compares well with the average absolute emission rate in a regional mass balance in the gulf with a larger sample size (117 kg h−1). When excluding the multi-platform complex P4, the southern North Sea average emission estimate amounts to 23 kg h−1, which compares well with the average emission rate in the Norwegian Sea, where no multi-platform complex was sampled.
In contrast to the southern North Sea, where gas (with little gas condensate) production dominates, in the northern Gulf of Mexico natural gas is produced as a side product from oil exploitation (associated gas), and in the Norwegian Sea both oil production and gas production take place. The natural gas production rates for the facilities in the southern North Sea shown in the second column in Fig. 4 are on average 1 order of magnitude smaller than in the Norwegian Sea, 1 order of magnitude higher than in the gulf's regional estimate, but almost the same value as the gulf's facility-wise estimate. Average oil production rates in the Norwegian Sea and in the northern Gulf of Mexico are comparable.
Total loss rates, i.e. all gas lost to the atmosphere divided by the total production rates in the respective region, can be determined either from gas production only or from the sum of oil and gas production. There, we convert oil and gas production rate units according to the energy content. Considering only gas production, the total loss rate in the southern North Sea (0.54 % (0 %–3.1 %)) is 1 order of magnitude higher than in the Norwegian Sea (0.02 % (0.003 %–1.6 %)) and 1 order of magnitude smaller than in the gulf. The latter amounts to 1.9 % (0.04 %–128 %) for the facility-level measurements and 3.7 % for the regional measurements. Including oil production, the total loss rates in the Norwegian Sea (0.01 % (0.001 %–0.2 %)) and in the gulf (0.51 % (0.01 %–112 %) for the facility study; 1.1 % for the regional study) are reduced. Thus, the total loss rates in the southern North Sea and in the northern Gulf of Mexico compare to each other when including oil production, and the total loss rates in the Norwegian Sea are still 1 order of magnitude smaller compared with the other regions but span over 3 orders of magnitude.
We report CH4 flux estimates for six UK and five Dutch offshore gas production installations in the southern North Sea derived from airborne measurements conducted in spring 2019. We identified the observed CH4 enhancements as emissions arising from natural gas based on co-emitted C2H6 and derive C2H6-to-CH4 ratios for each offshore installation. Comparison with a ship-based top-down study conducted around Dutch facilities in 2018 (Hensen et al., 2019) shows that our derived CH4 fluxes deviate by factors of 0.23–0.57 smaller with respect to fluxes derived by Hensen et al. (2019). Our CH4 flux estimates were compared with different bottom-up inventories available for this region, including the Global Fuel Exploitation Inventory (GFEI) (Scarpelli et al., 2019), the UK Environmental and Emissions Monitoring System database (EEMS), the UK National Atmospheric Emissions Inventory (NAEI), and direct facility-level reporting by Dutch operators. In general, the comparison for individual facilities shows a large discrepancy between the top-down derived emissions and all bottom-up (inventory and reported) estimates, which may be expected because of the nature of single snapshot measurements per facility in this study and potential temporal variability per facility demonstrated via repeat measurements by Foulds et al. (2022). The largest discrepancy exists with the annual emission data from the globally gridded GFEI for the year 2019, showing that measured aggregated emissions from the UK and Dutch sites are higher by factors of ∼ 21 and ∼ 279, respectively. On the one hand, these high-discrepancy factors reflect the weaknesses in using global inventories based on Tier-1 methods for field-specific emission characterizations, especially when compared with snapshot measurements. On the other hand, Dutch UNFCCC-reported emissions, which the inventory is based on, are much smaller compared with UK UNFCCC reporting and could give rise to the exceptionally large factor for the Dutch sites. Our top-down emission fluxes for all the sampled UK installations on aggregate deviate from UK national annualized emission data from NAEI and EEMS for the year 2018 by factors of 6 and 12, respectively. NAEI data, which are based on EEMS operator-based reporting, are equal to or higher than EEMS, except for one out of the six installations. The latest UK national inventory data available for 2019 from EEMS deviate slightly less from the measurements, with the latter being a factor of 11 higher for all sampled UK facilities on aggregate. According to the EEMS inventory, CO2 emissions measured around UK facilities and correlating with CH4 emissions are solely attributable to combustion sources (turbines, engines), while flaring emissions are reported as zero for both CO2 and CH4. The measurements in this study cannot differentiate flaring from other combustive sources and thus rule out flaring. Still, the measured ratios of emitted CH4 to CO2 point to existing venting or fugitive CH4 sources, where flaring sources could be contributing.
As expected, the best agreement with our flux estimates exists with facility-level reporting from the Dutch operators for the specific survey date. The measurements deviate by a factor of 0.64 (0.33–12) and are smaller with respect to the Dutch-reported emissions for all the sampled facilities on aggregate. Our results for operator-based facility-level reporting compare very well with a study conducted in the Norwegian Sea by Foulds et al. (2022), which finds their measurements deviating by a factor of 0.8 and being smaller compared to the reporting by operators. We conclude that, for sites with operator-based facility-level reporting in Dutch waters – as suggested in the reporting framework Oil and Gas Methane Partnership 2.0 (https://www.ogmpartnership.com, last access: 20 September 2023) –, the highest accuracy is demonstrated compared with the measurements. The adoption of facility-level estimation in national inventories would be expected to increase the accuracy of national CH4 emissions accounting for the offshore oil and gas sector. To improve comparisons of top-down and bottom-up observation and resolve discrepancies, generating bottom-up inventories at facility scale and accounting for temporal variability when including top-down measurements would be extremely valuable.
A regional comparison to airborne studies in the Norwegian Sea (Foulds et al., 2022) and in the northern Gulf of Mexico (Gorchov Negron et al., 2020) shows that the absolute facility-level emission rates agree with the general distribution found in other offshore basins. This is despite differing gas production rates, which span 2 orders of magnitudes across geographies. Including oil production rates, total loss rates of the southern North Sea compare to total loss rates in the gulf, whereas loss rates in the Norwegian Sea are 1 order of magnitude smaller. As a consequence of the similar absolute emission rates, mitigation is needed virtually equally across geographies. Further, average absolute emission rates in this study are substantially larger in the UK compared to NL, which is largely driven by one super-emitter in the UK. The emission of the super-emitter is as high as the emissions measured around similar infrastructure types (multi-platform complexes in shallow water) in the study in the northern Gulf of Mexico, but additional sampling in future studies is needed to investigate representativeness.
In the following, the CH4 flux calculation is illustrated by using observations of platform P1 on 30 April 2019.
Measurements were performed downwind at a distance of around 3–4 km from the platform (wind direction (179.5 ± 29.8)∘; perpendicular wind speed (3.2 ± 1.5) m s−1). To fully capture the emitted CH4 plume dispersed within the boundary layer, which extended up to (420 ± 20) m, vertically stacked transects were flown between 97 and 305 m. Figure A1 shows the downwind horizontal transects with CH4 mole fractions colour-coded in panel a and the corresponding time series in panel b. CH4 enhancements were detected in all seven transects. We calculated CH4 fluxes for each transect resulting in a total flux of (86.5 ± 41.2) kg h−1. The uncertainty is given for confidence intervals of 1 standard deviation and arises mainly due to wind measurements. CO2 fluxes are calculated using the slope of the linear regression between co-emitted CO2 and CH4 for the respective peaks. Figure A2a shows the scatterplot for CO2 and CH4 for platform P1, where enhanced CO2 was found for two peaks at altitudes above 240 m. The observation of co-emitted CO2 points to a buoyant plume adding up to the CH4 plume at altitudes above 240 m. Figure A2b shows the time series of measured CH4 and C2H6 for the transect at 250 m altitude downwind of P1 to illustrate the calculation of the C2H6-to-CH4 (C2 : C1) ratio. The peak areas for C2H6 and CH4 enhancements over the background are shown in yellow. The C2 : C1 ratio is calculated by dividing the integrated peak area of C2H6 by the integrated peak area of CH4, which results in a C2 : C1 ratio of 4.3 % in this case.
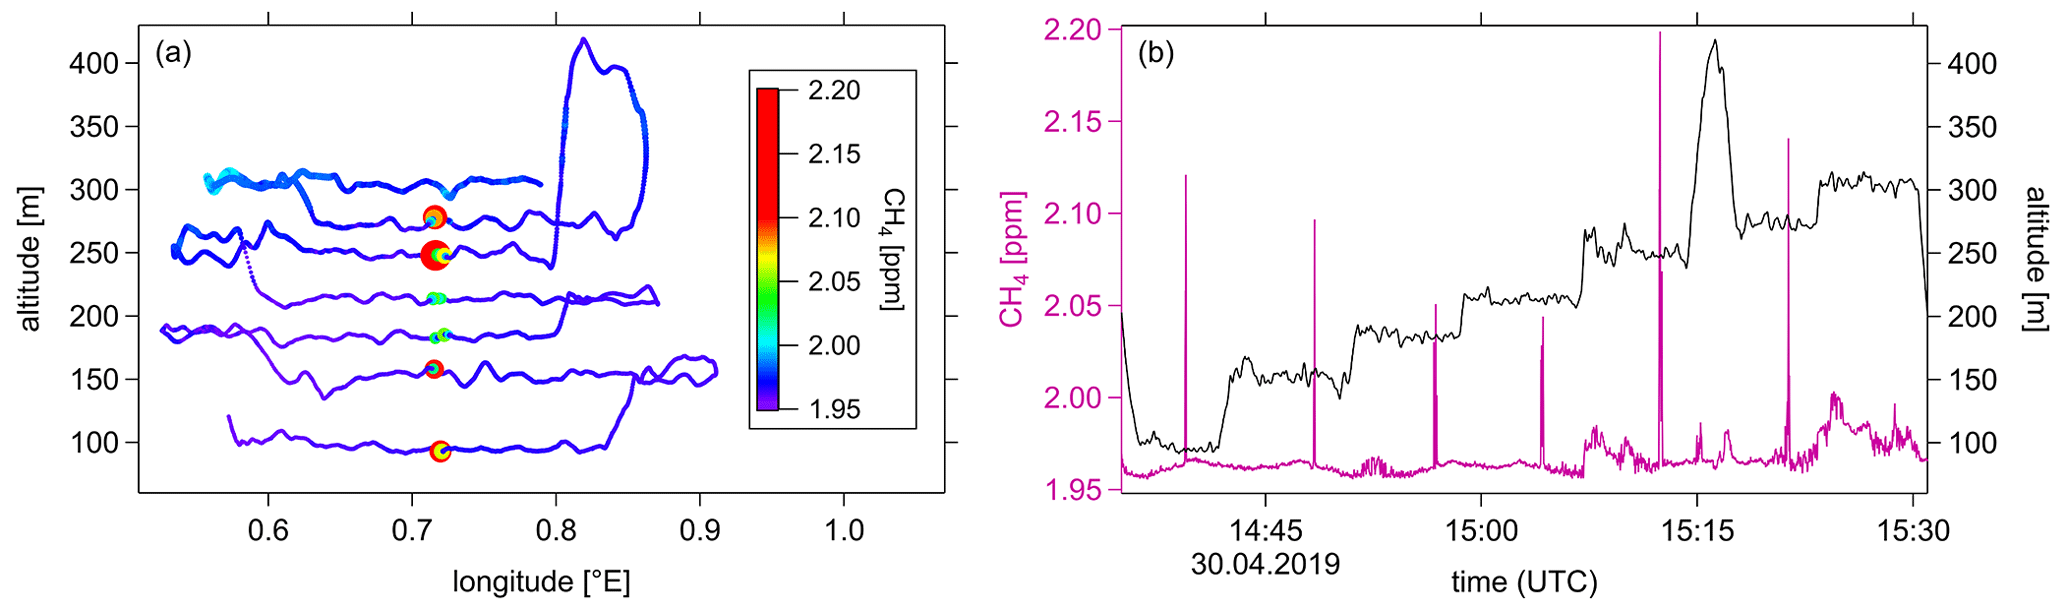
Figure A1Example of measurements downwind of platform P1 during the offshore flight on 30 April 2019: (a) horizontal transects at altitudes between 94 and 304 m a.s.l. CH4 enhancements are elucidated with a colour scale, where the sizes of the plotted symbols are scaled to CH4 mole fractions. (b) The corresponding CH4 time series.
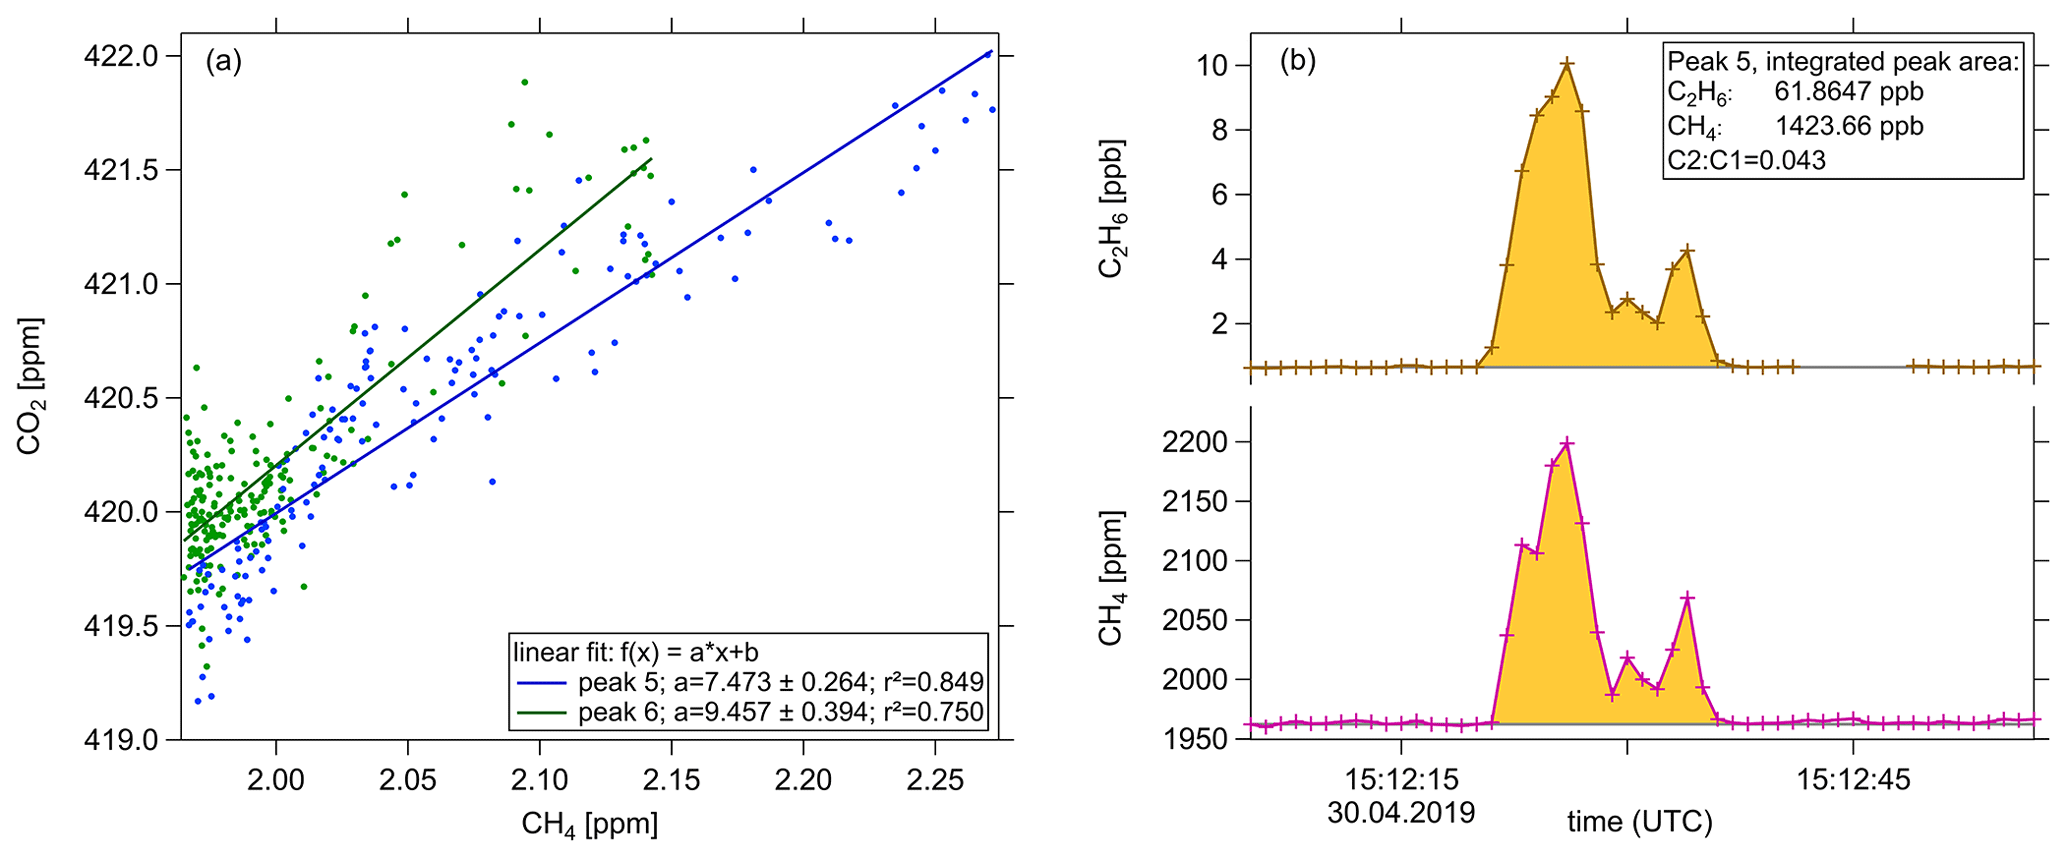
Figure A2(a) Scatterplot for co-emitted CO2 downwind of platform P1. Enhanced CO2 was found for two peaks at altitudes above 240 m. (b) Time series (1 Hz) of the transect at 250 m altitude downwind of P1 (peak 5): coinciding elevations in C2H6 (brown) and CH4 (magenta) mole fractions. The C2H6-to-CH4 (C2 : C1) ratio is calculated from the fraction of the integrated peak areas (yellow) over the background mole fractions (grey) and over the time span of the peak (18 s).
We use the Gaussian error propagation to determine the uncertainty of the flux calculation, represented as confidence intervals of 1 standard deviation (see Eq. 1 in Sect. 2.2). The uncertainties of the calculated CH4 fluxes for each layer i result from the uncertainties of each measured parameter q (Eq. B1). These parameters are the elevated CH4 mole fractions ΔCi, wind speed V⊥, pressure pi, temperature Ti, plume width Δxi, and plume height Di. The total uncertainty is the sum of the uncertainties of the fluxes calculated for each transect (Eq. B2).
The beginning of the plume is defined as a measured concentration enhancement that is higher than 2 standard deviations of the background mole fractions. For ΔCi the CH4 mole fractions measured inside (Ci) and outside (C0) the plume are used. Both Ci and C0 have a systematic uncertainty resulting from the Picarro instrument uncertainty of 1.2 ppb (France et al., 2021). The background mole fraction at each point j within the plume is determined from an interpolation between C0,a and C0,b, which are the mean CH4 mole fractions within 30 s before and after the plume. The uncertainty of the interpolated background at each point u(ΔC0,j) is calculated from the standard deviations σ0,a and σ0,b of C0,a and C0,b (Eq. B4). The parameter n denotes the number of points within the plume.
We determine the perpendicular wind speed from the average aircraft heading, measured average horizontal wind speed, and average wind angle over all the transects. The uncertainty of the perpendicular wind speed u(V⊥) is a result of the standard deviations and is valid for all the transects.
For the uncertainties of pressure u(pi) and temperature u(Ti), the standard deviations of the mean values across the plume and the 30 s background are taken.
The plume width is determined by the distance the aircraft covered while crossing the plume. Thereby, the velocity of the aircraft is multiplied with the time span of the plume. The uncertainty of the plume width u(xi) is derived from the uncertainty (standard deviation) of the measured velocity of the aircraft.
Since we assume a well-mixed plume within the boundary layer, the uncertainty of plume height u(Di) is characterized by the uncertainty arising from the estimation of the boundary layer height. Therefore, u(Di) is only relevant for the uncertainty of the flux calculated for the uppermost layer.
The uncertainty of the wind measurement is the biggest contributor to the total uncertainty of the flux calculation (typically 90 %). Uncertainties of wind speed and wind direction measurements range from 1 to 3 m s−1 (23 %–70 % relative uncertainty at 1σ) and from 8 to 39∘ (2 %–19 % relative uncertainty at 1σ), respectively. The uncertainty of plume height ranges from 20 to 32 m and accounts for less than 10 % of the total uncertainty of the flux calculated for the uppermost layer.
The model study concludes that 9 out of the 19 platforms of the complex could have contributed to the measured CH4 enhancement (the flight track with colour-coded CH4 in Fig. C1). None of the possible emitters is listed in the inventories as a single platform.
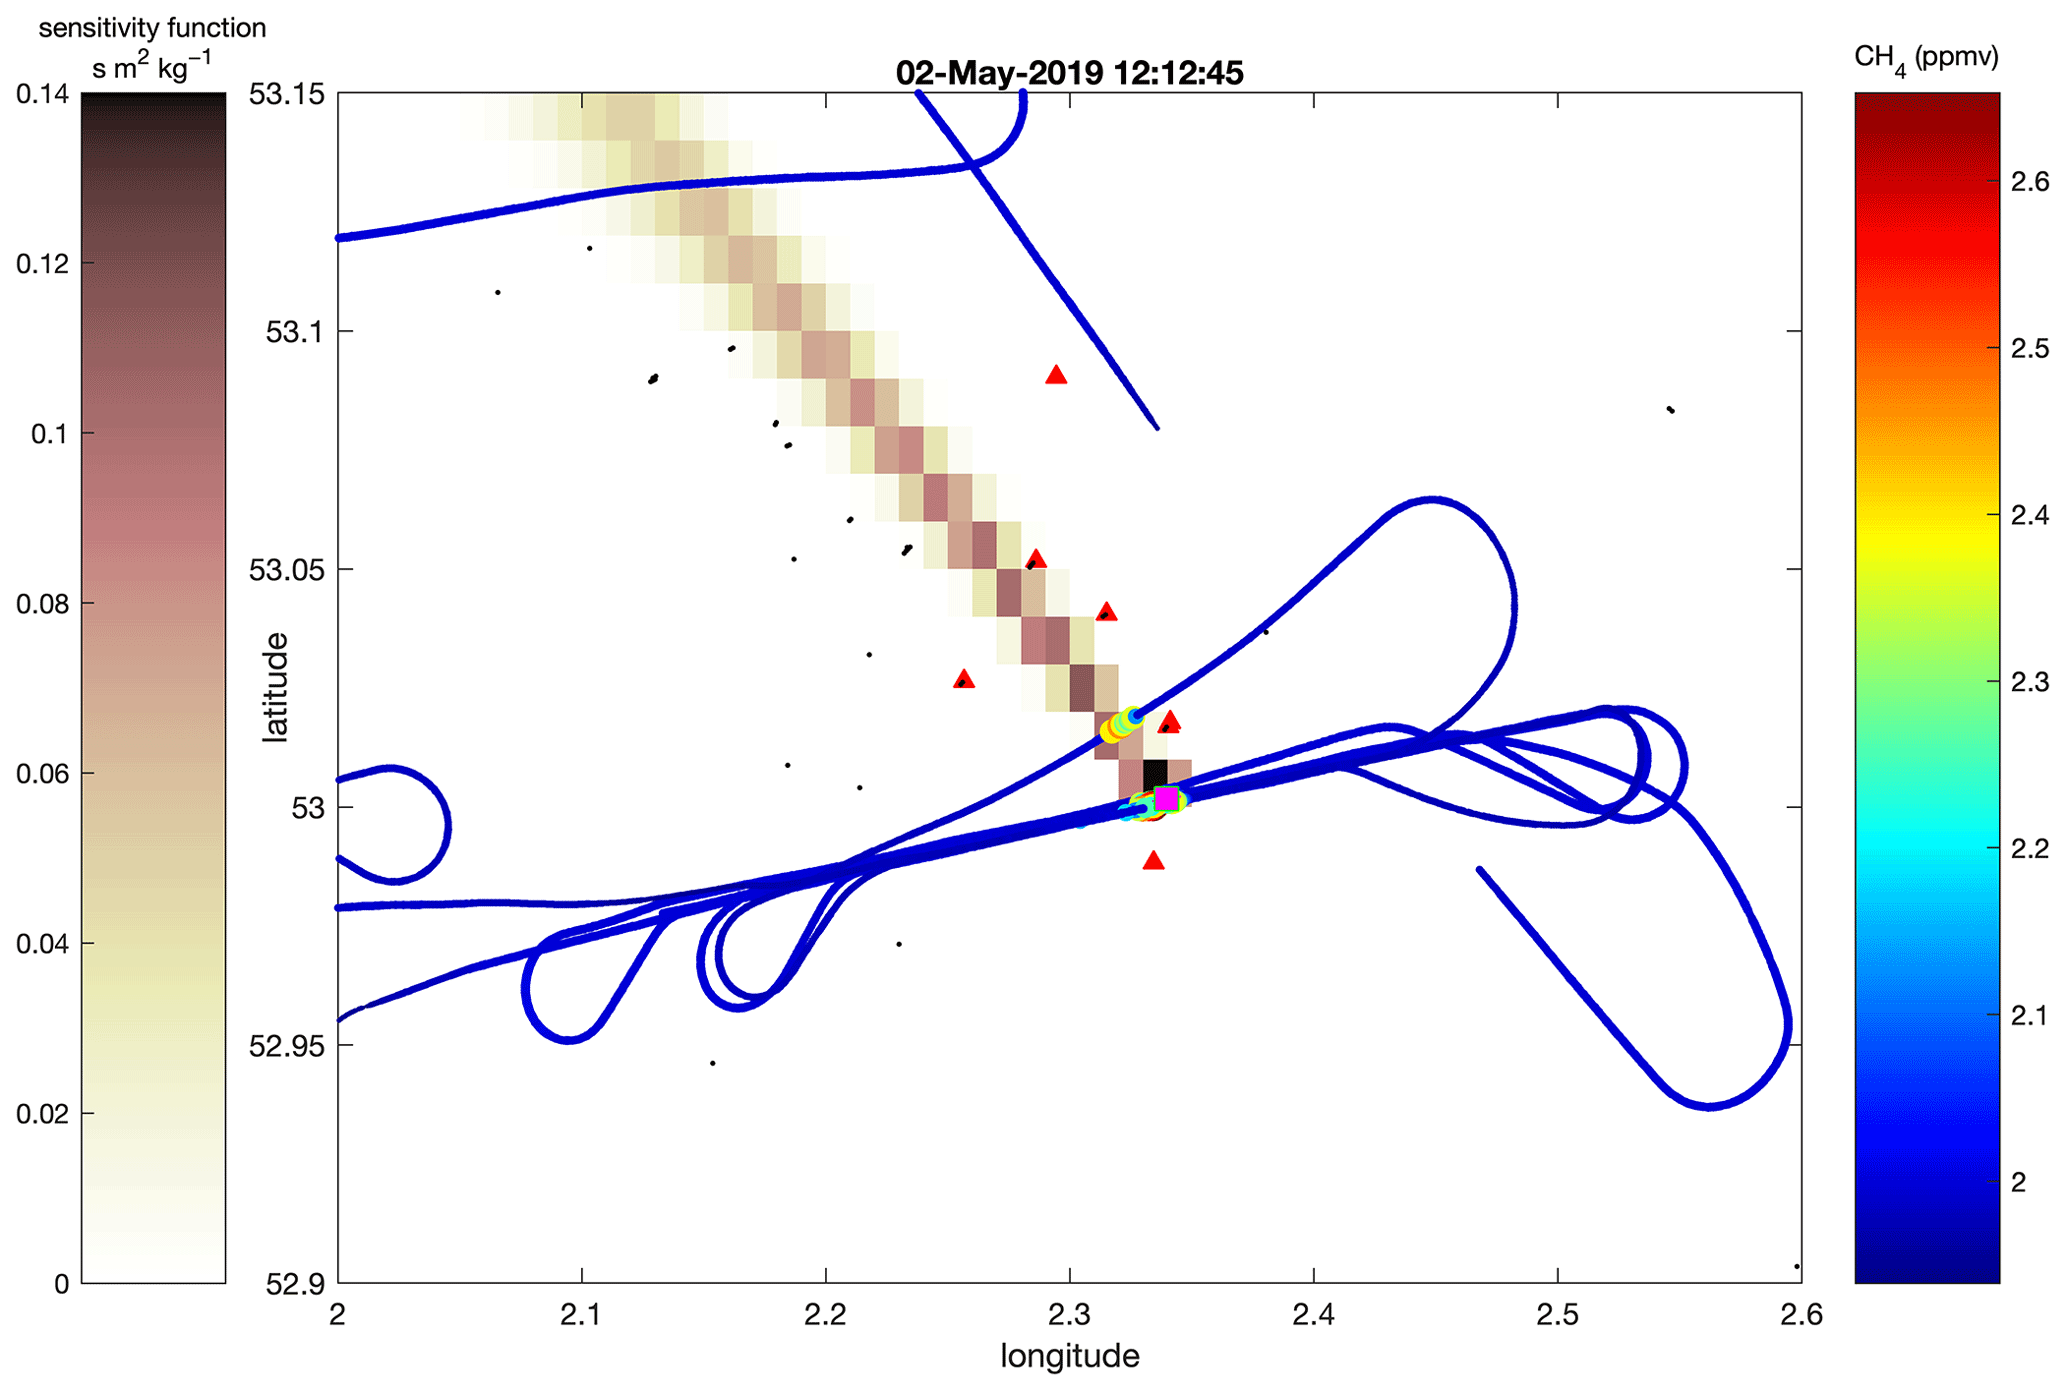
Figure C1Footprint analysis for the multi-platform complex P4 (backward simulation) sampled during flight 327. The flight track is shown with colour-coded CH4 in units of parts per million. The particle density is shown with a brownish scale. Black markers symbolize the installations in the area and red markers show all the installations which could have contributed to the measured plume.
Table D1Measured and reported (OGA, NLOG) C2H6-to-CH4 ratios for all the sampled platforms at 2σ. All installations for which CH4 was enhanced were accompanied by co-emitted C2H6. No detected C2H6 and CO2 enhancements are indicated with < LoD. Measured CO2 emissions are compared to UK inventory data (NAEI, EEMS) and Dutch operator data. Information on emission processes is given for venting (vent), fugitives (fug), and flaring (flar). CO2 emissions are rounded to two significant digits. NA stands for not available and n/a stands for not applicable.
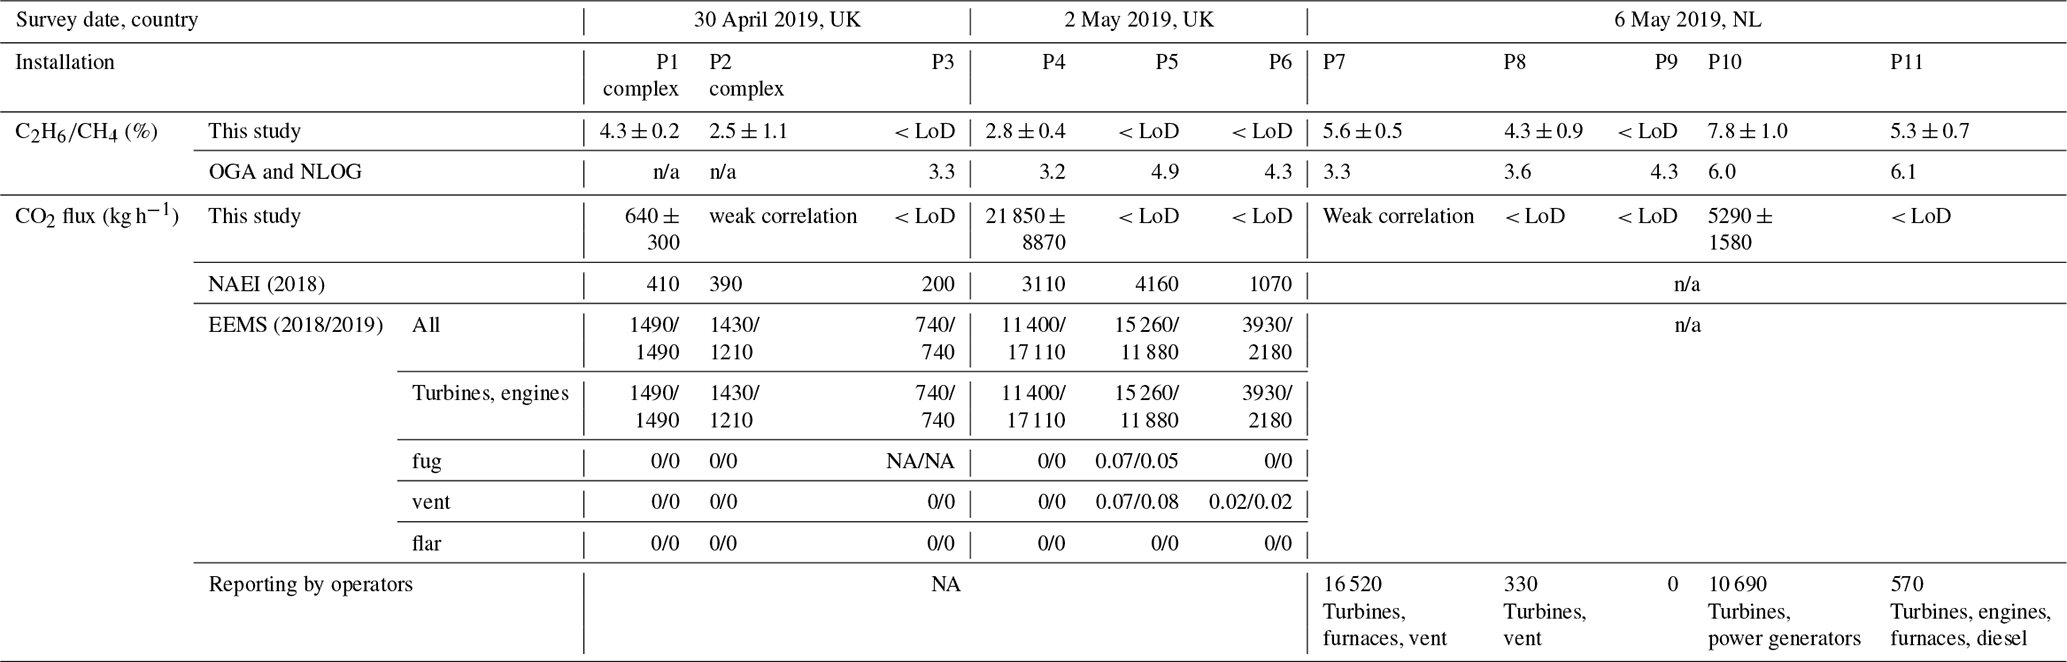
Figure E1 shows gas lost to the atmosphere, which is calculated from CH4 emission rates and the CH4 mol percentage (UK sites: OGA Shell/ExxonMobil Geochemistry Database for Central North Sea (OGA, 2017); NL sites: operator data). The determined loss rates are the ratio of gas loss and dry gas production, i.e. normalized CH4 emissions against natural gas production rates.
Table E1 shows platform production rates along with calculated loss rates. No loss rates were determined for installations, where emissions were below the detection limit and thus no enhancements were measured (abbreviation “no enh.”). Z1–Z8 are non-emitting installations from fly-bys. Individual platform production data for 2019 were taken from the UK Oil and Gas Authority (OGA, 2019), the NLOG (2019) and operator-reported data. UK production rates are given as monthly values by OGA. Thereby, we include production from upstream fields with only subsea wells and no platform infrastructure. Dutch production data were provided by Dutch operators for the specific survey day.
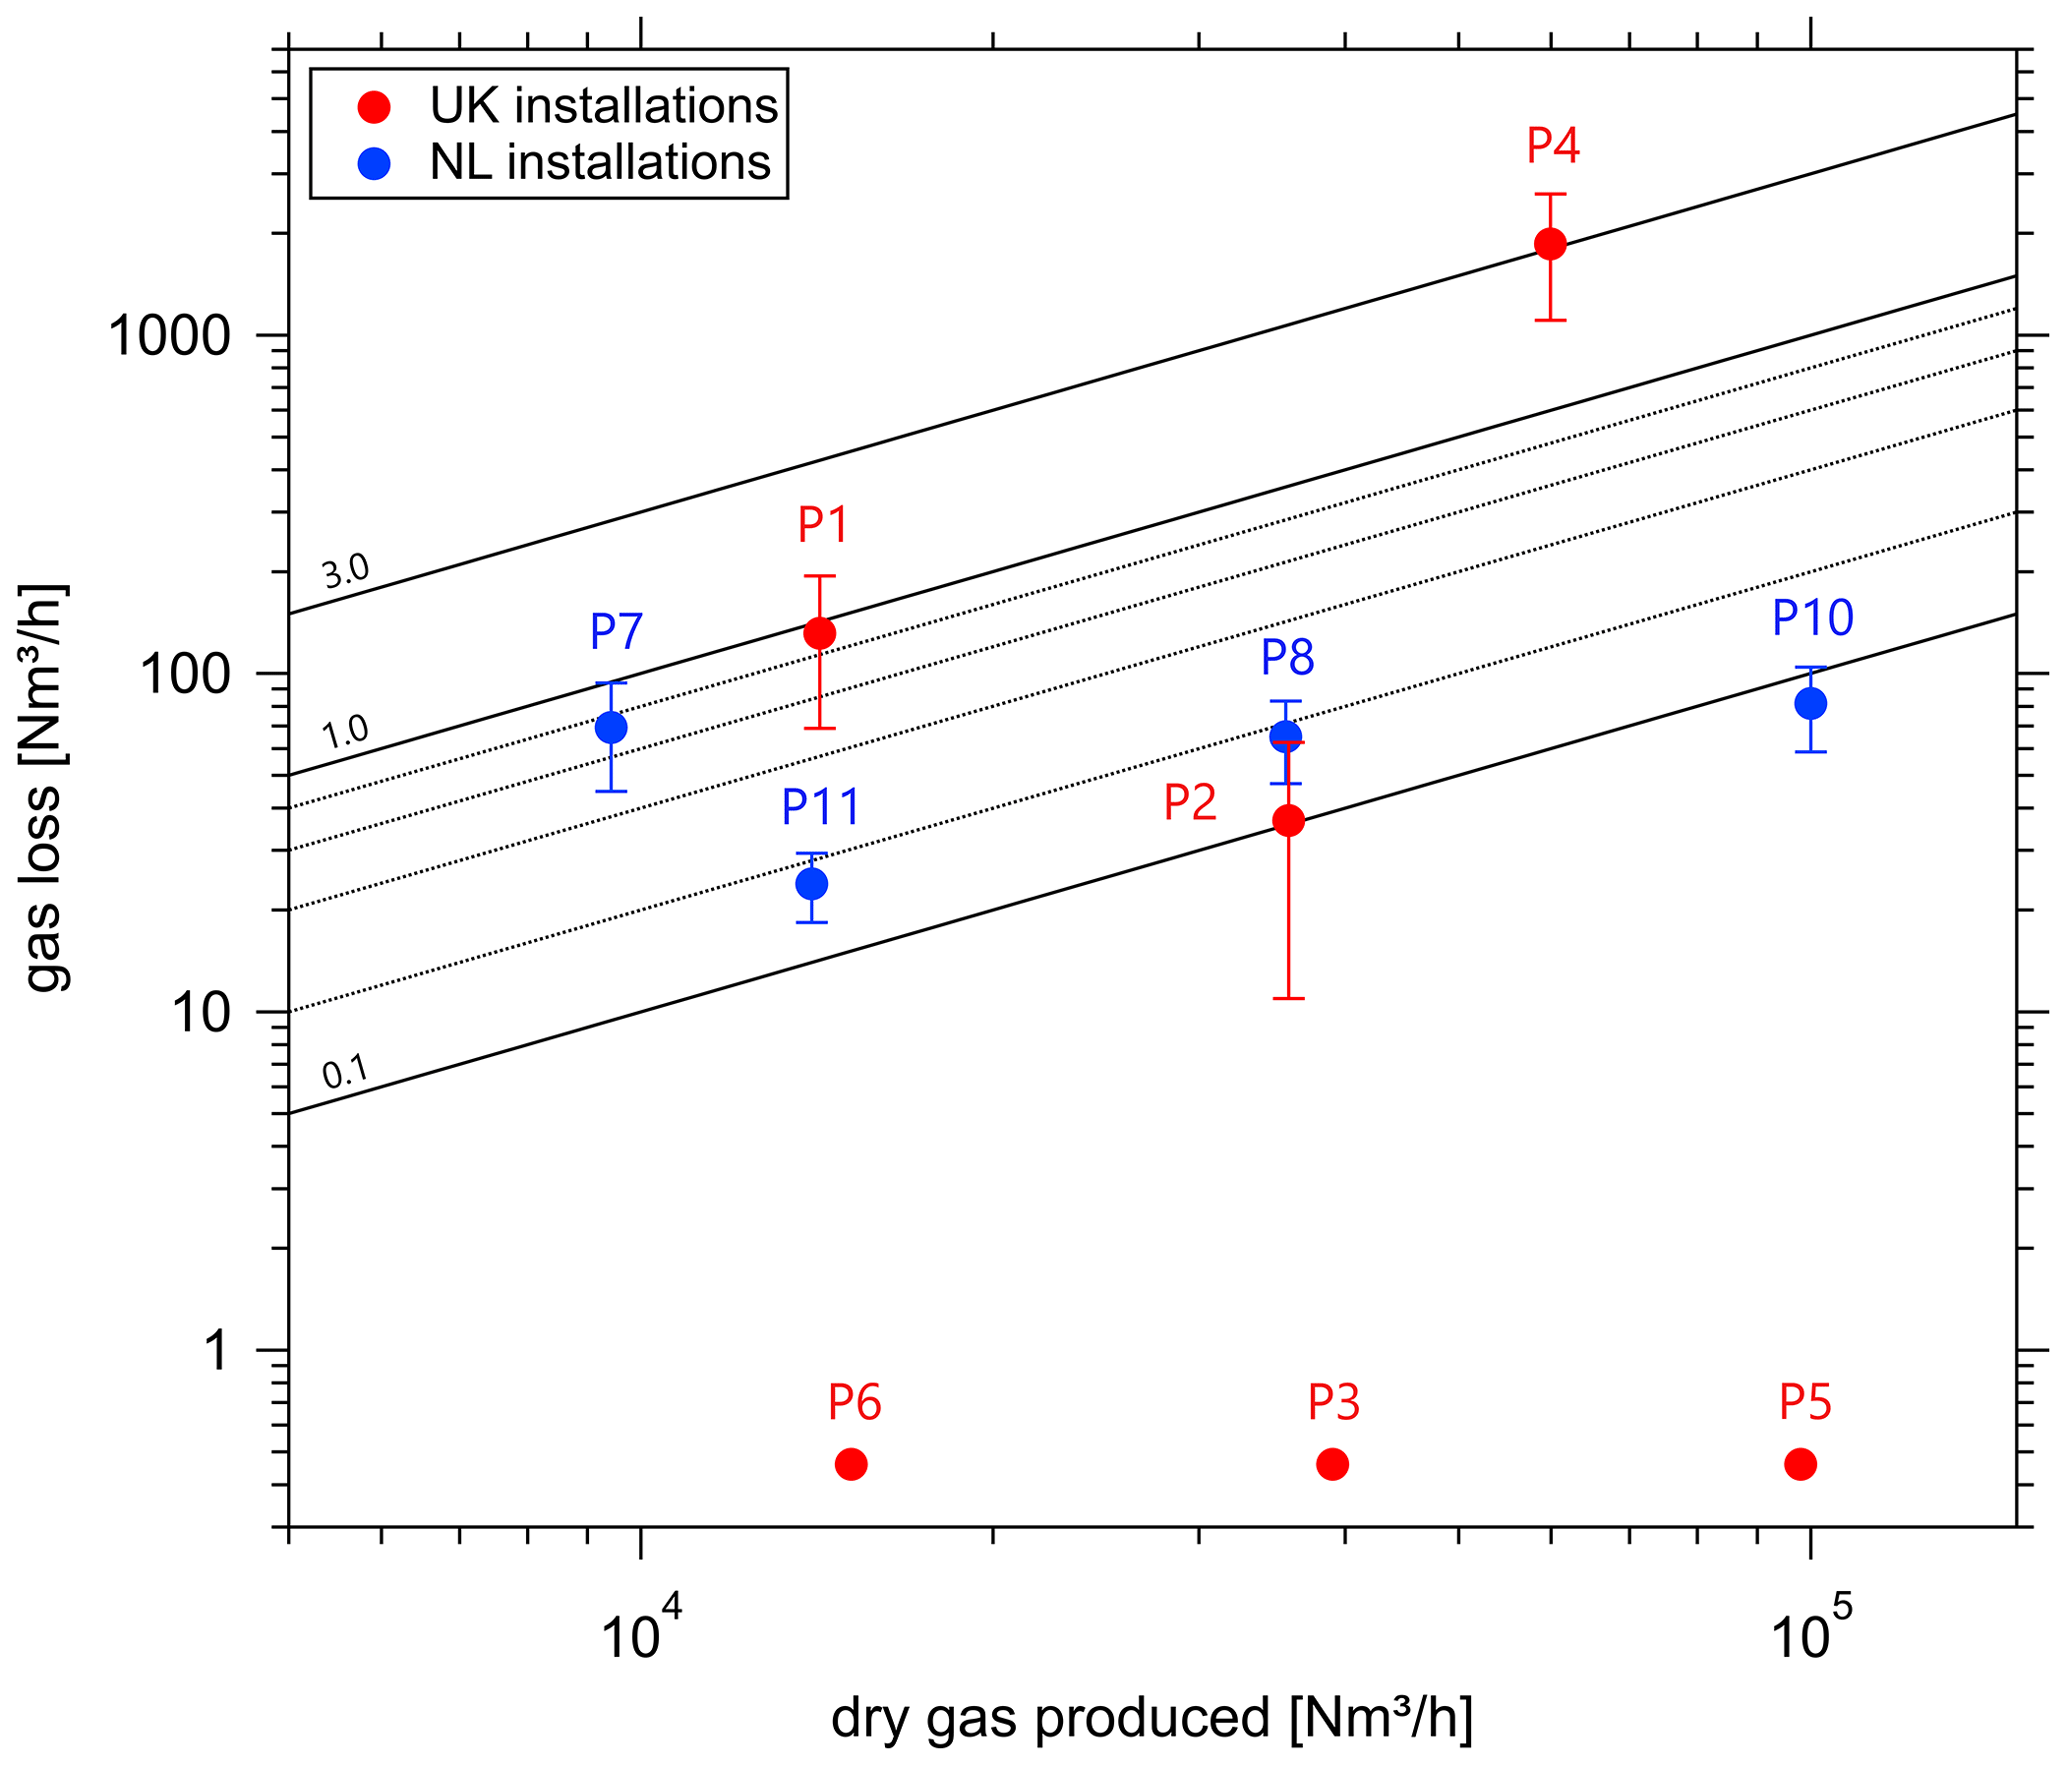
Figure E1Gas lost to the atmosphere against the amount of dry gas produced in norm cubic metres (Nm3) per hour (UK: OGA; NL: operator data). Dutch platforms are shown in blue and UK platforms in red. Note that no downwind enhancements were detected for four installations (P3, P5, P6, P9), with only P9 (NL installation, excluded) not producing. Lines of constant loss rates (%) are shown in black.
Table E1Reported production rates and calculated loss rates for the sampled UK (P1–P6) and Dutch (P7–P11) installations (OGA, 2019; NLOG, 2019). Z1–Z8 are (non-emitting) installations from fly-bys. NA stands for not available.
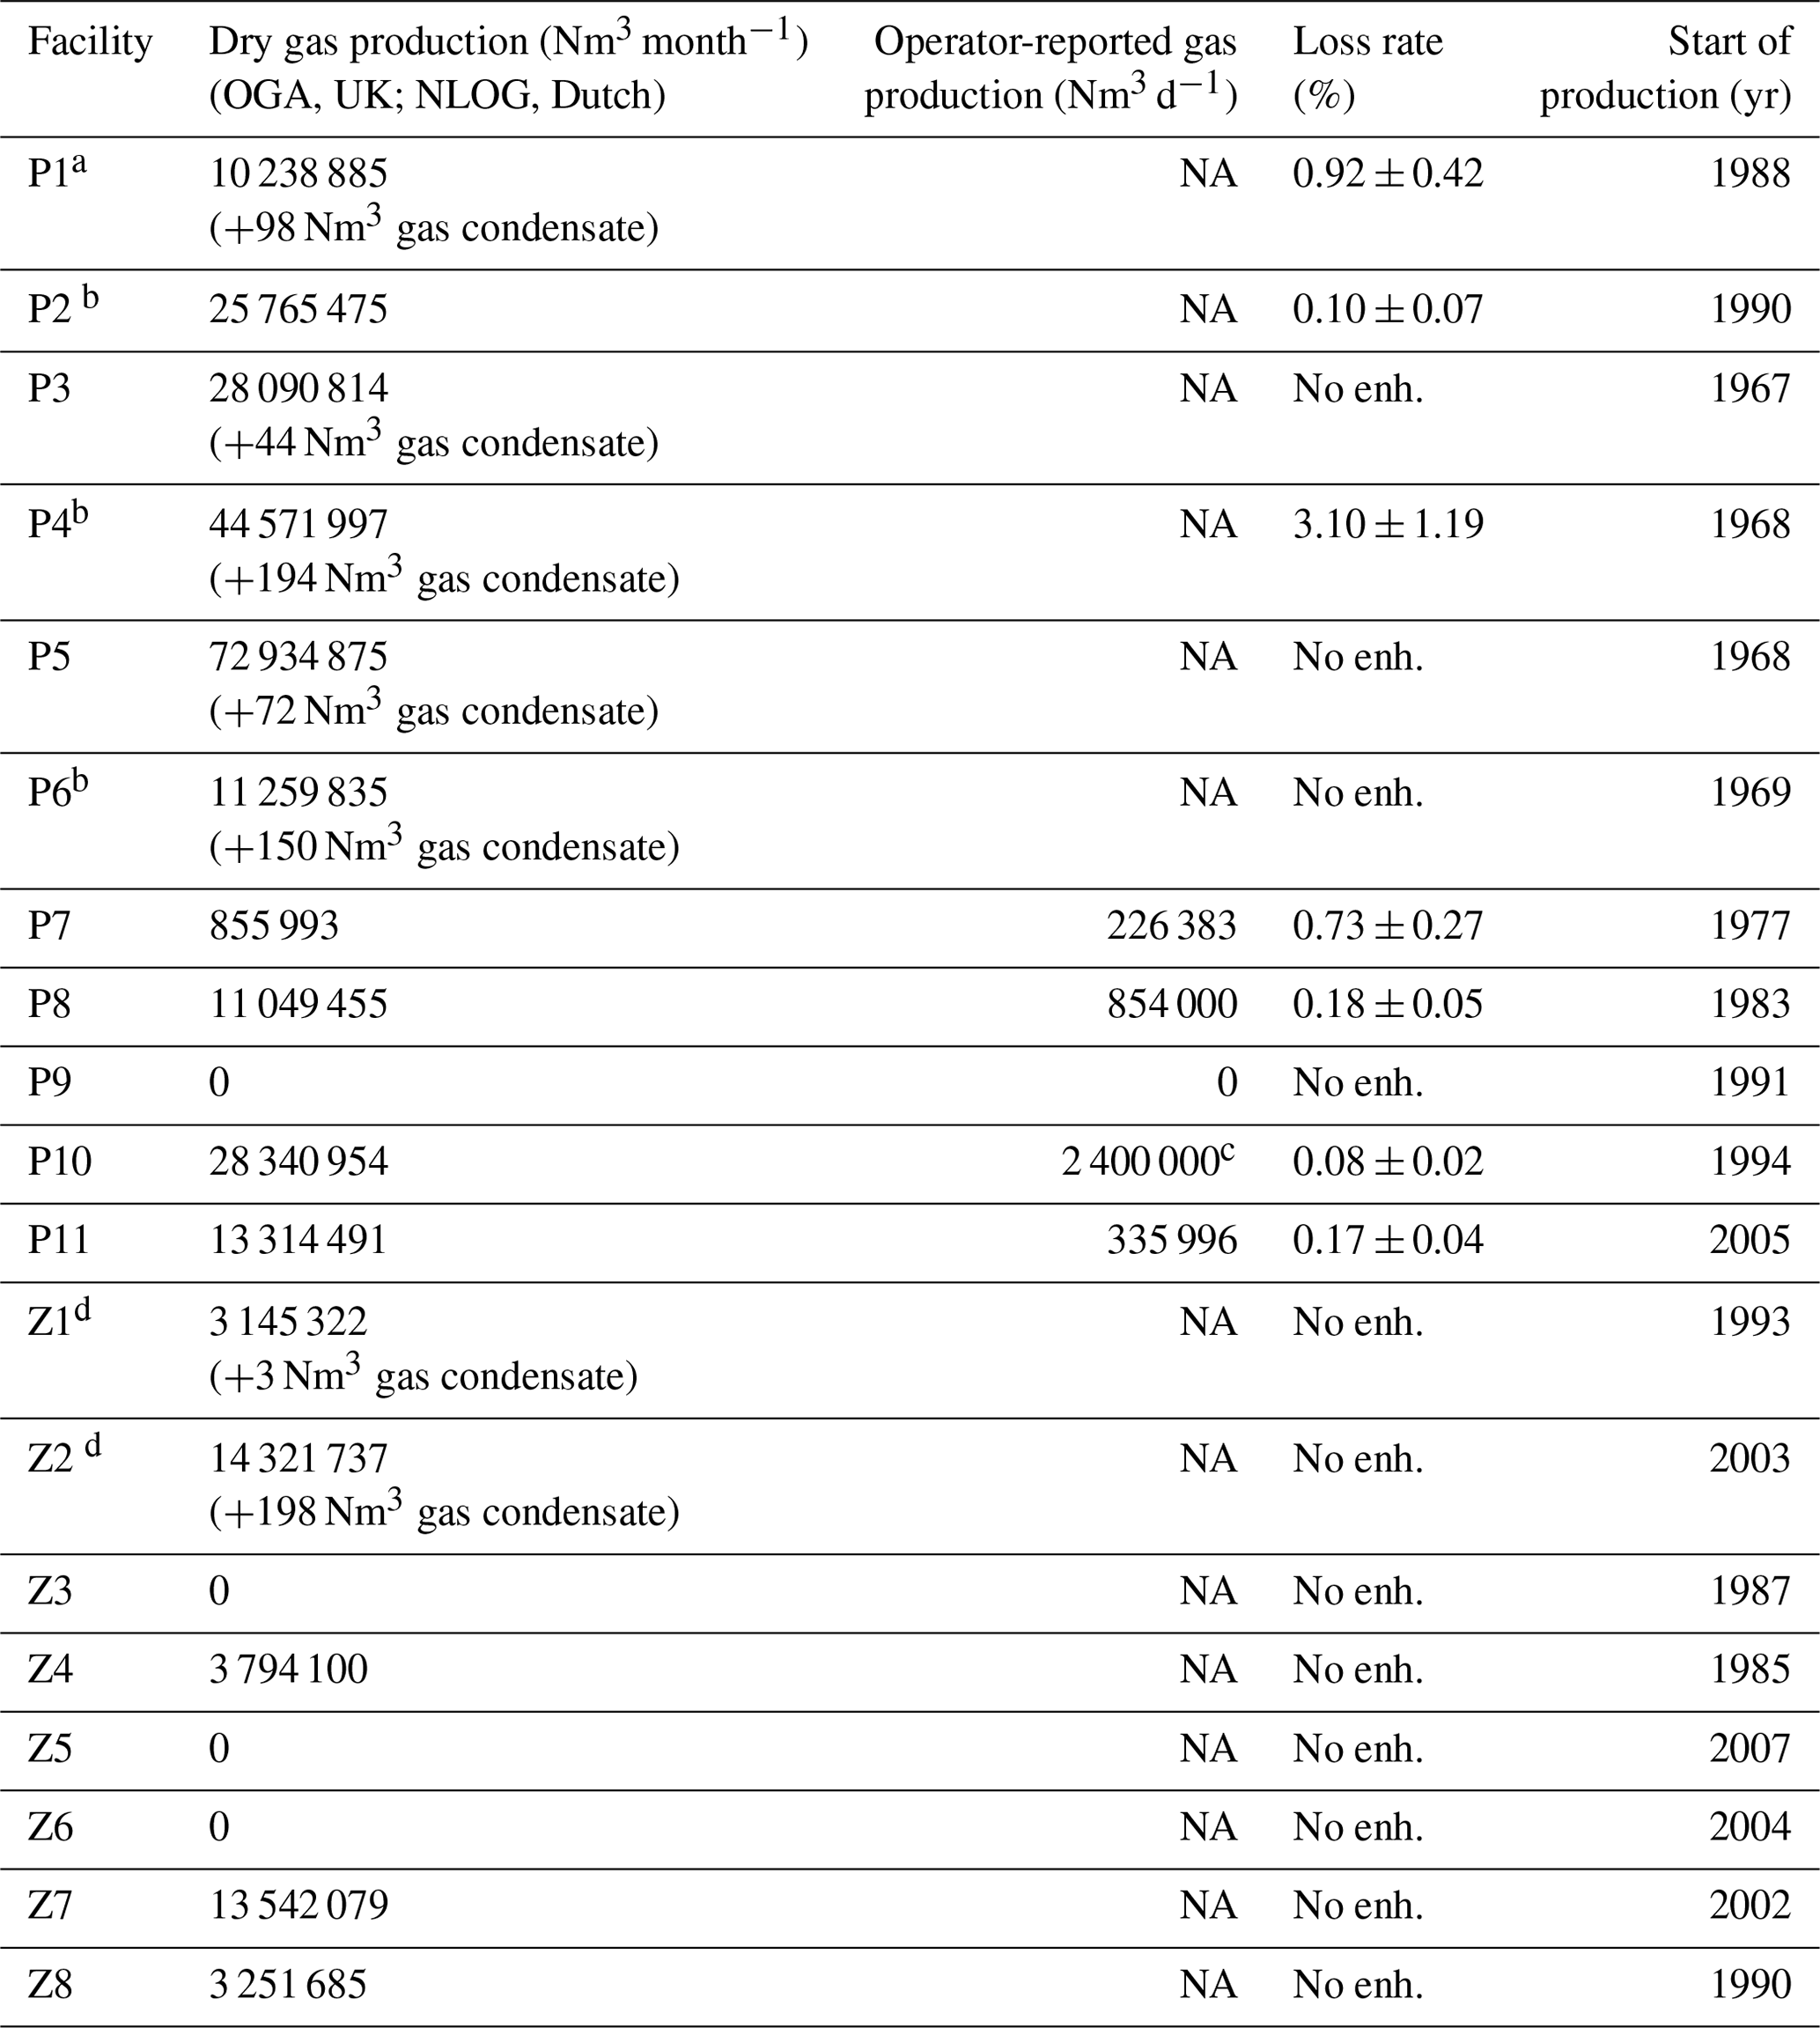
a Zero gas production for the month of the survey. Production only of delivering subsea wells. b Includes one delivering subsea well. c Gas production with little gas condensate (gas condensate is injected back into the export gas). d Uncrewed installation. NA stands for not applicable.
Access to the data will be provided via request from the British Antarctic Survey Polar Data Centre.
The paper was written and the figures were prepared by MP with contributions from AMGN. Modelling work was done by IP. All the authors contributed to the discussion. The experimental design and flight planning were performed by GA, JL, TLC, and DL. Aircraft set-up and in-flight measurements were performed by PB, PD, SA, SY, AW, TLC, and JLF. Laboratory measurements were made by REF, and data processing and calibrations were performed by JLF, LH, PB, JS, and PD.
The contact author has declared that none of the authors has any competing interests.
Publisher’s note: Copernicus Publications remains neutral with regard to jurisdictional claims made in the text, published maps, institutional affiliations, or any other geographical representation in this paper. While Copernicus Publications makes every effort to include appropriate place names, the final responsibility lies with the authors.
This work was funded by the Climate & Clean Air Coalition (CCAC) Oil and Gas Methane Science Studies (MSS) programme, which was hosted by the United Nations Environment Programme. Funding was provided by the Environmental Defense Fund (EDF), the Oil and Gas Climate Initiative, the European Commission, and the CCAC.
This research has been supported by the CCAC (grant no. DTIE18-EN018).
The article processing charges for this open-access publication were covered by the German Aerospace Center (DLR).
This paper was edited by Tim Butler and reviewed by Tim Butler and one anonymous referee.
Brown, P., Cardenas, L., Del Vento, S., Karagianni, E., MacCarthy, J., Mullen, P., Passant, N., Richmond, B., Thistlethwaite, G., Thomson, A., Wakeling, D., and Willis, D.: UK Greenhouse Gas Inventory 1990 to 2021: Annual Report for submission under the Framework Convention on Climate Change, Ricardo Energy & Environment for the Department for Business, Energy & Industrial Strategy (BEIS), ISBN 978-0-9933975-9-2, 2023.
Cain, M., Warwick N. J., Fisher, R. E., Lowry, D., Lanoisellé, M., Nisbet, E. G., France, J., Pitt, J., O`Shea, S., Bower, K. N., Allen, G., Illingworth, S., Manning, A. J., Bauguitte, S., Pisso, I., and Pyle, J. A.: A study of a methane enhancement over the North Sea, J. Geophys. Res.-Atmos., 122, 7630–7645, https://doi.org/10.1002/2017JD026626, 2017.
Chen, Z., Yacovitch, T. I., Daube, C., Herndon, S. C., Wilson, D., Enoch, S., and Allen, D. T.: Reconciling methane emission measurements for offshore oil and gas platforms with detailed emission inventories: Accounting for emission intermittency, ChemRxiv, Cambridge: Cambridge Open Engage, Preprint, https://doi.org/10.26434/chemrxiv-2022-dfjvv, 2022.
Conley, S., Franco, G., Faloona, I., Blake, D. R., Peischl, J., and Ryerson, T. B.: Methane emissions from the 2015 Aliso Canyon blowout in Los Angeles, CA, Science, 351, 1317–1320, https://doi.org/10.1126/science.aaf2348, 2016.
European Commission, United States of America: Global Methane Pledge, Climate & Clean Air Coalition (CCAC), https://www.ccacoalition.org/en/resources/global-methane-pledge (last access: 30 November 2022), 2021.
Elvidge, C. D., Zhizhin, M., Hsu, F.-C., Baugh, and K. E.: VIIRS Nightfire: Satellite Pyrometry at Night, Remote Sens., 5, 4423–4449, https://doi.org/10.3390/rs5094423, 2013.
Elvidge, C. D., Zhizhin, M., Baugh, K., Hsu, F.-C., and Ghosh, T.: Methods for Global Survey of Natural Gas Flaring from Visible Infrared Imaging Radiometer Suite Data, Energies, 9, 14, https://doi.org/10.3390/en9010014, 2015.
European Commission: EU strategy to reduce methane emissions, https://energy.ec.europa.eu/documents_en?f\,%5B0\,%5D=document_title%3AEU%20methane%20strategy (last access: 30 November 2022), 2020.
European Commission: Energy, transport and environment statistics – 2020 edition: Energy Production 2018, Publications Office of the European Union, p. 11, https://doi.org/10.2785/522192, 2020.
Eurostat – European Union: Energy, transport and environment statistics – 2020 edition: Energy Production 2018, Publications Office of the European Union, p. 11, https://doi.org/10.2785/522192, 2020.
Foulds, A., Allen, G., Shaw, J. T., Bateson, P., Barker, P. A., Huang, L., Pitt, J. R., Lee, J. D., Wilde, S. E., Dominutti, P., Purvis, R. M., Lowry, D., France, J. L., Fisher, R. E., Fiehn, A., Pühl, M., Bauguitte, S. J. B., Conley, S. A., Smith, M. L., Lachlan-Cope, T., Pisso, I., and Schwietzke, S.: Quantification and assessment of methane emissions from offshore oil and gas facilities on the Norwegian continental shelf, Atmos. Chem. Phys., 22, 4303–4322, https://doi.org/10.5194/acp-22-4303-2022, 2022.
Forster, P., Storelvmo, T., Armour, K., Collins, W., Dufresne, J.-L., Frame, D., Lunt, D. J., Mauritsen, T., Palmer, M. D., Watanabe, M., Wild, M., and Zhang, H.: The Earth's Energy Budget, Climate Feedbacks, and Climate Sensitivity, in: Climate Change 2021: The Physical Science Basis, Contribution of Working Group I to the Sixth Assessment Report of the Intergovernmental Panel on Climate Change, edited by: Masson-Delmotte, V., Zhai, P., Pirani, A., Connors, S. L., Péan, C., Berger, S., Caud, N., Chen, Y., Goldfarb, L., Gomis, M. I., Huang, M., Leitzell, K., Lonnoy, E., Matthews, J. B. R., Maycock, T. K., Waterfield, T., Yelekçi, O., Yu, R., and Zhou, B., Cambridge University Press, Cambridge, United Kingdom and New York, NY, USA, 923–1054, https://doi.org/10.1017/9781009157896.009, 2021.
France, J. L., Bateson, P., Dominutti, P., Allen, G., Andrews, S., Bauguitte, S., Coleman, M., Lachlan-Cope, T., Fisher, R. E., Huang, L., Jones, A. E., Lee, J., Lowry, D., Pitt, J., Purvis, R., Pyle, J., Shaw, J., Warwick, N., Weiss, A., Wilde, S., Witherstone, J., and Young, S.: Facility level measurement of offshore oil and gas installations from a medium-sized airborne platform: method development for quantification and source identification of methane emissions, Atmos. Meas. Tech., 14, 71–88, https://doi.org/10.5194/amt-14-71-2021, 2021.
Garman, K. E., Hill, K. A., Wyss, P., Carlsen, M., Zimmerman, J. R., Stirm, B. H., Carney, T. Q., Santini, R., and Shepson, P. B.: An Airborne and Wind Tunnel Evaluation of a Wind Turbulence Measurement System for Aircraft-Based Flux Measurements, J. Atmos. Ocean. Tech., 23, 1696–1708, https://doi.org/10.1175/JTECH1940.1, 2006.
Gorchov Negron, A. M., Kort, E. A., Conley, S. A., and Smith, M. L.: Airborne Assessment of Methane Emissions from Offshore Platforms in the US Gulf of Mexico, Environ. Sci. Technol., 54, 5112–5120, https://doi.org/10.1021/acs.est.0c00179, 2020.
Hausmann, P., Sussmann, R., and Smale, D.: Contribution of oil and natural gas production to renewed increase in atmospheric methane (2007–2014): top–down estimate from ethane and methane column observations, Atmos. Chem. Phys., 16, 3227–3244, https://doi.org/10.5194/acp-16-3227-2016, 2016.
Hensen, A., Velzeboer, I., Frumau, K. F. A., van den Bulk, W. C. M., and van Dinther, D.: Methane emission measurements of offshore oil and gas platforms, TNO Report 2019 R1089, National Institute for Public Health and the Environment, RIVM, http://resolver.tudelft.nl/uuid:a9c705b9-ec88-4316-827f-f9d7ffbd05c2 (last access: 30 November 2022), 2019.
Honig, E., Montfoort, J. A., Dröge, R., Guis, B., Baas, K., van Huet, B., and van Hunnik, O. R.: Methodology report on the calculation of emissions to air from the sectors Energy, Industry and Waste, RIVM report 2022-0001, National Institute for Public Health and the Environment, https://doi.org/10.21945/RIVM-2022-0001, 2022.
IPCC: Chapter 4: Fugitive Emissions, in: 2006 IPCC Guidelines for National Greenhouse Gas Inventories, Volume 2: Energy, The National Greenhouse Gas Inventories Program, edited by: Eggleston, H. S., Buendia, L., Miwa, K., Ngara, T., Tanabe, K., Institute for Global Environmental Strategies (IGES) for the IPCC, Hayama, Kanagawa, Japan, ISBN 4-88788-032-4, 2006.
Jones, V. T., Matthews, M. D., and Richers, D. M.: Light hydrocarbons for petroleum and gas prospecting, Geochemical Remote Sensing of the Subsurface, Handbook of Exploration Geochemistry, 7, 133–212, Elsevier, New York, https://doi.org/10.1016/S0168-6275(00)80029-X, 2000.
Klausner, T., Mertens, M., Huntrieser, H., Galkowski, M., Kuhlmann, G., Baumann, R., Fiehn, A., Jöckel, P., Pühl, M., and Roiger, A.: Urban greenhouse gas emissions from the Berlin area: A case study using airborne CO2 and CH4 in situ observations in summer 2018, Elem. Sci. Anth., 8, 15, https://doi.org/10.1525/elementa.411, 2020.
Lan, X., Thoning, K. W., and Dlugokencky, E. J.: Trends in globally-averaged CH4, N2O, and SF6 determined from NOAA Global Monitoring Laboratory measurements, Version 2022-11, https://doi.org/10.15138/P8XG-AA10, 2022.
Lee, J. D., Mobbs, S. D., Wellpott, A., Allen, G., Bauguitte, S. J.-B., Burton, R. R., Camilli, R., Coe, H., Fisher, R. E., France, J. L., Gallagher, M., Hopkins, J. R., Lanoiselle, M., Lewis, A. C., Lowry, D., Nisbet, E. G., Purvis, R. M., O'Shea, S., Pyle, J. A., and Ryerson, T. B.: Flow rate and source reservoir identification from airborne chemical sampling of the uncontrolled Elgin platform gas release, Atmos. Meas. Tech., 11, 1725–1739, https://doi.org/10.5194/amt-11-1725-2018, 2018.
Lowry, D., Fisher, R. E., France, J. L., Coleman, M., Lanoisellé, M., Zazzeri, G., Nisbet, E. G., Shaw, J. T., Allen, G., Pitt, J., and Ward, R. S.: Environmental baseline monitoring for shale gas development in the UK: Identification and geochemical characterisation of local source emissions of methane to atmosphere, Sci. Total Environ., 708, 134600, https://doi.org/10.1016/j.scitotenv.2019.134600, 2020.
Lyon, D. R., Zavala-Araiza, D., Alvarez, R. A., Harris, R., Palacios, V., Lan, X., Talbot, R., Lavoie, T., Shepson, P., Yacovitch, T. I., Herndon, S. C., Marchese, A. J., Zimmerle, D., Robinson, A. L., and Hamburg, S. P.: Constructing a Spatially Resolved Methane Emission Inventory for the Barnett Shale Region, Environ. Sci. Technol., 49, 8147–8157, https://doi.org/10.1021/es506359c, 2015.
MacKay, K., Lavoie, M., Bourlon, E., Atherton, E., O'Connell, E., Baillie, J., Fougère, C., and Risk, D.: Methane emissions from upstream oil and gas production in Canada are underestimated, Sci. Rep., 11, 8041, https://doi.org/10.1038/s41598-021-87610-3, 2021.
Nara, H., Tanimoto, H., Tohjima, Y., Mukai, H., Nojiri, Y., and Machida, T.: Emissions of methane from offshore oil and gas platforms in Southeast Asia, Sci. Rep., 4, 6503, https://doi.org/10.1038/srep06503, 2014.
Nisbet, E. G., Manning, M. R., Dlugokencky, E. J., Fisher, R. E., Lowry, D., Michel, S. E., Lund Myhre, C., Platt, S. M., Allen, G., Bousquet, P., Brownlow, R., Cain, M., France, J. L., Hermansen, O., Hossaini, R., Jones, A. E., Levin, I., Manning, A. C., Myhre, G., Pyle, J. A., Vaughn, B. H., Warwick, N. J., and White, J. W. C.: Very strong atmospheric methane growth in the 4 years 2014–2017: Implications for the Paris Agreement, Global Biogeochem. Cy., 33, 318–342, https://doi.org/10.1029/2018GB006009, 2019.
NLOG – Dutch Oil and Gas Portal: Production figures for fields in 2019, https://www.nlog.nl/datacenter/prodfigures/fields (last access: 15 June 2021), 2019.
OGA – Oil and Gas Authority (North Sea Transition Authority): OGA Shell/Exxon Mobil Geochemistry Database for Southern North Sea, https://opendata-nstauthority.hub.arcgis.com/documents/53769edfbc0f4938a7b07a5ee1d30204/about (last access: 12 August 2022), 2017.
OGA – Oil and Gas Authority (North Sea Transition Authority): NSTA Field Production Points, PPRS (WGS84), https://opendata-nstauthority.hub.arcgis.com/search (last access: 4 May 2022), 2019.
OGA: UKCS Flaring and Venting Report, https://ogauthorityreports.wixsite.com/ukcs-f-v-report-2020 (last access: 30 November 2022), 2020.
OPRED (BEIS): EEMS Atmospheric Emissions Calculations, https://assets.publishing.service.gov.uk/government/uploads/system/uploads/attachment_data/file/136461/atmos-calcs.pdf (last access: 30 November 2022), 2008.
O'Shea, S. J., Allen, G., Gallagher, M. W., Bower, K., Illingworth, S. M., Muller, J. B. A., Jones, B. T., Percival, C. J., Bauguitte, S. J.-B., Cain, M., Warwick, N., Quiquet, A., Skiba, U., Drewer, J., Dinsmore, K., Nisbet, E. G., Lowry, D., Fisher, R. E., France, J. L., Aurela, M., Lohila, A., Hayman, G., George, C., Clark, D. B., Manning, A. J., Friend, A. D., and Pyle, J.: Methane and carbon dioxide fluxes and their regional scalability for the European Arctic wetlands during the MAMM project in summer 2012, Atmos. Chem. Phys., 14, 13159–13174, https://doi.org/10.5194/acp-14-13159-2014, 2014.
Pandey, S., Gautam, R., Houweling, S., van der Gon, H. D., Sadavarte, P., Borsdorff, T., Hasekamp, O., Landgraf, J., van Kempen, T., Hoogeveen, R., van Hees, R., Hamburg, S. P., Maasakkers, J. D., and Aben, I.: Satellite observations reveal extreme methane leakage from a natural gas well blowout, P. Natl. Acad. Sci., 116, 26376–26381, https://doi.org/10.1073/pnas.1908712116, 2019.
Peischl, J., Eilerman, S. J., Neuman, J. A., Aikin, K. C., de Gouw, J., Gilman, J. B., Herndon, S. C., Nadkarni, R., Trainer, M., Warneke, C., and Ryerson, T., B.: Quantifying methane and ethane emissions to the atmosphere from central and western U.S. oil and natural gas production regions. J. Geophys. Res.-Atmos., 123, 7725–7740, https://doi.org/10.1029/2018JD028622, 2018.
Pétron, G., Karion, A., Sweeney, C., Miller, B. R., Montzka, S. A., Frost, G. J., Trainer, M., Tans, P., Andrews, A., Kofler, J., Helmig, D., Guenther, C., Dlugokencky, E., Lang, P., Newberger, T., Wolter, S., Hall, B., Novelli, P., Brewer, A., Conley, S., Hardesty, M., Banta, R., White, A., Noone, D., Wolfe, D., and Schnell, R.: A new look at methane and nonmethane hydrocarbon emissions from oil and natural gas operations in the Colorado Denver-Julesburg Basin, J. Geophys. Res.-Atmos., 119, 6836–6852, https://doi.org/10.1002/2013JD021272, 2014.
Pisso, I., Sollum, E., Grythe, H., Kristiansen, N. I., Cassiani, M., Eckhardt, S., Arnold, D., Morton, D., Thompson, R. L., Groot Zwaaftink, C. D., Evangeliou, N., Sodemann, H., Haimberger, L., Henne, S., Brunner, D., Burkhart, J. F., Fouilloux, A., Brioude, J., Philipp, A., Seibert, P., and Stohl, A.: The Lagrangian particle dispersion model FLEXPART version 10.4, Geosci. Model Dev., 12, 4955–4997, https://doi.org/10.5194/gmd-12-4955-2019, 2019.
Pitt, J. R., Allen, G., Bauguitte, S. J.-B., Gallagher, M. W., Lee, J. D., Drysdale, W., Nelson, B., Manning, A. J., and Palmer, P. I.: Assessing London CO2, CH4 and CO emissions using aircraft measurements and dispersion modelling, Atmos. Chem. Phys., 19, 8931–8945, https://doi.org/10.5194/acp-19-8931-2019, 2019.
PRTR – Pollutant Release and Transfer Register: Oil and Gas industry, Netherlands Continental Shelf, https://legacy.emissieregistratie.nl/erpubliek/erpub/selectie/criteria.aspx (last access: 24 October 2022), 2019.
Riddick, S. N., Mauzerall, D. L., Celia, M., Harris, N. R. P., Allen, G., Pitt, J., Staunton-Sykes, J., Forster, G. L., Kang, M., Lowry, D., Nisbet, E. G., and Manning, A. J.: Methane emissions from oil and gas platforms in the North Sea, Atmos. Chem. Phys., 19, 9787–9796, https://doi.org/10.5194/acp-19-9787-2019, 2019.
Roiger, A., Thomas, J.-L., Schlager, H., Law, K. S., Kim, J., Schäfler, A., Winzierl, B., Dahlkötter, F., Krisch, I., Marelle, L., Minikin, A., Raut, J.-C., Reiter, A., Rose, M., Scheibe, M., Stock, P., Baumann, R., Bouarar, I., Clerbaux, C. George, M., Onishi, T., and Flemming, J.: Quantifying Emerging Local Anthropogenic Emissions in the Arctic Region: The ACCESS Aircraft Campaign Experiment, B. Am. Meteorol. Soc., 96, 441–460, https://doi.org/10.1175/BAMS-D-13-00169.1, 2015.
Saunois, M., Stavert, A. R., Poulter, B., Bousquet, P., Canadell, J. G., Jackson, R. B., Raymond, P. A., Dlugokencky, E. J., Houweling, S., Patra, P. K., Ciais, P., Arora, V. K., Bastviken, D., Bergamaschi, P., Blake, D. R., Brailsford, G., Bruhwiler, L., Carlson, K. M., Carrol, M., Castaldi, S., Chandra, N., Crevoisier, C., Crill, P. M., Covey, K., Curry, C. L., Etiope, G., Frankenberg, C., Gedney, N., Hegglin, M. I., Höglund-Isaksson, L., Hugelius, G., Ishizawa, M., Ito, A., Janssens-Maenhout, G., Jensen, K. M., Joos, F., Kleinen, T., Krummel, P. B., Langenfelds, R. L., Laruelle, G. G., Liu, L., Machida, T., Maksyutov, S., McDonald, K. C., McNorton, J., Miller, P. A., Melton, J. R., Morino, I., Müller, J., Murguia-Flores, F., Naik, V., Niwa, Y., Noce, S., O'Doherty, S., Parker, R. J., Peng, C., Peng, S., Peters, G. P., Prigent, C., Prinn, R., Ramonet, M., Regnier, P., Riley, W. J., Rosentreter, J. A., Segers, A., Simpson, I. J., Shi, H., Smith, S. J., Steele, L. P., Thornton, B. F., Tian, H., Tohjima, Y., Tubiello, F. N., Tsuruta, A., Viovy, N., Voulgarakis, A., Weber, T. S., van Weele, M., van der Werf, G. R., Weiss, R. F., Worthy, D., Wunch, D., Yin, Y., Yoshida, Y., Zhang, W., Zhang, Z., Zhao, Y., Zheng, B., Zhu, Q., Zhu, Q., and Zhuang, Q.: The Global Methane Budget 2000–2017, Earth Syst. Sci. Data, 12, 1561–1623, https://doi.org/10.5194/essd-12-1561-2020, 2020.
Scarpelli, T. R. and Jacob, D. J.: Global Fuel Exploitation Inventory (GFEI), V2, Harvard Dataverse [data set], https://doi.org/10.7910/DVN/HH4EUM, 2019.
Scarpelli, T. R., Jacob, D. J., Maasakkers, J. D., Sulprizio, M. P., Sheng, J.-X., Rose, K., Romeo, L., Worden, J. R., and Janssens-Maenhout, G.: A global gridded (0.1° × 0.1°) inventory of methane emissions from oil, gas, and coal exploitation based on national reports to the United Nations Framework Convention on Climate Change, Earth Syst. Sci. Data, 12, 563–575, https://doi.org/10.5194/essd-12-563-2020, 2020.
Schwietzke, S., Sherwood, O., Bruhwiler, L. M. P., Miller, J. B., Etiope, G., Dlugokencky, E. J., Englund Michel, S., Arling, V., A., Vaughn, B. H., White, J. W. C., and Tans, P. P.: Upward revision of global fossil fuel methane emissions based on isotope database, Nature, 538, 88–91, https://doi.org/10.1038/nature19797, 2016.
Smith, M. L., Kort, E. A., Karion, A., Sweeney, C., Herndon, S. C., and Yacovitch, T. I.: Airborne Ethane Observations in the Barnett Shale: Quantification of Ethane Flux and Attribution of Methane Emissions, Environ. Sci. Technol., 59, 8158–8166, https://doi.org/10.1021/acs.est.5b00219, 2015.
Stull, R. B.: An Introduction to Boundary Layer Meteorology, Atmospheric Sciences Library, Springer, Dordrecht, https://doi.org/10.1007/978-94-009-3027-8, 1988.
Tullos, E. E., Stokes, S. N., Cardoso-Saldaña, F., J., Herndon, S. C., Smith, B. J., and Allen, D. T.: Use of Short Duration Measurements to Estimate Methane Emissions at Oil and Gas Production Sites, Environ. Sci. Technol., 8, 463–467, https://doi.org/10.1021/acs.estlett.1c00239, 2021.
UNFCCC: Greenhouse Gas Inventory Data Interface, http://di.unfccc.int/detailed_data_by_party (last access: 14 March 2022), 2022.
Varon, D. J., McKeever, J., Jervis, D., Maasakkers, J. D., Pandey, S., and Houweling, S.: Satellite discovery of anomalously large methane poin sources from oil/gas production, Geophys. Res. Lett., 46, 13507–13516, https://doi.org/10.1029/2019GL083798, 2019.
Weiss, A. I., King, J., Lachlan-Cope, T., and Ladkin, R.: On the effective aerodynamic and scalar roughness length of Weddell Sea ice, J. Geophys. Res.-Atmos., 116, D19119, https://doi.org/10.1029/2011JD015949, 2011.
Xiao, Y., Logan, J. A., Jacob, D. J., Hudman, R. C., Yantosca, R., and Blake, D. R.: Global budget of ethane and regional constraints on US sources, J. Geophys. Res., 113, 306, https://doi.org/10.1029/2007JD009415, 2008.
Yacovitch, T. I., Herndon, S. C., Roscioli, J. R., Floerchinger, C., McGovern, R. M., Agnese, M., Pétron, G., Kofler, J., Sweeney, C., Karion, A., Conley, S. A., Kort, E. A., Nähle, L., Fischer, M. Hildebrandt, L., Koeth, J., McMaunus, J. B., Nelson, D. D., Zahniser, M. S., and Kolb, C. E.: Demonstration of an Ethane Spectrometer for Methane Source Identification, Environ. Sci. Technol., 48, 8028–8034, https://doi.org/10.1021/es501475q, 2014.
Yacovitch, T. I., Daube, C., and Herndon, S. C.: Methane Emissions from Offshore Oil and Gas Platforms in the Gulf of Mexico, Environ. Sci. Technol., 54, 3530–3538, https://doi.org/10.1021/acs.est.9b07148, 2020.
Zavala-Araiza, D., Alvarez, R. A., Lyon, D. R., Allen, D. T., Marchese, A. J., Zimmerle, D. J., and Hamburg, S. P.: Super-emitters in natural gas infrastructure are caused by abnormal process conditions, Nat. Commun., 8, 14012, https://doi.org/10.1038/ncomms14012, 2017.
Zavala-Araiza, D., Omara, M., Gautam, R., Smith, M. L., Pandey, S., Aben, I., Almanza-Veloz, V., Conley, S., Houweling, S., Kort, E. A., Maasakkers, J. D., Molina, L. T., Pusuluri, A., Scarpelli, T., Schwietzke, S., Shen, L., Zavala, M., and Hamburg, S. P.: A tale of two regions: methane emissions from oil and gas production in offshore/onshore Mexico, Environ. Res. Lett., 16, 024019, https://doi.org/10.1088/1748-9326/abceeb, 2021.
- Abstract
- Introduction
- Materials and methods
- Results
- Conclusions
- Appendix A: Example of flux calculation for P1
- Appendix B: Uncertainty analysis for flux calculation
- Appendix C: FLEXPART dispersion model: example footprint analysis for the multi-platform complex P4 (backward simulation)
- Appendix D: Comparison of C2H6-to-CH4 ratios and CO2 fluxes with reported values
- Appendix E: Production rates and loss rates (including non-emitting installations)
- Code and data availability
- Author contributions
- Competing interests
- Disclaimer
- Acknowledgements
- Financial support
- Review statement
- References