the Creative Commons Attribution 4.0 License.
the Creative Commons Attribution 4.0 License.
 | 06 Sep 2023
Radiation fog properties in two consecutive events under polluted and clean conditions in the Yangtze River Delta, China: a simulation study
Naifu Shao
Chunsong Lu
Xingcan Jia
Yuan Wang
Yubin Li
Bin Zhu
Tianliang Zhao
Duanyang Liu
Shengjie Niu
Shuxian Fan
Shuqi Yan
Jingjing Lv
Aerosol–cloud interaction (ACI) in fog and planetary boundary layer (PBL) conditions plays critical roles in the fog life cycle. However, it is not clear how ACI in the first fog (Fog1) affects the PBL and subsequently affects ACI in the second fog (Fog2), which is important information for understanding the interaction between ACI and the PBL, as well as their effects on fog properties. To fill this knowledge gap, we simulate two successive radiation fog events in the Yangtze River Delta, China, using the Weather Research and Forecasting model coupled with Chemistry (WRF-Chem). Our simulations indicate that the PBL conditions conducive to Fog2 formation are affected by ACI with high aerosol loading in Fog1; subsequently, the PBL promotes ACI in Fog2, resulting in a higher liquid water content, higher droplet number concentration, smaller droplet size, larger fog optical depth, wider fog distribution, and longer fog lifetime in Fog2 than in Fog1. This phenomenon is related to the following physical factors. The first factor involves meteorological conditions conducive to Fog2 formation, including low temperature, high humidity, and high stability. The second factor is the feedbacks between microphysics and radiative cooling. A higher fog droplet number concentration increases the liquid water path and fog optical depth, thereby enhancing long-wave radiative cooling and condensation near the fog top. The third factor is the feedbacks between macrophysics, radiation, and turbulence. A higher fog top presents stronger long-wave radiative cooling near the fog top than near the fog base, which weakens temperature inversion and strengthens turbulence, ultimately increasing the fog-top height and fog area.
In summary, under polluted conditions, ACI postpones the dissipation of Fog1 owing to these two feedbacks and generates PBL meteorological conditions that are more conducive to the formation of Fog2 than those prior to Fog1. These conditions promote the earlier formation of Fog2, further enhancing the two feedbacks and strengthening the ACI in Fog2. Our findings are critical for studying the interaction between aerosols, fog, and the PBL; moreover, they shed new light on ACI.
- Article
(2741 KB) - Full-text XML
-
Supplement
(1112 KB) - BibTeX
- EndNote


Fog comprises water droplets or ice crystals suspended above the ground (WMO, 1992). This results in low visibility, which affects human health, transportation, and power systems (Niu et al., 2010). Uncertainties exist in fog forecasting (Zhou and Du, 2010; Zhou et al., 2011). An important reason for this is that the physical processes of fog remain unclear because many processes (aerosol activation, condensation, radiation, and turbulence) occur simultaneously and interact with each other nonlinearly (Haeffelin et al., 2010), which affects fog properties (Mazoyer et al., 2022) and impedes related parameterisation (Poku et al., 2021). To better understand the physical processes of fog, comprehensive studies based on observations and simulations have been conducted (Fernando et al., 2021; Gultepe et al., 2014; Guo et al., 2015; Hammer et al., 2014; Liu et al., 2011; Price et al., 2018; Shen et al., 2018; Wang et al., 2021). The critical roles of aerosols and the planetary boundary layer (PBL) in these processes have been shown (Boutle et al., 2018; Niu et al., 2011; Quan et al., 2021).
Since fog is a special type of cloud (Guo et al., 2021; Kim and Yum, 2010, 2013; Wang et al., 2023), aerosol–fog interaction is expected to share similarities with aerosol–cloud interaction (ACI). The ACI in fog reflects the response of fog properties to changes in aerosol loading. Studies on ACI revealed that increasing aerosol loading increased cloud droplet concentration, thereby increasing the cloud optical depth under a constant liquid water content (LWC) (Garrett and Zhao, 2006; Twomey, 1977; Wang et al., 2013, 2018; Zhao and Garrett, 2015). Various continental fog observation projects showed that fog microphysical properties were significantly affected by aerosol loading (Mazoyer et al., 2019; Niu et al., 2011; Quan et al., 2011; Wang et al., 2021). For instance, in polluted fog observations, Quan et al. (2011) found that the fog droplet number concentration (Nd) was higher than 1000 cm−3 and that the effective radius (Re) was approximately 7 µm in the North China Plain. In clean fog observations, Wang et al. (2021) showed that Nd was smaller than 100 cm−3 and that Re was approximately 9 µm in the tropical rainforest in Xishuangbanna, China. Several simulation studies reproduced these observations and demonstrated the complex impact of ACI on fog micro- and macrophysics (Jia et al., 2019; Maalick et al., 2016; Stolaki et al., 2015; Yan et al., 2020). Regarding fog microphysics, increasing aerosol loading in the simulations increased Nd and LWC due to increased activation and condensation (Jia et al., 2019; Stolaki et al., 2015; Yan et al., 2020). Regarding fog macrophysics, several modelling studies reported that increasing aerosol loading increased the fog-top height (Jia et al., 2019; Stolaki et al., 2015) and prolonged the fog lifetime by delaying its dissipation (Quan et al., 2021; Yan et al., 2021).
Furthermore, previous studies found that meteorological conditions played crucial roles in ACI, as well as in cloud macro- and microphysics (Ackerman et al., 2004; Kumar et al., 2017, 2021; Liu et al., 2019, 2020; Toll et al., 2019). Similarly, studies on fog showed that ACI was affected by meteorological conditions in the PBL (e.g. radiation, thermodynamics, and dynamics), which further affected fog micro- and macrophysics (Haeffelin et al., 2010). Previous studies showed that radiative cooling was an important factor in temperature inversion that provided stable conditions for fog formation (Fitzjarrald and Lala, 1989; Holets and Swanson, 1981; Roach et al., 1976). According to Zhou and Ferrier (2008), turbulence may suppress or deepen the fog-top height, which was related to the critical turbulence coefficient. The critical turbulence coefficient was the turbulence threshold for diagnosing whether turbulence suppressed fog or not. When the turbulence intensity within the fog did not exceed the critical turbulence coefficient, the fog persisted; however, when it surpassed its threshold, the fog dissipated (Zhou and Ferrier, 2008). When temperature inversion was weak, excessive vertical turbulent mixing delayed fog formation (Maronga and Bosveld, 2017). However, when temperature inversion was sufficiently strong, vertical turbulent mixing at the fog middle and base increased the fog-top height, as suggested by observations (Ye et al., 2015) and simulations (Porson et al., 2011). Consequently, turbulence may impact fog macrophysics. Moreover, aerosols were reported to affect turbulence, thereby impacting fog macrophysics (Jia et al., 2019; Quan et al., 2021). A qualitative analysis, conducted in a previous study, revealed that aerosols promoted turbulence and horizontal distribution because of weaker temperature inversion (Jia et al., 2019).
Previous studies typically focused on either a single fog event or analysed multiple fog events statistically; however, several studies noted that LWC, Nd, and liquid water path (LWP) in a latter fog event exhibited larger values compared to those for the preceding fog event (Quan et al., 2011; Wærsted et al., 2017). What are the physical mechanisms behind the property changes during two successive fog events? Furthermore, which fog event has macro- and microphysical properties that are more sensitive to aerosol loading, i.e. that experience a stronger ACI? What are the mechanisms underlying the interactions between ACI and the PBL? To answer these questions, two successive radiation fog events in the Yangtze River Delta (YRD) region of China are simulated in this article using the Weather Research and Forecasting model coupled with Chemistry (WRF-Chem). The two fog events provide an excellent opportunity to investigate ACI under polluted conditions as a chain. This involves analysing how high aerosol loading affects properties in the first fog event, how the properties in the first polluted fog event affect radiation and PBL structure, and finally how radiation and the PBL affect properties and ACI in the second fog event under polluted conditions. Additionally, since fog is a special type of cloud near the ground, studying the evolution of ACI in fog aids in examining the progression of ACI in cloud, which is critical for climate prediction (Boutle et al., 2018; Vautard et al., 2009).
The rest of the article is organised as follows. Section 2 presents descriptions of the two successive fog events, experimental design, and data source. Section 3 presents the simulation evaluation. Section 4 shows larger aerosol-induced changes in Fog2 than in Fog1. Section 5 presents the physical mechanisms underlying the larger aerosol-induced changes in Fog2 compared to in Fog1. Finally, Sect. 6 summarises the conclusions of this study.
Here, we study how radiation fog properties are affected by high aerosol loading and PBL meteorological conditions in two successive events in the YRD region. Before fog events in the YRD, the PM2.5 mass concentration was over 100 µg m−3 due to anthropogenic emissions (Zhu et al., 2019a). On 26 and 27 November 2018, two successive radiation fog events occurred in the northern YRD. The first fog event is called Fog1, and the second one is called Fog2. Ground-based observations at the Nanjing site (32.2∘ N, 118.7∘ E) show that two fog events (visibility < 1000 m) are accompanied by high relative humidity, low temperature, and weak wind speed (Fig. 1). As shown in Fig. S1 in the Supplement, the surface is controlled by a high-pressure system with cold and moist air in the northern YRD at 20:00 local standard time (LST; Universal Time Coordinated+8 h) on 26 and 27 November 2018. WRF-Chem (version 4.1.3) is used to simulate the two successive radiation fog events. WRF-Chem couples physical and chemical processes; therefore, it has been widely used to study ACI (Jia et al., 2019; Lee et al., 2016; Yan et al., 2020, 2021). The model is integrated from 14:00 LST on 24 November 2018 to 14:00 LST on 27 November 2018, with the first 24 h being regarded as the spin-up time. As shown in Fig. S2, the model is configured using three nested domains, and all domain centres are located in Nanjing. The three nested domains are made up of 90 × 122, 118 × 142, and 130 × 154 grid cells with resolutions of 27, 9, and 3 km, respectively. The simulation area covers the major weather system affecting the YRD. The model includes 36 vertical levels, of which 17 layers are located at the lowest 500 m above the ground level. Moreover, Yang et al. (2019) noted a better fog simulation performance when the bottom layer was 8 m above the ground since this layer affected the fog and surface flux interaction. Consequently, in this study, we set the bottom layer of the model to 8 m. The model is driven by the National Centre for Environmental Prediction (NCEP) Final (FNL) 1∘ × 1∘ reanalysis data (https://rda.ucar.edu/datasets/ds083.2/, last access: 30 August 2023) (Ding et al., 2019; Jia et al., 2019). The Multiresolution Emission Inventory for China (MEIC) database (http://meicmodel.org.cn/?page_id=2351&lang=en#firstPage, last access: 22 April 2022) is used for anthropogenic emissions in the model (M. Li et al., 2017; Zheng et al., 2018).
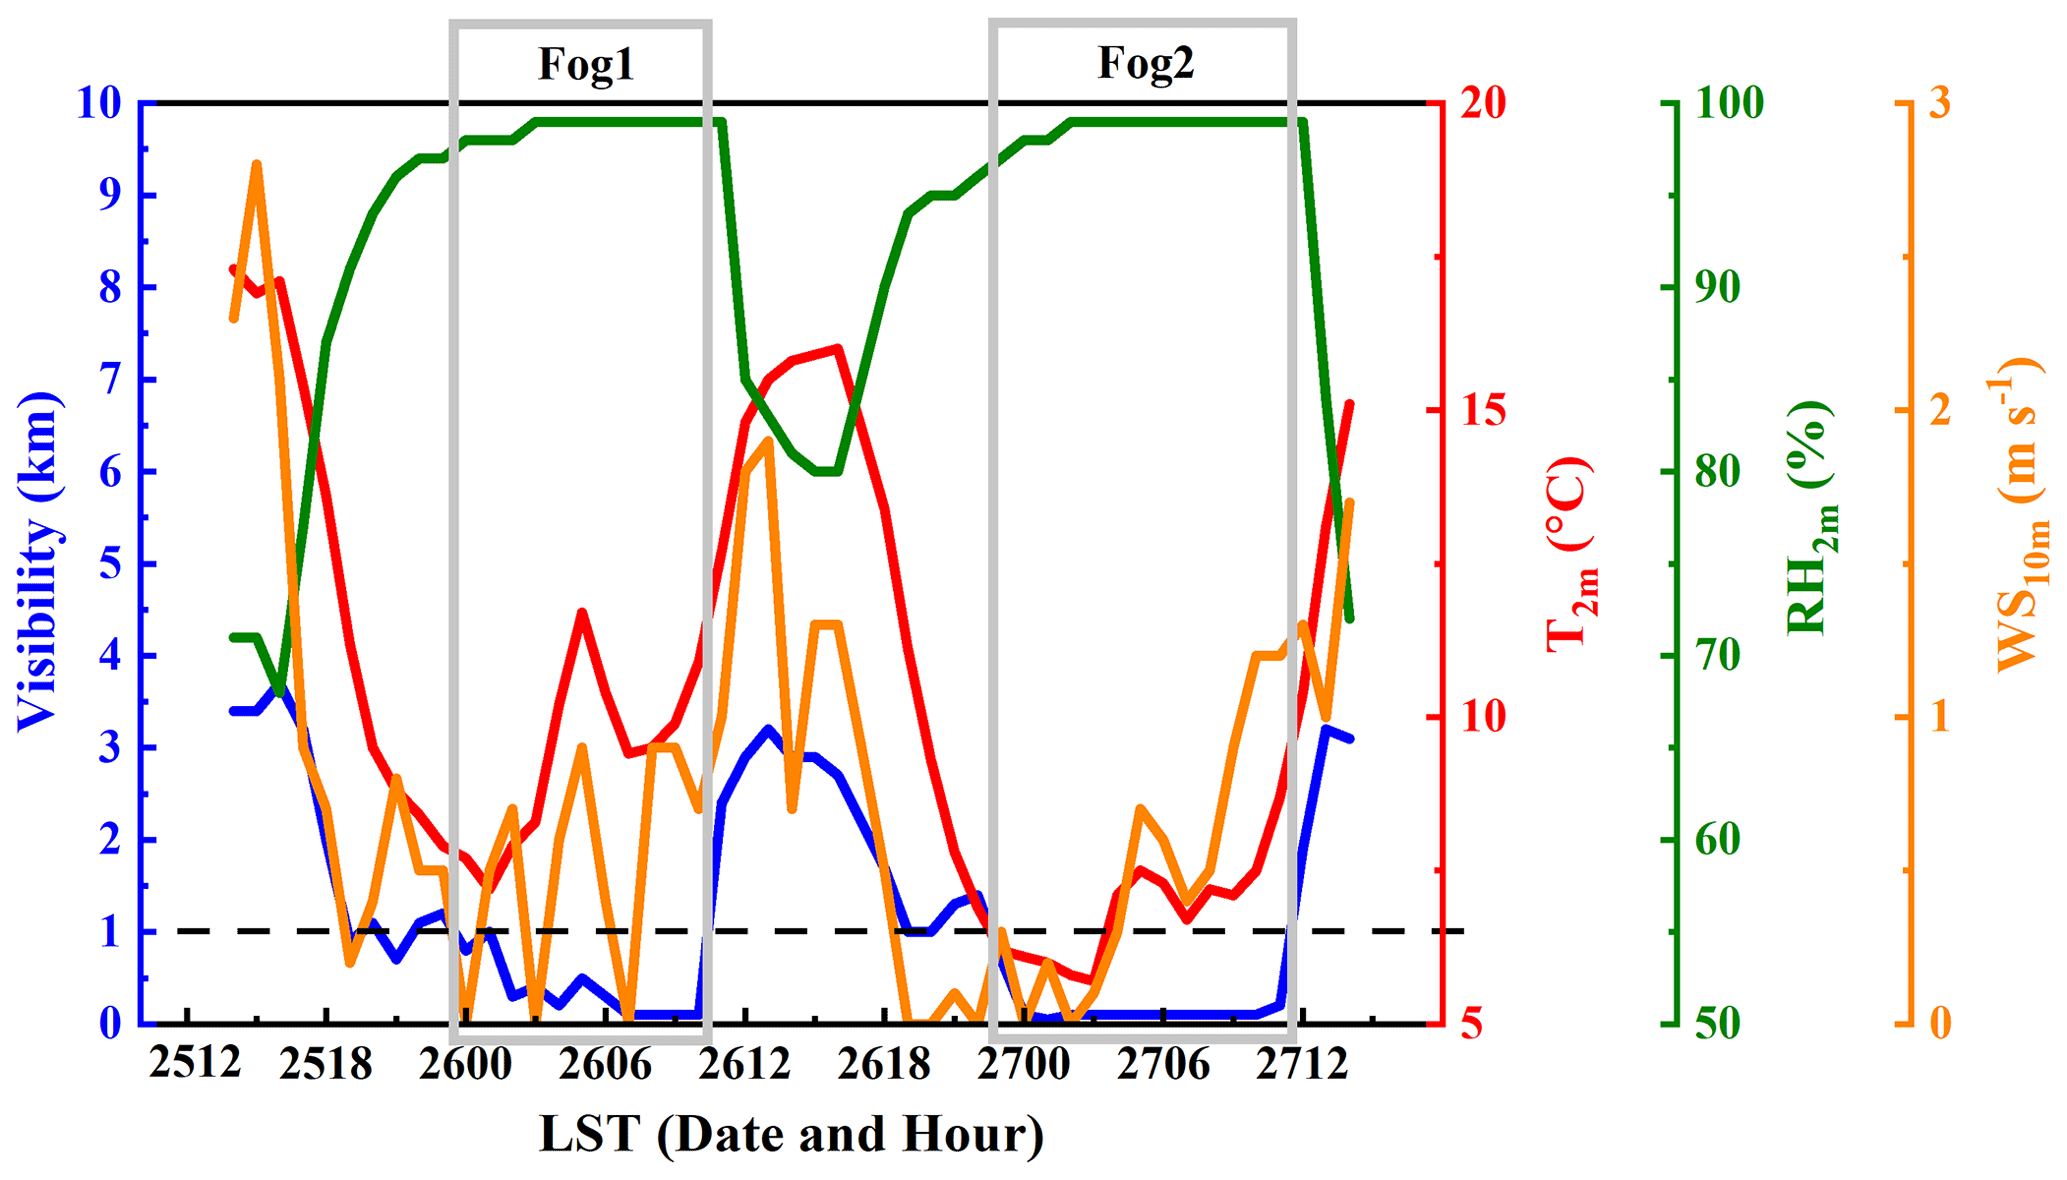
Figure 1The time series of visibility, 2 m temperature (T2 m), 2 m relative humidity (RH2 m), and 10 m wind speed (WS10 m) above the ground at the Nanjing observation site (31.93∘ N, 118.9∘ E). Fog1 and Fog2 in the light-grey box are the two fog events. Time “2512” indicates 12:00 LST (Universal Time Coordinated+8 h) on 25 November 2018. The other time expressions follow the same notation.
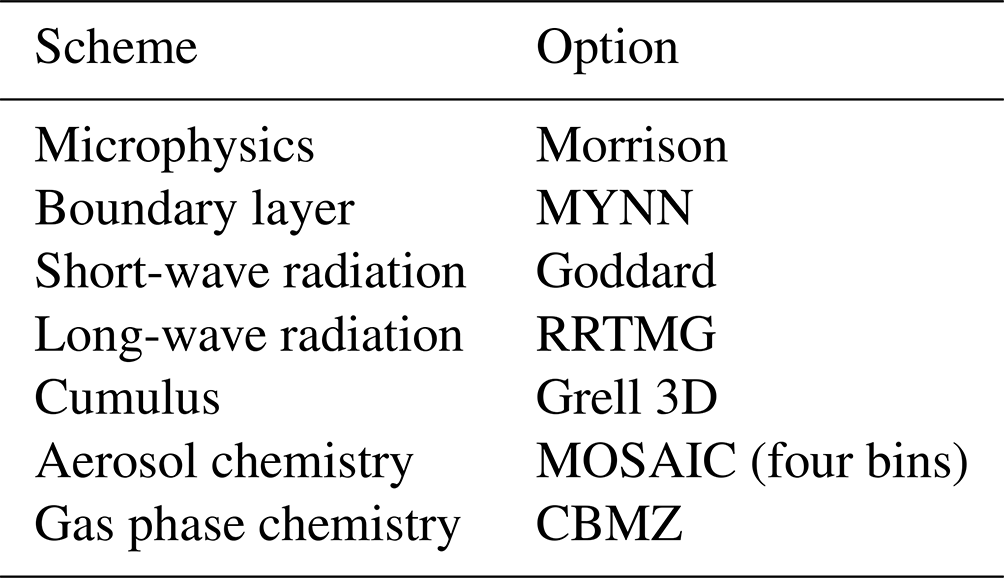
Table 1 lists the parameterisation schemes of physical processes used in this study. The microphysics scheme is that of Morrison (Morrison et al., 2005) coupled with the activation scheme (Abdul-Razzak, 2002). The PBL scheme is MYNN2.5 (Nakanishi and Niino, 2009). Turbulence is parameterised in the MYNN2.5 scheme, and there is also a sub-grid cloud parameterisation (Chaboureau and Bechtold, 2002) in the MYNN2.5 scheme. The radiation schemes are coupled with the aerosol–cloud–radiation interactions. The long- and short-wave radiation schemes are RRTMG (Iacono et al., 2008) and Goddard (Matsui et al., 2020), respectively. The cumulus scheme is Grell 3D (Grell and Dévényi, 2002). The chemistry schemes are MOSAIC-4 bins (Zaveri et al., 2008) and CBMZ (Zaveri and Peters, 1999).
For model evaluation, meteorological data are retrieved from the China Meteorological Administration (http://data.cma.cn/en, last access: 30 August 2023). The cloud product (level-2 full-disk cloud property data) from the Himawari-8 geostationary satellite is used (Bessho et al., 2016; Iwabuchi et al., 2018; https://www.eorc.jaxa.jp/ptree/index.html, last access: 30 August 2023). The quality of the Himawari cloud product is reliable because this product has been evaluated against the Moderate Resolution Imaging Spectroradiometer (MODIS) (Bessho et al., 2016; Letu et al., 2020) and cloud profiles from aircraft measurements (Zhao et al., 2020). The spatial resolution of the Himawari cloud product is 0.05∘ × 0.05∘ (Yang et al., 2020). PM2.5 mass concentration data are obtained from the Ministry of Environmental Protection (https://quotsoft.net/air/, last access: 30 August 2023).
To investigate the aerosol-induced changes in fog macro- and microphysics, one control run and two sensitivity tests are conducted: EXP1, EXP2, and EXP3, respectively. High and low emissions indicate polluted and clean conditions, respectively. The differences indicate the aerosol effect on fog properties. In EXP1, the emission intensity is obtained directly from the MEIC database to simulate fog under polluted conditions. In EXP2, the emission intensity is multiplied by 0.05 to simulate fog under clean conditions, as described by Jia et al. (2019) and Yan et al. (2021). In EXP3, Fog1 occurs under clean conditions (5 % of emission from the MEIC database) and Fog2 occurs under polluted conditions (the default emission from the MEIC database). According to Fog1 dissipation time, clean conditions change to polluted conditions at 12:00 LST on 26 November 2018. Compared with the difference between EXP1 and EXP2, the difference between EXP3 and EXP2 reveals whether the fog properties and ACI with higher aerosol loading in Fog1 affect those in Fog2.
Simulation evaluations for temperature, relative humidity, and wind speed are shown in Fig. 2. The correlation coefficients of 2 m temperature (T2 m), 2 m relative humidity (RH2 m), and 10 m wind speed (WS10 m) between the simulations and observations are 0.9, 0.9, and 0.6, respectively, passing the significance test at 99 %. Therefore, the simulations are generally consistent with the observations. The mean biases (MBs) of T2 m, RH2 m, and WS10 m between the simulations and observations are 1.0 ∘C, 2.7 %, and 0.4 m s−1, respectively, consistent with evaluation results in studies by Hu et al. (2021), Gao et al. (2016), and Yang et al. (2022). Figure 3 shows the evaluation of PM2.5 distribution, and Table 2 summarises statistics of the mean mass concentration of PM2.5 based on the method proposed by Boylan and Russell (2006). The normalised mean bias (NMB), normalised mean error (NME), mean fractional bias (MFB), and mean fractional error (MFE) between the simulations and observations are 25 %, 30 %, 24 %, and 28 %, respectively (Eqs. S3–S6 in the Supplement). Although the PM2.5 mass concentration is overestimated, it remains within a reasonable range (Shu et al., 2021; Yang et al., 2022; Zhai et al., 2018).
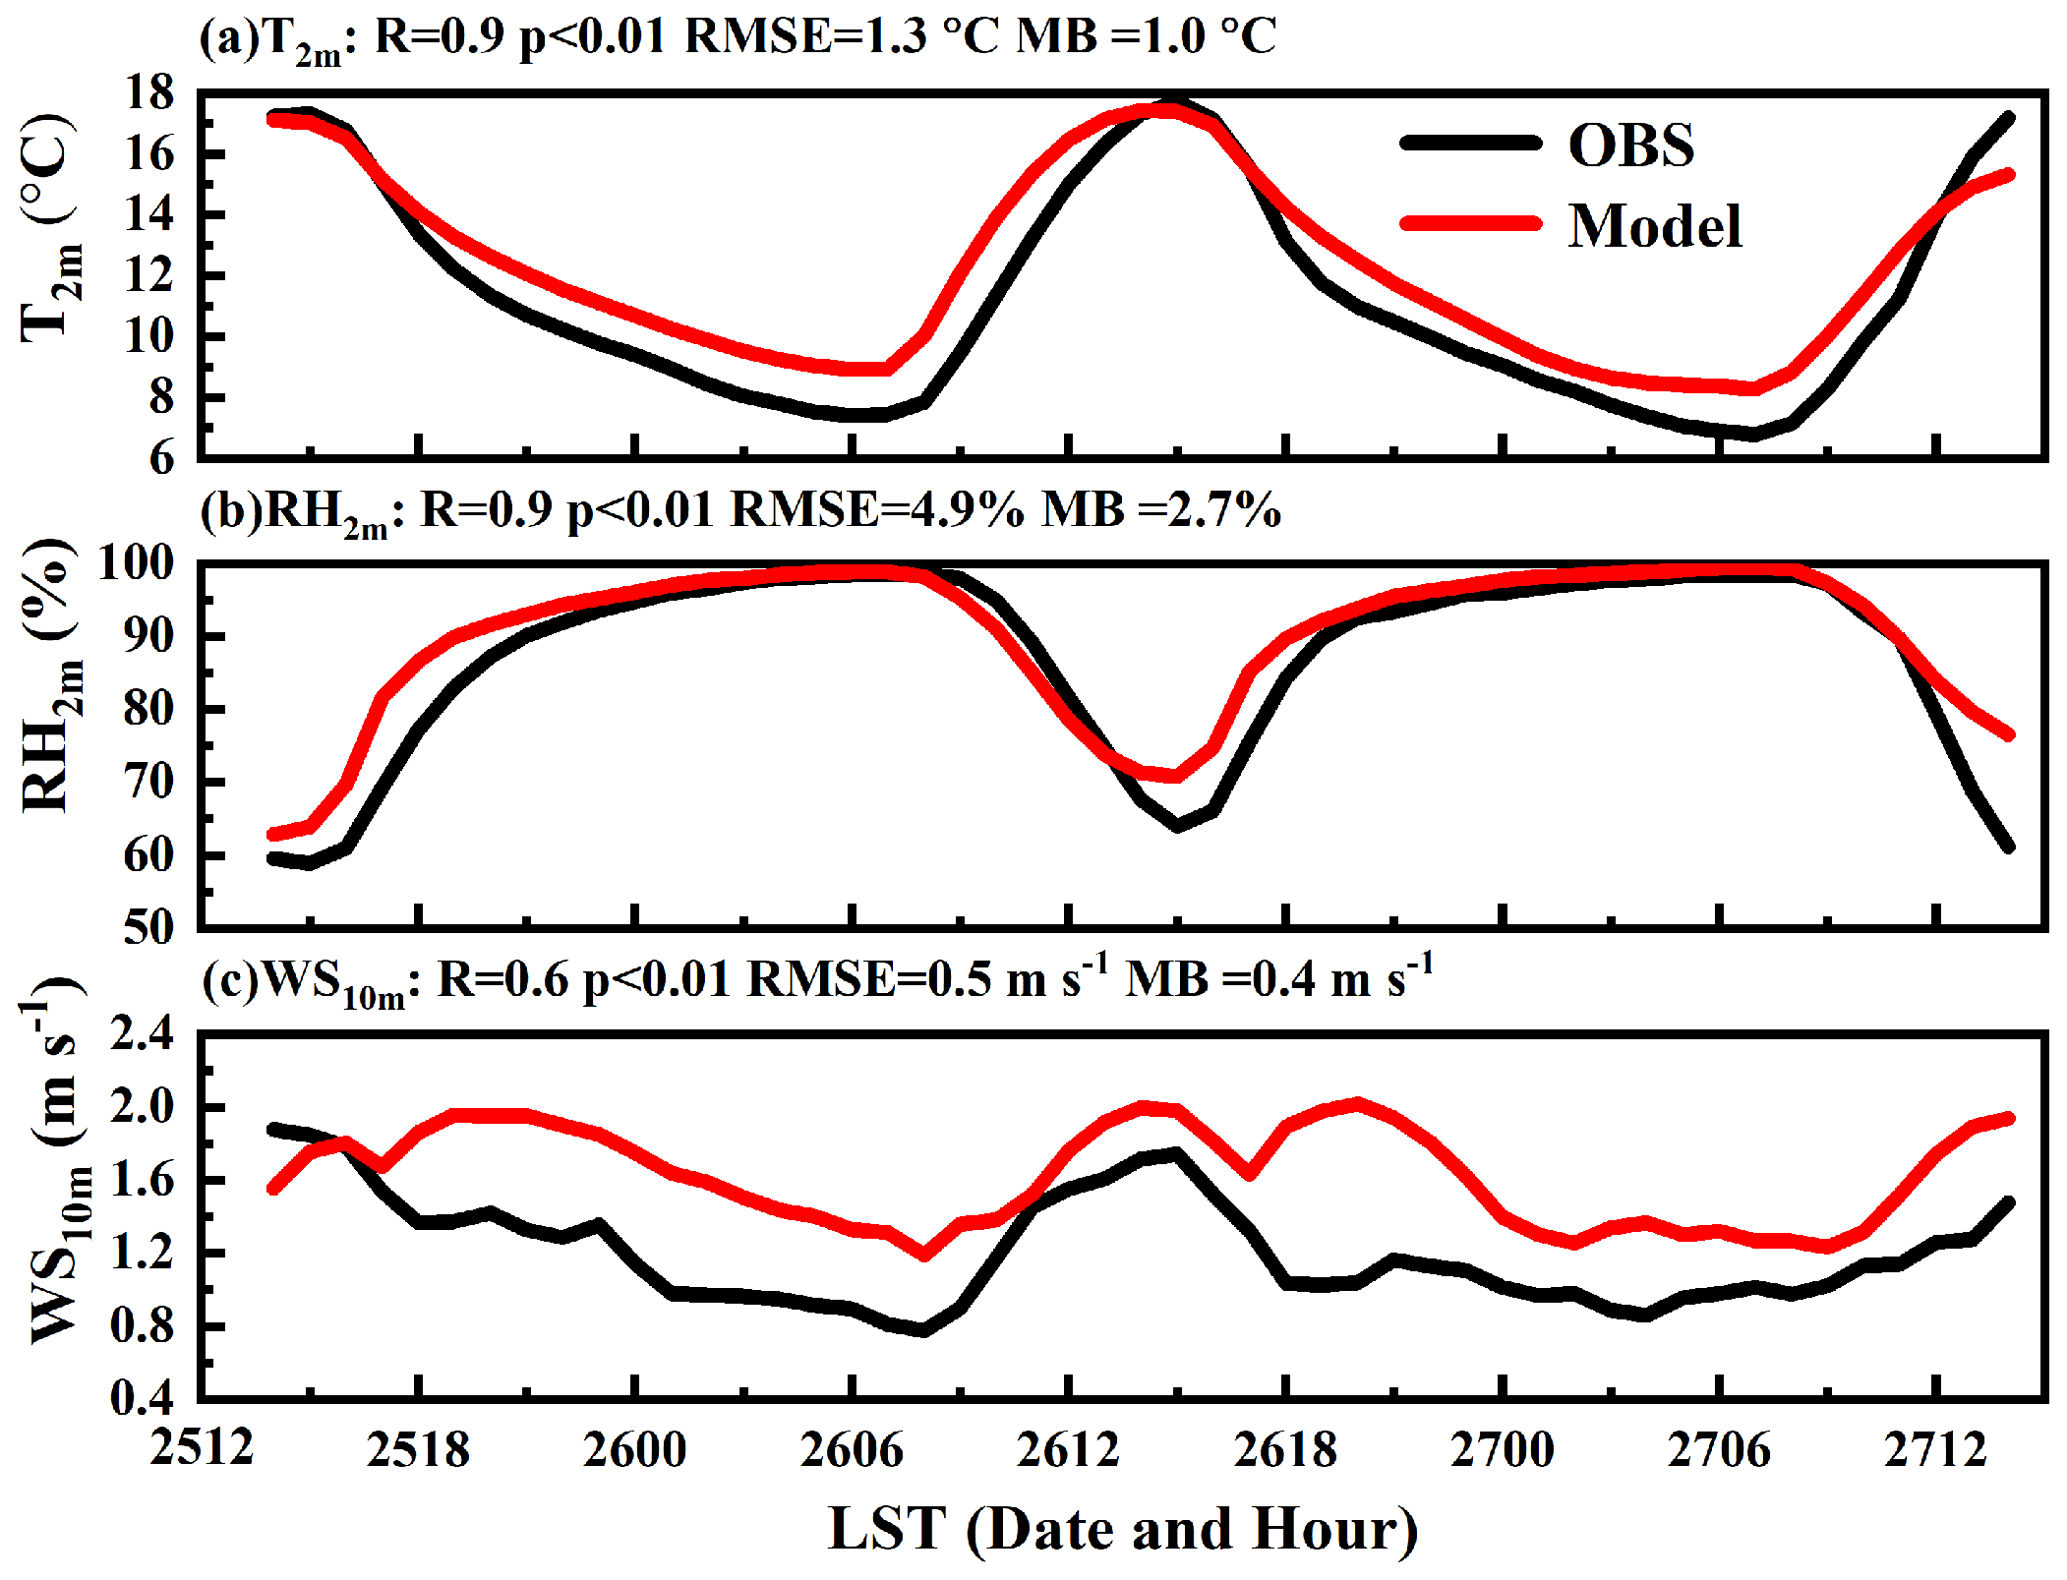
Figure 2Hourly variations in observed (black lines) and simulated (red lines) meteorological properties, including (a) 2 m temperature (T2 m), (b) 2 m relative humidity (RH2 m), and (c) 10 m wind speed (WS10 m) above the ground, averaged over 104 meteorological stations in domain 3 from 14:00 LST (Universal Time Coordinated+8 h) on 25 November to 14:00 LST on 27 November 2018. R, p, RMSE, and MB indicate the correlation coefficient, significance level, root-mean-square error, and mean bias, respectively. The equations for RMSE and MB (Eqs. S1–S2) are given in the Supplement. Time “2512” indicates 12:00 LST on 25 November 2018. The other time expressions follow the same notation.
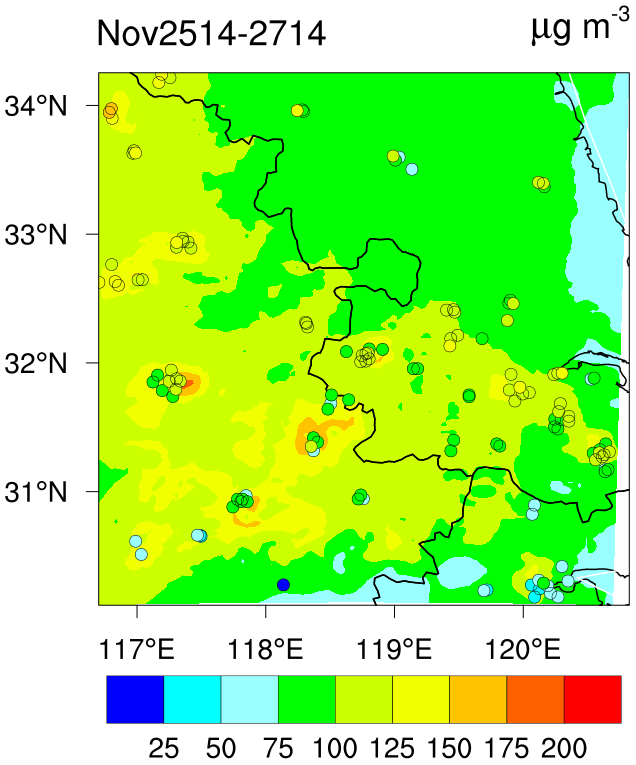
Figure 3Simulated (shaded area) and observed (coloured dots) average distributions of PM2.5 concentration (µg m−3) from 14:00 LST (Universal Time Coordinated+8 h) on 25 November to 14:00 LST on 27 November 2018.
Table 2Evaluation of PM2.5 mass concentration. NMB, NME, MFB, and MFE stand for normalised mean bias, normalised mean error, mean fractional bias, and mean fractional error, respectively. Time “2514” (DateHour) indicates 14:00 LST (Universal Time Coordinated+8 h) on 25 November 2018. The other time expressions follow the same notation.
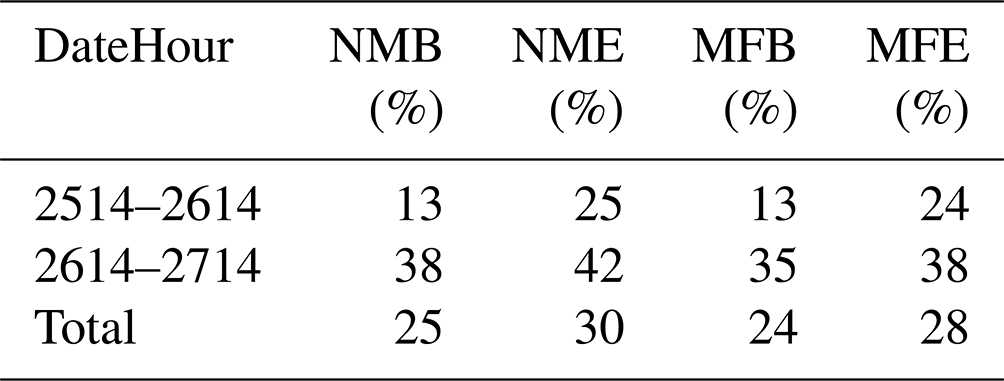
Figure 4 shows the evaluation of fog spatial distribution. The simulated fog optical depth distribution is compared with the Himawari-8 cloud optical depth products at 08:00 LST on 26 and 27 November 2018, respectively. To identify observed fog at ground-based stations (the black circles in Fig. 4), we apply two criteria: visibility less than 1 km and relative humidity greater than 90 % (Yan et al., 2020). Qualitatively, the values of fog optical depth and the fog spatial distribution in the simulation are roughly similar to those observed by the Himawari satellite and at ground-based stations. Likewise, Lee et al. (2016) evaluated fog distribution simulations against satellite-derived cloud optical depth from satellite and concluded that the distributions of simulations and observations were generally comparable to each other.
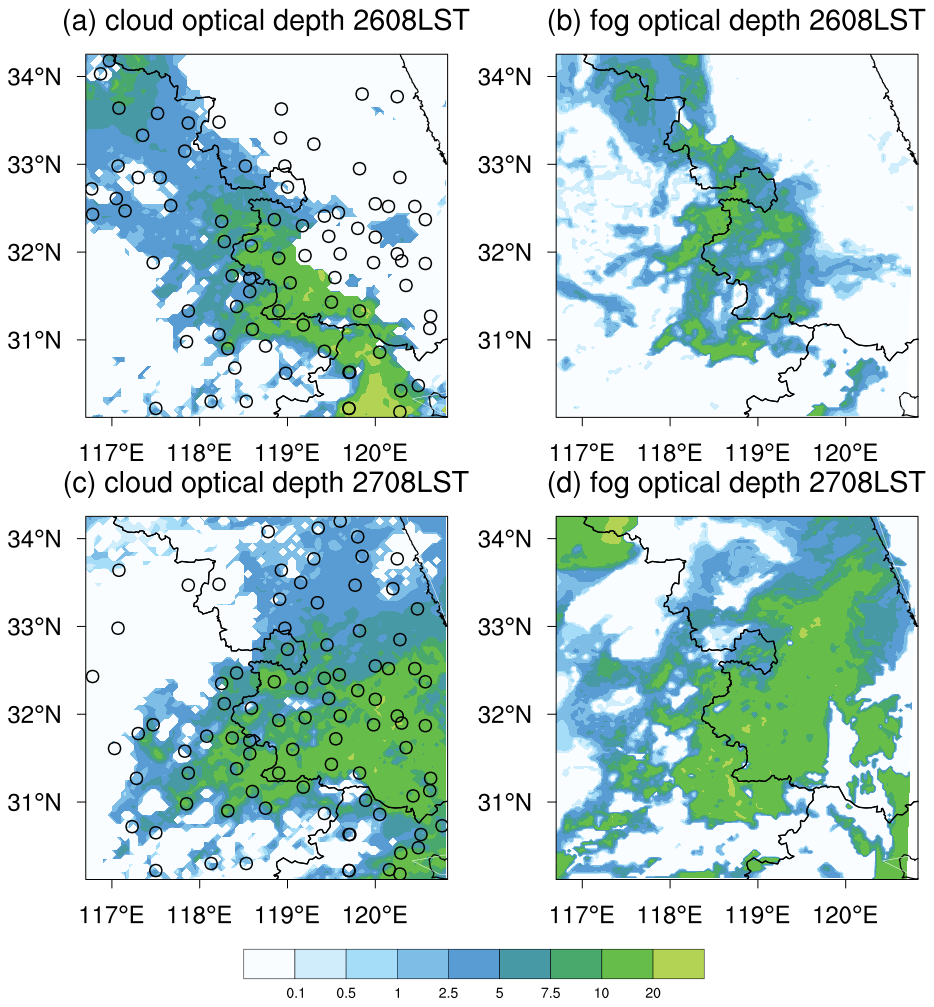
Figure 4(a, c) Distributions of ground-based fog observations (the circular black points) and cloud optical depth from Himawari-8 products at 08:00 LST on 26 and 27 November 2018. (b, d) Simulated fog optical depth distributions in domain 3 at the corresponding time of observations. Time “2608LST” indicates 08:00 LST (Universal Time Coordinated+8 h) on 26 November 2018. The other time expressions follow the same notation.
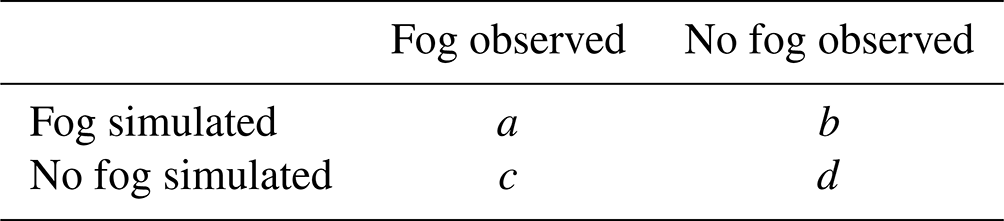
Further, to quantitatively evaluate the simulation, the Heidke skill score (HSS) is calculated as follows (Barnston, 1992):
Elements a–d are determined by the occurrence of fog at observation stations located in domain 3 and the closest model grids to those observations, as shown in Table 3. If fog events are both observed at stations and simulated in the closest model grids, we recognise those as hits, and a in Eq. (1) represents the total number of hits during the entire fog event. Similarly, d represents the number of correct negatives for the correct non-event simulations. On the other hand, if fog events are simulated but not observed, we recognise those as false alarms, and b represents the total number of false alarms during the entire fog event. Conversely, c represents the total number of misses, which indicates that fog events are observed but not simulated. The criteria of observed fog are shown in the last paragraph. Simulated foggy grids are classified based on three criteria (Jia et al., 2019; Zhao et al., 2013): the fog water mixing ratio is over 0.01 g kg−1, Nd is greater than 1 cm−3, and the fog base is touching the ground. The perfect HSS score is 1.0, indicating that simulations are identical to observations. Here, the HSS scores are 0.34 and 0.36 in Fog1 and Fog2, respectively, which are close to those of previous reports (Mecikalski et al., 2008; Xu et al., 2020; Yamane et al., 2010). Therefore, the model generally captures the fog spatial distribution.
Here, we analyse the fog macro- and microphysical characteristics under clean and polluted conditions (Fig. 5). To ensure sufficient sample size for statistical analysis, only data with a fog area fraction larger than 5 % are analysed. The fog area fraction is calculated as the number of foggy grid cells divided by the total number of grids in domain 3. We also test other thresholds, specifically 1 %, 2.5 %, 7.5 %, and 10 % (Fig. S3). The results are similar to those based on the threshold of 5 %.
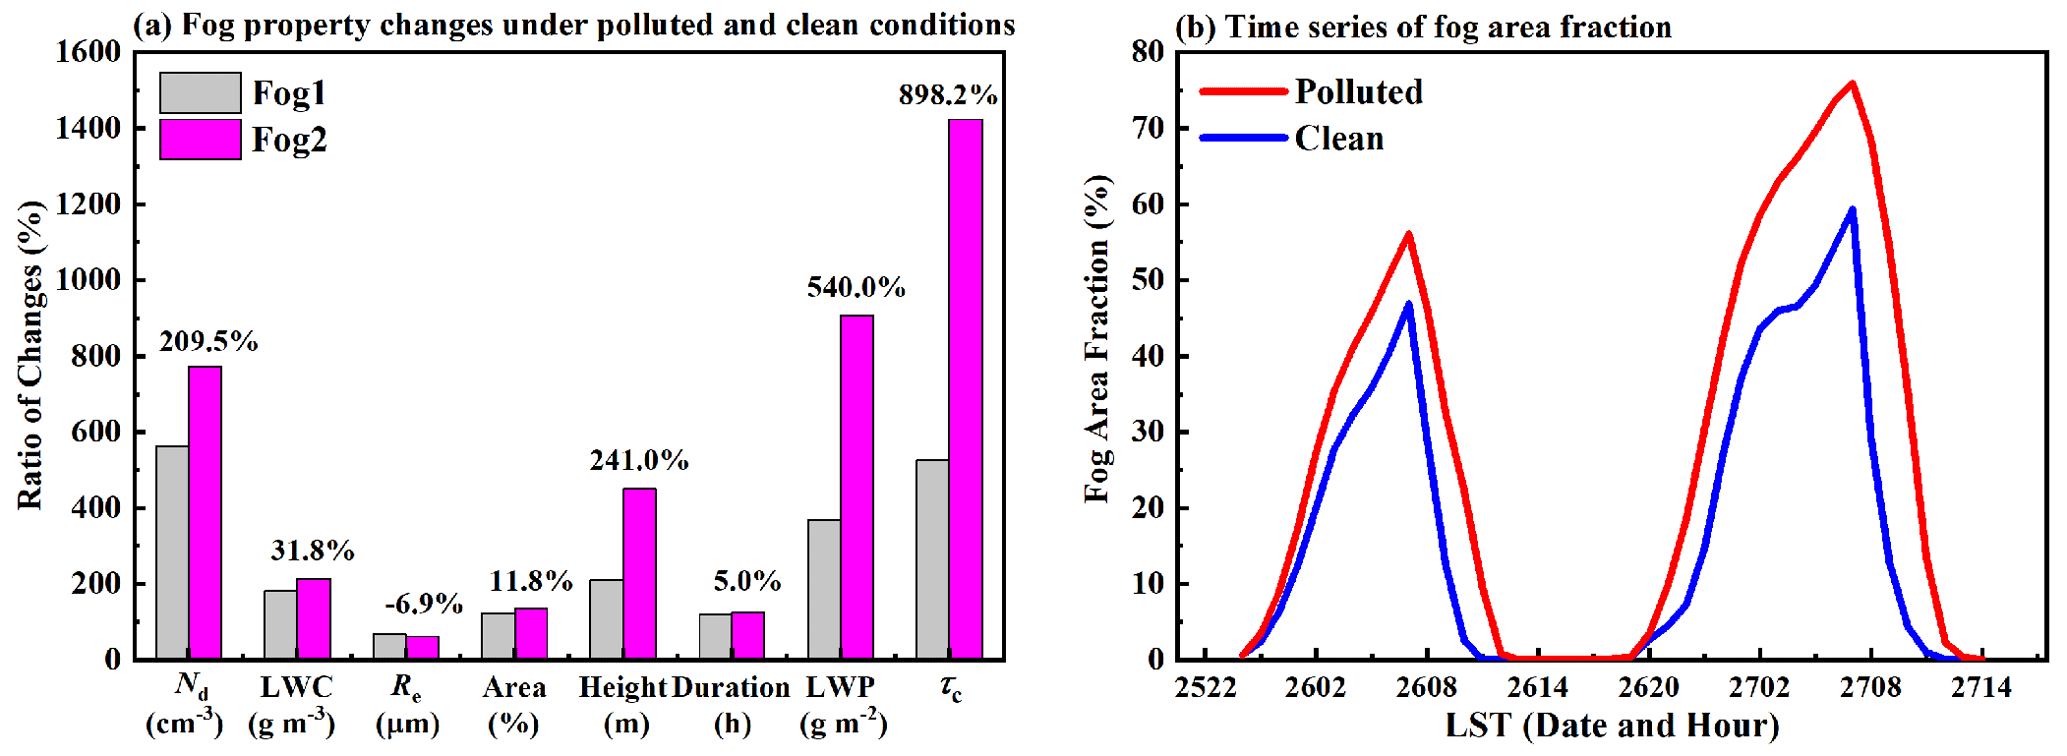
Figure 5(a) Aerosol-induced changes in macro- and microphysical properties during the first fog (Fog1) and the second fog (Fog2) events under polluted and clean conditions. (b) Temporal evolution of fog area fraction under clean and polluted conditions. Nd, LWC, Re, Area, Height, Duration, LWP, and τc indicate fog droplet number concentration, liquid water content, effective radius, fog area fraction, fog-top height, liquid water path, and fog optical depth, respectively. The ratios of changes are calculated by polluted clean in panel (a), which reveals the aerosol-induced changes. The numbers above the bars in panel (a) represent the difference in those ratios of changes between Fog1 and Fog2 (calculated by Fog2 − Fog1). Time “2522” in panel (b) indicates 22:00 LST (Universal Time Coordinated+8 h) on 25 November 2018. The other time expressions follow the same notation.
The ratios of changes between the polluted and clean conditions reveal that high aerosol loading affects fog macro- and microphysical properties in Fog1 and Fog2 (Fig. 5a). Compared to fog microphysics under clean conditions, Nd and LWC in Fog1 increase by, respectively, 463.0 % and 81.7 %; however, Re decreased by 32.1 % under polluted conditions. Furthermore, because of the ACI, Nd and LWC in Fog2 increased by, respectively, 672.4 % and 113.5 %; however, Re decreases by 40.0 %. Therefore, aerosol-induced changes in Fog2 are larger than those in Fog1, as shown in Fig. 5a (Nd: 209.5 %, LWC: 31.8 %, and Re: −6.9 %). Similarly, aerosol-induced changes in fog macrophysics are larger in Fog2. Compared with values under clean conditions, the fog area, fog-top height, and duration in Fog1 increase by, respectively, 23.1 %, 109.6 %, and 20.0 % under polluted conditions; the corresponding values in Fog2 are larger (34.9 %, 350.5 %, and 25.0 %, respectively). In addition, LWP and fog optical depth (τc) exhibit similar trends. With a similar trend between observation and simulation, Fig. S4 shows that aerosol mass concentration is similar before Fog1 and Fog2 formation, and aerosol number concentration before Fog2 is less than that before Fog1 formation. Therefore, changes in aerosol concentration are not the main reason for the increase in aerosol-induced changes in the two fog properties. To determine whether ACI under polluted conditions leads to an increase in aerosol-induced changes in Fog1 and Fog2, we design a sensitivity test called EXP3, as mentioned above. Furthermore, to quantitatively evaluate the strength of ACI in the two fog events, we examine the responses of τc to changes in Nd (Eq. 2) (Ghan et al., 2016):
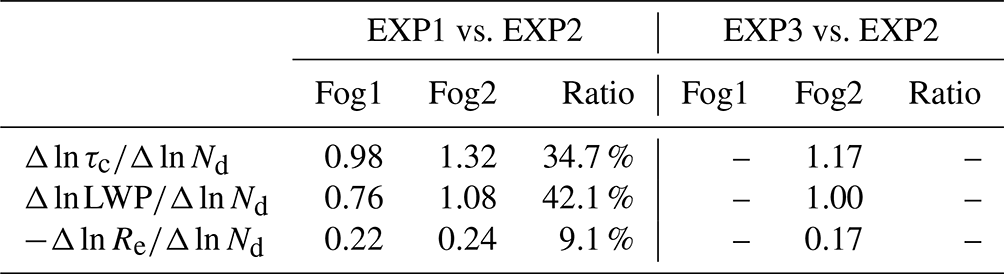
Based on the similar aerosol concentration background (Fig. S4), the responses of τc to changes in Nd quantitatively confirm which fog has stronger ACI. As shown in Table 4, the strength of ACI in Fog2 (1.32) is larger than that in Fog1 (0.98). If Fog1 occurs under clean conditions and Fog2 occurs under polluted conditions (EXP3), ACI in Fog2 is 1.17, which is lower than that in EXP1 (1.32). This implies that high aerosol loading in Fog1 enhances ACI in Fog2. Relative changes in the above properties between Fog1 and Fog2 are calculated as (Fog2 − Fog1) Fog1. The values of , , and are 34.7 %, 42.1 %, and 9.1 % larger in Fog2 than in Fog1, respectively. These numbers quantitatively confirm stronger ACI in Fog2 and indicate that LWP is the dominant factor for enhancing ACI. LWP depends on the fog-top height and LWC. As shown in Fig. 5a, when aerosol loading changes from clean to polluted, the rate of increase in fog-top height in Fog2 (350.5 %) is much larger than that in Fog1 (109.6 %). Although the increase in LWC in Fog2 (113.5 %) is also larger than that in Fog1 (81.7 %), the magnitude of the increase in LWC is smaller than that increase in fog-top height, indicating that ACIs are more sensitive to fog-top height than to LWC.
Table 4Quantitative estimation of ACI strength in two fog events (Fog1 and Fog2), including the responses of fog optical depth (τc), liquid water path (LWP), and fog effective radius (Re) to the changes in fog droplet number concentration (Nd). In EXP1, both fog events occur under polluted conditions, and fog events in EXP2 occur under clean conditions. In EXP3, Fog1 occurs under clean conditions, and Fog2 occurs under polluted conditions. The ratio represents the relative change between Fog1 and Fog2, calculated as (Fog2 − Fog1) Fog1. In the fourth and sixth columns, Fog1 in both EXP2 and EXP3 occurs under clean conditions.
Fog duration is determined by the time of fog formation and dissipation, which is primarily extended because high aerosol loading delays fog dissipation, as reported previously (Jia et al., 2019; Quan et al., 2021). In this study, high aerosol loading not only delays fog dissipation but also promotes earlier fog formation, particularly during Fog2 (Fig. 5b). Fog formation is related to the PBL conditions which are affected by ACI. To investigate the aerosol effect on the Fog2 formation stage, fog spatial distribution during the formation stage from 19:00 to 21:00 LST on 26 November is examined, as shown in Fig. 6. The fog area is rather small at 19:00 LST under both polluted and clean conditions. At 20:00 LST, fog formation is similar under both polluted and clean conditions in grid cells located outside the black box. However, inside the black box, there are several foggy grid cells under polluted conditions. At 21:00 LST, fog area in the black box further expands under polluted conditions. However, there is almost no fog in the black box at 20:00 and 21:00 LST under clean conditions. Therefore, high aerosol loading promotes earlier formation of Fog2, which is primarily caused by meteorological conditions in the PBL inside the black box. In addition, the fog area outside the black box is larger under polluted conditions than under clean conditions, which is mainly related to the stronger turbulence diffusion under polluted conditions. A detailed analysis is presented in Sect. 5.
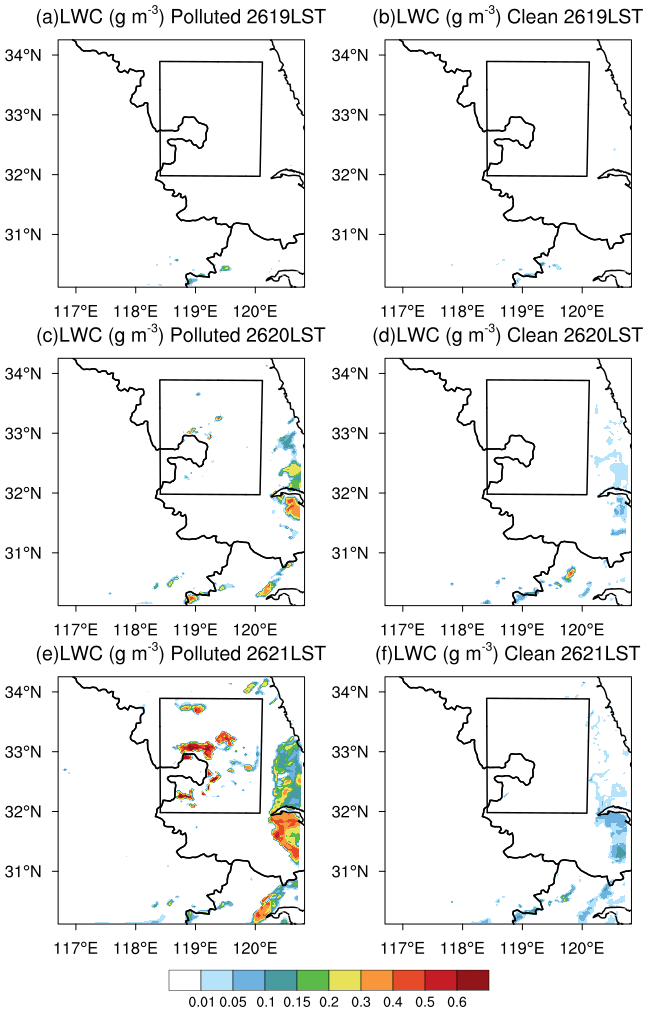
Figure 6Liquid water content (LWC) distribution at the bottom layer from 19:00 to 21:00 LST (Universal Time Coordinated+8 h) on 26 November 2018 under (a, c, e) polluted and (b, d, f) clean conditions. The black box is the area in which Fog2 formed earlier under polluted conditions. Time “2619LST” indicates 19:00 LST on 26 November 2018. The other time expressions follow the same notation.
5.1 More conducive meteorological conditions for Fog2 formation
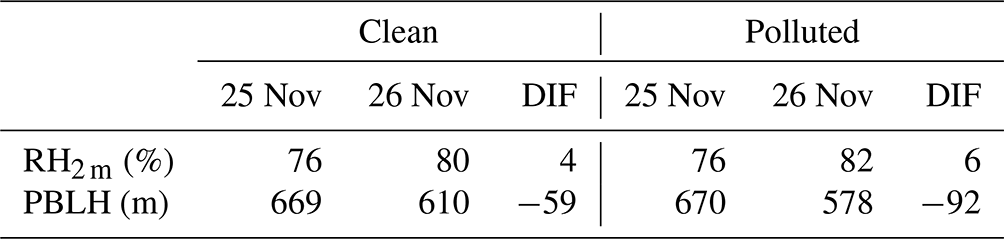
Meteorological conditions in the PBL affect fog formation time and ACI during fog events. As shown in Table 5, under clean conditions, RH2 m before Fog2 formation is higher, and PBL height (PBLH) is lower than that before Fog1 formation in domain 3. Polluted conditions yield similar results. Furthermore, compared with the difference in aerosol-induced changes in RH2 m and PBLH before fog formation, RH2 m increases by 6 % and PBLH decreases by 92 m under polluted conditions, which is larger than under clean conditions (RH2 m: 4 % and PBLH: −59 m). Therefore, high aerosol loading generates meteorological conditions more conducive to Fog2 formation during the two successive fog events.
Table 5Average 2 m relative humidity (RH2 m) and planetary boundary layer height (PBLH) above the ground in domain 3 during 12:00–20:00 LST (Universal Time Coordinated+8 h) on 25 and 26 November 2018 under clean and polluted conditions. DIF is the difference in each property between 25 and 26 November.
To further analyse how high aerosol loading promotes Fog2 formation, we focus on the black box in Fig. 6, as described in Sect. 4 and by Yan et al. (2021). The regional average differences in the total optical depth (τt), downwelling short-wave radiation (SW) at the ground, T2 m, PBLH, RH2 m, and water vapour mixing ratio (Qvbot) at the model bottom layer (8 m) in the black box between polluted and clean conditions are calculated (Fig. 7). Compared with clean conditions, the larger τt (mainly due to larger τc) and delayed fog dissipation in polluted conditions reduce short-wave radiation reaching the ground (from −46 to −121 W m−2) during the Fog1 dissipation time. This leads to a decrease in T2 m (from −0.2 to −1 ∘C) and PBLH (from −42 to −118 m), which further prolongs fog duration (Fig. 7). Notably, Qvbot under polluted conditions is lower than that under clean conditions before the complete dissipation of Fog1 because of reduced fog water evaporation. When the fog dissipates completely, the lower PBLH accumulates more water vapour, increasing Qvbot and RH2 m. The positive feedbacks between ACI and PBL are similar to the feedbacks between high aerosol loading and the PBL reviewed by Z. Li et al. (2017). Furthermore, the feedback mechanism between high aerosol loading and PBL introduced by Zhong et al. (2018) supports the daytime feedbacks between fog and the PBL in the present study. Additionally, aerosol extinction is also considered in τt. Whether aerosol optical depth (AOD) affects PBL significantly should also be discussed. As shown in Table 5, RH2 m and PBLH before Fog1 on 25 November under clean conditions are 76 % and 669 m, respectively, similarly to under polluted conditions (76 % and 670 m, respectively). Therefore, it is unlikely that aerosol–meteorology interaction leads to the meteorological differences in Fig. 7. In addition, a previous study (Yan et al., 2021) also noted that aerosol–fog interaction was more remarkable than aerosol–radiation interaction. Therefore, lower temperature, higher relative humidity, and higher stability result from ACI in Fog1 under polluted conditions, contributing to the earlier formation of Fog2.
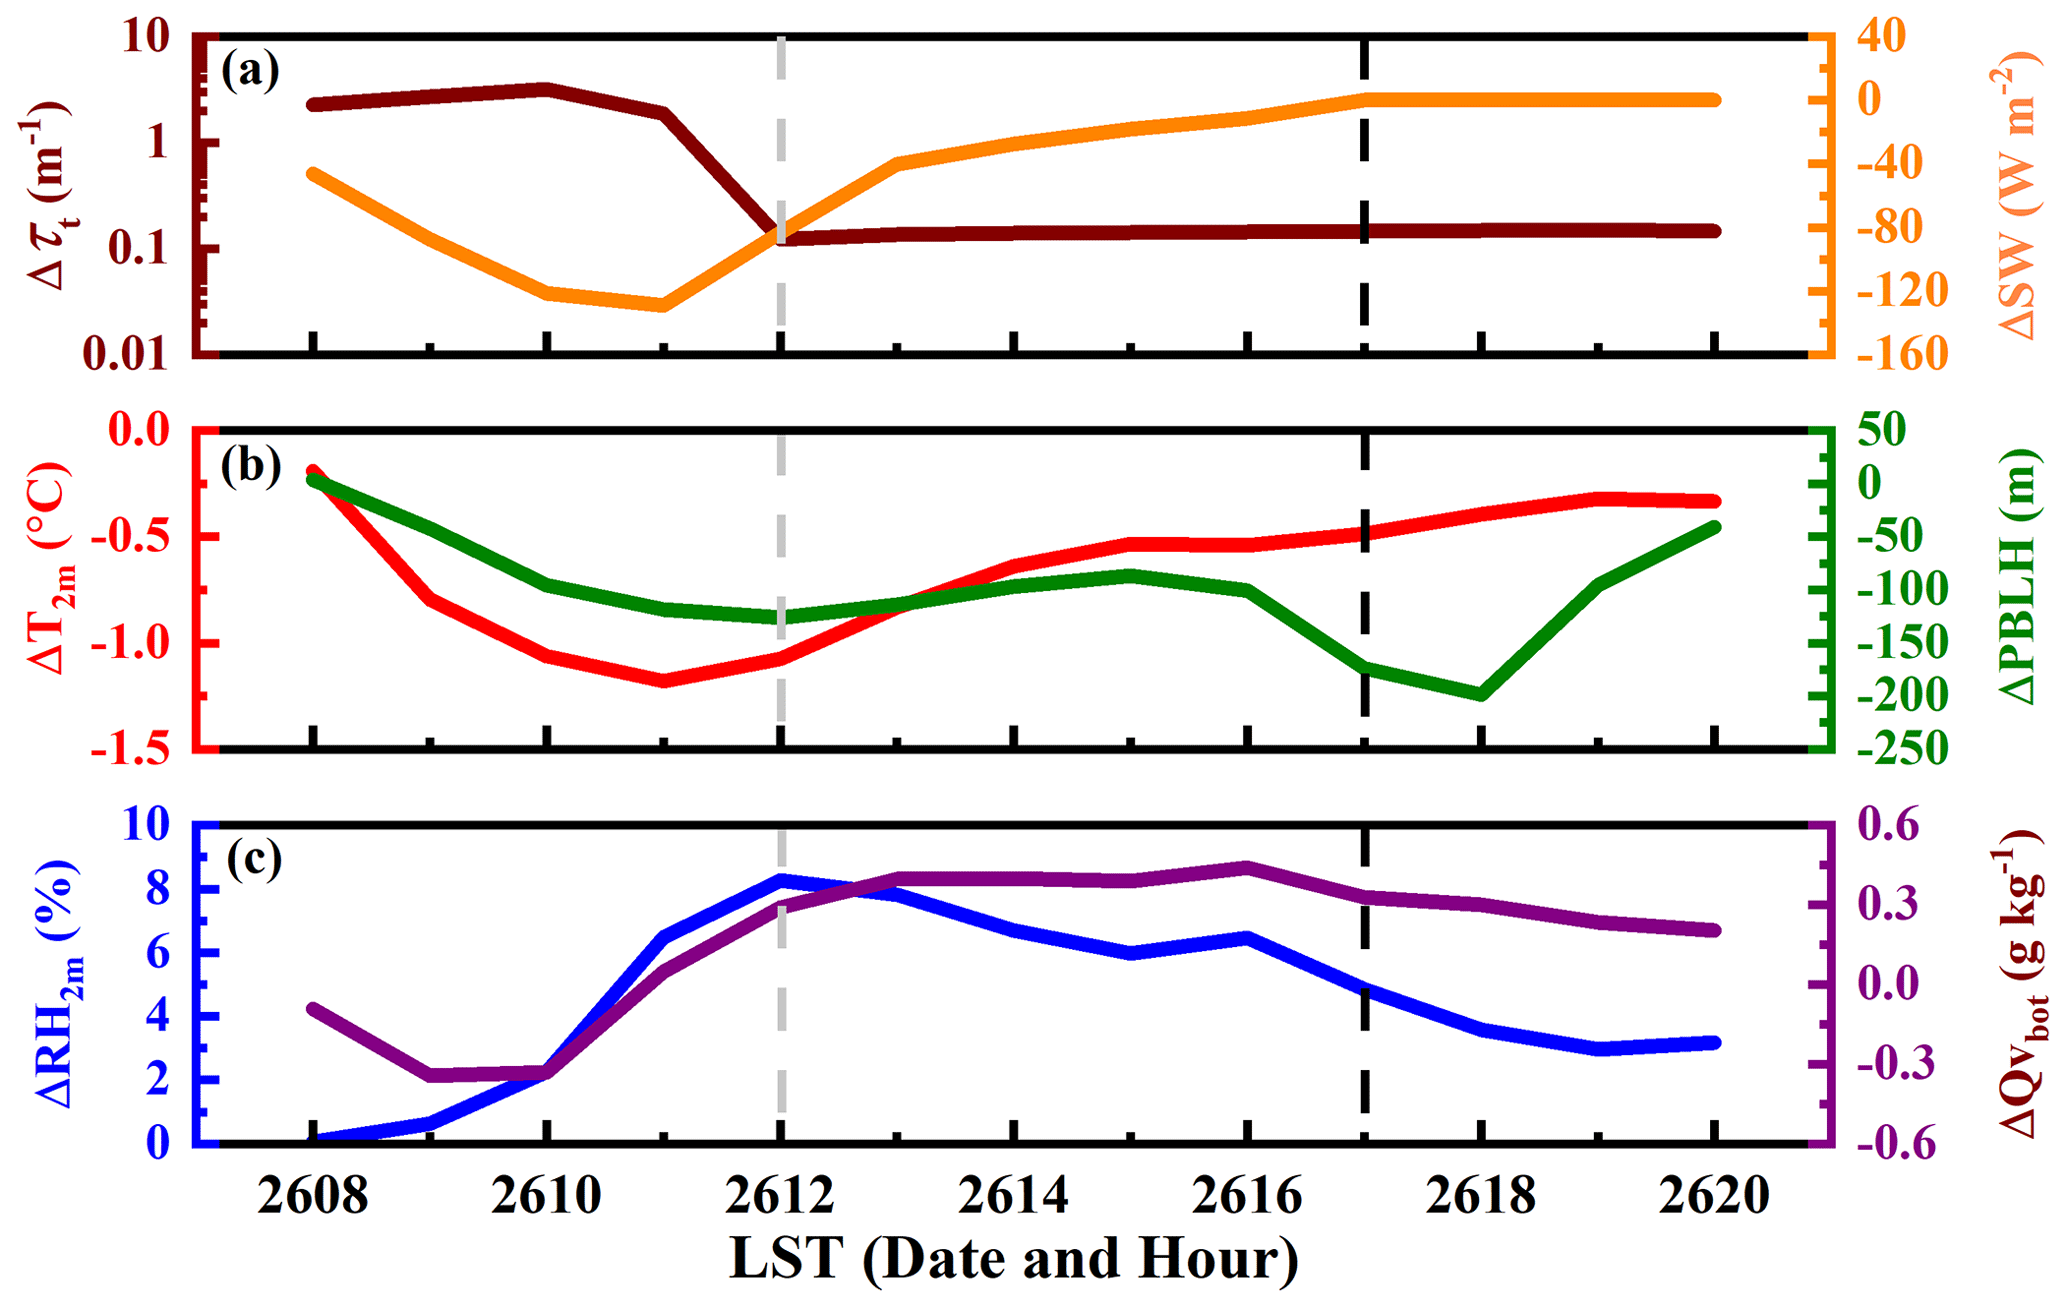
Figure 7Differences in properties between polluted and clean conditions in the black box in Fig. 6, including (a) total optical depth (τt), surface downwelling short-wave radiation (SW), (b) 2 m temperature (T2 m), planetary boundary layer height (PBLH), (c) 2 m relative humidity (RH2 m), and water vapour mixing ratio at the bottom of the model (Qvbot), where τt=τc (fog optical depth) + AOD (aerosol optical depth). The dashed grey line is the time of complete evaporation of Fog1 under polluted conditions. The dashed black line is the time of sunset. Time “2608” indicates 08:00 LST (Universal Time Coordinated+8 h) on 26 November 2018. The other time expressions follow the same notation.
Larger τc and delayed dissipation result in lower temperature, higher relative humidity, and higher stability by affecting solar radiation during the day. How are these conducive conditions maintained after the sunset around 17:00 LST? Figure 8a shows that cold advection is the major reason for the difference in temperature between polluted and clean conditions. We further seek to unveil the reason why cold advection is stronger under polluted conditions. Figure 8b shows a cold centre, with wind diverging outwards. The cold centre is related to lower temperature under polluted conditions due to the larger τc and longer duration in Fog1. Likewise, Steeneveld and De Bode (2018) noted that fog appeared earlier with cold advection. In addition, lower PBLHs induced by high aerosol loading promote the maintenance of higher humidity and stability.
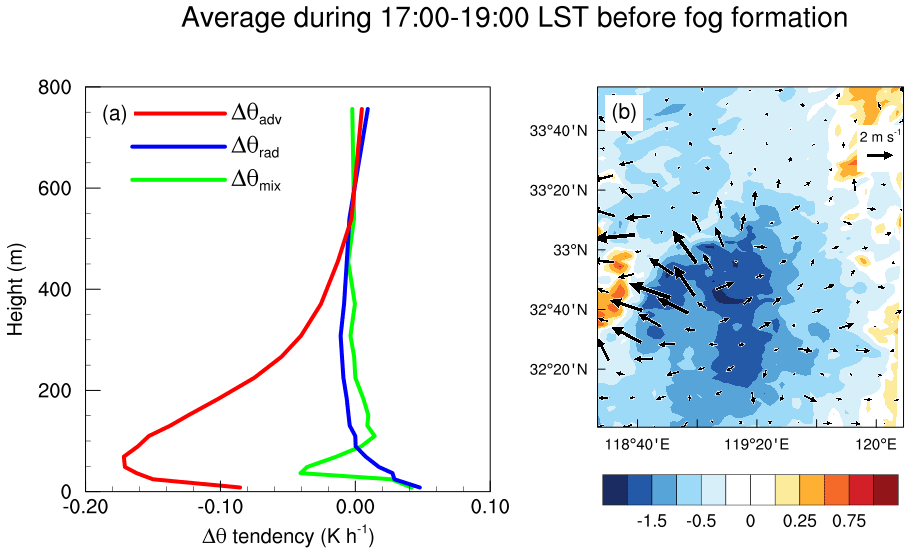
Figure 8(a) Differences (polluted − clean) in terms of contribution to the potential temperature tendency, including radiation (θrad), vertical mixing (θmix), and advection (θadv) in the black box in Fig. 6 before fog formation (17:00–19:00 LST; Universal Time Coordinated+8 h). (b) The shaded area represents the mean temperature difference (polluted − clean), and vectors represent the mean wind vector difference (polluted − clean) at the bottom of the model.
Overall, due to ACI at the Fog1 dissipation stage, the meteorological conditions are more conducive for promoting Fog2 formation. Furthermore, this interaction enhances the feedbacks in the fog physical processes, thus leading to a stronger ACI in Fog2. Details are discussed in Sect. 5.2 and 5.3.
5.2 Feedbacks between microphysics and long-wave cooling
Section 5.1 reveals the mechanism through which ACI in Fog1 leads to meteorological conditions more conducive to Fog2 formation. In Sect. 5.2, we demonstrate how conducive meteorological conditions play a fundamental role in promoting feedbacks between microphysics and long-wave cooling, resulting in a stronger ACI in Fog2.
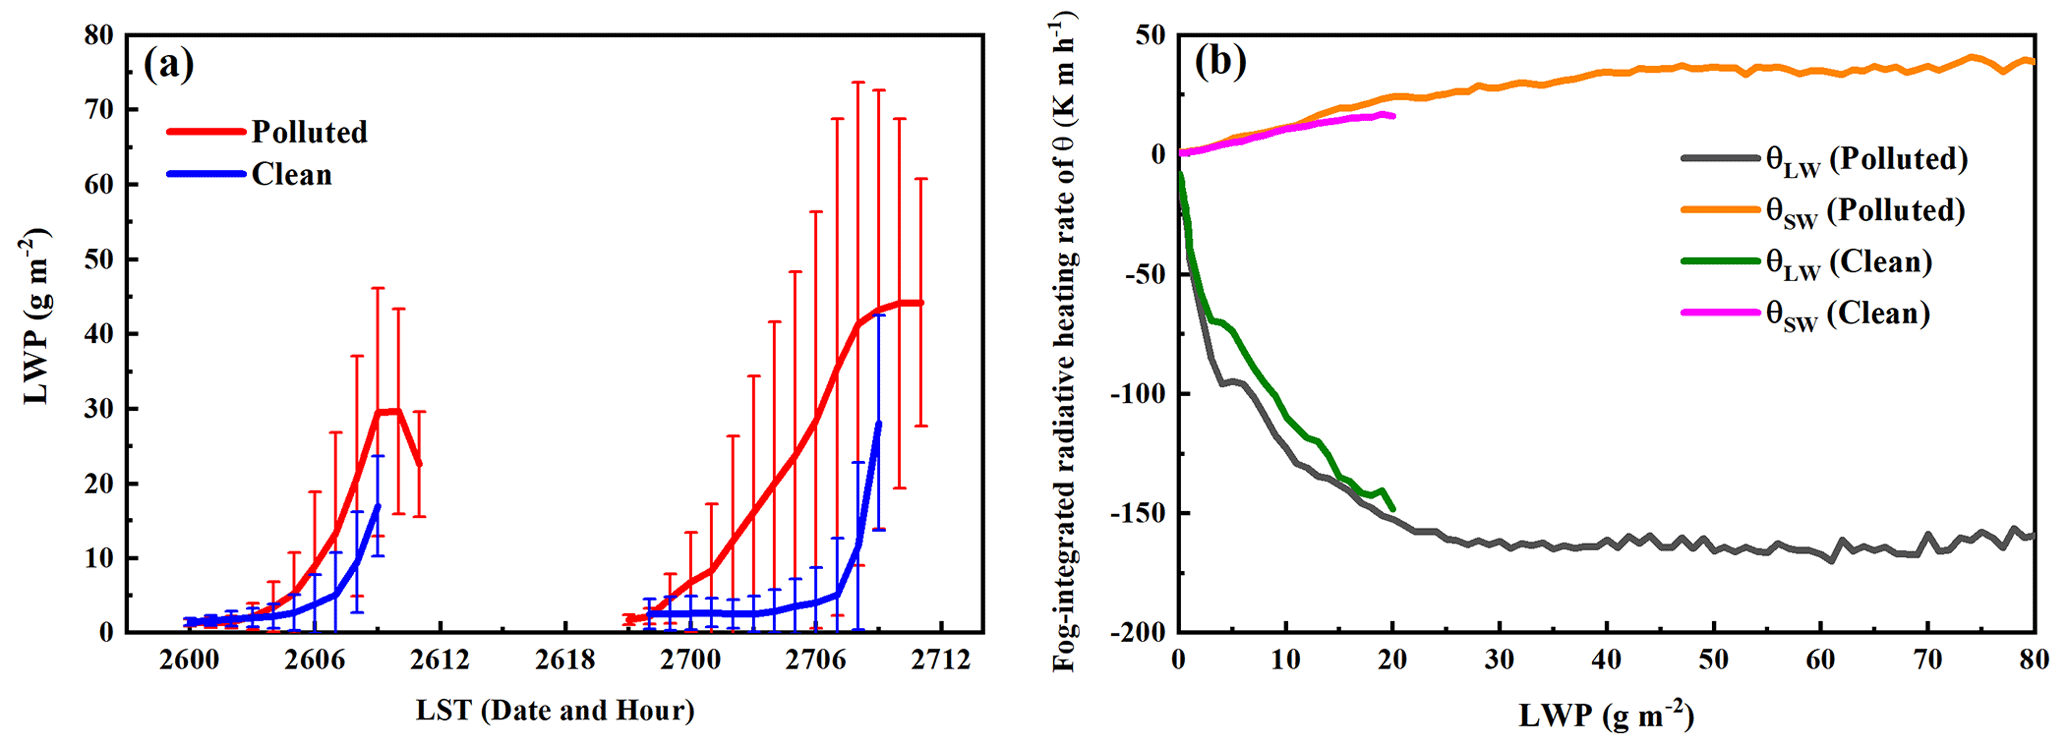
Figure 9(a) The time series of liquid water path (LWP) under polluted and clean conditions. The length of the bar represents standard deviation. (b) Dependence of fog-integrated radiative cooling or heating with LWP under polluted and clean conditions. θLW and θSW represent vertically integrated heating rate of potential temperature (θ) within the fog layer due to long-wave radiation and short-wave radiation, respectively. Time “2512” indicates 12:00 LST (Universal Time Coordinated+8 h) on 25 November 2018. The other time expressions follow the same notation.
As shown in Fig. 5a, aerosol-induced changes in Nd and LWC during Fog2 are larger than those during Fog1 because lower temperature and higher humidity are more conducive for aerosol activation and fog condensation (Petters and Kreidenweis, 2007; Simmel and Wurzler, 2006). Owing to competition for available water vapour (Mazoyer et al., 2022; Yum and Hudson, 2005), Re in Fog2 is smaller than that in Fog1. As shown in Fig. 9a, LWP is larger under polluted conditions than under clean conditions, particularly for Fog2. The average LWPs in Fog1 and Fog2 under polluted conditions are 11.6 and 24.3 g m−2, respectively. When LWP is less than 20 g m−2, vertically integrated long-wave cooling and short-wave heating are stronger under polluted conditions than under clean conditions (Fig. 9b). This is similar to the results from Petters et al. (2012) and Prabhakaran et al. (2023). Because Nd shows a similar trend with LWP (Fig. S5), the dependence of heating and cooling rates on droplet concentration is consistent with the results based on LWP. Additionally, increased τc in Fog2 triggers stronger positive feedbacks between microphysics and long-wave cooling, further enhancing cooling, activation, and condensation and thereby increasing Nd and LWC. Jia et al. (2019) emphasised that high aerosol loading promoted these positive feedbacks. This study further highlights the synergistic effects of high aerosol loading and meteorological conditions on the enhancement of positive feedbacks, which promotes ACI in Fog2.
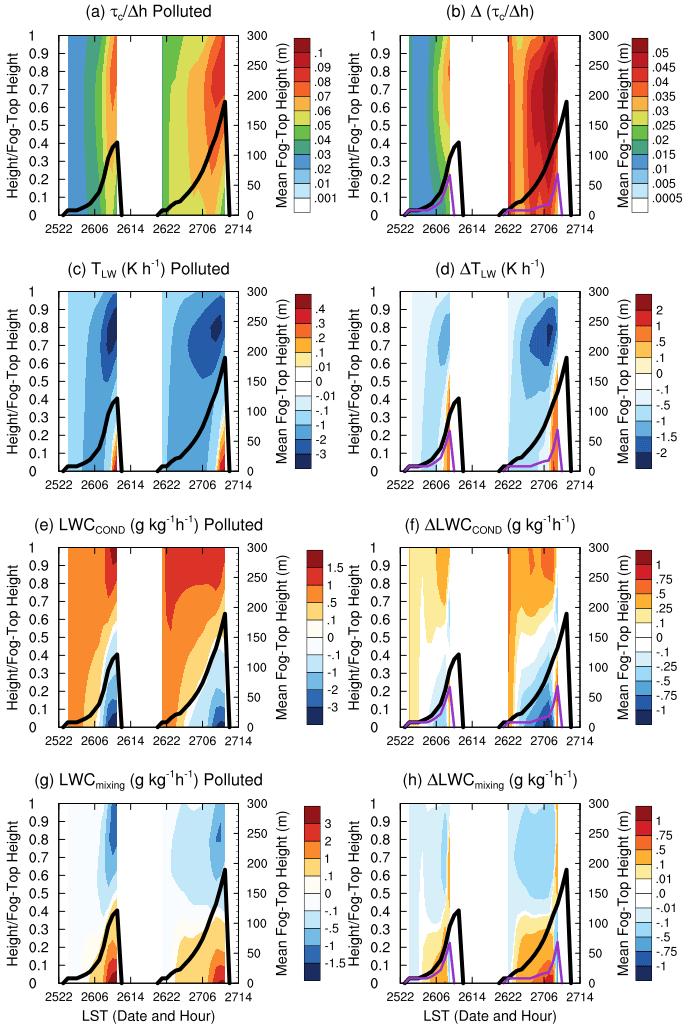
Figure 10Time–height profiles of (a–b) average extinction coefficient through the fog layers, which is fog optical depth (τc) per unit height (h), (c–d) radiative cooling rate (TLW), (e–f) condensation growth rate (LWCCOND), and (g–h) liquid water content tendency due to vertical mixing (LWCmixing). Heights on the left axes are normalised by the fog-top heights, and the left axes are mean fog-top heights. The left column represents polluted conditions, and the right column represents the difference (polluted − clean). Black and purple lines are the mean fog-top heights under polluted and clean conditions, respectively. Time “2522” indicates 22:00 LST (Universal Time Coordinated+8 h) on 25 November 2018. The other time expressions follow the same notation.
To better understand how the above positive feedbacks affect ACI, Fig. 10 presents the average extinction coefficient through the fog, that is, τc per unit height (); radiative cooling rate (TLW); condensational growth rate (LWCCOND); and LWC tendency due to vertical mixing (LWCmixing) in the two successive fog events. Radiative cooling is the strongest near the fog top and weakest near the fog base (Ducongé et al., 2020; Mazoyer et al., 2017; Wærsted et al., 2017). Consequently, LWCCOND and LWCmixing both follow similar profiles in response to radiative cooling. Therefore, if the vertical profiles of the three terms use absolute height, they will be distorted. To overcome this problem, physical quantities are normalised by the fog-top height. Compared with those in Fog1, a larger extinction coefficient (Fig. 10a–b), stronger long-wave radiative cooling (Fig. 10c–d), and more condensation (Fig. 10e–f) near the fog top are noted in Fog2 because of the conducive conditions for Fog2 formation, which further increases LWC, fog-top height in Fog2 (black and purple lines), as well as LWP. Enhancement of these parameters indicates that the feedbacks between microphysics and long-wave cooling are stronger in Fog2 than in Fog1. As a result, ACI is stronger in Fog2 than in Fog1 due to favourable PBL conditions caused by ACI in Fog1. In addition, as shown in Fig. 10g–h, vertical mixing transports fog water from the fog top to the fog base, and the strength of this transportation is stronger in Fog2 than in Fog1 because of stronger turbulent kinetic energy (TKE) in Fog2. The effect of TKE on fog is analysed in Sect. 5.3.
5.3 Feedbacks between macrophysics, radiation, and turbulence
Section 5.2 analyses the microphysics-related mechanisms underlying a stronger ACI in Fog2. This subsection not only focuses on macrophysics and its feedbacks with radiation and turbulence but also discusses how the combined effects of high aerosol loading and meteorological conditions impact the feedbacks and enhance ACI in Fog2 compared with those in Fog1. Briefly, fog macrophysics involves duration and distribution. The reason why the duration of Fog2 is longer than that of Fog1 is due to the earlier formation of Fog2, which is induced by meteorological conditions more conducive to Fog2 formation, as discussed in Sect. 5.1. The reason for the wider distribution (fog-top height and fog area) is discussed here.
5.3.1 Effects of macrophysics on radiation
Meteorological conditions more conducive to Fog2 formation and ACI promote condensation near the fog top (Fig. 10d, f), thereby raising the fog-top height in Fog2 compared with that in Fog1 (black and purple lines in Fig. 10). Therefore, both fog-top height and τc in Fog2 are higher than those in Fog1. Compared with that in Fog1, the higher τc in Fog2 enhances cooling near the fog top and downwelling long-wave radiation, weakening the cooling at the fog base compared to near the fog top (Fig. 10c). Additionally, the horizontal distribution of Fog2 is wider than that of Fog1 (Fig. 5b). Therefore, more foggy grid cells show more radiative cooling near the fog top and downwelling long-wave radiation at the fog base in Fog2.
5.3.2 Effects of radiation on turbulence
The above analysis reveals the mechanism underlying the effects of meteorology and ACI on radiation in fog. How does radiation affect stability and turbulence (i.e. TKE)? To answer this question, we must know the dominant factors contributing to TKE, as described in the following TKE budget equation:
where is the TKE tendency with time (Fig. 11b), and the four terms on the right side of Eq. (3) are contributors to TKE, including wind shear (Fig. 11c), buoyancy (Fig. 11d), dissipation (Fig. 11e), and vertical mixing (Fig. 11f). Detailed equations of these contributions to TKE are provided in the Supplement (Eqs. S7–S10) (Nakanishi and Niino, 2009).
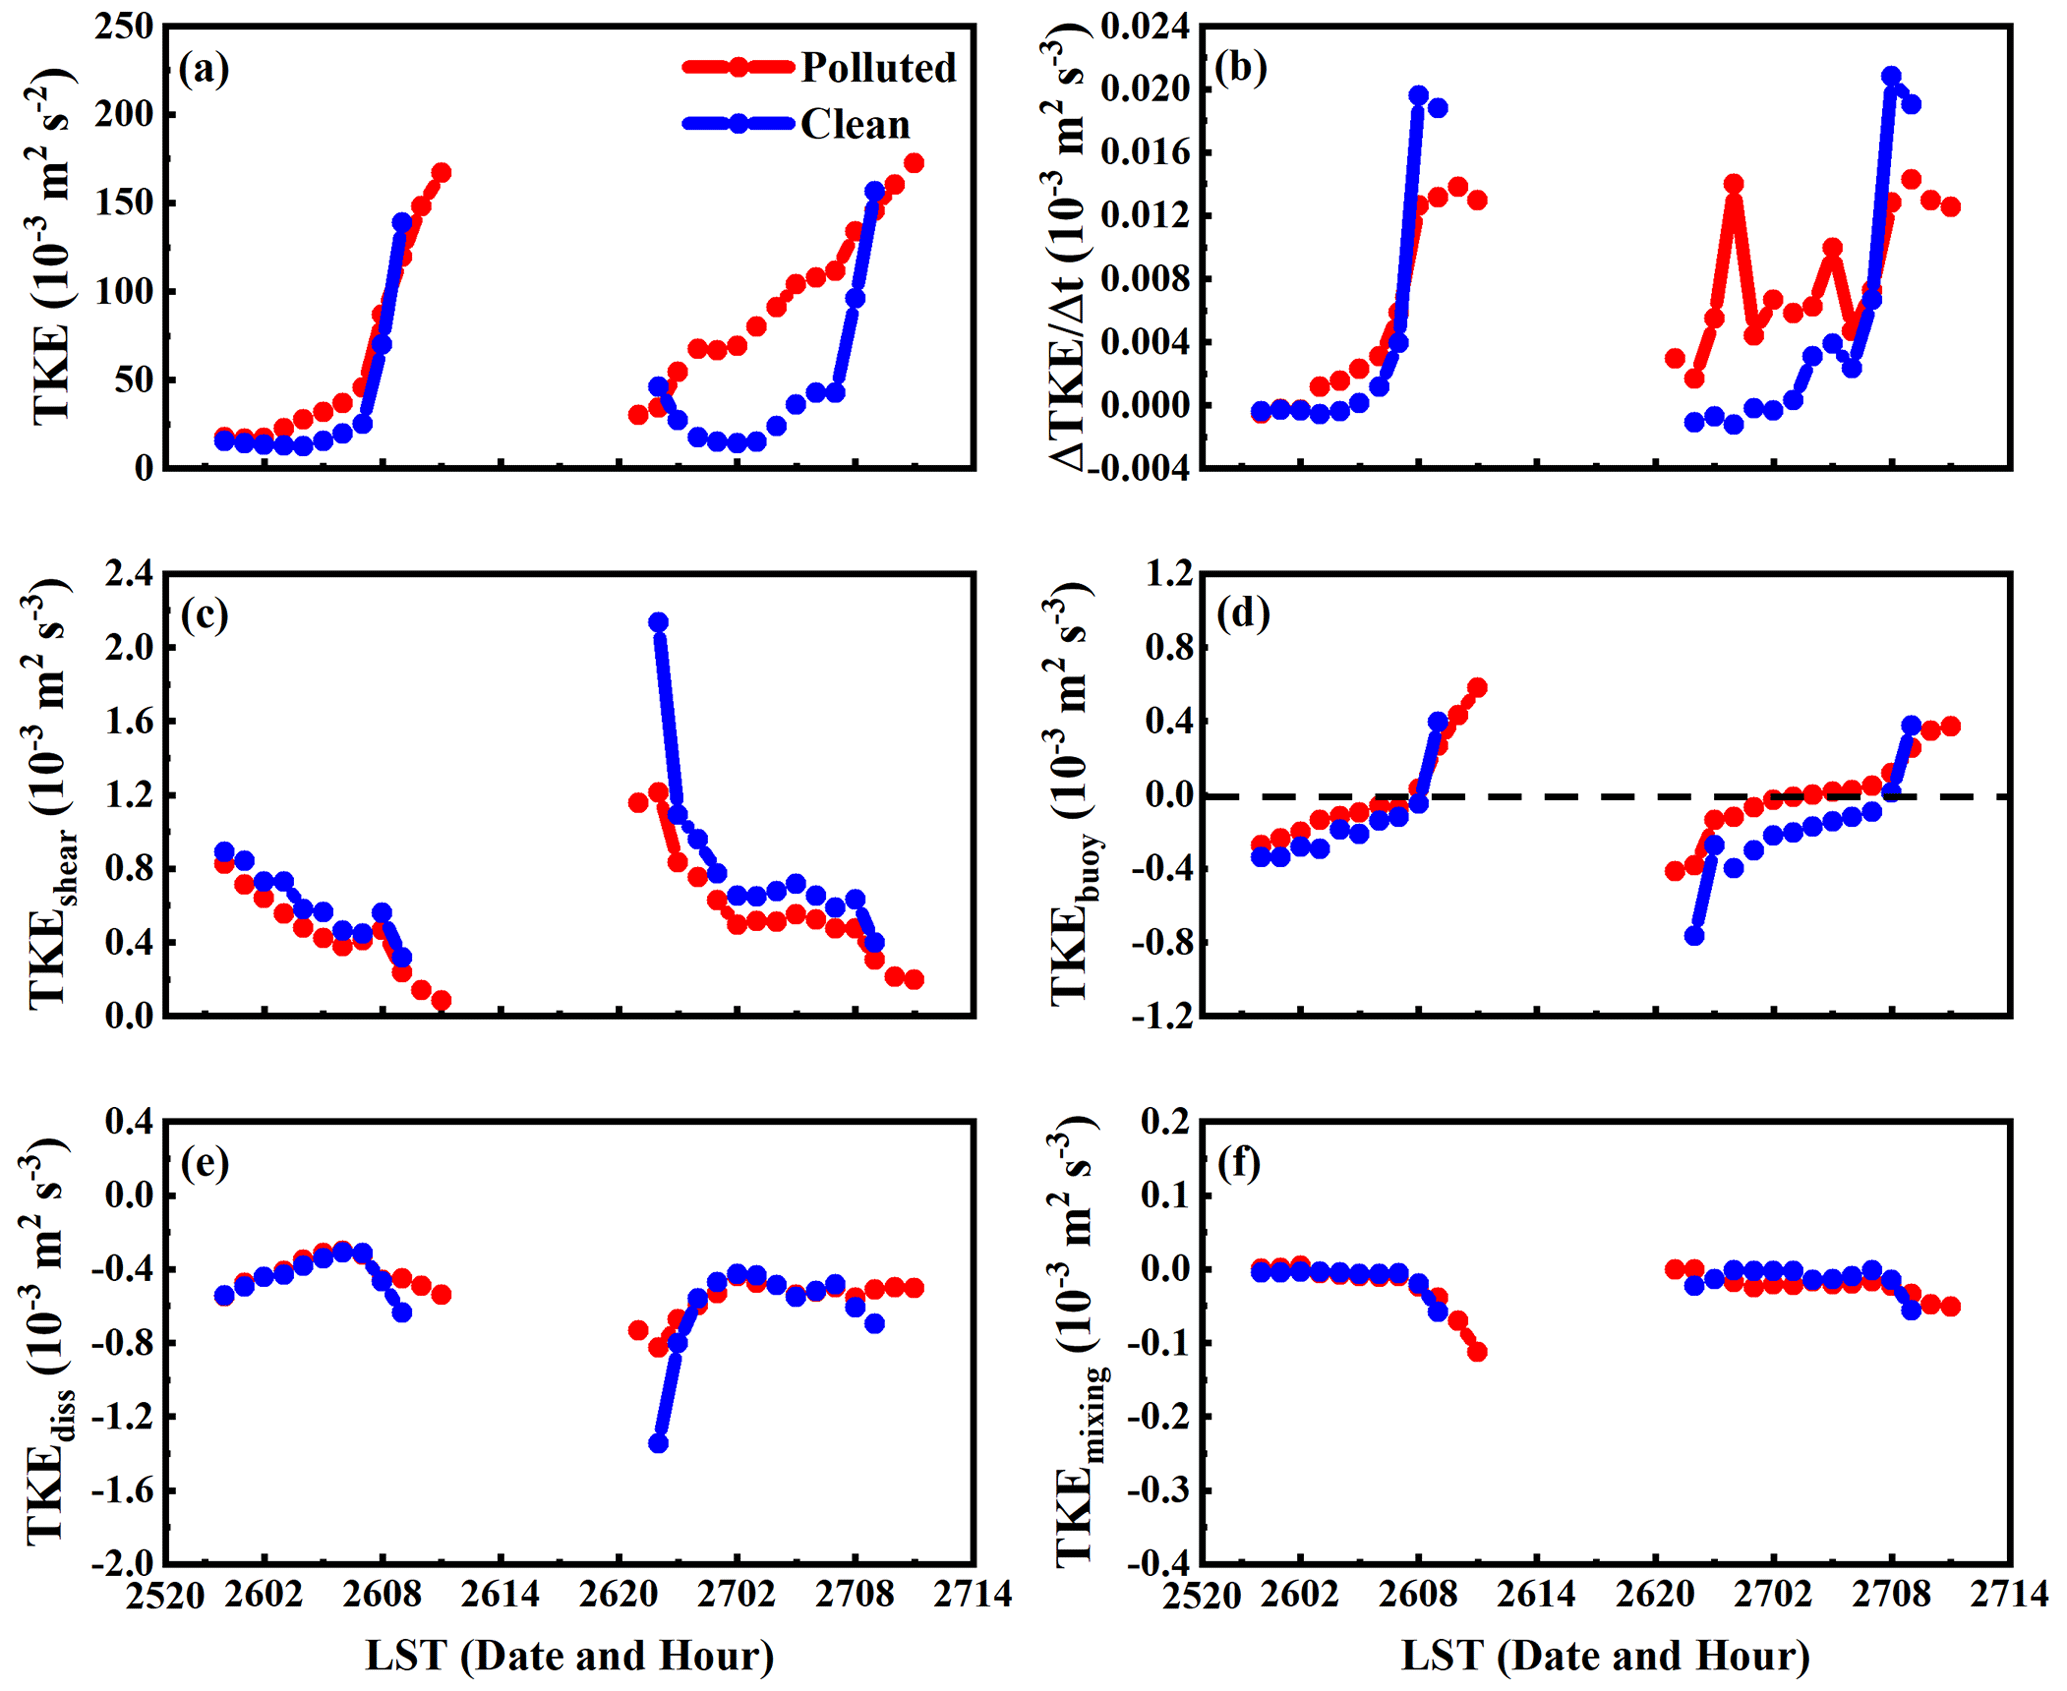
Figure 11(a) Temporal evolution of turbulent kinetic energy (TKE), (b) TKE tendency, (c) wind shear term (TKEshear), (d) buoyancy term (TKEbuoy), (e) dissipation term (TKEdiss), and (f) vertical mixing terms (TKEmixing) under polluted and clean conditions. The dashed line represents the zero line for TKEbuoy. Time “2522” indicates 22:00 LST (Universal Time Coordinated+8 h) on 25 November 2018. The other time expressions follow the same notation.
As shown in Fig. 11a, TKE in Fog2 is stronger than that in Fog1, particularly under polluted conditions. Since the vertical mixing term is 1 order of magnitude smaller than the others, it is negligible (Fig. 11f). At night, only the shear term is positive, and it is therefore the main contributor to TKE (Fig. 11c), consistent with the speculations of Kim and Yum (2012). However, the dominant term driving the differences in TKE between polluted and clean conditions is buoyancy (Fig. 11d). As shown in Fig. 11b, is larger under polluted conditions than under clean conditions. Meanwhile, the shear term is smaller, but the buoyancy term is larger under polluted conditions than under clean conditions, and the dissipation term is similar between the two conditions. Therefore, the buoyancy term is the main factor that increases TKE under polluted conditions, corroborating the qualitative speculations by Jia et al. (2019). This is particularly true for Fog2. In addition, during the daytime, is weaker under polluted conditions because higher τc reduces short-wave radiation reaching the surface. These results are consistent with the higher stability during the dissipation stage under polluted conditions, as described in Sect. 5.1.
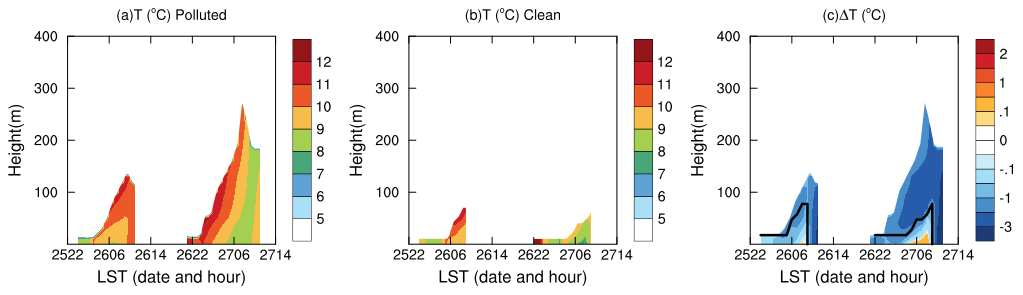
Figure 12Time–height profiles of in-fog temperature (T) under (a) polluted and (b) clean conditions. (c) Difference between polluted and clean conditions. The Black line on the right side represents the maximal fog-top height under clean conditions. Time “2522” indicates 22:00 LST (Universal Time Coordinated+8 h) on 25 November 2018. The other time expressions follow the same notation.
After confirming the importance of the buoyancy term, we analyse the effect of radiation on buoyancy and then on TKE. Buoyancy contributions to TKE are determined by temperature inversion in the PBL during the night. As shown in Fig. 12a–b, temperature inversion is close to the surface. With the effect of ACI, much stronger radiative cooling leads to a more rapid temperature drop at the fog top than at the fog base (Fig. 12c), thereby causing weaker temperature inversion under polluted conditions. Therefore, stability is weaker, and TKE is larger under polluted conditions, particularly in Fog2.
5.3.3 Effects of turbulence on macrophysics
Previous observations (Liu et al., 2010; Román-Cascón et al., 2016) and large eddy simulations (Bergot, 2013; Mazoyer et al., 2017; Nakanishi, 2000) showed that turbulence could increase the fog-top height. In this study, we note that increasing TKE increases fog-top height (black and purple lines in Fig. 10) and fog area (Fig. 5b), which is consistent with the observations of Jia et al. (2019) and Quan et al. (2021). The increased fog-top height increases TKE by promoting radiative cooling near the fog top and weakening temperature inversion. This reflects the feedbacks between macrophysics, radiation, and turbulence. Overall, owing to meteorological conditions more conducive to Fog2 formation, the feedbacks are stronger in Fog2 than in Fog1.
To explore the interactions between the PBL and ACI, as well as their effects on fog properties, WRF-Chem 4.1.3 is used to simulate two successive radiation fog events that occurred in the northern YRD region in China on 26 and 27 November 2018. Two fog event simulations (Fog1 and Fog2) reproduce well the observed results.
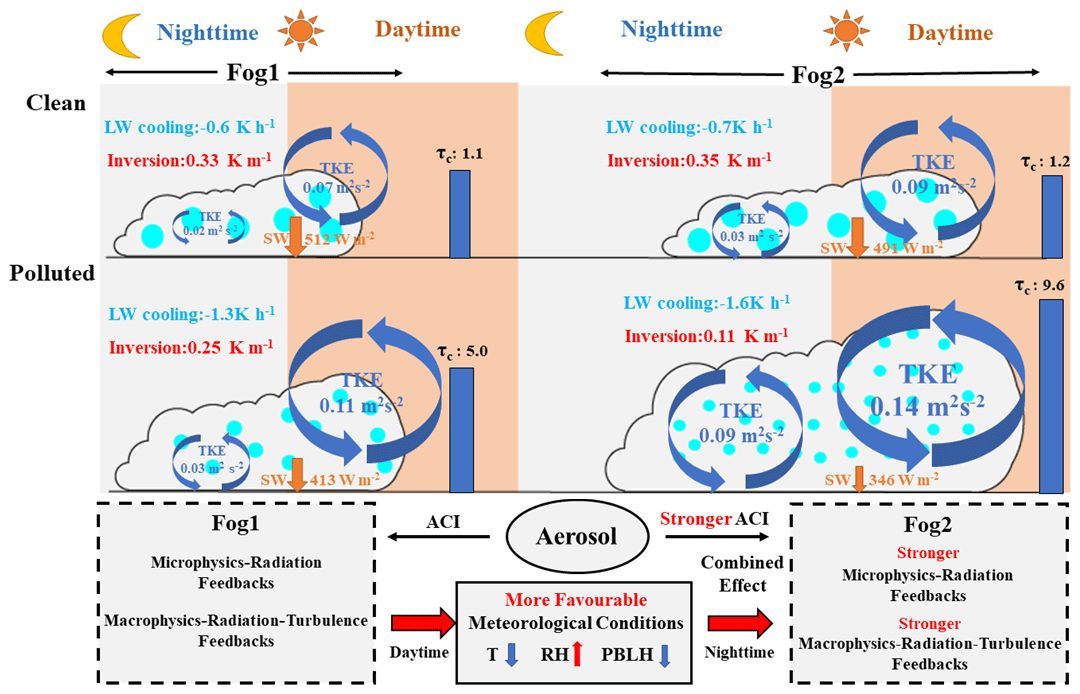
Figure 13Conceptual image of interactions between aerosol–fog interaction (ACI) and the planetary boundary layer (PBL). τc, SW, LW, TKE, T, RH, and PBLH stand for fog optical depth, short-wave radiation, long-wave radiation, turbulent kinetic energy, temperature, relative humidity, and planetary boundary layer height, respectively. LW and inversion are calculated during the night, and τc is calculated during the day.
The results show higher LWC, higher Nd, smaller Re, higher fog-top height, longer duration, wider spatial distribution, higher LWP, and higher τc under polluted conditions than under clean conditions. Aerosol-induced changes in micro- and macro-physical properties are more significant in Fog2 than in Fog1. When Fog1 occurs under clean conditions, the response of Fog2 to high aerosol loading becomes weaker. Therefore, ACI with high aerosol loading in Fog1 promotes aerosol-induced changes in Fog2. A conceptual diagram is proposed to describe the mechanism of fog property changes, as well as ACI evolution, during two successive radiation fog events (Fig. 13). Moreover, the mechanisms of changes in fog properties and ACI evolution are discussed based on the synergistic effects of aerosols and meteorological conditions. The microphysics–radiation feedbacks and macrophysics–radiation–turbulence feedbacks delay Fog1 dissipation, generating more conducive conditions for promoting the earlier formation of Fog2. Furthermore, the microphysics–radiation feedbacks and macrophysics–radiation–turbulence feedbacks are strengthened in Fog2 due to the conditions that are more conducive to Fog2 formation, enhancing ACI in Fog2 compared with that in Fog1. Detailed mechanisms are summarised below, including meteorological conditions and the two types of feedbacks.
First, meteorological conditions before Fog2 formation are more conducive than those before Fog1 formation; these conditions play a fundamental role in changing fog properties and enhancing ACI during the two fog events. This is related to the delayed dissipation of Fog1 induced by τc. During Fog1 dissipation (daytime), the cooling effect caused by the higher τc contributes to the lower temperature, higher relative humidity, and higher stability. At night, cold advection near the ground is enhanced. Meanwhile, the temperature remains low, forming a cold centre, due to low daytime temperatures. Moreover, the surface wind diverges outwards from the cold centre, strengthening the cold advection. Ultimately, the meteorological conditions induced by high aerosol loading are more conducive for promoting the earlier formation and a longer duration of Fog2 than of Fog1.
Second, the positive feedbacks between microphysics and radiative cooling are crucial physical mechanisms for changing fog properties and enhancing ACI. In Fog2, high aerosol loading and more conducive meteorological conditions synergistically promote fog microphysics. Lower temperature and higher relative humidity promote aerosol activation and condensation. Consequently, Nd, LWP, and τc are higher, whereas Re is smaller in Fog2 than in Fog1. Radiative cooling and heating within the fog layer depend on LWP and Nd. When LWP in fog is less than 20 g m−2, higher aerosol loading enhances vertically integrated cooling and heating in optically thin fog. These variations in microphysics lead to stronger long-wave radiative cooling and condensational growth near the top of Fog2. Therefore, the positive feedbacks between microphysics and radiation are stronger in Fog2, which further promotes stronger ACI.
Finally, the feedbacks between fog macrophysics, radiation, and turbulence affect fog properties. Under polluted conditions, the higher fog top strengthens the fog-top long-wave radiative cooling and then reduces the strength of temperature inversion near the surface and enhances turbulence. Stronger turbulence further increases the fog-top height and fog area. Because of meteorological conditions more conducive to Fog2 formation, the feedbacks are stronger in Fog2 than in Fog1, contributing to the enhancement of ACI.
This study focuses on a 2 d radiation fog event in the Yangtze River Delta, China, which has a large population. The conclusions are expected to be applicable to radiation fog events in this region and other regions with similar human activities. It would be interesting to see if similar conclusions can be found in other fog types (e.g. advection fog) in other regions (e.g. ocean). Furthermore, there are large uncertainties in the aerosol–cloud interaction (Fan et al., 2016; Guo et al., 2018; Rosenfeld et al., 2019; Seinfeld et al., 2016; Zhu and Penner, 2020; Zhu et al., 2019b). The findings of our study offer novel insights into the potential involvement of mechanisms responsible for the evolution of ACI, particularly for stratus, which is similar to fog.
The ground air quality data were from https://quotsoft.net/air/ (China National Environmental Monitoring Center, 2014). The MEIC inventory was from http://meicmodel.org.cn/?page_id=2351&lang=en#firstPage (MEIC Team, 2012). The FNL data were adopted from https://doi.org/10.5065/D6M043C6 (National Centers for Environmental Prediction et al., 1999). The meteorological data were from http://data.cma.cn/en (China Meteorological Data Service Center, 2018). The Himawari-8 cloud product data were from https://www.eorc.jaxa.jp/ptree/index.html (Japan Meteorological Agency, 2018). The WRF-Chem source code can be downloaded from https://github.com/wrf-model/WRF/releases/tag/v4.1.3 (Skamarock et al., 2019). Data, model outputs and codes can be accessed by contacting Chunsong Lu via luchunsong110@gmail.com.
The supplement related to this article is available online at: https://doi.org/10.5194/acp-23-9873-2023-supplement.
NS performed the data analysis, model simulation, and article writing. CL proposed the idea, supervised the work, and revised the article. XJ and YW both took part in revising the article and gave suggestions. Ground-based observation data were provided by XJ and DL. YL supervised the analysis of the turbulence kinetic energy budget. TZ supported the work on anthropogenic emissions driven by the Multiresolution Emission Inventory for China (MECI). SN provided financial support. NS prepared the article with help from YY, BZ, SF, SY, and JL.
The contact author has declared that none of the authors has any competing interests.
Publisher’s note: Copernicus Publications remains neutral with regard to jurisdictional claims in published maps and institutional affiliations.
This article was supported by the National Key Scientific and Technological Infrastructure project “Earth System Science Numerical Simulator Facility” (EarthLab), and we acknowledge the High Performance Computing Centre of Nanjing University of Information Science & Technology for their support of this work. I would like to express my gratitude to all the editors and reviewers. Their suggestions have elevated the quality of the article.
This research has been supported by the National Natural Science Foundation of China (grant nos. 42027804, 41775134, 41975181, and 42205072) and the Science and Technology Planning Project of Gansu Province (grant no. 22JR5RA445).
This paper was edited by Graham Feingold and reviewed by two anonymous referees.
Abdul-Razzak, H.: A parameterization of aerosol activation 3. Sectional representation, J. Geophys. Res., 107, 4026, https://doi.org/10.1029/2001jd000483, 2002.
Ackerman, A. S., Kirkpatrick, M. P., Stevens, D. E., and Toon, O. B.: The impact of humidity above stratiform clouds on indirect aerosol climate forcing, Nature, 432, 1014–1017, https://doi.org/10.1038/nature03174, 2004.
Barnston, A. G.: Correspondence among the Correlation, RMSE, and Heidke Forecast Verification Measures; Refinement of the Heidke Score, Weather Forecast., 7, 699–709, https://doi.org/10.1175/1520-0434(1992)007<0699:catcra>2.0.co;2, 1992.
Bergot, T.: Small-scale structure of radiation fog: a large-eddy simulation study, Q. J. Roy. Meteor. Soc., 139, 1099–1112, https://doi.org/10.1002/qj.2051, 2013.
Bessho, K., Date, K., Hayashi, M., Ikeda, A., Imai, T., Inoue, H., Kumagai, Y., Miyakawa, T., Murata, H., and Ohno, T.: An introduction to Himawari-8/9 – Japan's new-generation geostationary meteorological satellites, J. Meteorol. Soc. Jpn. Ser. II, 94, 151–183, https://doi.org/10.2151/jmsj.2016-009, 2016.
Boutle, I., Price, J., Kudzotsa, I., Kokkola, H., and Romakkaniemi, S.: Aerosol–fog interaction and the transition to well-mixed radiation fog, Atmos. Chem. Phys., 18, 7827–7840, https://doi.org/10.5194/acp-18-7827-2018, 2018.
Boylan, J. W. and Russell, A. G.: PM and light extinction model performance metrics, goals, and criteria for three-dimensional air quality models, Atmos. Environ., 40, 4946–4959, https://doi.org/10.1016/j.atmosenv.2005.09.087, 2006.
Chaboureau, J.-P. and Bechtold, P.: A Simple Cloud Parameterization Derived from Cloud Resolving Model Data: Diagnostic and Prognostic Applications, J. Atmos. Sci., 59, 2362–2372, https://doi.org/10.1175/1520-0469(2002)059<2362:ascpdf>2.0.co;2, 2002.
China Meteorological Data Service Center: Observation Data From Automated Weather Stations In China, China Meteorological Administration [data set], http://data.cma.cn/en (last access: 30 August 2023), 2018.
China National Environmental Monitoring Center: National Air Quality Monitoring Data, the Ministry of Environmental Protection [data set], https://quotsoft.net/air/ (last access: 30 August 2023), 2014.
Ding, Q., Sun, J., Huang, X., Ding, A., Zou, J., Yang, X., and Fu, C.: Impacts of black carbon on the formation of advection–radiation fog during a haze pollution episode in eastern China, Atmos. Chem. Phys., 19, 7759–7774, https://doi.org/10.5194/acp-19-7759-2019, 2019.
Ducongé, L., Lac, C., Vié, B., Bergot, T., and Price, J. D.: Fog in heterogeneous environments: the relative importance of local and non-local processes on radiative-advective fog formation, Q. J. Roy. Meteor. Soc., 146, 2522–2546, https://doi.org/10.1002/qj.3783, 2020.
Fan, J., Wang, Y., Rosenfeld, D., and Liu, X.: Review of Aerosol–Cloud Interactions: Mechanisms, Significance, and Challenges, J. Atmos. Sci., 73, 4221–4252, https://doi.org/10.1175/jas-d-16-0037.1, 2016.
Fernando, H. J. S., Gultepe, I., Dorman, C., Pardyjak, E., Wang, Q., Hoch, S. W., Richter, D., Creegan, E., Gaberšek, S., Bullock, T., Hocut, C., Chang, R., Alappattu, D., Dimitrova, R., Flagg, D., Grachev, A., Krishnamurthy, R., Singh, D. K., Lozovatsky, I., Nagare, B., Sharma, A., Wagh, S., Wainwright, C., Wroblewski, M., Yamaguchi, R., Bardoel, S., Coppersmith, R. S., Chisholm, N., Gonzalez, E., Gunawardena, N., Hyde, O., Morrison, T., Olson, A., Perelet, A., Perrie, W., Wang, S., and Wauer, B.: C-FOG: Life of Coastal Fog, B. Am. Meteorol. Soc., 102, E244–E272, https://doi.org/10.1175/bams-d-19-0070.1, 2021.
Fitzjarrald, D. R. and Lala, G. G.: Hudson Valley Fog Environments, J. Appl. Meteorol. Clim., 28, 1303–1328, https://doi.org/10.1175/1520-0450(1989)028<1303:hvfe>2.0.co;2, 1989.
Gao, M., Carmichael, G. R., Wang, Y., Saide, P. E., Yu, M., Xin, J., Liu, Z., and Wang, Z.: Modeling study of the 2010 regional haze event in the North China Plain, Atmos. Chem. Phys., 16, 1673–1691, https://doi.org/10.5194/acp-16-1673-2016, 2016.
Garrett, T. J. and Zhao, C.: Increased Arctic cloud longwave emissivity associated with pollution from mid-latitudes, Nature, 440, 787–789, https://doi.org/10.1038/nature04636, 2006.
Ghan, S., Wang, M., Zhang, S., Ferrachat, S., Gettelman, A., Griesfeller, J., Kipling, Z., Lohmann, U., Morrison, H., and Neubauer, D.: Challenges in constraining anthropogenic aerosol effects on cloud radiative forcing using present-day spatiotemporal variability, P. Natl. Acad. Sci. USA, 113, 5804–5811, https://doi.org/10.1073/pnas.1514036113, 2016.
Grell, G. A. and Dévényi, D.: A generalized approach to parameterizing convection combining ensemble and data assimilation techniques, Geophys. Res. Lett., 29, 38-31–38-34, https://doi.org/10.1029/2002gl015311, 2002.
Gultepe, I., Kuhn, T., Pavolonis, M., Calvert, C., Gurka, J., Heymsfield, A. J., Liu, P. S. K., Zhou, B., Ware, R., Ferrier, B., Milbrandt, J., and Bernstein, B.: Ice Fog in Arctic During FRAM–Ice Fog Project: Aviation and Nowcasting Applications, B. Am. Meteorol. Soc., 95, 211–226, https://doi.org/10.1175/bams-d-11-00071.1, 2014.
Guo, J., Liu, H., Li, Z., Rosenfeld, D., Jiang, M., Xu, W., Jiang, J. H., He, J., Chen, D., Min, M., and Zhai, P.: Aerosol-induced changes in the vertical structure of precipitation: a perspective of TRMM precipitation radar, Atmos. Chem. Phys., 18, 13329–13343, https://doi.org/10.5194/acp-18-13329-2018, 2018.
Guo, L., Guo, X., Fang, C., and Zhu, S.: Observation analysis on characteristics of formation, evolution and transition of a long-lasting severe fog and haze episode in North China, Sci. China, Ser. D Earth Sci., 58, 329–344, https://doi.org/10.1007/s11430-014-4924-2, 2015.
Guo, L., Guo, X., Luan, T., Zhu, S., and Lyu, K.: Radiative effects of clouds and fog on long-lasting heavy fog events in northern China, Atmos. Res., 252, 105444, https://doi.org/10.1016/j.atmosres.2020.105444, 2021.
Haeffelin, M., Bergot, T., Elias, T., Tardif, R., Carrer, D., Chazette, P., Colomb, M., Drobinski, P., Dupont, E., Dupont, J.-C., Gomes, L., Musson-Genon, L., Pietras, C., Plana-Fattori, A., Protat, A., Rangognio, J., Raut, J.-C., Rémy, S., Richard, D., Sciare, J., and Zhang, X.: Parisfog: Shedding new Light on Fog Physical Processes, B. Am. Meteorol. Soc., 91, 767–783, https://doi.org/10.1175/2009bams2671.1, 2010.
Hammer, E., Gysel, M., Roberts, G. C., Elias, T., Hofer, J., Hoyle, C. R., Bukowiecki, N., Dupont, J.-C., Burnet, F., Baltensperger, U., and Weingartner, E.: Size-dependent particle activation properties in fog during the ParisFog 2012/13 field campaign, Atmos. Chem. Phys., 14, 10517–10533, https://doi.org/10.5194/acp-14-10517-2014, 2014.
Holets, S. and Swanson, R. N.: High-Inversion Fog Episodes in Central California, J. Appl. Meteorol. Clim., 20, 890–899, https://doi.org/10.1175/1520-0450(1981)020<0890:hifeic>2.0.co;2, 1981.
Hu, W., Zhao, T., Bai, Y., Kong, S., Xiong, J., Sun, X., Yang, Q., Gu, Y., and Lu, H.: Importance of regional PM2.5 transport and precipitation washout in heavy air pollution in the Twain-Hu Basin over Central China: Observational analysis and WRF-Chem simulation, Sci. Total Environ., 758, 143710, https://doi.org/10.1016/j.scitotenv.2020.143710, 2021.
Iacono, M. J., Delamere, J. S., Mlawer, E. J., Shephard, M. W., Clough, S. A., and Collins, W. D.: Radiative forcing by long-lived greenhouse gases: Calculations with the AER radiative transfer models, J. Geophys. Res., 113, D13103, https://doi.org/10.1029/2008jd009944, 2008.
Iwabuchi, H., Putri, N. S., Saito, M., Tokoro, Y., Sekiguchi, M., Yang, P., and Baum, B. A.: Cloud property retrieval from multiband infrared measurements by Himawari-8, J. Meteorol. Soc. Jpn. Ser. II, 96B, 27–42, https://doi.org/10.2151/jmsj.2018-001, 2018.
Japan Meteorological Agency (JMA): Himawari Cloud Property Data, Japan Meteorological Agency [data set], https://www.eorc.jaxa.jp/ptree/index.html (last access: 30 August 2023), 2018.
Jia, X., Quan, J., Zheng, Z., Liu, X., Liu, Q., He, H., and Liu, Y.: Impacts of Anthropogenic Aerosols on Fog in North China Plain, J. Geophys. Res.-Atmos., 124, 252–265, https://doi.org/10.1029/2018jd029437, 2019.
Kim, C. K. and Yum, S. S.: Local meteorological and synoptic characteristics of fogs formed over Incheon international airport in the west coast of Korea, Adv. Atmos. Sci., 27, 761–776, https://doi.org/10.1007/s00376-009-9090-7, 2010.
Kim, C. K. and Yum, S. S.: A numerical study of sea-fog formation over cold sea surface using a one-dimensional turbulence model coupled with the weather research and forecasting model, Bound.-Lay. Meteorol., 143, 481–505, https://doi.org/10.1007/s10546-012-9706-9, 2012.
Kim, C. K. and Yum, S. S.: A study on the transition mechanism of a stratus cloud into a warm sea fog using a single column model PAFOG coupled with WRF, Asia-Pac. J. Atmos. Sci., 49, 245–257, https://doi.org/10.1007/s13143-013-0024-z, 2013.
Kumar, B., Bera, S., Prabha, T. V., and Grabowski, W. W.: Cloud-edge mixing: Direct numerical simulation and observations in Indian Monsoon clouds, J. Adv. Model. Earth Syst., 9, 332–353, https://doi.org/10.1002/2016ms000731, 2017.
Kumar, B., Ranjan, R., Yau, M.-K., Bera, S., and Rao, S. A.: Impact of high- and low-vorticity turbulence on cloud–environment mixing and cloud microphysics processes, Atmos. Chem. Phys., 21, 12317–12329, https://doi.org/10.5194/acp-21-12317-2021, 2021.
Lee, H.-H., Chen, S.-H., Kleeman, M. J., Zhang, H., DeNero, S. P., and Joe, D. K.: Implementation of warm-cloud processes in a source-oriented WRF/Chem model to study the effect of aerosol mixing state on fog formation in the Central Valley of California, Atmos. Chem. Phys., 16, 8353–8374, https://doi.org/10.5194/acp-16-8353-2016, 2016.
Letu, H., Yang, K., Nakajima, T. Y., Ishimoto, H., Nagao, T. M., Riedi, J., Baran, A. J., Ma, R., Wang, T., and Shang, H.: High-resolution retrieval of cloud microphysical properties and surface solar radiation using Himawari-8/AHI next-generation geostationary satellite, Remote Sens. Environ., 239, 111583, https://doi.org/10.1016/j.rse.2019.111583, 2020.
Li, M., Liu, H., Geng, G., Hong, C., Liu, F., Song, Y., Tong, D., Zheng, B., Cui, H., Man, H., Zhang, Q., and He, K.: Anthropogenic emission inventories in China: a review, Natl. Sci. Rev., 4, 834–866, https://doi.org/10.1093/nsr/nwx150, 2017.
Li, Z., Guo, J., Ding, A., Liao, H., Liu, J., Sun, Y., Wang, T., Xue, H., Zhang, H., and Zhu, B.: Aerosol and boundary-layer interactions and impact on air quality, Natl. Sci. Rev., 4, 810–833, https://doi.org/10.1093/nsr/nwx117, 2017.
Liu, D., Yang, J., Niu, S., and Li, Z.: On the evolution and structure of a radiation fog event in Nanjing, Adv. Atmos. Sci., 28, 223–237, https://doi.org/10.1007/s00376-010-0017-0, 2010.
Liu, D. Y., Niu, S. J., Yang, J., Zhao, L. J., Lü, J. J., and Lu, C. S.: Summary of a 4-Year Fog Field Study in Northern Nanjing, Part 1: Fog Boundary Layer, Pure Appl. Geophys., 169, 809–819, https://doi.org/10.1007/s00024-011-0343-x, 2011.
Liu, Y., Hua, S., Jia, R., and Huang, J.: Effect of Aerosols on the Ice Cloud Properties Over the Tibetan Plateau, J. Geophys. Res.-Atmos., 124, 9594–9608, https://doi.org/10.1029/2019jd030463, 2019.
Liu, Y., Zhu, Q., Hua, S., Alam, K., Dai, T., and Cheng, Y.: Tibetan Plateau driven impact of Taklimakan dust on northern rainfall, Atmos. Environ., 234, 117583, https://doi.org/10.1016/j.atmosenv.2020.117583, 2020.
Maalick, Z., Kühn, T., Korhonen, H., Kokkola, H., Laaksonen, A., and Romakkaniemi, S.: Effect of aerosol concentration and absorbing aerosol on the radiation fog life cycle, Atmos. Environ., 133, 26–33, https://doi.org/10.1016/j.atmosenv.2016.03.018, 2016.
Maronga, B. and Bosveld, F. C.: Key parameters for the life cycle of nocturnal radiation fog: a comprehensive large-eddy simulation study, Q. J. Roy. Meteor. Soc., 143, 2463–2480, https://doi.org/10.1002/qj.3100, 2017.
Matsui, T., Zhang, S. Q., Lang, S. E., Tao, W.-K., Ichoku, C., and Peters-Lidard, C. D.: Impact of radiation frequency, precipitation radiative forcing, and radiation column aggregation on convection-permitting West African monsoon simulations, Clim. Dynam., 55, 193–213, https://doi.org/10.1007/s00382-018-4187-2, 2020.
Mazoyer, M., Lac, C., Thouron, O., Bergot, T., Masson, V., and Musson-Genon, L.: Large eddy simulation of radiation fog: impact of dynamics on the fog life cycle, Atmos. Chem. Phys., 17, 13017–13035, https://doi.org/10.5194/acp-17-13017-2017, 2017.
Mazoyer, M., Burnet, F., Denjean, C., Roberts, G. C., Haeffelin, M., Dupont, J.-C., and Elias, T.: Experimental study of the aerosol impact on fog microphysics, Atmos. Chem. Phys., 19, 4323–4344, https://doi.org/10.5194/acp-19-4323-2019, 2019.
Mazoyer, M., Burnet, F., and Denjean, C.: Experimental study on the evolution of droplet size distribution during the fog life cycle, Atmos. Chem. Phys., 22, 11305–11321, https://doi.org/10.5194/acp-22-11305-2022, 2022.
Mecikalski, J. R., Bedka, K. M., Paech, S. J., and Litten, L. A.: A Statistical Evaluation of GOES Cloud-Top Properties for Nowcasting Convective Initiation, Mon. Weather Rev., 136, 4899–4914, https://doi.org/10.1175/2008mwr2352.1, 2008.
MEIC Team: The Multi-resolution Emission Inventory Model for Climate and Air Pollution Research, MEIC Model [data set], http://meicmodel.org.cn/?page_id=2351&lang=en#firstPage (last access: 22 April 2022), 2012.
Morrison, H., Curry, J., and Khvorostyanov, V.: A new double-moment microphysics parameterization for application in cloud and climate models. Part I: Description, J. Atmos. Sci., 62, 1665–1677, https://doi.org/10.1175/JAS3446.1, 2005.
Nakanishi, M.: Large-eddy simulation of radiation fog, Bound.-Lay. Meteorol., 94, 461–493, https://doi.org/10.1023/A:1002490423389, 2000.
Nakanishi, M. and Niino, H.: Development of an Improved Turbulence Closure Model for the Atmospheric Boundary Layer, J. Meteorol. Soc. Jpn., 87, 895–912, https://doi.org/10.2151/jmsj.87.895, 2009.
National Centers for Environmental Prediction/National Weather Service/NOAA/U.S. Department of Commerce: NCEP FNL Operational Model Global Tropospheric Analyses, continuing from July 1999, Research Data Archive at the National Center for Atmospheric Research, Computational and Information Systems Laboratory [data set], https://doi.org/10.5065/D6M043C6, 1999.
Niu, S., Lu, C., Yu, H., Zhao, L., and Lü, J.: Fog research in China: An overview, Adv. Atmos. Sci., 27, 639–662, https://doi.org/10.1007/s00376-009-8174-8, 2010.
Niu, S. J., Liu, D. Y., Zhao, L. J., Lu, C. S., Lü, J. J., and Yang, J.: Summary of a 4-Year Fog Field Study in Northern Nanjing, Part 2: Fog Microphysics, Pure Appl. Geophys., 169, 1137–1155, https://doi.org/10.1007/s00024-011-0344-9, 2011.
Petters, J. L., Harrington, J. Y., and Clothiaux, E. E.: Radiative–dynamical feedbacks in low liquid water path stratiform clouds, J. Atmos. Sci., 69, 1498–1512, https://doi.org/10.1175/JAS-D-11-0169.1, 2012.
Petters, M. D. and Kreidenweis, S. M.: A single parameter representation of hygroscopic growth and cloud condensation nucleus activity, Atmos. Chem. Phys., 7, 1961–1971, https://doi.org/10.5194/acp-7-1961-2007, 2007.
Poku, C., Ross, A. N., Hill, A. A., Blyth, A. M., and Shipway, B.: Is a more physical representation of aerosol activation needed for simulations of fog?, Atmos. Chem. Phys., 21, 7271–7292, https://doi.org/10.5194/acp-21-7271-2021, 2021.
Porson, A., Price, J., Lock, A., and Clark, P.: Radiation Fog. Part II: Large-Eddy Simulations in Very Stable Conditions, Bound.-Lay. Meteorol., 139, 193–224, https://doi.org/10.1007/s10546-010-9579-8, 2011.
Prabhakaran, P., Hoffmann, F., and Feingold, G.: Evaluation of Pulse Aerosol Forcing on Marine Stratocumulus Clouds in the Context of Marine Cloud Brightening, J. Atmos. Sci., 80, 1585–1604, https://doi.org/10.1175/JAS-D-22-0207.1, 2023.
Price, J. D., Lane, S., Boutle, I. A., Smith, D. K. E., Bergot, T., Lac, C., Duconge, L., McGregor, J., Kerr-Munslow, A., Pickering, M., and Clark, R.: LANFEX: A Field and Modeling Study to Improve Our Understanding and Forecasting of Radiation Fog, B. Am. Meteorol. Soc., 99, 2061–2077, https://doi.org/10.1175/bams-d-16-0299.1, 2018.
Quan, J., Zhang, Q., He, H., Liu, J., Huang, M., and Jin, H.: Analysis of the formation of fog and haze in North China Plain (NCP), Atmos. Chem. Phys., 11, 8205–8214, https://doi.org/10.5194/acp-11-8205-2011, 2011.
Quan, J., Liu, Y., Jia, X., Liu, L., Dou, Y., Xin, J., and Seinfeld, J. H.: Anthropogenic aerosols prolong fog lifetime in China, Environ. Res. Lett., 16, 044048, https://doi.org/10.1088/1748-9326/abef32, 2021.
Roach, W., Brown, R., Caughey, S., Garland, J., and Readings, C.: The physics of radiation fog: I–a field study, Q. J. Roy. Meteor. Soc., 102, 313–333, https://doi.org/10.1002/qj.49710243204, 1976.
Román-Cascón, C., Yagüe, C., Steeneveld, G.-J., Sastre, M., Arrillaga, J. A., and Maqueda, G.: Estimating fog-top height through near-surface micrometeorological measurements, Atmos. Res., 170, 76–86, https://doi.org/10.1016/j.atmosres.2015.11.016, 2016.
Rosenfeld, D., Zhu, Y., Wang, M., Zheng, Y., Goren, T., and Yu, S.: Aerosol-driven droplet concentrations dominate coverage and water of oceanic low-level clouds, Science, 363, eaav0566, https://doi.org/10.1126/science.aav0566, 2019.
Seinfeld, J. H., Bretherton, C., Carslaw, K. S., Coe, H., DeMott, P. J., Dunlea, E. J., Feingold, G., Ghan, S., Guenther, A. B., Kahn, R., Kraucunas, I., Kreidenweis, S. M., Molina, M. J., Nenes, A., Penner, J. E., Prather, K. A., Ramanathan, V., Ramaswamy, V., Rasch, P. J., Ravishankara, A. R., Rosenfeld, D., Stephens, G., and Wood, R.: Improving our fundamental understanding of the role of aerosol-cloud interactions in the climate system, P. Natl. Acad. Sci. USA., 113, 5781–5790, https://doi.org/10.1073/pnas.1514043113, 2016.
Shen, C., Zhao, C., Ma, N., Tao, J., Zhao, G., Yu, Y., and Kuang, Y.: Method to Estimate Water Vapor Supersaturation in the Ambient Activation Process Using Aerosol and Droplet Measurement Data, J. Geophys. Res.-Atmos., 123, 10606–10619, https://doi.org/10.1029/2018jd028315, 2018.
Shu, Z., Liu, Y., Zhao, T., Xia, J., Wang, C., Cao, L., Wang, H., Zhang, L., Zheng, Y., Shen, L., Luo, L., and Li, Y.: Elevated 3D structures of PM2.5 and impact of complex terrain-forcing circulations on heavy haze pollution over Sichuan Basin, China, Atmos. Chem. Phys., 21, 9253–9268, https://doi.org/10.5194/acp-21-9253-2021, 2021.
Simmel, M. and Wurzler, S.: Condensation and activation in sectional cloud microphysical models, Atmos. Res., 80, 218–236, https://doi.org/10.1016/j.atmosres.2005.08.002, 2006.
Skamarock, W. C., Klemp, J. B., Dudhia, J., Gill, D. O., Liu, Z., Berner, J., Wang, W., Powers, J., Duda, M., and Barker, D.: A description of the advanced research WRF version 4, NCAR tech. note ncar/tn-556+ str, National Center for Atmospheric Research: Boulder, CO, USA, https://doi.org/10.5065/1dfh-6p97, 2019 (data available at: https://github.com/wrf-model/WRF/releases/tag/v4.1.3, last access: 30 August 2023).
Steeneveld, G. J. and de Bode, M.: Unravelling the relative roles of physical processes in modelling the life cycle of a warm radiation fog, Q. J. Roy. Meteor. Soc., 144, 1539–1554, https://doi.org/10.1002/qj.3300, 2018.
Stolaki, S., Haeffelin, M., Lac, C., Dupont, J. C., Elias, T., and Masson, V.: Influence of aerosols on the life cycle of a radiation fog event. A numerical and observational study, Atmos. Res., 151, 146–161, https://doi.org/10.1016/j.atmosres.2014.04.013, 2015.
Toll, V., Christensen, M., Quaas, J., and Bellouin, N.: Weak average liquid-cloud-water response to anthropogenic aerosols, Nature, 572, 51–55, https://doi.org/10.1038/s41586-019-1423-9, 2019.
Twomey, S.: The influence of pollution on the shortwave albedo of clouds, J. Atmos. Sci., 34, 1149–1152, https://doi.org/10.1175/1520-0469(1977)034<1149:TIOPOT>2.0.CO;2, 1977.
Vautard, R., Yiou, P., and van Oldenborgh, G. J.: Decline of fog, mist and haze in Europe over the past 30 years, Nat. Geosci., 2, 115–119, https://doi.org/10.1038/ngeo414, 2009.
Wærsted, E. G., Haeffelin, M., Dupont, J.-C., Delanoë, J., and Dubuisson, P.: Radiation in fog: quantification of the impact on fog liquid water based on ground-based remote sensing, Atmos. Chem. Phys., 17, 10811–10835, https://doi.org/10.5194/acp-17-10811-2017, 2017.
Wang, Y., Fan, J., Zhang, R., Leung, L. R., and Franklin, C.: Improving bulk microphysics parameterizations in simulations of aerosol effects, J. Geophys. Res.-Atmos., 118, 5361–5379, https://doi.org/10.1002/jgrd.50432, 2013.
Wang, Y., Vogel, J. M., Lin, Y., Pan, B., Hu, J., Liu, Y., Dong, X., Jiang, J. H., Yung, Y. L., and Zhang, R.: Aerosol microphysical and radiative effects on continental cloud ensembles, Adv. Atmos. Sci., 35, 234–247, https://doi.org/10.1007/s00376-017-7091-5, 2018.
Wang, Y., Niu, S., Lu, C., Lv, J., Zhang, J., Zhang, H., Zhang, S., Shao, N., Sun, W., Jin, Y., and Song, Q.: Observational study of the physical and chemical characteristics of the winter radiation fog in the tropical rainforest in Xishuangbanna, China, Sci. China, Ser. D Earth Sci., 64, 1982–1995, https://doi.org/10.1007/s11430-020-9766-4, 2021.
Wang, Y., Lu, C., Niu, S., Lv, J., Jia, X., Xu, X., Xue, Y., Zhu, L., and Yan, S.: Diverse dispersion effects and parameterization of relative dispersion in urban fog in eastern China, J. Geophys. Res.-Atmos., 128, e2022JD037514, https://doi.org/10.1029/2022JD037514, 2023.
WMO: International meteorological vocabulary, World Meteorological Organization, Geneva, Switzerland, 784 pp., ISBN 978-92-63-02182-3, 1992.
Xu, X., Lu, C., Liu, Y., Gao, W., Wang, Y., Cheng, Y., Luo, S., and Van Weverberg, K.: Effects of Cloud Liquid-Phase Microphysical Processes in Mixed-Phase Cumuli Over the Tibetan Plateau, J. Geophys. Res.-Atmos., 125, e2020JD033371, https://doi.org/10.1029/2020jd033371, 2020.
Yamane, Y., Hayashi, T., Dewan, A. M., and Akter, F.: Severe local convective storms in Bangladesh: Part II, Atmos. Res., 95, 407–418, https://doi.org/10.1016/j.atmosres.2009.11.003, 2010.
Yan, S., Zhu, B., Huang, Y., Zhu, J., Kang, H., Lu, C., and Zhu, T.: To what extents do urbanization and air pollution affect fog?, Atmos. Chem. Phys., 20, 5559–5572, https://doi.org/10.5194/acp-20-5559-2020, 2020.
Yan, S., Zhu, B., Zhu, T., Shi, C., Liu, D., Kang, H., Lu, W., and Lu, C.: The Effect of Aerosols on Fog Lifetime: Observational Evidence and Model Simulations, Geophys. Res. Lett., 48, e2020GL61803, https://doi.org/10.1029/2020gl091156, 2021.
Yang, Q., Zhao, T., Tian, Z., Kumar, K. R., Chang, J., Hu, W., Shu, Z., and Hu, J.: The Cross-Border Transport of PM2.5 from the Southeast Asian Biomass Burning Emissions and Its Impact on Air Pollution in Yunnan Plateau, Southwest China, Remote Sens., 14, 1886, https://doi.org/10.3390/rs14081886, 2022.
Yang, Y., Hu, X.-M., Gao, S., and Wang, Y.: Sensitivity of WRF simulations with the YSU PBL scheme to the lowest model level height for a sea fog event over the Yellow Sea, Atmos. Res., 215, 253–267, https://doi.org/10.1016/j.atmosres.2018.09.004, 2019.
Yang, Y., Zhao, C., and Fan, H.: Spatiotemporal distributions of cloud properties over China based on Himawari-8 advanced Himawari imager data, Atmos. Res., 240, 104927, https://doi.org/10.1016/j.atmosres.2020.104927, 2020.
Ye, X., Wu, B., and Zhang, H.: The turbulent structure and transport in fog layers observed over the Tianjin area, Atmos. Res., 153, 217–234, https://doi.org/10.1016/j.atmosres.2014.08.003, 2015.
Yum, S. S. and Hudson, J. G.: Adiabatic predictions and observations of cloud droplet spectral broadness, Atmos. Res., 73, 203–223, https://doi.org/10.1016/j.atmosres.2004.10.006, 2005.
Zaveri, R. A. and Peters, L. K.: A new lumped structure photochemical mechanism for large-scale applications, J. Geophys. Res.-Atmos., 104, 30387–30415, https://doi.org/10.1029/1999jd900876, 1999.
Zaveri, R. A., Easter, R. C., Fast, J. D., and Peters, L. K.: Model for Simulating Aerosol Interactions and Chemistry (MOSAIC), J. Geophys. Res., 113, D13204, https://doi.org/10.1029/2007jd008782, 2008.
Zhai, S., An, X., Zhao, T., Sun, Z., Wang, W., Hou, Q., Guo, Z., and Wang, C.: Detection of critical PM2.5 emission sources and their contributions to a heavy haze episode in Beijing, China, using an adjoint model, Atmos. Chem. Phys., 18, 6241–6258, https://doi.org/10.5194/acp-18-6241-2018, 2018.
Zhao, C. and Garrett, T. J.: Effects of Arctic haze on surface cloud radiative forcing, Geophys. Res. Lett., 42, 557–564, https://doi.org/10.1002/2014gl062015, 2015.
Zhao, L., Niu, S., Zhang, Y., and Xu, F.: Microphysical characteristics of sea fog over the east coast of Leizhou Peninsula, China, Adv. Atmos. Sci., 30, 1154–1172, https://doi.org/10.1007/s00376-012-1266-x, 2013.
Zhao, L., Zhao, C., Wang, Y., Wang, Y., and Yang, Y.: Evaluation of cloud microphysical properties derived from MODIS and Himawari-8 using in situ aircraft measurements over the Southern Ocean, Earth Space Sci., 7, e2020EA001137, https://doi.org/10.1029/2020EA001137, 2020.
Zheng, B., Tong, D., Li, M., Liu, F., Hong, C., Geng, G., Li, H., Li, X., Peng, L., Qi, J., Yan, L., Zhang, Y., Zhao, H., Zheng, Y., He, K., and Zhang, Q.: Trends in China's anthropogenic emissions since 2010 as the consequence of clean air actions, Atmos. Chem. Phys., 18, 14095–14111, https://doi.org/10.5194/acp-18-14095-2018, 2018.
Zhong, J., Zhang, X., Wang, Y., Liu, C., and Dong, Y.: Heavy aerosol pollution episodes in winter Beijing enhanced by radiative cooling effects of aerosols, Atmos. Res., 209, 59–64, https://doi.org/10.1016/j.atmosres.2018.03.011, 2018.
Zhou, B. and Du, J.: Fog Prediction from a Multimodel Mesoscale Ensemble Prediction System, Weather Forecast., 25, 303–322, https://doi.org/10.1175/2009waf2222289.1, 2010.
Zhou, B. and Ferrier, B. S.: Asymptotic Analysis of Equilibrium in Radiation Fog, J. Appl. Meteorol. Clim., 47, 1704–1722, https://doi.org/10.1175/2007jamc1685.1, 2008.
Zhou, B., Du, J., Gultepe, I., and Dimego, G.: Forecast of Low Visibility and Fog from NCEP: Current Status and Efforts, Pure Appl. Geophys., 169, 895–909, https://doi.org/10.1007/s00024-011-0327-x, 2011.
Zhu, J. and Penner, J. E.: Radiative forcing of anthropogenic aerosols on cirrus clouds using a hybrid ice nucleation scheme, Atmos. Chem. Phys., 20, 7801–7827, https://doi.org/10.5194/acp-20-7801-2020, 2020.
Zhu, J., Zhu, B., Huang, Y., An, J., and Xu, J.: PM2.5 vertical variation during a fog episode in a rural area of the Yangtze River Delta, China, Sci. Total Environ., 685, 555–563, https://doi.org/10.1016/j.scitotenv.2019.05.319, 2019a.
Zhu, J., Penner, J. E., Yu, F., Sillman, S., Andreae, M. O., and Coe, H.: Decrease in radiative forcing by organic aerosol nucleation, climate, and land use change, Nat. Commun., 10, 423, https://doi.org/10.1038/s41467-019-08407-7, 2019b.
- Abstract
- Introduction
- Experimental design and data source
- Simulation evaluation
- Larger aerosol-induced changes in Fog2 than in Fog1
- Physical mechanisms underlying the larger aerosol-induced changes in Fog2 than in Fog1
- Conclusion
- Code and data availability
- Author contributions
- Competing interests
- Disclaimer
- Acknowledgements
- Financial support
- Review statement
- References
- Supplement