the Creative Commons Attribution 4.0 License.
the Creative Commons Attribution 4.0 License.
 | 05 Sep 2023
Quantifying the seasonal variations in and regional transport of PM2.5 in the Yangtze River Delta region, China: characteristics, sources, and health risks
Yangzhihao Zhan
Wei Zhao
Tijian Wang
Da Gao
Pulong Chen
Jun Tian
Kuanguang Zhu
Shu Li
Bingliang Zhuang
Mengmeng Li
Yi Luo
Runqi Zhao
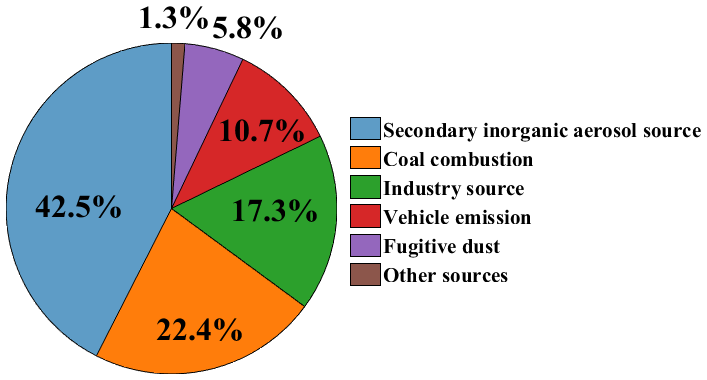
Given the increasing complexity of the chemical composition of PM2.5, identifying and quantitatively assessing the contributions of pollution sources has played an important role in formulating policies to control particle pollution. This study provides a comprehensive assessment between PM2.5 chemical characteristics, sources, and health risks based on sampling data conducted over 1 year (March 2018 to February 2019) in Nanjing. Results show that PM2.5 exhibits a distinct variation across different seasons, which is primarily driven by emissions, meteorological conditions, and the chemical conversion of gaseous pollutants. First, the chemical mass reconstruction shows that secondary inorganic aerosols (62.5 %) and carbonaceous aerosols (21.3 %) contributed most to the PM2.5 mass. The increasing oxidation rates of SO2 and NO2 from summer to winter indicate that the secondary transformation of gaseous pollutants is strongly positively correlated with relative humidity. Second, the positive matrix factorization (PMF) method shows that identified PM2.5 sources include secondary inorganic aerosol source (SIS, 42.5 %), coal combustion (CC, 22.4 %), industry source (IS, 17.3 %), vehicle emission (VE, 10.7 %), fugitive dust (FD, 5.8 %), and other sources (1.3 %). The Hybrid Single-Particle Lagrangian Integrated Trajectory (HYSPLIT) model and the concentration-weighted trajectory (CWT) analysis are used to further explore different spatial distributions and regional transport of sources. The concentrations (10–11 µg m−3) of SIS and CC distribute in Nanjing and central China in winter. The concentrations (8–10 µg m−3) of IS and VE are potentially located north of Jiangsu, Anhui, and Jiangxi. Finally, the health risk assessment indicates that the carcinogenic and non-carcinogenic risks of toxic elements (Cr, As, Ni, Mn, V, and Pb) mainly come from IS, VE, and CC, which are within the tolerance or acceptable level. Although the main source of pollution in Nanjing is SIS at present, we should pay more attention to the health burden of vehicle emissions, coal combustion, and industrial processes.
- Article
(1652 KB) - Full-text XML
- BibTeX
- EndNote


PM2.5 is particulate matter with an aerodynamic equivalent diameter less than or equal to 2.5 µm, and it is one of the most important air pollutants, which can affect air quality (Sharma et al., 2020), atmospheric visibility (Tseng et al., 2019), and ecosystems (Li et al., 2021). PM2.5 can directly enter the human body through the respiratory system, leading to increased health risks (Kumar and Toshniwal, 2022; Sulaymon et al., 2021). PM2.5 concentrations in the United States and Europe have begun to decrease since the 1980s, and those in Japan gradually decreased after 2012 (Zhang et al., 2020). In China, the annual average concentration of PM2.5 has decreased by 50 % with the implementation of the Air Pollution Prevention and Control Action Plan (APPCAP) in 2013. However, annual PM2.5 concentrations in most cities are greater than 10 µg m−3, the air quality guideline of the World Health Organization (Song et al., 2017; Zeng et al., 2019; Cheng et al., 2021), and the number of deaths caused by PM2.5 exceeds 1 million per year (Zhu et al., 2020). It indicates that a comprehensive assessment between PM2.5 chemical characteristics, sources, and health risks is significant for pollution control measures in the key regions of China.
Understanding the chemical composition of PM2.5 is important for formulating control strategies. Sulfate, nitrate, and ammonium (SNA) are the major secondary inorganic aerosols, whose chemical conversion occurs in homogeneous and heterogeneous reactions (Fan et al., 2020; Chow et al., 2022). Variations in the form of SO and NH3 lead to variations in the acid–base balance of aerosols (Roper et al., 2019). Organic carbon (OC) comprises thousands of organic compounds. Elemental carbon (EC) is stable and mainly derived from primary sources of combustion products (Wu et al., 2020; Zhang et al., 2017). Both and ratios can be reasonably used to evaluate the contribution of mobile and stationary sources to PM2.5 in the atmosphere (Zhan et al., 2021). To identify the sources of PM2.5, receptor models have been developed, which include positive matrix factorization (PMF), chemical mass balance (CMB), and principal component analysis (PCA) (Zong et al., 2016; Lv et al., 2020). Recently, the combination of the PMF model and trajectory modeling has proven to be powerful to identify source regions and quantify chemical compositions for a receptor site (Zheng et al., 2019). Air exposure models have been widely used to compare the health outcomes of people exposed to different levels of air pollution (Thurston et al., 2016; Conibear et al., 2018). Long-term exposure to PM2.5 is particularly significant for cardiovascular disease mortality (Hayes et al., 2019). Trace metals (Cr, Ni, Mn, V, and Pb) are a minor component of PM2.5 in qualitative terms, but the health risk of toxic elements through inhalation of PM2.5 exceeds acceptable levels (Jiang et al., 2018; Jeong et al., 2019; Xie et al., 2020). Health risk assessments have been widely used to assess further the non-carcinogenic and carcinogenic health risks of toxic elements in PM2.5 (Behrooz et al., 2021; Fang et al., 2021; Li et al., 2022).
Chemical characteristics of PM2.5 have been widely investigated in the Beijing–Tianjin–Hebei (BTH) area, the Yangtze River Delta (YRD), and the Pearl River Delta (PRD) during the last decade (Huang et al., 2017; Liu et al., 2017; T. T. Li et al., 2020). In the megacity of China, the occurrence of haze may be exacerbated by interactions between aerosols and meteorological conditions and regional transport (Zeng et al., 2019; Fan et al., 2020; Wang et al., 2023). The YRD region is China's scientific research base and comprehensive transportation hub. The annual PM2.5 concentration in the YRD has been reduced by 45.6 % from 2016 to 2018. However, as a megacity in the YRD, the PM2.5 in Nanjing still exceeds the National Ambient Air Quality Standard (35 µg m−3 as an annual average) by more than 38 % (Nie et al., 2018). Source apportionment studies mainly focus on the relative importance of local emissions and regional transportation on PM2.5 at a specific site using the PMF model and the backward trajectory analysis (Zheng et al., 2019; Yan et al., 2021; Lv et al., 2022). Some studies involved the health risks of toxic elements in PM2.5 (Khan et al., 2016; Fang et al., 2021), and only a few studies discussed the classification of toxic elements according to PMF results (Wang et al., 2019; S. B. Wang et al., 2020). However, there were two shortcomings in previous studies. (1) Given the uneven geographical distribution of observation sites and difficulties in data collection, most studies were based on short-term data comparisons and lacked systematic comparisons of the distinctive seasonality, regional transport, and meteorological effects of various elements and sources. (2) A comprehensive assessment of the health risks of toxic elements in each source of PM2.5 was still scarce, which limited the implementation of long-term pollution control measures in megacities.
In this work, we provide high-quality composition data for PM2.5 in the typical YRD city, including chemical characteristics and diurnal variations. Moreover, the measured PM2.5 in its entirety is successfully apportioned to various contributing sources by PMF and concentration-weighted trajectory (CWT) methods. Finally, potential risks associated with exposure to airborne toxic elements are identified based on the health risk assessment. The results can systematically assess the relationship between chemical characteristics, sources, and health risks of PM2.5, as well as serve to guide PM2.5 control measures for other megacities.
2.1 Chemical component sampling, air quality, and meteorological data
Hourly concentrations of particulate matter (PM) components from December 2018 to February 2019 in Nanjing were used in this study. PM2.5 samples were collected on the rooftop of the School of Atmospheric Sciences, Xianlin Campus, Nanjing University (32.12∘ N, 118.96∘ E). The elemental carbon (EC), organic carbon (OC), 30 trace elements, and 8 soluble components in aerosols were quantified in each PM2.5 sample.
EC and OC samples were analyzed by the online carbon fraction monitor (EA-32, EveriseTech Co., Beijing). Taking advantage of the fact that EC was more difficult to be volatilized than OC, OC and EC were separated by step heating, catalyzed sequentially, and then determined by the non-dispersive infrared method.
A total of 30 trace elements included Si, Al, As, Ca, K, Co, Mo, Ag, Sc, Tl, Pd, Br, Te, Ga, Cs, Pb, Se, Hg, Cr, Cd, Zn, Cu, Ni, Fe, Mn, Ti, Sb, Sn, and V. The components of trace elements were collected by the atmospheric heavy metal monitor (AMS-100, FPI Inc., Hangzhou). We used a particle cutting head to collect particles with an aerodynamic equivalent diameter of less than 100, 10, and 2.5 µm in the ambient air; used organic microporous filter membranes to enrich the collected particles; used the principle of β-ray absorption to detect the concentration of particles enriched on the filter membranes; and used the principle of X-ray fluorescence to detect the concentration of more than 30 types of trace elements in the particles (S. B. Wang et al., 2020).
Eight soluble components included Na+, K+, Mg2+, Ca2+, Cl−, NO, SO, and NH. The soluble-component sampling instrument was the in situ gas and aerosol composition monitor (IGAC, Greatest Idea Strategy Co., Taiwan). It consisted of the wet concentric circular tube, the gas gel processor, and the ion chromatograph. The sampling inlet was about 20 m above the ground, and the flow rate was 16.67 L min−1. The collected liquid samples were filtered by defoaming and then injected into the ion chromatography analyzers to analyze the ion components from the gases and the aerosols. The detection limits were below 0.12 µg m−3, and the collection efficiency was higher than 90 % (Zhan et al., 2021).
Air pollutants, including PM2.5, PM10, O3, NO2, SO2, and CO, were monitored by the National Environmental Monitoring Center (NEMC) of China. The nationwide observation network began operating in 74 major cities in 2013, and it included 1597 nonrural sites covering 454 cities by 2017 (Gao et al., 2021). The monitoring Xianlin Station (32.10∘ N, 118.93∘ E) collected air pollutant data and automatically measured hourly air pollutants. These data were issued hourly on the national urban air quality real-time publishing platform (https://air.cnemc.cn:18007/, last access: 7 April 2023). Meteorological parameters included air pressure, air temperature, relative humidity, wind speed, and boundary layer height. We collected hourly data from the National Climatic Data Center (NCDC) of the University of Wyoming website (http://weather.uwyo.edu/surface/, last access: 7 April 2023). We extracted boundary layer height data from the national benchmark at Nanjing station 58238 (32.00∘ N, 118.48∘ E) and were also acquired from this website. The quality assurance and quality control (QA/QC) procedures were used at each site according to the method of Xie et al. (2016) and Gao et al. (2021). PM2.5 component data were collected hourly, and the study was based on high-time-resolution data. We measured 10 % of all samples as parallel sampling, and the pass rate was over 95 %. We defined the missing sampling of atmospheric pollutant data as −999 to facilitate PMF processing. The chemical mass reconstruction method was used to correct potential measurement errors, which is described in detail in Sect. 2.2. The QA/QC procedures have passed the artificial random inspection of extreme value and time consistency.
2.2 Mass and chemical composition determination for PM2.5
Due to the limitation in sampling location and equipment, the sum of measured species was often lower than the gravimetric mass. Chemical mass reconstruction (CMR) attempted to achieve closure between the gravitational mass and the sum of components and correct potential measurement errors. In this study, the reconstructed result and the gravimetric result exhibited a significant correlation, with a mean R2 of 0.93, indicating that the chemical reconstruction method had strong reliability. Following the work of Xu et al. (2021), eight categories of chemical components in chemically reconstructed PM2.5 can be expressed as follows:
where OM refers to the organic matter. The OC to OM conversion coefficient at urban sites is 1.6 (Brokamp et al., 2017). The calculation of mineral dust (MD) is based on crustal element oxides (Yan et al., 2020):
where Si is estimated by multiplying Al in crustal material by a converting factor (3.14) (Zheng et al., 2019). Trace metals (TMs) represent the sum of 30 different types of heavy metals:
2.3 Identification of source by the positive matrix factorization (PMF) model
The positive matrix factorization (PMF) was developed by the Environmental Protection Agency (EPA) and has been widely adopted to classify PM2.5 into different factors (Zong et al., 2016). The US EPA PMF version 5.0 was referred to in this study. The basic principle of the PMF model was to calculate the weight error of each chemical component in the particulate matter and then determine its main pollution source and contribution rate by the least square method (Paatero and Tapper, 1994). The equation of the PMF model can be expressed as follow:
where Xij is the concentration of the ijth sample, gik represents the contribution of the ikth sample, fkj represents the mass fraction of the kjth, and eij is the residual between the measured mass concentration of the ijth sample and its analytical value. The purpose of the PMF model is to find the minimum Q value with the concentration file and uncertainty file (uij) introduced into the model. The objective function Q is defined as follows:
where Q is the sum of all sample residuals and their uncertainties u. In this study, the fitting species included 41 types of chemical species of PM2.5 that were selected and validated to ensure that the value of the objective function Q was minimized.
where Unc is the uncertainty. MDL is the method detection limit. If the concentration is less than or equal to the MDL provided, Unc is calculated using a fixed fraction of the MDL (Taylor et al., 2020). If the concentration is greater than the MDL, the calculation is based on the concentration fraction and MDL.
First, we excluded more than 50 % of the dataset for species below the method detection limit (MDL) and retained 23 species that were significantly correlated with PM2.5. Second, we calculated the uncertainty (Unc) for each species based on the concentration fraction and MDL (Taylor et al., 2020). Third, different numbers of factors were tested with random seeds in 20 iterations of each run. When the number of factors was set to six, the fitting degree of the model calculation results was the highest, with a correlation coefficient of 0.93, and the species almost showed a normal curve. Finally, the bootstrap (BS), displacement (DISP), and bootstrapping with displacement (BS-DISP) diagnostic analyses were also used to evaluate the rationality of the apportioned factor profiles and contributions. BS is used to detect and estimate the disproportionate effects of a small set of observations on the solution and also, to a lesser extent, the effects of rotational ambiguity. The value of the f peak strength was ensured to be 0.5 to eliminate the rotation ambiguity. The mapping for each factor in this study was more than 80 % from the BS run, indicating the six-factor solution was appropriate.
2.4 Source apportionment by backward trajectory calculation and CWT analysis
The Hybrid Single-Particle Lagrangian Integrated Trajectory (HYSPLIT) model was developed by the National Oceanic and Atmospheric Administration (NOAA) and the Australian Bureau of Meteorology to simulate and analyze the movement, deposition, and diffusion of airflow. The reanalysis data with a spatial resolution of 1∘ and a temporal resolution of 6 h (00:00, 06:00, 12:00, and 18:00 UTC) were obtained from the Global Data Assimilation System (GDAS) (https://rda.ucar.edu/datasets/, last access: 7 April 2023). To locate the potential source areas for the corresponding components, we used the HYSPLIT model to analyze the backward trajectory of airflow from March 2018 to February 2019. The 48 h backward trajectories terminated at a height of 100 m above ground level were calculated at the starting point (32.07∘ N, 118.78∘ E). Due to the high uncertainty of a single backward trajectory, we drew multiple trajectories and performed cluster analysis. The cluster analysis was a multivariate statistical technique using the angle distance algorithm, which could quantify the relationship among the pollution concentrations in each source area (Shu et al., 2017).
The concentration-weighted trajectory (CWT) analysis was further used to determine the relative contribution of different areas. The CWT analysis was conducted by the TrajStat software, which was a GIS (geographic information system) application that enabled the user to visualize and analyze the spatial and meteorological data with multiple data formats (Feng et al., 2021). In this study, the meteorological data used for the HYSPLIT model and the CWT method remained the same. The CWT method divided the research area into small equal grids, set a standard value for the research object, and defined the trajectory exceeding the standard value as the pollution trajectory. According to the criteria of the Chinese National Ambient Air Quality Standards (NAAQS), the standard value of the PM2.5 concentrations was 75 µg m−3 in this study. The spatial resolution was 0.5×0.5 (Y. K. Liu et al., 2018). The CWT method reflected the pollution degree of different trajectories by calculating the weight concentration of the airflow trajectory in potential source areas:
where Cij is the average weight concentration of grid ij, Cl is the pollutant concentration based on trajectory l that passes through grid ij, and τij is the residence time of trajectory l in grid ij. Similarly, to reduce the uncertainty caused by the smaller nij, the CWT value is multiplied by the weight function as well (Wong et al., 2022):
where nij is the number of trajectories that pass through the ijth cell. Wij is an empirical weight function to reduce the undue influence of small nij on the CWT values (Fan et al., 2020). In this study, the CWT value of each identified source derived from the PMF model was calculated.
2.5 Health risk assessment
The human health risk from heavy metals in PM2.5 may occur through exposure to ambient air (Zhang et al., 2019). Based on the PMF analysis, we selected six toxic elements (Cr, As, Ni, Mn, V, and Pb) for the exposure risk assessment. Cr, Ni, and As have both carcinogenic and non-carcinogenic effects; Mn and V mainly have non-carcinogenic effects; and Pb mainly produces a carcinogenic effect (Jiang et al., 2018). The non-carcinogenic and carcinogenic risks from the toxic species of PM2.5 were evaluated by the hazard quotient (HQ) and lifetime carcinogenic risk (LCR), respectively. The US EPA human health risk assessment models were used to conduct carcinogenic and non-carcinogenic risk assessments (Khan et al., 2016):
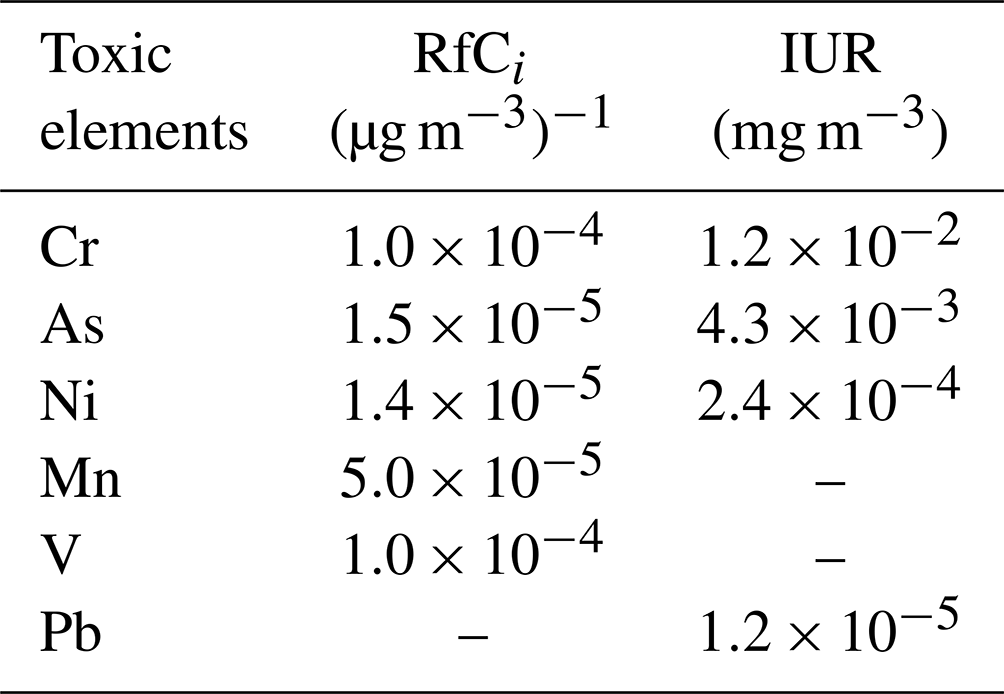
where ECinh is the average daily exposure concentration of toxic elements inhaled through respiration. GA is the concentration of toxic elements in each source composition. ET is the exposure time, 24 h d−1; EF is the exposure frequency, 365 d yr−1; ED is the exposure duration, 30 years; and AT is the average exposure time, calculated by 30 yr × 365 d yr−1 × 24 h d−1 for non-carcinogens and 70 yr × 365 d yr−1 × 24 h d−1 for carcinogens. RfCi is the inhalation reference concentration (mg m−3). IUR is the inhalation unit risk ((µg m−3)−1). A HQ greater than 1 indicated a non-carcinogenic risk to human health. For carcinogenic risk, LCR < 10−6 means no cancer risk, LCR between 10−6 and 10−4 is acceptable or tolerable, and LCR > 10−4 is intolerable. The exposure parameters are shown in Table 1 (Jiang et al., 2018; Khan et al., 2016).
Table 1Exposure parameters of toxic elements through inhalation route in health risk assessments.
3.1 Chemical components, meteorological parameters, and diurnal variations
Table 2 shows the seasonal average of chemical components and meteorological parameters from March 2018 to February 2019. In this study, March to May 2018 is defined as spring, June to August 2018 is defined as summer, September to November 2018 is defined as fall, and December 2018 to February 2019 is defined as winter. The daily average concentration of PM2.5 ranged from 6.7 to 234.0 µg m−3, with an annual average of 68.7 µg m−3. The order of average concentrations of PM2.5 in each season was winter (113.9 µg m−3) > spring (99.1 µg m−3) > autumn (38.9 µg m−3) > summer (23.7 µg m−3). Seasonal variations in PM2.5 were closely related to emission and meteorological conditions. In spring, the wind speed (WS) was higher (3.5 m s−1) than in other seasons. Pearson correlation showed that PM2.5 concentrations were significantly (p<0.0) correlated to WS () in spring. In summer, high boundary layer height (BLH) (520.4 m) significantly reduced PM2.5 concentrations. In autumn and winter, PM2.5 showed significant correlations between temperature (), relative humidity (r=0.62), and BLH (). Biomass burning and industrial emissions are important sources of aerosols in the urban atmosphere and contribute 7 %–27 % to PM2.5 mass in applicable cities (Tao et al., 2017; Andreae, 2019). Coal consumption and population density have a significantly positive effect on PM2.5 concentration (Zhou et al., 2018; Chow et al., 2022). The highest level of PM2.5 in winter was due to coal consumption, lower temperatures (4.9 ∘C), higher humidity (79.6 %), and lower BLH (419.7 m) than in summer.
Table 2Seasonal average concentration of components of PM2.5 (in µg m−3 and % in brackets) and meteorological parameters. T, RH, WS, and BLH represent air temperature, relative humidity, wind speed, and boundary layer height, respectively.
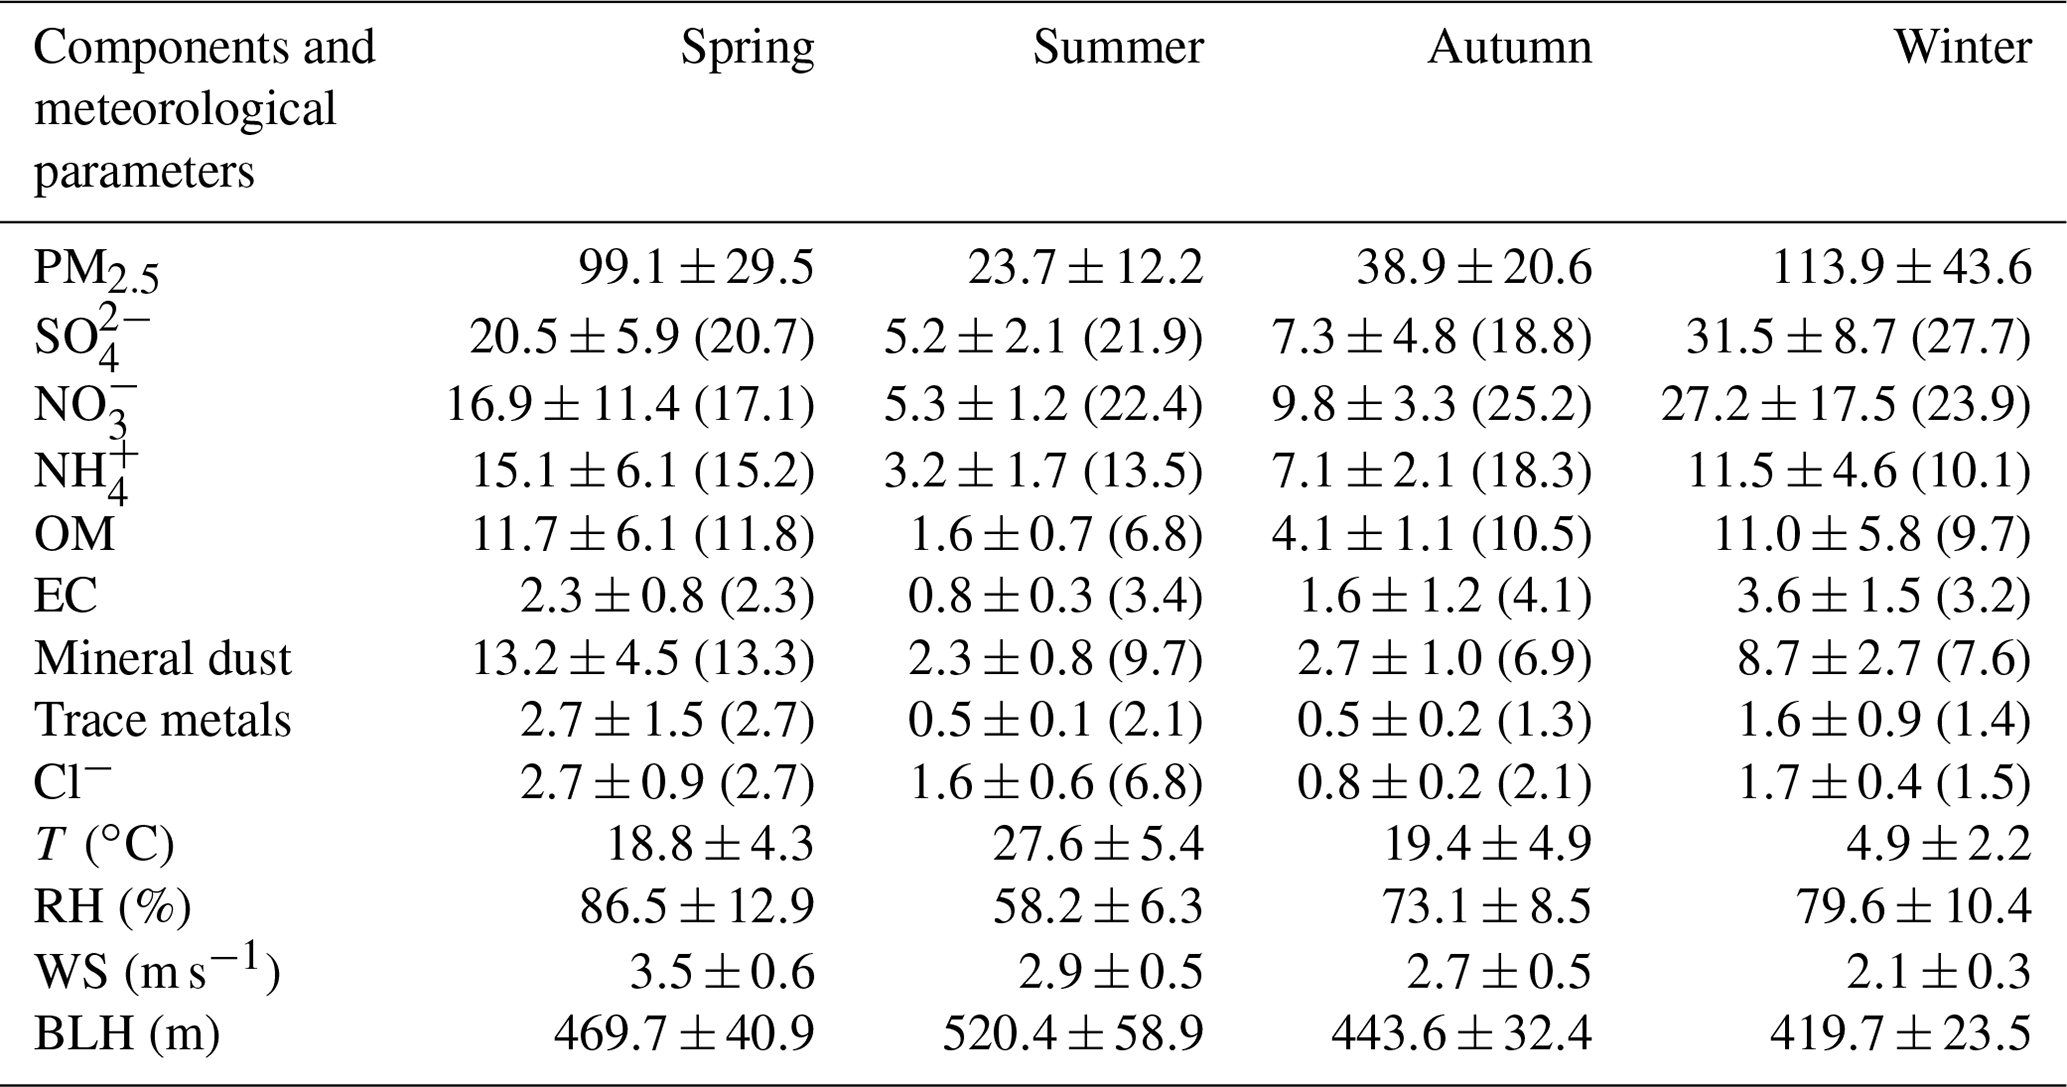
The seasonal variation in anthropogenic emissions also considerably affected PM2.5 concentrations. The order of the major components in PM2.5 was NO (20 %–31 %) > SO (16 %–27 %) > NH (11 %–19 %) > mineral dust (8 %–14 %) > OM (6 %–1 %) > EC (2 %–4 %) > trace metals (2 %–3 %) > Cl− (1 %–3 %). Sulfate, nitrate, and ammonium (SNA) accounted for 60 % of the total PM2.5 and were closely related to the secondary transformation of gaseous precursors. The concentration ratio of NO to SO () was used to differentiate the relative importance of nitrogen (generally related to vehicle emissions) and sulfur (normally related to stationary sources) in the atmosphere (Liu et al., 2019). Over the past few years, the mass ratio of was 2.13 in Ningbo, 1.89 in Hangzhou, and 1.21 in Beijing (Huang et al., 2017; Li et al., 2018). In this study, the average ratios of were 1.81 in spring, 1.20 in summer, 2.34 in autumn, and 1.59 in winter, indicating the enhanced secondary transformation of gaseous pollutants (e.g., SO2, NOx, volatile organic compounds – VOCs) during heavily polluted periods (Liu et al., 2019; Z. R. Liu et al., 2018). The oxidation rates of SO2 and NO2 need to be further investigated. Carbonaceous aerosols (OM and EC) accounted for 12 % and 14 % of PM2.5 in spring and winter, respectively. The large increase in the number of coal fires used for residential heating in winter may increase the abundance of carbon-containing emissions, including OC, EC, and VOCs (Islam et al., 2020). Compared with 2015, the concentrations of OM and EC decreased from 22.9 % to 12.8 % (Chen et al., 2017). This may be related to policies to control coal combustion and motor vehicle emissions, considering similar meteorological conditions in the two periods (Tao et al., 2017; Jeong et al., 2019).
Figure 1 shows the diurnal variation in chemical components in PM2.5. The seasonal differences were mainly reflected in the variation in the timing of peak values. In spring (Fig. 1a), the highest and lowest PM2.5 concentrations were 143.6 µg m−3 at 07:00 UTC and 94.8 µg m−3 at 14:00 UTC, respectively. The concentration of SNA had obvious diurnal variations. From 06:00 to 18:00 UTC, the average concentration of NO increased from 17.6 to 21.8 µg m−3, while the average concentration of SO decreased from 23.2 to 15.9 µg m−3. In summer (Fig. 1b), the highest and lowest PM2.5 concentrations were 23.5 µg m−3 at 09:00 UTC and 14.2 µg m−3 at 14:00 UTC, respectively. The maximum concentration difference in SNA between day and night was less than 10 µg m−3, indicating the study area was in a relatively stable background field (Chen et al., 2018). In autumn (Fig. 1c), the highest and lowest PM2.5 concentrations were 77.1 µg m−3 at 08:00 UTC and 47.8 µg m−3 at 16:00 UTC, respectively. The concentration of SNA increased at night and decreased during the day. The maximum concentration difference was more than 20 µg m−3. In winter (Fig. 1d), from 18:00 to 23:00 UTC, the concentration of SNA increased from 74.5 to 108.7 µg m−3, with increasing rates of 8.5 µg m−3 h−1. The height of the atmospheric boundary layer decreased early in the winter afternoons (Chen et al., 2018). The values of PM2.5 in winter were higher at night due to the coal combustion and biomass burning (BB) for residential heating (Zou et al., 2017). In summary, compared with the spring and winter, PM2.5 presented similar and relatively flat diurnal patterns in both autumn and summer. Although the seasonal variations in mass concentrations and aerosol compositions were substantially different, the concentrations of aerosol species showed similar diurnal variation patterns during all the sampling days, with higher values in the nighttime and early morning, suggesting that the factors driving the diurnal variations were similar.
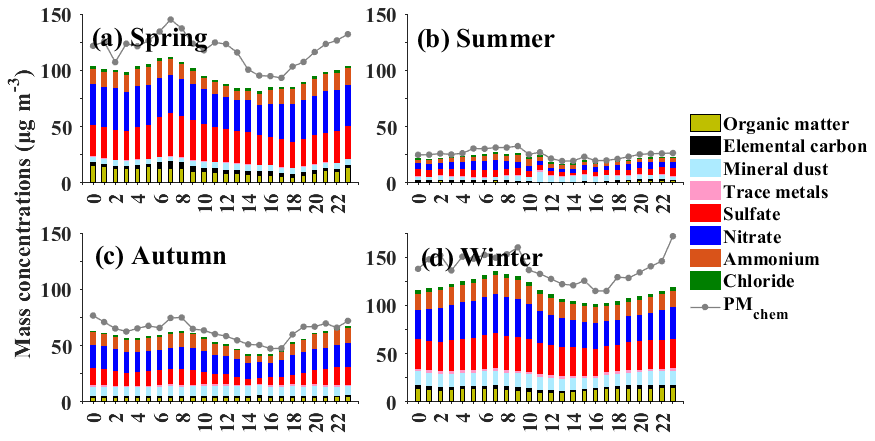
Figure 1Average diurnal variation in the concentrations of major chemical components of PM2.5 for each season.

Figure 2Chemical compositions of PM2.5 and mass ratio of at different pollution levels of the total samples per season. C, MP, and HP represent the clean day, moderately polluted day, and heavily polluted day, respectively. “%” represents the proportion of the filter sample quantity at each pollution level out of the total samples.
3.2 Variation in PM2.5 chemical compositions at different pollution levels
Figure 2 presents the PM2.5 concentrations and components at different pollution levels. In this study, it was defined as the clean day (C) when the daily average PM2.5 concentrations were less than 35 µg m−3, the moderate pollution day (MP) when PM2.5 concentrations were more than 35 µg m−3 and less than 150 µg m−3, and the heavy pollution day (HP) when PM2.5 concentrations were more than or equal to 150 µg m−3. As shown in Fig. 2a, the annual average concentration of the water-soluble inorganic ions (WSIIs) was 41.9 µg m−3, and they accounted for 61.8 % of PM2.5. WSIIs were largely responsible for the variability in PM2.5. The ratios of SNA in spring and winter were similar, with ratios of 65.0 % for clean days, 75.0 % for moderate pollution days, and 83.9 % for heavy pollution days. With the degradation of air quality, the contribution of NO noticeably increased from 27.5 % to 47.8 % in spring and from 28.9 % to 44.7 % in autumn. To understand the oxidation rates of SO2 and NO2, the sulfur oxidation rate and nitrogen oxidation rate (defined as SOR = SO(SO + SO2) and NOR = NO(NO + NO2)) were calculated. The critical value of both SOR and NOR in the atmosphere is 0.1 (Win et al., 2020). The order of the seasonal average NOR was winter (0.21) > spring (0.18) > autumn (0.17) > summer (0.15), while the order of the seasonal average SOR was winter (0.51) > spring (0.43) > autumn (0.42) > summer (0.36). PM2.5 pollution in winter is associated with high RH and rapid production of particulate sulfate from the oxidation of SO2 emitted by coal combustion (J. F. Wang et al., 2020). From summer to winter, the NOR and SOR values increased by 40.0 % and 41.6 %, respectively. SOR and NOR showed a strong positive correlation with relative humidity, with a correlation coefficient of 0.53 and 0.61, respectively. The contribution of coal combustion varied between 30 % and 57 % of PM2.5 in winter (Zhang et al., 2017). Under the conditions of high coal combustion emissions and high RH, the rapid oxidation of SO2 occurred to produce sulfate. The sensitivity of PM2.5 to surface temperature, wind speed, and boundary layer height is negative, while the sensitivity to relative humidity is positive (Chen et al., 2018; Sulaymon et al., 2021). In summer, the correlation coefficients of PM2.5 with RH, T, WS, and BLH were 0.42, −0.47, −0.15, and −0.23, respectively. In winter, the correlation coefficients of PM2.5 concentration with RH, T, WS, and BLH were 0.74, −0.57, −0.31, and −0.32, respectively. High RH (79.6 %), low temperature (4.9 ∘C), low WS (2.1 m s−1), and low BLH (419.7 m) provided favorable conditions for the accumulation of PM2.5.
Coal combustion, biomass burning, and motor vehicle emissions all led to a remarkable increase in carbonaceous aerosols (Chow et al., 2022). As shown in Fig. 2b, carbonaceous species also had a significantly enhanced contribution in the colder season compared to the warmer season. The seasonal differences might be related to the effects of meteorological conditions and source emissions. Pearson correlation showed that the relationships between OM and EC and meteorological parameters (T, RH, WS, and BLH) were not significant (Table 2). To explore the possible pollution sources, it is feasible to study the mass ratio of under different pollution levels. OC comprises thousands of organic compounds. EC is stable and mainly derived from primary sources of combustion products (Zhang et al., 2017; Wu et al., 2020). The mass ratio of motor vehicle emissions (1.1) is lower than that of coal combustion (2.7) and biomass burning (9.0) (Xu et al., 2021). In this study, the ratios continuously decreased as air pollution got worse, and the values ranged from 6.1 (C) and 4.1 (MP) to 3.9 (HP) in spring, from 6.2 (C) to 4.8 (MP) in autumn, and from 4.3 (C) and 2.7 (MP) to 1.3 (HP) in winter. The annual average ratio of decreased by 56.1 % from clean days to heavy pollution days. If the values were in the range of 2.5–5.0, vehicle exhaust emissions were considered the main source of OC and EC in aerosols, whereas if the values were in the range of 5.0–10.5, coal combustion was considered the main source of OC and EC in aerosols (Gao et al., 2018; Y. K. Liu et al., 2018). Distinct differences in the evolution of the ratio on polluted days imply that mobile sources are likely more important. Both the increase in motor vehicle emissions and the formation of meteorological conditions conducive to pollutant accumulation contribute to the decrease in the ratio.
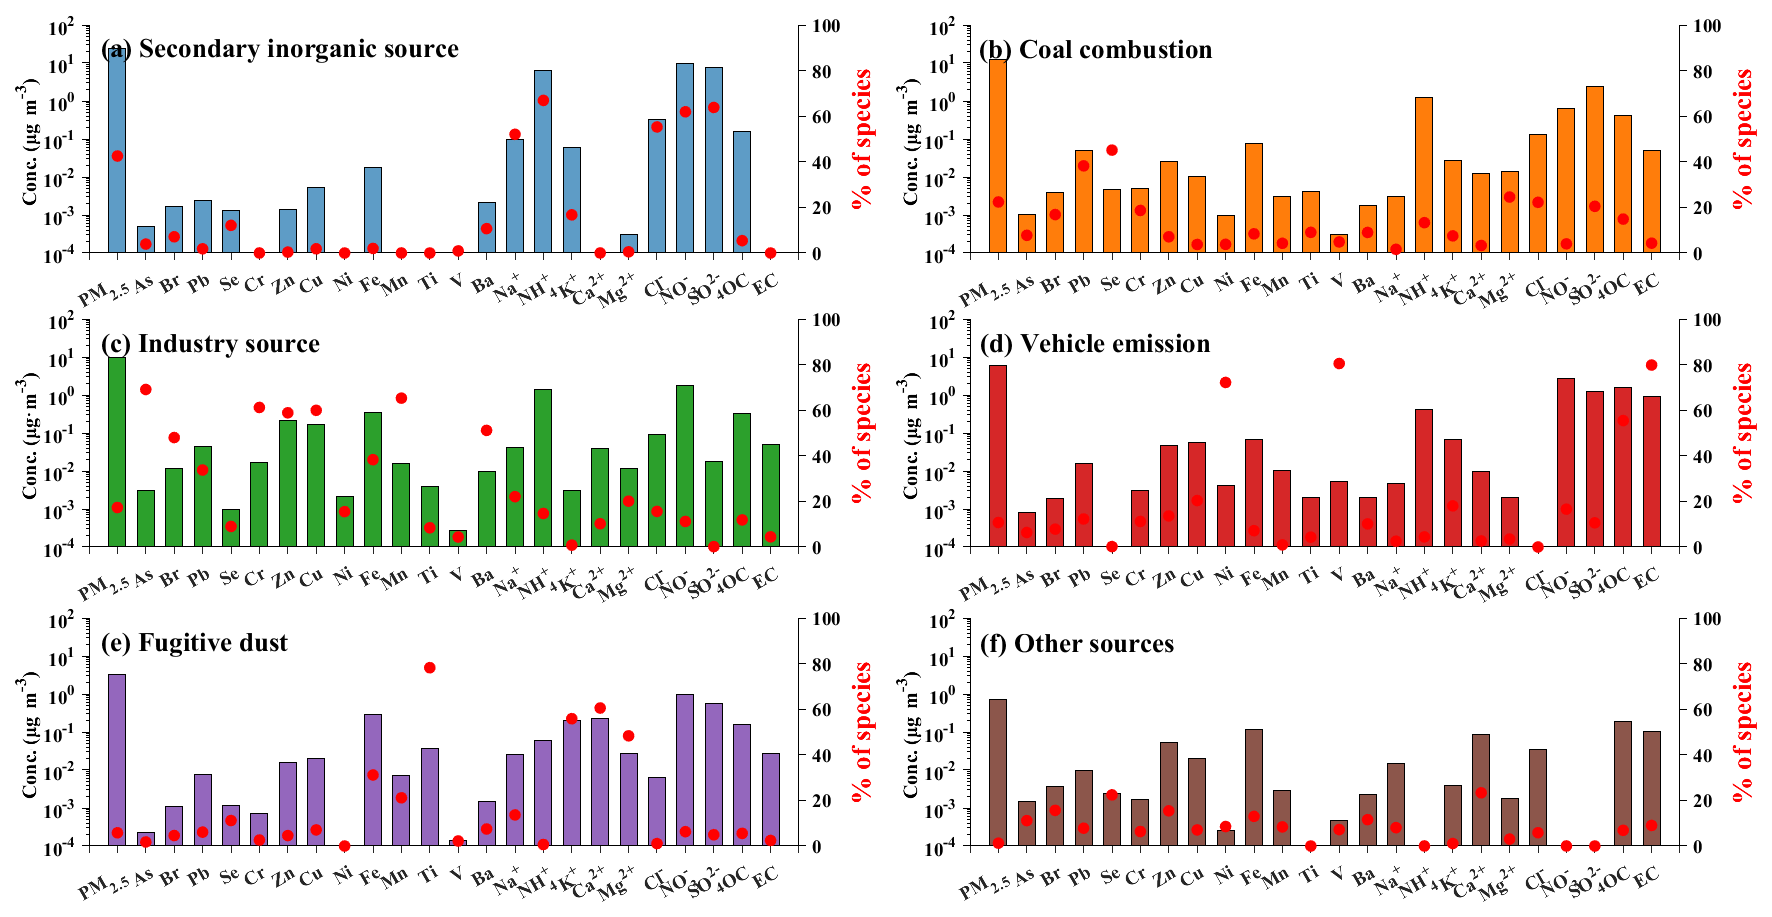
Figure 3Factor profile in each source for PM2.5 during the whole year. The histograms are the mass concentration of each species to every species (µg m−3), and the red dots are the relative contributions of each source to every species (%).
3.3 Source identification and apportionment
3.3.1 Elemental profile and source apportionment from the PMF model
To further quantitatively determine the source apportionment of PM2.5, the EPA PMF5.0 model was adopted. The number of factors in the PMF model corresponded to the number of sources of PM2.5 in this study. When the number of factors was set to six, the fitting degree of the model calculation results was the highest. Figure 3 presents the factor profiles and relative contributions of six factors to each species (% of species total), including secondary inorganic aerosol source (SIS), coal combustion (CC), industry source (IS), vehicle emission (VE), fugitive dust (FD), and other sources (OSs). The meaning of the percentage sign is the proportion of each chemical component in each source of PM2.5. As shown in Fig. 3a, the compositions of SIS were more clear than other sources. NO and SO are mainly from the oxidation of NOx and SO2, while NH probably comes from the conversion processes between ammonia and sulfuric and nitric acid (Win et al., 2020). Factor 1 was identified as the SIS with distinctly high loads of NH (66.9 %), NO (61.9 %), SO (63.8 %), and Cl− (55.3 %). Factor 2 (Fig. 3b) was associated with a high proportion of Pb (38.2 %) and Se (45.1 %) and a moderate proportion of As (14.3 %), SO (20.5 %), and Cl− (22.2 %). Pb and As are important identifying elements of coal combustion and are used as tracers (Xie et al., 2020). SO is formed by the photochemical oxidation of sulfur-containing precursors (SO2 and H2S) released by coal combustion (Zong et al., 2016). Given the source profile, Factor 2 was related to coal combustion emissions. Factor 3 (Fig. 3c) was characterized by the association of heavy metal pollutants such as As (42.8 %), Pb (33.8 %), Cr (61.1 %), Zn (58.9 %), Cu (59.4 %), Fe (38.3 %), and Mn (40.1 %). As, Pb, Cr, Fe, and Mn are related to metal smelting and processing (Fang et al., 2021). However, the percentage of OC was only 11.3 %, while rates of Zn (58.9 %) and Cu (59.4 %) were higher in Factor 3 (Fig. 3c). Cu, Zn, and OC are used as tracers of a mixed source of traffic and industrial, and OC is the major pollutant in the vehicle exhaust (S. B. Wang et al., 2020). Compared to motor vehicle emissions, Factor 3 should be significantly influenced by industrial activities. Cu and Zn were mainly from industrial process sources. As discussed above, Factor 3 was attributed to IS. Factor 4 (Fig. 3d) was characterized by the association of vehicle emissions, with the high proportions of Ni (54.7 %), V (80.5 %), OC (55.4 %), EC (79.8 %), and NO (20.3 %). VOCs and NOx released from vehicles were the precursors of the secondary organic compounds and nitrate in PM2.5 and were important catalysts for increased atmospheric oxidation (Guevara et al., 2021). OC and EC are mainly from the vehicle exhaust, and Ni and V are usually tracers of heavy oil combustion (Wu et al., 2020; Veld et al., 2021). Factor 4 contained a high proportion of OC, EC, and NO, which could be considered vehicle emissions, while Factor 4 contained Ni and V, which were also influenced by shipping emissions (Gao et al., 2018; Veld et al., 2021). As shown in Fig. 3e, Factor 5 had relatively high proportions of Fe (31.1 %), Ti (78.2 %), K+ (55.8 %), Ca2+ (60.5 %), and Mg2+ (48.3 %). Ti, Fe, and Mg are both common crustal elements that can represent the source of mineral dust. K+ and Ca2+ are considered to be significant tracers of biomass burning, which have obvious seasonal variations (Tong et al., 2020; Silva et al., 2022). Factor 5 was classified as the fugitive dust and biomass burning, including road dust, industrial dust, and soil dust. Factor 6 (Fig. 3f) was unidentified and could be affected by coal combustion, industrial processes, and biomass burning. In the absence of a clear designation of the source, Factor 6 was attributed to an erroneous contribution from a different source.
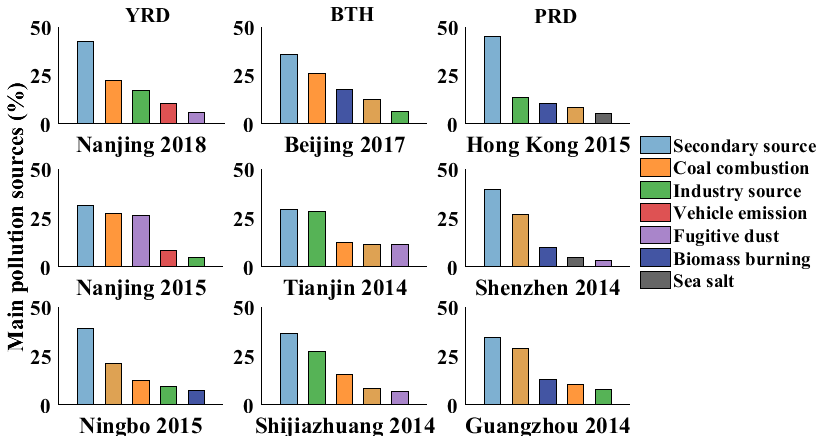
Figures 4 and 5 show the comparisons of our PMF results with the previous findings. In the YRD region, SIS contributed about 42.5 % to PM2.5 in Nanjing in this study, which was higher than that reported by S. W. Li et al. (2020), while the contribution of CC was lower. However, other sources of PM2.5 in different cities were more complicated. In the BTH, IS was a crucial source and contributed about 30 % in Tianjin and Shijiazhuang (Huang et al., 2017). In contrast, IS in Nanjing contributed only 17.3% of PM2.5 pollution. Recent emission control policies in the YRD have had positive effects on reducing industrial pollution. In the PRD, vehicle emissions, secondary nitrate, coal burning, and industrial emissions showed obvious local emission characteristics. An extra 30 % PM2.5 concentration was closely related to local emissions in the downtown and industrial areas (Huang et al., 2014; T. T. Li et al., 2020; Chow et al., 2022). In this study, VE contributed only 10.7 % in Nanjing. It is worth noting that the PMF model assumes that source profiles do not change significantly over time and that species do not undergo chemical reactions (Paatero and Tapper, 1994). The human activities in seasonal variations in this study made the actual pollution incompatible with the ideal assumption. For example, emissions from coal combustion increased the contribution of CC in winter significantly (Xu et al., 2021). In addition, the sources of air masses in each season also created uncertainties. All of these required detailed discussions of regional transport conditions in each season.
3.3.2 Source identification by backward air mass trajectory analysis
The regional transport of air pollutants exerts a profound impact on local air quality (Shu et al., 2017). Figure 6 shows the quantified contributions of PM2.5 with 48 h backward trajectories. In spring (Fig. 6a), nearly half of the air masses (cluster a3) stemmed from northern Jiangxi, passed over Anhui Province before arriving at the sampling sites, and had the highest PM2.5 average value (127.2 µg m−3). CC from cluster a3 had the highest contribution, with mass and percentage contributions being 41.0 µg m−3 and 32.3 %, respectively. In addition, FD contributed relatively highly in clusters a2 and a3, with proportions of 18.2 % and 10.3 %, respectively. Increased contribution from fugitive dust was related to industrial and construction activities (Xu et al., 2016). Cluster a2 originated in Liaoning, and cluster a3 was from northern Jiangxi. There were many industrial cities located in Liaoning, and the largest coal-fired thermal power plant in Jiangxi was located in the northern city of Jiujiang (Xu et al., 2016; Wang et al., 2019). Long-range transport of dust from these areas would have a significant impact on the formation of severe particle pollution in the YRD. In summer (Fig. 6b), the most obvious characteristic of regional transport was significantly influenced by the ocean. Clusters b2 and b3 were relatively clean, with low concentrations of PM2.5 (28.2 µg m−3 for b2 and 32.4 µg m−3 for b3). These clusters passed over the ocean areas and accounted for more than half of all trajectories. The magnitude of total CC, IS, and VE exhibited a descending order from clusters b1 to b3. The dilution effects of clean ocean air masses played a vital role in particulate pollution. In autumn (Fig. 6c), there were the highest concentrations of PM2.5 in cluster c1, with an average value of 84.6 µg m−3. CC (23.1 %) and IS (27.6 %) contributed relatively highly in cluster c1, indicating that regional transport from industrial regions might play an important role. For SIS, the proportion of NH in these air masses was significantly higher in autumn than in other seasons (Table 2). The increase in the proportion of NH indicated that air pollution masses were heavily affected by nearby agricultural activities. In winter (Fig. 6d), clusters d1 (108.3 µg m−3) and d3 (122.6 µg m−3) originated from Shandong Province and the BTH, accounting for more than three-quarters of the air masses. These air masses, which moved at high altitudes with a slow speed, could have carried abundant air pollutants. Cluster d2 (153.9 µg m−3) was short-distance transport and derived from Jiangsu Province. The contribution of SIS exhibited an increasing order from clusters d1 (22.9 %) to d3 (43.4 %) to d2 (55.5 %), corresponding to the transition from the long-range transport of air masses to the short-range transport of air masses.
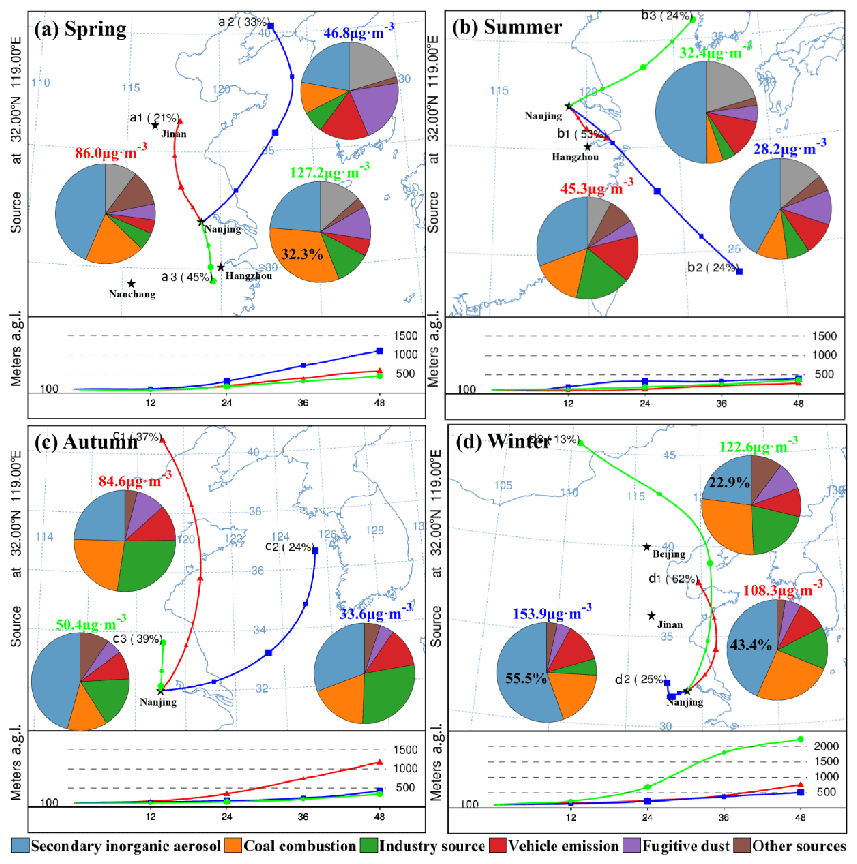
Figure 6Source contributions to PM2.5 grouped by air masses associated with different 48 h backward trajectory clusters. The pie charts show the average source contribution for corresponding clusters. The abbreviation a.g.l. signifies above ground level.
Figure 7 shows the spatial distribution of the contribution from each source of PM2.5 by the CWT method and highlights the potential geographic origins. For SIS (Fig. 7a), the high levels (10–15 µg m−3) of this source mainly originated from local emissions in Jiangsu and regional transport from Shandong Province. For CC (Fig. 7b), the high emissions (10–11 µg m−3) were distributed in the YRD and central China. The weighted concentration values of CC were lower than those of the SIS. High concentrations near the center area are associated with local sources, while those far away from the center area are indicative of regional transport (Shu et al., 2017). The secondary aerosol source was probably from the accumulation of precursors emitted by local emissions. For IS and VE (Fig. 7c and d), there were no high potential areas for these sources. The moderate weighted concentration values of IS (8–10 µg m−3) were potentially located in the north of Jiangsu, Anhui, and Jiangxi, which are the most important industrial base in China. The oceanic air masses are influenced by tropical cyclones with high temperature and strong wind (Li et al., 2018; Chow et al., 2022). Based on the backward trajectory calculation, most of the long-range transport of PM2.5 passed through the Yellow Sea and the East Sea. High wind speed had a great effect on mitigating PM2.5 pollution.
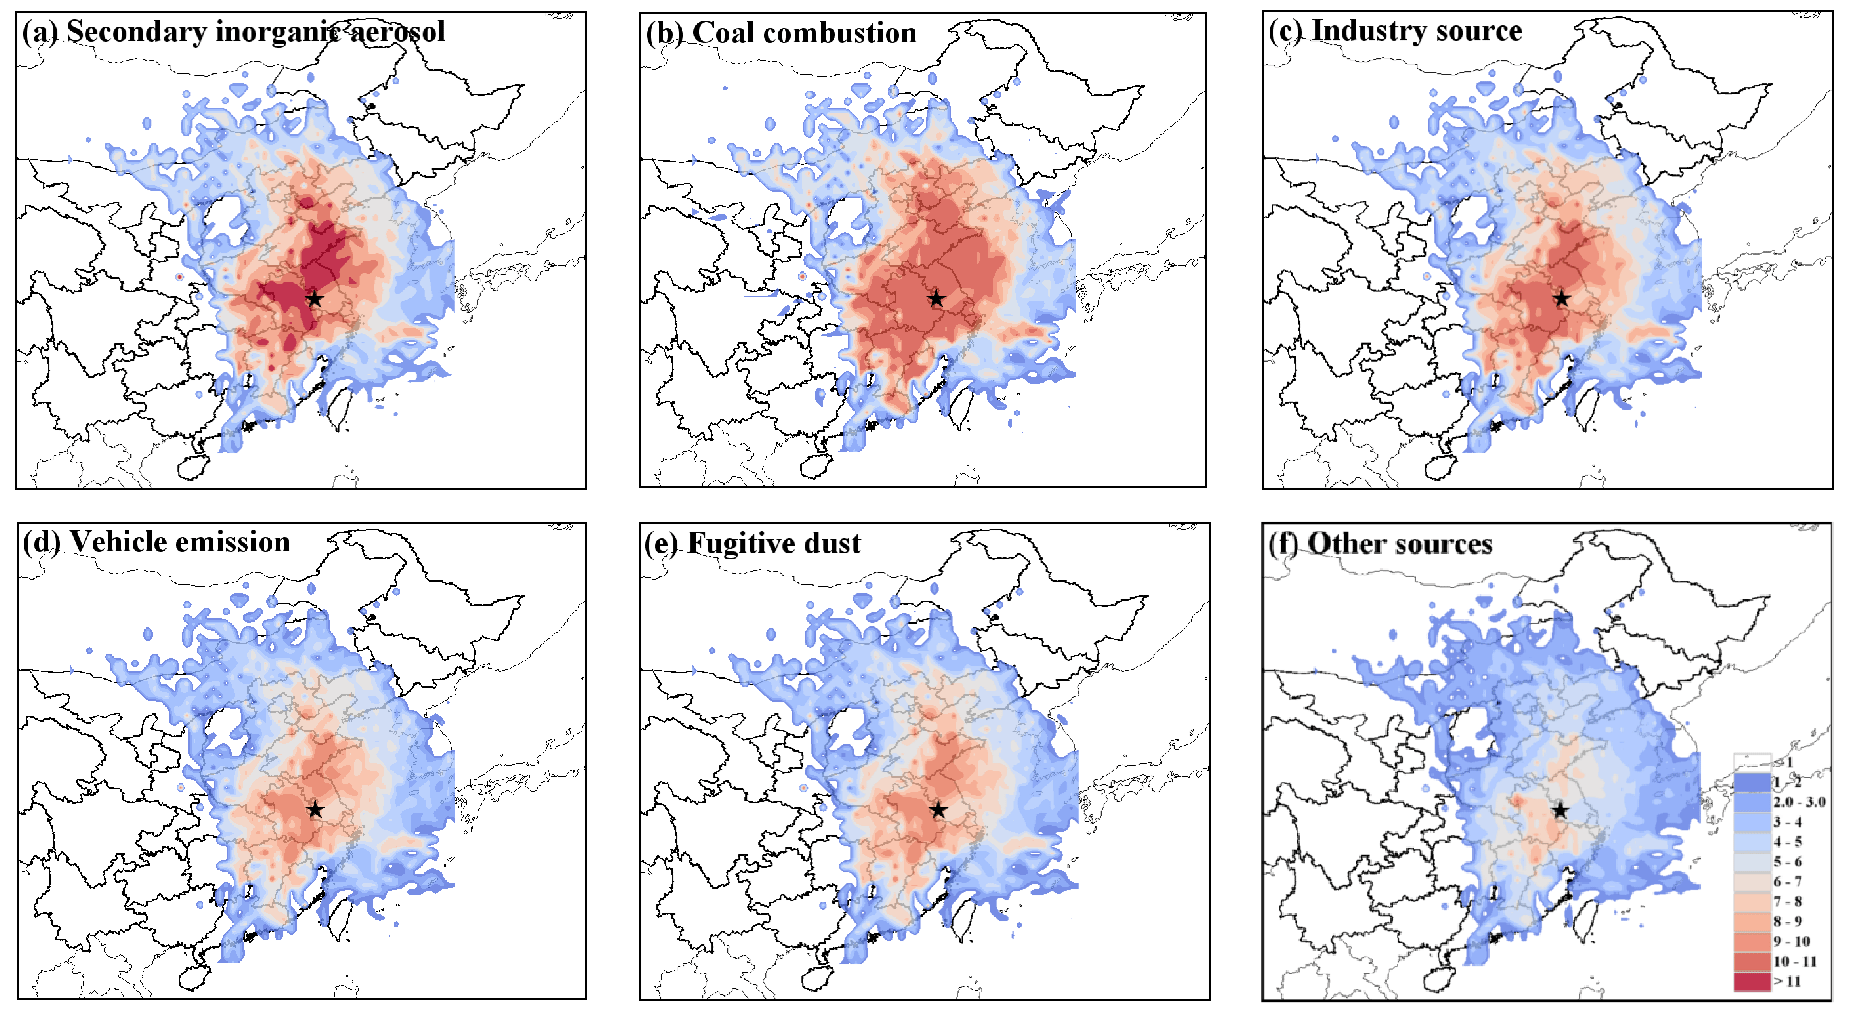
Figure 7Potential source regions for individual sources of PM2.5 identified by the CWT method from March 2018 to February 2019.
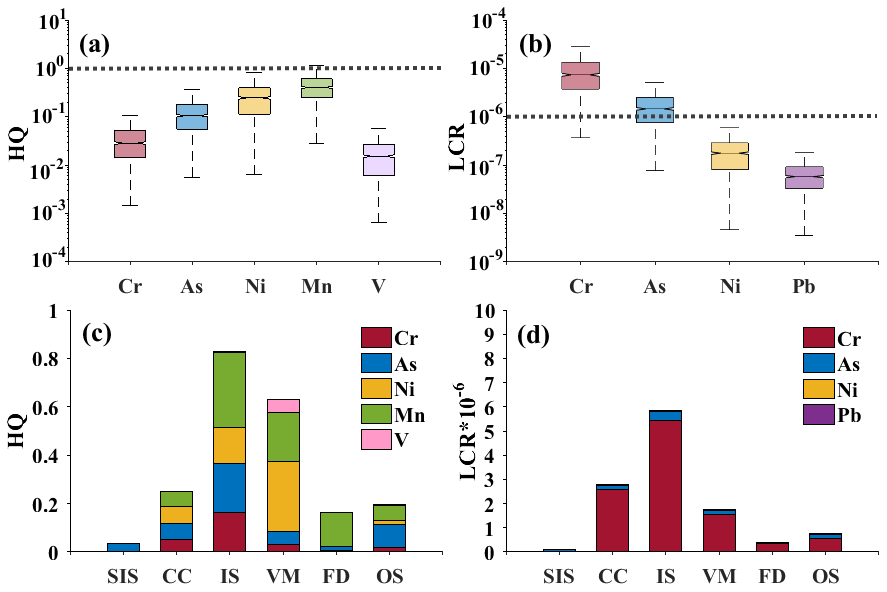
Figure 8Non-carcinogenic (a) and carcinogenic (b) risks of toxic elements. Non-carcinogenic (c) and carcinogenic (d) risks of the sources identified for PM2.5 in Nanjing. HQ, LCR, SIS, CC, IS, VM, FD, and OSs represent hazard quotient, lifetime carcinogenic risk, secondary inorganic aerosol source, coal combustion, industry source, vehicle emission, fugitive dust, and other sources, respectively.
3.4 Non-carcinogenic and carcinogenic health risks of toxic metal elements in each source of PM2.5
Figure 8 shows the HQ values of non-carcinogenic risk and the LCR values of carcinogenic risk in PM2.5 and their total health risk in each source. For non-carcinogenic risk (Fig. 8a), the order of the average HQ values was Mn (0.47) > Ni (0.32) > As (0.14) > Cr (0.04) > V (0.02). The HQ values of toxic elements were all less than 1, which indicated that there was no significant non-carcinogenic risk. However, the summation of five HQ values was higher than one, indicating that the combined exposure to the pollutant class still had adverse effects. The carcinogenic risk (Fig. 8b) posed by Ni () and Pb () was lower than and could be acceptable. The carcinogenic risk level of Cr () and As () was within the tolerance or acceptable level (–) (Zheng et al., 2019). Figure 8c and d show the integrated assessment of the source apportionment in toxic elements. IS accounted for the largest proportion of the non-carcinogenic and carcinogenic risk, with the HQ of 0.83 and LCR of , respectively. Although the PMF results indicated that SIS had the highest contribution to PM2.5 (Fig. 5), the health risk results showed that the health risks of toxic elements from IS and CC were much higher than those from SIS. Previous studies showed that coal combustion sources in Beijing, Shanxi, and Jinan were responsible for higher respiratory exposure and health risks, while the fugitive dust source in Liaoning contained higher levels of Pb, As, and Co (Zeng et al., 2019). As, Cr, and Ni in PM2.5 were within the acceptable level for both children and adults in Nanjing, but there was a potential carcinogenic risk posed by Pb via ingestion to children and adults (Hu et al., 2012). It was related to the differences in PM2.5 pollution characteristics and source contributions in different cities. The ingestion exposure may result in the potential health risk from IS, CC, and VE. Based on the implementation of energy conservation and emission reduction policies, the main source of pollution in Nanjing is SIS at present, and the health risk has been alleviated. However, we should pay more attention to the health burden of vehicle emissions, coal combustion, and industrial processes.
Identifying and quantitatively assessing the contributions and health risks of pollution sources have played an important role in formulating policies to control particle pollution. We have derived a high-quality PM2.5 composition dataset, based on monitoring chemical components from March 2018 to February 2019 in Nanjing. The PMF and backward trajectory results were adopted to investigate the chemical characteristics and regional transports of each source. The health risk assessment was used to explore non-carcinogenic and carcinogenic risks of toxic elements.
The results showed that PM2.5 concentrations ranged from 6.7 to 234.0 µg m−3, with an annual average of 68.7 µg m−3. Water-soluble ions contributed the most to PM2.5. From summer to winter, the ratio increased from 1.2 to 1.59. The ratio decreased by 56.1 % from clean days to heavy pollution days. The average ratio on heavy pollution days was 1.3. Both the increase in motor vehicle emissions and the formation of meteorological conditions conducive to pollutant accumulation contribute to the decrease in the ratio. Based on the PMF model, the source variations and health risks were assessed. The contribution of identified sources – including SIS (42.5 %), CC (22.4 %), IS (17.3 %), VE (10.7 %), FD (5.8 %), and other sources (1.3 %) – had different spatial distributions and seasonal variations. The CWT analysis indicated that high emissions (10–11 µg m−3) of SIS and CC were distributed in the YRD and central China in winter. Moderate emissions (8–9 µg m−3) of IS and VE were potentially located in the north of Jiangsu, Anhui, and Jiangxi. The carcinogenic and non-carcinogenic risks of toxic elements (Cr, As, Ni, Mn, V, and Pb) mainly came from IS, VE, and CC, which were within the tolerance or acceptable level. Based on the implementation of energy conservation and emission reduction policies, the main source of pollution in Nanjing is SIS at present, and the health risk has been alleviated. However, we should pay more attention to the health burden of vehicle emissions, coal combustion, and industrial processes.
This study provided new insight for PM2.5 research between the source apportionment and health risk. The results presented characteristics of chemical components, pinpointed secondary transformation processes leading to the high PM2.5 concentrations, revealed spatial variations in source contribution, and provided new references for megacities to conduct health risk analysis on air pollution control measures.
PM2.5 composition data were collected by the atmospheric heavy metal monitor and the in situ gas and aerosol composition monitor at the School of Atmospheric Sciences, Nanjing University (the data presented in this article are available upon request from Yangzhihao Zhan (zyzh1049744276@gmail.com)). Air quality monitoring data were acquired from the official NEMC real-time publishing platform (https://air.cnemc.cn:18007/, China National Environmental Monitoring Centre, 2023). Meteorological data were obtained from the University of Wyoming website (http://weather.uwyo.edu/, University of Wyoming, 2023). The NCEP FNL data were taken from the NCEP (https://doi.org/10.5065/D6M043C6, NOAA, 2023). These data can be downloaded for free as long as one agrees to the official instructions.
YZ and MX had the original ideas, designed the research, collected the data, and prepared the original draft. YZ, WZ, PC, YL, and RZ performed PMF experiments and carried out the data analysis. MX and WZ acquired financial support for the project leading to this publication. TW, DG, JT, KZ, SL, BZ, and ML reviewed the initial draft and checked the English of the original paper.
The contact author has declared that none of the authors has any competing interests.
Publisher's note: Copernicus Publications remains neutral with regard to jurisdictional claims in published maps and institutional affiliations.
The authors are grateful to NEMC for the air quality monitoring data, to NCDC for the meteorological data, and to NCEP for global final analysis fields. We gratefully acknowledge the NOAA Air Resources Laboratory (ARL) for providing the HYSPLIT transport and dispersion model used in this work. We acknowledge the Chinese Academy of Meteorological Sciences for supporting this work (http://www.meteothink.org/, last access: 7 April 2023).
This work was supported by the National Natural Science Foundation of China (grant nos. 42275102), the Natural Science Foundation of Jiangsu Province (grant no. BK20211158), and the National Key Research and Development Program of China (grant no. 2018YFC0213502).
This paper was edited by Harald Saathoff and reviewed by two anonymous referees.
Andreae, M. O.: Emission of trace gases and aerosols from biomass burning an updated assessment, Atmos. Chem. Phys., 19, 8523–8546, https://doi.org/10.5194/acp-19-8523-2019, 2019.
Behrooz, R. D., Kaskaoutis, D. G., Grivas, G., and Mihalopoulos, N.: Human health risk assessment for toxic elements in the extreme ambient dust conditions observed in Sistan, Iran, Chemosphere, 262, 127835, https://doi.org/10.1016/j.chemosphere.2020.127835, 2021.
Brokamp, C., Jandarov, R., Rao, M. B., LeMasters, G., and Ryan, P.: Exposure assessment models for elemental components of particulate matter in an urban environment: A comparison of regression and random forest approaches, Atmos. Environ., 151, 1–11, https://doi.org/10.1016/j.atmosenv.2016.11.066, 2017.
Chen, D., Cui, H. F., Zhao, Y., Yin, L. N., Lu, Y., and Wang, Q. G.: A two-year study of carbonaceous aerosols in ambient PM2.5 at a regional background site for western Yangtze River Delta, China, Atmos. Res., 183, 351–361, https://doi.org/10.1016/j.atmosres.2016.09.004, 2017.
Chen, Z. Y., Xie, X. M., Cai, J., Chen, D. L., Gao, B. B., He, B., Cheng, N. L., and Xu, B.: Understanding meteorological influences on PM2.5 concentrations across China: a temporal and spatial perspective, Atmos. Chem. Phys., 18, 5343–5358, https://doi.org/10.5194/acp-18-5343-2018, 2018.
Cheng, J., Tong, D., Zhang, Q., Liu, Y., Lei, Y., Yan, G., Yan, L., Yu, S., Cui, Y. R., Clarke, L., Geng, G. G., Zheng, B., Zhang, X. T., Davis, S. J., He, K. B.: Pathways of China's PM2.5 air quality 2015–2060 in the context of carbon neutrality, Nat. Sci. Rev., 8, nwab078, https://doi.org/10.1093/nsr/nwab078, 2021.
China National Environmental Monitoring Centre: Air pollutants data, https://air.cnemc.cn:18007/, last access: 7 Apri 2023.
Chow, W. S., Huang, X. H. H., Leung, K. F., Huang, L., Wu, X. R., and Yu, J. Z.: Molecular and elemental marker-based source apportionment of fine particulate matter at six sites in Hong Kong, China, Sci. Total Environ., 813, 152652, https://doi.org/10.1016/j.scitotenv.2021.152652, 2022.
Conibear, L., Butt, E. W., Knote, C., Arnold, S. R., and Spracklen, D. V.: Residential energy use emissions dominate health impacts from exposure to ambient particulate matter in India, Nat. Commun., 9, 617, https://doi.org/10.1038/s41467-018-02986-7, 2018.
Fan, H., Zhao, C. F., and Yang, Y. K.: A comprehensive analysis of the spatio-temporal variation of urban air pollution in China during 2014–2018, Atmos. Environ., 220, 117066, https://doi.org/10.1016/j.atmosenv.2019.117066, 2020.
Fang, B., Zeng, H., Zhang, L., Wang, H. W., Liu, J. J., Hao, K. L., Zheng, G. Y., Wang, M. M., Wang, Q., and Yang, W. Q.: Toxic metals in outdoor/indoor airborne PM2.5 in port city of Northern, China: Characteristics, sources, and personal exposure risk assessment, Environ. Pollut., 279, 116937, https://doi.org/10.1016/j.envpol.2021.116937, 2021.
Feng, X. Y., Tian, Y. Z., Xue, Q. Q., Song, D. L., Huang, F. X., and Feng, Y. C.: Measurement report: Spatiotemporal and policy-related variations of PM2.5 composition and sources during 2015–2019 at multiple sites in a Chinese megacity, Atmos. Chem. Phys., 21, 16219–16235, https://doi.org/10.5194/acp-21-16219-2021, 2021.
Gao, D., Xie, M., Liu, J., Wang, T. J., Ma, C. Q., Bai, H. K., Chen, X., Li, M. M., Zhuang, B. L., and Li, S.: Ozone variability induced by synoptic weather patterns in warm seasons of 2014–2018 over the Yangtze River Delta region, China, Atmos. Chem. Phys., 21, 5847–5864, https://doi.org/10.5194/acp-21-5847-2021, 2021.
Gao, J. J., Wang, K., Wang, Y., Liu, S. H., Zhu, C. Y., Hao, J. M., Liu, H. J., Hua, S. B., Tian, H. Z.: Temporal-spatial characteristics and source apportionment of PM2.5 as well as its associated chemical species in the Beijing-Tianjin-Hebei region of China, Environ. Pollut., 233, 714–724, https://doi.org/10.1016/j.envpol.2017.10.123, 2018.
Guevara, M., Jorba, O., Soret, A., Petetin, H., Bowdalo, D., Serradell, K., Tena, C., van der Gon, H. D., Kuenen, J., Peuch, V. H., and Garcia-Pando, C. P.: Time-resolved emission reductions for atmospheric chemistry modelling in Europe during the COVID-19 lockdowns, Atmos. Chem. Phys., 21, 773–797, https://doi.org/10.5194/acp-21-773-2021, 2021.
Hayes, R. B., Lim, C., Zhang, Y., Cromar, K., Shao, Y., Reynolds, H. R., Silverman, D. T., Jones, R. R., Park, Y., Jerrett, M., Ahn, J., and Thurston, G. D.: PM2.5 air pollution and cause-specific cardiovascular disease mortality, Int. J. Epidemiol., 49, 25–35, https://doi.org/10.1093/ije/dyz114, 2019.
Hu, X., Zhang, Y., Ding, Z. H., Wang, T. J., Lian, H. Z., Sun, Y. Y., and Wu, J. C.: Bioaccessibility and health risk of arsenic and heavy metals (Cd, Co, Cr, Cu, Ni, Pb, Zn and Mn) in TSP and PM2.5 in Nanjing, China, Atmos. Environ., 57, 146–152, https://doi.org/10.1016/j.atmosenv.2012.04.056, 2012.
Huang, X. F., Yun, H., Gong, Z. H., Li, X., He, L. Y., Zhang, Y. H., and Hu, M.: Source apportionment and secondary organic aerosol estimation of PM2.5 in an urban atmosphere in China, Sci. China Earth Sci. 57, 1352–1362, https://doi.org/10.1007/s11430-013-4686-2, 2014.
Huang, X. J., Liu, Z. R., Liu, J. Y., Hu, B., Wen, T. X., Tang, G. Q., Zhang, J. K., Wu, F. K., Ji, D. S., Wang, L. L., and Wang, Y. S.: Chemical characterization and source identification of PM2.5 at multiple sites in the Beijing-Tianjin-Hebei region, China, Atmos. Chem. Phys., 17, 12941–12962, https://doi.org/10.5194/acp-17-12941-2017, 2017.
Islam, M. R., Jayarathne, T., Simpson, I. J., Werden, B., Maben, J., Gilbert, A., Praveen, P. S., Adhikari, S., Panday, A. K., Rupakheti, M., Blake, D. R., Yokelson, R. J., DeCarlo, P. F., Keene, W. C., and Stone, E. A.: Ambient air quality in the Kathmandu Valley, Nepal, during the pre-monsoon: concentrations and sources of particulate matter and trace gases, Atmos. Chem. Phys., 20, 2927–2951, https://doi.org/10.5194/acp-20-2927-2020, 2020.
Jeong, C. H., Wang, J. M., Hilker, N., Debosz, J., Sofowote, U., Su, Y., Noble, M., Healy, R., Munoz, T., Celo, V., White, L., Audette, C., Herod, D., and Evans, G. J.: Temporal and spatial variability of traffic-related PM2.5 sources: Comparison of exhaust and non-exhaust emissions, Atmos. Environ., 198, 55–69, https://doi.org/10.1016/j.atmosenv.2018.10.038, 2019.
Jiang, N., Duan, S. G., Yu, X., Zhang, R. Q., and Wang, K.: Comparative major components and health risks of toxic elements and polycyclic aromatic hydrocarbons of PM2.5 in winter and summer in Zhengzhou: Based on three-year data, Atmos. Res., 213, 173–184, https://doi.org/10.1016/j.atmosres.2018.06.008, 2018.
Khan, M. F., Latif, M. T., Saw, W. H., Amil, N., Nadzir, M. S. M., Sahani, M., Tahir, N. M., and Chung, J. X.: Fine particulate matter in the tropical environment: monsoonal effects, source apportionment, and health risk assessment, Atmos. Chem. Phys., 16, 597–617, https://doi.org/10.5194/acp-16-597-2016, 2016.
Kumari, P. and Toshniwal, D.: Impact of lockdown measures during COVID-19 on air quality – A case study of India, Int. J. Environ. Health Res., 32, 503–510, https://doi.org/10.1080/09603123.2020.1778646, 2022.
Li, M., Hu, M., Guo, Q., Tan, T., Du, B., Huang, X., He, L., Guo, S., Wang, W., Fan, Y., and Xu, D.: Seasonal Source Apportionment of PM2.5 in Ningbo, a Coastal City in Southeast China, Aerosol Air Qual. Res., 18, 2741–2752, https://doi.org/10.4209/aaqr.2018.01.0011, 2018.
Li, S. W., Chang, M. H., Li, H. M., Cui, X. Y., and Ma, L. Q.: Chemical compositions and source apportionment of PM2.5 during clear and hazy days: Seasonal changes and impacts of Youth Olympic Games, Chemosphere, 256, 127163, https://doi.org/10.1016/j.chemosphere.2020.127163, 2020.
Li, T. T., Li, J., Jiang, H. X., Chen, D. H., Zong, Z., Tian, C. G., and Zhang, G.: Source Apportionment of PM2.5 in Guangzhou Based on an Approach of Combining Positive Matrix Factorization with the Bayesian Mixing Model and Radiocarbon, Atmosphere, 11, 512, https://doi.org/10.3390/atmos11050512, 2020.
Li, X. Y., Cheng, T. H., Shi, S. Y., Guo, H., Wu, Y., Lei, M., Zuo, X., Wang, W. N., and Han, Z. Y.: Evaluating the impacts of burning biomass on regional transport under various emission conditions, Sci. Total Environ., 793, 148481, https://doi.org/10.1016/j.scitotenv.2021.148481, 2021.
Li, X., Yan, C. Q., Wang, C. Y., Ma, J. J., Li, W. X., Liu, J. Y., and Liu, Y.: PM2.5-bound elements in Hebei Province, China: Pollution levels, source apportionment and health risks, Sci. Total Environ., 806, 150440, https://doi.org/10.1016/j.scitotenv.2021.150440, 2022.
Liu, J., Wu, D., Fan, S. J., Mao, X., and Chen, H. Z.: A one-year, on-line, multi-site observational study on water-soluble inorganic ions in PM2.5 over the Pearl River Delta region, China, Sci. Total Environ., 601, 1720–1732, https://doi.org/10.1016/j.scitotenv.2017.06.039, 2017.
Liu, M. X., Huang, X., Song, Y., Tang, J., Cao, J. J., Zhang, X. Y., Zhang, Q., Wang, S. X., Xu, T. T., Kang, L., Cai, X. H., Zhang, H. S., Yang, F. M., Wang, H. B., Yu, J. Z., Lau, A. K. H., He, L. Y., Huang, X. F., Duan, L., Ding, A. J., Xue, L. K., Gao, J., Liu, B., and Zhu, T.: Ammonia emission control in China would mitigate haze pollution and nitrogen deposition, but worsen acid rain, P. Natl. Acad. Sci. USA, 116, 7760–7765, https://doi.org/10.1073/pnas.1814880116, 2019.
Liu, Y. K., Yu, Y. P., Liu, M., Lu, M., Ge, R. R., Li, S. W., Liu, X. R., Dong, W. B., and Qadeer, A.: Characterization and source identification of PM2.5-bound polycyclic aromatic hydrocarbons (PAHs) in different seasons from Shanghai, China, Sci. Total Environ., 644, 725–735, https://doi.org/10.1016/j.scitotenv.2018.07.049, 2018.
Liu, Z. R., Gao, W. K., Yu, Y. C., Hu, B., Xin, J. Y., Sun, Y., Wang, L. L., Wang, G. H., Bi, X. H., Zhang, G. H., Xu, H. H., Cong, Z. Y., He, J., Xu, J. S., and Wang, Y. S.: Characteristics of PM2.5 mass concentrations and chemical species in urban and background areas of China: Emerging results from the CARE-China network. Atmos. Chem. Phys., 18, 8849–8871, https://doi.org/10.5194/acp-18-8849-2018, 2018.
Lv, L. L., Wei, P., Hu, J. N., Chen, Y. J., and Shi, Y. P.: Source apportionment and regional transport of PM2.5 during haze episodes in Beijing combined with multiple models, Atmos. Res., 266, 105957, https://doi.org/10.1016/j.atmosres.2021.105957, 2022.
Lv, Z. F., Wang, X. T., Deng, F. Y., Ying, Q., Archibald, A. T., Jones, R. L., Ding, Y., Cheng, Y., Fu, M. L., Liu, Y., Man, H. Y., Xue, Z. G., He, K. B., Hao, J. M., and Liu, H. A.: Source-Receptor Relationship Revealed by the Halted Traffic and Aggravated Haze in Beijing during the COVID-19 Lockdown, Environ. Sci. Technol., 54, 15660–15670, https://doi.org/10.1021/acs.est.0c04941, 2020.
Nie, D. Y., Chen, M. D., Wu, Y., Ge, X. L., Hu, J. L., Zhang, K., and Ge, P. X.: Characterization of Fine Particulate Matter and Associated Health Burden in Nanjing, Int. J. Environ. Res. Publ. Health, 15, 602, https://doi.org/10.3390/ijerph15040602, 2018.
NOAA: NCEP FNL Operational Model Global Tropospheric Analyses, continuing from July 1999, NCAR, Research Data Archive [data set], https://doi.org/10.5065/D6M043C6, 2023.
Paatero, P. and Tapper, U.: Positive Matrix Factorization – A Nonnegative Factor Model With Optimal Utilization Of Error-Estimates Of Data Values, Environmetrics, 5, 111–126, https://doi.org/10.1002/env.3170050203, 1994.
Roper, C., Delgado, L. S., Barrett, D., Simonich, S. L. M., and Tanguay, R. L.: PM2.5 Filter Extraction Methods: Implications for Chemical and Toxicological Analyses, Environ. Sci. Technol. 53, 434–442, https://doi.org/10.1021/acs.est.8b04308, 2019
Sharma, S., Zhang, M. Y., Anshika, Gao, J. S., Zhang, H. L., and Kota, S. H.: Effect of restricted emissions during COVID-19 on air quality in India, Sci. Total Environ., 728, 138878, https://doi.org/10.1016/j.scitotenv.2020.138878, 2020.
Shu, L., Xie, M., Gao, D., Wang, T. J., Fang, D. X., Liu, Q., Huang, A. N., and Peng, L. W.: Regional severe particle pollution and its association with synoptic weather patterns in the Yangtze River Delta region, China, Atmos. Chem. Phys., 17, 12871–12891, https://doi.org/10.5194/acp-17-12871-2017, 2017.
Silva, L. F., Schneider, I. L., Artaxo, P., Núñez-Blanco, Y., Pinto, D., Flores, É. M., Gómez-Plata, L., Ramírez, O., and Dotto, G. L.: Particulate matter geochemistry of a highly industrialized region in the Caribbean: Basis for future toxicological studies, Geosci. Front., 13, 101–115, https://doi.org/10.1016/j.gsf.2020.11.012, 2022.
Song, C. B., He, J. J., Wu, L., Jin, T. S., Chen, X., Li, R. P., Ren, P. P., Zhang, L., and Mao, H. J.: Health burden attributable to ambient PM2.5 in China, Environ., Pollut., 223, 575–586, https://doi.org/10.1016/j.envpol.2017.01.060, 2017.
Sulaymon, I. D., Zhang, Y. X., Hopke, P. K., Zhang, Y., Hua, J. X., and Mei, X. D.: COVID-19 pandemic in Wuhan: Ambient air quality and the relationships between criteria air pollutants and meteorological variables before, during, and after lockdown, Atmos. Res., 250, 105362, https://doi.org/10.1016/j.atmosres.2020.105362, 2021.
Tao, J., Zhang, L., Cao, J., and Zhang, R.: A review of current knowledge concerning PM2.5 chemical composition, aerosol optical properties and their relationships across China, Atmos. Chem. Phys., 17, 9485–9518, https://doi.org/10.5194/acp-17-9485-2017, 2017.
Taylor, A. A., Tsuji, J. S., Garry, M. R., McArdle, M. E., Goodfellow, W. L., Adams, W. J., and Menzie, C. A.: Critical Review of Exposure and Effects: Implications for Setting Regulatory Health Criteria for Ingested Copper, Environ. Manage., 65, 131–159, https://doi.org/10.1007/s00267-019-01234-y, 2020.
Thurston, G. D., Burnett, R. T., Turner, M. C., Shi, Y., Krewski, D., Lall, R., Ito, K., Jerrett, M., Gapstur, S. M., Diver, W. R., and Pope III, C. A.: Ischemic heart disease mortality and long-term exposure to source-related components of US fine particle air pollution. Environ. Health Perspect., 124, 785–794, https://doi.org/10.1289/ehp.1509777, 2016.
Tong, S. Y., Kong, L. D., Yang, K. J., Shen, J. D., Chen, L., Jin, S. Y., Wang, C., Sha, F., and Wang, L.: Characteristics of air pollution episodes influenced by biomass burning pollution in Shanghai, China, Atmos. Environ., 238, 117756, https://doi.org/10.1016/j.atmosenv.2020.117756, 2020.
Tseng, C. H., Tsuang, B. J., Chiang, C. J., Ku, K. C., Tseng, J. S., Yang, T. Y., Hsu, K. H., Chen, K. C., Yu, S. L., Lee, W. C., Liu, T. W., Chan, C. C., and Chang, G. C.: The Relationship Between Air Pollution and Lung Cancer in Nonsmokers in Taiwan, J. Thorac. Oncol., 14, 784–792, https://doi.org/10.1016/j.jtho.2018.12.033, 2019.
University of Wyoming, Department of atmospheric science: Surface and sounding meteorological data, http://weather.uwyo.edu/, last access: 7 April 2023.
Veld, M., Alastuey, A., Pandolfi, M., Amato, F., Perez, N., Reche, C., and Querol, X.: Compositional changes of PM2.5 in NE Spain during 2009–2018: A trend analysis of the chemical composition and source apportionment, Sci. Total Environ., 795, 148728, https://doi.org/10.1016/j.scitotenv.2021.148728, 2021.
Wang, J. F., Li, J. Y., Ye, J. H., Zhao, J., Wu, Y. Z., Hu, J. L., Liu, D. T., Nie, D. Y., Shen, F. Z., Huang, X. P., Huang, D. D., Ji, D. S., Sun, X., Xu, W. Q., Guo, J. P., Song, S. J., Qin, Y. M., Liu, P. F., Turner, J. R., Lee, C. H., Hwang, S. W., Liao, H., Martin., S. T., Zhang, Q., Chen, M. D., Sun, Y. L., Ge, X. L., and Jacob, D. J.: Fast sulfate formation from oxidation of SO2 by NO2 and HONO observed in Beijing haze, Nat. Commun., 11, 2844, https://doi.org/10.1038/s41467-020-16683-x, 2020.
Wang, H. L., Ke, Y., Tan, T., Zhu, B., Zhao, L. T., and Yin, Y.: Observational evidence for the dual roles of BC in the megacity of eastern China: Enhanced O3 and decreased PM2.5 pollution, Chemosphere, 327, 138548, https://doi.org/10.1016/j.chemosphere.2023.138548, 2023.
Wang, S. B., Ji, Y. Q., Zhao, J. B., Lin, Y., and Lin, Z.: Source apportionment and toxicity assessment of PM2.5-bound PAHs in a typical iron-steel industry city in northeast China by PMF-ILCR, Sci. Total Environ., 713, 136428, https://doi.org/10.1016/j.scitotenv.2019.136428, 2020.
Wang, S. S., Hu, G. R., Yan, Y., Wang, S., Yu, R. L., and Cui, J. Y.: Source apportionment of metal elements in PM2.5 in a coastal city in Southeast China: Combined Pb-Sr-Nd isotopes with PMF method, Atmos. Environ., 198, 302–312, https://doi.org/10.1016/j.atmosenv.2018.10.056, 2019.
Win, M. S., Zeng, J. Y., Yao, C. H., Zhao, M. F., Xiu, G. L., Xie, T. T., Rao, L. F., Zhang, L. Y., Lu, H., Liu, X. C., Wang, Q. Y., and Lu, S. N.: Sources of HULIS-C and its relationships with trace metals, ionic species in PM2.5 in suburban Shanghai during haze and non-haze days, J. Atmos. Chem., 77, 63–81, https://doi.org/10.1007/s10874-020-09404-7, 2020.
Wong, Y. K., Liu, K. M., Yeung, C., Leung, K. K. M., and Yu, J. Z.: Measurement report: Characterization and source apportionment of coarse particulate matter in Hong Kong: insights into the constituents of unidentified mass and source origins in a coastal city in southern China, Atmos. Chem. Phys., 22, 5017–5031, https://doi.org/10.5194/acp-22-5017-2022, 2022.
Wu, X., Cao, F., Haque, M., Fan, M. Y., Zhang, S. C., and Zhang, Y. L.: Molecular composition and source apportionment of fine organic aerosols in Northeast China, Atmos. Environ., 239, 117722, https://doi.org/10.1016/j.atmosenv.2020.117722, 2020.
Xie, J. J., Yuan, C. G., Xie, J., Niu, X. D., and He, A. E.: PM2.5-bound potentially toxic elements (PTEs) fractions, bioavailability and health risks before and after coal limiting, Ecotoxicol. Environ. Safe., 192, 110249, https://doi.org/10.1016/j.ecoenv.2020.110249, 2020.
Xie, M., Liao, J. B., Wang, T. J., Zhu, K. G., Zhuang, B. L., Han, Y., Li, M. M., and Li, S.: Modeling of the anthropogenic heat flux and its effect on regional meteorology and air quality over the Yangtze River Delta region, China, Atmos. Chem. Phys., 16, 6071–6089, https://doi.org/10.5194/acp-16-6071-2016, 2016.
Xu, H. M., Cao, J. J., Chow, J. C., Huang, R. J., Shen, Z., Chen, L. A., Ho, K. F., and Watson, J. G.: Inter-annual variability of wintertime PM2.5 chemical composition in Xi'an, China: evidences of changing source emissions, Sci. Total Environ., 545, 546–555, https://doi.org/10.1016/j.scitotenv.2015.12.070, 2016.
Xu, J. S., Liu, D., Wu, X. F., Vu, T., Zhang, Y. L., Fu, P. Q., Sun, Y. L., Xu, W. Q., Zheng, B., Harrison, R. M., and Shi, Z. B.: Source apportionment of fine organic carbon at an urban site of Beijing using a chemical mass balance model, Atmos. Chem. Phys., 21, 7321–7341, https://doi.org/10.5194/acp-21-7321-2021, 2021.
Yan, Y., Zheng, Q., Yu, R. L., Hu, G. R., Huang, H. B., Lin, C. Q., Cui, J. Y., and Yan, Y.: Characteristics and provenance implications of rare earth elements and Sr-Nd isotopes in PM2.5 aerosols and PM2.5 fugitive dusts from an inland city of southeastern China, Atmos. Environ., 220, 117069, https://doi.org/10.1016/j.atmosenv.2019.117069, 2020.
Yan, Y. C., Liu, Z. R., Gao, W., Li, J. Y., Zhang, X. H., Chai, W. H., Bai, J. H., Hu, B., and Wang, Y. S.: Physiochemistry characteristics and sources of submicron aerosols at the background area of North China Plain: Implication of air pollution control in heating season, Atmos. Res., 249, 105291, https://doi.org/10.1016/j.atmosres.2020.105291, 2021.
Zeng, Y. Y., Cao, Y. F., Qiao, X., Seyler, B. C., and Tang, Y.: Air pollution reduction in China: Recent success but great challenge for the future, Sci. Total Environ., 663, 329–337, https://doi.org/10.1016/j.scitotenv.2019.01.262, 2019.
Zhan, Y. Z. H., Xie, M., Gao, D., Wang, T. J., Zhang, M., and An, F. X.: Characterization and source analysis of water-soluble inorganic ionic species in PM2.5 during a wintertime particle pollution episode in Nanjing, China, Atmos. Res., 262, 105769, https://doi.org/10.1016/j.atmosres.2021.105769, 2021.
Zhang, L. L., Wilson, J. P., MacDonald, B., Zhang, W. H., and Yu, T.: The changing PM2.5 dynamics of global megacities based on long-term remotely sensed observations, Environ. Int., 142, 105862, https://doi.org/10.1016/j.envint.2020.105862, 2020.
Zhang, Z. Z., Wang, W. X., Cheng, M. M., Liu, S. J., Xu, J., He, Y. J., and Meng, F.: The contribution of residential coal combustion to PM2.5 pollution over China's Beijing-Tianjin-Hebei region in winter, Atmos. Environ., 159, 147–161, https://doi.org/10.1016/j.atmosenv.2017.03.054, 2017.
Zheng, H., Kong, S. F., Yan, Q., Wu, F. Q., Cheng, Y., Zheng, S. R., Wu, J., Yang, G. W., Zheng, M. M., Tang, L. L., Yin, Y., Chen, K., Zhao, T. L., Liu, D. T., Li, S. L., Qi, S. H., Zhao, D. L., Zhang, T., Ruan, J. J., and Huang, M. Z.: The impacts of pollution control measures on PM2.5 reduction: Insights of chemical composition, source variation and health risk, Atmos. Environ., 197, 103–117, https://doi.org/10.1016/j.atmosenv.2018.10.023, 2019.
Zhou, C. S., Chen, J., and Wang, S. J.: Examining the effects of socioeconomic development on fine particulate matter (PM2.5) in China's cities using spatial regression and the geographical detector technique, Sci. Total Environ., 619, 436–445, https://doi.org/10.1016/j.scitotenv.2017.11.124, 2018.
Zhu, Y. J., Xie, J. G., Huang, F. M., and Cao, L. Q.: Association between short-term exposure to air pollution and COVID-19 infection: Evidence from China, Sci. Total Environ., 727, 138704, https://doi.org/10.1016/j.scitotenv.2020.138704, 2020.
Zong, Z., Wang, X. P., Tian, C. G., Chen, Y. J., Qu, L., Ji, L., Zhi, G. R., Li, J., and Zhang, G.: Source apportionment of PM2.5 at a regional background site in North China using PMF linked with radiocarbon analysis: insight into the contribution of biomass burning, Atmos. Chem. Phys., 16, 11249–11265, https://doi.org/10.5194/acp-16-11249-2016, 2016.
Zou, B. B., Huang, X. F., Zhang, B., Dai, J., Zeng, L. W., Feng, N., and He, L. Y.: Source apportionment of PM2.5 pollution in an industrial city in southern China, Atmos. Pollut. Res., 8, 1193–1202, https://doi.org/10.1016/j.apr.2017.05.001, 2017.