the Creative Commons Attribution 4.0 License.
the Creative Commons Attribution 4.0 License.
 | 25 Aug 2023
High-time-resolution chemical composition and source apportionment of PM2.5 in northern Chinese cities: implications for policy
Yong Zhang
Jie Tian
Qiyuan Wang
Lu Qi
Manousos Ioannis Manousakas
Yuemei Han
Weikang Ran
Huikun Liu
Renjian Zhang
Yunfei Wu
Tianqu Cui
Kaspar Rudolf Daellenbach
Jay Gates Slowik
André S. H. Prévôt
Junji Cao
Fine particulate matter (PM2.5) pollution is still one of China's most important environmental issues, especially in northern cities during wintertime. In this study, intensive real-time measurement campaigns were conducted in Xi'an, Shijiazhuang, and Beijing to investigate the chemical characteristics and source contributions of PM2.5 and explore the formation of heavy pollution for policy implications. The chemical compositions of PM2.5 in the three cities were all dominated by organic aerosol (OA) and nitrate (NO). Results of source apportionment analyzed by a hybrid environmental receptor model (HERM) showed that the secondary formation source contributed more to PM2.5 compared to other primary sources. Biomass burning was the dominant primary source in the three pilot cities. The contribution of coal combustion to PM2.5 is non-negligible in Xi'an and Shijiazhuang but is no longer an important contributor in the capital city of Beijing due to the execution of a strict coal-banning policy. The potential formation mechanisms of secondary aerosol in the three cities were further explored by establishing the correlations between the secondary formation sources and aerosol liquid water content (ALWC) and Ox (O3+NO2), respectively. The results showed that photochemical oxidation and aqueous-phase reaction were two important pathways of secondary aerosol formation. According to source variations, air pollution events that occurred in campaigns were classified into three types: biomass-combustion-dominated, secondary-formation-source-dominated, and a combination of primary and secondary sources. Additionally, this study compares the changes in chemical composition and source contributions of PM2.5 in past decades. The results suggest that the clean-energy replacements for rural households should be urgently encouraged to reduce the primary source emissions in northern China, and collaborative control on ozone and particulate matter needs to be continuously promoted to weaken the atmosphere oxidation capacity for the sake of reducing secondary aerosol formation.
- Article
(2527 KB) - Full-text XML
-
Supplement
(2643 KB) - BibTeX
- EndNote


Fine particulate matter (PM2.5, aerodynamic diameter ≤2.5 µm) is of large concern because of its adverse effects on both the natural environment (Kuniyal and Guleria, 2019; Kuo et al., 2013) and human health (Pöschl, 2005; Shen et al., 2021; Zeng and He, 2019). With the soaring economic growth and urbanization in China, PM2.5 pollution has been a very serious environmental issue in recent decades (Chan and Yao, 2008; He et al., 2002; Pui et al., 2014; Zhang et al., 2013). The most impressive case is that an extremely severe haze pollution episode occurred in eastern and central China in January 2013, with a peak PM2.5 concentration value of over 500 µg m−3. This month had been reported as the haziest month in the past 60 years in Beijing, China (Wang et al., 2014; Huang et al., 2014). Thereafter, aiming to improve air quality, the Chinese central government issued the Air Pollution Prevention and Control Action Plan (APCAP) in September 2013 (http://www.gov.cn/zwgk/2013-09/12/content_2486773.htm, last access: 12 September 2013; in Chinese) and the Three-year Action Plan to Fight Air Pollution (TAPFAP) in June 2018 (http://www.gov.cn/zhengce/content/2018-07/03/content_5303158.htm, last access: 3 July 2018; in Chinese). With the implementation of strict pollution controls, air quality in northern China has improved significantly over the past decade (Wang et al., 2020a, 2017; Li et al., 2020). Previous studies show that PM2.5 concentration decreased notably in the past 2 decades, and the composition of organic aerosol (OA), black carbon (BC), and sulfate (SO) decreased as well, while ammonium (NH) slightly increased, and nitrate (NO) increased obviously. In terms of PM2.5 sources, the contribution of secondary sources increased obviously, while the contribution of industrial emissions and coal combustion decreased due to elimination of industries and enterprises with high pollutant emissions, promotion of desulfurization in industrial facilities, replacement of clean energy, and optimization of industrial and energy structures (Lu et al., 2021; Ma et al., 2022; Tao et al., 2017; Y. Wang et al., 2019). However, there is still a significant gap between the PM2.5 concentration in northern China and its latest recommendations on air quality guidelines (5 µg m−3) by the World Health Organization (https://apps.who.int/iris/bitstream/handle/10665/345329/9789240034228-eng.pdf, last access: 26 November 2018; p. 78). In addition, severe PM2.5 pollution still frequently occurred in northern China during wintertime (Guo et al., 2021; J. Li et al., 2017; X. Li et al., 2021). To figure out the causes behind the pollution and further improve air quality in northern China, it is essential to use online high-time-resolution source apportionment technology to understand the chemical composition and source contribution of PM2.5 in those pollution events.
Recently, more research on measurements of PM2.5 and its source apportionments were conducted using online high-time-resolution technologies (Y. Li et al., 2017; F. Wang et al., 2021; Elser et al., 2016). Compared to traditional offline filter-based approaches, online methods characterize the short-time variation in PM2.5. This allows the rapid changes in and evolutions of chemical components to be distinguished and is particularly beneficial for the purpose of gaining knowledge about the formations of heavy air pollution (Liu et al., 2016; Ouyang et al., 2019; Zheng et al., 2016; Elser et al., 2016). For instance, Lv et al. (2021) employed a positive matrix factorization (PMF) model with high-time-resolution online PM2.5 data to accurately quantify and distinguish the source distributions in Beijing during two haze episodes in January 2019. Liu et al. (2019) recognized the main drivers of haze events that occurred in Beijing in winter of 2016 according to high-time-resolution source apportionment of PM2.5 with multiple models. Furthermore, M. Wang et al. (2021) found that vehicle emissions contributed most to PM2.5 during pollution episodes in downtown Lanzhou based on high-resolution online data source apportionment. Currently, to fully understand and solve heavy-pollution events in winter that trouble local governments in northern cities of China (Z. Wang et al., 2022; Xu et al., 2022; Zhou et al., 2022), more advanced online measurement and source apportionment are better choices (Tao et al., 2015). It should be pointed out that previous research has mainly focused on individual cities, and those results have some limitations in guiding the improvement of air quality in the entire northern region of China. Therefore, it is necessary to conduct comparative research among multiple cities.
Considering the differences in geographical location, population, economy, industry and energy structure, air quality, and depth of air pollution control measures among different cities, three cities in northern China (Beijing, Shijiazhuang, and Xi'an) were chosen as pilot research subjects. The cities of Beijing and Shijiazhuang are located in the North China Plain, which is one of the most polluted regions in China (Chan and Yao, 2008). Beijing is the capital of China, and its air quality has significantly improved under the implementation of the strictest clean-air policy since 2013 (J. Li et al., 2021; Pang et al., 2021; Vu et al., 2019; Zhang et al., 2020). However, the city is still plagued by pollution events in wintertime (Wang et al., 2020b; X. Yang et al., 2022; Zhou et al., 2022). Shijiazhuang has been recognized as one of the cities with the most serious air pollution worldwide (B. Liu et al., 2018; R.-J. Huang et al., 2019). Its air quality had also improved under the implementation of the Clean Air Plan, whereas its annual PM2.5 concentration was still unable to meet China's National Ambient Air Quality Standards (NAAQS-II) of 35 µg m−3 until 2021 (Fig. S1 in the Supplement). Xi'an is located in the Fenwei Plain, which is a region that has suffered from heavy pollution and was designated as a key region for the TAPFAP in 2018 (Cao and Cui, 2021). Compared with Beijing and Shijiazhuang, high-intensity air pollution controls in Xi'an started late due to a lack of financial support. And the annual PM2.5 concentration in Xi'an could not meet the NAAQS-II until 2021 as well (Fig. S1). Meanwhile, it is still unclear whether the actual causes of the pollution are topography, meteorological conditions, or local emissions (Chen et al., 2021; Tian et al., 2022; Wang et al., 2015; Z. Wang et al., 2022). In this study, we conducted intensive real-time observation of PM2.5 chemical components in Xi'an, Shijiazhuang, and Beijing during wintertime. The objectives were (1) to determine the characteristics of PM2.5 and its chemical components in the three typical northern Chinese cities during wintertime, (2) to quantify the source contribution and explore the potential formation mechanism of secondary aerosols, (3) to explore the unique causes of heavy-pollution events in different cities, and (4) to provide suggestions for the establishment of efficient policies for continuous air quality improvement. This study provides scientific guidance for developing policy on air quality improvement for northern Chinese cities.
2.1 Sampling sites and periods
In this study, intensive online measurements of PM2.5 were conducted in the three pilot cities of Xi'an, Shijiazhuang, and Beijing during wintertime (Fig. 1). The sampling sites in Xi'an and Beijing are located at two Chinese Academy of Sciences (CAS) stations. The one in Xi'an is the Guanzhong Plain Ecological Environment Change and Comprehensive Treatment National Observation and Research Station, Institute of Earth Environment (IEE) (34.24∘ N, 108.87∘ E), and the one in Beijing is the Tower Branch of the Institute of Atmospheric Physics (IAP) (39.98∘ N, 116.39∘ E). Both sites are surrounded by commercial and residential buildings without intense industrial emissions nearby. Previous studies indicated that these two sites were influenced by biomass and coal burning for heating and cooking during wintertime as well as usual local traffic emissions (Tian et al., 2021; Xu et al., 2021). The sampling site in Shijiazhuang is situated in the courtyard of Hebei Sailhero Environmental Protection High-tech Co., Ltd. (38.04∘ N, 114.65∘ E), which is surrounded by pharmaceutical and machine-building industries and close to the streets. The intensive campaigns were continuously conducted for ∼1 month in each city (i.e., 12 December 2020 to 7 January 2021 in Xi'an, 20 December 2021 to 24 January 2022 in Shijiazhuang, and 17 January to 20 February 2021 in Beijing).
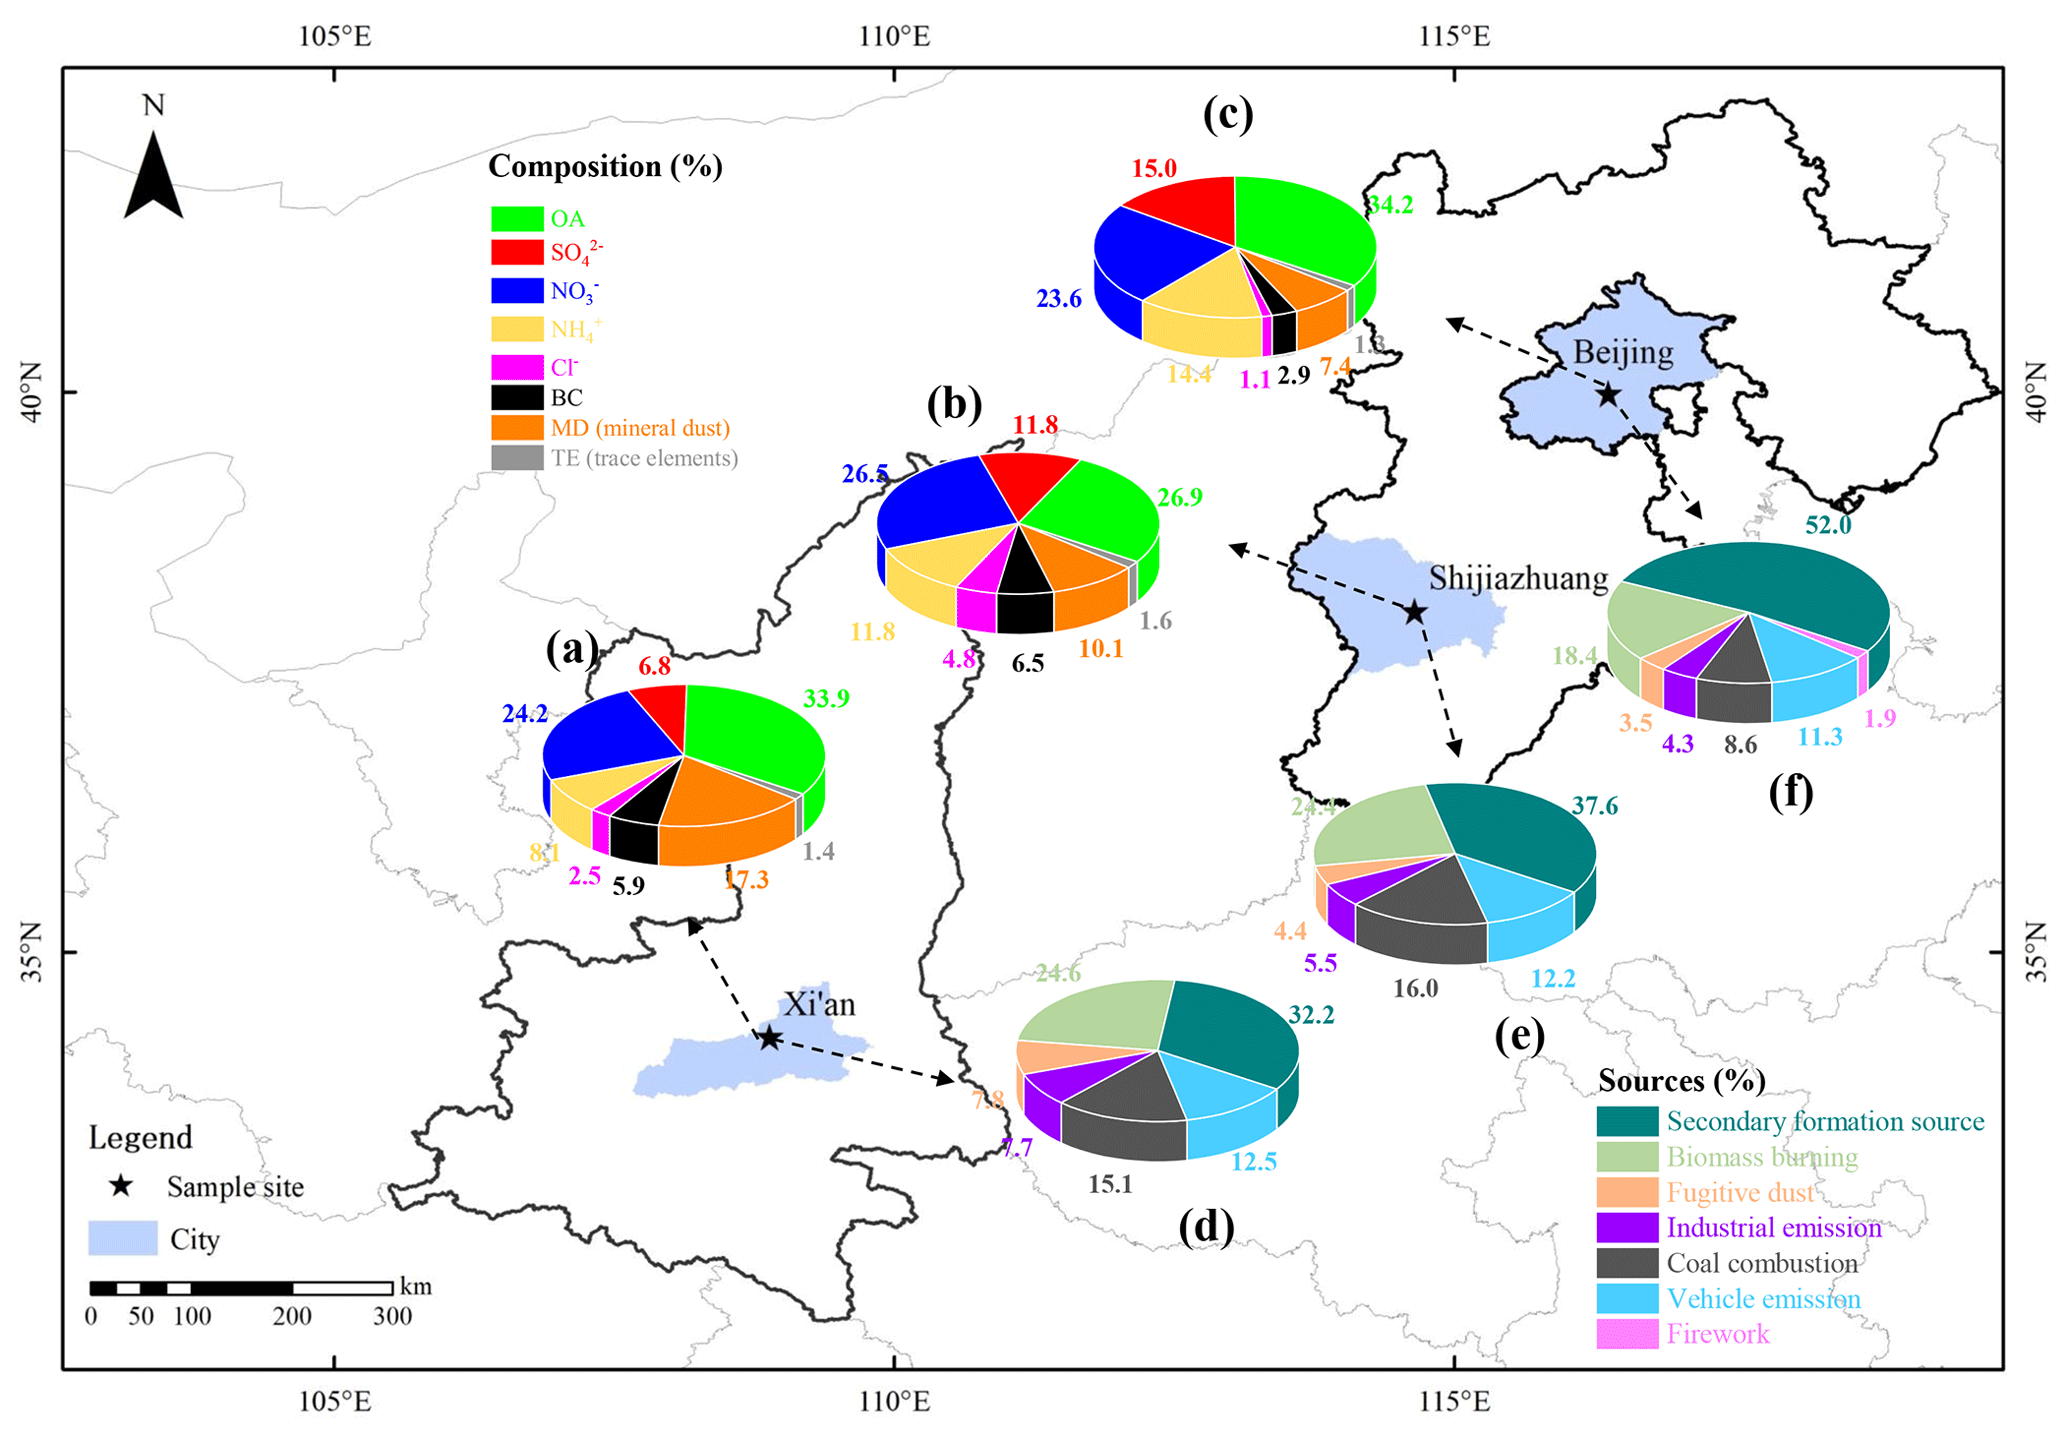
Figure 1Chemical composition and source apportionment results of PM2.5 in the three pilot cities of northern China during the sampling period.
2.2 Online measurements of PM2.5 chemical components
2.2.1 Organic aerosol and inorganic ions
Concentrations of OA, NO, SO, ammonium (NH), and chloride (Cl−) in PM2.5 at a 15 min time resolution were monitored by a quadrupole aerosol chemical speciation monitor (Q-ACSM; Aerodyne Research Inc., Billerica, MA, USA) equipped with a PM2.5 lens. The detailed operational principles and calibration method of the Q-ACSM are described elsewhere (Ng et al., 2011; Hu et al., 2017). First, the sampled ambient airstream passed through a PM10 impactor inlet and a Nafion® dryer (MD-700-24F-3, Perma Pure, Inc., Lakewood, NJ, USA) with a flow rate of 5 L min−1 before entering the Q-ACSM chamber. Then, the pre-treatment particles passed through a 100 µm critical orifice at 0.1 L min−1 and were focused into a narrow beam by an aerodynamic intermediate-pressure lens. The focused particle beam was flash-vaporized by a capture vaporizer (CV) at ∼600 ∘C. The vaporized compounds were then ionized by an electron impactor (EI) ionization source at 70 eV and subsequently analyzed by the quadrupole mass spectrometer.
The calibration system consists of an atomizer (Model 9302, TSI Inc., Shoreview, MN, USA), a differential mobility analyzer (DMA; TSI model 3080, TSI Inc.), and a condensation particle counter (CPC; TSI model 3772, TSI Inc.), and ammonium nitrate (NH4NO3) and ammonium sulfate ((NH4)2SO4) aerosols were used for calibration. The raw data of the Q-ACSM were analyzed by the ACSM local tool (V1.5.3.5, Aerodyne Research Inc., Billerica, Massachusetts, USA) compiled with Igor Pro 6.37 (WaveMetrics, Lake Oswego, OR, USA). The response factors (RFs) for NO in Xi'an, Shijiazhuang, and Beijing were set at , , and , respectively, and the relative ionization efficiencies (RIEs) for NH and SO were set at 8.06 and 0.83 in Xi'an, 5.82 and 0.30 in Shijiazhuang, and 6.31 and 0.38 in Beijing, respectively. Other RIEs for NO, OA, and Cl− were set at default values of 1.4, 1.1, and 1.3, respectively (Ng et al., 2011). In addition, the collection efficiency (CE) value of the Q-ACSM equipped with a PM2.5 lens was recommended as 1 based on laboratory simulation experiments by Xu et al. (2017). Finally, the chemical components monitored by the Q-ACSM were corrected by the results of offline filter sampling experiments during the same periods (Fig. S2).
2.2.2 Black carbon
BC concentration in PM2.5 was obtained by an Aethalometer (Model AE33, Magee Scientific Inc., Berkeley, CA, USA) with a 1 min time resolution. The AE33 monitors the light attenuation of seven wavelengths (λ= 370, 470, 525, 590, 660, 880, and 940 nm), and the light attenuation at λ=880 nm was used to calculate BC concentration (Q. Wang et al., 2019; Drinovec et al., 2015). Briefly, the ambient air was first sampled on a filter tape inside the instrument through a PM2.5 cyclone (SCC-1.829, BGI Inc., USA) at a flow rate of 5 L min−1. The entering particles were divided into two sample spots on the filter through two channels with different flows. Then the light attenuation transmitted through two parallel spots was detected. For high-quality monitoring accuracy, the sampled particles were desiccated with a Nafion® dryer (MD-700-24F-3, Perma Pure, Inc., Lakewood, NJ, USA) before entering the AE33. Furthermore, a real-time loading effect compensation algorithm based on two spot measurements was used to eliminate the nonlinear loading effects of the Aethalometer. A detailed description of the Model AE33 principle can be found in Drinovec et al. (2015).
2.2.3 Elements
A total of 23 elements, including Si, K, Ca, V, Cr, Mn, Fe, Co, Ni, Cu, Zn, Ga, As, Se, Ag, Cd, Sn, Ba, Au, Hg, Th, Pb, and Pd in PM2.5, were analyzed by an Xact625 ambient-metal monitor (Cooper Environmental Services, Tigard, Oregon, USA) with a 1 h time resolution. Si, K, Ca, Cr, Mn, Fe, Ni, Cu, Zn, As, Se, Ba, and Pb were selected for further analysis in Xi'an and Beijing, while other elements were excluded due to most of their concentration being below the method's detection limit. In Shijiazhuang, S, Cl, and Ti were analyzed by replacement of Ga, Ag, and Au, respectively. Finally, Si, K, Ca, Ti, Cr, Mn, Fe, Ni, Cu, Zn, As, Se, Ba, and Pb were selected for further analysis. The description and detection principles of Xact625 were introduced by Furger et al. (2020) and Rai et al. (2020). In brief, the ambient airstream was first sampled on a Teflon filter tape inside the instrument through a PM2.5 cyclone inlet at a constant flow rate of 16.7 L min−1, and then the sample was automatically analyzed by nondestructive energy-dispersive X-ray fluorescence (XRF) to determine the mass of the species. For quality control and assurance, the Xact625 performed automatic internal quality control by testing the Pd rod every hour to ensure the stability of the instrument. Energy calibration was performed daily from 00:00 to 00:15 and a range calibration from 00:15 to 00:30 local standard time (LST) to monitor any possible shift in and instability of the XRF (Liu et al., 2019). During our sampling periods, the concentration of Pd varied within 3 standard deviations (Fig. S3), illustrating the reliable and stable performance of the Xact625.
2.2.4 Complementary data
Online hourly concentrations of PM2.5 and gas pollutants (i.e., NOx, NO2, CO, SO2, and O3) were acquired from the national air quality monitoring station (https://air.cnemc.cn:18007/, last access: 17 August 2023). Meteorological parameters, including wind speed (WS), wind direction (WD), relative humidity (RH), and temperature (T), were obtained from the national meteorological station (http://data.cma.cn/, last access: 30 September 2022). Detailed information on complementary data is listed in Table S1 in the Supplement.
2.3 Data analysis
2.3.1 PM2.5 mass reconstruction
A chemical closure was utilized to assess whether chemical compositions can be representative of PM2.5. The sum of OA, NO, SO, NH, Cl−, BC, mineral dust (MD), and trace elements (TEs) was considered to be the reconstructed PM2.5, where MD and TEs were calculated as follows (Chow et al., 2015):
where the square brackets represent the chemical species concentration; [Al] and [Ti] were calculated by the concentration of Ca ( and ) (Wei et al., 1991). Good correlations between online and reconstructed PM2.5 mass (slope = 0.87–1.10, R2= 0.82–0.93) in the three pilot cities (Fig. S4) indicated that our measurements could detect major components of PM2.5. The PM2.5 concentration used in the following discussion refers to the reconstructed PM2.5 concentration.
2.3.2 Hybrid environment receptor model
Source apportionment of PM2.5 was analyzed with a bilinear model referred to as a hybrid environment receptor model (HERM). HERM was developed by the IEE, CAS, and the University of Nevada, Las Vegas (Chen and Cao, 2018). Like other receptor models, the speciation of pollutants at a receptor site can be separated into emission sources and the chemical compositions of the sources. To solve the mass balance of PM2.5, the bilinear HERM in matrix notation is defined as follows:
where Cmn is the measured concentration of chemical species m during time n; Fmi is the source profile, which is the fractional quantity of species m in source i emissions; Gin represents the contribution of source i during time n; and Qmn is the model residual for species m concentration measured during time n. Based on an iterative conjugate gradient algorithm, the HERM solves Gin and unknown Fmi by minimizing the Qmn, which is defined as follows:
where M, N, and I are the number of samples, chemical species, and sources, respectively; represents the error in the variability in the constrained factor profile. δmi was set to 0 or 1 depending on whether the ith factor profile is constrained or unconstrained, respectively.
The HERM input data included the concentration and uncertainty data of chemical species. A total of 19 chemical species in Xi'an and Shijiazhuang and 20 chemical species in Beijing were selected for source apportionment, respectively. Details of selected chemical species and their uncertainty calculation are described in Sect. S1 in the Supplement. A range of 2- to 10-factor solutions were investigated by HERM with completely unconstrained factor profiles to search for optimal solutions. The detailed diagnostics can be seen in Sect. S2. A six-factor solution for Xi'an and Shijiazhuang and an eight-factor solution for Beijing were found to be the optimal solutions based on multiple criteria, including (1) variations in , which can be used to choose the optimal number of resolved factors; (2) physical meaningfulness of distinct factor profiles and explained variation (EV) values of variables; (3) good correlations between source contribution and external and internal tracers; and (4) agreement between the measured and modeled PM2.5 mass. More detailed information on the final selected factor profiles and contributions is presented in Sect. 3.2.
2.3.3 Aerosol liquid water content
Aerosol liquid water content (ALWC) was calculated by the ISORROPIA II thermodynamic equilibrium model (http://isorropia.eas.gatech.edu/, last access: 17 August 2023) based on data of PM2.5 chemical species (including NO, SO, NH, and Cl−) and meteorological parameters, including relative humidity (RH) and temperature (T); more model information can be found in Fountoukis and Nenes (2007). It should be noted that the ISORROPIA II model does not consider the contribution of the organic aerosols, as inorganic aerosols are the most hygroscopic species and the most dominant contributor to ALWC (Huang et al., 2020).
3.1 Characteristics of PM2.5 and its chemical components
Figure 1 illustrates the mass composition of PM2.5 in the three pilot cities during the sampling periods, and their concentration levels are summarized in Table S4. The average PM2.5 concentrations in Xi'an, Beijing, and Shijiazhuang were 77±47, 64±57, and 60±39 µg m−3, respectively. It is noted that the average PM2.5 concentrations in Xi'an, Beijing, and Shijiazhuang did not meet the second level of the NAAQS, indicating that it is necessary to establish more particular and efficient pollution reduction measures. As shown in Fig. 1, the chemical compositions of PM2.5 were similar in Beijing and Shijiazhuang (Fig. 1b and c) and were mainly composed of OA (26.9 %–34.2 %), followed by NO (23.6 %–26.5 %), SO (11.8 %–15.0 %), NH (11.8 %–14.8 %), MD (7.4 %–10.1 %), BC (2.9 %–6.5 %), and Cl− (1.1 %–4.8 %). However, in Xi'an, MD contributed comparatively more to PM2.5 (17.3 %), while SO had a smaller contribution (6.8 %). This could be explained by more construction activity and MD transport from the Loess Plateau to Xi'an (Long et al., 2016; Yan et al., 2015). Meanwhile, the lowest sulfur oxidation ratio (SOR) was observed in Xi'an (0.18±0.08; see Table S5), indicating weak efficiency of the second generation of SO. The sum of SO, NO, and NH accounted for 39.0 %–53.0 % of PM2.5 in the three pilot cities, highlighting the importance of the secondary inorganic components in northern China. In addition, the fractions of BC, Cl−, and TE in PM2.5 were lower in Beijing than those in the other two cities, which can be explained by the stricter local control policies on solid fuel combustion and tightening of industrial emission standards in and near the capital city of China (J. Li et al., 2021; Pang et al., 2021).
To better understand the impact of the chemical components, the mass fraction of each component was plotted as a function of the PM2.5 mass concentration (Fig. 2a–c). The two dominant components of PM2.5 were OA (25.7 %–38.0 %) and MD (19.9 %–37.1 %), while the PM2.5 concentrations were below 40 µg m−3. The fraction of OA in PM2.5 was the highest in Shijiazhuang and Beijing, while MD contributed most to PM2.5 in Xi'an. This is potentially related to more emissions and higher backgrounds of local dust. With increases in the PM2.5 mass concentration, the fractions of chemical components in Xi'an and Shijiazhuang changed notably. The fractions of OA and NO increased the most and reached peaks of 40.1 % and 28.7 %, respectively, when the PM2.5 concentration reached ∼ 196 µg m−3 in Xi'an. In contrast, NO and SO were two dominant drivers of increasing PM2.5 concentrations in Shijiazhuang, showing peak contributions of 32.5 % and 18.7 %, respectively, when the PM2.5 concentration was over 100 µg m−3. Compared to Xi'an and Shijiazhuang, Beijing had relatively stable fractions of each chemical component, with increasing PM2.5 concentrations. Particularly, the fractions of OA and NO contributed dominantly, with averages of 33.3±3.0 % and 25.3±2.5 %, respectively, when the PM2.5>40 µg m−3.
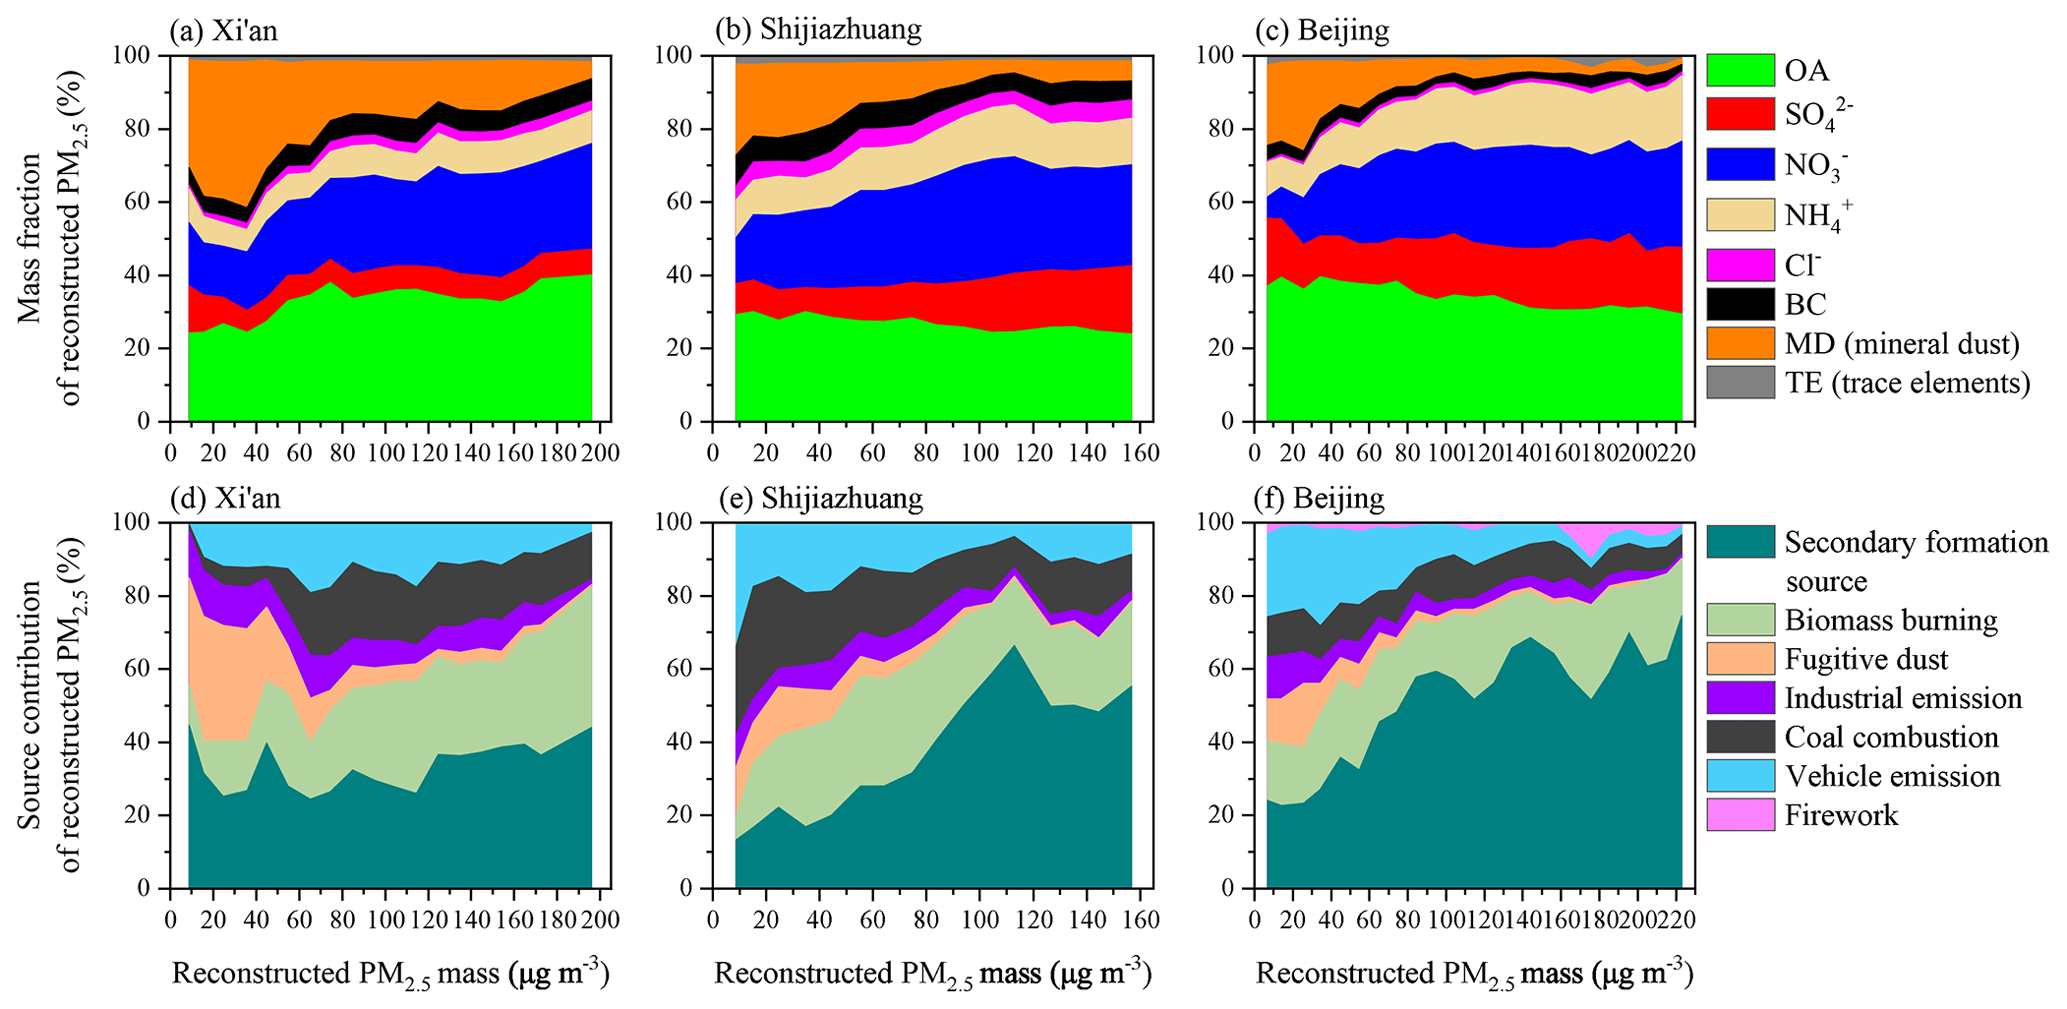
Figure 2Mass fractions of chemical components (a–c) and source contribution (d–f) with reconstructed PM2.5 concentration in Xi'an, Shijiazhuang, and Beijing.
3.2 Source apportionment of PM2.5
Six potential sources, including biomass burning, fugitive dust, industrial emissions, coal combustion, vehicle emissions, and secondary formation sources, were resolved by the HERM analysis. In Beijing, secondary formation sources were further divided into secondary nitrate plus OA and secondary sulfate plus OA. Fireworks as a special pollution source were separated due to the Chinese Spring Festival (from New Year's Eve to 3 January on the lunar calendar). Figures S6–S8 present the source profiles and contributions in Xi'an, Shijiazhuang, and Beijing, respectively. Biomass burning features high EV for the two tracers Cl− (33 %–58 %) and K (30 %–44 %) in the three cities (Ni et al., 2017; Zhao et al., 2021). The fugitive dust is characterized by high EV values for Si (60 %–90 %) and Ca (34 %–54 %), which are the dominant chemical species in the fugitive dust profiles in northern China (Shen et al., 2016; Zhao et al., 2006). The fractions of industrial emissions vary among the cities, showing high EV for Ni (55 % and 87 %) and Cr (25 % and 70 %) in Xi'an and Shijiazhuang and high EV for Cr (26 %), Mn (40 %), and Pb (27 %) in Beijing. Ni is possibly emitted from the semiconductor industry (Simka et al., 2005). Cr, Mn, and Pb could originate from steel manufacturing and incinerator fly ash (Duan and Tan, 2013; Ledoux et al., 2017). Coal combustion is characterized by high EV values for As (38 %–75 %), Se (40 %–50 %), and Pb (31 %–57 %). These elements are enriched in coals, which are reliable indicators of coal combustion (Tian et al., 2013; Xu et al., 2012). The non-exhaust vehicle emissions could be identified by the elements Ba, Cu, Ca, Fe, and Mn. Cu and Ba can be released from brake and tire wear of vehicles (Adachi and Tainosho, 2004; Thorpe and Harrison, 2008). Moreover, Fe and Mn could be emitted from the combustion of lubricating oil and fuel additives (Ålander et al., 2005; Lewis et al., 2003). Relatively high EV values for Ba (68 %), Cu (36 %), and Ca (35 %) are seen in Xi'an; significantly high EV values of Mn (68 %), Fe (65 %), Cu (53 %), and Ba (80 %) are characterized in Shijiazhuang; and relatively high EV values of Fe (34 %) and Cu (39 %) are featured in Beijing. Moreover, moderate EV values for BC (18 %–27 %) and OA (13 %–22 %) are commonly regarded as contributions of vehicle engine exhaust, while the temporal variations in the source concentration are well correlated with gaseous NOx or NO2 in the three cities (R2= 0.45–0.78), which is a good tracer of traffic-related emissions (Huang et al., 2017; L. Li et al., 2017). The secondary sources resolved by HERM are different among the three cities. In Xi'an and Shijiazhuang, this factor is characterized by high EV values for SO (62 %–75 %), NO (55 %–53 %), and NH (60 %–56 %) and a medium EV value for OA (23 %–29 %), which showed good correlations with SO (R2= 0.85–0.90) and NO (R2= 0.85–0.92) (Dai et al., 2020; Tian et al., 2022). In addition, the OA concentration of this factor was calculated by the EV value of OA, which was close to the secondary OA (SOA) concentration estimated by the BC-trace method (see Sect. S3 and Table S6). This means that SOA was mixed in this factor; therefore, this factor was identified as a secondary formation source. In Beijing, two secondary sources were resolved. The first one was characterized by a high EV value for NO (58 %) and NH (42 %) and medium values for OA (21 %); another one was characterized by a high EV value for SO (58 %) and medium values for OA (16 %) and NH (30 %). The OA concentration in those two factors was also comparable to that estimated by the BC-trace method (see Sect. S3). So those two sources were identified as secondary nitrate plus OA and secondary sulfate plus OA, respectively. The combination of secondary nitrate plus OA and secondary sulfate plus OA is equivalent to the secondary formation sources for the next discussion. Additionally, the source of firework emissions is characterized by high EV values of Ba (83 %), Cu (45 %), and K (38 %), which are recognized as common indicators of fireworks (Rai et al., 2020; Tian et al., 2014).
The modeled PM2.5 mass was well correlated with the reconstructed PM2.5 mass (R2=0.99, slope = 0.90–1.01; Fig. S10) in the three pilot cities, indicating that the established models are reasonable. As shown in Fig. 1d and e, the contributions of primary sources (i.e., the sum of biomass burning, fugitive dust, industrial emissions, coal combustion, and vehicle emissions) in PM2.5 were significantly higher than those of the secondary formation sources in Xi'an and Shijiazhuang, indicating that the PM2.5 in these two cities is mainly influenced by the primary source emissions during wintertime. Particularly, biomass burning and coal combustion were two dominant contributors to PM2.5, with contributions of 24.6 % and 15.1 %, respectively, in Xi'an and 24.4 % and 16.0 %, respectively, in Shijiazhuang. These suggest that controls of solid fuel combustion are critical to reducing PM2.5 pollution in these cities. In contrast, the contribution of secondary formation sources to PM2.5 in Beijing was highly dominant (>50 %), potentially attributed to the strict control of primary emissions under the execution of a series of pollution control policies (Lv et al., 2016; Pang et al., 2021) and more regional transportation of secondary pollutants (Liu et al., 2019; Wang and Zhao, 2018). Among the primary sources, the contributions of biomass burning and vehicle emissions were only 18.4 % and 11.3 %, respectively, further reflecting the benefits of reductions in all primary emissions. Due to the Chinese Spring Festival, the contribution of fireworks (7.9 %) to PM2.5 ranked second in primary sources (Fig. S11), which indicates that more refined control schemes need to be encouraged to deal with such special events in the future. It should be noted that the contribution of fugitive dust was lower than the fraction of mineral dust in the three pilot cities (Fig. 1). This is because fugitive dust defined here mainly refers to road and construction dust emissions, while mineral dust represents material assumed to be oxides of mineral elements such as Al, Si, Ca, Ti, and Fe (Chow et al., 2015). These mineral elements in PM2.5 come from more emission sectors, including industry, the Earth's crust, transportation, construction, and combustion (J. Liu et al., 2018; Lu et al., 2014; Pant and Harrison, 2013; Shen et al., 2016).
Figure 2d–f show variations in source contribution with increases in PM2.5 mass concentrations in the three pilot cities. The two most dominant sources were secondary formation sources (32.1 %) and fugitive dust (31.4 %) in Xi'an, coal combustion (24.9 %) and vehicle emissions (21.3 %) in Shijiazhuang, and secondary formation sources (24.3 %) and fugitive dust (23.8 %) in Beijing when the PM2.5 mass concentration was <40 µg m−3. In Xi'an, when the PM2.5 mass concentrations exceeded 180 µg m−3, the contribution of biomass burning rose the most and reached a peak of 38.4 %, demonstrating that biomass burning plays an important role in the worsening of air quality in Xi'an. In contrast, the contributions of secondary formation sources increased the most in comparison to other sources in Shijiazhuang and Beijing, indicating that the PM2.5 pollution was mainly dominated by secondary aerosol formation during the wintertime. And the peak contributions of secondary nitrate and sulfate were 66.5 % and 74.7 %, while the PM2.5 mass concentration increased to 113 and 223 µg m−3 in Shijiazhuang and Beijing, respectively.
3.3 Formation of secondary aerosols
Using the high-time-resolution data, we further explored the possible formation mechanisms of secondary formation sources. The concentration of secondary formation sources is standardized by dividing background-corrected CO (ΔCO) to weaken the impact of planetary boundary layer height (PBLH) (DeCarlo et al., 2010). In this study, ΔCO is defined as the 1.25th percentiles of CO concentration during the campaign, which are 0.17, 0.15, and 0.16 ppm in Xi'an, Shijiazhuang, and Beijing, respectively. Ox (NO2+O3) is an indicator of the photochemical oxidation degree (Wood et al., 2010). The function between the secondary formation source ΔCO ratio and Ox during the daytime (i.e., 08:00–17:00 LST) (Fig. S12) was plotted to explain the effect of photochemical oxidation in the three pilot cities. As shown in Fig. 3, good linear correlations of the secondary formation source ΔCO ratio and Ox (R2= 0.83–0.99) suggest that photochemical oxidations play an important role in the formation of secondary aerosol during the daytime. Compared to the low-level Ox, formation of secondary aerosol was significantly enhanced at high Ox levels (>50 ppb) in Xi'an and Beijing, characterized by larger slopes of 17.2 and 38.9, respectively (Fig. 3a and c). Furthermore, the highest atmospheric oxidation capacity was found in Beijing, inferred by the highest fraction of O3 to Ox. This is consistent with the highest contribution of secondary formation sources to PM2.5 in Beijing during the daytime (Fig. S13a–c).
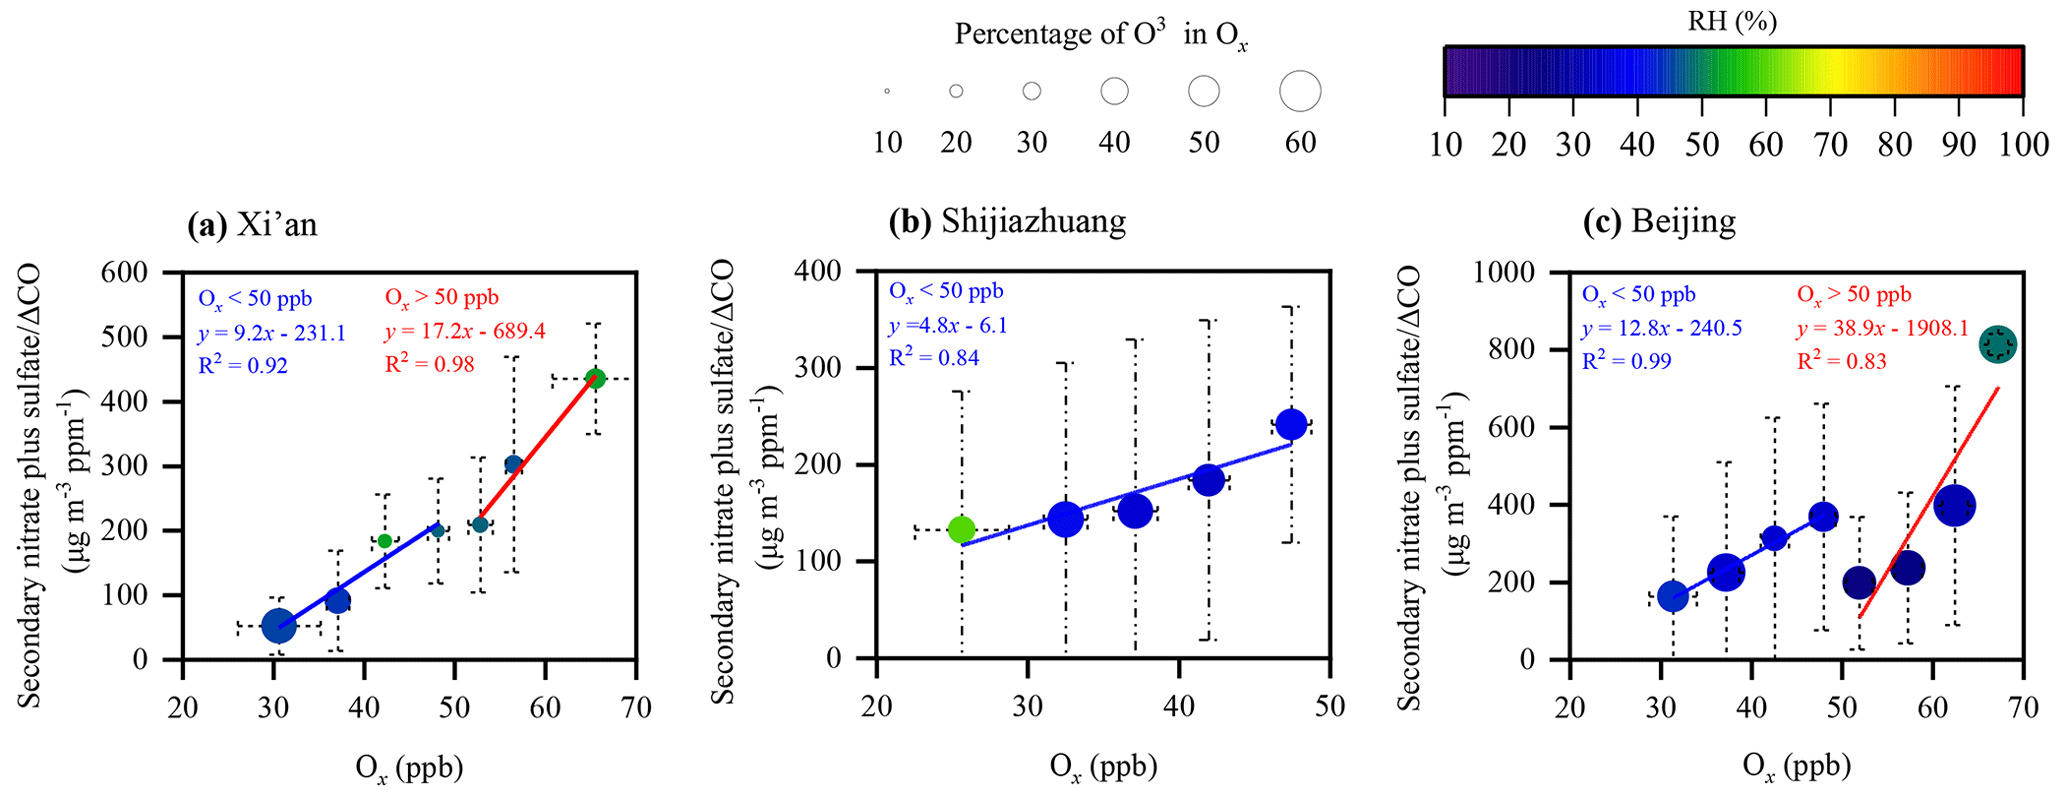
Figure 3Correlations of the secondary formation source ΔCO ratio and Ox in (a) Xi'an, (b) Shijiazhuang, and (c) Beijing. Each point and its error bar represent the mean and standard deviation in each bin (ΔOx=5 ppb).
The aqueous-phase reaction is another important pathway for secondary aerosol formation in the atmosphere (Wang et al., 2018; Xue et al., 2014). ALWC is considered an indicator of an aqueous-phase reaction (Ervens et al., 2011). As shown in Fig. S14, the aqueous-phase reaction occurred during both daytime and nighttime and was characterized by good correlations between the secondary formation source ΔCO ratio and ALWC (R2= 0.81–0.98). The correlations of the secondary formation source ΔCO ratio and ALWC during all sampling periods were re-established in the three pilot cities to assess the implications of aqueous-phase chemistry for secondary aerosol production. As shown in Fig. 4, the secondary formation source ΔCO ratio showed a significant linear correlation with ALWC (R2= 0.92–0.99) when RH <80 %, indicating an obvious effect of the aqueous-phase reaction on the secondary aerosol formation during the sampling periods. However, when RH >80 %, the secondary formation source ΔCO ratio showed no notable increase with ALWC in Shijiazhuang (Fig. 4b), whereas it showed a tiny increase with ALWC in Beijing (Fig. 4c). The higher ALWC at RH >80 % probably inhibits secondary aerosol formation due to the decrease in aerosol acidity (X. Huang et al., 2019; Meng et al., 2014). Khan et al. (2008) found that NO3 radicals can be rapidly generated from the reaction between NO2 and O3 with unsaturated organic species during nighttime. The value of O3 × NO2 can thus represent its production reaction rate or be used as a proxy for the NO3 radical. The highest NO3 radical production rate was found in Beijing, followed by Xi'an and Shijiazhuang, when RH <80 %. This could be used to explain the highest contribution of secondary formation sources to PM2.5 in Beijing during the daytime and nighttime (Fig. S13). Moreover, the results showed that both photochemical oxidation and aqueous-phase reaction play more important roles in Beijing, where the primary sources have been better controlled. This reflects that pollution control policies need to focus on the suppression of secondary formations.
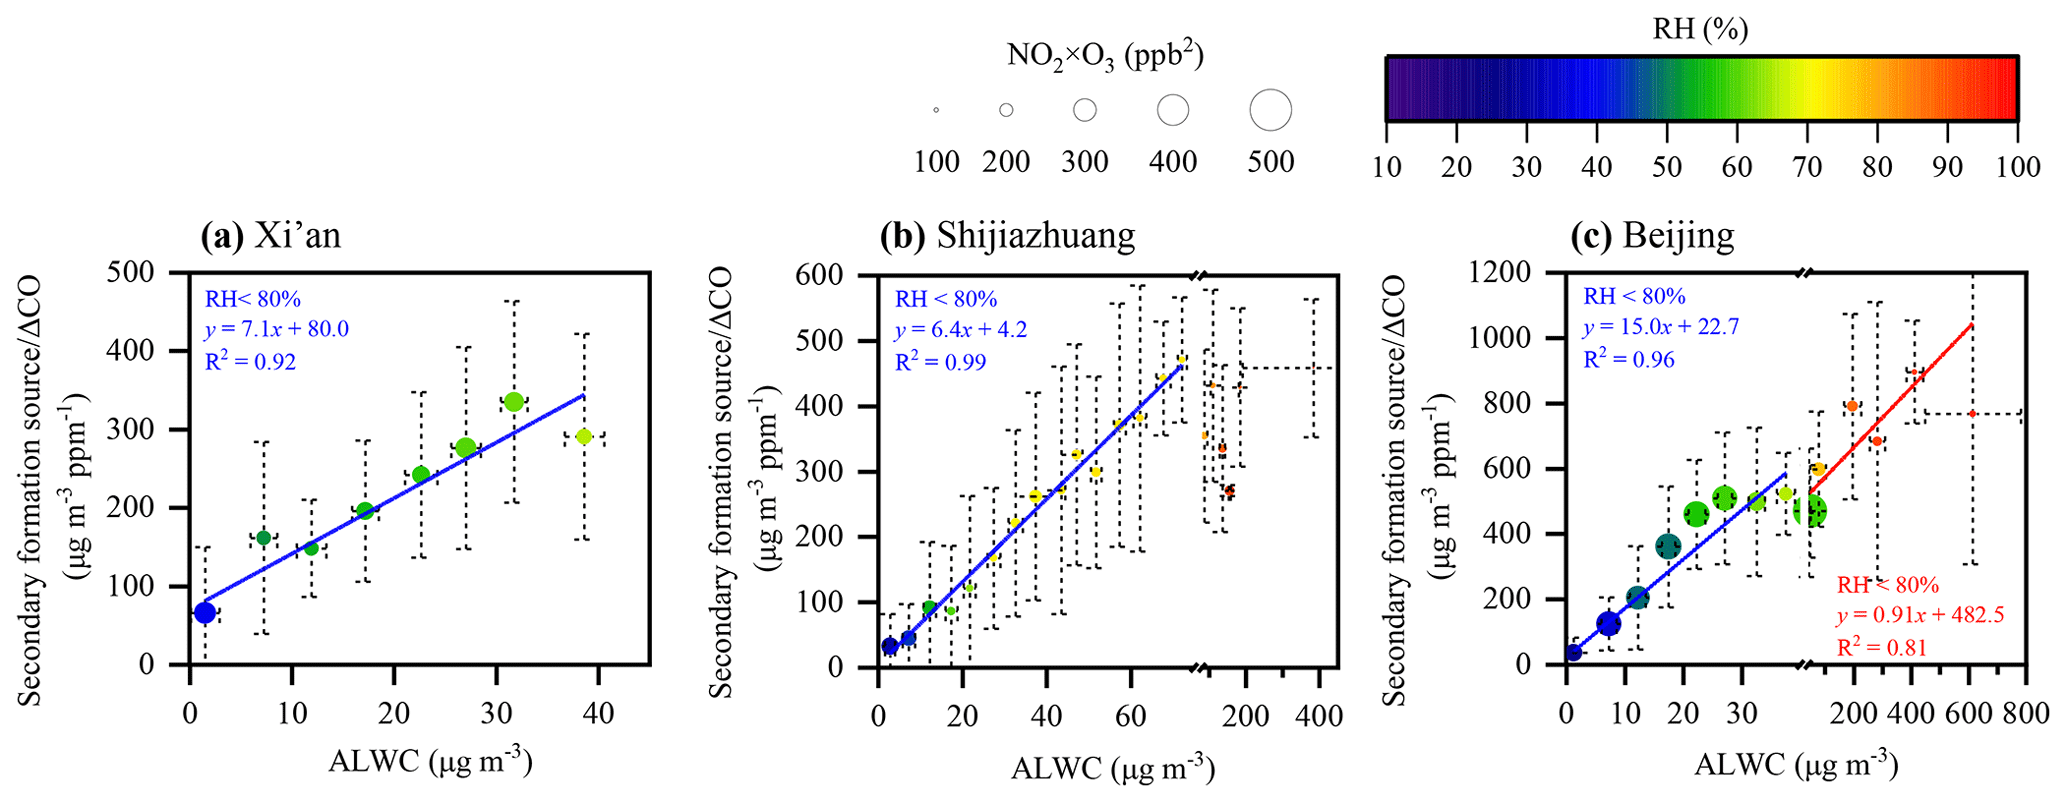
Figure 4Correlation of the secondary formation source ΔCO ratio and ALWC during sampling periods in (a) Xi'an, (b) Shijiazhuang, and (c) Beijing, respectively. The points and error bars represent the mean values and standard deviation values of the secondary formation source ΔCO ratio and ALWC in each bin. In Xi'an, each bin is 5 µg m−3 (ΔALWC=5 µg m−3). In Shijiazhuang, each bin is 5 µg m−3 (ΔALWC=5 µg m−3) when ALWC ranged from 0 to 75 µg m−3 but 25 µg m−3 (ΔALWC=25 µg m−3) when ALWC ranged from 75 to 200 µg m−3 due to limitations in data. In Beijing, each bin is 5 µg m−3 (ΔALWC=5 µg m−3) when ALWC ranged from 0 to 50 µg m−3 but 100 µg m−3 (ΔALWC=100 µg m−3) when ALWC ranged from 50 to 900 µg m−3 due to limitations in data.
3.4 Elaborations of different episodes
During the sampling periods, the concentration of PM2.5 and its chemical components accumulated within a short period in a few cases (Fig. S15a–c). We define such a rapid rise in PM2.5 mass concentration as a pollution episode. As shown in Table 1, meteorological conditions, the concentration levels of gaseous pollutants, chemical compositions, and source contributions of PM2.5 during pollution episodes in the three pilot cities are summarized. The episodes were accompanied by low wind speed (<2 m s−1), leading to weak dispersions of fresh emissions and accumulated pollutants (Z. Chen et al., 2020). OA and NO were the two dominant chemical components in PM2.5 during all pollution episodes, with fractions of 26 %–40 % and 23 %–32 %, respectively. Their high abundances could be explained by the significant reduction in SO2 emissions because of the prohibition of burning bulk coals and enforcement of the “Coal-to-Natural Gas” policy in recent years (Meng et al., 2022). In this study, eight pollution episodes (denoted as EP1–EP8) were classified into three types: the first type was dominated by biomass burning (30 %–40 %) (EP1, EP4, and EP8); the second type was dominated by secondary formation sources (61 %–70 %) (EP5, EP6, and EP7); and the two remaining pollution episodes were mutually contributed by both primary and secondary sources (EP2 and EP3), in which secondary formation sources (34 %–39 %) and biomass burning (23 %–24 %) were the two dominant contributors to PM2.5.
Table 1Meteorological conditions, gas pollutants, chemical composition, and source contribution of PM2.5 during pollution episodes in Xi'an, Shijiazhuang, and Beijing.
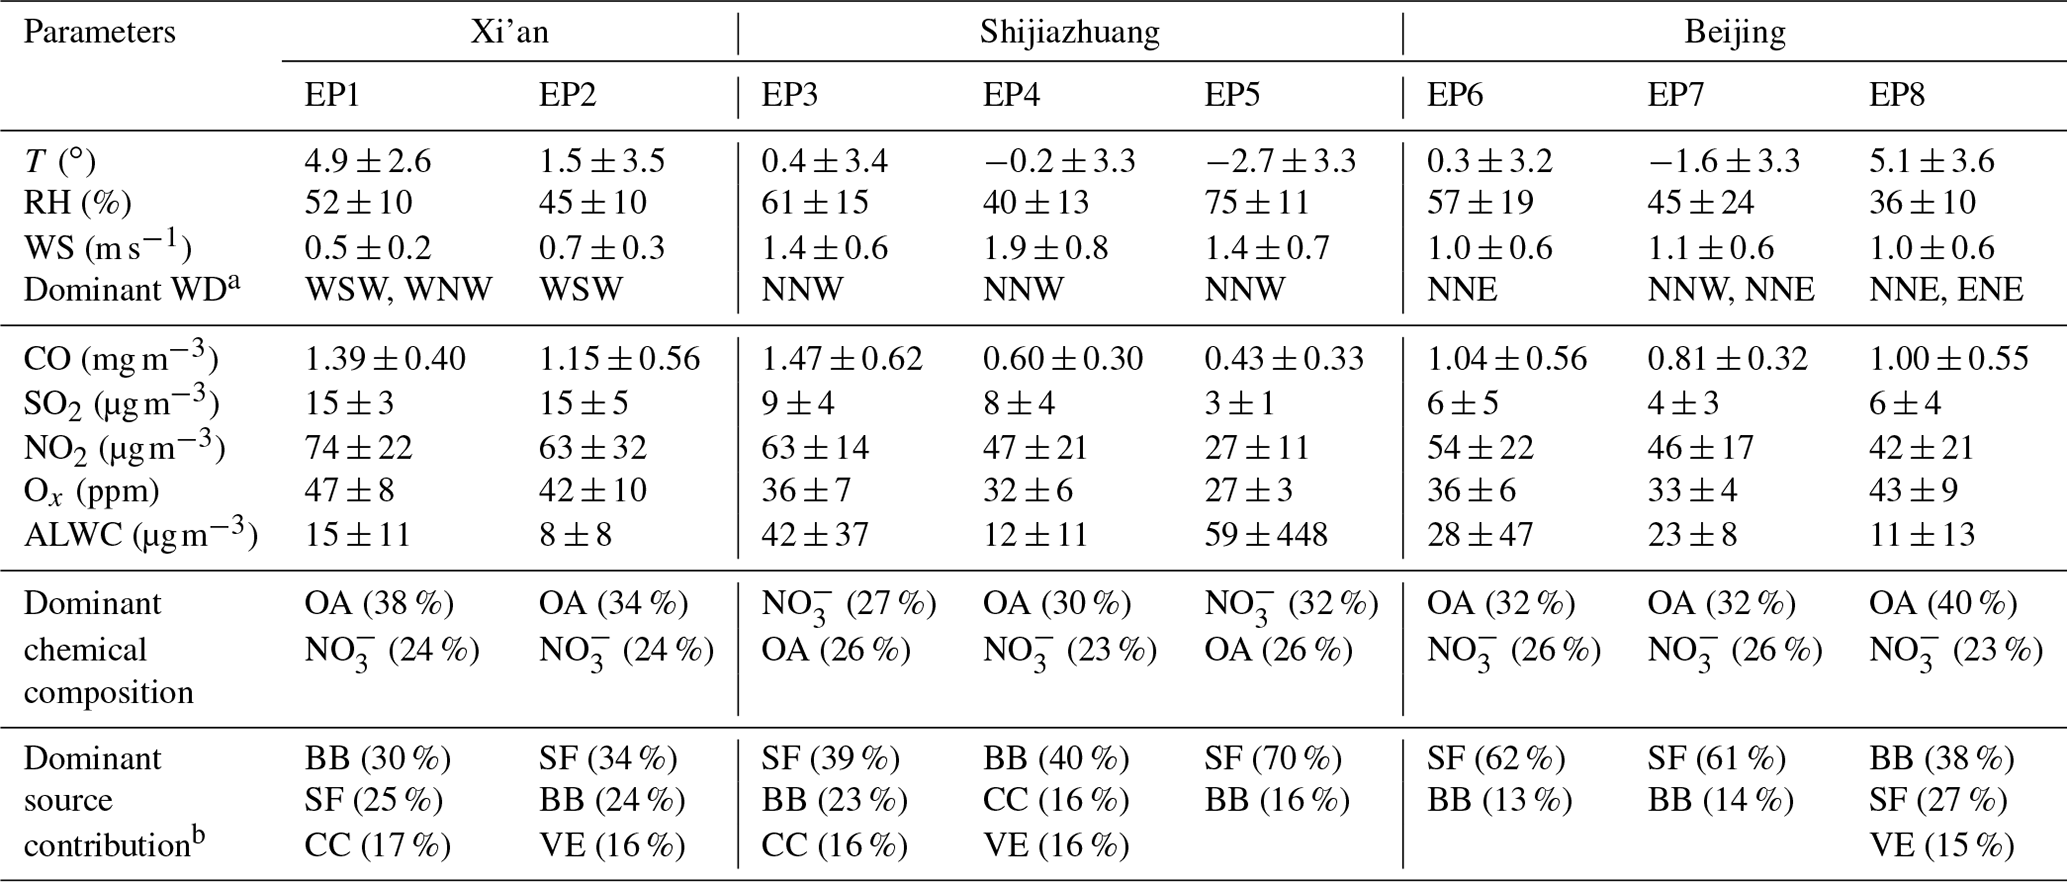
a WSW: west-southwest; WNW: west-northwest; NNW: north-northwest; NNE: north-northeast; ENE: east-northeast. b BB: biomass burning; SF: secondary formation source; CC: coal combustion; VE: vehicle emissions.
To gain insights into the process of pollution episodes, three typical pollution events were chosen for detailed discussion (i.e., EP2 in Xi'an, EP4 in Shijiazhuang, and EP7 in Beijing) based on the validity and integrity of the data and the representativeness of the selected pollution events. The two-stage evolution was distinguished for EP4 as an example of the first type of episode (Fig. S16). In Stage 1, the PM2.5 mass concentrations rapidly increased from 7 to 82 µg m−3 under stable weather conditions, inferred by low wind speed (1.8±0.8 m s−1; Fig. S16b), in which the concentrations (fractions) of biomass burning increased from 0.6 µg m−3 (7 %) to 36.7 µg m−3 (55 %) due to heating activity during nighttime. Meanwhile, the chemical composition was relatively stable and dominated by OA (31±5 %) and NO (21±5 %). In Stage 2, the PM2.5 mass concentration continuously increased to 105 µg m−3 in a few hours, and the concentration (contribution) of secondary formation sources rapidly increased from 2.3 µg m−3 (4 %) to 54.4 µg m−3 (52 %) (Fig. S16g and h). This is due to the aqueous-phase-reaction effect inferred by the rapid increase in ALWC (from 16 to 78 µg m−3; Fig. S16c) and RH (from 51 % to 79 %; Fig. S16a).
In contrast, a three-stage evolution was distinguished for the second type of episode, using EP7 as an example (Fig. S17). In Stage 1, the PM2.5 concentration gradually increased from 11 to 30 µg m−3, as did NO2 (from 15 to 59 µg m−3; Fig. S17d), due to the boosts of the predominant contributions of vehicle emissions and biomass burning (Fig. S17g and h). In the meantime, the contribution of coal combustion also slowly increased along with SO2 (Fig. S17d and h). In Stage 2, under the lowest average wind speed in the study period (0.7±0.4 m s−1; Fig. S17b), the PM2.5 mass concentrations moderately increased from 30 to 91 µg m−3 with relatively stable chemical composition and source contribution (Fig. S17f and h). Compared to Stage 1, the fractions of NO increased mostly from 9±3 % to 23±3 %; this is probably influenced by photochemical oxidation, inferred by relatively high Ox and NO2 concentration (Fig. S17c and d). In Stage 3, the PM2.5 mass concentration rapidly rose to 142 µg m−3 and then remained stable. Furthermore, the greatest increase in source concentration (contribution) was secondary formation sources, from 18.9 µg m−3 (48 %) to 120.6 µg m−3 (80 %). This might be due to the occurrence of an aqueous-phase reaction, which was indicated by the elevation of RH and ALWC (Fig. S17a and c).
Figure S16 illustrates the third type of episode, in which a four-stage evolution was resolved, using EP2 as an example. In Stage 1, the PM2.5 mass concentration (14±3 µg m−3) was relatively low and was dominated by the contributions of secondary formation sources (43±17 %) and fugitive dust (24±8 %), as well as MD (28±7 %) and OA (26±7 %). In Stage 2, the PM2.5 mass concentrations promptly increased from 21 to 82 µg m−3 with the two dominant chemical components of OA (21.7 µg m−3) and NO (17.1 µg m−3). The PM2.5 increases can also be attributed to the rise in secondary formation sources (25.3 µg m−3) and biomass burning (14.4 µg m−3). The enhancement of secondary aerosol was probably generated through the aqueous-phase reaction evidenced by the increase in ALWC and NO2 (Fig. S18c and d). In Stage 3, PM2.5 mass continuously increased to 139 µg m−3 with a dominant increase in primary source emissions, including biomass burning (29.0 µg m−3), vehicle emissions (21.5 µg m−3), and coal combustion (16.5 µg m−3), along with the increases in SO2 and NO2 as well (Fig. S18d). The three primary sources contributed >60 % of the total resolved sources. Meanwhile, the secondary formation sources also increased slowly through aqueous-phase reaction, inferred by the increase in ALWC (Fig. S18c). In the final stage, Stage 4, the PM2.5 mass concentration remained relatively stable, with an average of 142±11 µg m−3, dominated by secondary formation sources (34±6 %) and biomass burning (28±6 %) as well as chemical components of OA (36±4 %) and NO (25±1 %).
In summary, the pollution events that occurred in Xi'an were mainly derived by stronger emissions of primary sources under adverse meteorological conditions, even though the aqueous-phase reaction also contributed to secondary aerosol formation. In contrast, pollution events that occurred in Shijiazhuang and Beijing were mainly influenced by the formation of secondary aerosols through both aqueous-phase reaction and photochemical oxidation. Moreover, aqueous-phase reaction plays a more important role than photochemical oxidation. Hence, to further improve the air quality in the north of China, primary source emissions should be prioritized for control in the northwestern region, with a focus on biomass burning and coal combustion. In the North China Plain, priority should be given to the reduction in emissions of the precursors from secondary sources, with a focus on NOx and volatile organic compounds (VOCs).
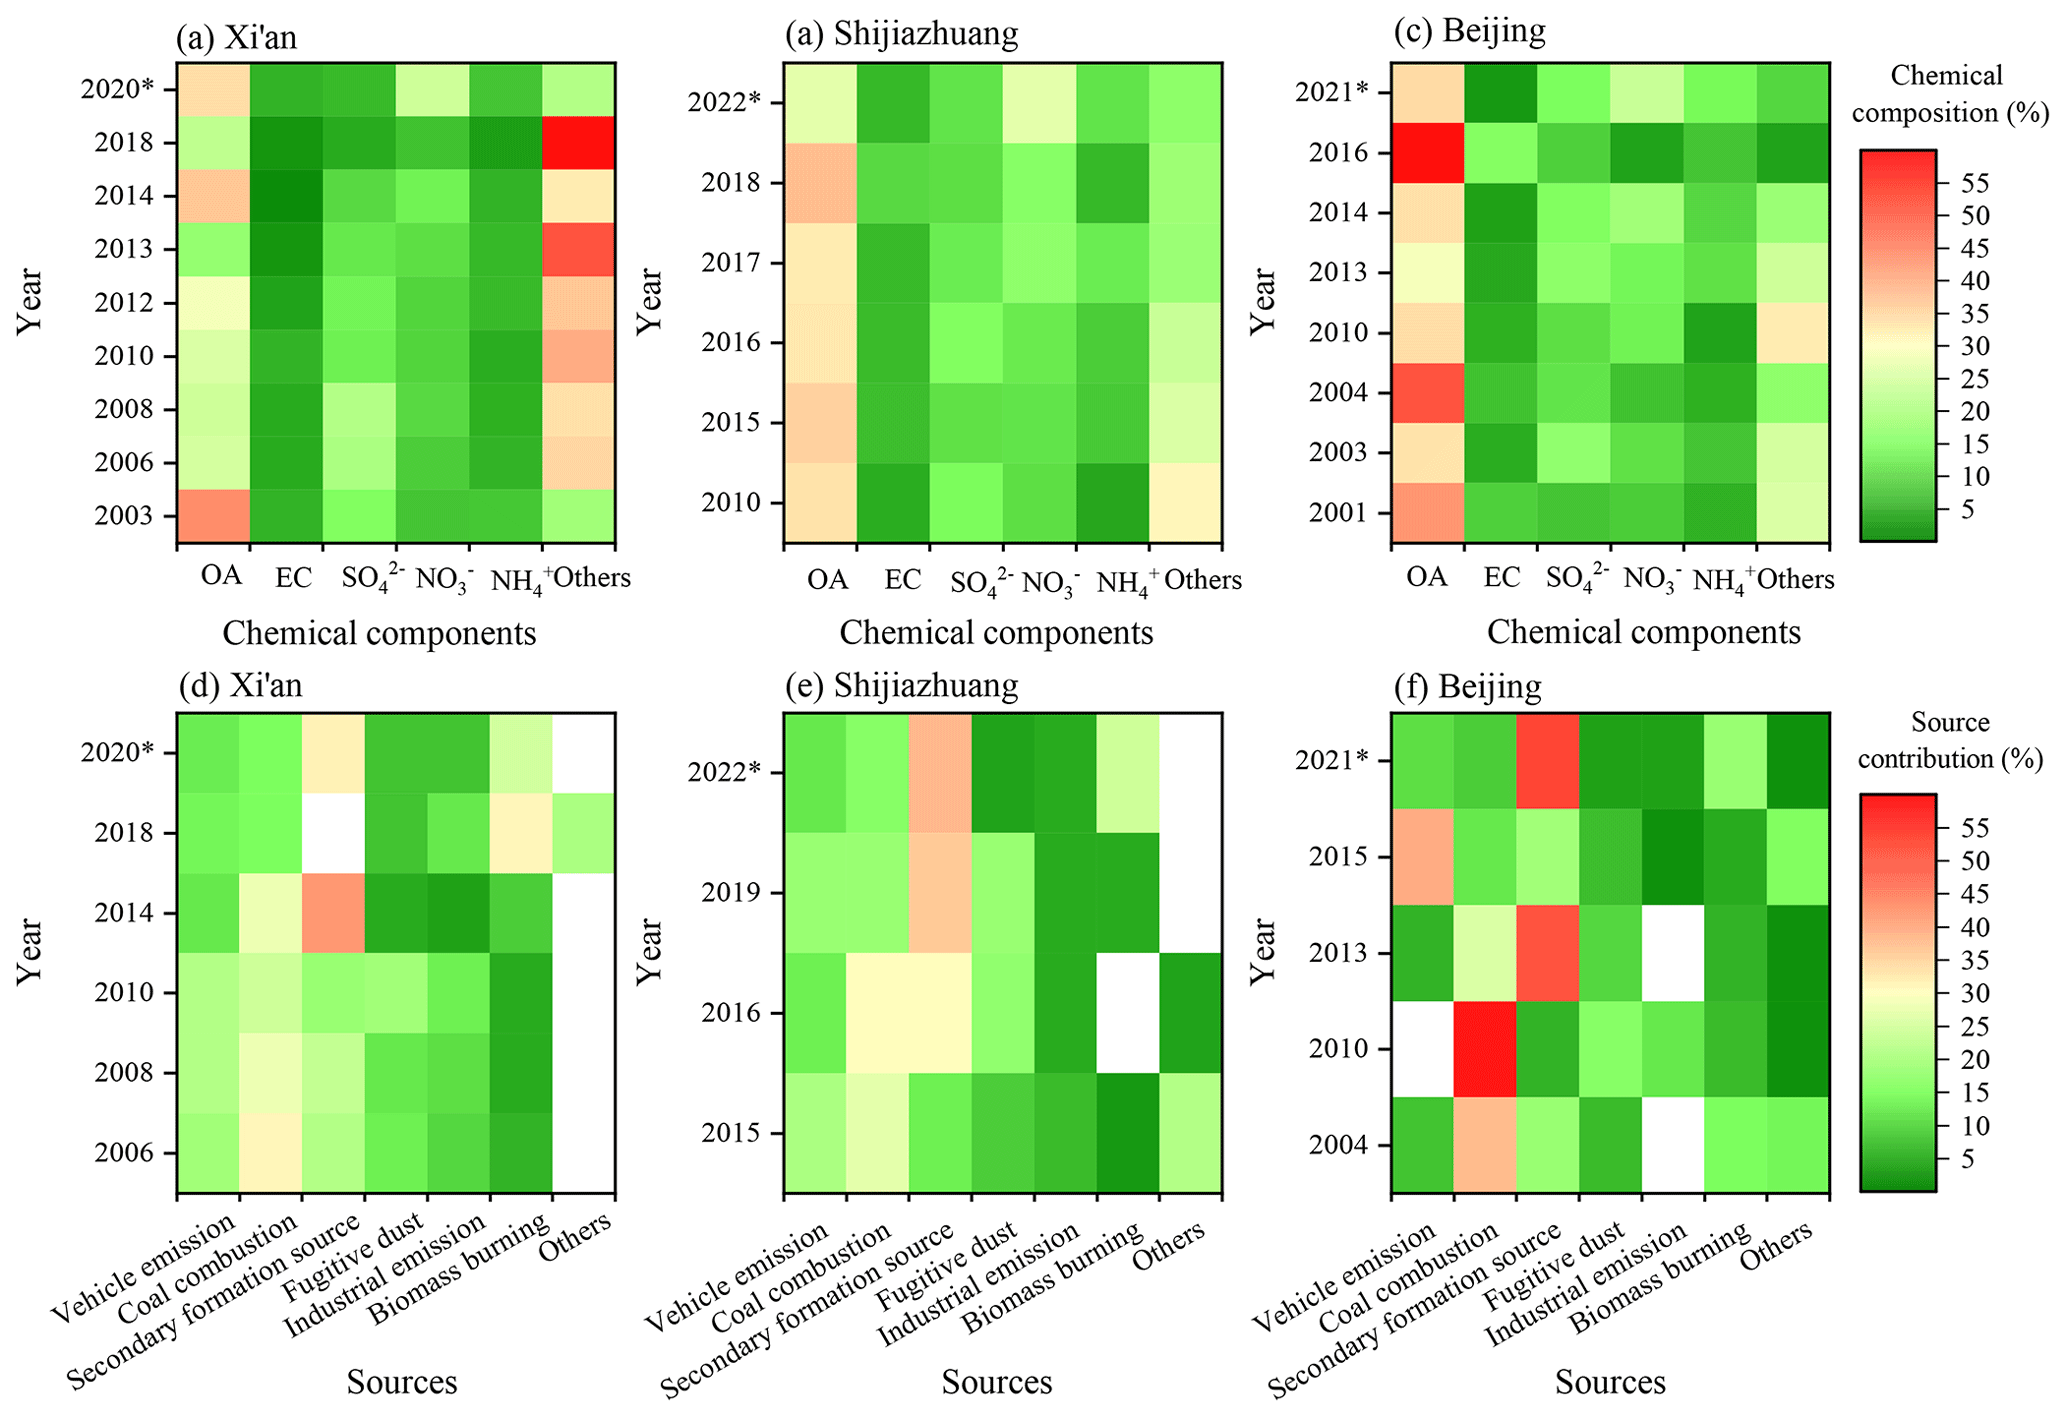
Figure 5Summary of PM2.5 and its composition (a, b, c) and source contribution (d, e, f) in Xi'an, Shijiazhuang, and Beijing in winter in past decades, where * represents the results of this study. The data and references used for this figure are listed in Tables S7 and S8.
3.5 Policy implications
In past decades, the air quality in China improved notably under the implementation of air pollution control policies, including the APCAP and TAPFAP. The PM2.5 mass in Xi'an, Shijiazhuang, and Beijing was the lowest during the campaigns compared with those in the last few decades (Table S7). The variations in the chemical composition and the source contribution of PM2.5 in the three pilot cities are displayed in Fig. 5. As shown, the dominant chemical components of PM2.5 changed from OA and SO to OA and NO (Fig. 5a–c). This could be attributed to the reduction in coal consumption due to clean-energy replacement and the increase in vehicle ownership, which led to a decrease in SO2 and an increase in NO2 (Wang et al., 2013). Since the atmospheric oxidation reaction (i.e., aqueous-phase reaction and photochemical oxidation) of the precursors ( i.e., NO2, VOCs) is the primary source for the OA and NO in the atmosphere (Feng et al., 2018; Li et al., 2022; Tao et al., 2016; S. Yang et al., 2022; Ziemann and Atkinson, 2012), and it is impossible to avoid, the precursors of OA and NO should be reduced from the combustion and transportation sectors (Fermo et al., 2021; Liu et al., 2022; Y. Wang et al., 2021; Zhang et al., 2019). In addition, the fraction of NH in PM2.5 increased at an alarming rate. Coincidentally, this follows a similar trend to NH3. Studies have reported that controls of NH are more effective than those of NOx in the reduction in PM2.5 mass concentrations (Gu et al., 2021; Zheng et al., 2022). Therefore, collaborative control measures for the emissions of precursors, including NOx, VOCs, and NH3, are necessary.
As shown in Table S8 and Fig. 5d–f, coal combustion decreased remarkably due to the coal-related policies implemented, including the strength of emissions standards for coal-fired power plants, the change in energy source from coal to natural gas in some industries, and the ban on coal burning in the main urban areas (Shen, 2016; Yang and Teng, 2018). A similar trend was also found in the results of PM2.5 source apportionment in Beijing released by the Beijing Municipal Ecology and Environment Bureau (Fig. S19). Meanwhile, the contribution of industrial emissions and vehicle emissions decreased slightly because of the improvement of industrial emission standards (He et al., 2020; Wang et al., 2020a) and traffic-related policy implementation such as strengthening of vehicle emission standards, improvement of fuel quality, and elimination of high-emission vehicles. This resulted in a reduction in precursor gases and PM2.5 from vehicles (Feng et al., 2021; Fontaras et al., 2012; Jin et al., 2012). However, the emissions of biomass burning did not show a significant reduction in recent years, and its contribution increased from 9 % in 2014 to 25 % in 2020 (Xi'an), from 3 % in 2015 to 24 % in 2022 (Shijiazhuang), and from 6 % in 2013 to 18 % in 2021 (Beijing) (Fig. 5d–f). This is likely because biomass burning is an open source, which makes it more difficult to control compared to other primary sources. Biomass used for residential heating in rural areas is still common (Ren, 2021; Tian et al., 2022; D. Yang et al., 2022; Zhang et al., 2017). Hence, the clean-energy revolution should be promoted urgently, especially in northwestern China. Moreover, the contributions of secondary formation sources increased, which is potentially explained by the high reduction rate of primary emissions and the improvement of atmospheric oxidation capacity (S. Chen et al., 2020; Feng et al., 2020). Therefore, more control measures should focus on weakening the atmospheric oxidation capacity, such as reduction in O3 formation, to reduce the formation of secondary pollutants, which are now identified as the most critical drivers of pollution. Considering those factors, it is also important to promote the mitigation of both PM2.5 and O3.
Intensive real-time measurement campaigns related to PM2.5 chemical components were conducted in Xi'an, Shijiazhuang, and Beijing during the wintertime. Chemical compositions of PM2.5 in the three cities were all dominated by OA (26.9 %–34.2 %) and NO (23.6 %–26.5 %). Six sources of PM2.5 in Xi'an and Shijiazhuang were resolved by HERM, and their contributions were similar. In descending order, they were secondary formation sources (32.2 %–37.6 %), biomass burning (24.4 %–24.6 %), coal combustion (15.1 %–16.0 %), vehicle emissions (12.2 %–12.5 %), industrial emissions (5.5 %–7.7 %), and fugitive dust (4.4 %–7.8 %). However, the secondary nitrate (29.0 %) and the secondary sulfate (23.0 %) were separately resolved and were relatively more important in Beijing. In addition, the contribution of fireworks (7.9 %) to PM2.5 was found during the Chinese Spring Festival.
The possible formation mechanism of secondary formation sources in the three pilot cities was explored. The results showed that secondary aerosols were generated by both photochemical oxidation and aqueous-phase reaction. Meanwhile, the formation rate of secondary aerosols in Beijing was higher than that in Xi'an and Shijiazhuang. Furthermore, the eight pollution episodes within the sampling periods were categorized into three types and characterized. The dominant chemical compositions of PM2.5 were OA (26 %–40 %) and NO (23 %–32 %) during all pollution episodes. Furthermore, secondary formation sources and biomass burning were two major drivers of the pollution.
The dominant chemical components of PM2.5 in the pilot cities changed from OA and SO to OA and NO under the implementation of a clean-air plan in the past decades. This indicates that a reduction in precursors, including NO2 and VOCs, should be a key task in the future. In addition, the contribution of biomass burning increased, especially in Xi'an. This indicates that clean energy for heating activity in rural areas in northwestern China is still insufficient. Furthermore, to weaken the atmospheric oxidation capacity for reducing the contribution of secondary formation sources, it is necessary to promote the collaborative control on ozone and particulate matter.
Data used to support the findings in this study are archived at the Institute of Earth Environment, Chinese Academy of Sciences, and are publicly available at https://doi.org/10.5281/zenodo.8106655 (Zhang et al., 2023).
The supplement related to this article is available online at: https://doi.org/10.5194/acp-23-9455-2023-supplement.
QW, YH, and JC designed the campaigns. WR and YZ conducted the field measurements. YZ, JT, HL, LQ, and TC performed data analysis and interpretation. MIM, KRD, JGS, and ASHP were involved in supervision and review. YZ wrote the paper with contributions from all co-authors.
The contact author has declared that none of the authors has any competing interests.
Publisher’s note: Copernicus Publications remains neutral with regard to jurisdictional claims in published maps and institutional affiliations.
The authors are grateful for field sampling assistance provided by staff of the Guanzhong Plain, Eco-environmental Change and Comprehensive Treatment, National Observation and Research Station; the Tower Branch of the Institute of Atmospheric Physics, Chinese Academy Sciences; and Hebei Sailhero Environmental Protection High-tech Co., Ltd.
This research has been supported by the Sino-Swiss Cooperation on Air Pollution for Better Air (grant no. 7F-09802.01.02) from the Swiss Agency for Development and Cooperation (SDC), the National Key R&D Program of China (grant no. 2022YFF0802501), the Youth Innovation Promotion Association of the Chinese Academy of Sciences (grant no. 2019402), and the Natural Science Basic Research Program of Shaanxi (grant no. 2022JQ-267).
This paper was edited by Zhibin Wang and reviewed by two anonymous referees.
Adachi, K. and Tainosho, Y.: Characterization of heavy metal particles embedded in tire dust, Environ. Int., 30, 1009–1017, https://doi.org/10.1016/j.envint.2004.04.004, 2004.
Ålander, T., Antikainen, E., Raunemaa, T., Elonen, E., Rautiola, A., and Torkkell, K.: Particle emissions from a small Two-Stroke engine: Effects of fuel, lubricating oil, and exhaust aftertreatment on particle characteristics, Aerosol Sci. Technol., 39, 151–161, https://doi.org/10.1080/027868290910224, 2005.
Cao, J. J. and Cui, L.: Current status, characteristics and causes of particulate air pollution in the Fenwei Plain, China: A Review, J. Geophys. Res.-Atmos., 126, e2020JD034472, https://doi.org/10.1029/2020JD034472, 2021.
Chan, C. K. and Yao, X.: Air pollution in mega cities in China, Atmos. Environ., 42, 1–42, https://doi.org/10.1016/j.atmosenv.2007.09.003, 2008.
Chen, L.-W. A. and Cao, J. J.: PM2.5 source apportionment using a hybrid environmental receptor model, Environ. Sci. Technol., 52, 6357–6369, https://doi.org/10.1021/acs.est.8b00131, 2018.
Chen, Q., Hua, X., Li, J. W., Chang, T., and Wang, Y.: Diurnal evolutions and sources of water-soluble chromophoric aerosols over Xi'an during haze event, in Northwest China, Sci. Total Environ., 786, 147412, https://doi.org/10.1016/j.scitotenv.2021.147412, 2021.
Chen, S., Wang, H., Lu, K., Zeng, L., Hu, M., and Zhang, Y.: The trend of surface ozone in Beijing from 2013 to 2019: Indications of the persisting strong atmospheric oxidation capacity, Atmos. Environ., 242, 117801, https://doi.org/10.1016/j.atmosenv.2020.117801, 2020.
Chen, Z., Chen, D., Zhao, C., Kwan, M., Cai, J., Zhuang, Y., Zhao, B., Wang, X., Chen, B., Yang, J., Li, R., He, B., Gao, B., Wang, K., and Xu, B.: Influence of meteorological conditions on PM2.5 concentrations across China: A review of methodology and mechanism, Environ. Int., 139, 105558, https://doi.org/10.1016/j.envint.2020.105558, 2020.
Chow, J. C., Lowenthal, D. H., Chen, L.-W. A., Wang, X., and Watson, J. G.: Mass reconstruction methods for PM2.5: a review, Air Qual. Atmos. Hlth, 8, 243–263, https://doi.org/10.1007/s11869-015-0338-3, 2015.
Dai, Q., Liu, B., Bi, X., Wu, J., Liang, D., Zhang, Y., Feng, Y., and Hopke, P. K.: Dispersion normalized PMF provides insights into the significant changes in source contributions to PM2.5 after the COVID-19 outbreak, Environ. Sci. Technol., 54, 9917–9927, https://doi.org/10.1021/acs.est.0c02776, 2020.
DeCarlo, P. F., Ulbrich, I. M., Crounse, J., de Foy, B., Dunlea, E. J., Aiken, A. C., Knapp, D., Weinheimer, A. J., Campos, T., Wennberg, P. O., and Jimenez, J. L.: Investigation of the sources and processing of organic aerosol over the Central Mexican Plateau from aircraft measurements during MILAGRO, Atmos. Chem. Phys., 10, 5257–5280, https://doi.org/10.5194/acp-10-5257-2010, 2010.
Drinovec, L., Močnik, G., Zotter, P., Prévôt, A. S. H., Ruckstuhl, C., Coz, E., Rupakheti, M., Sciare, J., Müller, T., Wiedensohler, A., and Hansen, A. D. A.: The “dual-spot” Aethalometer: an improved measurement of aerosol black carbon with real-time loading compensation, Atmos. Meas. Tech., 8, 1965–1979, https://doi.org/10.5194/amt-8-1965-2015, 2015.
Duan, J. and Tan, J.: Atmospheric heavy metals and Arsenic in China: Situation, sources and control policies, Atmos. Environ., 74, 93–101, https://doi.org/10.1016/j.atmosenv.2013.03.031, 2013.
Elser, M., Huang, R.-J., Wolf, R., Slowik, J. G., Wang, Q., Canonaco, F., Li, G., Bozzetti, C., Daellenbach, K. R., Huang, Y., Zhang, R., Li, Z., Cao, J., Baltensperger, U., El-Haddad, I., and Prévôt, A. S. H.: New insights into PM2.5 chemical composition and sources in two major cities in China during extreme haze events using aerosol mass spectrometry, Atmos. Chem. Phys., 16, 3207–3225, https://doi.org/10.5194/acp-16-3207-2016, 2016.
Ervens, B., Turpin, B. J., and Weber, R. J.: Secondary organic aerosol formation in cloud droplets and aqueous particles (aqSOA): a review of laboratory, field and model studies, Atmos. Chem. Phys., 11, 11069–11102, https://doi.org/10.5194/acp-11-11069-2011, 2011.
Feng, T., Bei, N., Zhao, S., Wu, J. rui, Li, X., Zhang, T., Cao, J., Zhou, W., and Li, G.: Wintertime nitrate formation during haze days in the Guanzhong basin, China: A case study, Environ. Pollut., 243, 1057–1067, https://doi.org/10.1016/j.envpol.2018.09.069, 2018.
Feng, T., Zhao, S., Zhang, X., Wang, Q., Liu, L., Li, G., and Tie, X.: Increasing wintertime ozone levels and secondary aerosol formation in the Guanzhong basin, central China, Sci. Total Environ., 745, 140961, https://doi.org/10.1016/j.scitotenv.2020.140961, 2020.
Feng, X., Zhang, X., He, C., and Wang, J.: Contributions of traffic and industrial emission reductions to the air quality improvement after the lockdown of Wuhan and neighboring Cities due to COVID-19, Toxics, 9, 358, https://doi.org/10.3390/toxics9120358, 2021.
Fermo, P., Artíñano, B., De Gennaro, G., Pantaleo, A. M., Parente, A., Battaglia, F., Colicino, E., Di Tanna, G., Goncalves da Silva Junior, A., Pereira, I. G., Garcia, G. S., Garcia Goncalves, L. M., Comite, V., and Miani, A.: Improving indoor air quality through an air purifier able to reduce aerosol particulate matter (PM) and volatile organic compounds (VOCs): Experimental results, Environ. Pollut., 197, 111131, https://doi.org/10.1016/j.envres.2021.111131, 2021.
Fontaras, G., Martini, G., Manfredi, U., Marotta, A., Krasenbrink, A., Maffioletti, F., Terenghi, R., and Colombo, M.: Assessment of on-road emissions of four Euro V diesel and CNG waste collection trucks for supporting air-quality improvement initiatives in the city of Milan, Sci. Total Environ., 426, 65–72, https://doi.org/10.1016/j.scitotenv.2012.03.038, 2012.
Fountoukis, C. and Nenes, A.: ISORROPIA II: a computationally efficient thermodynamic equilibrium model for K+–Ca2+–Mg2+–NH–Na+–SO–NO–Cl−–H2O aerosols, Atmos. Chem. Phys., 7, 4639–4659, https://doi.org/10.5194/acp-7-4639-2007, 2007.
Furger, M., Rai, P., Slowik, J. G., Cao, J., Visser, S., Baltensperger, U., and Prévôt, A. S. H.: Automated alternating sampling of PM10 and PM2.5 with an online XRF spectrometer, Atmospheric Environment: X, 5, 100065, https://doi.org/10.1016/j.aeaoa.2020.100065, 2020.
Gu, B., Zhang, L., Van Dingenen, R., Vieno, M., Van Grinsven, H. J., Zhang, X., Zhang, S., Chen, Y., Wang, S., Ren, C., Rao, S., Holland, M., Winiwarter, W., Chen, D., Xu, J., and Sutton, M. A.: Abating ammonia is more cost-effective than nitrogen oxides for mitigating PM2.5 air pollution, Science, 374, 758–762, https://doi.org/10.1126/science.abf8623, 2021.
Guo, Y., Lin, C., Li, J., Wei, L., Yang, Y., Yang, Q., Li, D., Wang, H., and Shen, J.: Persistent pollution episodes, transport pathways, and potential sources of air pollution during the heating season of 2016–2017 in Lanzhou, China, Environ. Monit. Assess., 193, 852, https://doi.org/10.1007/s10661-021-09597-8, 2021.
He, J., Zhao, M., Zhang, B., Wang, P., Zhang, D., Wang, M., Liu, B., Li, N., Yu, K., Zhang, Y., Zhou, T., and Jing, B.: The impact of steel emissions on air quality and pollution control strategy in Caofeidian, North China, Atmos. Pollut. Res., 11, 1238–1247, https://doi.org/10.1016/j.apr.2020.04.012, 2020.
He, K., Huo, H., and Zhang, Q.: Urban air pollution in China: Current status, characteristics, and progress, Annu. Rev. Energy. Environ., 27, 397–431, https://doi.org/10.1146/annurev.energy.27.122001.083421, 2002.
Hu, W., Campuzano-Jost, P., Day, D. A., Croteau, P., Canagaratna, M. R., Jayne, J. T., Worsnop, D. R., and Jimenez, J. L.: Evaluation of the new capture vapourizer for aerosol mass spectrometers (AMS) through laboratory studies of inorganic species, Atmos. Meas. Tech., 10, 2897–2921, https://doi.org/10.5194/amt-10-2897-2017, 2017.
Huang, R.-J., Zhang, Y., Bozzetti, C., Ho, K.-F., Cao, J.-J., Han, Y., Daellenbach, K. R., Slowik, J. G., Platt, S. M., Canonaco, F., Zotter, P., Wolf, R., Pieber, S. M., Bruns, E. A., Crippa, M., Ciarelli, G., Piazzalunga, A., Schwikowski, M., Abbaszade, G., Schnelle-Kreis, J., Zimmermann, R., An, Z., Szidat, S., Baltensperger, U., Haddad, I. E., and Prévôt, A. S. H.: High secondary aerosol contribution to particulate pollution during haze events in China, Nature, 514, 218–222, https://doi.org/10.1038/nature13774, 2014.
Huang, R.-J., Wang, Y., Cao, J., Lin, C., Duan, J., Chen, Q., Li, Y., Gu, Y., Yan, J., Xu, W., Fröhlich, R., Canonaco, F., Bozzetti, C., Ovadnevaite, J., Ceburnis, D., Canagaratna, M. R., Jayne, J., Worsnop, D. R., El-Haddad, I., Prévôt, A. S. H., and O'Dowd, C. D.: Primary emissions versus secondary formation of fine particulate matter in the most polluted city (Shijiazhuang) in North China, Atmos. Chem. Phys., 19, 2283–2298, https://doi.org/10.5194/acp-19-2283-2019, 2019.
Huang, R.-J., He, Y., Duan, J., Li, Y., Chen, Q., Zheng, Y., Chen, Y., Hu, W., Lin, C., Ni, H., Dai, W., Cao, J., Wu, Y., Zhang, R., Xu, W., Ovadnevaite, J., Ceburnis, D., Hoffmann, T., and O'Dowd, C. D.: Contrasting sources and processes of particulate species in haze days with low and high relative humidity in wintertime Beijing, Atmos. Chem. Phys., 20, 9101–9114, https://doi.org/10.5194/acp-20-9101-2020, 2020.
Huang, X., Liu, Z., Liu, J., Hu, B., Wen, T., Tang, G., Zhang, J., Wu, F., Ji, D., Wang, L., and Wang, Y.: Chemical characterization and source identification of PM2.5 at multiple sites in the Beijing–Tianjin–Hebei region, China, Atmos. Chem. Phys., 17, 12941–12962, https://doi.org/10.5194/acp-17-12941-2017, 2017.
Huang, X., Zhang, J., Luo, B., Luo, J., Zhang, W., and Rao, Z.: Characterization of oxalic acid-containing particles in summer and winter seasons in Chengdu, China, Atmos. Environ., 198, 133–141, https://doi.org/10.1016/j.atmosenv.2018.10.050, 2019.
Jin, T., Gao, J., Fu, L. Ai, Y., and Xu, X. H.: An evaluation of improvements in the air quality of Beijing arising from the use of new vehicle emission standards, Environ. Monit. Assess., 184, 2151–2159, https://doi.org/10.1007/s10661-011-2106-7, 2012.
Khan, M. A. H., Ashfold, M. J., Nickless, G., Martin, D., Watson, L. A., Hamer, P. D., Wayne, R. P., Canosa-Mas, C. E., and Shallcross, D. E.: Night-time NO3 and OH radical concentrations in the United Kingdom inferred from hydrocarbon measurements, Atmos. Sci. Lett., 9, 140–146, https://doi.org/10.1002/asl.175, 2008.
Kuniyal, J. C. and Guleria, R. P.: The current state of aerosol-radiation interactions: A mini review, J. Aerosol Sci., 130, 45–54, https://doi.org/10.1016/j.jaerosci.2018.12.010, 2019.
Kuo, C.-Y., Cheng, F.-C., Chang, S.-Y., Lin, C.-Y., Chou, C. C. K., Chou, C.-H., and Lin, Y.-R.: Analysis of the major factors affecting the visibility degradation in two stations, J. Air Waste Manage., 63, 433–441, https://doi.org/10.1080/10962247.2012.762813, 2013.
Ledoux, F., Kfoury, A., Delmaire, G., Roussel, G., El Zein, A., and Courcot, D.: Contributions of local and regional anthropogenic sources of metals in PM2.5 at an urban site in northern France, Chemosphere, 181, 713–724, https://doi.org/10.1016/j.chemosphere.2017.04.128, 2017.
Lewis, C. W., Norris, G. A., Conner, T. L., and Henry, R. C.: Source apportionment of Phoenix PM2.5 aerosol with the Unmix receptor model, J. Air Waste Manage., 53, 325–338, https://doi.org/10.1080/10473289.2003.10466155, 2003.
Li, J., Du, H., Wang, Z., Sun, Y., Yang, W., He, J., Tang, X., and Fu, P.: Rapid formation of a severe regional winter haze episode over a mega-city cluster on the North China Plain, Environ. Pollut., 223, 605–615, https://doi.org/10.1016/j.envpol.2017.01.063, 2017.
Li, J., Gao, W., Cao, L., Xiao, Y., Zhang, Y., Zhao, S., Liu, Z., Liu, Z., Tang, G., Ji, D., Hu, B., Song, T., He, L., Hu, M., and Wang, Y.: Significant changes in autumn and winter aerosol composition and sources in Beijing from 2012 to 2018: Effects of clean air actions, Environ. Pollut., 268, 115855, https://doi.org/10.1016/j.envpol.2020.115855, 2021.
Li, K., Zhang, X., Zhao, B., Bloss, W. J., Lin, C., White, S., Yu, H., Chen, L., Geng, C., Yang, W., Azzi, M., George, C., and Bai, Z.: Suppression of anthropogenic secondary organic aerosol formation by isoprene, npj Clim. Atmos. Sci., 5, 12, https://doi.org/10.1038/s41612-022-00233-x, 2022.
Li, L., Tan, Q., Zhang, Y., Feng, M., Qu, Y., An, J., and Liu, X.: Characteristics and source apportionment of PM2.5 during persistent extreme haze events in Chengdu, southwest China, Environ. Pollut., 230, 718–729, https://doi.org/10.1016/j.envpol.2017.07.029, 2017.
Li, W., Shao, L. yi, Wang, W., Li, H., Wang, X., Li, Y., Li, W., Jones, T., and Zhang, D.: Air quality improvement in response to intensified control strategies in Beijing during 2013–2019, Sci. Total Environ., 744, 140776, https://doi.org/10.1016/j.scitotenv.2020.140776, 2020.
Li, X., Bei, N., Tie, X., Wu, J., Liu, S., Wang, Q., Liu, L., Wang, R., and Li, G.: Local and transboundary transport contributions to the wintertime particulate pollution in the Guanzhong Basin (GZB), China: A case study, Sci. Total Environ., 797, 148876, https://doi.org/10.1016/j.scitotenv.2021.148876, 2021.
Li, Y., Sun, Y., Zhang, Q., Li, X., Li, M., Zhou, Z., and Chan, C. K.: Real-time chemical characterization of atmospheric particulate matter in China: A review, Atmos. Environ., 158, 270–304, https://doi.org/10.1016/j.atmosenv.2017.02.027, 2017.
Liu, B., Cheng, Y., Zhou, M., Liang, D., Dai, Q., Wang, L., Jin, W., Zhang, L., Ren, Y., Zhou, J., Dai, C., Xu, J., Wang, J., Feng, Y., and Zhang, Y.: Effectiveness evaluation of temporary emission control action in 2016 in winter in Shijiazhuang, China, Atmos. Chem. Phys., 18, 7019–7039, https://doi.org/10.5194/acp-18-7019-2018, 2018.
Liu, J., Chen, Y., Chao, S., Cao, H., Zhang, A., and Yang, Y.: Emission control priority of PM2.5-bound heavy metals in different seasons: A comprehensive analysis from health risk perspective, Sci. Total Environ., 644, 20–30, https://doi.org/10.1016/j.scitotenv.2018.06.226, 2018.
Liu, J., Chu, B., Jia, Y., Cao, Q., Zhang, H., Chen, T., Ma, Q., Ma, J., Wang, Y., Zhang, P., and He, H.: Dramatic decrease of secondary organic aerosol formation potential in Beijing: Important contribution from reduction of coal combustion emission, Sci. Total Environ., 832, 155045, https://doi.org/10.1016/j.scitotenv.2022.155045, 2022.
Liu, Y., Zheng, M., Yu, M., Cai, X., Du, H., Li, J., Zhou, T., Yan, C., Wang, X., Shi, Z., Harrison, R. M., Zhang, Q., and He, K.: High-time-resolution source apportionment of PM2.5 in Beijing with multiple models, Atmos. Chem. Phys., 19, 6595–6609, https://doi.org/10.5194/acp-19-6595-2019, 2019.
Liu, Z., Wang, Y., Hu, B., Ji, D., Zhang, J., Wu, F., Wan, X., and Wang, Y.: Source appointment of fine particle number and volume concentration during severe haze pollution in Beijing in January 2013, Environ. Sci. Pollut. R., 23, 6845–6860, https://doi.org/10.1007/s11356-015-5868-6, 2016.
Long, X., Li, N., Tie, X., Cao, J., Zhao, S., Huang, R., Zhao, M., Li, G., and Feng, T.: Urban dust in the Guanzhong Basin of China, part I: A regional distribution of dust sources retrieved using satellite data, Sci. Total Environ., 541, 1603–1613, https://doi.org/10.1016/j.scitotenv.2015.10.063, 2016.
Lu, J., Ge, P., and Zhao, Y.: Recent development of effect mechanism of alloying elements in titanium alloy design, Rare Metal Mat. Eng., 43, 775–779, https://doi.org/10.1016/S1875-5372(14)60082-5, 2014.
Lu, W., Tian, Q., Xu, R., Qiu, L., Fan, Z., Wang, S., Liu, T., Huang, J., Li, Y., Wang, Y., Shi, C., Liu, Y., and Zhou, Y.: Ambient air pollution and hospitalization for chronic obstructive pulmonary disease: Benefits from Three-Year Action Plan, Ecotox. Environ. Safe., 228, 113034, https://doi.org/10.1016/j.ecoenv.2021.113034, 2021.
Lv, B., Zhang, B., and Bai, Y.: A systematic analysis of PM2.5 in Beijing and its sources from 2000 to 2012, Atmos. Environ., 124, 98–108, https://doi.org/10.1016/j.atmosenv.2015.09.031, 2016.
Lv, L., Chen, Y., Han, Y., Cui, M., Wei, P., Zheng, M., and Hu, J.: High-time-resolution PM2.5 source apportionment based on multi-model with organic tracers in Beijing during haze episodes, Sci. Total Environ., 772, 144766, https://doi.org/10.1016/j.scitotenv.2020.144766, 2021.
Ma, Y., Huang, Y., Wu, J., E, J., Zhang, B., Han, D., and Ong, H. C.: A review of atmospheric fine particulate matters: chemical composition, source identification and their variations in Beijing, Energ. Source. Part A, 44, 4783–4807, https://doi.org/10.1080/15567036.2022.2075991, 2022.
Meng, H., Shen, Y., Fang, Y., and Zhu, Y.: Impact of the 'Coal-to-Natural Gas' Policy on Criteria Air Pollutants in Northern China, Atmosphere, 13, 945, https://doi.org/10.3390/atmos13060945, 2022.
Meng, J., Wang, G., Li, J., Cheng, C., Ren, Y., Huang, Y., Cheng, Y., Cao, J., and Zhang, T.: Seasonal characteristics of oxalic acid and related SOA in the free troposphere of Mt. Hua, central China: Implications for sources and formation mechanisms, Sci. Total Environ., 493, 1088–1097, https://doi.org/10.1016/j.scitotenv.2014.04.086, 2014.
Ng, N. L., Herndon, S. C., Trimborn, A., Canagaratna, M. R., Croteau, P. L., Onasch, T. B., Sueper, D., Worsnop, D. R., Zhang, Q., Sun, Y. L., and Jayne, J. T.: An Aerosol Chemical Speciation Monitor (ACSM) for Routine Monitoring of the Composition and Mass Concentrations of Ambient Aerosol, Aerosol Sci. Technol., 45, 780–794, https://doi.org/10.1080/02786826.2011.560211, 2011.
Ni, H., Tian, J., Wang, X., Wang, Q., Han, Y., Cao, J., Long, X., Chen, L.-W. A., Chow, J. C., Watson, J. G., Huang, R.-J., and Dusek, U.: PM2.5 emissions and source profiles from open burning of crop residues, Atmos. Environ., 169, 229–237, https://doi.org/10.1016/j.atmosenv.2017.08.063, 2017.
Ouyang, J., Song, L.-J., Ma, L.-L., Luo, M., Dai, X.-X., Zhang, J.-T., and Xu, D.-D.: Quantification of secondary particle loading during a heavy air pollution event in Beijing: A simplified method based on coal emission indicators, Atmos. Environ., 215, 116896, https://doi.org/10.1016/j.atmosenv.2019.116896, 2019.
Pant, P. and Harrison, R. M.: Estimation of the contribution of road traffic emissions to particulate matter concentrations from field measurements: A review, Atmos. Environ., 77, 78–97, https://doi.org/10.1016/j.atmosenv.2013.04.028, 2013.
Pang, N., Gao, J., Zhu, G., Hui, L., Zhao, P., Xu, Z., Tang, W., and Chai, F.: Impact of clean air action on the PM2.5 pollution in Beijing, China: Insights gained from two heating seasons measurements, Chemosphere, 263, 127991, https://doi.org/10.1016/j.chemosphere.2020.127991, 2021.
Pöschl, U.: Atmospheric Aerosols: Composition, Transformation, Climate and Health Effects, Angew. Chem. Int. Edit., 44, 7520–7540, https://doi.org/10.1002/anie.200501122, 2005.
Pui, D. Y. H., Chen, S.-C., and Zuo, Z.: PM2.5 in China: Measurements, sources, visibility and health effects, and mitigation, Particuology, 13, 1–26, https://doi.org/10.1016/j.partic.2013.11.001, 2014.
Rai, P., Furger, M., Slowik, J. G., Canonaco, F., Fröhlich, R., Hüglin, C., Minguillón, M. C., Petterson, K., Baltensperger, U., and Prévôt, A. S. H.: Source apportionment of highly time-resolved elements during a firework episode from a rural freeway site in Switzerland, Atmos. Chem. Phys., 20, 1657–1674, https://doi.org/10.5194/acp-20-1657-2020, 2020.
Ren, Y.: Chemical components and source identification of PM2.5 in non-heating season in Beijing: The influences of biomass burning and dust, Atmos. Res., 251, 105412, https://doi.org/10.1016/j.atmosres.2020.105412, 2021.
Shen, G.: Changes from traditional solid fuels to clean household energies – Opportunities in emission reduction of primary PM2.5 from residential cookstoves in China, Biomass Bioenerg., 86, 28–35, https://doi.org/10.1016/j.biombioe.2016.01.004, 2016.
Shen, W.-T., Yu, X., Zhong, S.-B., and Ge, H.-R.: Population Health Effects of Air Pollution: Fresh Evidence From China Health and Retirement Longitudinal Survey, Front. Public Health, 9, 779552, https://doi.org/10.3389/fpubh.2021.779552, 2021.
Shen, Z., Sun, J., Cao, J., Zhang, L., Zhang, Q., Lei, Y., Gao, J., Huang, R.-J., Liu, S., Huang, Y., Zhu, C., Xu, H., Zheng, C., Liu, P., and Xue, Z.: Chemical profiles of urban fugitive dust PM2.5 samples in Northern Chinese cities, Sci. Total Environ., 569–570, 619–626, https://doi.org/10.1016/j.scitotenv.2016.06.156, 2016.
Simka, H., Shankar, S., Duran, C., and Haverty, M.: Fundamentals of Cu/Barrier-Layer Adhesion in Microelectronic Processing, MRS Online Proceedings Library, 863, B9.2, https://doi.org/10.1557/PROC-863-B9.2, 2005.
Tao, J., Zhang, L., Cao, J., and Zhang, R.: A review of current knowledge concerning PM2.5 chemical composition, aerosol optical properties and their relationships across China, Atmos. Chem. Phys., 17, 9485–9518, https://doi.org/10.5194/acp-17-9485-2017, 2017.
Tao, J., Zhang, L., Zhang, Z., Huang, R., Wu, Y., Zhang, R., Cao, J., and Zhang, Y.: Control of PM2.5 in Guangzhou during the 16th Asian Games period: Implication for hazy weather prevention, Sci. Total Environ., 508, 57–66, https://doi.org/10.1016/j.scitotenv.2014.11.074, 2015.
Tao, Y., Ye, X., Ma, Z., Xie, Y., Wang, R., Chen, J., Yang, X., and Jiang, S.: Insights into different nitrate formation mechanisms from seasonal variations of secondary inorganic aerosols in Shanghai, Atmos. Environ., 145, 1–9, https://doi.org/10.1016/j.atmosenv.2016.09.012, 2016.
Thorpe, A. and Harrison, R. M.: Sources and properties of non-exhaust particulate matter from road traffic: A review, Sci. Total Environ., 400, 270–282, https://doi.org/10.1016/j.scitotenv.2008.06.007, 2008.
Tian, H. Z., Lu, L., Hao, J. M., Gao, J. J., Cheng, K., Liu, K. Y., Qiu, P. P., and Zhu, C. Y.: A Review of key hazardous trace elements in Chinese coals: Abundance, occurrence, behavior during coal combustion and their environmental impacts, Energ. Fuel., 27, 601–614, https://doi.org/10.1021/ef3017305, 2013.
Tian, J., Wang, Q., Zhang, Y., Yan, M., Liu, H., Zhang, N., Ran, W., and Cao, J.: Impacts of primary emissions and secondary aerosol formation on air pollution in an urban area of China during the COVID-19 lockdown, Environ. Int., 150, 106426, https://doi.org/10.1016/j.envint.2021.106426, 2021.
Tian, J., Wang, Q., Liu, H., Ma, Y., Liu, S., Zhang, Y., Ran, W., Han, Y., and Cao, J.: Measurement report: The importance of biomass burning in light extinction and direct radiative effect of urban aerosol during the COVID-19 lockdown in Xi'an, China, Atmos. Chem. Phys., 22, 8369–8384, https://doi.org/10.5194/acp-22-8369-2022, 2022.
Tian, Y. Z., Wang, J., Peng, X., Shi, G. L., and Feng, Y. C.: Estimation of the direct and indirect impacts of fireworks on the physicochemical characteristics of atmospheric PM10 and PM2.5, Atmos. Chem. Phys., 14, 9469–9479, https://doi.org/10.5194/acp-14-9469-2014, 2014.
Vu, T. V., Shi, Z., Cheng, J., Zhang, Q., He, K., Wang, S., and Harrison, R. M.: Assessing the impact of clean air action on air quality trends in Beijing using a machine learning technique, Atmos. Chem. Phys., 19, 11303–11314, https://doi.org/10.5194/acp-19-11303-2019, 2019.
Wang, F., Yu, H., Wang, Z., Liang, W., Shi, G., Gao, J., Li, M., and Feng, Y.: Review of online source apportionment research based on observation for ambient particulate matter, Sci. Total Environ., 762, 144095, https://doi.org/10.1016/j.scitotenv.2020.144095, 2021.
Wang, H. and Zhao, L.: A joint prevention and control mechanism for air pollution in the Beijing-Tianjin-Hebei region in china based on long-term and massive data mining of pollutant concentration, Atmos. Environ., 174, 25–42, https://doi.org/10.1016/j.atmosenv.2017.11.027, 2018.
Wang, J., Zhao, B., Wang, S., Yang, F., Xing, J., Morawska, L., Ding, A., Kulmala, M., Kerminen, V.-M., Kujansuu, J., Wang, Z., Ding, D., Zhang, X., Wang, H., Tian, M., Petäjä, T., Jiang, J., and Hao, J.: Particulate matter pollution over China and the effects of control policies, Sci. Total Environ., 584–585, 426–447, https://doi.org/10.1016/j.scitotenv.2017.01.027, 2017.
Wang, L., Wang, X., Gu, R., Wang, H., Yao, L., Wen, L., Zhu, F., Wang, W., Xue, L., Yang, L., Lu, K., Chen, J., Wang, T., Zhang, Y., and Wang, W.: Observations of fine particulate nitrated phenols in four sites in northern China: concentrations, source apportionment, and secondary formation, Atmos. Chem. Phys., 18, 4349–4359, https://doi.org/10.5194/acp-18-4349-2018, 2018.
Wang, L. T., Wei, Z., Yang, J., Zhang, Y., Zhang, F. F., Su, J., Meng, C. C., and Zhang, Q.: The 2013 severe haze over southern Hebei, China: model evaluation, source apportionment, and policy implications, Atmos. Chem. Phys., 14, 3151–3173, https://doi.org/10.5194/acp-14-3151-2014, 2014.
Wang, M., Tian, P., Wang, L., Yu, Z., Du, T., Chen, Q., Guan, X., Guo, Y., Zhang, M., Tang, C., Chang, Y., Shi, J., Liang, J., Cao, X., and Zhang, L.: High contribution of vehicle emissions to fine particulate pollutions in Lanzhou, Northwest China based on high-resolution online data source appointment, Sci. Total Environ., 798, 149310, https://doi.org/10.1016/j.scitotenv.2021.149310, 2021.
Wang, P., Cao, J., Shen, Z., Han, Y., Lee, S., Huang, Y., Zhu, C., Wang, Q., Xu, H., and Huang, R.: Spatial and seasonal variations of PM2.5 mass and species during 2010 in Xi'an, China, Sci. Total Environ., 508, 477–487, https://doi.org/10.1016/j.scitotenv.2014.11.007, 2015.
Wang, Q., Ye, J., Wang, Y., Zhang, T., Ran, W., Wu, Y., Tian, J., Li, L., Zhou, Y., Hang Ho, S. S., Dang, B., Zhang, Q., Zhang, R., Chen, Y., Zhu, C., and Cao, J.: Wintertime Optical Properties of Primary and Secondary Brown Carbon at a Regional Site in the North China Plain, Environ. Sci. Technol., 53, 12389–12397, https://doi.org/10.1021/acs.est.9b03406, 2019.
Wang, Y., Wang, Q., Ye, J., Yan, M., Qin, Q., Prévôt, A. S. H., and Cao, J.: A Review of Aerosol Chemical Composition and Sources in Representative Regions of China during Wintertime, Atmosphere, 10, 277, https://doi.org/10.3390/atmos10050277, 2019.
Wang, Y., Zhang, Q. Q., He, K., Zhang, Q., and Chai, L.: Sulfate-nitrate-ammonium aerosols over China: response to 2000–2015 emission changes of sulfur dioxide, nitrogen oxides, and ammonia, Atmos. Chem. Phys., 13, 2635–2652, https://doi.org/10.5194/acp-13-2635-2013, 2013.
Wang, Y., Yuan, Y., Wang, Q., Liu, C., Zhi, Q., and Cao, J.: Changes in air quality related to the control of coronavirus in China: Implications for traffic and industrial emissions, Sci. Total Environ., 731, 139133, https://doi.org/10.1016/j.scitotenv.2020.139133, 2020a.
Wang, Y., Yu, M., Wang, Y., Tang, G., Song, T., Zhou, P., Liu, Z., Hu, B., Ji, D., Wang, L., Zhu, X., Yan, C., Ehn, M., Gao, W., Pan, Y., Xin, J., Sun, Y., Kerminen, V.-M., Kulmala, M., and Petäjä, T.: Rapid formation of intense haze episodes via aerosol–boundary layer feedback in Beijing, Atmos. Chem. Phys., 20, 45–53, https://doi.org/10.5194/acp-20-45-2020, 2020b.
Wang, Y., Liu, C., Wang, Q., Qin, Q., Ren, H., and Cao, J.: Impacts of natural and socioeconomic factors on PM2.5 from 2014 to 2017, J. Environ. Manage., 284, 112071, https://doi.org/10.1016/j.jenvman.2021.112071, 2021.
Wang, Z., Wang, R., Wang, J., Wang, Y., McPherson Donahue, N., Tang, R., Dong, Z., Li, X., Wang, L., Han, Y., and Cao, J.: The seasonal variation, characteristics and secondary generation of PM2.5 in Xi'an, China, especially during pollution events, Environ. Res., 212, 113388, https://doi.org/10.1016/j.envres.2022.113388, 2022.
Wei, F., Yang G., Jiang, D., Liu, Z., and Sun, B.: Basic statistics and characteristics of background values of soil elements in China, Environmental Monitoring In China, 7, 1–6, https://doi.org/10.19316/j.issn.1002-6002.1991.01.001, 1991 (in Chinese).
Wood, E. C., Canagaratna, M. R., Herndon, S. C., Onasch, T. B., Kolb, C. E., Worsnop, D. R., Kroll, J. H., Knighton, W. B., Seila, R., Zavala, M., Molina, L. T., DeCarlo, P. F., Jimenez, J. L., Weinheimer, A. J., Knapp, D. J., Jobson, B. T., Stutz, J., Kuster, W. C., and Williams, E. J.: Investigation of the correlation between odd oxygen and secondary organic aerosol in Mexico City and Houston, Atmos. Chem. Phys., 10, 8947–8968, https://doi.org/10.5194/acp-10-8947-2010, 2010.
Xu, H. M., Cao, J. J., Ho, K. F., Ding, H., Han, Y. M., Wang, G. H., Chow, J. C., Watson, J. G., Khol, S. D., Qiang, J., and Li, W. T.: Lead concentrations in fine particulate matter after the phasing out of leaded gasoline in Xi'an, China, Atmos. Environ., 46, 217–224, https://doi.org/10.1016/j.atmosenv.2011.09.078, 2012.
Xu, J., Liu, D., Wu, X., Vu, T. V., Zhang, Y., Fu, P., Sun, Y., Xu, W., Zheng, B., Harrison, R. M., and Shi, Z.: Source apportionment of fine organic carbon at an urban site of Beijing using a chemical mass balance model, Atmos. Chem. Phys., 21, 7321–7341, https://doi.org/10.5194/acp-21-7321-2021, 2021.
Xu, P., Yang, Y., Zhang, J., Gao, W., Liu, Z., Hu, B., and Wang, Y.: Characterization and source identification of submicron aerosol during serious haze pollution periods in Beijing, J. Environ. Sci., 112, 25–37, https://doi.org/10.1016/j.jes.2021.04.005, 2022.
Xu, W., Croteau, P., Williams, L., Canagaratna, M., Onasch, T., Cross, E., Zhang, X., Robinson, W., Worsnop, D., and Jayne, J.: Laboratory characterization of an aerosol chemical speciation monitor with PM2.5 measurement capability, Aerosol Sci. Technol., 51, 69–83, https://doi.org/10.1080/02786826.2016.1241859, 2017.
Xue, J., Griffith, S. M., Yu, X., Lau, A. K. H., and Yu, J. Z.: Effect of nitrate and sulfate relative abundance in PM2.5 on liquid water content explored through half-hourly observations of inorganic soluble aerosols at a polluted receptor site, Atmos. Environ., 99, 24–31, https://doi.org/10.1016/j.atmosenv.2014.09.049, 2014.
Yan, Y., Sun, Y. B., Weiss, D., Liang, L. J., and Chen, H. Y.: Polluted dust derived from long-range transport as a major end member of urban aerosols and its implication of non-point pollution in northern China, Sci. Total Environ., 506–507, 538–545, https://doi.org/10.1016/j.scitotenv.2014.11.071, 2015.
Yang, D., Li, Z., Yue, Z., Liu, J. X., Zhai, Z., Li, Z., Gao, M., Hu, A. L., Zhu, W. J., Ding, N., Li, Z., Guo, S., Wang, X., Wang, L., and Wei, J.: Variations in sources, composition, and exposure risks of PM2.5 in both pre-heating and heating seasons, Aerosol Air Qual. Res., 22, 14, https://doi.org/10.4209/aaqr.210333, 2022.
Yang, S., Yuan, B., Peng, Y., Huang, S., Chen, W., Hu, W., Pei, C., Zhou, J., Parrish, D. D., Wang, W., He, X., Cheng, C., Li, X.-B., Yang, X., Song, Y., Wang, H., Qi, J., Wang, B., Wang, C., Wang, C., Wang, Z., Li, T., Zheng, E., Wang, S., Wu, C., Cai, M., Ye, C., Song, W., Cheng, P., Chen, D., Wang, X., Zhang, Z., Wang, X., Zheng, J., and Shao, M.: The formation and mitigation of nitrate pollution: comparison between urban and suburban environments, Atmos. Chem. Phys., 22, 4539–4556, https://doi.org/10.5194/acp-22-4539-2022, 2022.
Yang, X. and Teng, F.: The air quality co-benefit of coal control strategy in China, Resour. Conserv. Recy., 129, 373–382, https://doi.org/10.1016/j.resconrec.2016.08.011, 2018.
Yang, X., Zheng, M., Liu, Y., Yan, C., Liu, J., Liu, J., and Cheng, Y.: Exploring sources and health risks of metals in Beijing PM2.5: Insights from long-term online measurements, Sci. Total Environ., 814, 151954, https://doi.org/10.1016/j.scitotenv.2021.151954, 2022.
Zeng, J. and He, Q.: Does industrial air pollution drive health care expenditures? Spatial evidence from China, J. Clean. Prod., 218, 400–408, https://doi.org/10.1016/j.jclepro.2019.01.288, 2019.
Zhang, R., Jing, J., Tao, J., Hsu, S.-C., Wang, G., Cao, J., Lee, C. S. L., Zhu, L., Chen, Z., Zhao, Y., and Shen, Z.: Chemical characterization and source apportionment of PM2.5 in Beijing: seasonal perspective, Atmos. Chem. Phys., 13, 7053–7074, https://doi.org/10.5194/acp-13-7053-2013, 2013.
Zhang, Q., Zheng, Y., Tong, D., Shao, M., Wang, S., Zhang, Y., Xu, X., Wang, J., He, H., Liu, W., Ding, Y., Lei, Y., Li, J., Wang, Z., Zhang, X., Wang, Y., Cheng, J., Liu, Y., Shi, Q., Yan, L., Geng, G., Hong, C., Li, M., Liu, F., Zheng, B., Cao, J., Ding, A., Gao, J., Fu, Q., Huo, J., Liu, B., Liu, Z., Yang, F., He, K., and Hao, J.: Drivers of improved PM2.5 air quality in China from 2013 to 2017, P. Natl. Acad. Sci. USA, 116, 24463–24469, https://doi.org/10.1073/pnas.1907956116, 2019.
Zhang, Y., Vu, T. V., Sun, J., He, J., Shen, X., Lin, W., Zhang, X., Zhong, J., Gao, W., Wang, Y., Fu, T. M., Ma, Y., Li, W., and Shi, Z.: Significant changes in chemistry of fine particles in wintertime Beijing from 2007 to 2017: Impact of Clean Air Actions, Environ. Sci. Technol., 54, 1344–1352, https://doi.org/10.1021/acs.est.9b04678, 2020.
Zhang, Y., Tian, J., Qi, L., Manousakas, L. M., Han, Y., Ran, W., Sun, Y., Liu, H., Zhang, R., Wu, Y., Cui, T., Dällenbach, R. K., Slowik, G. J., Prévôt, S. H. A., and Cao, J.: High-time-resolution chemical composition and source apportionment of PM2.5 in northern Chinese cities: implications for policy, Zenodo [data set], https://doi.org/10.5281/zenodo.8106655, 2023.
Zhang, Z., Gao, J., Zhang, L., Wang, H., Tao, J., Qiu, X., Chai, F., Li, Y., and Wang, S.: Observations of biomass burning tracers in PM2.5 at two megacities in North China during 2014 APEC summit, Atmos. Environ., 169, 54–64, https://doi.org/10.1016/j.atmosenv.2017.09.011, 2017.
Zhao, P., Feng, Y., Zhu, T., and Wu, J.: Characterizations of resuspended dust in six cities of North China, Atmos. Environ., 40, 5807–5814, https://doi.org/10.1016/j.atmosenv.2006.05.026, 2006.
Zhao, S., Tian, H., Luo, L., Liu, H., Wu, B., Liu, S., Bai, X., Liu, W., Liu, X., Wu, Y., Lin, S., Guo, Z., Lv, Y., and Xue, Y.: Temporal variation characteristics and source apportionment of metal elements in PM2.5 in urban Beijing during 2018–2019, Environ. Pollut., 268, 115856, https://doi.org/10.1016/j.envpol.2020.115856, 2021.
Zheng, G., Duan, F., Ma, Y., Zhang, Q., Huang, T., Kimoto, T., Cheng, Y., Su, H., and He, K.: Episode-Based Evolution Pattern Analysis of Haze Pollution: Method Development and Results from Beijing, China, Environ. Sci. Technol., 50, 4632–4641, https://doi.org/10.1021/acs.est.5b05593, 2016.
Zheng, M., Wang, Y., Yuan, L., Chen, N., and Kong, S.: Ambient observations indicating an increasing effectiveness of ammonia control in wintertime PM2.5 reduction in Central China, Sci. Total Environ., 824, 153708, https://doi.org/10.1016/j.scitotenv.2022.153708, 2022.
Zhou, W., Lei, L., Du, A., Zhang, Z., Li, Y., Yang, Y., Tang, G., Chen, C., Xu, W., Sun, J., Li, Z., Fu, P., Wang, Z., and Sun, Y.: Unexpected increases of severe haze pollution during the post COVID-19 Period: Effects of emissions, meteorology, and secondary production, J. Geophys. Res.-Atmos., 127, e2021JD035710, https://doi.org/10.1029/2021JD035710, 2022.
Ziemann, P. J. and Atkinson, R.: Kinetics, products, and mechanisms of secondary organic aerosol formation, Chem. Soc. Rev., 41, 6582, https://doi.org/10.1039/c2cs35122f, 2012.