the Creative Commons Attribution 4.0 License.
the Creative Commons Attribution 4.0 License.
 | 24 Aug 2023
Effect of radiation interaction and aerosol processes on ventilation and aerosol concentrations in a real urban neighbourhood in Helsinki
Jani Strömberg
Xiaoyu Li
Mona Kurppa
Heino Kuuluvainen
Liisa Pirjola
Leena Järvi
Large-eddy simulation (LES) is an optimal tool to examine aerosol particle concentrations in detail within urban neighbourhoods. The concentrations are a complex result of local emissions, meteorology, aerosol processes and local mixing conditions due to thermal and mechanical effects. Despite this, most studies have focused on simplification of the affecting processes such as examining the impact of local mixing in idealised street canyons or treating aerosols as passive scalars. The aim of this study is to include all these processes into LES using the PALM model system and to examine the importance of radiative heating and aerosol processes in simulating local aerosol particle concentrations and different aerosol metrics within a realistic urban neighbourhood in Helsinki under morning rush hour with calm wind conditions. The model outputs are evaluated against mobile laboratory measurements of air temperature and total particle number concentration (Ntot) as well as drone measurements of lung-deposited surface area (LDSA).
The inclusion of radiation interaction in LES has a significant impact on simulated near-surface temperatures in our study domain, increasing them on average from 8.6 to 12.4 ∘C. The resulting enhanced ventilation reduces the pedestrian-level (4 m) Ntot by 53 %. The reduction in Ntot due to aerosol processes is smaller, only 18 %. Aerosol processes particularly impact the smallest particle range, whereas radiation interaction is more important in the larger particle range. The inclusion of radiation interaction reduces the bias between the modelled and mobile-laboratory-measured air temperatures from −3.9 to +0.2 ∘C and Ntot from +98 % to −13 %. With both aerosol and radiation interaction on, the underestimation is 16 %, which might be due to overestimation of the ventilation. The results show how inclusion of radiative interaction is particularly important in simulating PM2.5, whereas aerosol processes are more important in simulating LDSA in this calm wind situation.
- Article
(12092 KB) - Full-text XML
- BibTeX
- EndNote


Urban air pollution has been recognised as being one of the major global challenges, as it has been estimated to result annually in up to 0.8 million premature deaths in Europe (Lelieveld et al., 2019) and 3 million deaths worldwide (Lelieveld et al., 2015; WHO, 2016). The numbers are expected to increase further in the future as the proportion of the global population living in urban areas is projected to increase from the current 55 % (2018) to 68 % by 2050 (United Nations, 2019). Often the poorest air quality is observed at pedestrian level in street canyons due to the vicinity of road traffic and degraded ventilation (Kurppa et al., 2020). Ventilation of a street canyon or a wider urban area depends not only on building morphology but also on radiative processes, resulting in increased turbulent production and mixing of air when solar radiation is present (Tominaga and Stathopoulos, 2013; Nazarian and Kleissl, 2016; Park et al., 2017). Mechanically and thermally driven turbulence affect urban air pollutant concentrations, and thus understanding their behaviour in detail are vital for correct estimation of urban air quality and aerosol particle concentrations.
Turbulence and street canyon flows have been researched intensively in recent years through computational fluid dynamics (CFD) modelling (e.g. Letzel et al., 2012; Park and Baik, 2013; Kwak et al., 2015; Kurppa et al., 2020). From the two main modelling methods, Reynolds-averaged Navier–Stokes (RANS) and large-eddy simulation (LES), LES has been found to perform better in resolving instantaneous turbulence in realistic complex urban settings (Salim et al., 2011; García-Sánchez et al., 2018). In LES the subgrid-scale turbulence is parameterised, but otherwise the three-dimensional wind field and scalar variables describing boundary-layer flows are solved with high spatial and temporal resolution (Maronga et al., 2020). LES has been used to examine the impact of thermal effects on urban ventilation but mainly in idealised street canyons. Nazarian and Kleissl (2016) examined an idealised 3×3 building array, where the differential heating was parameterised with a new dimensionless universal Richardson number, and found that the roof and ground heating alter the formed canyon vortices' location and strength. Nazarian et al. (2018) had a similar simulation setup and results about the changes to street vortices' structures as Nazarian and Kleissl (2016) but additionally concluded that the spatial pollutant field is not as strongly affected by the heating distribution as it is by the vertical removal of pollutants from the street canyons. Most simulations in realistic urban settings have not yet included the effect of solar-radiation-induced thermal turbulence on street canyon flow patterns and ventilation and furthermore on pollutant concentrations, mainly due to the computational cost of LES (e.g. Salim et al., 2011; Kurppa et al., 2020; Karttunen et al., 2020). Park and Baik (2013) had a simplified radiation scheme to study turbulent coherent structures between no-heating and bottom heating cases. Implementing a radiation scheme to an LES model offers a way to model the complex radiative transfer processes in urban areas in detail, such as multiple reflections, diffuse radiation and the effect of shading, and further the resulting thermal effects on flow structures (Resler et al., 2017).
Furthermore, for realistic simulation of air pollutants and particularly aerosol particle concentrations, aerosol particle dynamics accounting for their chemical and physical processes need to be considered (Kurppa et al., 2019, 2020). Traditionally, pollutants and aerosol particles have been treated as passive scalars in CFD (Branford et al., 2011; Gousseau et al., 2011; Cai, 2012; Tominaga and Stathopoulos, 2013), and only a few LES models allow for a detailed description of aerosol particles, their size distributions and their dynamic processes. Steffens et al. (2013) included a CFD-based Comprehensive Turbulent Aerosol Dynamics and Gas Chemistry model (CTAG) in their simulations. Kurppa et al. (2019) implemented the sectional aerosol module SALSA into PALM. Zhong et al. (2020) on the other hand used WRF-LES to model the behaviour of ultrafine particles (UFPs) on a neighbourhood scale.
The main aims of this study are to conduct a novel LES, including both aerosol processes and mixing conditions within a real urban neighbourhood, and to examine the impact of radiative effects and aerosol dynamics on different aerosol particle metrics in a built-up neighbourhood in Helsinki under calm wind conditions during morning rush hour. The relative importance of including radiative effects and aerosol processes in simulating aerosol particle concentrations and distributions describing different aerosol metrics will be examined. The examination is made as simplification in LES can save computational resources, and for this reason it is important to understand the relative importance of different processes. The LES model PALM (Maronga et al., 2020) will be used in the simulations, as it allows for a realistic description of the urban surface and aerosol dynamics, and it can be coupled with the radiation scheme rapid radiative transfer model for global models (RRTMG; Krč et al., 2021), which uses a radiative transfer model (RTM) to model the radiation interaction within the urban canopy layer. Helsinki was chosen due to the intensive observational air-quality campaign made within the study area, allowing extensive model evaluation. Model outputs will be compared against the lung-deposited surface area (LDSA) of aerosol particles measured using a drone as well as total particle number concentration and air temperature measured using a mobile laboratory (Järvi et al., 2023).
2.1 PALM
PALM is an LES model used to study atmospheric and oceanic boundary-layer dynamics (Maronga et al., 2020). PALM solves the non-hydrostatic, filtered and incompressible Navier–Stokes equations of wind (u, v and w) and scalar variables, including turbulent kinetic energy, potential temperature and specific humidity, in a Boussinesq-approximated form. As the model is well-scalable on massively parallel computer architectures, it is particularly well-suited for urban simulations on domains up to a city scale with a fine grid resolution. PALM also has a self-nesting capability, allowing a fine grid resolution within the main domain of interest (i.e. child domain), and coarser resolution in parent and root domains, allowing a large total modelling domain (Hellsten et al., 2021). Moreover, PALM has multiple features which enhance its usability to examine urban turbulence. First of all, it utilises surface models such as the land surface model (LSM) and the urban surface model (USM), solving the energy balance for each surface (Resler et al., 2017; Gehrke et al., 2021). LSM requires the use of a radiation scheme, which is provided by the external RRTMG library embedded in PALM and is enabled in these simulations (Krč et al., 2021). Secondly, PALM has a plant canopy model (PCM) which is used to model the interaction between vegetation and flow (Karttunen et al., 2020). Finally, the Sectional Aerosol module for Large-Scale Applications (SALSA) is used to solve the aerosol processes responsible for modifying the size distribution and pollutant interaction with the surface in PALM (Kurppa et al., 2019, 2020). The most important modules for this study are RRTMG and SALSA.
2.1.1 RRTMG
The rapid radiative transfer model for global models (RRTMG) is an external library, which can be used with PALM to provide the variables responsible for describing the radiative interaction between the surface and the atmosphere. RRTMG is used as a single-column model in PALM, whereas a separate multi-reflection radiation transfer model (RTM) is used within the urban canopy layer (Resler et al., 2017). RRTMG feeds the RTM, which is used by the surface models USM and LSM, with the necessary components such as the time of day and coordinates to solve the energy balance over all surfaces (Resler et al., 2017; Salim et al., 2022; Gehrke et al., 2021). RTM is capable of calculating multiple reflections, diffuse radiation and absorbed radiation on different surfaces (Krč et al., 2021). RTM handles plant canopies as fully transparent in the long-wave radiation range, and therefore shading is only modelled for the shortwave range in these cases (Resler et al., 2017). Sky-view factors are calculated at each radiation time step and on both vertical and horizontal grid points, which describe the amount of sky visible from a given surface as a fractional number between 0–1 (Salim et al., 2022; Krč et al., 2021).
2.1.2 SALSA
The sectional aerosol module SALSA (Kokkola et al., 2008), which is embedded in the PALM model system (Kurppa et al., 2019), is employed to describe the aerosol population by discretising the aerosol number size distribution into several size bins based on the geometric mean dry particle diameter. Each bin can be composed of different chemical components including sulfate, organic carbon, black carbon, nitrate, ammonium, sea salt, mineral dust and water. The hybrid bin method is used for the update of aerosol size distribution in both subranges (Kokkola et al., 2018). SALSA is designed to resolve aerosol microphysical processes in a very large number of grid points, comprising of nucleation, coagulation, condensation and dissolution, as well as dry deposition on horizontal and vertical surfaces and resolved-scale vegetation. The implementation of SALSA is flexible so that the user can decide the number of size bins, diameter range of aerosols, specific chemical components and involved aerosol dynamic processes.
2.2 Model setup
Our study area is a 42 m wide street canyon (average height to width ) and its immediate surroundings in Helsinki, Finland (Fig. 1), on an early summer morning on 9 June 2017. The street canyon has pavement and three lanes for both directions with the outermost lanes next to the pavement reserved for public transport. In the middle there are two tram lines with street tree rows separating them from the lanes. An urban air-quality monitoring supersite operated by the Helsinki Region Environmental Services Authority is located on the southern side of the street canyon. The simulation setup consists of a root (768×768 cells), parent (768×768 cells) and child (576×576 cells) domain, each with an increase in horizontal resolution by a factor of 3 when moving from the root (9 m) to the smaller domains (3 m in parent and 1 m in child). The surface energy balance and flow are solved in each domain, whereas SALSA is only enabled in the child domain. Dynamic boundary conditions are supplied by numerical weather prediction data from the MetCoOp Ensemble Prediction System (MEPS; Bengtsson et al., 2017; Müller et al., 2017), which provides the necessary forcing for initialising the large-scale motions in the atmosphere. The trajectory model for Aerosol Dynamics, gas and particle phase CHEMistry (ADCHEM; Roldin et al., 2011b) provides the background trace gas concentrations, particle number concentrations and chemical composition of aerosol particles for SALSA. Emissions from road traffic within the child domain are estimated by combining information on hourly vehicle fleet composition, as well as particle number and gaseous unit emissions factors. In this study, we only considered exhausted traffic emissions and did not involve emissions from vegetation. In SALSA the aerosol particle size distribution is described by 10 bins ranging from 2.5 nm to 1 µm, and the particles contain sulfate, organic carbon, black carbon, nitrate and ammonium. The aerosol processes of condensation, coagulation and dry deposition are included and calculated per second. More information on the model setup can be found from Kurppa et al. (2020).
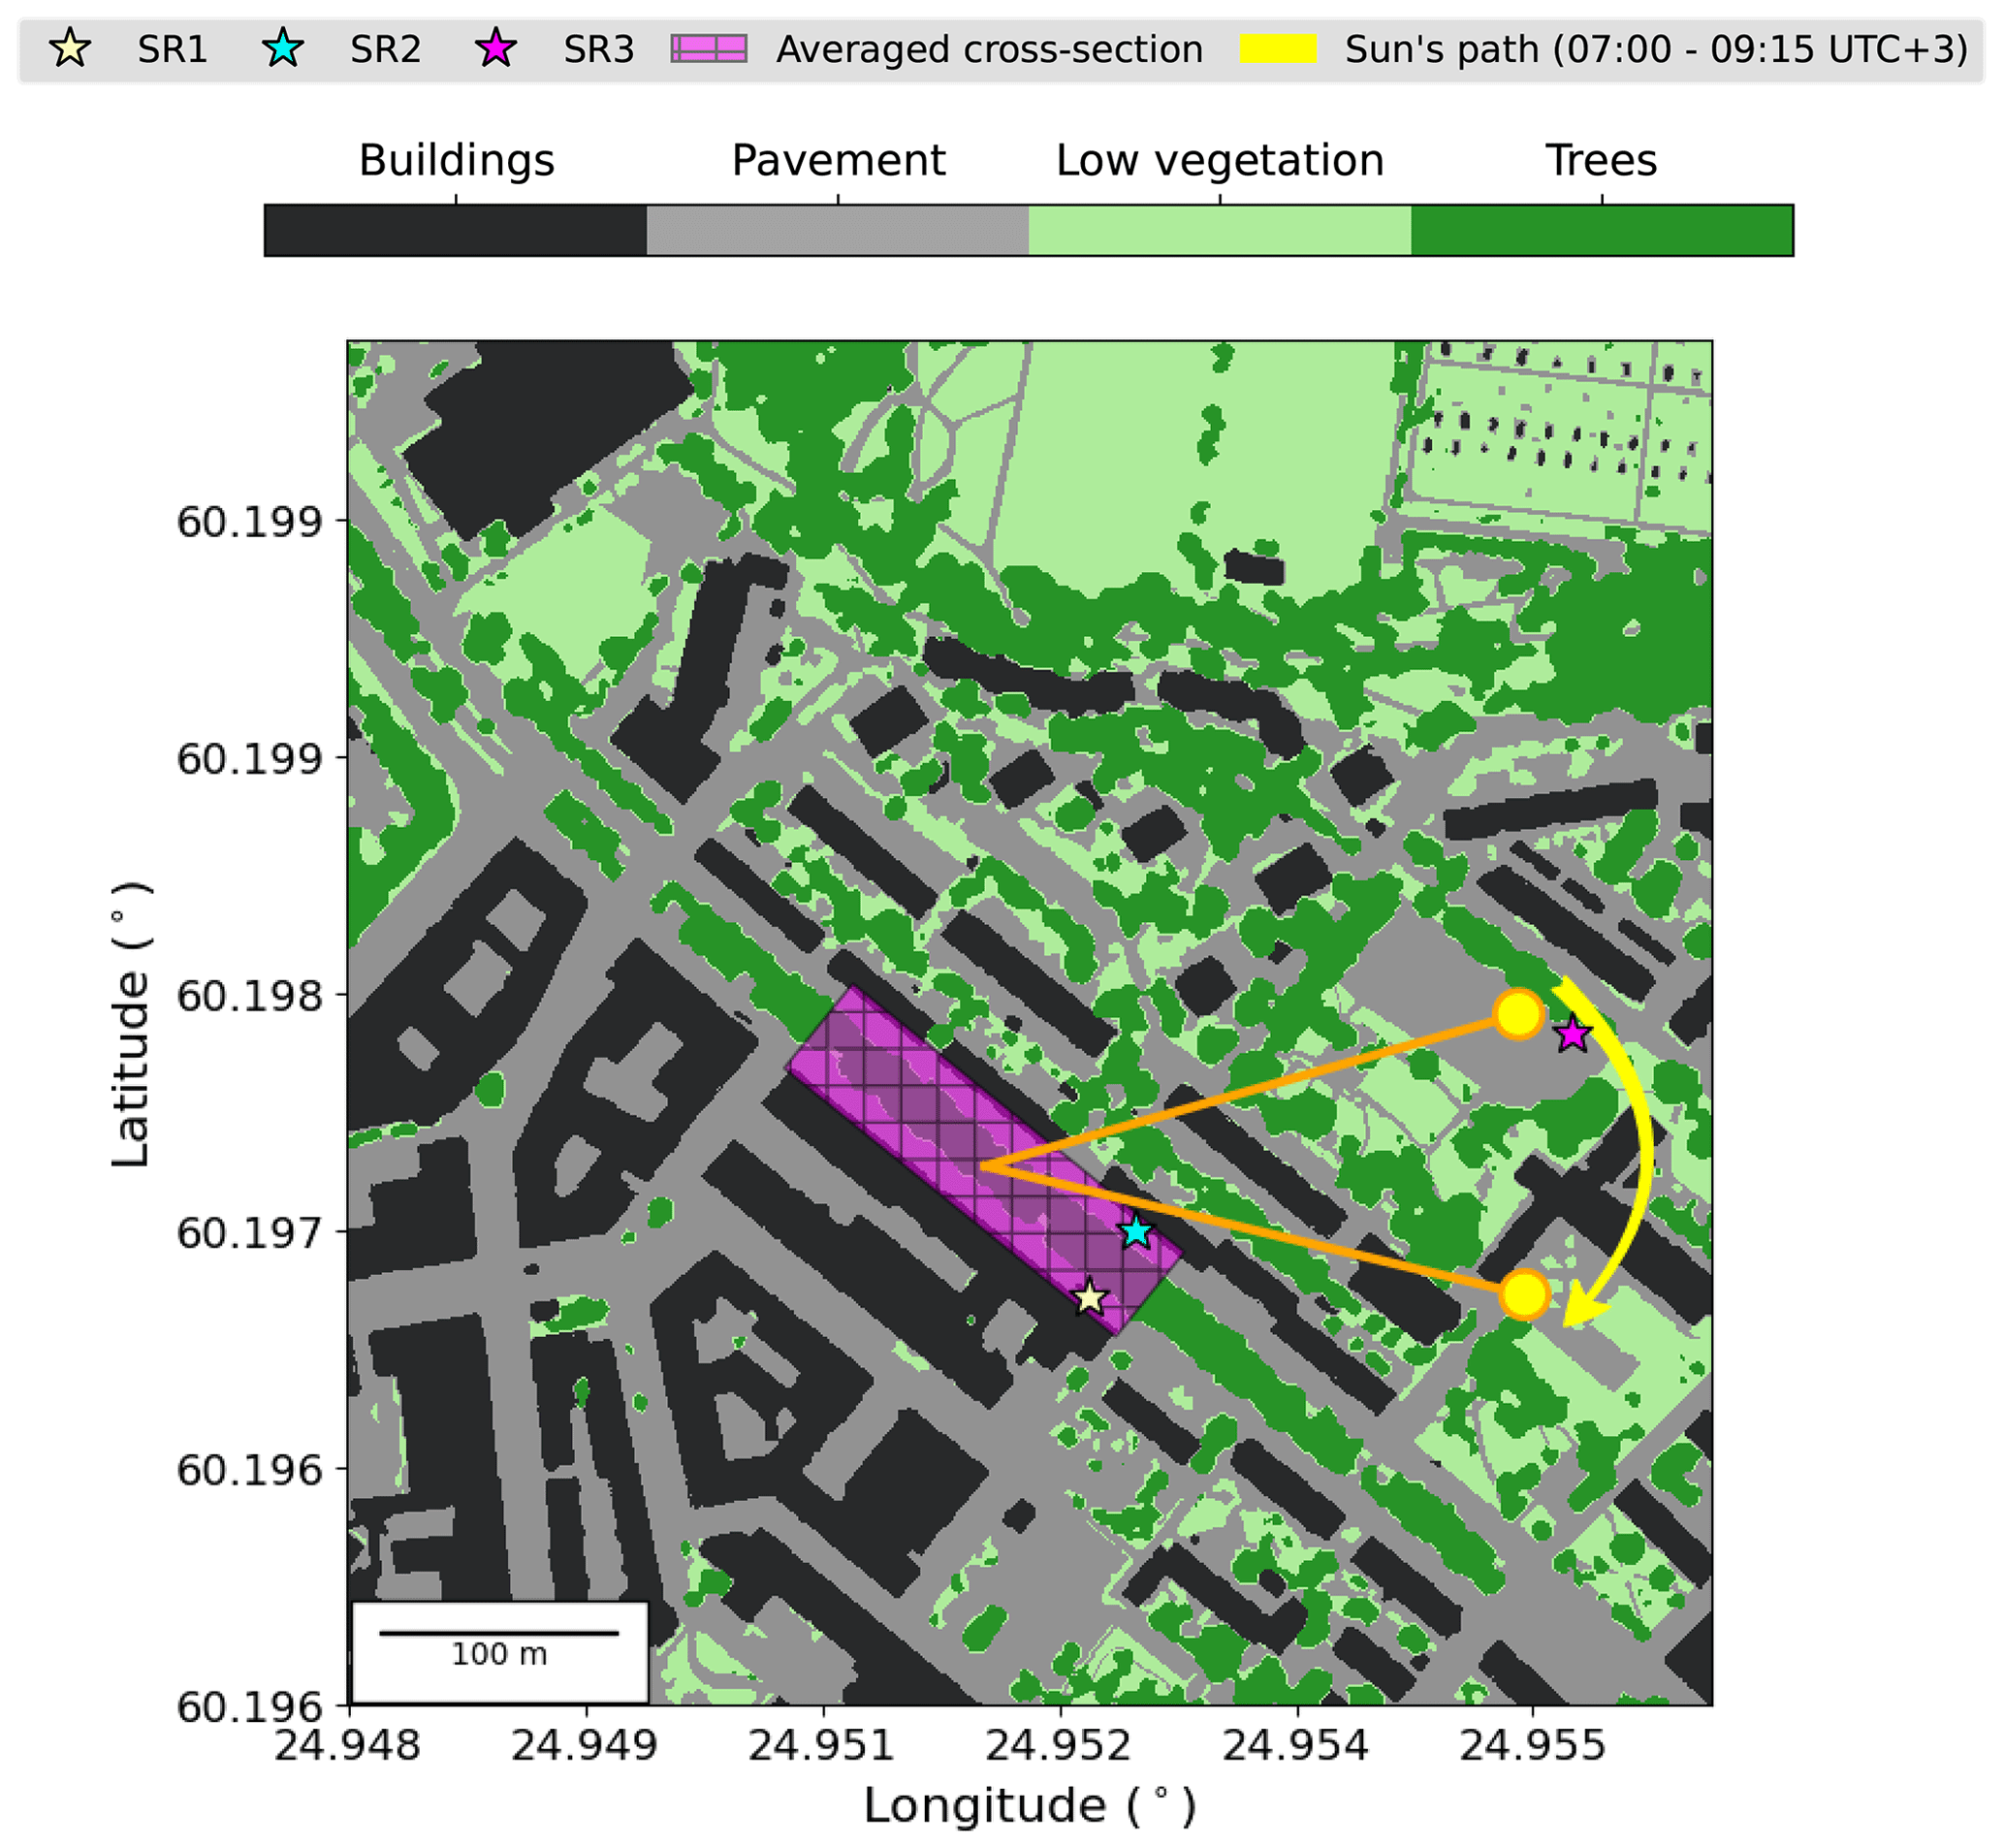
Figure 1Child domain of the model setup, including the location of three statistical regions (SRs), the area used to calculate the street canyon cross-section and the sun's path during the main run.
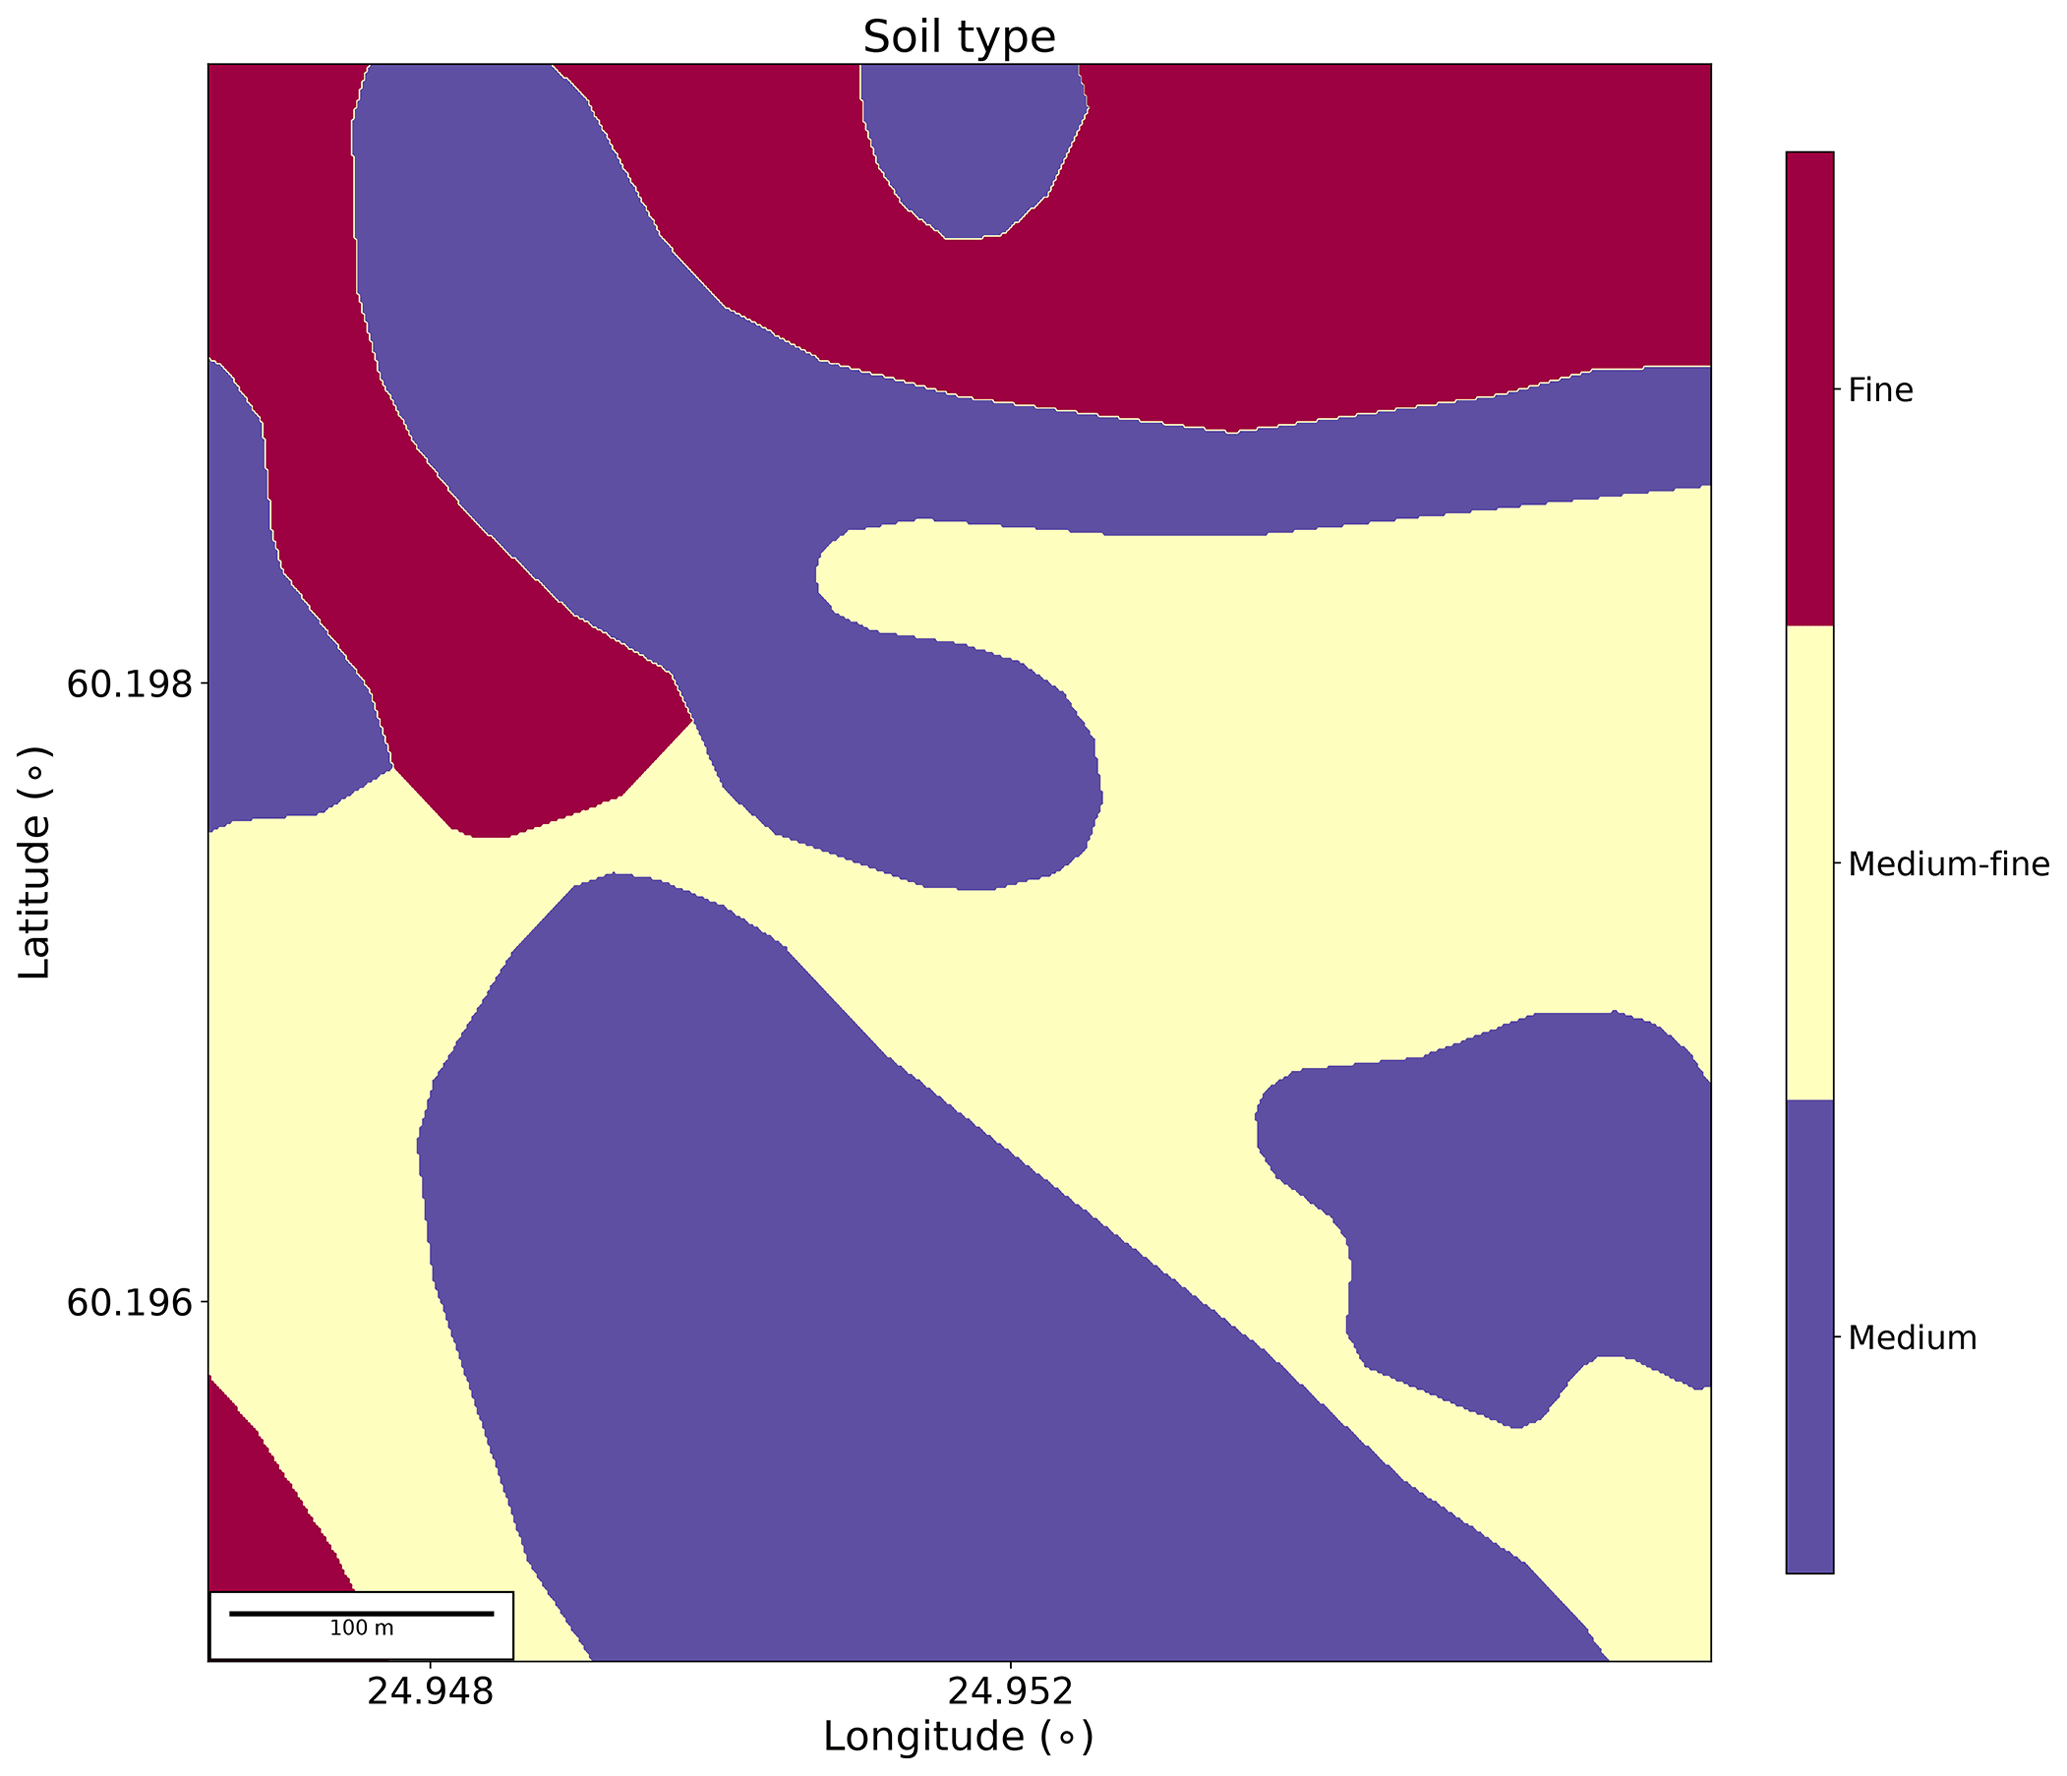
RRTMG uses information about the usage and built time period of buildings (Appendix Fig. A1), pavement materials (Fig. A3), and vegetation types (Fig. A2) to model the thermal and radiative properties of each surface. Building usage for our study area and the time period they were built were obtained from the city of Helsinki open database (HRI, 2018; see Supplement). Soil information (Fig. A4) needed by the LSM was retrieved from the National Land Survey of Finland (GTK, 2018).
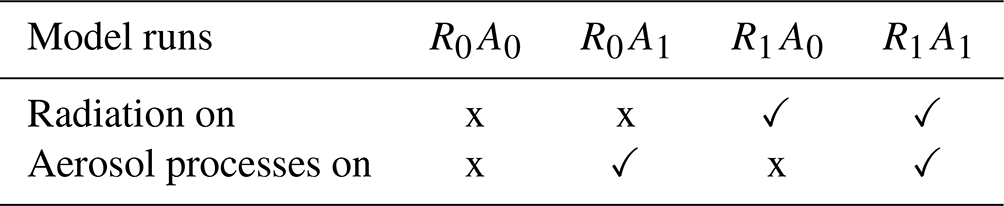
2.3 Model runs
In order to understand the effect of radiation (R) and aerosol processes (A) on aerosol particle distributions both together and separately, four model runs are performed. R0A0 is the base run, with both aerosol processes and radiation turned off. This run purely solves the flow and aerosol dispersion as passive scalars, and the spatial distribution of particles and ventilation is only affected by the mechanical processes. R0A1 increases the level of complexity by including the aerosol processes (condensation, coagulation and deposition), while leaving the radiation out. R1A0 on the other hand has radiation turned on but only simulates the transport of the aerosols, without any aerosol processes affecting their size distribution. R1A1 combines the two processes together and simulates both radiation and aerosol processes, being the most complex in terms of the number of processes affecting the simulation. R0A1 is the same model setup as in Kurppa et al. (2020). In terms of atmospheric stability, R0A0 and R0A1 describe purely neutral cases, whereas R1A0 and R1A1 are unstable. The neutral simulations do not have a USM and LSM, since they require a radiation scheme. This means that the temperatures are directly provided by MEPS dynamic input in the neutral cases. The PALM revision used is r4734.
Table 1Summary of the model runs discussed in this study. R (radiation) and A (aerosol processes) describe the changing conditions between the runs, and the subscript under them indicates if that part of the simulation is turned on (1) or off (0).
2.4 Initialisation
The simulation time of the model runs is separated into three parts: spin-up, precursor and main run (Fig. 2). The main run of all modelled processes including SALSA covers the time period 07:00–09:15 UTC+3, which was chosen as observations from an intensive observational campaign of local air quality are available for model evaluation (Järvi et al., 2023). Before the main run, a precursor run to initialise flow and turbulence (06:00–07:00 UTC+3) is performed (Kurppa et al., 2020). From the restart data provided by the precursor run, PALM is able to start the main run to get the final output data. In addition, the runs with radiation enabled require an additional spin-up run of 24 h (full diurnal cycle of solar radiation) for realistic development of surface temperatures to accurately model the heat exchanges with the atmosphere (Resler et al., 2017; Krč et al., 2021). For the spin-up run (8 June 06:00 – 9 June 06:00 UTC+3), PALM needs the mean and variation amplitude of the potential temperature, which were calculated to be 12 and 3 ∘C using the Finnish Meteorological Institute (FMI, 2017) weather station data and taking the 24 h mean temperature and difference between minimum and maximum temperatures during the precursor period. The precursor run period is cloudy, with little diurnal variation in air temperature (Fig. 2). The morning at the time of the main run is less cloudy, and solar radiation is already at the same level at 08:00 UTC+3 as the maximum of the previous day. Wind is from the west, and during the main run, the wind turns from 273 to 305∘, and the wind speed increases due to the rising sun.
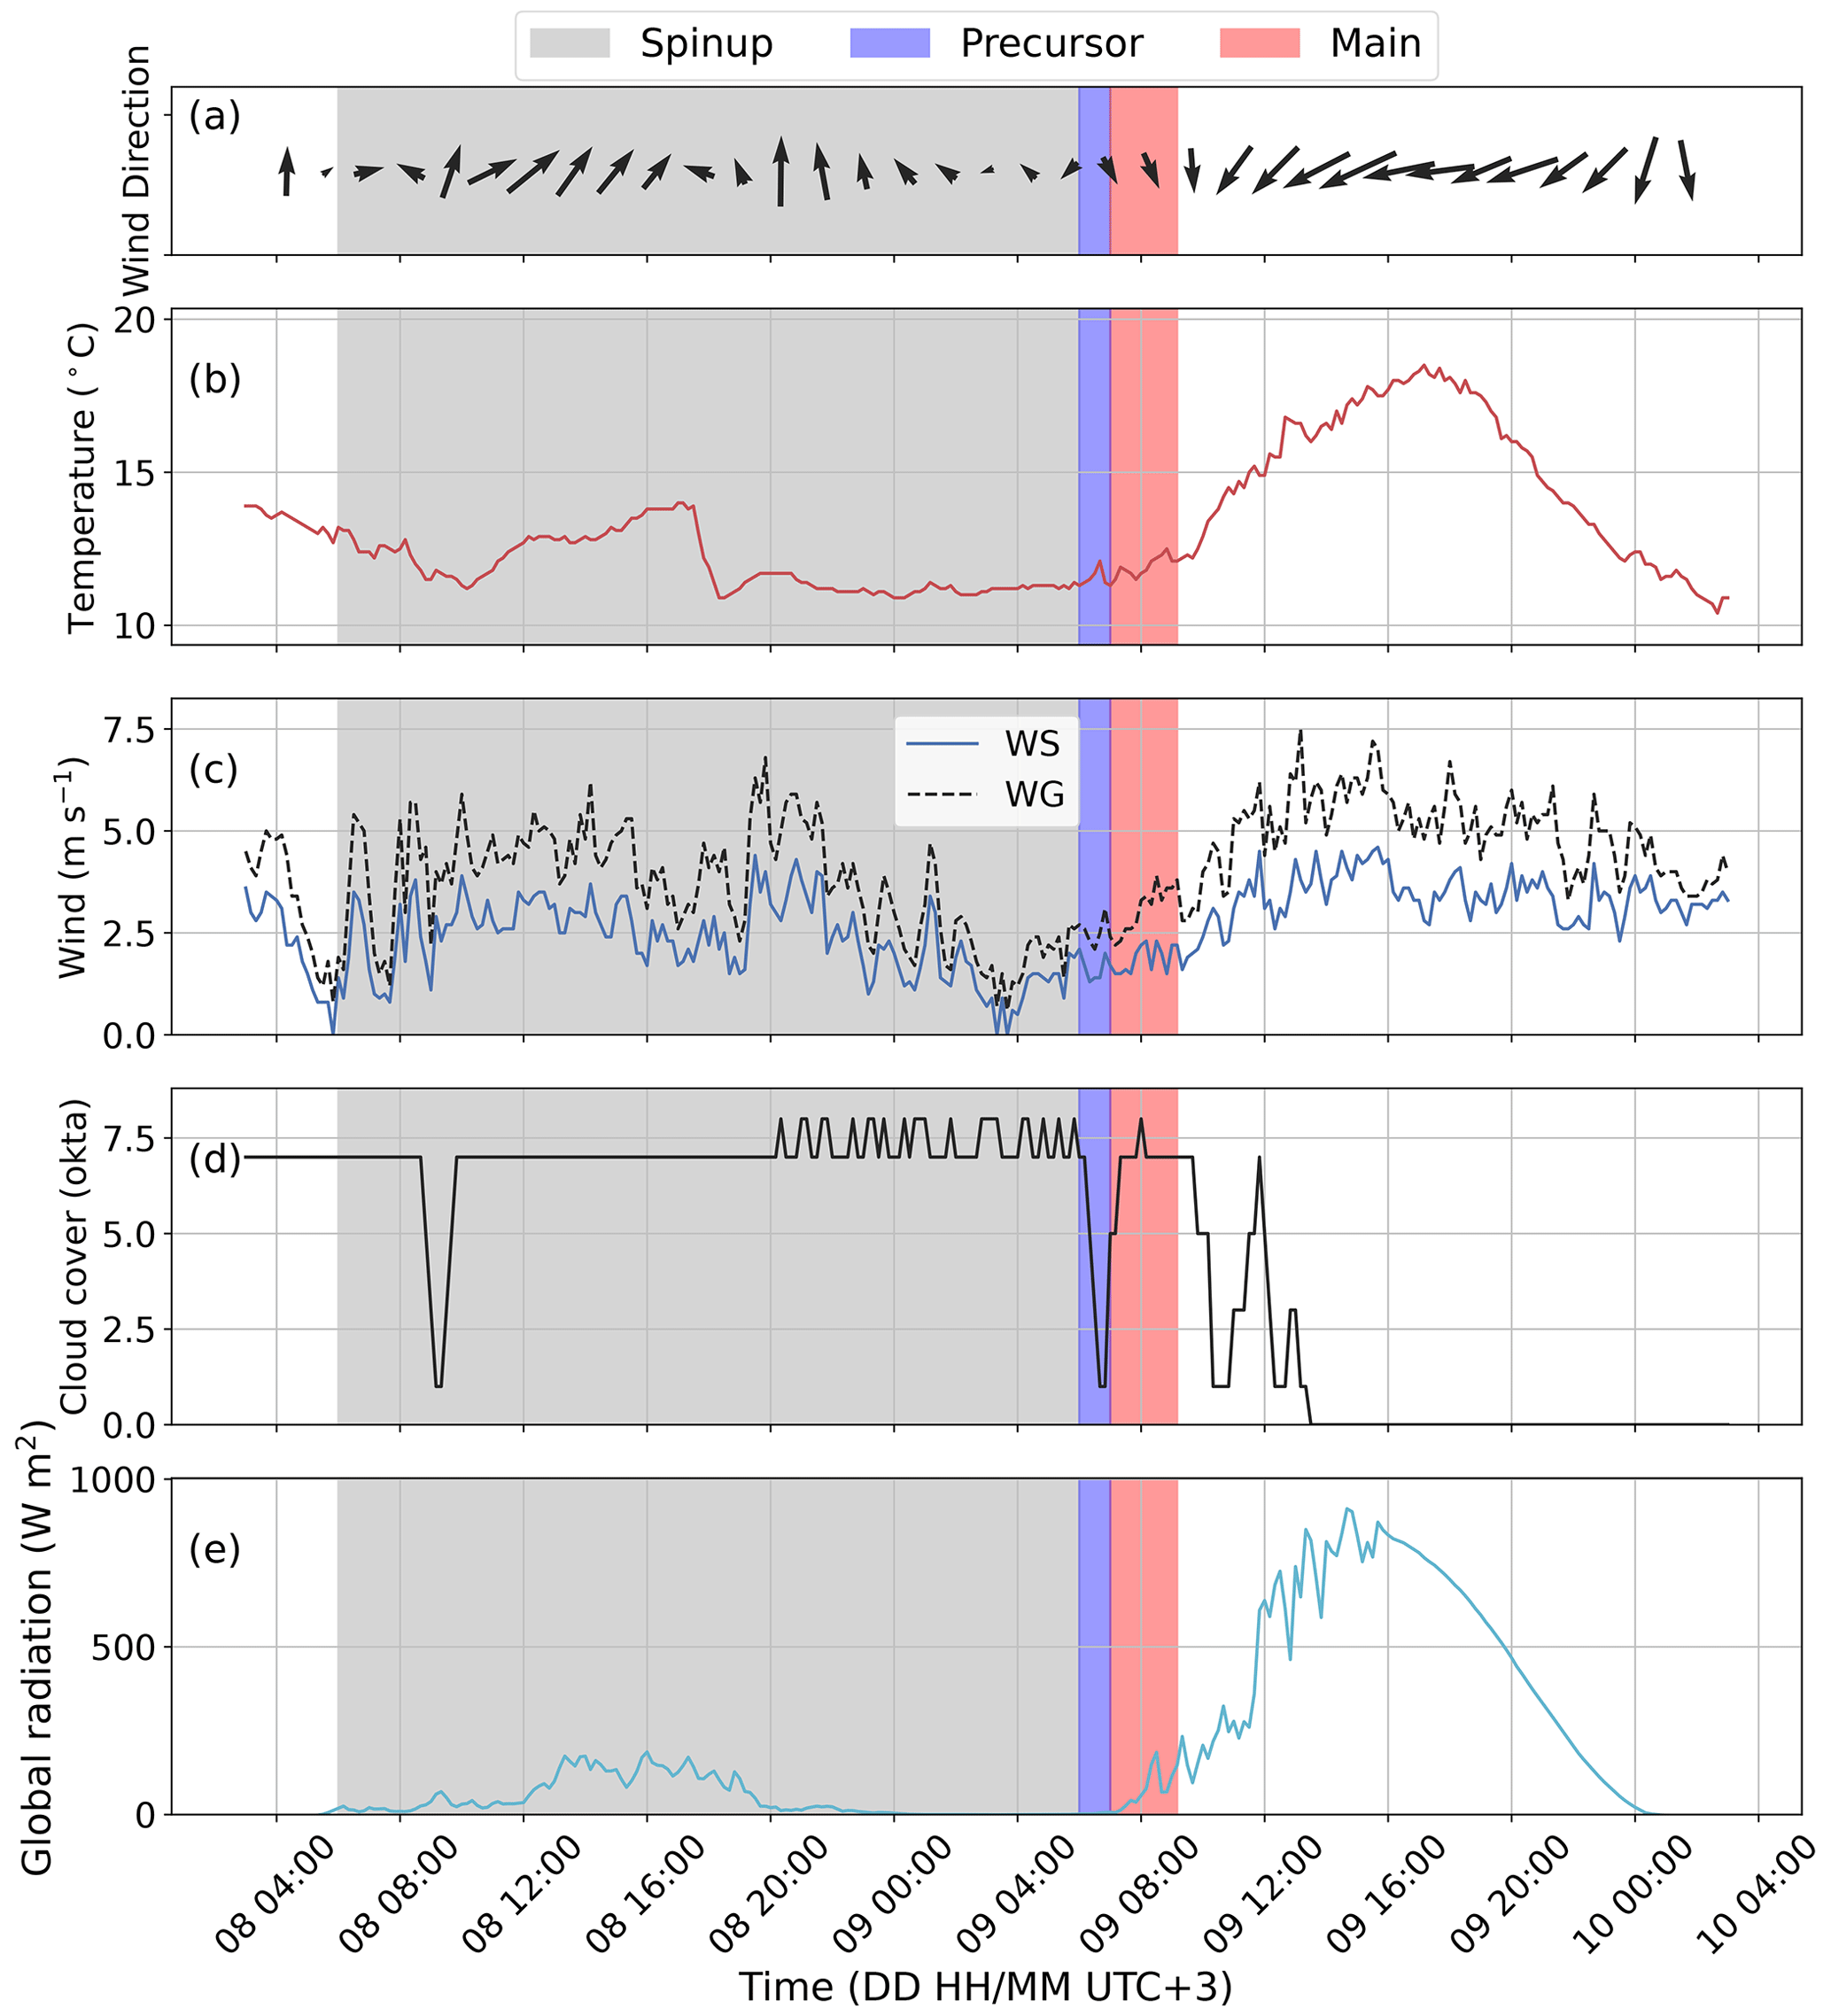
Figure 2Meteorological conditions during the whole simulation period as measured at the Finnish Meteorological Institute weather station located at Kumpula every 10 min. Variables plotted are wind arrows (a), temperature (T) (b), wind speed (WS) and gusts (WG) (c), cloud cover (d), and global radiation (e). The grey area highlights the spin-up run, blue the precursor run and red the main run.
2.5 Data analysis
Data with greater temporal and spatial resolution than what are saved from the full domains are saved from specific statistical regions between 0.1 s intervals at 1 m resolution. In our analysis we use four such regions (see also Fig. 1). Statistical regions SR1 and SR2 cover 5 m × 5 m areas from the ground level to a height of 144 m on opposite sides of the main street canyon, hereafter named supersite and opposite supersite (Kurppa et al., 2020). Similarly, SR3 is a 5 m × 5 m × 144 m column representing a background measurement site away from the main street canyon. All three statistical regions save profile information about wind components, fluxes, air temperature and available SALSA output of particle number size distribution, total particle number concentration (Ntot), number concentration for ultrafine particles (UFPs; particles with an aerodynamic diameter less than 0.1 µm), particulate mass for particles with an aerodynamic diameter below 2.5 µm (PM2.5) and LDSA. Different aerosol metrics are analysed, as they reflect the characteristics of particles with different sizes. It has been reported that dispersion is somewhat different for smaller and larger particles (Rivas et al., 2017; Karttunen et al., 2020). The statistical regions SR1 and SR2 are chosen to get model output data with higher temporal resolution, enabling comparison to LDSA observations made using a drone, and SR3 is chosen to get a comparison of how the vertical profiles of aerosol particles look like outside the emission sources.
Additionally, a fourth area of interest is calculated for the cross-section of the main street canyon covering a 176 m long section (Fig. 1). This is not saved as a separate statistical region but rather taken as a subset from a mask area slightly smaller than the child domain containing only the main street and its immediate surroundings. The street canyon section is chosen as it follows the long building on the southwestern side and is between two side streets coming from the west. The area is chosen to provide an overall understanding of the flow and aerosol fields within the street canyon. The mean cross-section for this area is calculated by applying a 51∘ coordinate rotation to the horizontal wind components in order to align the street with the y-coordinate direction. The cross-sectional wind analysis and Ntot analysis use data from 2 to 32 m above the ground that follow the terrain. Analysed data cover the time period 07:00–09:15 UTC+3 when only modelled data are analysed and time period 07:15–09:15 UTC+3 when modelled data are compared to drone observations. Additionally, colourblind-friendly colour maps were provided by Crameri (2021).
2.6 Observations
During the measurement campaign, observations with the mobile laboratory Sniffer (Pirjola et al., 2004) and a drone were conducted (Järvi et al., 2023). The mobile-laboratory-measured Ntot of particles with 2.5–20 nm in aerodynamic diameter using a condensation particle counter (CPC; TSI 3776, TSI Ltd, USA) and a 2 m air temperature using a temperature and humidity probe (HMP45A, Vaisala Oyj, Finland) with a 1 s resolution. The latter sensor measures temperature at range −40–60 ∘C with accuracy of 0.2 ∘C (in 20 ∘C) and relative humidity at range 0–100 % with accuracy of ±0.1 % RH. The inlet for the aerosol instrument was located above the windshield at 2.4 m. The van speed and position were recorded using a global positioning system (model GPS V, Garmin). The van was driving along the main street canyon and its side streets and standing at the background, supersite and opposite supersite (i.e. matching with the statistical regions). In the standing measurements, the first 3 min was always excluded from the data analyses in order to avoid contamination coming from the van itself. Mean temperature and Ntot were calculated for 5 m × 5 m grids for 07:15–09:15 UTC+3 within the area where the mobile laboratory was driving (Kurppa et al., 2020). The grid size was determined based on the particle number concentration measurements and number of counts in each grid and by the width of streets.
At the same time with the mobile laboratory, a multi-rotor drone (X8, VideoDrone Finland Ltd) was measuring the vertical distribution of the alveolar LDSA of aerosol particles using an electrical particle sensor (Partector, Naneos GmbH, Switzerland). The measurements were done within the statistical subregions SR1 and SR2 located on both sides of the street canyon. The drone flew 10 times up and down between z=2 and 50 m during one 30 min measurement interval, after which measurements were repeated on the other side. Geometric mean profiles from the 10 repetitions for the supersite (opposite supersite) were calculated for time periods 07:16–07:44 (07:54–08:14) and 08:23–08:44 (08:51–09:15) UTC+3. More details on the drone measurements and data analysis can be found in Kuuluvainen et al. (2018).
3.1 Near-surface air temperature
Figure 3 shows the overall change in the mean near-surface air temperature at a height of 2 m (T2 m) for the base run R0A0 without radiation interaction and aerosol processes and for the model run with both aerosol and radiation interaction on (R1A1) within the child domain. In the base run R0A0, the mean T2 m over the child domain is 8.6 ∘C and varies spatially between 8.4 to 8.9 ∘C (Fig. 3a), whereas in R1A1, the mean overall T2 m is 12.4 ∘C and ranges spatially between 11.2 and 17.9 ∘C. Thus, there is an average increase of 3.8 ∘C within the entire child domain in R1A1 when compared to R0A0. The largest T2 m increase is observed close to the eastward-facing building walls in the main street canyon. This is due to the early morning sun heating the walls and creating a more heterogeneous temperature distribution compared to R0A0. Aerosol processes do not affect radiation, but they impact the flow (Matthias Sühring, personal communication, 25 February 2022), which in turn affects near-surface air temperatures. This impact is however minor with −0.6 % difference in T2 m between R1A0 and R1A1. Thus, we can say that the difference between R0A0 and R1A1 is caused by radiation interaction.
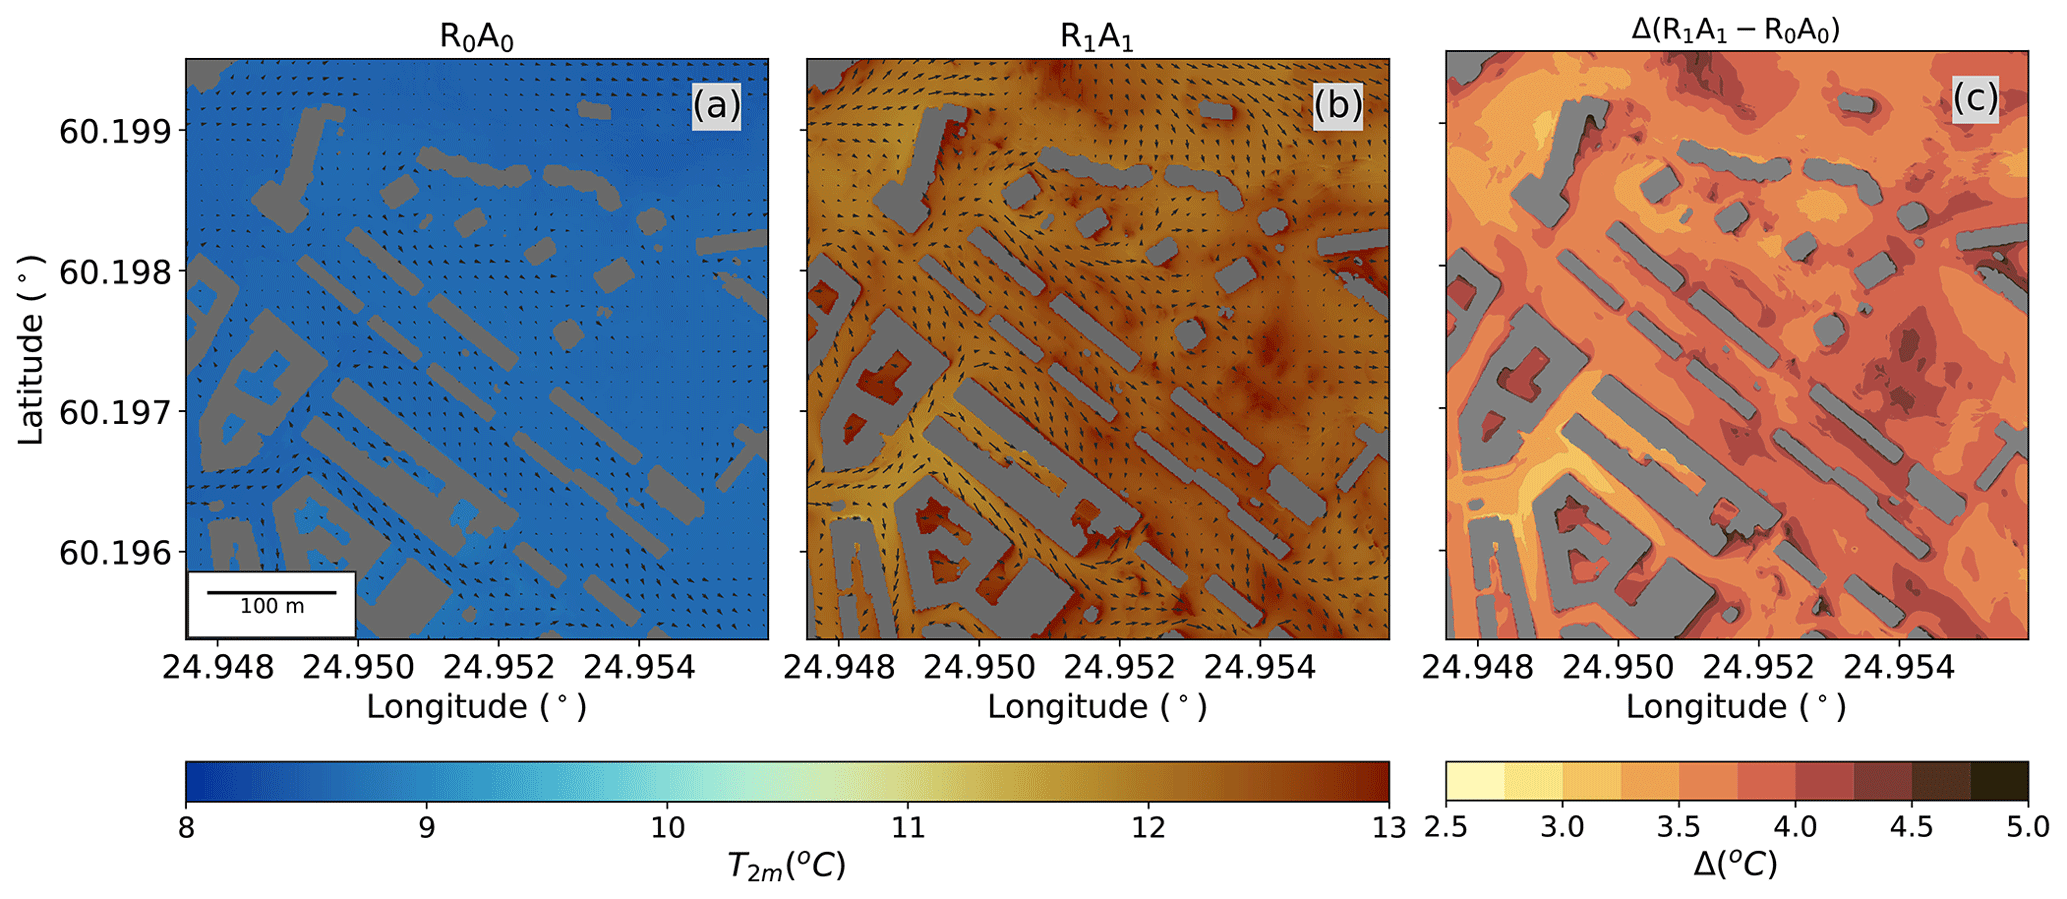
Figure 3Near-surface (z=2 m) mean air temperature (T2 m, ∘C) and flow field (arrows) for the base run R0A0 without radiation interaction and aerosol processes (a) and for run R1A1 with both radiation interaction and aerosol processes on (b), and the difference in R0A0 and R1A1 (c) averaged over 07:00–09:15 UTC+3 in the child domain.
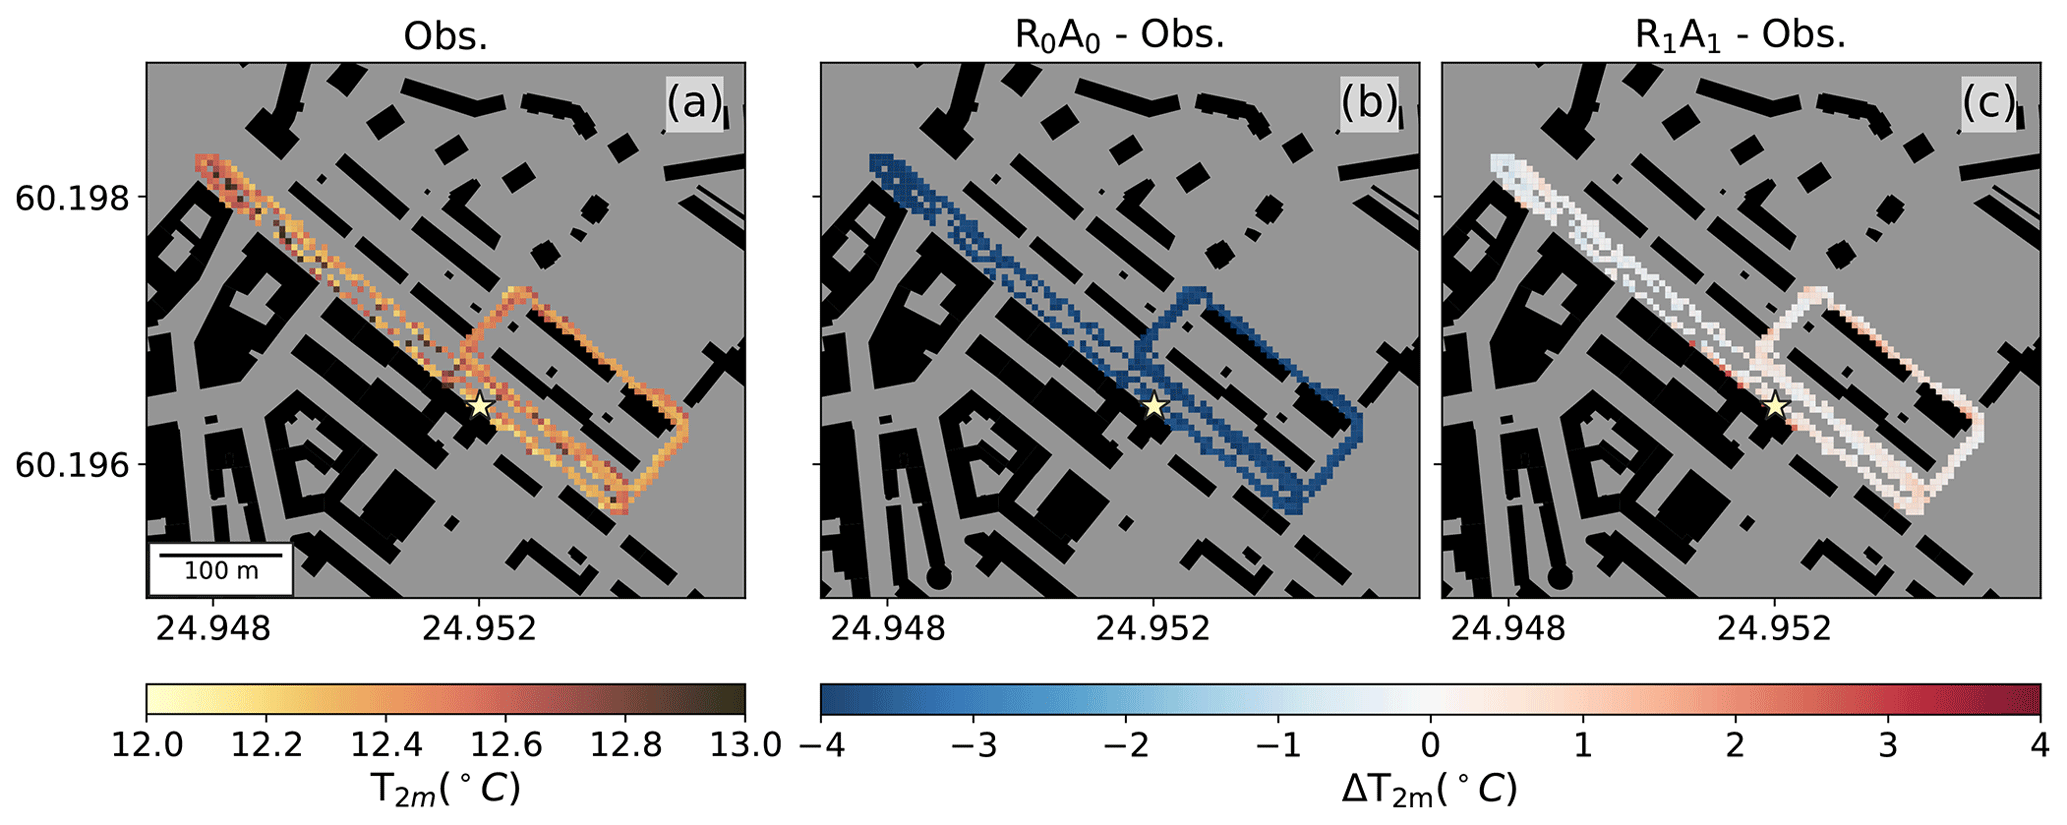
Figure 4Observed 2 m air temperature (T2 m, ∘C) (a), the temperature difference between the base run (R0A0) without radiation interaction and aerosol processes on and observations (b), and the temperature difference between R1A1 with radiation interaction and aerosol processes on and observations (c). Negative values indicate underestimation and positive values overestimation of the observations. The supersite is marked with a beige star.
The observed T2 m measured by the mobile laboratory is in the range of 12–13 ∘C with a spatial mean of 12.4 ∘C (Fig. 4a). When compared to the modelled temperatures (Fig. 4b, c), R0A0 underestimates T2 m by 3.9 ∘C due to a lack of heat exchange between the surface and atmosphere and the absence of solar radiation (Gehrke et al., 2021). When comparing these to R1A1, an immediate improvement is visible, with a decrease in the bias from −3.9 to +0.2 ∘C. With radiation interaction turned on, the overall spatial distribution of air temperature falls in the same range at 12.7 ∘C for the whole area. This shows the model describes heating of the surfaces correctly. There are some areas with slightly higher air temperatures compared to the observations close to the western-side wall next to the supersite. Similar behaviour of the highest temperatures on one side of a street canyon is also reported in Jiang and Yoshie (2018). This can be attributed to the amount of solar radiation received, as a large gap between buildings on the opposite side of the street combined with low azimuth angles of the sun cause this strip of wall to receive more incoming shortwave radiation than the rest of Mäkelänkatu (Oke, 1988). The revision used of PALM (r4734) is known to overestimate heat input at vertical walls by roughly 20 %, which can at least partially explain this near −1 ∘C maximum difference (PALM Model System, 2021).
3.2 Flow field
In order to examine differences in the flow fields, R0A0 and R1A1 are examined at a height of 4 m (V4 m) (Fig. 5). In the base run R0A0, the highest V4 m is visible at the side street southwest of the main street canyon, reaching 1.3 m s−1, and over an open flat terrain in the northern part of the child domain reaching 0.9 m s−1 (Fig. 5a). In R1A1, the flow field stays similar to R0A0 (Fig. 5b), but an increase in the overall V4 m is seen (Fig. 5c). In this case, the smaller street canyon southwest of the main street canyon experiences stronger winds, reaching 2.1 m s−1. Some spots, such as the eastern side of the main street, show a slight decrease in V4 m by 0.6 m s−1. The smallest difference in V4 m between the two model runs is found at the location of the trees, where the tree canopies slow down the flow. Overall the mean flow increases by 89 % in the child domain from 0.29 (R0A0) to 0.54 m s−1 (R1A1) at the 4 m height due to enhanced circulation from radiative warming and cooling (Fig. 6). Aerosol processes have a minor impact on the flow, causing a minor increase of 0.1 % from R0A0 to R0A1 and 4.8 % from R1A0 to R1A1 in V4 m. During the main run, the mean wind direction in the beginning of the simulation period is from the west but turns northwesterly during the simulation. The wind turning is greater in the base run compared to R1A1. The increase in wind speeds with heated surfaces has commonly been reported in previous studies. Li et al. (2010) used a ground heating approach and reported an increase in near-ground flow and roof-level streamwise flow with increasing instability. Vertical wind speeds showed an increase of up to 150 %. Cheng and Liu (2011) report a similar increase in mean flow speed at opposing sides of the canyon of 100 % but additionally show that the locations of the flow velocity maxima remain the same between neutral and unstable cases. Similar observations about the locations of the flow maxima can be seen in Fig. 6. Li et al. (2012) observed a strengthening of the vortex due to buoyant lifting of leeward flow, which enhanced the rotation of the vortex and resulted in a 150 % increase in the windward vertical wind speeds. Nazarian et al. (2018) had similar wind speeds of 3 m s−1 and reported the street vortex becoming stronger and its centre moving towards the windward side. In these studies, no changes in wind direction were seen, likely due to fixed wind direction relative to idealised street canyons. In our simulations, the wind direction changes during the simulation period, presenting a more realistic wind pattern.
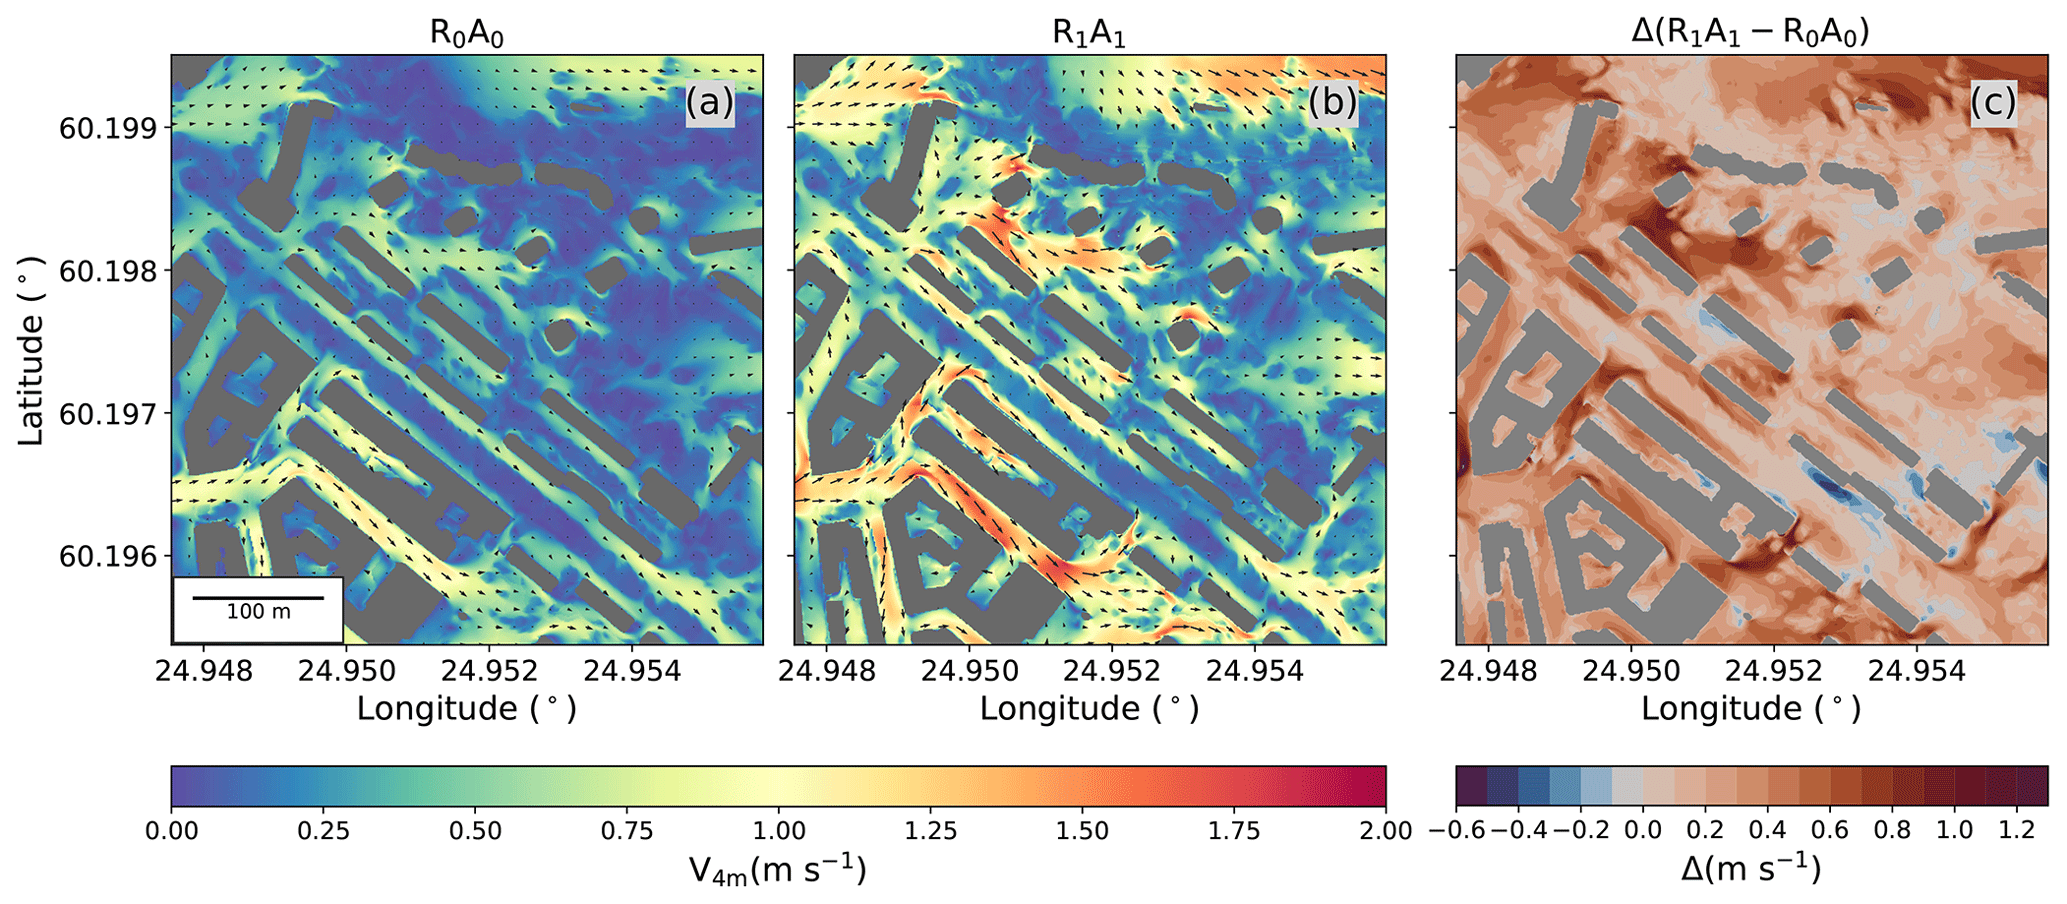
Figure 5Mean horizontal wind speed at 4 m height (V4 m) between 07:00–09:15 UTC+3 for the base run (R0A0) when radiation effects are turned off (a) and for the run with radiation effects turned on (R1A1) (b), as well as the absolute change in horizontal wind speed between the two model runs (c).
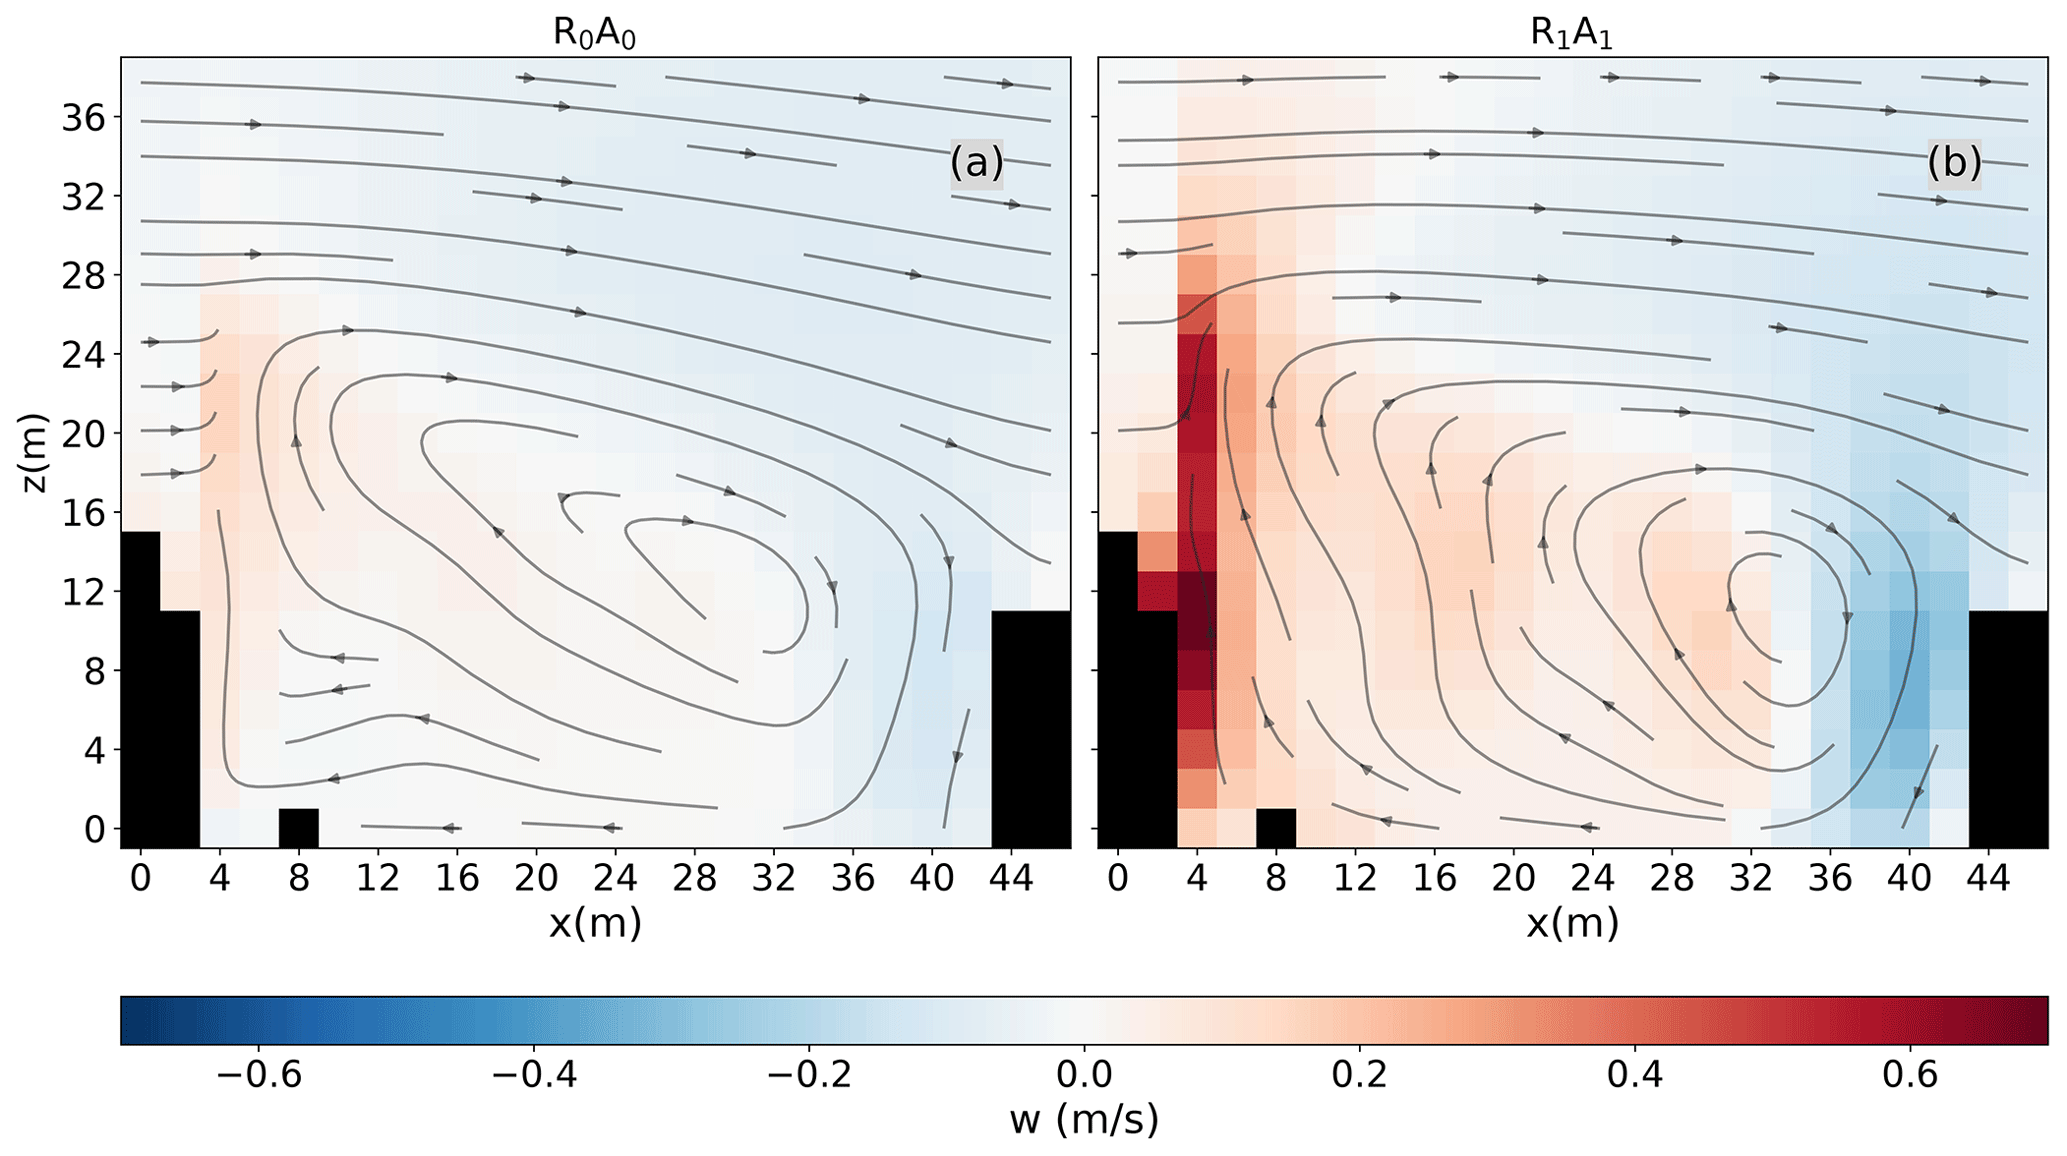
Figure 6Street canyon vortex mean flow for the base run R0A0 with no radiation interaction (a) and R1A1 when the radiation model is turned on (b), averaged along the canyon over the shaded area shown in Fig. 1. The streamlines describe the flow rotating around the y axis aligned with the street, and the colours describe the vertical wind speed. Black areas represent buildings on both sides of the street, with an additional measurement container on the western side.
Figure 6 shows the street canyon vortex within the main street canyon (see Fig. 1) for R0A0 and R1A1. R1A1 shows the effect of radiative forcing with stronger opposing wind speeds. Maximum ascent (descent) increased from 0.15 m s−1 (−0.13 m s−1) in R0A0 to 0.69 m s−1 (-0.33 m s−1) in R1A1 due to radiative cooling and warming on opposite sides of the street canyon. In the middle of the canyon, the effect of street trees is visible with enhanced ascent due to warming canopy, which spreads the area of ascent more toward the middle of the canyon. Similar changes to the vortex were reported by Xie et al. (2005) and Bottillo et al. (2014) in idealised street canyon setups. As already mentioned above, the mean wind direction remains more westerly in R1A1 when compared to R0A0. This increases the cross-flow component over the canyon in R1A1 and is one possible cause for the more organised canyon vortex (Offerle et al., 2007; Dimitrova et al., 2009). This change in both the vortex structure and the strength in an unstable case compared to a neutral one has been shown in numerous studies (Nezis et al., 2011; Mei et al., 2016; Guo et al., 2020). Previous studies have also suggested that canyon vortices in wide street canyons are sensitive to the time of day, since heating of the windward wall would hinder the vortex instead of strengthening it, causing an entirely different flow structure in the canopy layer (Sini et al., 1996; Xie et al., 2005). As this is a calm wind case (mean wind 0.54 m s−1), the effect of solar-heating-induced thermal turbulence has a larger effect on the flow than what would be the case with higher wind speeds (Bottillo et al., 2014). On the other hand, we simulate an early morning when solar radiation is around 240 W m−2 when compared to midday radiation levels, reaching 920 W m−2 when the radiative heating is going to be even stronger.
3.3 Aerosol particle number concentration
The spatial variability in Ntot at 4 m height (Ntot,4 m) for the base run R0A0 and the differences in model runs R0A1, R1A0 and R1A1 compared to the base run are shown in Fig. 7. R0A0 shows the largest concentrations on the western side of the main street canyon, reaching up to . This is due to the canyon vortex transporting traffic emissions to the leeward side of the street canyon, which has also been reported in previous studies. Nezis et al. (2011) reported pollutant concentrations having a direct correlation with the flow field and stability within the street canyon. This includes the leeward transport of pollutants within the canyon. Jiang and Yoshie (2018) found the temperature and flow distribution in an unstable case to also cause leeward transport of pollutants from the leeward side and that pollutants are removed from the canyon mainly at the sides of the canyon. Chen et al. (2020) mainly focus on the temperature differences between eastward- and westward-facing walls during solar heating. They reported a high dependency of the street canyon orientation and aspect ratio on the resulting temperature distribution, which directly affects the flow conditions and ventilation. Kurppa et al. (2020) mainly focused on neutral cases and found the pollutant concentrations to be overestimated within the canyon when there was no heating present. Slightly smaller concentrations are seen when moving towards the southeast compared to other parts of the street canyon (Fig. 7a). The side streets and surrounding areas away from the main street traffic emissions show the smallest concentrations, staying above . When only aerosol processes are turned on (R0A1), there is generally a decrease in Ntot,4 m where trees in the main street canyon are located (Fig. 7b). This is due to dry deposition removing particles from the air (Buccolieri et al., 2011; Karttunen et al., 2020). With only radiation interaction turned on (R1A0), Ntot,4 decreases on average by 53 % from to in the child domain as the increased wind speed enhances the particle transport from the 4 m height upward (Fig. 7c). An exception is seen close to building walls along the main street canyon in the central area. A small area of stagnating horizontal flow is formed in the middle close to the supersite (SR1), which combined with the overall pollutant transport to the leeward side of the street results in the largest increase in Ntot. The upward transport of pollutants starts at 4 m height, and particles are then swept away above the canopy by the free flow.
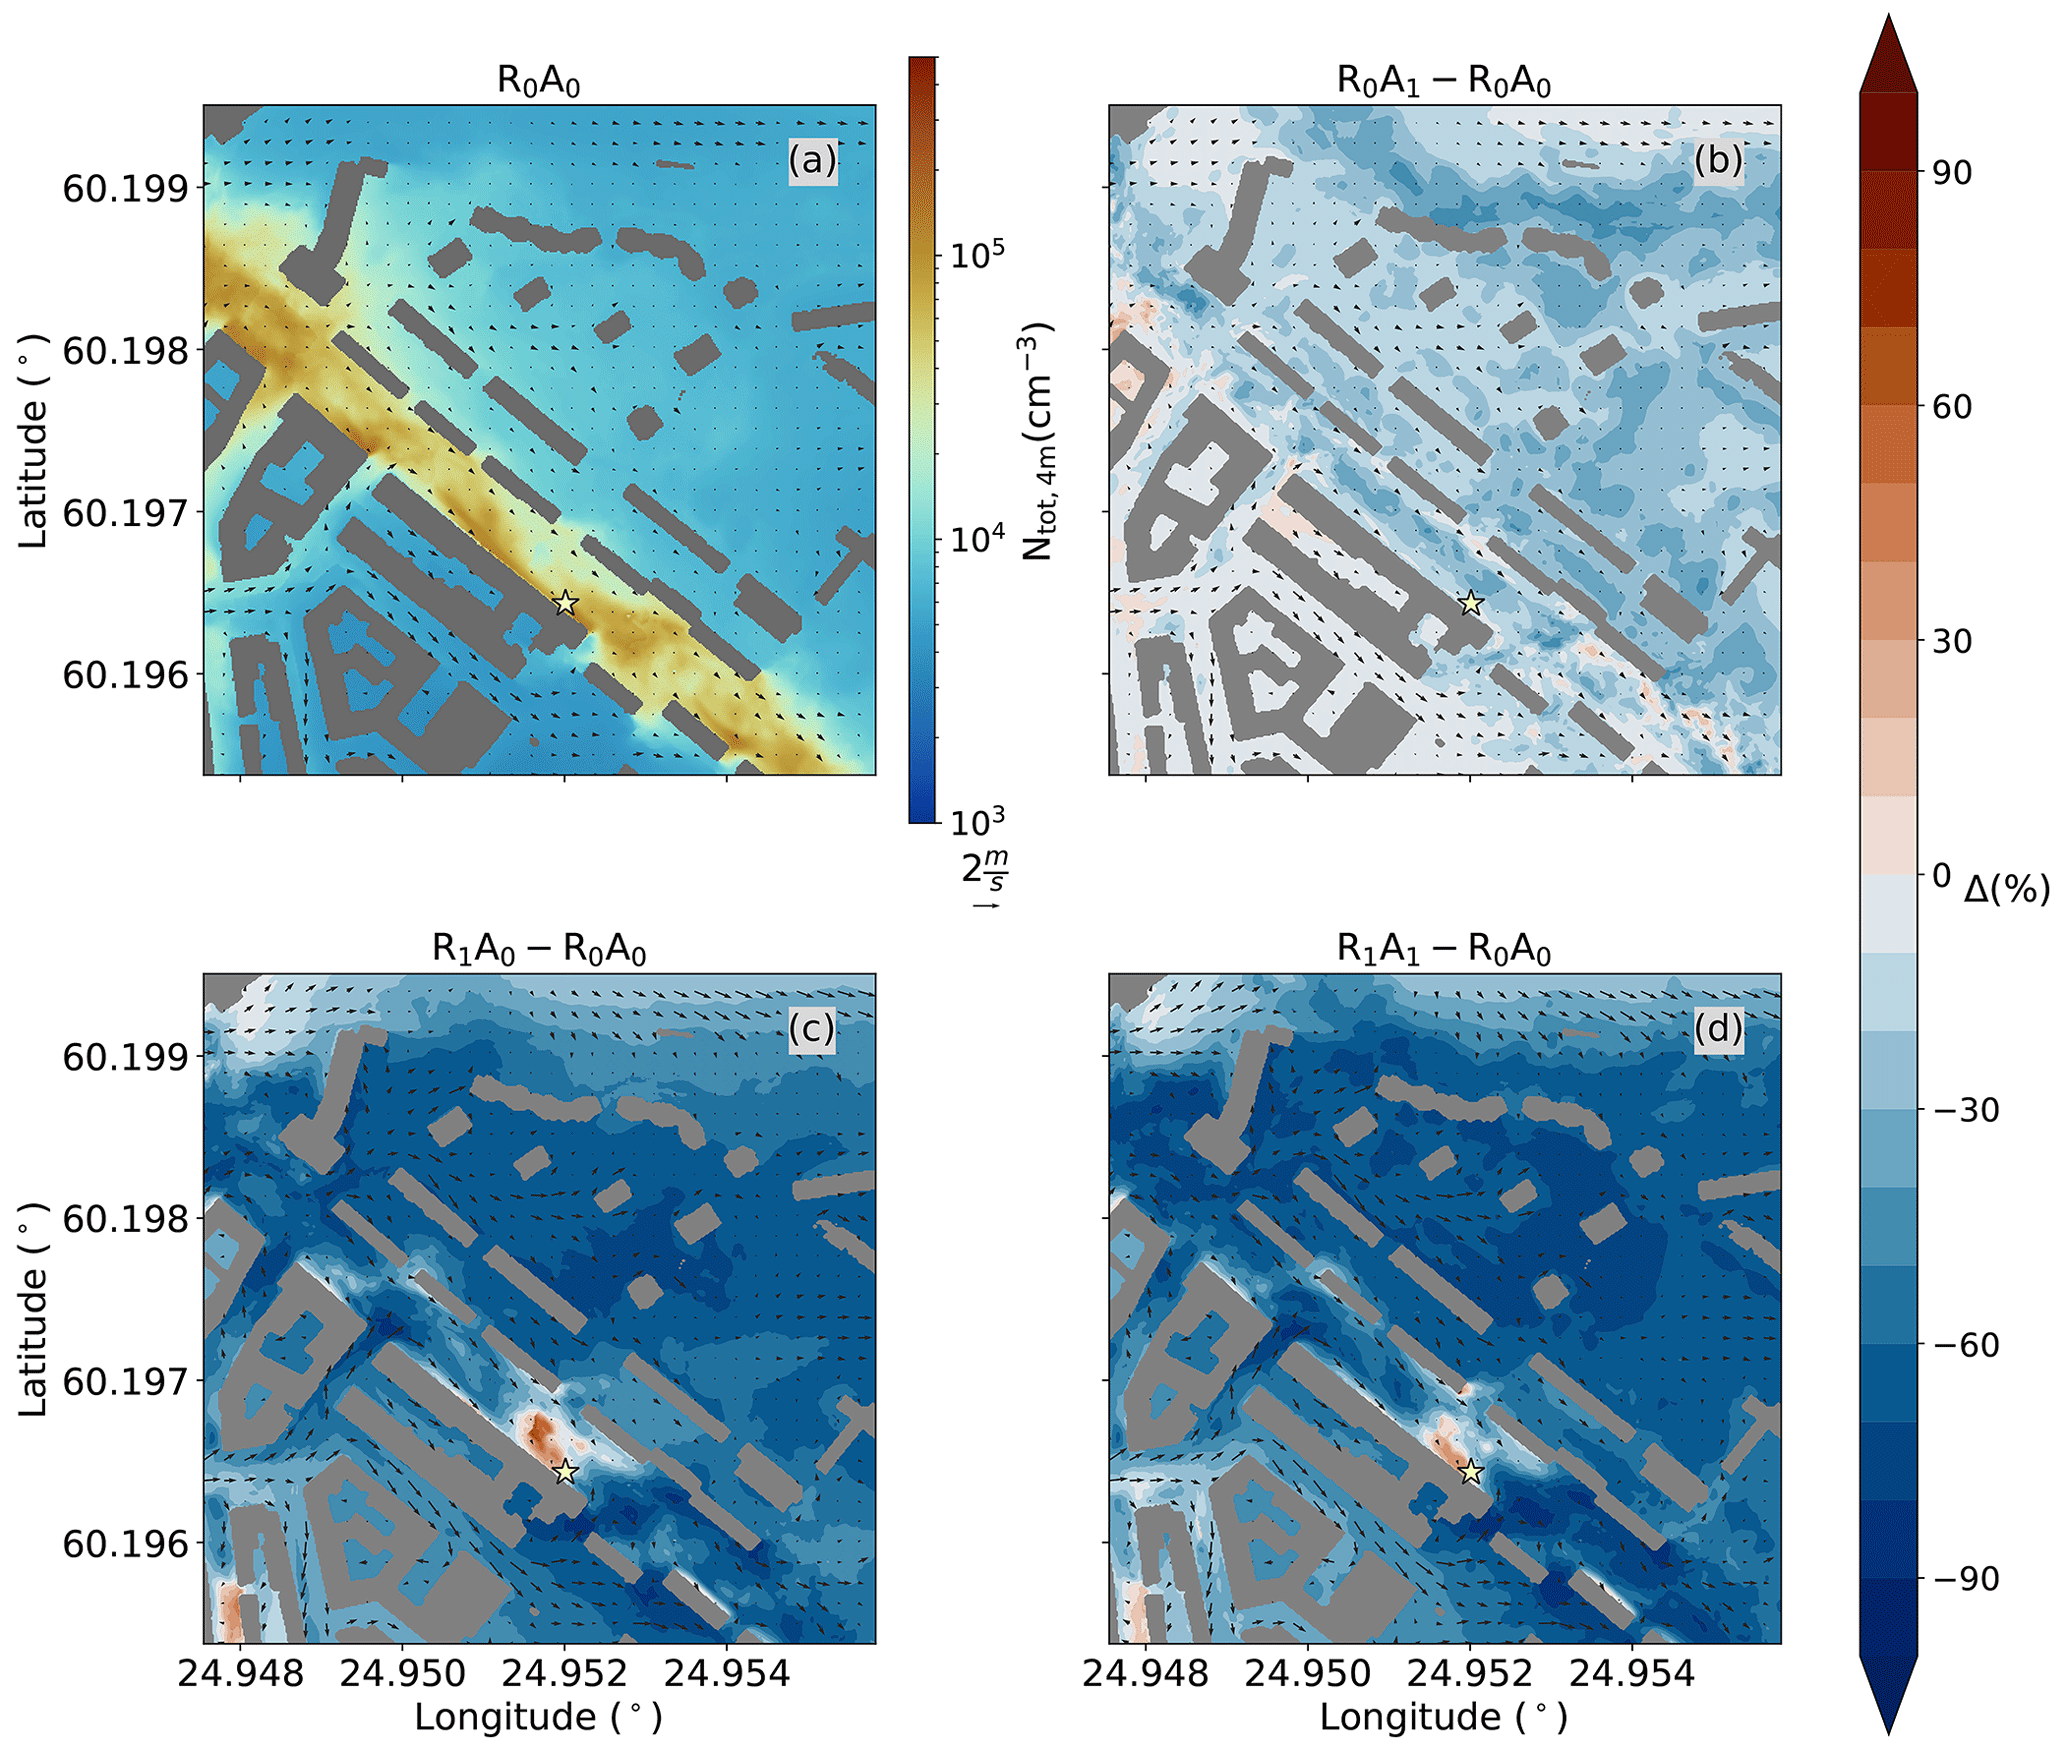
Figure 7Mean total particle number concentration (Ntot,4 m) and horizontal wind speed (arrows) at 4 m height for the base run R0A0 (a) and the change in percentages of R0A1 (b), R1A0 (c) and R1A1 (d) compared to R0A0. The supersite is marked with a beige star.
Aerosol processes (R0A1) alone decrease Ntot,4 m in the child domain by 18 %, while thermal turbulence alone (R1A0) decreases the concentrations by 53 %. When the combined effect from radiation and aerosol processes (R1A1) are considered, Ntot,4 m is decreased by 56 %. Previous studies such as Li et al. (2012) have reported a decrease of 65 % at the centre of the canyon with an aspect ratio of 0.5. Li et al. (2015) attribute this type of decrease to both turbulent and mean flow removal during unstable cases, whereas in a neutral case the mean flow is the main process of removing pollutants from the street canyon.
The modelled particle number concentrations at 2 m height (Ntot,2 m) are compared with the mobile laboratory measurements in the child domain (Fig. 8). The base run R0A0 and the run with only aerosol processes on (R0A1) show on average 98 % and 74 % larger Ntot,2 m, respectively, than what is measured (Fig. 8a). R0A1 performs better compared to R0A0, as the effect of aerosol processes decreases the overall particle concentrations. When introducing radiation interaction, the model performs much better, with a 13 % (R1A0) and a 16 % (R1A1) decrease in Ntot,2 m compared to observations. The enhanced pollutant dispersion away from the surface decreases Ntot,2 m at nearly all locations, especially along the side streets. Thus, radiation also decreases the absolute difference when compared to measurements and performs better compared to when radiation interaction is absent. The base run (R0A0) and the run with only aerosol processes on (R0A1) perform better in the southern sector of the main street canyon, but due to the large overestimation at the northern end of the street, R1A0 and R1A1 perform better overall.
Figure 9 shows the averaged cross-section of Ntot in the main street canyon. In the base run R0A0, the highest concentrations reaching 104×103 cm−3 are modelled at the ground level on the western side of the street canyon due to the street canyon vortex (Fig. 9a). Introducing the aerosol processes reduces Ntot in the cross-section because of the combined effect of coagulation scavenging the small particles and dry deposition to the building and canopy surfaces (Fig. 9b). The reduction is around 15.6 % near the ground and 21.0 % within the street canyon (below 16 m). When radiation is involved (Fig. 9c), there is a disparity between the amount of decreased pollutant concentrations when comparing the left and right side of the street, as the transport across the canyon is more pronounced, and the canyon vortex is modified. R1A0 shows an overall decrease of 27.1 % in the canyon Ntot compared to the base run (R0A0) and near-surface concentration decrease by 40.5 %. This infers that the removal of pollutants is the most effective near the ground at the centre of the canyon. Considering the combined effect of aerosol processes and radiative heating in R1A1 (Fig. 9d), a further decrease in particle concentrations appears in the middle and especially the eastern side of the main street canyon from the ground level to the top of the tree canopy. The particle concentrations are the lowest near the surface in the middle of the street with a decrease of 46.3 %. Idealised simulations such as those of Xie et al. (2005) reported stronger pollutant transport and vortex strength when the leeward canyon wall was heated, whereas ground heating was more effective at pollutant removal overall. Nezis et al. (2011) show similar results where the increased ascent at the leeward side combined with the horizontal transport remove pollutants from the canyon and transport them away by the flow at roof level. Mei et al. (2016) reported a similar one-vortex flow when the aspect ratio is 0.5, with a direct correlation between increasing instability and a decrease in pollutant concentrations within the canyon. Mei et al. (2017) used a sinusoidal function to model the thermal conditions in an idealised street canyon setup and found PM mass to decrease in the canyon with increasing instability.
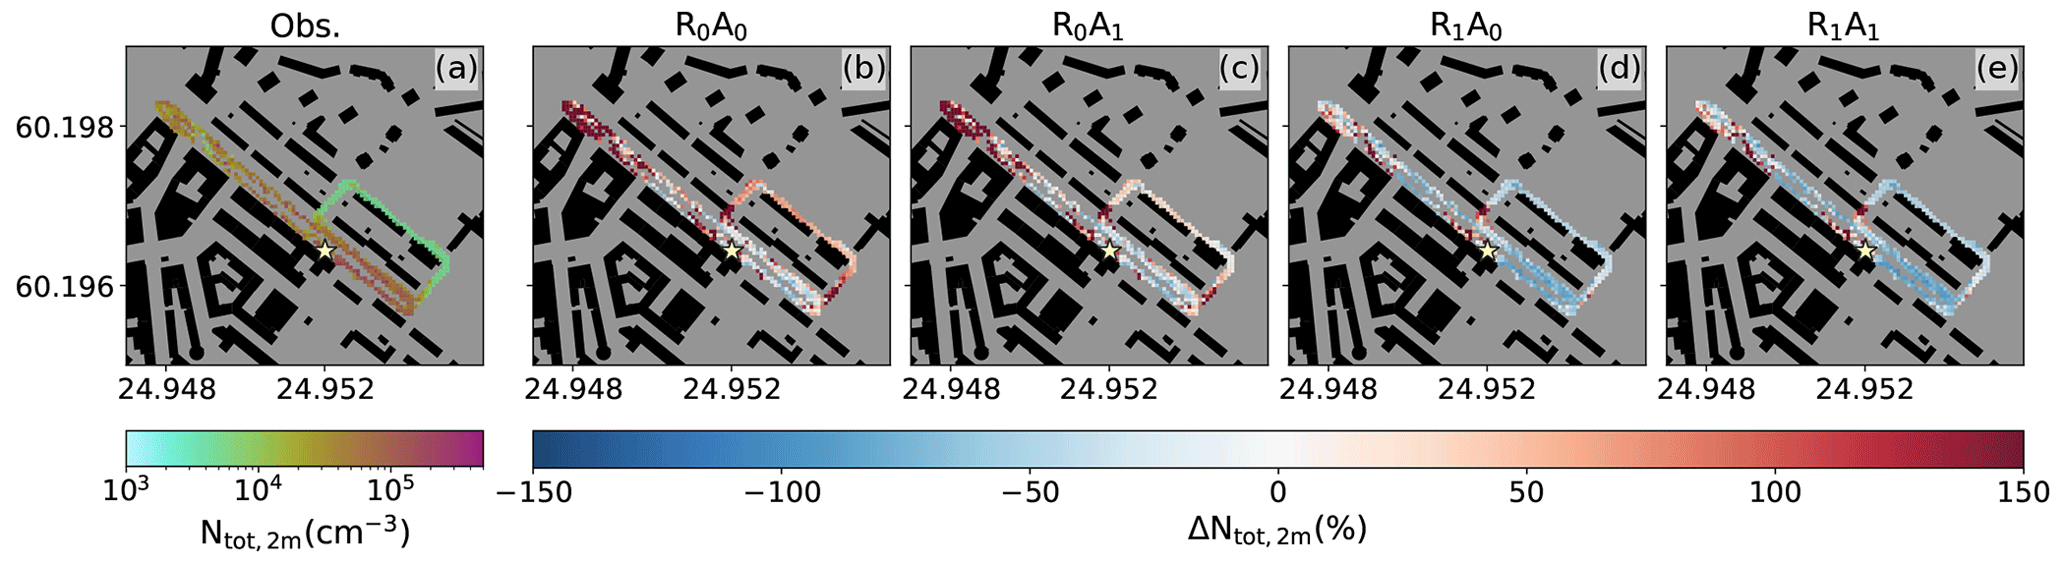
Figure 8Observed 2 m total particle number concentration (Ntot,2 m) (a) and the difference between the base run (R0A0) (b), aerosol processes (R0A1) (c), radiation interaction (R1A0) (d) and both (R1A1) (e) compared to the observed concentrations.
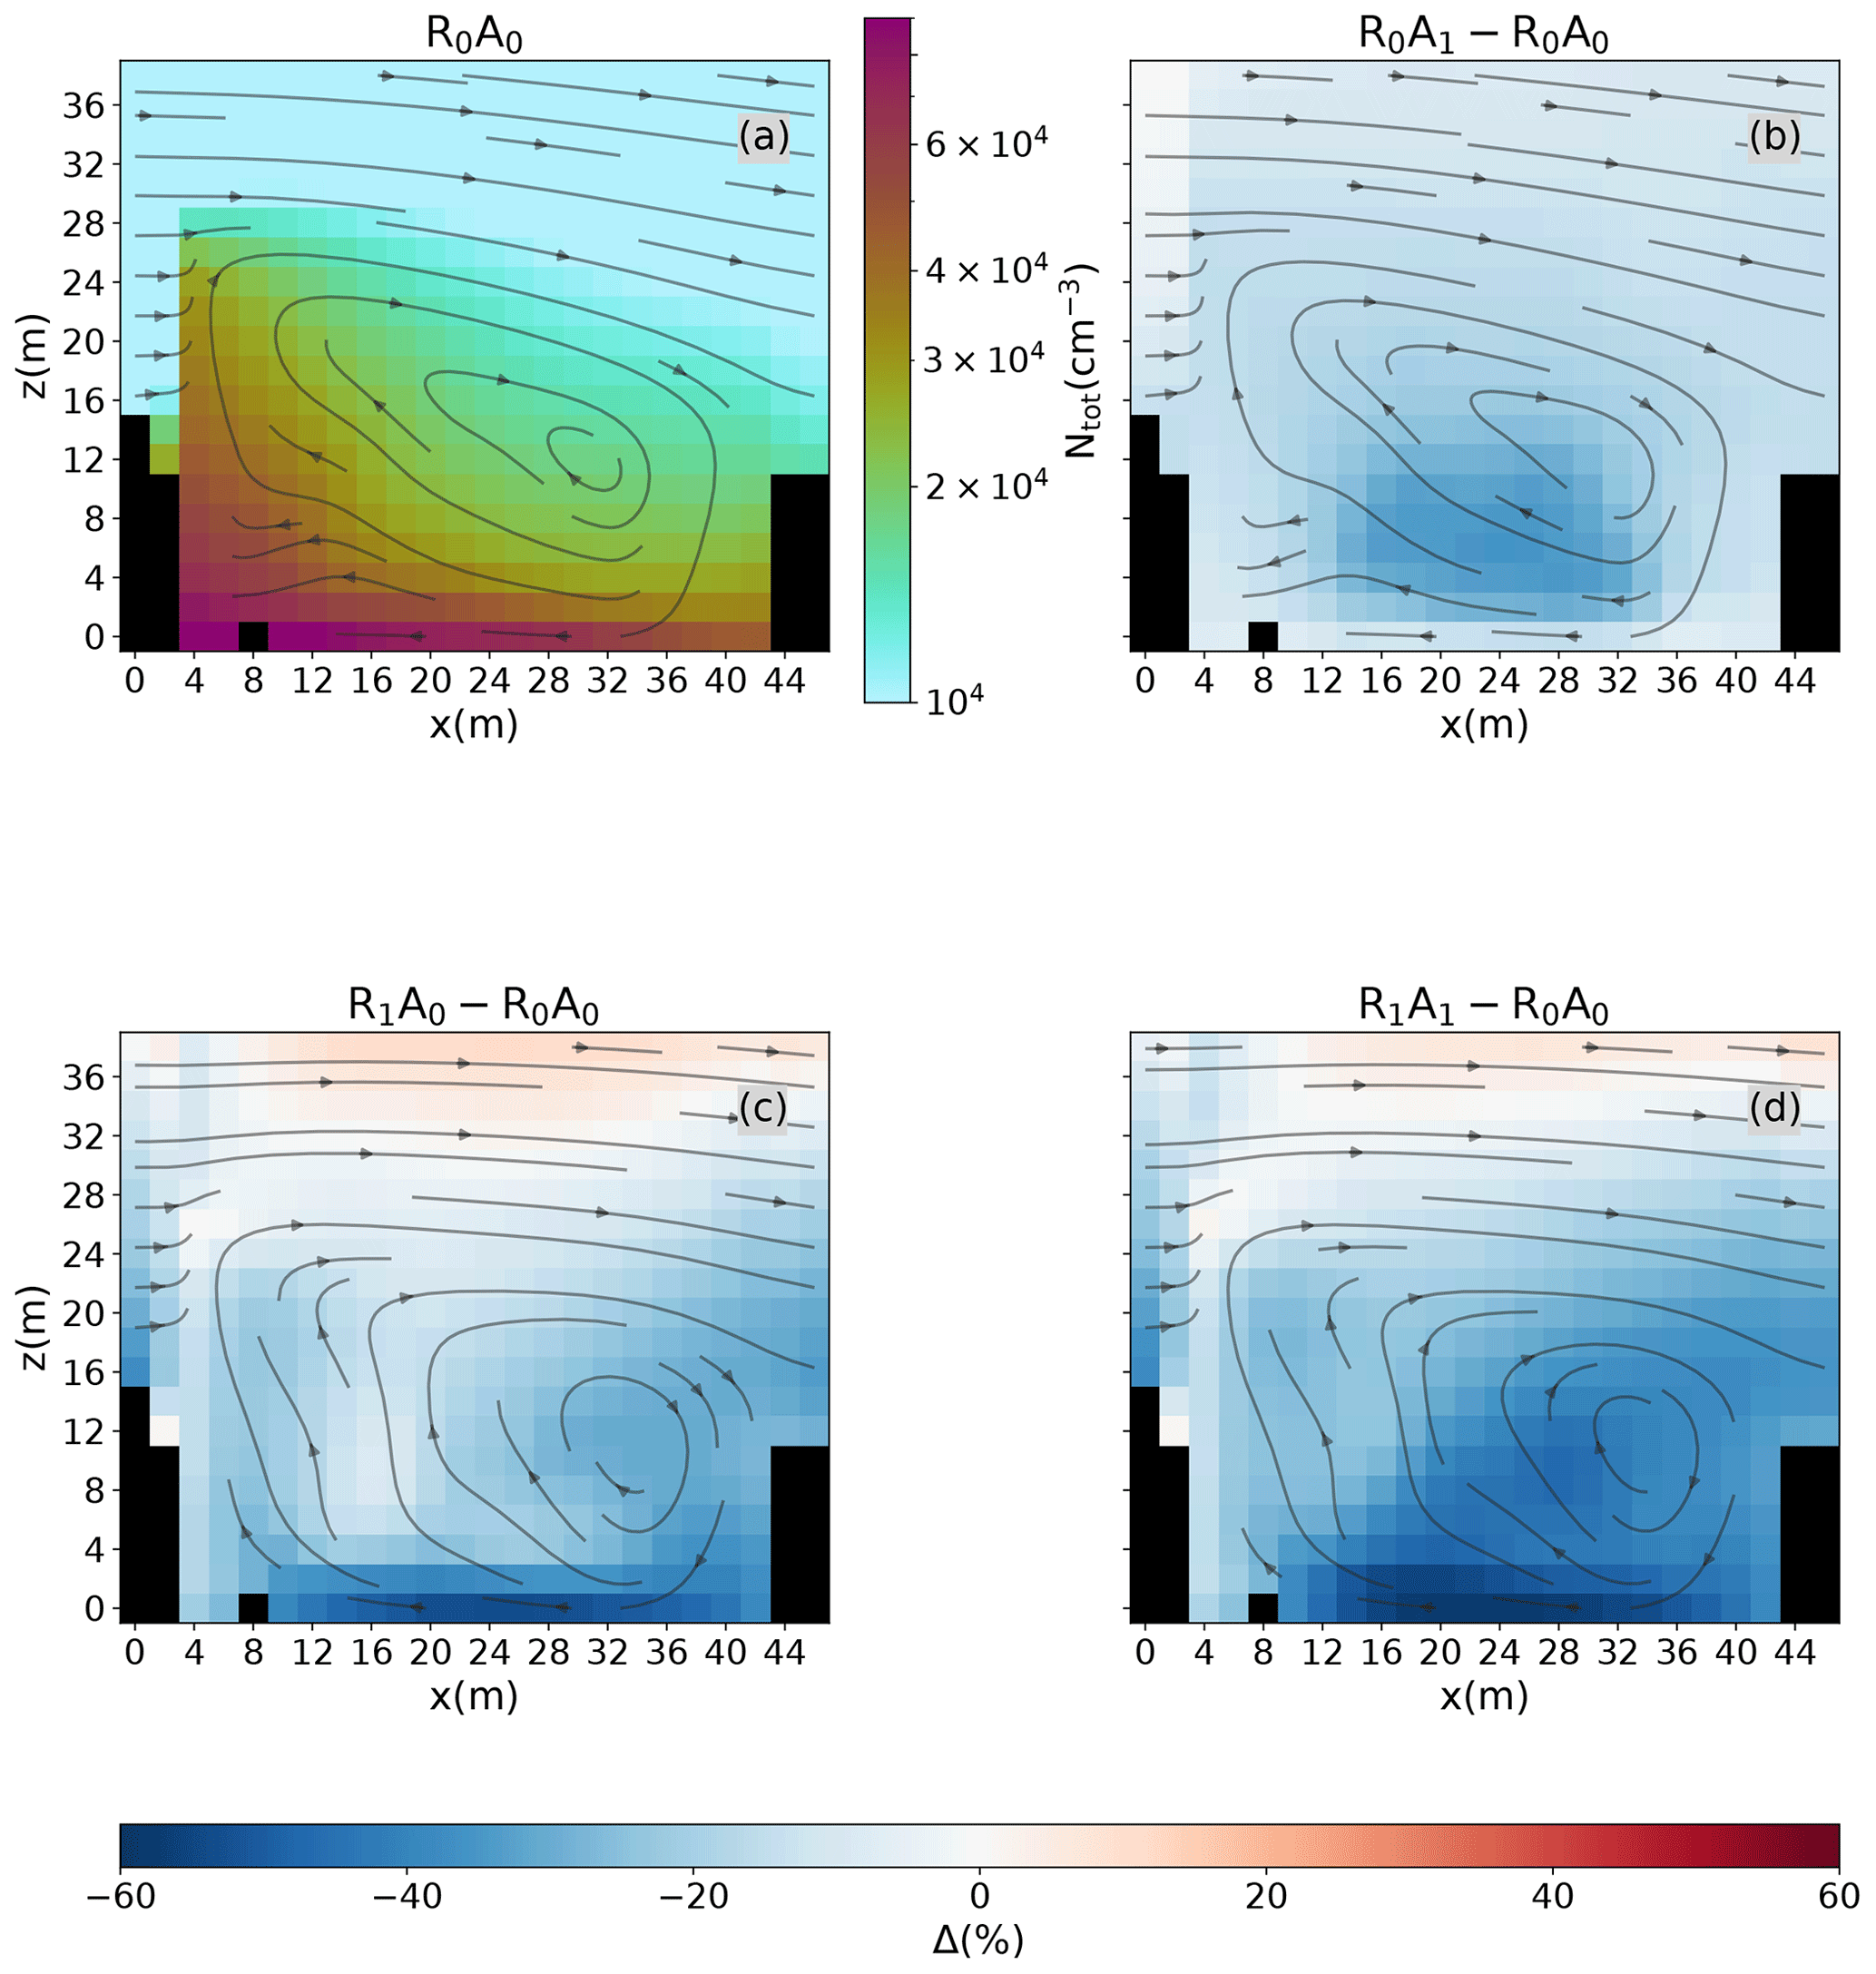
Figure 9Mean total particle number concentration (Ntot) cross-section along the main street canyon in the base run R0A0 (a) and the difference between the model runs with only aerosol processes on (R0A1) (b), only radiation on (R1A0) (c) and both on (R1A1) (d) compared to the base run.
3.4 Aerosol particle size distribution
Focusing only on Ntot ignores the effects of the aerosol dynamic processes on the different sizes of aerosol particles. Figure 10 shows the particle size distribution at the statistical regions (see Fig. 1). The dominant particle size shifts to a larger size when the aerosol processes are introduced. The largest overall change appears in the range of the smallest particles (4–15 nm) between R0A0 and R0A1. The number concentration of small particles is orders of magnitude larger when aerosol processes are off (R0A0 and R1A0) compared to when aerosol processes are on (R0A1 and R1A1). This is due to coagulation and condensation, which act as a sink for the smallest particles. A simulation in a narrow street canyon in Cambridge also indicated that aerosol processes have the greatest effect on the smallest particles independently of modelling height, and the condensation growth contributes much more to the reduction in small particle concentrations than coagulation (Kurppa et al., 2019).
At the supersite, the concentration of aerosol particles at all size bins is higher with radiation interaction on, especially for small particles, regardless of whether aerosol processes are introduced or not. The increase in small particle concentration can be up to 8.2 times in the case of R1A1 compared to R0A1. When radiation is introduced, the combined effect of the stronger transport towards the leeward wall and the stagnant flow parallel to the canyon leads to this increment in particle concentration. Similarly, the results of CFD demonstrated that the heating of the leeward façade further developed the clockwise-rotating vortex, and the pollutants would be brought to the leeward side, leading to a zone of higher pollutant concentration (Xie et al., 2007). At the opposite of the supersite, the effect of radiation on aerosol concentrations is not significant when the aerosol processes are absent. When the aerosol processes are switched on, the concentration of small particles is higher with radiation interaction on, which is probably related to the interaction of the flow field, temperature, and coagulation and condensation processes of small particles. Meanwhile, the background particle concentrations at all size bins are lower compared to the street canyon. Unlike the main street, particle concentrations in the background site are larger in R0A0 and R0A1. The inclusion of radiation interaction reduces particle concentration for all size bins. The background site is at the edge of a gravel football field, so street canyon flows such as an enhanced vortex structure and the increased ventilation caused by it are not as evident here compared to the main street. Xie et al. (2007) also pointed out that in a street canyon of , the wind structure was not isolated and involving heating did not lead to extreme pollution zones. In addition, the street canyon average particle size distribution (Fig. 10d) resembles the distribution on the northeastern side of the street (SR2).
In our simulations, the particle deposition to vegetation is considered but not the possible impact of biogenic emissions on particle size distributions and concentrations. Primary biological aerosols (PBAs) directly emitted from vegetation, such as spores and pollen, commonly have a particle diameter larger than 1µm (Fröhlich-Nowoisky et al., 2016). This exceeds the considered particle size range (2.5 nm–1 µm) in our simulations, and thus the lack of PBA is expected to have a minor impact on simulated particle distributions. Biogenic volatile organic compounds (BVOCs) emitted from vegetation form secondary organic aerosols through gas-to-particle conversion (Schobesberger et al., 2013). The particle formation rate correlates positively with BVOCs (Dal Maso et al., 2016). Due to the lack of BVOC emissions, the current simulations may underestimate the concentration of small organic aerosols, particularly in the southeastern part of the child domain where the most vegetation is present. In addition, the lack of the condensation process of BVOCs would affect the particle size distribution in our results. It has been shown that growth rates of small particles are correlated very well with total BVOC concentrations (Dal Maso et al., 2016). However, the measurement campaign made at the Helsinki supersite (SR1) shows that in this traffic environment, BVOC concentrations are significantly lower than anthropogenic VOCs (Saarikoski et al., 2023), and thus this lack of BVOCs is likely to have a relatively small impact on the simulated aerosol particle size distributions.
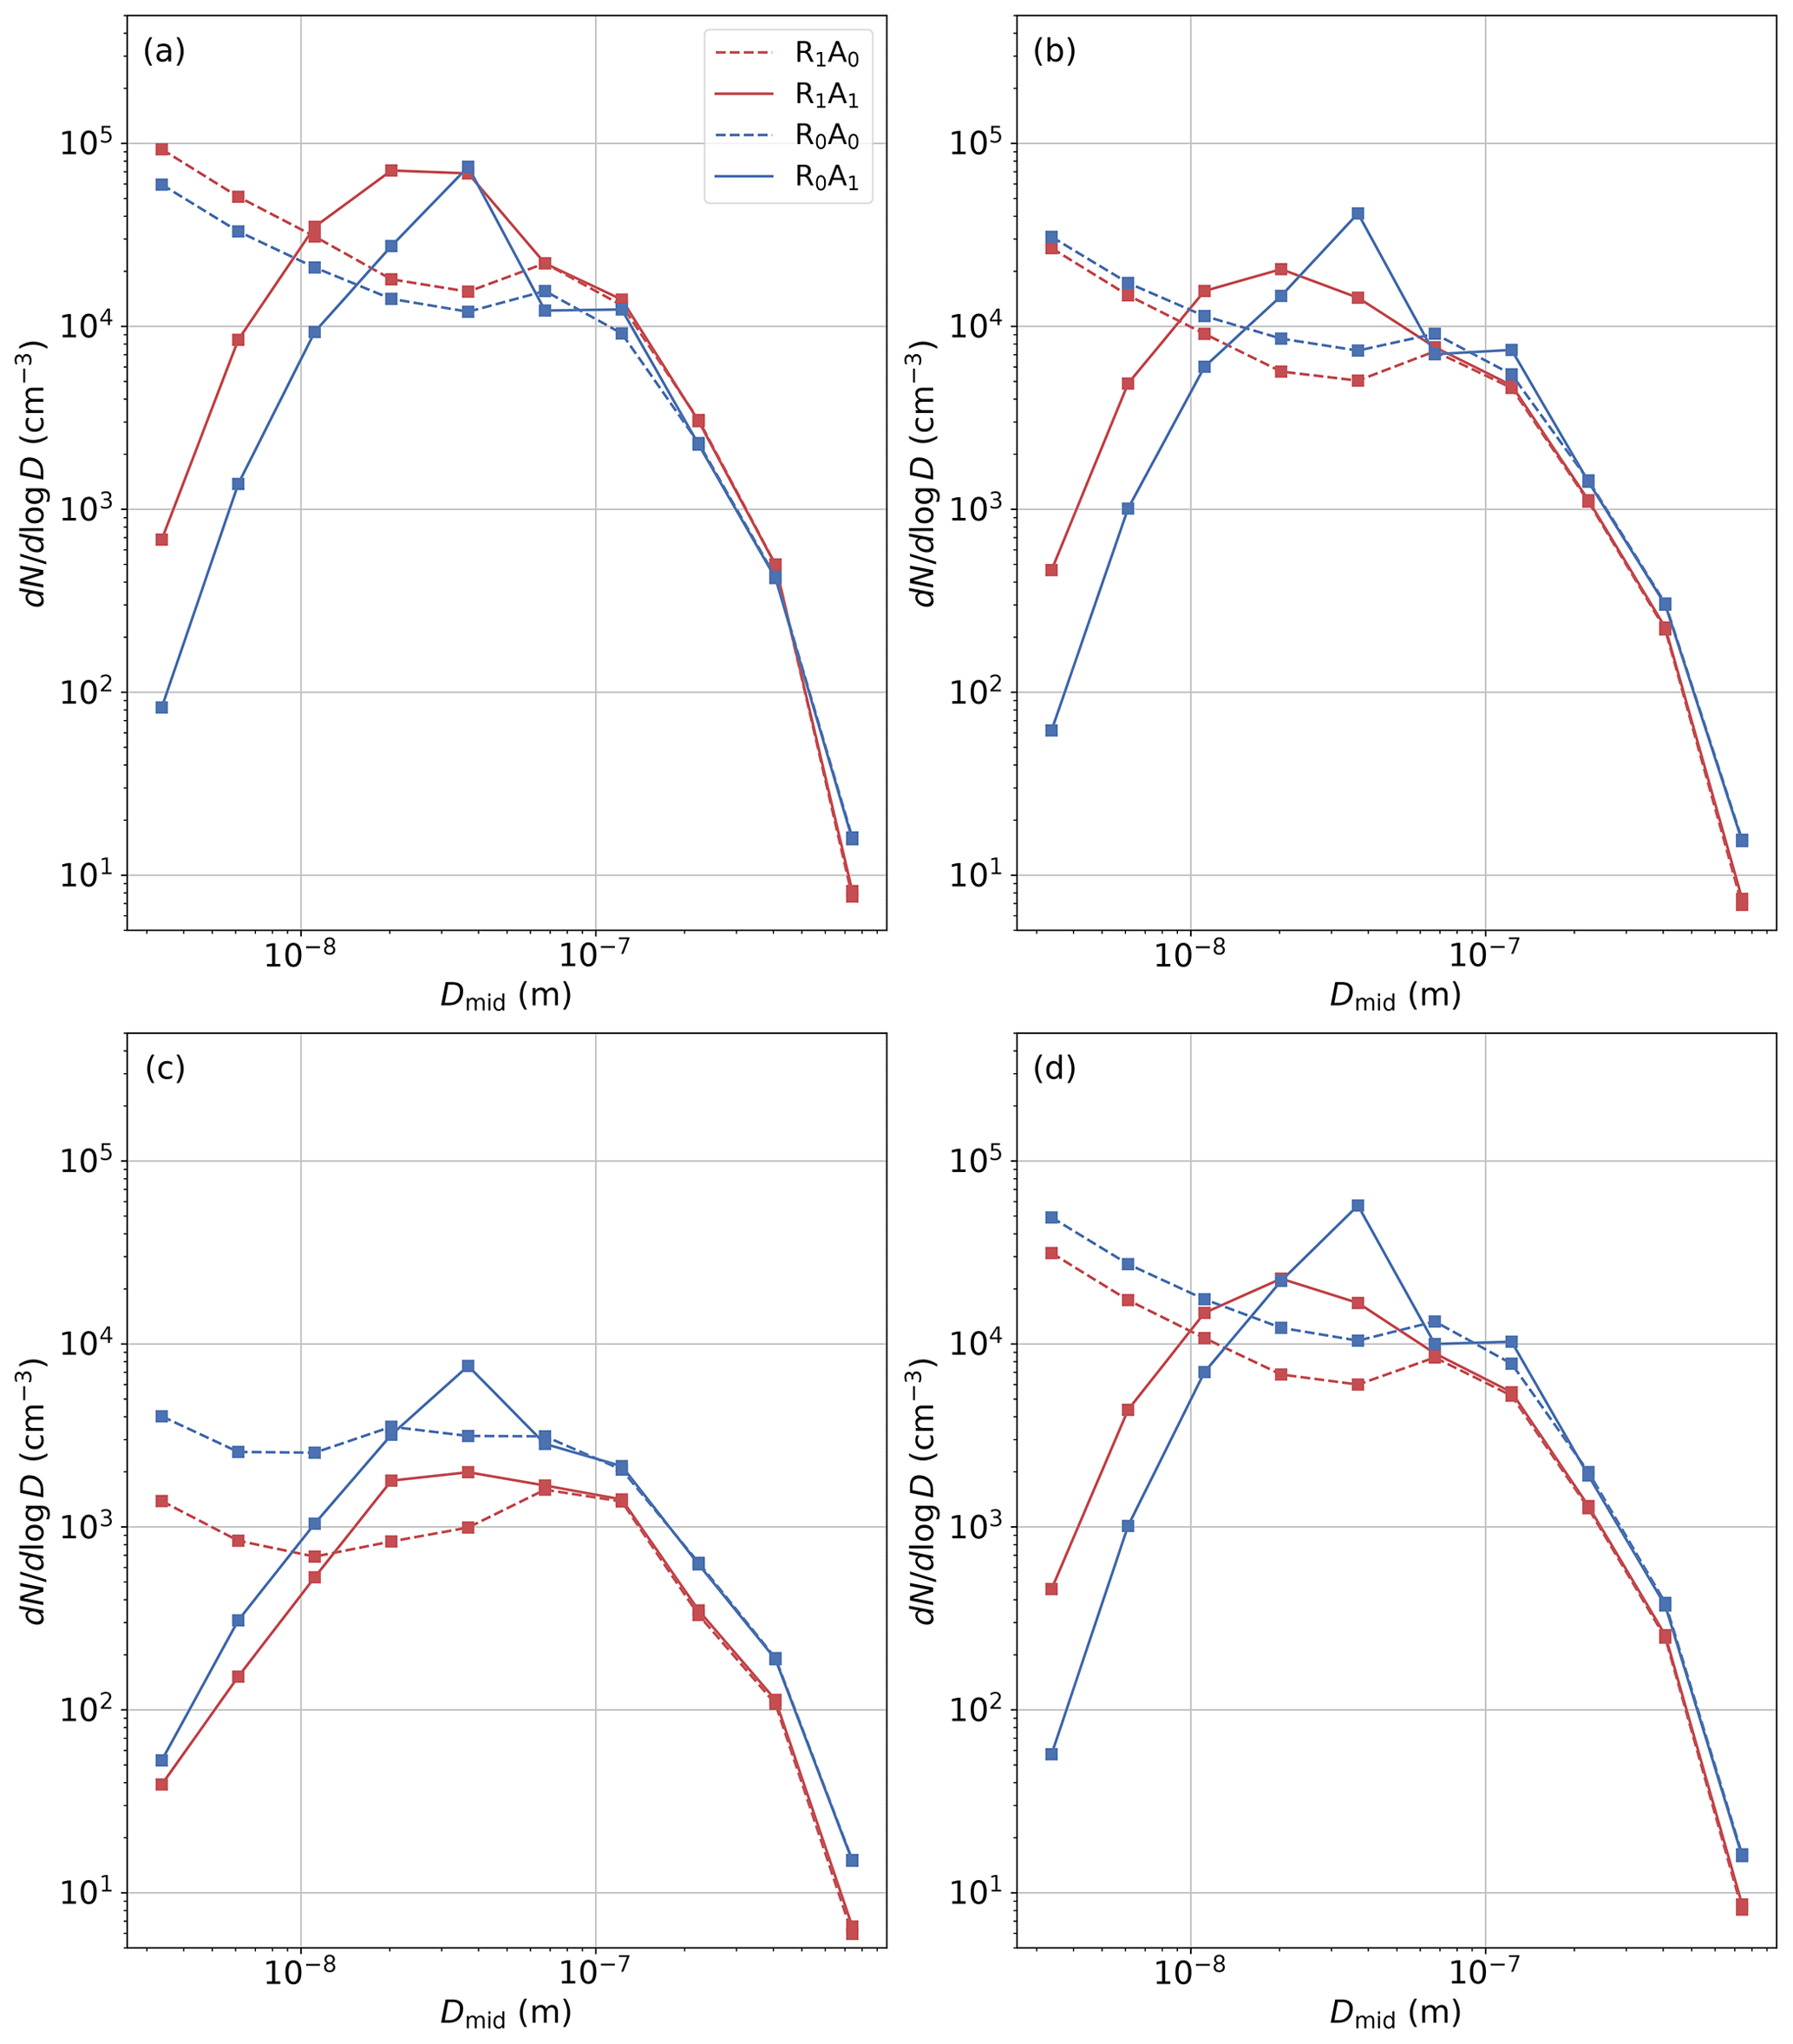
Figure 10The 4 m mean particle number size distributions for the supersite (SR1) (a), opposite supersite (SR2) (b), background (SR3) (c) and canyon average (d) for runs with radiation (R1A0 and R1A1) and without radiation (R0A0 and R0A1).
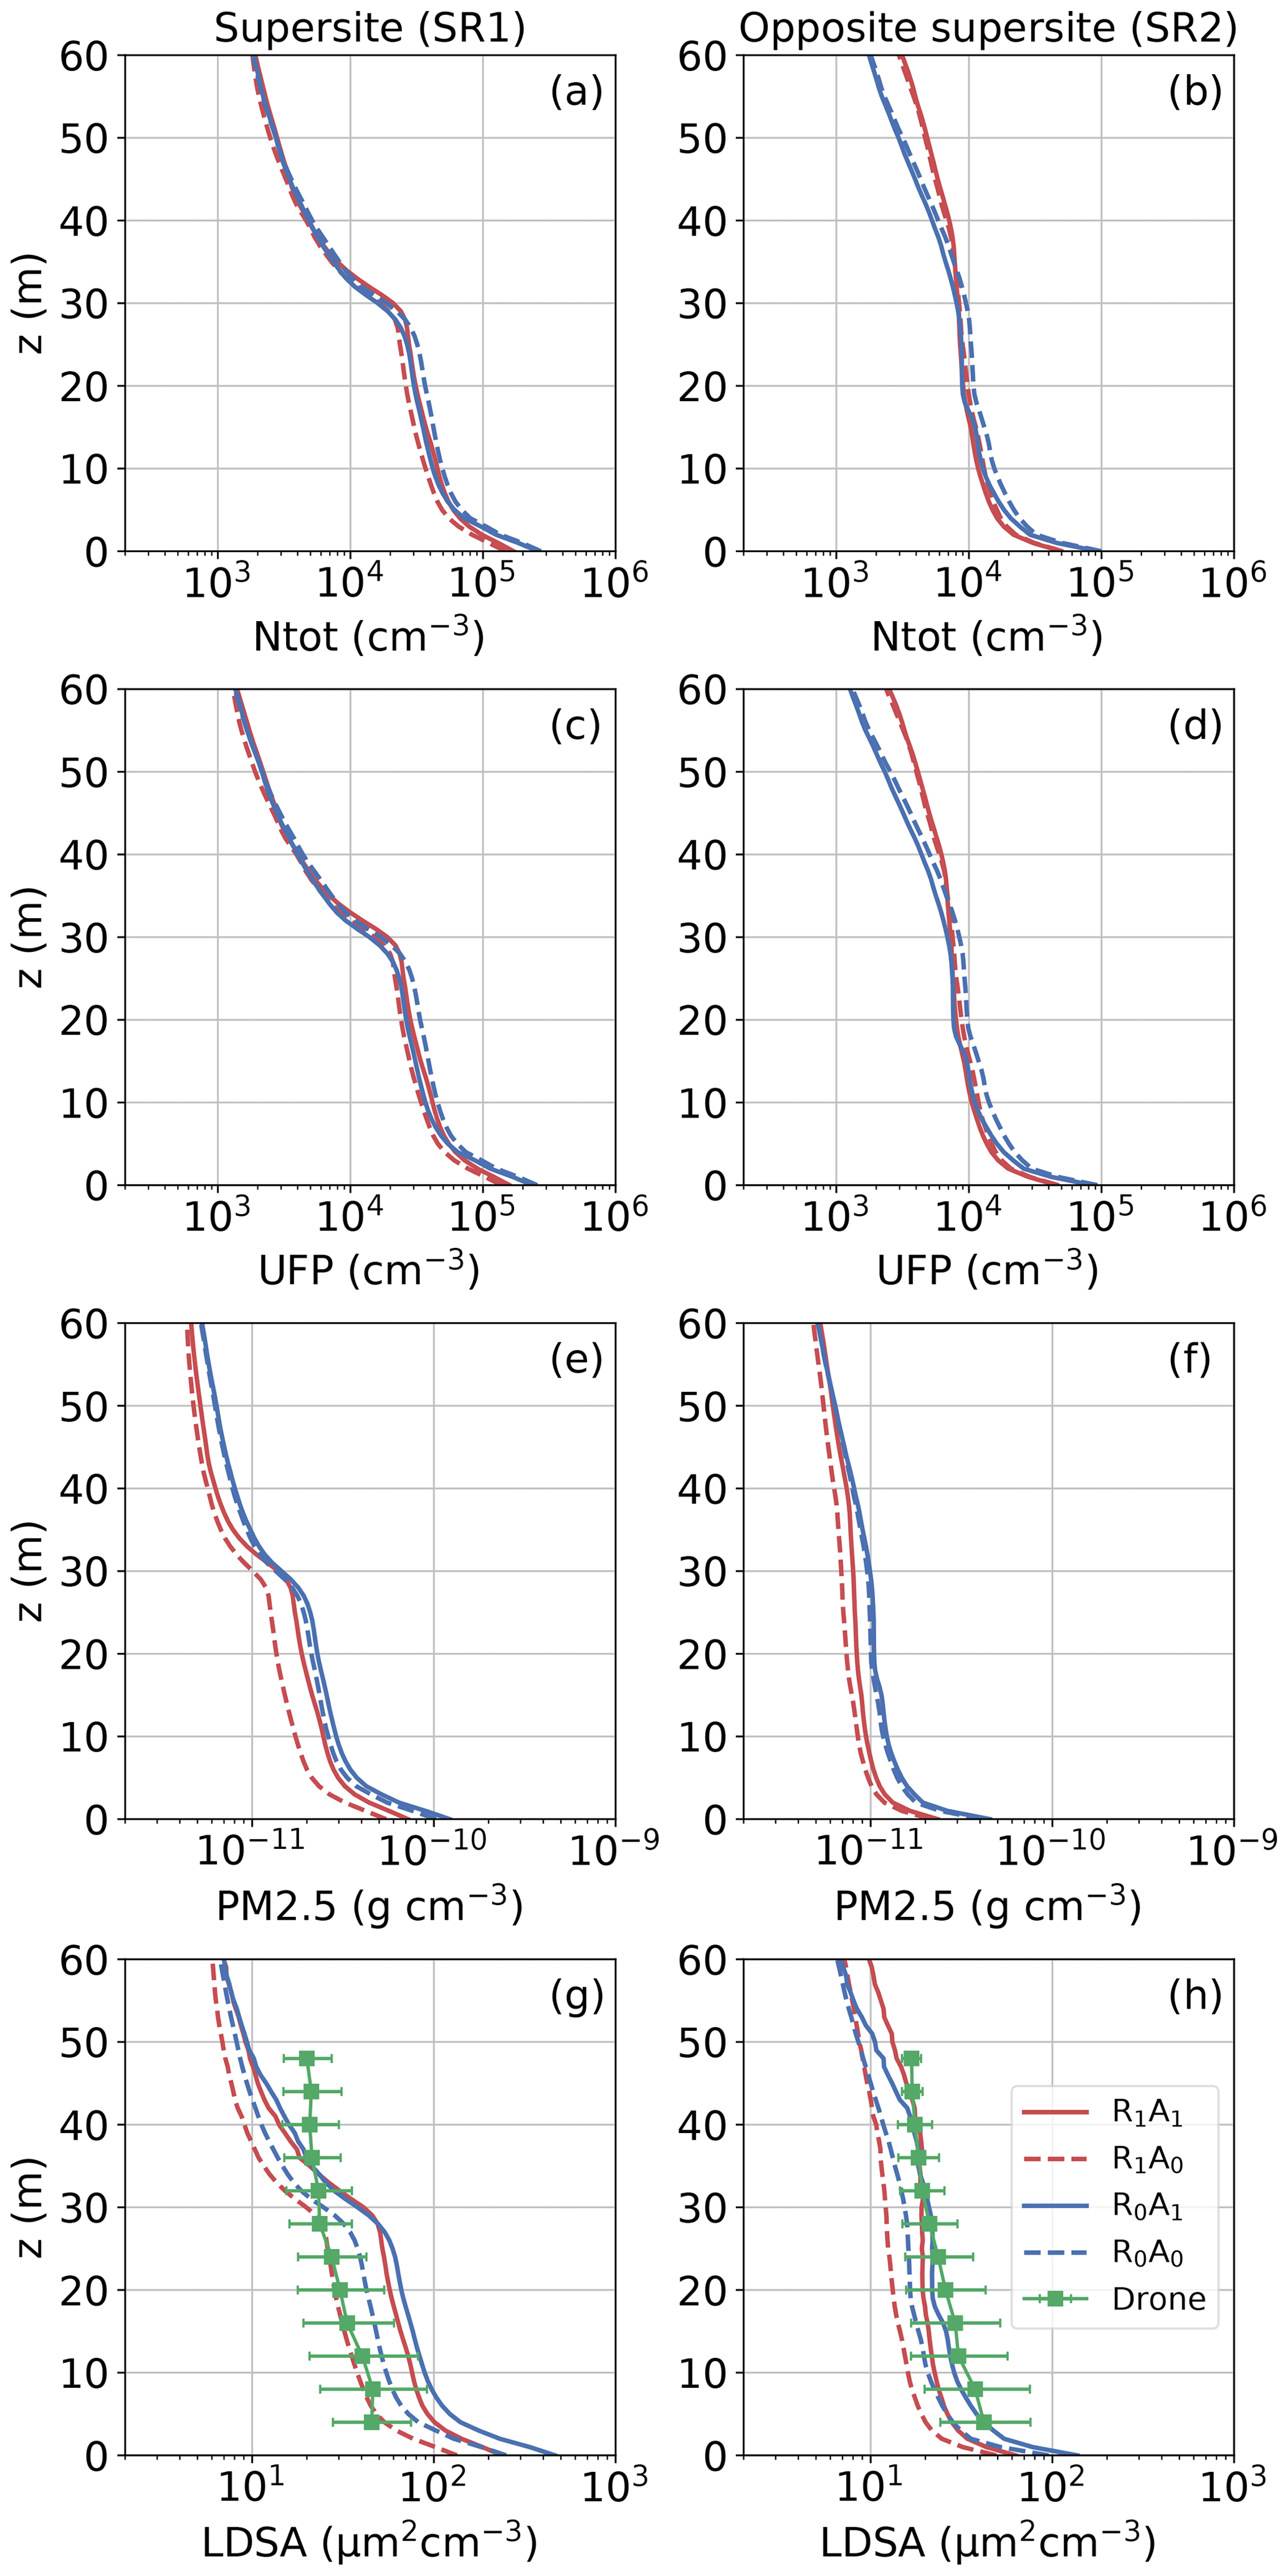
Figure 11The geometric mean vertical profiles of the total particle number concentration (Ntot) (a–b), number of ultrafine particles (UFPs) (c–d), particle mass below 2.5 µm (PM2.5) (e–f) and lung-deposited surface area (LDSA) of particles (g–h) at the supersite (a, c, e, g) and opposite the supersite (b, d, f, h).
3.5 Vertical profiles of pollutant concentrations
The vertical aerosol profiles from both sides of the main street canyon (statistical regions SR1 and SR2) are illustrated in Fig. 11 for the different aerosol metrics Ntot, UFP, PM2.5 and LDSA. When radiation interaction is included in the simulations (R1A0 and R1A1), the removal of particles from the canyon is evident in all aerosol metrics at SR1. Particularly the metrics representing larger particles (LDSA and PM2.5) decrease below the rooftop. A change in stratification from near neutral to unstable, and the resulting reduction in pollutant concentrations within street-level concentrations, has also been reported by previous studies. Nezis et al. (2011) mainly focused on structural flow field changes, whereas Mei et al. (2016) showed a decrease of 100 % at the leeward side of the street for a 0.5 canyon aspect ratio. Jiang and Yoshie (2018) focused on inflow and outflow rates between the canyon and the roof level. They observed low-pollutant-concentration air entering the canyon from the windward side and mixing with the polluted air, which, combined with the lifting on the leeward side, removes pollutants from the canyon. Above the rooftop the profiles of Ntot and UFP are similar between the runs, whereas PM2.5 and LDSA have more variability. Due to radiation interaction, PM2.5 decreases on both R1A0 and R1A1, whereas LDSA decreases only in the absence of aerosol processes. In SR2, there is a slight reduction in street canyon concentrations of Ntot and UFP but a larger increase above the canopy in runs with radiation interaction on R1A0 and R1A1. This suggests that the modified canyon circulation enhances the transport of smaller particles above the rooftops on the windward of the street canyon. A similar behaviour in concentrations increasing above the canopy due to the expanding canyon vortex was reported by Mei et al. (2016) in idealised simulations with unstable stratification and a similar aspect ratio (0.5) compared to our case (0.45). PM2.5 and LDSA have similar behaviour at SR2 to SR1 with PM2.5 systematically decreasing and LDSA decreasing with radiation interaction and increasing with aerosol processes. The transport towards the leeward side of the canyon is seen as higher concentrations at SR1 compared to SR2. Again the increase in the crossing-flow component in R1A0 and R1A1 resulting in the packing of the pollutants on the leeward side of the street canyon compared to R0A0 and R0A1 is visible.
Both at SR1 and SR2 are the aerosol processes more important (R0A1 and R1A1) for LDSA than for other aerosol metrics. Although the concentration of the smallest particles decreases, the increased concentration of particles larger than 20 nm due to aerosol processes is more important to LDSA (Kuula et al., 2020). Compared to the drone observations (Fig. 11g, h), SR1 shows the most agreement with R1A0 out of all the processes reducing LDSA at low levels but is greater than any model run above the canopy. This might indicate issues in the background forcing of the particles. At SR2 however, both R0A1 and R1A1 show better agreement with observations, which suggests that aerosol processes are more important on this side of the street canyon.
LES provides an optimal mean to examine flow and pollutant distributions in realistic urban areas, as it can account for complex interactions between the surface and the air flow, radiation interaction, and in some cases also aerosol particle dynamics such as in the LES model PALM used in this study. The main aims of this study are to examine the impact of aerosol dynamics and radiation interaction on different aerosol metrics in a real built-up neighbourhood in Helsinki. This was achieved using novel LES, which includes both aerosol processes and mixing conditions. The model performance was evaluated against near-surface temperature (T2 m) and total aerosol particle number concentrations (Ntot) measured by a mobile laboratory, as well as lung-deposited surface area (LDSA) measured by a drone. Four main runs to represent an early summer morning on 6 June 2017 between 07:00 and 09:15 UTC+3 were performed. In the base run (R0A0) neither radiation interaction nor aerosol processes were on. R1A0 only had radiation interaction on, R0A1 only had aerosol processes on, and finally R1A1 had both radiation interaction and aerosol processes on.
In a calm wind case, such as the simulated summer morning, inclusion of radiation interaction improved the model performance in simulating the near-surface temperatures within the study area. In the base run, T2 m was underestimated by on average 3.9 ∘C. In R1A1, T2 m was overestimated by 0.2 ∘C, being on average 12.4 ∘C. This change in temperatures and radiation provide energy for flow, and the 4 m wind speeds increased on average from 0.29 to 0.55 m s−1 within the study area.
Changes in flow increased ventilation and decreased particle concentrations close to the ground. The 4 m Ntot was reduced by 53 % with radiation interaction included (R1A0). The inclusion of radiation interaction in LES is more important than adding the aerosol process which decreased the 4 m Ntot concentrations by 18 % (R0A1). Together, with both the aerosol processes and the radiation interaction included, the concentrations decreased by 56 %. Compared to observations at the 2 m modelling height, the near-surface particle number concentration bias was reduced from a 98 % overestimation (R0A0) to a 16 % underestimation (R1A1). The bias is particularly reduced by inclusion of radiation interaction in the model runs.
Aerosol processes and their response to changes in flow altered the size distribution of particles. The size distribution in R0A1 and R1A1 showed larger particle sizes dominating, whereas in R0A0 and R1A0, the fraction of particles between 4–15 nm in diameter increased significantly due to the absence of processes such as deposition, coagulation and condensation. Radiation interaction and the enhanced flow field had a larger impact on the size distribution at the supersite, where the concentrations of all size bins increased by up to 8.2 times with R1A1 compared to R0A1 at the pedestrian level. Overall radiation interaction had the largest effect on medium to small particle size ranges at this height.
The change in stratification also affected the aerosol vertical profiles. All aerosol concentrations decrease in the street canyon when radiation interaction is considered, the effect being larger for PM2.5 and LDSA on both sides of the canyon. Above the canopy Ntot and UFP increase at the windward side of the canyon due to the modified street canyon vortex by radiation interaction. The supersite shows higher concentrations overall compared to the opposite side due to the leeward transport described before. Aerosol processes have a larger effect on the vertical profiles of PM2.5 and LDSA than Ntot and UFP, with the effect being particularly pronounced in LDSA. When taking into account both sides of the main canyon, R1A0 performs the best in terms of LDSA, as the change in flow alone is enough to bring LDSA closer to observations.
The results show that radiation interaction is more important to be considered in LES than aerosol processes when simulating pollutant distributions within an urban neighbourhood in low-wind conditions. Without radiation interaction, near-surface air temperature and flow are underestimated and pollutant concentrations overestimated. Aerosol processes are however critical when aerosol particle size distributions, particularly the smallest size ranges, or vertical profiles of larger particles are examined. In our simulations with weak prevailing wind speed, the impact of radiation interaction on reducing the street-level concentrations can be greater than with stronger wind speeds. On the other hand, we simulated the early morning when the radiative effects are not the strongest. In the future more meteorological conditions with varying wind speed and direction scenarios and time of day should be made to understand the effect of radiation interaction and aerosol processes in detail.
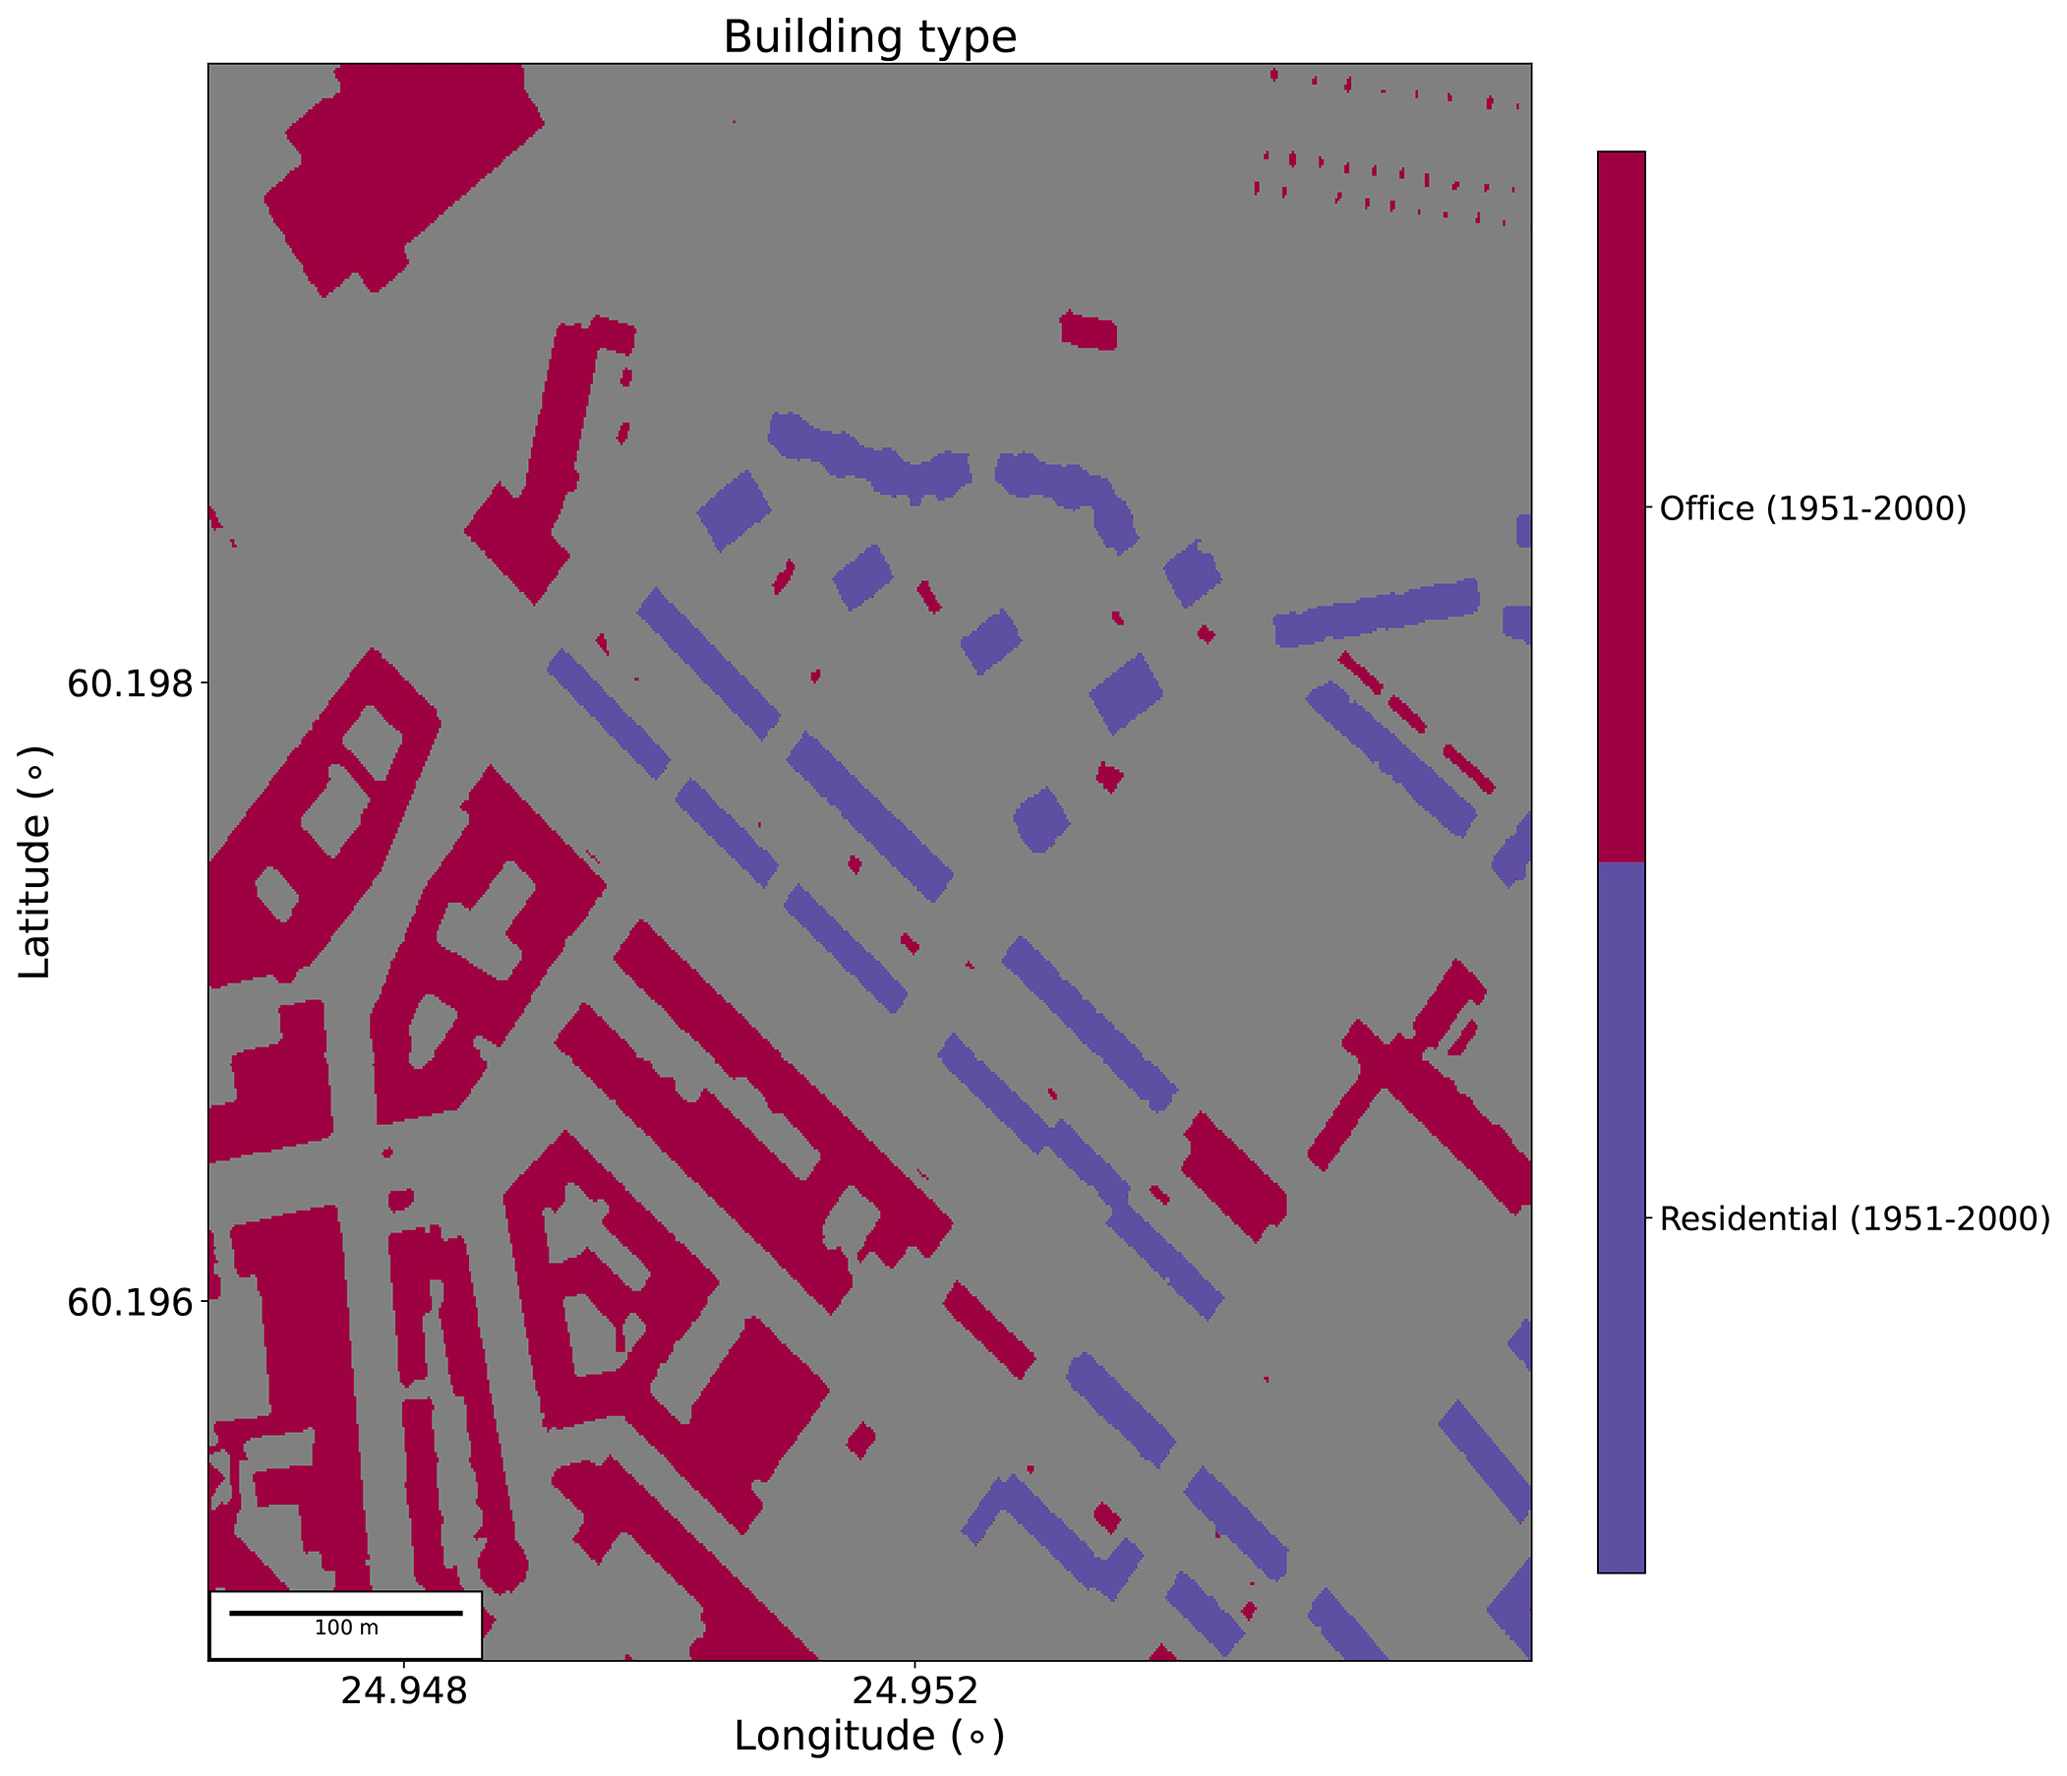
Figure A1Building surface types in the child domain.
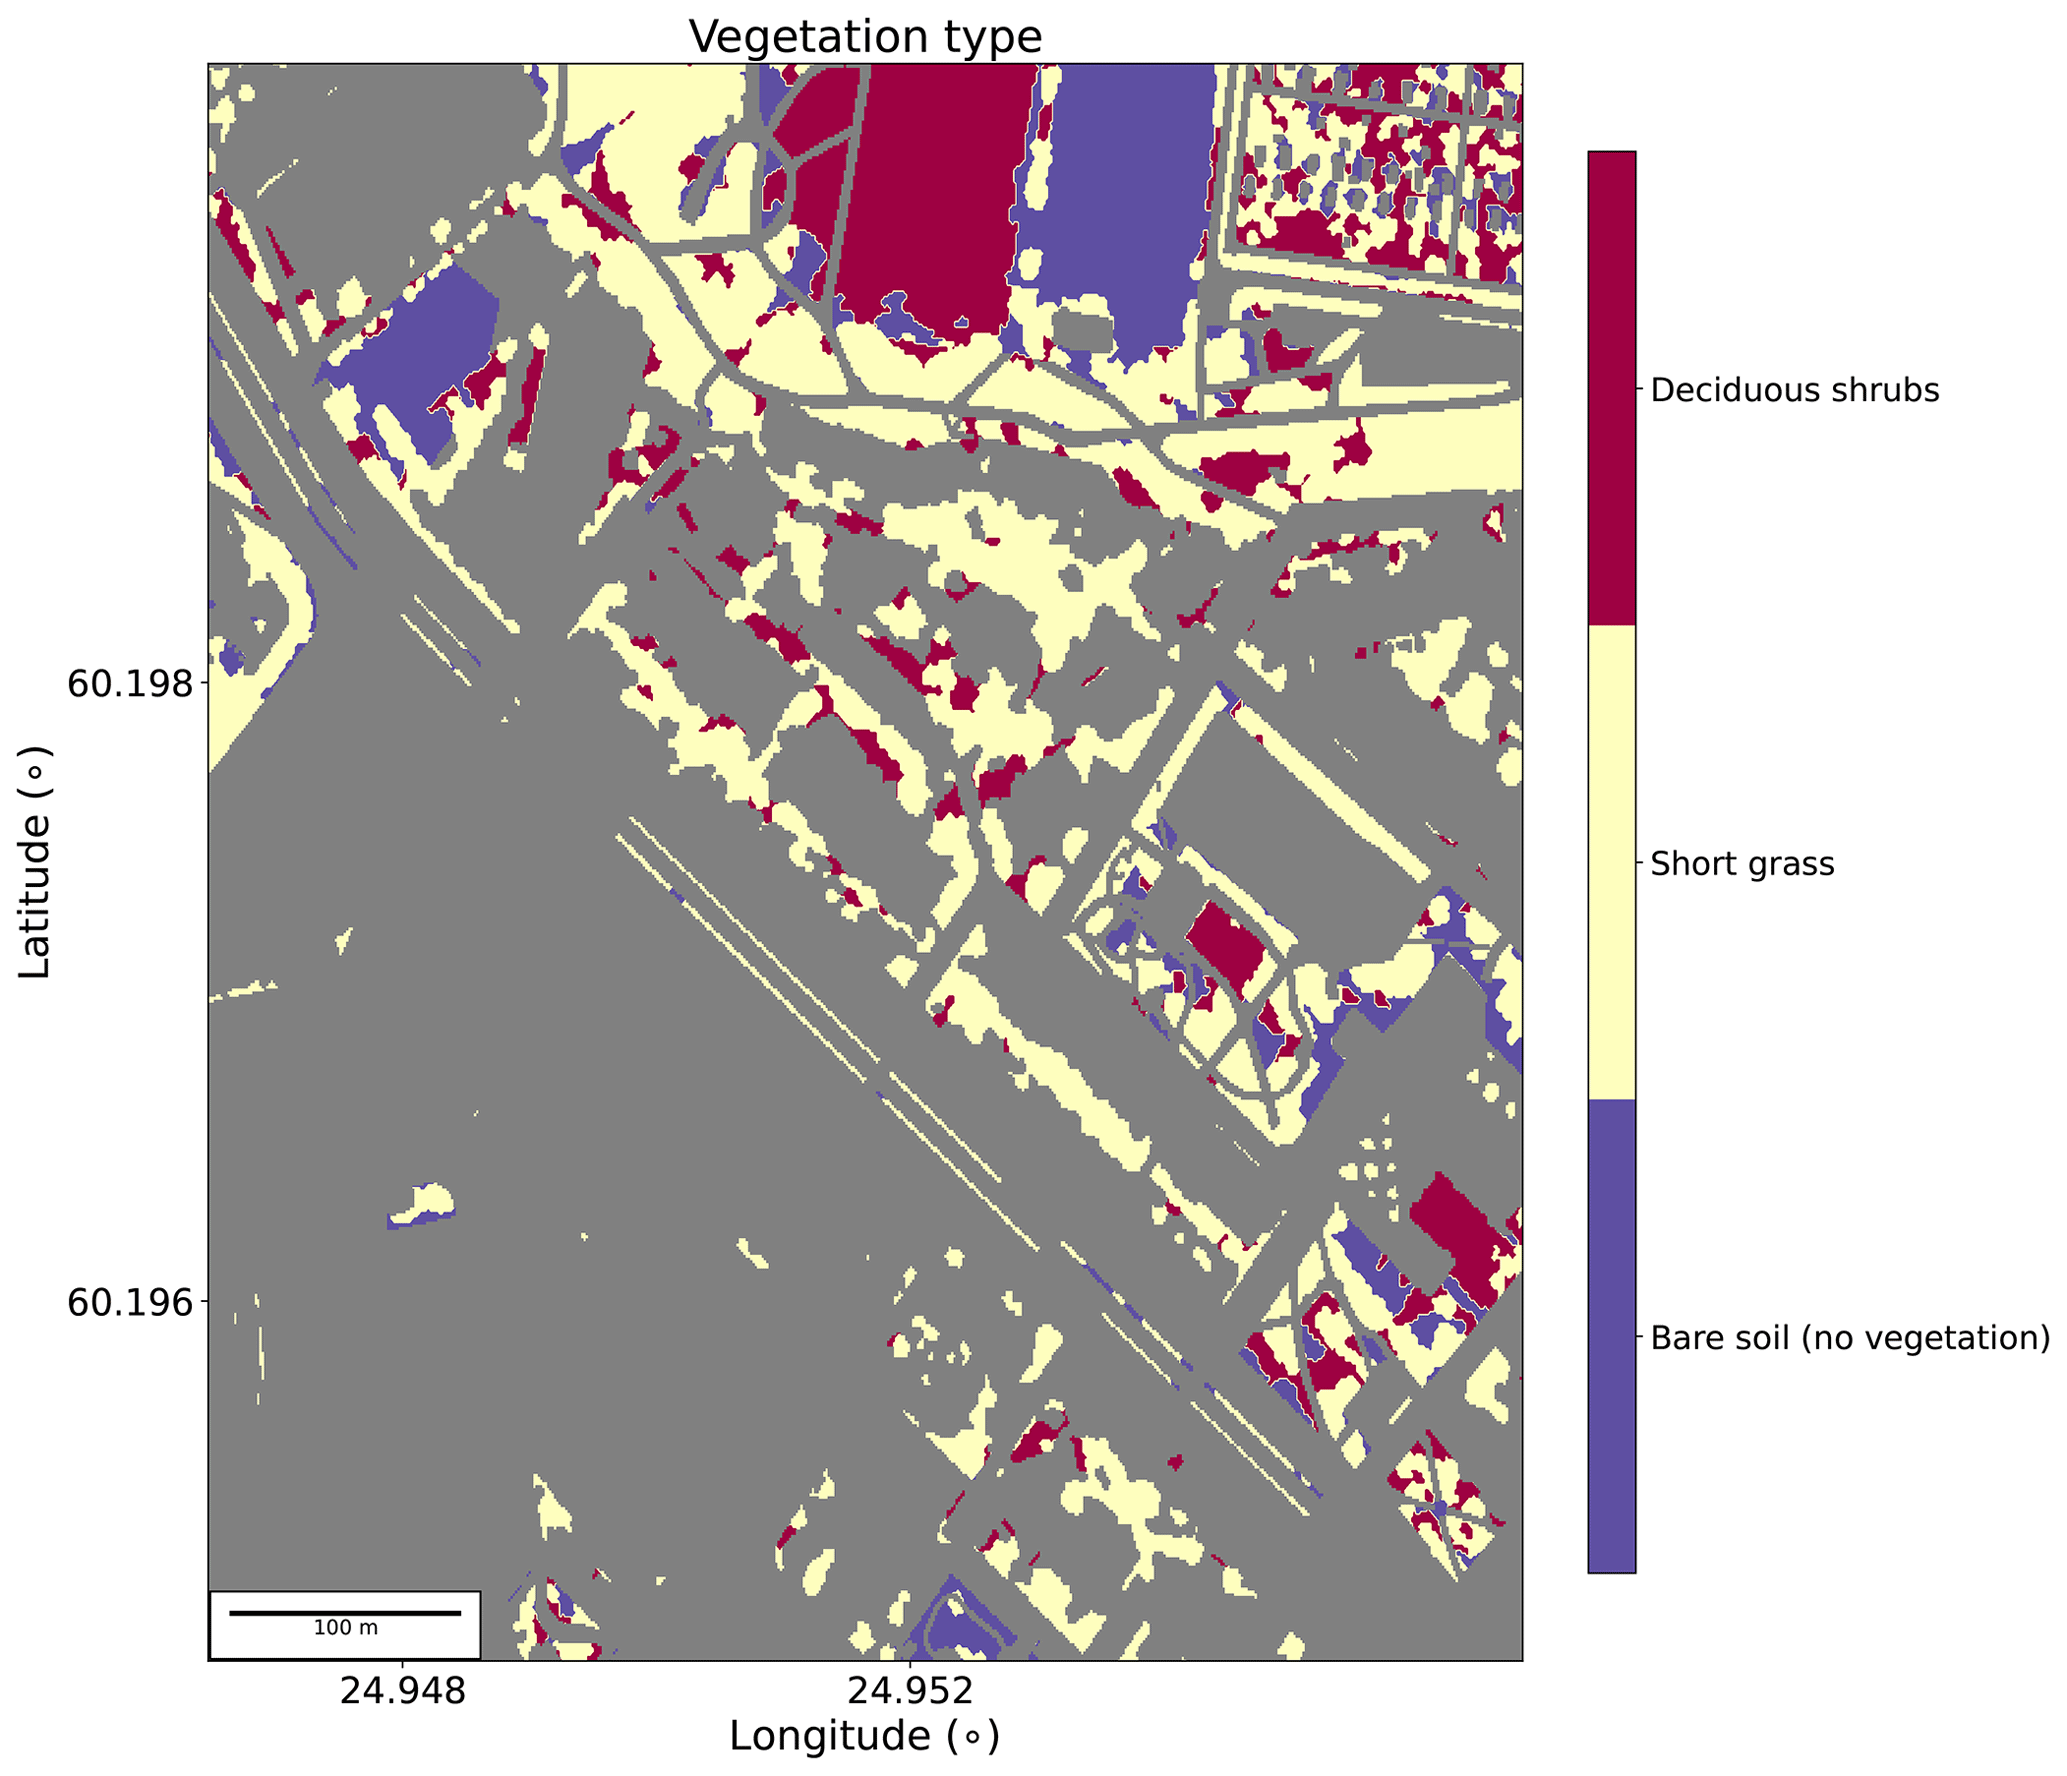
Figure A2Vegetation surface types in the child domain.
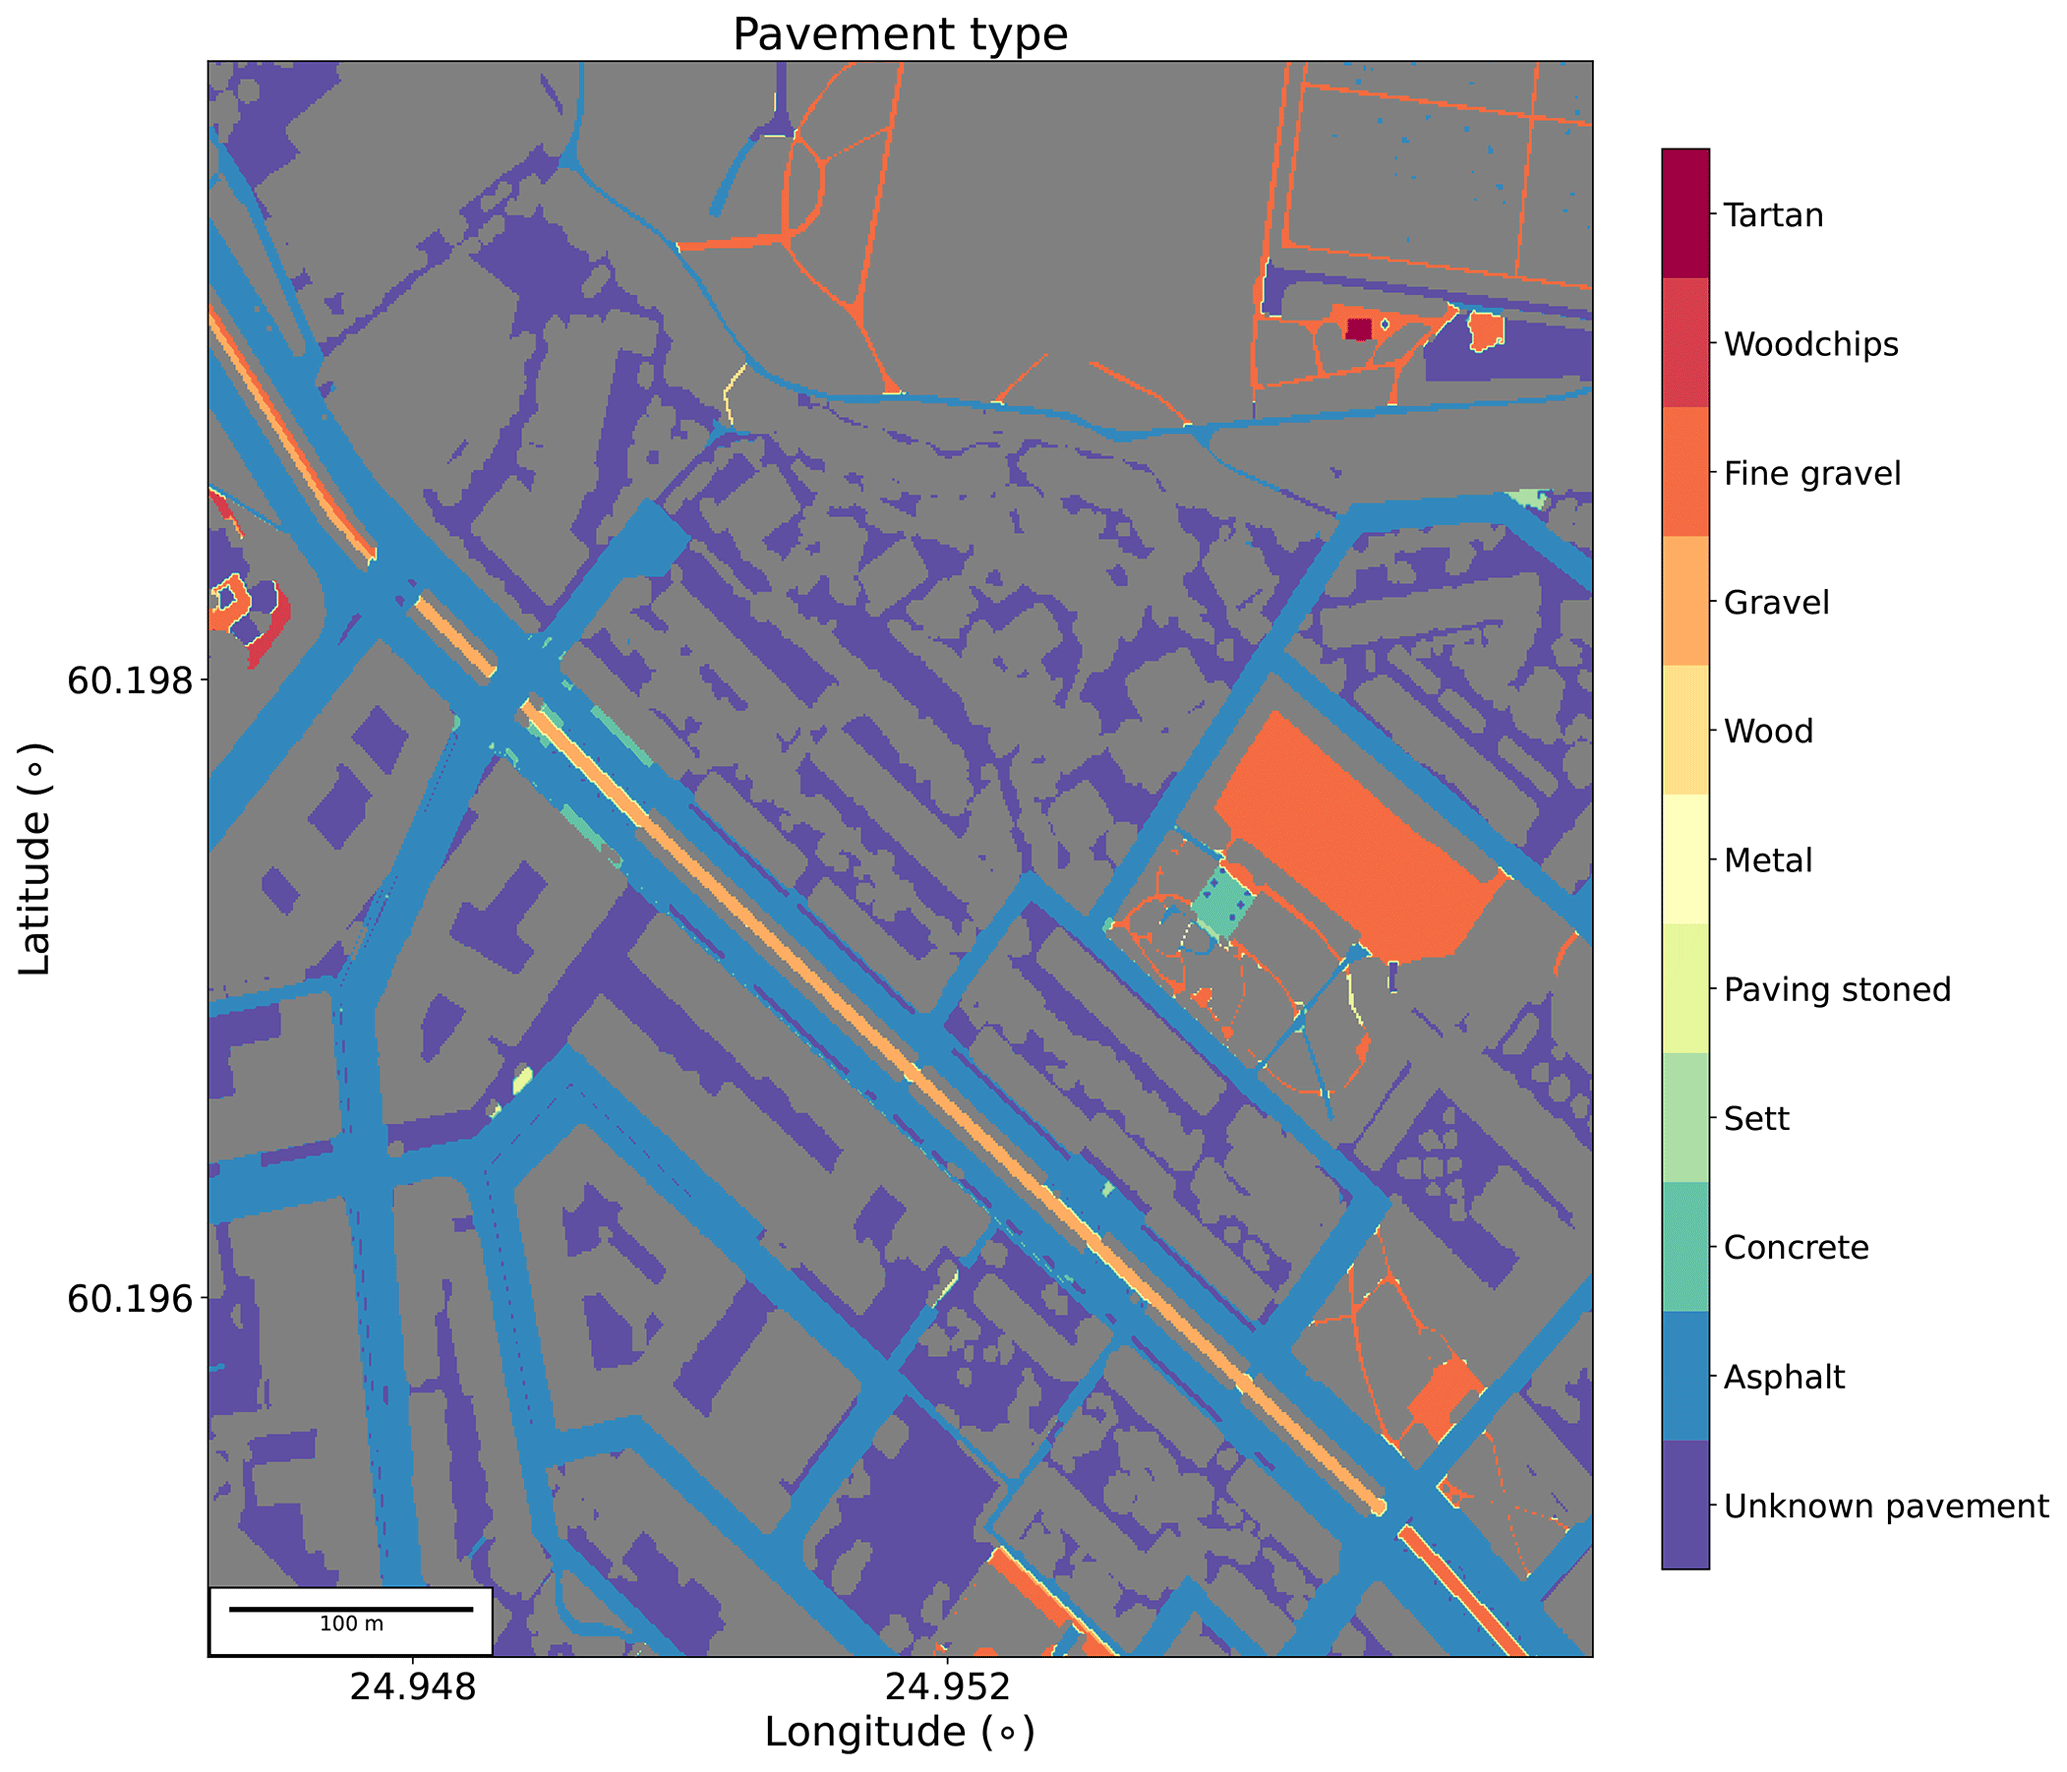
Figure A3Pavement surface types in the child domain.
This paper uses input data and analysis scripts available from https://doi.org/10.5281/zenodo.7115705 (Strömberg and Kurppa, 2022), https://doi.org/10.5281/zenodo.3839684 (Strömberg and Kurppa, 2020) and https://doi.org/10.5281/zenodo.8112867 (Strömberg and Kurppa, 2023). Model source code is available from https://doi.org/10.5281/zenodo.8113087 (PALM model system development team, 2020).
LJ, HK and LP planned and conducted the measurements. LJ, MK and JS planned the simulation setup. JS conducted the simulations. MK and JS wrote the code to analyse the data. JS, LJ and XL wrote the paper with input from all authors. MK, LP and HK commented on the paper. LJ supervised the project.
The contact author has declared that none of the authors has any competing interests.
Publisher’s note: Copernicus Publications remains neutral with regard to jurisdictional claims in published maps and institutional affiliations.
We thank the Helsinki metropolitan region Urban Research programme, the Academy of Finland (CousCOUS project, decision numbers: 332177 and 332178), the Academy of Finland ACCC Flagship (decision numbers: 337549, 337552 and 337551) and the CITYZER project funded by Tekes and Finnish companies (decision number: 2883/31/2015). This project has also received funding from the European Union’s Horizon 2020 research and innovation programme under grant agreement nos. 101036245 (project RI-URBANS) and 101037319 (project PAUL). The authors are very grateful to Aleksi Malinen and Sami Kulovuori from the Metropolia University of Applied Sciences for the operation of the mobile laboratory Sniffer and to Aeromon Oy for conducting the drone measurements.
This research has been supported by Tekes (grant no. 2883/31/2015), Horizon 2020 (grant nos. 101036245 and 101037319) and the Academy of Finland (grant nos. 332177, 332178, 337549, 337551 and 337552).
Open-access funding was provided by the Helsinki University Library.
This paper was edited by Yun Qian and reviewed by three anonymous referees.
Bengtsson, L., Andrae, U., Aspelien, T., Batrak, Y., Calvo, J., de Rooy, W., Gleeson, E., Hansen-Sass, B., Homleid, M., Hortal, M., Ivarsson, K.-I., Lenderink, G., Niemelä, S., Nielsen, K. P., Onvlee, J., Rontu, L., Samuelsson, P., Muñoz, D. S., Subias, A., Tijm, S., Toll, V., Yang, X., and Øegaard Køltzow, M.: The HARMONIE–AROME Model Configuration in the ALADIN–HIRLAM NWP System, Mon. Weather Rev., 145, 1919–1935, https://doi.org/10.1175/MWR-D-16-0417.1, 2017. a
Bottillo, S., De Lieto Vollaro, A., Galli, G., and Vallati, A.: CFD modeling of the impact of solar radiation in a tridimensional urban canyon at different wind conditions, Sol. Energy, 102, 212–222, https://doi.org/10.1016/j.solener.2014.01.029, 2014. a, b
Branford, S., Coceal, O., Thomas, T. G., and Belcher, S. E.: Dispersion of a Point-Source Release of a Passive Scalar Through an Urban-Like Array for Different Wind Directions, Bound.-Lay. Meteorol., 139, 367–394, https://doi.org/10.1007/s10546-011-9589-1, 2011. a
Buccolieri, R., Salim, S. M., Leo, L. S., Di Sabatino, S., Chan, A., Ielpo, P., de Gennaro, G., and Gromke, C.: Analysis of local scale tree–atmosphere interaction on pollutant concentration in idealized street canyons and application to a real urban junction, Atmos. Environ., 45, 1702–1713, https://doi.org/10.1016/j.atmosenv.2010.12.058, 2011. a
Cai, X.: Effects of differential wall heating in street canyons on dispersion and ventilation characteristics of a passive scalar, Atmos. Environ., 51, 268–277, https://doi.org/10.1016/j.atmosenv.2012.01.010, 2012. a
Chen, G., Yang, X., Yang, H., Hang, J., Lin, Y., Wang, X., Wang, Q., and Liu, Y.: The influence of aspect ratios and solar heating on flow and ventilation in 2D street canyons by scaled outdoor experiments, Build. Environ., 185, 107–159, https://doi.org/10.1016/j.buildenv.2020.107159, 2020. a
Cheng, W. C. and Liu, C.-H.: Large-eddy simulation of turbulent transports in urban street canyons in different thermal stabilities, J. Wind Eng. Ind. Aerod., 99, 434–442, https://doi.org/10.1016/j.jweia.2010.12.009, 2011. a
Crameri, F.: Scientific colour maps (7.0.1), Zenodo [data set], https://doi.org/10.5281/zenodo.5501399, 2021. a
Dal Maso, M., Liao, L., Wildt, J., Kiendler-Scharr, A., Kleist, E., Tillmann, R., Sipilä, M., Hakala, J., Lehtipalo, K., Ehn, M., Kerminen, V.-M., Kulmala, M., Worsnop, D., and Mentel, T.: A chamber study of the influence of boreal BVOC emissions and sulfuric acid on nanoparticle formation rates at ambient concentrations, Atmos. Chem. Phys., 16, 1955–1970, https://doi.org/10.5194/acp-16-1955-2016, 2016. a, b
Dimitrova, R., Sini, J.-F., Richards, K., Schatzmann, M., Weeks, M., Perez García, E., and Borrego, C.: Influence of Thermal Effects on the Wind Field Within the Urban Environment, Bound.-Lay. Meteorol., 131, 223–243, https://doi.org/10.1007/s10546-009-9368-4, 2009. a
FMI: Finnish Meteorological Institute open data, https://www.ilmatieteenlaitos.fi/havaintojen-lataus (last access: 5 March 2021), 2017. a
Fröhlich-Nowoisky, J., Kampf, C. J., Weber, B., Huffman, J. A., Pöhlker, C., Andreae, M. O., Lang-Yona, N., Burrows, S. M., Gunthe, S. S., Elbert, W., Su, H., Hoor, P., Thines, E., Hoffmann, T., Després, V. R., and Pöschl, U.: Bioaerosols in the Earth system: Climate, health, and ecosystem interactions, Atmos. Res., 182, 346–376, https://doi.org/10.1016/j.atmosres.2016.07.018, 2016. a
García-Sánchez, C., van Beeck, J., and Gorlé, C.: Predictive large eddy simulations for urban flows: Challenges and opportunities, Build. Environ., 139, 146–156, https://doi.org/10.1016/j.buildenv.2018.05.007, 2018. a
Gehrke, K. F., Sühring, M., and Maronga, B.: Modeling of land–surface interactions in the PALM model system 6.0: land surface model description, first evaluation, and sensitivity to model parameters, Geosci. Model Dev., 14, 5307–5329, https://doi.org/10.5194/gmd-14-5307-2021, 2021. a, b, c
Gousseau, P., Blocken, B., Stathopoulos, T., and van Heijst, G.: CFD simulation of near-field pollutant dispersion on a high-resolution grid: A case study by LES and RANS for a building group in downtown Montreal, Atmos. Environ., 45, 428–438, https://doi.org/10.1016/j.atmosenv.2010.09.065, 2011. a
GTK: Maaperä: Karttatasot WFS-rajapinnassa – Geological Survey of Finland, https://www.gtk.fi/palvelut/aineistot-ja-verkkopalvelut/rajapintapalvelut/maapera-karttatasot-wfs-rajapinnassa/ (last access: 28 August 2020), 2018. a
Guo, D., Zhao, P., Wang, R., Yao, R., and Hu, J.: Numerical simulations of the flow field and pollutant dispersion in an idealized urban area under different atmospheric stability conditions, Process Saf. Environ., 136, 310–323, https://doi.org/10.1016/j.psep.2020.01.031, 2020. a
Hellsten, A., Ketelsen, K., Sühring, M., Auvinen, M., Maronga, B., Knigge, C., Barmpas, F., Tsegas, G., Moussiopoulos, N., and Raasch, S.: A nested multi-scale system implemented in the large-eddy simulation model PALM model system 6.0, Geosci. Model Dev., 14, 3185–3214, https://doi.org/10.5194/gmd-14-3185-2021, 2021. a
HRI: Helsingin rakennukset – Helsinki Region Infoshare, https://hri.fi/data/dataset/helsingin-rakennukset (last access: 28 August 2020), 2018. a
Jiang, G. and Yoshie, R.: Large-eddy simulation of flow and pollutant dispersion in a 3D urban street model located in an unstable boundary layer, Build. Environ., 142, 47–57, https://doi.org/10.1016/j.buildenv.2018.06.015, 2018. a, b, c
Järvi, L., Kuuluvainen, H., Rönkkö, T., Karttunen, S., Balling, A., Timonen, H., Niemi, J. V., and Pirjola, L.: Determinants of spatial variability of air pollutant concentrations in a street canyon network measured using a mobile laboratory and a drone, Sci. Total Environ., 856, 158–974, https://doi.org/10.1016/j.scitotenv.2022.158974, 2023. a, b, c
Karttunen, S., Kurppa, M., Auvinen, M., Hellsten, A., and Järvi, L.: Large-eddy simulation of the optimal street-tree layout for pedestrian-level aerosol particle concentrations – A case study from a city-boulevard, Atmos. Environ. X, 6, 100 073, https://doi.org/10.1016/j.aeaoa.2020.100073, 2020. a, b, c, d
Kokkola, H., Korhonen, H., Lehtinen, K. E. J., Makkonen, R., Asmi, A., Järvenoja, S., Anttila, T., Partanen, A.-I., Kulmala, M., Järvinen, H., Laaksonen, A., and Kerminen, V.-M.: SALSA – a Sectional Aerosol module for Large Scale Applications, Atmos. Chem. Phys., 8, 2469–2483, https://doi.org/10.5194/acp-8-2469-2008, 2008. a
Kokkola, H., Kühn, T., Laakso, A., Bergman, T., Lehtinen, K. E. J., Mielonen, T., Arola, A., Stadtler, S., Korhonen, H., Ferrachat, S., Lohmann, U., Neubauer, D., Tegen, I., Siegenthaler-Le Drian, C., Schultz, M. G., Bey, I., Stier, P., Daskalakis, N., Heald, C. L., and Romakkaniemi, S.: SALSA2.0: The sectional aerosol module of the aerosol–chemistry–climate model ECHAM6.3.0-HAM2.3-MOZ1.0, Geosci. Model Dev., 11, 3833–3863, https://doi.org/10.5194/gmd-11-3833-2018, 2018. a
Krč, P., Resler, J., Sühring, M., Schubert, S., Salim, M. H., and Fuka, V.: Radiative Transfer Model 3.0 integrated into the PALM model system 6.0, Geosci. Model Dev., 14, 3095–3120, https://doi.org/10.5194/gmd-14-3095-2021, 2021. a, b, c, d, e
Kurppa, M., Hellsten, A., Roldin, P., Kokkola, H., Tonttila, J., Auvinen, M., Kent, C., Kumar, P., Maronga, B., and Järvi, L.: Implementation of the sectional aerosol module SALSA2.0 into the PALM model system 6.0: model development and first evaluation, Geosci. Model Dev., 12, 1403–1422, https://doi.org/10.5194/gmd-12-1403-2019, 2019. a, b, c, d, e
Kurppa, M., Roldin, P., Strömberg, J., Balling, A., Karttunen, S., Kuuluvainen, H., Niemi, J. V., Pirjola, L., Rönkkö, T., Timonen, H., Hellsten, A., and Järvi, L.: Sensitivity of spatial aerosol particle distributions to the boundary conditions in the PALM model system 6.0, Geosci. Model Dev., 13, 5663–5685, https://doi.org/10.5194/gmd-13-5663-2020, 2020. a, b, c, d, e, f, g, h, i, j, k
Kuula, J., Kuuluvainen, H., Niemi, J. V., Saukko, E., Portin, H., Kousa, A., Aurela, M., Rönkkö, T., and Timonen, H.: Long-term sensor measurements of lung deposited surface area of particulate matter emitted from local vehicular and residential wood combustion sources, Aerosol Sci. Tech., 54, 190–202, https://doi.org/10.1080/02786826.2019.1668909, 2020. a
Kuuluvainen, H., Poikkimäki,, M., Järvinen,, A., Kuula, J., Irjala, M., Dal Maso, M., Keskinen, J., Timonen, H., Niemi, J. V., and Rönkkö, T.: Vertical profiles of lung deposited surface area concentration of particulate matter measured with a drone in a street canyon, Environ. Pollut., 241, 96–105, https://doi.org/10.1016/j.envpol.2018.04.100, 2018. a
Kwak, K.-H., Baik, J.-J., Ryu, Y.-H., and Lee, S.-H.: Urban air quality simulation in a high-rise building area using a CFD model coupled with mesoscale meteorological and chemistry-transport models, Atmos. Environ., 100, 167–177, https://doi.org/10.1016/j.atmosenv.2014.10.059, 2015. a
Lelieveld, J., Evans, J. S., Fnais, M., Giannadaki, D., and Pozzer, A.: The contribution of outdoor air pollution sources to premature mortality on a global scale, Nature, 525, 367–371, https://doi.org/10.1038/nature15371, 2015. a
Lelieveld, J., Klingmüller,, K., Pozzer, A., Pöchl, U., Fnais, M., Daiber, A., and Münzel, T.: Cardiovascular disease burden from ambient air pollution in Europe reassessed using novel hazard ratio functions, Eur. Heart J., 40, 1590–1596, https://doi.org/10.1093/eurheartj/ehz135, 2019. a
Letzel, M. O., Helmke, C., Ng, E., An, X., Lai, A., and Raasch, S.: LES case study on pedestrian level ventilation in two neighbourhoods in Hong Kong, Meteorol. Z., 21, 575–589, https://doi.org/10.1127/0941-2948/2012/0356, 2012. a
Li, X.-X., Britter, R. E., Koh, T. Y., Norford, L. K., Liu, C.-H., Entekhabi, D., and Leung, D. Y. C.: Large-Eddy Simulation of Flow and Pollutant Transport in Urban Street Canyons with Ground Heating, Bound.-Lay. Meteorol., 137, 187–204, https://doi.org/10.1007/s10546-010-9534-8, 2010. a
Li, X.-X., Britter, R. E., Norford, L. K., Koh, T.-Y., and Entekhabi, D.: Flow and Pollutant Transport in Urban Street Canyons of Different Aspect Ratios with Ground Heating: Large-Eddy Simulation, Bound.-Lay. Meteorol., 142, 289–304, https://doi.org/10.1007/s10546-011-9670-9, 2012. a, b
Li, X.-X., Britter, R. E., and Norford, L. K.: Transport processes in and above two-dimensional urban street canyons under different stratification conditions: results from numerical simulation, ENVIRONMENTAL FLUID MECHANICS, 1st Symposium on Urban Fluid Mechanics (UFM), ASME Conf, Chicago, IL, AUG, 2014, 3–7 August 2014, 15, 399–417, https://doi.org/10.1007/s10652-014-9347-2, 2015. a
Maronga, B., Banzhaf, S., Burmeister, C., Esch, T., Forkel, R., Fröhlich, D., Fuka, V., Gehrke, K. F., Geletič, J., Giersch, S., Gronemeier, T., Groß, G., Heldens, W., Hellsten, A., Hoffmann, F., Inagaki, A., Kadasch, E., Kanani-Sühring, F., Ketelsen, K., Khan, B. A., Knigge, C., Knoop, H., Krč, P., Kurppa, M., Maamari, H., Matzarakis, A., Mauder, M., Pallasch, M., Pavlik, D., Pfafferott, J., Resler, J., Rissmann, S., Russo, E., Salim, M., Schrempf, M., Schwenkel, J., Seckmeyer, G., Schubert, S., Sühring, M., von Tils, R., Vollmer, L., Ward, S., Witha, B., Wurps, H., Zeidler, J., and Raasch, S.: Overview of the PALM model system 6.0, Geosci. Model Dev., 13, 1335–1372, https://doi.org/10.5194/gmd-13-1335-2020, 2020. a, b, c
Mei, D., Wang, Y., and Deng, Q.: Modeling the Airflow and Particle Dispersion in Street Canyons under Unsteady Thermal Environment with Sinusoidal Variation, Aerosol Air Qual. Res., 17, 1021–1032, https://doi.org/10.4209/aaqr.2016.12.0559, 2017. a
Mei, S.-J., Liu, C.-W., Liu, D., Zhao, F.-Y., Wang, H.-Q., and Li, X.-H.: Fluid mechanical dispersion of airborne pollutants inside urban street canyons subjecting to multi-component ventilation and unstable thermal stratifications, Sci. Total Environ., 565, 1102–1115, https://doi.org/10.1016/j.scitotenv.2016.05.150, 2016. a, b, c, d
Müller, M., Homleid, M., Ivarsson, K.-I., Køltzow, M. A. Ø., Lindskog, M., Midtbø, K. H., Andrae, U., Aspelien, T., Berggren, L., Bjørge, D., Dahlgren, P., Kristiansen, J., Randriamampianina, R., Ridal, M., and Vignes, O.: AROME-MetCoOp: A Nordic Convective-Scale Operational Weather Prediction Model, Weather Forecast., 32, 609–627, https://doi.org/10.1175/WAF-D-16-0099.1, 2017. a
Nazarian, N. and Kleissl, J.: Realistic solar heating in urban areas: Air exchange and street-canyon ventilation, Build. Environ., 95, 75–93, https://doi.org/10.1016/j.buildenv.2015.08.021, 2016. a, b, c
Nazarian, N., Martilli, A., and Kleissl, J.: Impacts of Realistic Urban Heating, Part I: Spatial Variability of Mean Flow, Turbulent Exchange and Pollutant Dispersion, Bound.-Lay. Meteorol., 166, 367–393, https://doi.org/10.1007/s10546-017-0311-9, 2018. a, b
Nezis, A. A., Angelidis, D. I., Assimakopoulos, V. D., and Bergeles, G. C.: On the wind flow patterns under neutral and unstable conditions in an urban area, Int. J. Environ. Pollut., 47, 257–267, 2011. a, b, c, d
Offerle, B., Eliasson, I., Grimmond, C. S. B., and Holmer, B.: Surface heating in relation to air temperature, wind and turbulence in an urban street canyon, Bound.-Lay. Meteorol., 122, 273–292, https://doi.org/10.1007/s10546-006-9099-8, 2007. a
Oke, T.: The urban energy balance, Prog. Phys. Geog.: Earth and Environment, 12, 471–508, https://doi.org/10.1177/030913338801200401, 1988. a
PALM Model System: PALM Changes since last svn-revision r4901, https://gitlab.palm-model.org/releases/palm_model_system/-/releases/v21.10 (last access: 10 November 2021), 2021. a
PALM model system development team: Source code of the PALM model system (revision 4734), Zenodo [code], https://doi.org/10.5281/zenodo.8113087, 2020. a
Park, C., Ha, J., and Lee, S.: Association between Three-Dimensional Built Environment and Urban Air Temperature: Seasonal and Temporal Differences, Sustainability, 9, 1338, https://doi.org/10.3390/su9081338, 2017. a
Park, S.-B. and Baik, J.-J.: A Large-Eddy Simulation Study of Thermal Effects on Turbulence Coherent Structures in and above a Building Array, J. Appl. Meteorol. Clim., 52, 1348–1365, https://doi.org/10.1175/JAMC-D-12-0162.1, 2013. a, b
Pirjola, L., Parviainen, H., M, L., Hussein, T., and Hämeri, K.: A novel mobile laboratory for chasing city traffic, SAE Transactions, 113 1258–1264, http://www.jstor.org/stable/44740844 (last access: July 2022), 2004. a
Resler, J., Krč, P., Belda, M., Juruš, P., Benešová, N., Lopata, J., Vlček, O., Damašková, D., Eben, K., Derbek, P., Maronga, B., and Kanani-Sühring, F.: PALM-USM v1.0: A new urban surface model integrated into the PALM large-eddy simulation model, Geosci. Model Dev., 10, 3635–3659, https://doi.org/10.5194/gmd-10-3635-2017, 2017. a, b, c, d, e, f
Rivas, I., Kumar, P., Hagen-Zanker, A., de Fatima Andrade, M., Slovic, A. D., Pritchard, J. P., and Geurs, K. T.: Determinants of black carbon, particle mass and number concentrations in London transport microenvironments, Atmos. Environ., 161, 247–262, https://doi.org/10.1016/j.atmosenv.2017.05.004, 2017. a
Saarikoski, S., Hellén, H., Praplan, A. P., Schallhart, S., Clusius, P., Niemi, J. V., Kousa, A., Tykkä, T., Kouznetsov, R., Aurela, M., Salo, L., Rönkkö, T., Barreira, L. M. F., Pirjola, L., and Timonen, H.: Characterization of volatile organic compounds and submicron organic aerosol in a traffic environment, Atmos. Chem. Phys., 23, 2963–2982, https://doi.org/10.5194/acp-23-2963-2023, 2023. a
Salim, M. H., Schubert, S., Resler, J., Krč, P., Maronga, B., Kanani-Sühring, F., Sühring, M., and Schneider, C.: Importance of radiative transfer processes in urban climate models: a study based on the PALM 6.0 model system, Geosci. Model Dev., 15, 145–171, https://doi.org/10.5194/gmd-15-145-2022, 2022. a, b
Salim, S. M., Buccolieri, R., Chan, A., and Sabatino, S. D.: Numerical simulation of atmospheric pollutant dispersion in an urban street canyon: Comparison between RANS and LES, J. Wind Eng. Ind. Aerod., 99, 103–113, https://doi.org/10.1016/j.jweia.2010.12.002, 2011. a, b
Schobesberger, S., Junninen, H., Bianchi, F., Lönn, G., Ehn, M., Lehtipalo, K., Dommen, J., Ehrhart, S., Ortega, I., Franchin, A., Nieminen, T., Riccobono, F., Hutterli, M., Duplissy, J., Almeida, J., Amorim, A., Breitenlechner, M., Downard, A., Dunne, E., and Worsnop, D.: Molecular understanding of atmospheric particle formation from sulfuric acid and large oxidized organic molecules, P. Natl. Acad. Sci. USA, 110, 17223–17228, https://doi.org/10.1073/pnas.1306973110, 2013. a
Sini, J., Anquetin, S., and Mestayer, P.: Pollutant dispersion and thermal effects in urban street canyons, Atmos. Environ., 30, 2659–2677, https://doi.org/10.1016/1352-2310(95)00321-5, 1996. a
Steffens, J. T., Heist, D. K., Perry, S. G., and Zhang, K. M.: Modeling the effects of a solid barrier on pollutant dispersion under various atmospheric stability conditions, Atmos. Environ., 69, 76–85, https://doi.org/10.1016/j.atmosenv.2012.11.051, 2013. a
Strömberg, J. and Kurppa, M.: Input files and scripts for creating PALM simulation input files on Mäkelänkatu in Helsinki, Finland, Zenodo [data set], https://doi.org/10.5281/zenodo.3839684, 2020. a
Strömberg, J. and Kurppa, M.: Mäkelänkatu Simulations 2022, Zenodo [data set], https://doi.org/10.5281/zenodo.7115705 2022. a
Strömberg, J. and Kurppa, M.: Mäkelänkatu Scripts 2022 Finalized Mäkelänkatu in Helsinki, Finland, Zenodo [data set], https://doi.org/10.5281/zenodo.8112867, 2023. a
Tominaga, Y. and Stathopoulos, T.: CFD simulation of near-field pollutant dispersion in the urban environment: A review of current modeling techniques, Atmos. Environ., 79, 716–730, https://doi.org/10.1016/j.atmosenv.2013.07.028, 2013. a, b
United Nations: World Urbanization Prospects: The 2018 Revision (ST/ESA/SER.A/420), New York: United Nations, https://population.un.org/wup/Publications/Files/WUP2018-Report.pdf (last access: 21 October 2021), 2019. a
WHO: Ambient air pollution: A global assessment of exposure and burden of disease, 121 pp., ISBN 9789241511353, 2016. a
Xie, X., Huang, Z., Wang, J., and Xie, Z.: The impact of solar radiation and street layout on pollutant dispersion in street canyon, Build. Environ., 40, 201–212, https://doi.org/10.1016/j.buildenv.2004.07.013, 2005. a, b, c
Xie, X., Liu, C.-H., and Leung, D.: Impact of building facades and ground heating on wind flow and pollutant transport in street canyons, Atmos. Environ., 41, 9030–9049, https://doi.org/10.1016/j.atmosenv.2007.08.027, 2007. a, b
Zhong, J., Nikolova, I., Cai, X., MacKenzie, A. R., Alam, M. S., Xu, R., Singh, A., and Harrison, R. M.: Traffic-induced multicomponent ultrafine particle microphysics in the WRF v3.6.1 large eddy simulation model: General behaviour from idealised scenarios at the neighbourhood-scale, Atmos. Environ., 223, 117213, https://doi.org/10.1016/j.atmosenv.2019.117213, 2020. a