the Creative Commons Attribution 4.0 License.
the Creative Commons Attribution 4.0 License.
 | 24 Aug 2023
Estimation of 1 km downwelling shortwave radiation over the Tibetan Plateau under all-sky conditions
Peizhen Li
Yaoming Ma
Yunfei Fu
Meilin Cheng
Xian Wang
Yuting Qi
Zixin Wang
Downwelling shortwave radiation (DSR) is the basic driving force for the energy and water cycles of the Earth's climate system. Called the Third Pole of the Earth, the Tibetan Plateau (TP) absorbs a large amount of shortwave radiation and exerts important impacts on global weather and climate change. However, due to coarse spatial resolution and insufficient consideration of factors influencing radiative transfer processes, DSR parameterization schemes still need to be improved when applied to the TP. Based on satellite datasets and meteorological forcing data, all-sky DSR over the TP at a spatial resolution of 1 km was derived using an improved parameterization scheme. The influence of topography and different radiative attenuations were comprehensively taken into account. Specifically, the introduction of cloud multiscattering and topography factors further improves the DSR estimation accuracy. The validation results indicated that the developed parameterization scheme showed reasonable accuracy. By comparing with current, widely used DSR products based on the same in situ observations, the derived DSR performed much better on different spatial and temporal scales. On instantaneous, 10 d and monthly timescales, the root-mean-square errors (RMSEs) of the derived DSR are 132.8–158.2, 70.8–76.5 and 61.3–67.5 W m−2, respectively, which are much smaller than those of current DSR products. The derived DSR not only captured the temporal-variation characteristics that are more consistent with the in situ measurements, but also provided reasonable spatial patterns. Meanwhile, the proposed parameterization scheme demonstrated its superiority in characterizing more details and high dynamics of the spatial pattern of DSR due to its terrain correction and high resolution. Moreover, this parameterization scheme does not need any local correction in advance and has the potential to be extended to other regions in the world.
- Article
(5615 KB) - Full-text XML
- BibTeX
- EndNote


Solar radiation is the basic energy source for surface biological, physical and chemical processes (vegetation photosynthesis, evapotranspiration, plant and crop growth, etc.) (Wang et al., 2015; Liang et al., 2019). It plays an important role in surface energy balance, land–atmosphere interactions, weather and climate change (Li et al., 1997; Wang and Dickinson, 2013; Huang et al., 2019). Furthermore, it comprises the key input data for land surface process models, hydrological models and Earth system models (Pinker et al., 2005; Liang et al., 2010; Stephens et al., 2012; Letu et al., 2020).
The Tibetan Plateau (TP) covers an area of approximately 2.65 × 10⁶ km2. It is known as the “Roof of the World” and “the Third Pole of the Earth” because of its average altitude of more than 4000 m (approximately of the troposphere height) and extremely complex topography (Qiu, 2008; Yao et al., 2012). In addition, the TP and its surrounding areas hold the largest number of glaciers outside the polar regions (Yao et al., 2012). The Yangtze River, the Yellow River, the Indus River and most major rivers in Asia originate from the TP, and thereby the TP is also called the “Asian Water Tower” (Xu et al., 2008; Immerzeel et al., 2010). Therefore, the unique features of the TP make it an important research object for global and regional energy and water circulation and one of the most sensitive regions in response to global climate and environmental change.
Due to its high altitude, low air mass and short path for solar radiation to reach its surface, the TP receives a large amount of radiation (Yang et al., 2014; Ma et al., 2017). Analysis of existing observation data shows that the solar radiation heating effect of the TP is obviously stronger than that of surrounding areas. Even the measured downwelling shortwave radiation (DSR) exceeds the solar constant that occurs frequently (Tanaka et al., 2001; Yang et al., 2006b, 2008). As a result, the TP can generate an intense surface heating field, which drives atmospheric circulation, regulates the formation and development of the East Asian monsoon, and exerts an important impact on global weather processes and climate change (Hong et al., 2012; Wu et al., 2012; Zhao et al., 2018; P. Zhao et al., 2019). Radiation-related changes to the environment become more severe in the case of global warming, such as significant snowmelt, glacier retreat and permafrost thawing (Piao et al., 2010; M. Yang et al., 2010; Kuang and Jiao, 2016). In turn, these processes may pose a threat to engineering constructions such as the Qinghai–Tibetan highway and railway (Chen et al., 2006; K. Yang et al., 2010). Meanwhile, in the context of carbon neutrality, DSR has become not only a vital source of energy for local residents, but also an indispensable part of photovoltaic energy technologies (Zhang et al., 2017; Huang et al., 2022; Yang et al., 2022). Consequently, reliable DSR estimation over the TP is of great value for many studies and related practical applications.
For many years, in situ measurements, numerical modeling, and satellite remote sensing have been three effective ways to obtain DSR (Liang et al., 2019). In situ measurements are the most direct and reliable way to obtain DSR data with high accuracy and high temporal resolution. However, due to the high maintenance cost of field instruments, DSR observations are available at a smaller number of stations compared to other routine meteorological variables, such as air temperature, pressure and humidity, especially in areas with harsh climate conditions (e.g., Antarctica, the Arctic and the TP). In situ measurements of DSR in these regions are not only sparse but also unevenly distributed. It is therefore not enough to characterize the distribution pattern of DSR at a large spatial scale. Numerical models can provide spatiotemporally continuous DSR data at regional and global scales. However, their spatial resolution is relatively coarse (Decker et al., 2012). Their accuracy is limited due to the uncertainties of models in simulating or predicting cloud quantities. In contrast, satellite remote sensing technology has certain advantages in estimating DSR with high spatial resolution over a large spatial coverage. The sensors aboard satellites can dynamically monitor the evolution and spatial distribution of clouds and capture a large amount of information about the atmosphere and underlying surface.
During the past few decades, various satellite-based methods for estimating DSR have been developed, which can be roughly divided into two categories: statistical methods and methods based on radiative transfer processes (Sengupta et al., 2018; Huang et al., 2019; Letu et al., 2020). The statistical methods used to estimate DSR construct the functional relationship between satellite measurements and in situ observations. Traditional empirical methods are simple to operate by applying statistical regression (Masuda et al., 1995; Li et al., 1997). However, although the empirical model may work at the local scale, it needs recalibration over different regions. The use of artificial intelligence models, which can estimate DSR by building nonlinear relationships between satellite signals and ground-based DSR, has become a new trend in estimating radiation flux (Lu et al., 2011; Qin et al., 2011; Wei et al., 2019; R. Ma et al., 2020). However, owing to an insufficient physical basis, the calculation accuracy of such methods depends largely on the selection of training data, and consequently, their generalizability is limited. In addition, the artificial intelligence model usually needs a large number of samples to train the model. Therefore, due to insufficient ground-based observations, this method is not easy to apply in the TP (K. Yang et al., 2010; Zhang et al., 2015). The lookup table (LUT) and physical parameterization method (Pinker and Laszlo, 1992; Bisht et al., 2005; Liang et al., 2006; Lu et al., 2010; Xie et al., 2016; Tang et al., 2019) are two typical methods based on the radiation transfer process and have been widely used to estimate DSR from satellite data. Since the LUT method is a close approximation to the complicated radiative transfer model (RTM), a large number of parameters are needed as inputs, such as cloud, aerosol and atmospheric parameters, to obtain higher estimation accuracy. However, the data volume in the LUT will then be greatly increased, which will further reduce the estimation efficiency of DSR. At the same time, it is usually necessary to encrypt the discrete calculation results by means of complex interpolation algorithms (Letu et al., 2020), which in turn will lead to a computational load. Alternatively, the physical parameterization method can alleviate the computational burden by parameterizing the complex process in RTM while maintaining sufficient estimation accuracy.
To date, the DSR parameterization scheme under clear-sky conditions has been quite mature (Bisht et al., 2005; Gueymard, 2012; Hwang et al., 2012). However, since optical remote sensing is greatly affected by clouds, estimating DSR efficiently and accurately under all-sky conditions is still a problem to be solved (Li et al., 1995, 1997; Huang et al., 2019; Zhong et al., 2019b; Letu et al., 2020). Although some studies have proposed parameterization schemes for cloudy-sky conditions, the current schemes still have some defects. In the presence of clouds, cloud-sky parameterization, which only considers the cloud fraction and cloud optical thickness, is usually coupled into clear-sky models in a simple and arbitrary manner (Niemela et al., 2001; Bisht and Bras, 2010). Second, some parameterization schemes do not consider the DSR attenuation caused by clouds carefully enough. Generally, only the single scattering of clouds has been considered, and the multiple-scattering effect of clouds has been ignored (Huang et al., 2018, 2020).
Due to the high elevation and complex terrain of the TP, the impact of terrain on DSR should be taken into account. Tovar et al. (1995) found that there is no obvious correlation between the spatial variation in radiation in mountainous areas and interstation distance, but it varies with the altitude difference. Therefore, the DSR in mountainous areas cannot be estimated simply by interpolation of adjacent observation values. Yang et al. (2006b) pointed out that Global Energy and Water Exchanges Surface Radiation Budget (GEWEX-SRB) v2.5 greatly underestimated the DSR on the TP due to ignoring the influence of surface elevation. Olson and Rupper (2019) reported that the deviation of the surface radiation budget could exceed 40 W m−2 during the summer melting season in the high-mountain Asia area. In addition, the coarse spatial resolution of most existing DSR products is prone to cause uncertainties in rugged areas such as the TP. Currently, the spatial resolution and accuracy of most existing DSR products cannot meet the requirements of energy and water cycle studies over the TP (Zhong et al., 2019a; Wang et al., 2021; Zhang et al., 2022). Therefore, all-sky DSR products with fine spatial resolution and high accuracy over the entire TP are still lacking.
In general, some existing DSR estimation methods are still not applicable to the TP due to its highly variable terrain, high elevation and unique climatic conditions. Therefore, an effective method to estimate the DSR of the entire TP under all-sky conditions is urgently needed. In this study, an improved parameterization scheme is proposed, and the derived DSR is validated by in situ measurements and compared with various existing DSR products. Then, the spatiotemporal distribution of the estimated DSR is presented, and the improvement brought by considering the multiple-scattering effect of clouds and topographic factors is discussed. The paper is organized as follows: Sect. 2 introduces the input data and validation data. Section 3 introduces the improved parameterization method. Section 4 presents the results and discussion. The main conclusions are given in Sect. 5.
2.1 Input data
The basic information of the meteorological forcing data and satellite datasets is listed in Table 1. The China Meteorological Forcing Dataset (CMFD) has a temporal resolution of 3 h and a horizontal spatial resolution of 0.1∘. It has been widely used by the scientific community due to its high resolution and quality. These forcing data were produced by combining routine meteorological observations of the China Meteorological Administration (CMA), Princeton reanalysis datasets, the Global Land Data Assimilation System (GLDAS), GEWEX-SRB and the Tropical Rainfall Measuring Mission (TRMM) satellite (He et al., 2020). The surface air pressure (Pa), air temperature (K) and specific humidity (kg kg−1) are used for DSR estimation.
Table 1Overview of the meteorological forcing and satellite datasets used in this study.
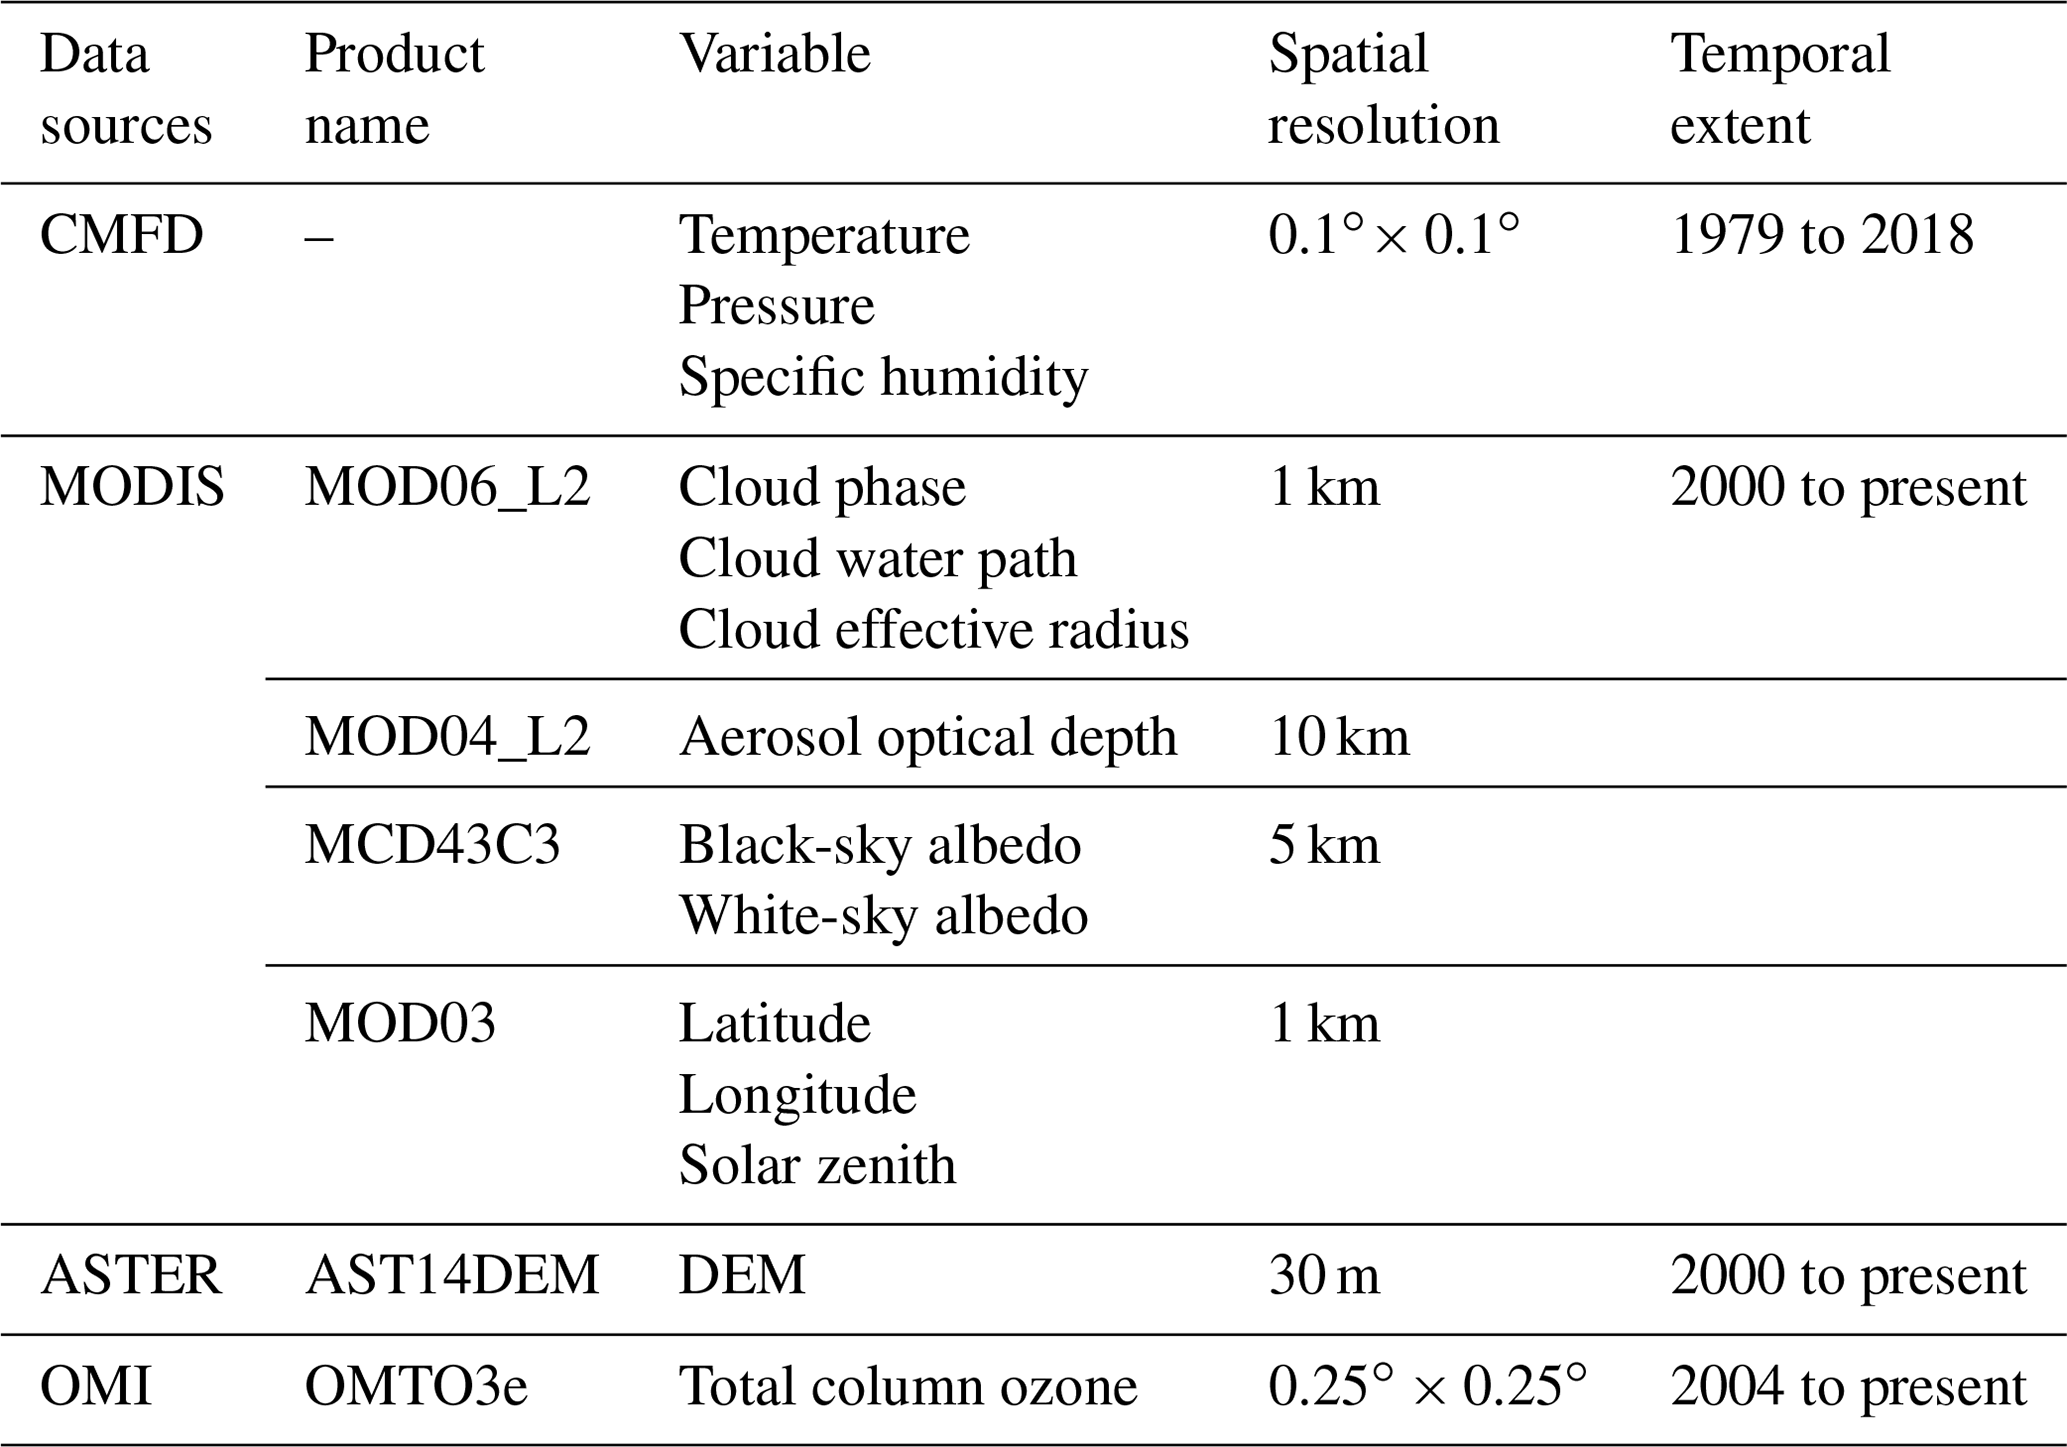
The satellite data come from MODIS (Moderate Resolution Imaging Spectroradiometer), OMI (Ozone Monitoring Instrument) and ASTER (Advanced Spaceborne Thermal Emission and Reflection Radiometer). The inputs for the parameterization scheme include (1) the cloud phase, cloud water path (CWP) and cloud effective radius (CER) (MODIS cloud product MOD06_L2); (2) aerosol optical depth (AOD) (MODIS aerosol products MOD04_L2); (3) ground surface albedo (MODIS combined land albedo product MCD43C3); (4) geolocation information (MOD03); (5) the total ozone column amount (OMTO3e); and (6) the 30 m ASTER digital elevation model (AST14DEM).
The MODIS combined Dark Target and Deep Blue AOD at 0.55 µm for land and ocean was used to derive the aerosol Ångström turbidity coefficients (Kim, 2004; Yang et al., 2006a; Huang et al., 2018). The actual surface albedo is derived with the shortwave black-sky albedo (BSA) and white-sky albedo (WSA) from the albedo product (Schaaf et al., 2002; Pinty et al., 2005). All MODIS product versions mentioned above are in Collection 6. The OMI science team created the OMTO3e product by selecting the best pixel data from high-quality, filtered level-2 total column ozone data (Ahn et al., 2008).
It should be noted that in operational applications, many parameters may not be available, especially in areas with extreme climatic conditions, such as the TP. Therefore, the “gap-filling” procedure should be carried out first, as in most studies. For aerosols, invalid retrievals were substituted using the level-3 MODIS global daily and monthly climatological products (Qin et al., 2015; Huang et al., 2016a; Li et al., 2022). For the ozone column amount and surface albedo, the unavailable retrievals were substituted using the nearest valid retrievals (Huang et al., 2018; Tang et al., 2019; Zhong et al., 2019b). The spatial resolutions of MODIS aerosol and albedo data are 10 and 5 km, respectively. The spatial resolutions of ozone and DEM data are 25 km and 30 m, respectively. To obtain the DSR at the 1 km spatial scale, these data were resampled to 1 km.
2.2 In situ observation stations
The distributions of the in situ observation stations are marked in Fig. 1, and their basic information is listed in Table 2. In this study, in situ DSR observations used to validate the accuracy of the improved parameterization scheme were extracted from 12 stations over the TP. A variety of elevations, climates and land cover types are included in these validation stations. Among them, six stations are obtained from the Tibetan Observation and Research Platform (TORP) project (Ma et al., 2008), including the BJ, QOMS, SETORS, NADORS, MAWORS and NAMORS stations. These six stations composed an integrated high-elevation and cold-region observation network. More detailed descriptions of these six stations are in Y. Ma et al. (2020). The Xidatan (XDT) monitoring station representing the characteristics of discontinuous and warm permafrost is located along the northern permafrost boundary of the TP. The Tanggula (TGL) monitoring station is located in the hinterland of the TP and is characterized by a continuous and cold permafrost zone (Yao et al., 2011; Zhao et al., 2021). There are two stations in the Ngoring Lake basin, which is located in the Yellow River source area east of the TP (Li et al., 2017). One grassland station (NLGS) is located on a flat surface, and the other observation station (NLTS) is located on the lakeside beside the lakeshore tower station (Li et al., 2020, 2021). The in situ data of D105 and NPAM come from the Coordinated Enhanced Observing Period Asia–Australia Monsoon Project (CAMP) on the Tibetan Plateau (CAMP/Tibet) (Ma et al., 2009, 2014; Zhong et al., 2010). Plausible value checks, time consistency checks and internal consistency checks were applied to ensure the accuracy and reliability of the observations. The original sampling data with high frequency were uniformly processed into 30 min and hourly average data by data loggers (e.g., CR3000, CR1000) (Campbell Scientific, USA). To retain the observations in their original form as much as possible, no further postprocessing processes were undertaken, except for replacing outliers with missing values (not a number – NaN). Meanwhile, periodic inspection, maintenance and calibration are carried out by professional engineers at all stations.
Table 2Basic information for the in situ observation stations over the Tibetan Plateau.
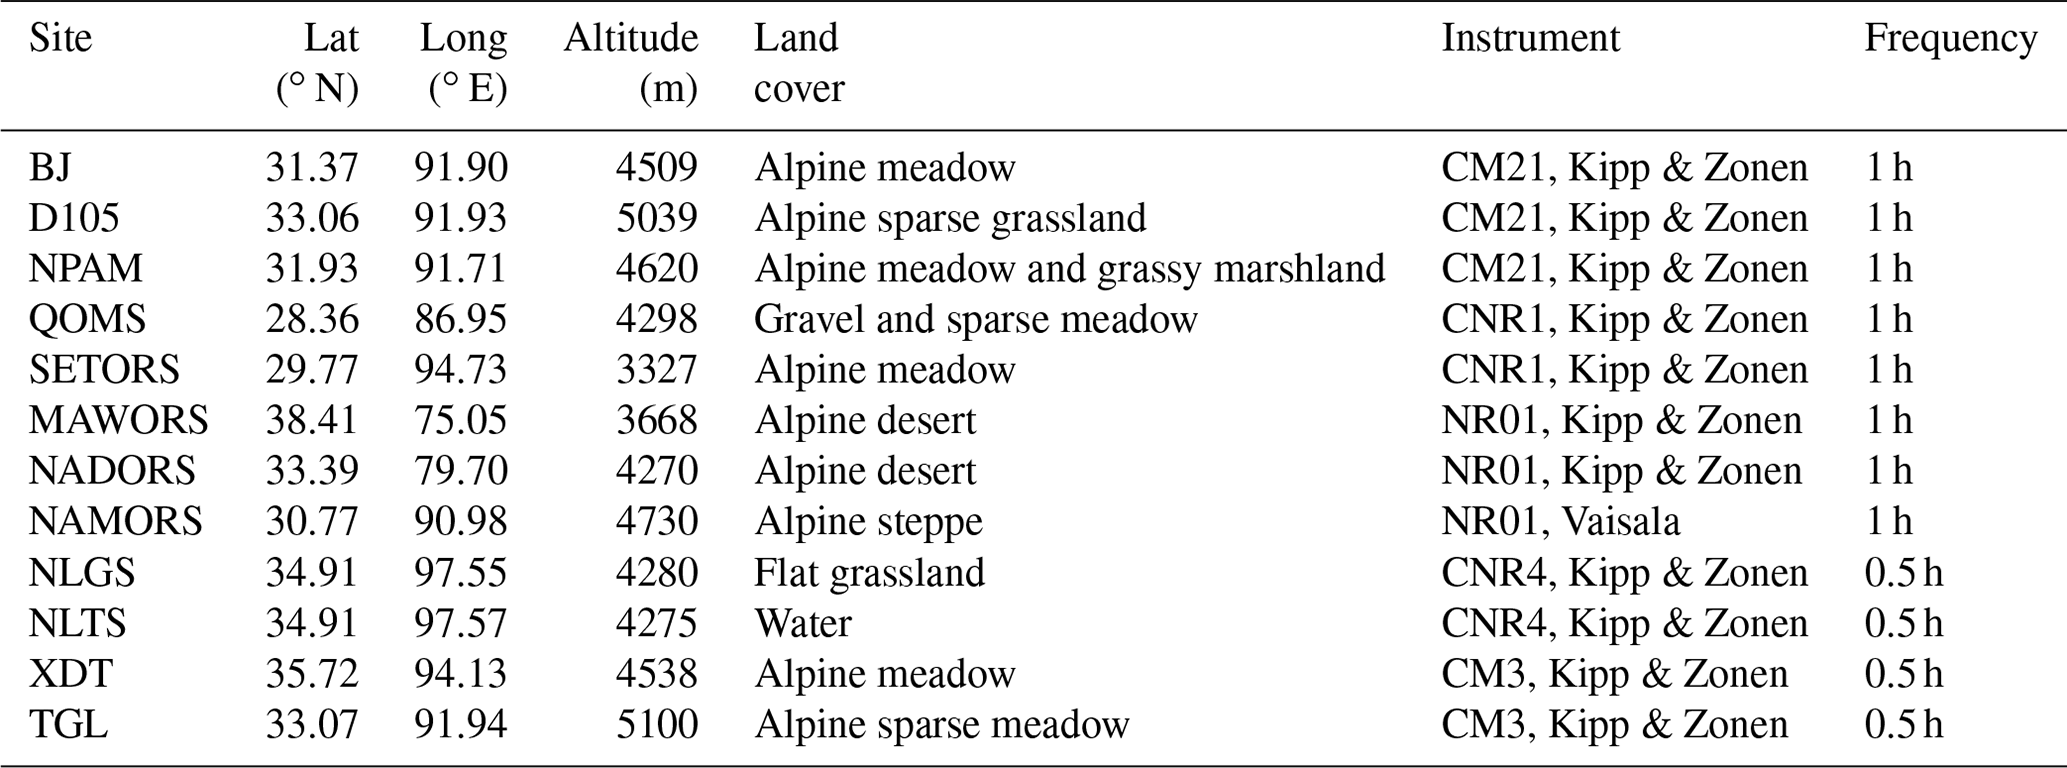
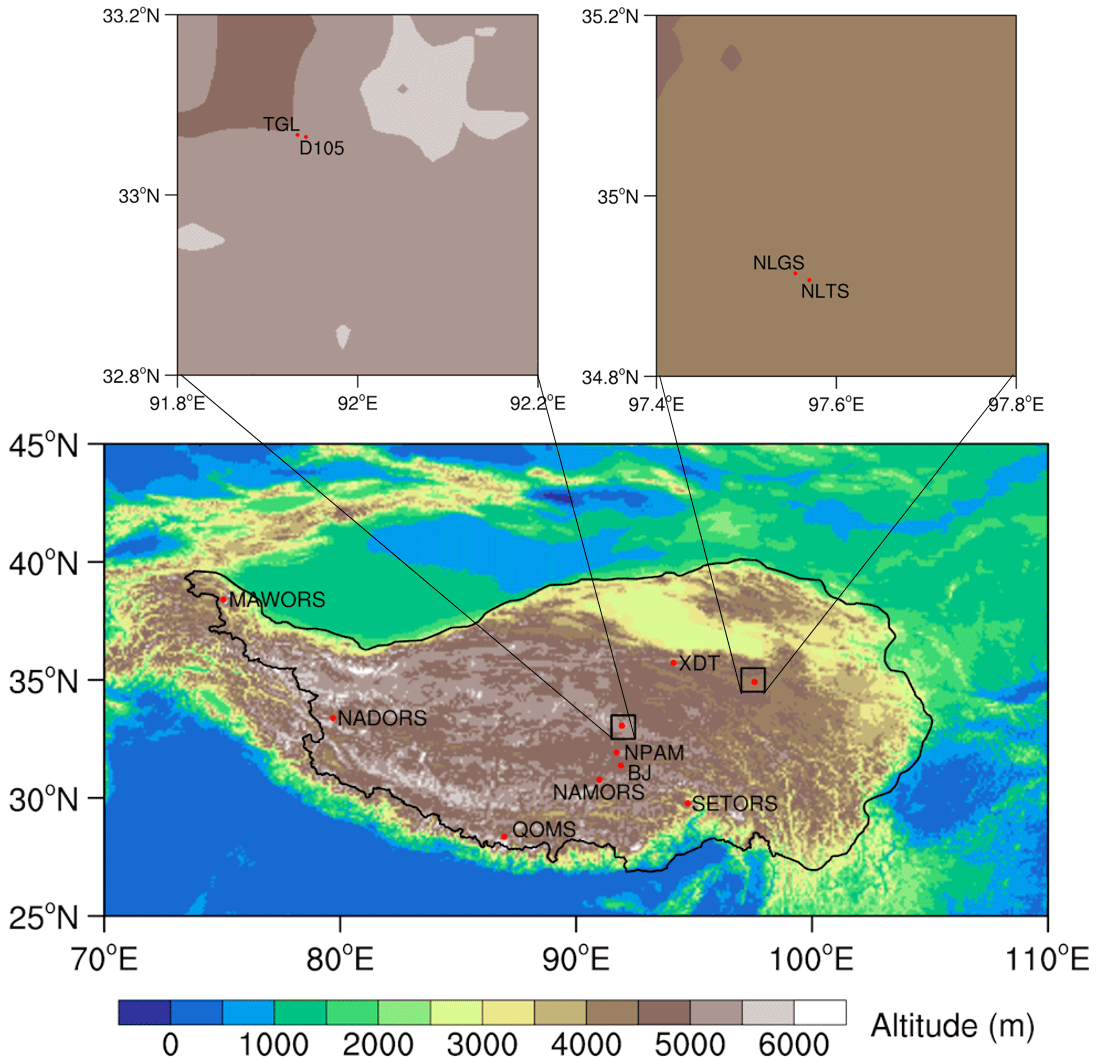
Figure 1Locations of the 12 in situ observation stations over the TP. The legend of the color map indicates the elevation above mean sea level in meters.
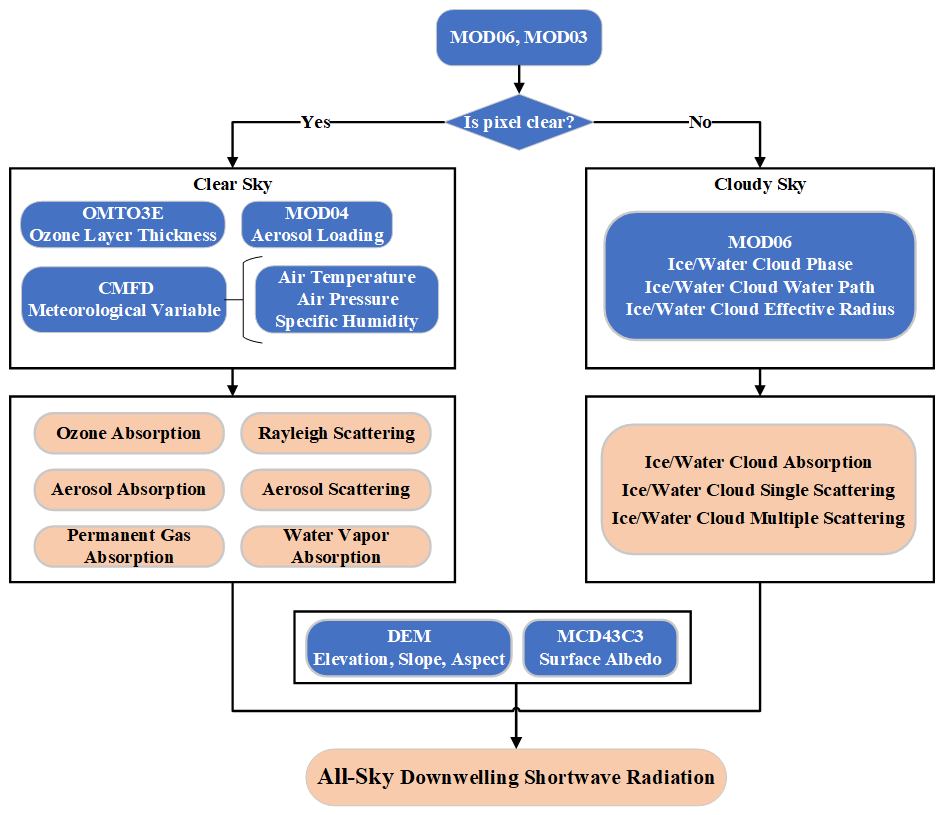
The effects caused by ozone, aerosol, water vapor, Rayleigh scattering, permanent gases, clouds and terrain are comprehensively taken into account in the improved parameterization scheme. More importantly, the DSR varies with altitude, surface slope and aspect, and the multiple effects of cloud and topography factors on DSR have been neglected in many previous studies. The all-sky DSR estimation method is divided into two groups, one for clear-sky conditions and the other for cloudy-sky conditions. The main steps of the method and related key variables are shown in Fig. 2.
3.1 Clear-sky scheme
The DSR under clear-sky conditions (DSRclr) can be calculated as the sum of three components: direct (beam) radiation (Sb,clr), diffuse radiation (Sd,clr) and reflected insolation from the surrounding terrain (Sr,clr).
where S0 denotes the horizontal extraterrestrial solar insolation, which may slightly change with the Earth–Sun distance throughout the year. In addition, τb,clr is the direct radiative transmittance, τd,clr is the diffuse radiative transmittance and τr,clr is the reflectance radiative transmittance.
3.2 Cloudy-sky scheme
DSR under cloudy-sky conditions (DSRcld) can be divided into four items as follows:
where the first, second and fourth items are the direct solar irradiance (Sb,cld), diffuse solar irradiance (Sd,cld) and reflected solar irradiance (Sr,cld) under cloudy conditions, respectively. The third item is the ambient solar irradiance caused by the interactions between the surface and atmosphere (Sam,cld). τb,cld is the direct radiative transmittance; τd,cld is the diffuse radiative transmittance; τr,cld is the reflectance radiative transmittance; ρa,cld is the atmosphere hemispherical albedo under cloudy-sky conditions. ρg is the ground surface albedo.
The variations in elevation, slope and aspect of the land surface are considered for the above radiative transmittance. A detailed description of τb,clr, τd,clr, τr,clr, τb,cld, τd,cld, τr,cld, ρa,cld and ρg is presented in Appendix A.
Considering the integrity and temporal continuity of the available data, the data of the BJ, D105, NPAM and SETORS stations in 2008; the data of the QOMS station in 2008 and 2015; and the data of the remaining seven stations in 2015 are used for validation. To ensure the reliability of the validation, first, the outliers in the ground-based observations were removed by considering the valid range and time continuity. Then, the hourly data were smoothed to 30 min to match the satellite overpass time and the station observation time (Huang et al., 2016b). The root-mean-square error (RMSE), mean bias (MB), mean absolute error (MAE) and Pearson correlation coefficient (R) are used to evaluate the performance of the radiation parameterization scheme.
4.1 Validation against in situ measurements
As shown in Fig. 3a and b, at the instantaneous scale, the RMSE and R of the 1 km DSR under clear-sky conditions are 105.34 and 0.76 W m−2, respectively, while those of the 1 km all-sky DSR are 158.19 and 0.70 W m−2, respectively. The validation results of this study are not as good as those in other plain areas, where RMSE and R are usually approximately 60 and 0.9 W m−2 under clear skies, while those of all-sky conditions are approximately 100 and 0.9 W m−2, respectively. Nevertheless, considering the unique climate characteristics of the TP and compared with the existing DSR products and algorithms (see Sect. 4.2 and 4.4 for details), the accuracy of the results is within an acceptable range. Roupioz et al. (2016) estimated all-sky solar radiation at an instantaneous timescale based on MODIS products, but the retrievals were validated using only the BJ, QOMS and NAMORS stations. In their study, the RMSE, MB and R of the BJ station were 225.5, 120.1 and 0.51 W m−2, respectively; the RMSE, MB and R of the QOMS station were 117.1, 13.0 and 0.74 W m−2, respectively; and the RMSE, MB and R of the NAMORS station were 203.5, 39.5 and 0.55 W m−2, respectively. Table 3 shows that the accuracy of our DSR estimation is better than the retrievals of Roupioz et al. (2016).
Table 3Summary statistics of the validation results for each station on different timescales. CCD denotes the proportion of cloud cover days.
Representativeness errors in point-scale measurements can affect the validation results of instantaneous DSR estimations to some extent. The insufficient spatial representation of point-scale observations can be partly compensated for by lowering their temporal resolution (Hakuba et al., 2013; Huang et al., 2016b). Therefore, the DSR estimation results were also validated at 10 d and monthly timescales. They are upscaled to 10 d and monthly timescales via averaging by instantaneous values. There are three 10 d periods within 1 month, which can be defined as follows: from the 1st to the 10th, from the 11th to the 20th and from the 21st to the end of every month. Obviously, the estimation of DSR at a longer timescale shows more reasonable agreement with the in situ measurements compared with the instantaneous DSR estimations (Fig. 3c and d).
Figure 3Validation results for the estimated DSR at (a, b) an instantaneous scale, (c) a 10 d scale and (d) a monthly scale. Scatterplots (a) and (b) show the validation results of instantaneous DSR under clear-sky and all-sky conditions, respectively. N indicates the number of points. The legend with different colors denotes the 12 stations involved in the validation. The units of RMSE, MB and MAE are W m−2.
The corresponding statistical indices for the 12 stations in this study are listed in Table 3. Since there is usually a distinctness between DSR estimation under clear-sky and cloudy-sky conditions, the statistics of specific stations are always related to the overall cloud fraction. Therefore, the proportion of cloud cover days (CCD) at each station is also listed in the table. Zhong et al. (2019b) estimated all-sky solar radiation on a 10 d timescale based on MODIS products over the TP, and their method needed to obtain ground-based measurements in advance for local calibration. We find that compared to the statistics presented at the D105, QOMS and SETORS stations, the accuracies of our method are on average slightly higher.
As illustrated in Table 3, the best validation results occurred at the QOMS station, showing the lowest RMSE, an MB of a smaller absolute value and a higher R, due to the extremely low proportion of CCD over the station (∼ 19.83 %), whereas poorer performance occurred at the SETORS and TGL stations according to the validation results on various timescales. The SETORS station is located in the valley near the southeastern TP, is surrounded by dense vegetation (mainly evergreen needleleaf trees and alpine meadows) and is close to the southern water vapor transport channel. Accordingly, many precipitation events occur here, with a maximum proportion of CCD (∼ 72.85 %) among the 12 sites. The TGL station lies on the north side of the Tanggula Mountains, surrounded by numerous glaciers and deep snow cover, which can persist for many days (Xu et al., 2017; Zhou et al., 2018). Because the snow or ice cover beneath the clouds is difficult to identify from satellite signals, there is great uncertainty in the corresponding retrievals of cloud microphysical parameters, which may lead to low accuracy of the estimation results. In addition, previous studies have shown that snow cover will result in the underestimation of DSR (Pinker et al., 2007; Huang et al., 2016a), which is also indicated by the large negative MB of the TGL site compared with other stations.
4.2 Comparison among different DSR products
To further evaluate the reliability of our DSR estimates, several existing, widely used DSR products were selected for comparison based on the same in situ observations used in Sect. 4.1. Among these products, there are remotely sensed and reanalysis DSR products, namely, Clouds and the Earth's Radiant Energy System Synoptic (CERES_SYN) surface fluxes (Loeb et al., 2013), Global Energy and Water Exchanges Surface Radiation Budget (GEWEX_SRB) datasets (Zhang et al., 2014), the MODIS DSR product (MCD18A1) (Wang et al., 2020), and the fifth-generation reanalysis (ERA5) from the European Centre for Medium-Range Weather Forecasts (ECMWF) (Hans et al., 2019). In addition, Letu et al. (2022) produced a high-resolution (5 km, 10 min) DSR dataset (shortened to “H-8_EAP” in our study) under all-sky conditions from 2016 to 2020 in the East Asia–Pacific region based on the next-generation geostationary satellite Himawari-8/AHI, which was also selected for comparison. At present, the latest in situ data in this study are from 2016, and the Himawari-8 satellite cannot observe the western part of the TP. Therefore, six stations (BJ, QOMS, SETORS, NAMORS, NLGS and NLTS) in 2016 were selected for comparison with the H-8_EAP DSR dataset.
The spatial resolutions of MCD18A1 and ERA5 are 1 and 25 km, respectively. CERES_SYN and GEWEX_SRB have a spatial resolution of 100 km. It is known that spatial mismatch may incur errors in the validation results, so our results at the original scale of 1 km were aggregated to the corresponding spatial resolution of the above products. The temporal resolution of MCD18A1 is instantaneous. GEWEX_SRB has a temporal resolution of 3 h, and ERA5 has a temporal resolution of 1 h. CERES_SYN products have two temporal resolutions of 1 and 3 h. The abovementioned DSR products and the estimated DSR of this study were temporally matched to 10:30 local time for mutual comparison (Zhong et al., 2019b).
Table 4Comparison with existing DSR products on different timescales in terms of accuracy.

As summarized in Table 4, the RMSE range of these DSR products is approximately 150–230 W m−2 at the instantaneous scale. At the 10 d scale, the RMSE range is approximately 80–150 W m−2. At the monthly scale, the RMSE range is approximately 70–130 W m−2. The MB range of these DSR products is −120 to −20 W m−2 at three temporal scales. These large spans of RMSE and MB indicate that the current DSR products still have great uncertainties over the TP. The RMSE ranges of this study at three temporal scales are 132–152, 70–82 and 61–71 W m−2. The MB range of this study is 3–24 W m−2 at three temporal scales. The estimates of this study show a smaller RMSE, lower absolute-value MB and comparable R values at the corresponding spatial and temporal scales. This means that the derived DSR based on the proposed method performs better than other DSR products over the TP.
In addition, it is noted that the accuracies of all datasets have been appreciably improved with an increasing timescale. This is because the 3D radiative transfer effects and complexity of clouds can be significantly reduced and the spatial representativeness of ground-based measurements can be significantly enhanced through temporal averaging (Huang et al., 2016a, b). A phenomenon in which the RMSE of this study has been improved with incremental space scales at three timescales is also found, while the variations are relatively small at the 10 d and monthly scales. This may be because the time mismatch between satellite observations and surface measurements can be partly decreased by inherent averaging in the upscaling of spatial resolution (Tang et al., 2019).
Figure 4Intercomparison of time series of DSR among MCD18A1, ERA5, CERES_SYN_1 h and this study at the (a) BJ, (b) D105, (c) NPAM, (d) SETORS, (e) QOMS, (f) MAWORS, (g) NADORS, (h) NAMORS, (i) NLGS, (j) NLTS, (k) XDT and (l) TGL stations on a 10 d timescale. The circles denote in situ data.
DSR products with relatively high accuracy, which correspond to three spatial resolutions of 1, 25 and 100 km, are selected for comparison with the estimated DSR in this study in terms of temporal-variation characteristics (Fig. 4). The time series of MCD18A1 at the NAMORS and NLGS stations are not displayed because there are many missing values in MCD18A1 at these two stations. It can be seen that six selected DSRs showed a quasi-convex shape in 1 year at all stations except SETORS. There are some fluctuations in DSR during the summer monsoon period due to the high frequency of clouds and precipitation. Almost all six selected DSRs showed relatively smooth variation at SETORS compared with other stations, which demonstrates a large variation with time. The dynamic range (defined as the difference between the maximum and the minimum in a year) of MCD18A1 is the largest, while ERA5, CERES_SYN_1 h and this study show similar dynamic ranges. Compared with other products, the derived DSR of this study is more consistent with the in situ observations at each station, and all show similar temporal-change trends.
It should be noted that the six selected DSRs are not consistent with the in situ observations at the SETORS station, especially in the monsoon period during which obvious underestimation can be found. Cloud and precipitation occurrence frequencies generally reach peaks during the monsoon period over the TP. Compared with other regions of the TP, not only higher cloud amounts and frequencies but also higher precipitation intensities and frequencies are found in the southeastern TP, where the SETORS station is located (C. Zhao et al., 2019; Kukulies et al., 2020). Convective clouds appear most frequently over the TP near noon local time, and thus, the DSR may also partially come from the high diffuse radiation caused by cloud scattering in addition to direct radiation (Fujinami et al., 2005; Li et al., 2008; K. Yang et al., 2010). It is still difficult to reflect the 3D radiation effect of clouds, although this study has considered the scattering of clouds and thus may lead to underestimation of DSR. The microphysical processes of convective clouds generally include mixed-phase processes inside clouds (Fu et al., 2020). Nevertheless, only a single phase can be diagnosed by satellite-based cloud products, which may significantly influence the retrieval accuracy of DSR (Platnick et al., 2003, 2017). In addition, the SETORS station is flat with grass cover, while its surroundings are classified as valley and dense evergreen needleleaf trees. The domes of instruments are vulnerable to the contamination of precipitation, and they further influence the spatial representativeness of in situ stations. Hence, some errors may be introduced due to the inadequate spatial representativeness of point-scale measurements compared with the coarse resolution of satellite images.
4.3 Spatiotemporal variations in surface downward shortwave radiation
Based on the above analysis, CERES_SYN_1 h and ERA5 performed better than the other DSR products. To better investigate the spatiotemporal variations in the estimated DSR over the TP, the seasonal spatial distributions of DSR generated from CERES_SYN_1 h, ERA5 and this study in 2008 are collected and compared in Fig. 5. In general, the three mentioned DSRs provide similar seasonal radiation patterns; i.e., the DSR values are higher in spring and summer and lower in autumn and winter. This phenomenon can also be found in the monthly mean DSR variation over the TP (Fig. 5m). The DSR increased from a minimum value in January to a maximum value in April. The formation of this pattern is primarily controlled by the north–south movement of the subsolar point.
Figure 5Spatial distribution of DSR from this study (left), CERES_SYN_1 h (center) and ERA5 (right) for four seasons in 2008 over the TP. The first to fourth rows represent spring (March, April and May – MAM), summer (June, July and August – JJA), autumn (September, October and November – SON) and winter (December, January and February – DJF), respectively. The bottom panel (m) shows a comparison of monthly temporal variation in spatial mean DSR estimates from this study, CERES_SYN_1 h and ERA5 over the TP.
It should be pointed out that the radiation texture of this study is rather clear due to the higher resolution (1 km), and more details of DSR variations can be captured. The high values of DSR are mostly located in the western TP. This can be explained by the fact that the western TP, with arid and semiarid climate characteristics, has a higher altitude than the eastern TP, and thus, less radiation attenuation occurred. At the same time, the southern margin of the TP and the eastern margin of the TP near the Sichuan Basin are always low-value areas of DSR. The southern edge of the TP is a water vapor transport channel associated with the South Asian monsoon, and the frequencies of clouds and rainfall are high. The eastern edge of the TP near the Sichuan Basin has a very low altitude (∼ 1800 m) and is often covered by stratiform clouds. Accordingly, strong solar radiation attenuation occurred in these two regions.
The differences among the three mentioned DSRs are also displayed in Fig. 5. A high value of DSR appears in the southwestern TP in spring, but the high value of ERA5 covers a large area and even extends to the Tanggula Mountains (Fig. 5a–c). The overall DSR pattern over the TP shows a decreasing trend from northwest to southeast in summer, but the high value in the Qaidam Basin is not found in ERA5 (Fig. 5d–f). In autumn, the high value of DSR is concentrated in the southwestern TP, showing a spatial pattern of high–west and low–east (Fig. 5g–i). In winter, the DSR reaches the minimum of the year and shows a spatial distribution of high–south and low–north over the TP (Fig. 5j–l). However, the DSR derived from this study is generally higher than that of the other two products. The monthly temporal variation in the spatial mean DSR over the TP also indicates a similar phenomenon (Fig. 5m). The spatial mean DSR of ERA5 is higher than those of the other two DSR products in spring, and the spatial mean DSR estimated in this study is higher than those of the other two radiation products in autumn and winter.
To further understand the difference between the three mentioned DSRs, the corresponding statistical indices for the four seasons are presented in Fig. 6. At all temporal scales in spring, ERA5 shows a positive bias, while the other two DSRs show a negative bias. In summer, autumn and winter, the DSR estimated from this study shows positive bias, while the other two products show negative bias. This explains the above phenomenon. However, this study's result is significantly lower than the other two DSR products in terms of the absolute value of MB. Particularly, it can be clearly seen that in all seasons and at all temporal scales, not only for MB but also in terms of RMSE and MAE, this study shows the lowest values, and in terms of R, this study is comparable to or higher than the CERES_SYN_1 h and ERA5 products. Similar comparison and verification results can also be found in Table 4. In addition, the spatial distribution of this study is similar to that in a previous study by Zhong et al. (2019b). Therefore, it is not difficult to conclude from the above analysis that the DSR patterns of this study are reasonable enough, at least showing advantages over other products in terms of spatial resolution with relevant details.
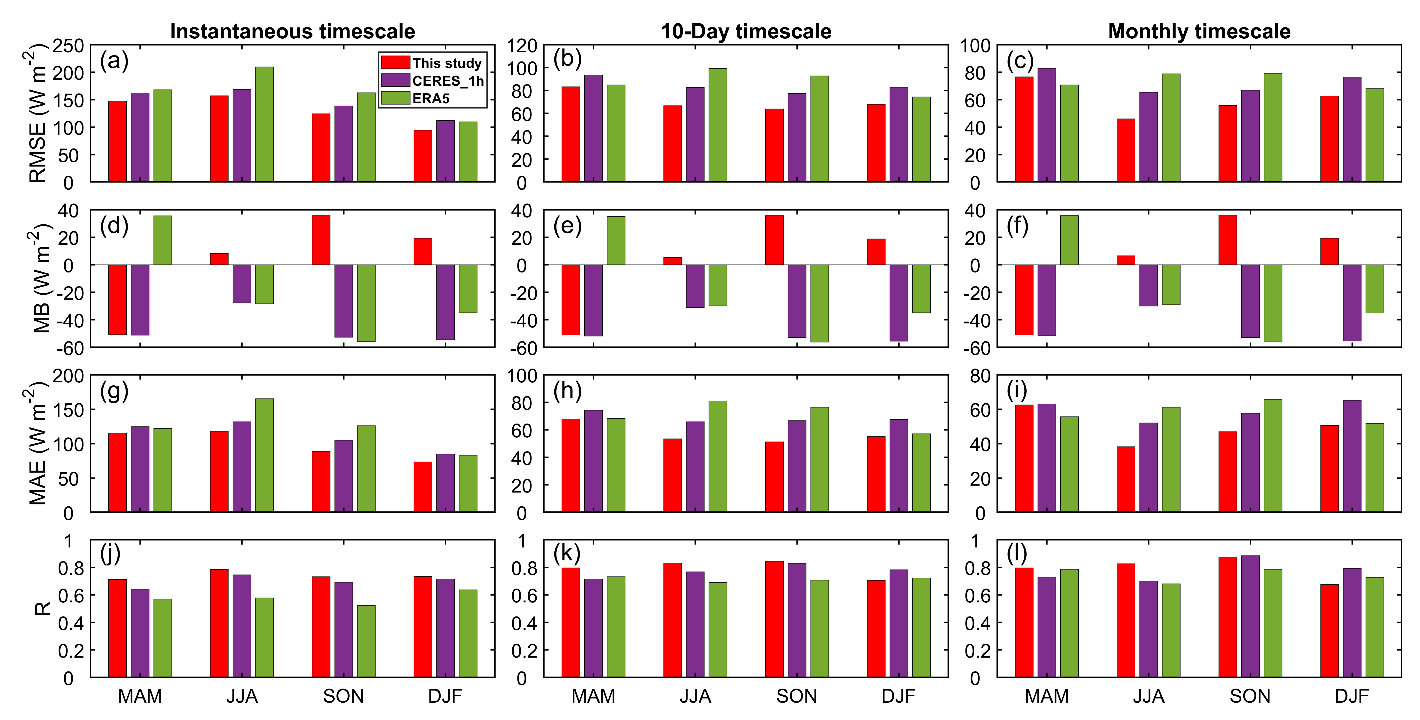
Figure 6RMSE (a–c), MB (d–f), MAE (g–i) and R (j–l) between in situ observations and DSR estimates from this study (red bar), CERES_SYN_1 h (purple bar) and ERA5 (green bar) products in the four seasons.
4.4 Evaluation of cloud multiscattering and topographic effects
To evaluate the effects of cloud multiscattering and complex topography, the accuracies of the DSR derived with and without considering terrain factors and cloud multiple scattering on different temporal scales were compared (Table 5). Here, four simple cases were designed. Both the terrain factor and cloud multiple scattering are not included in Case 1; Case 2 only considers the terrain factor, and Case 3 only considers cloud multiple scattering. Case 4 is the method adopted in this study; that is, both terrain factor and cloud multiple scattering are taken into account.
Table 5Comparison between DSR estimation with and without considering cloud multiple scattering and terrain factors on different timescales in terms of accuracy.
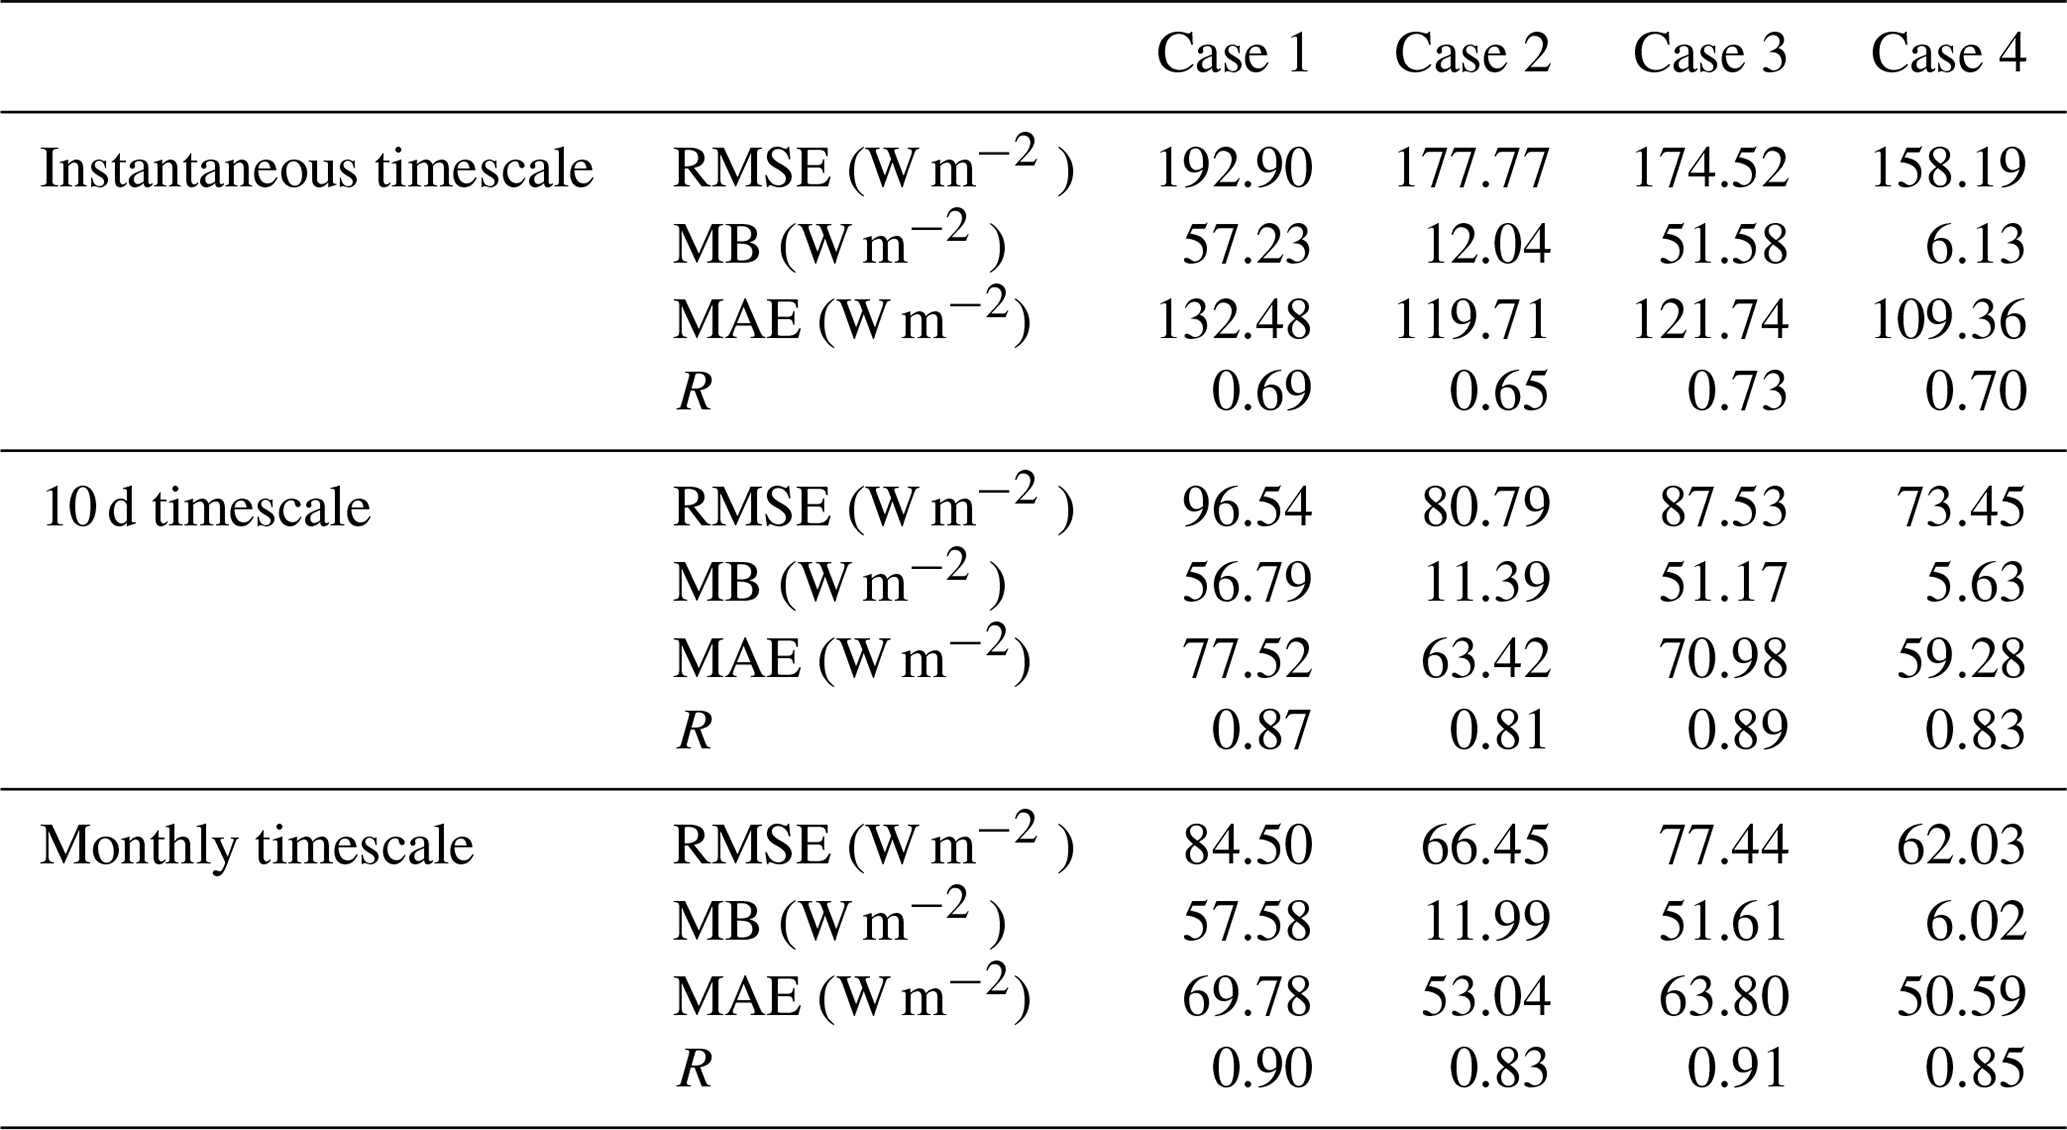
As shown in Table 5, the RMSE of Case 1 reaches nearly 200 W m−2 at the instantaneous scale, nearly 100 W m−2 at the 10 d scale and more than 80 W m−2 at the monthly scale, all of which are the highest among the four cases. As mentioned earlier, the estimated DSR of the SETORS station is more vulnerable to clouds. The RMSE of the SETORS station is reduced by 15 %–19 % when cloud multiple scattering is considered. Hence, ignoring the multiple scattering of clouds may lead to large errors in the case of high cloud cover. The verification results are improved when multiple cloud scattering and varying topography are introduced, and the RMSE is reduced by 8 %–25 %. Obviously, Case 4 shows the lowest RMSE, MB and MAE and similar R values compared with the other three cases. This reflects the fact that, when estimating DSR under all-sky conditions over the TP, the effects of terrain and cloud multiscattering cannot be simply ignored.
To show the impact of varying topography on DSR, the spatial DSR pattern in a subarea of the TP before and after terrain correction is shown under relatively clear-sky conditions (Fig. 7). Before terrain correction, the value of DSR is uniform, and the spatial texture is relatively smooth. The majority of the selected areas show relatively fixed values (∼ 750 W m−2), except for the parts covered by clouds, which show obviously low values. In contrast, the DSR values show high spatial dynamics, and it is easy to identify some subtle changes. The spatial gradient of DSR on the sunny and shady slope hillsides is obvious, and the higher parts receive more solar radiation. This is consistent with the surface features shown by the satellite images in the lower-right corner.
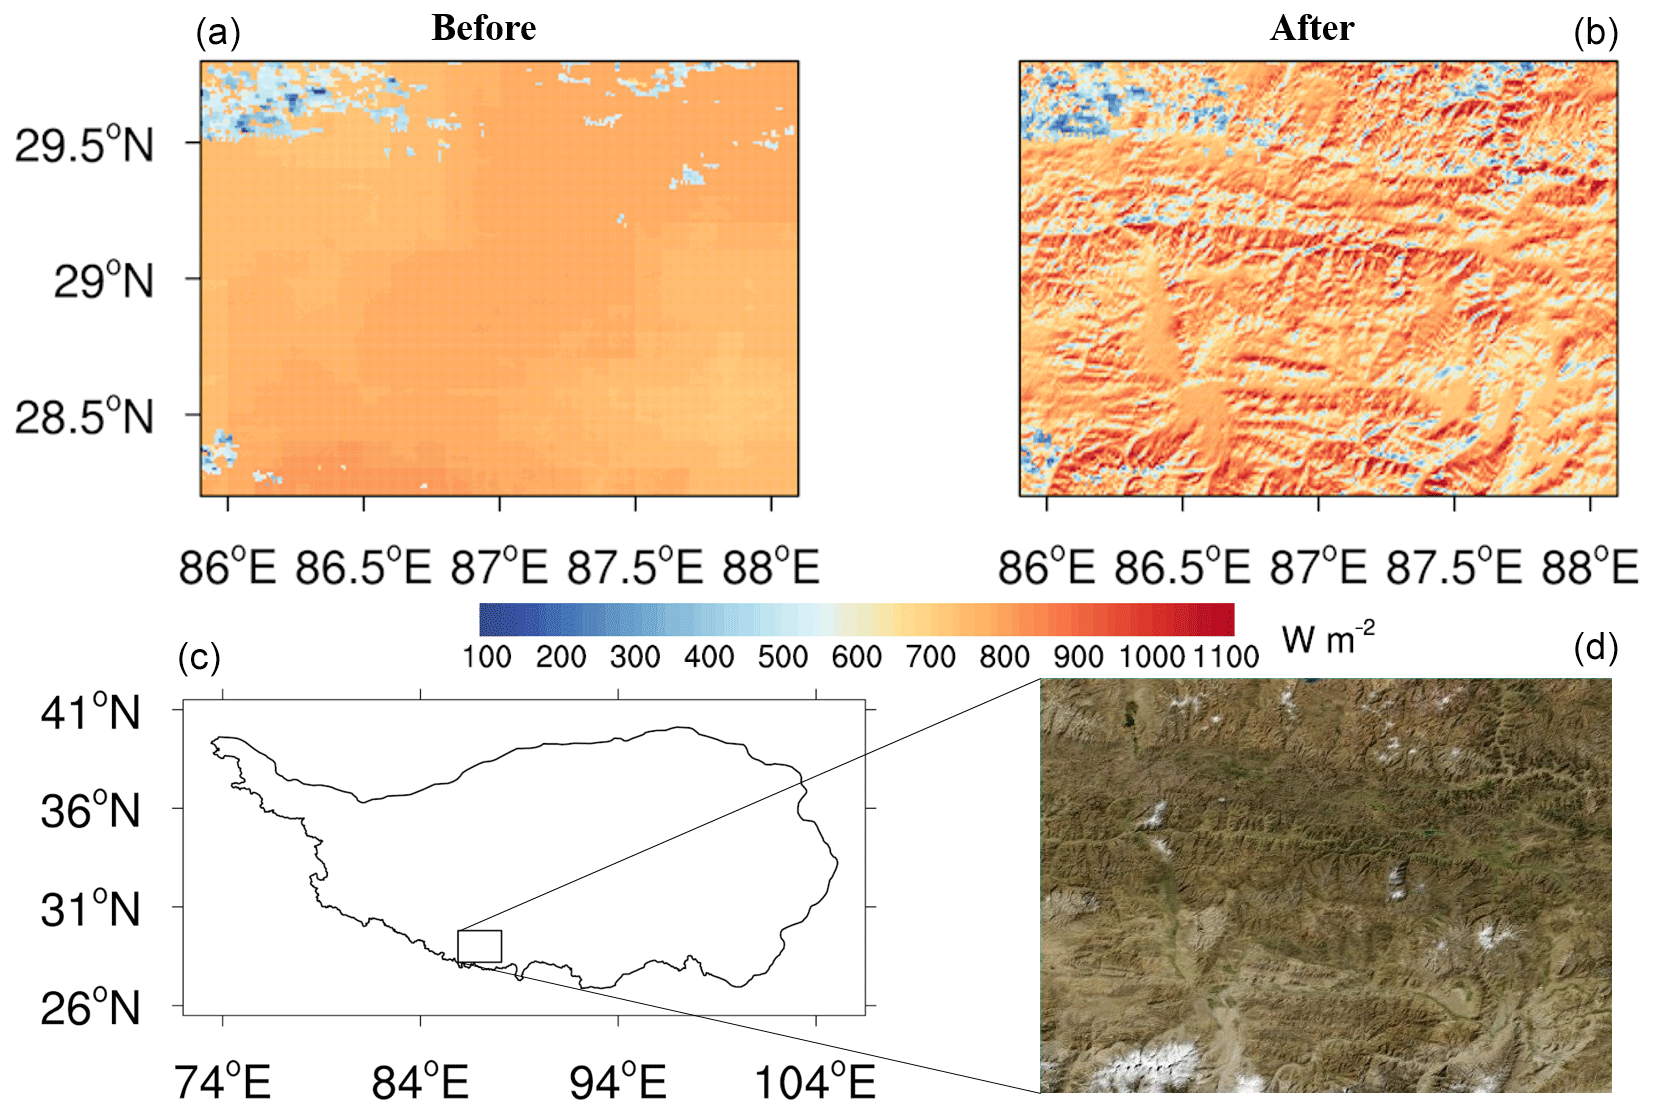
Figure 7DSR estimated before terrain correction (a, c) and after terrain correction (b, d) over the TP at 10:30 LT on 10 January 2008.
4.5 Sensitivity analysis
The accuracy of the parameterization scheme depends on the quality of the input data to some extent. To further understand the effect of uncertainties in input variables on the accuracy of the DSR retrieval scheme, analysis of the DSR sensitivity to input variables is conducted (Figs. 9 and 10). As shown in Fig. 8, three points located in the west, north-central part, and southeast of the TP are randomly selected for sensitivity tests. The average of each input variable (including air temperature Tair, air pressure Pair, specific humidity SH, ozone layer thickness, aerosol optical depth AOD, surface albedo, cloud effective radius CER and cloud water path CWP) for three randomly selected points is selected as the default value.
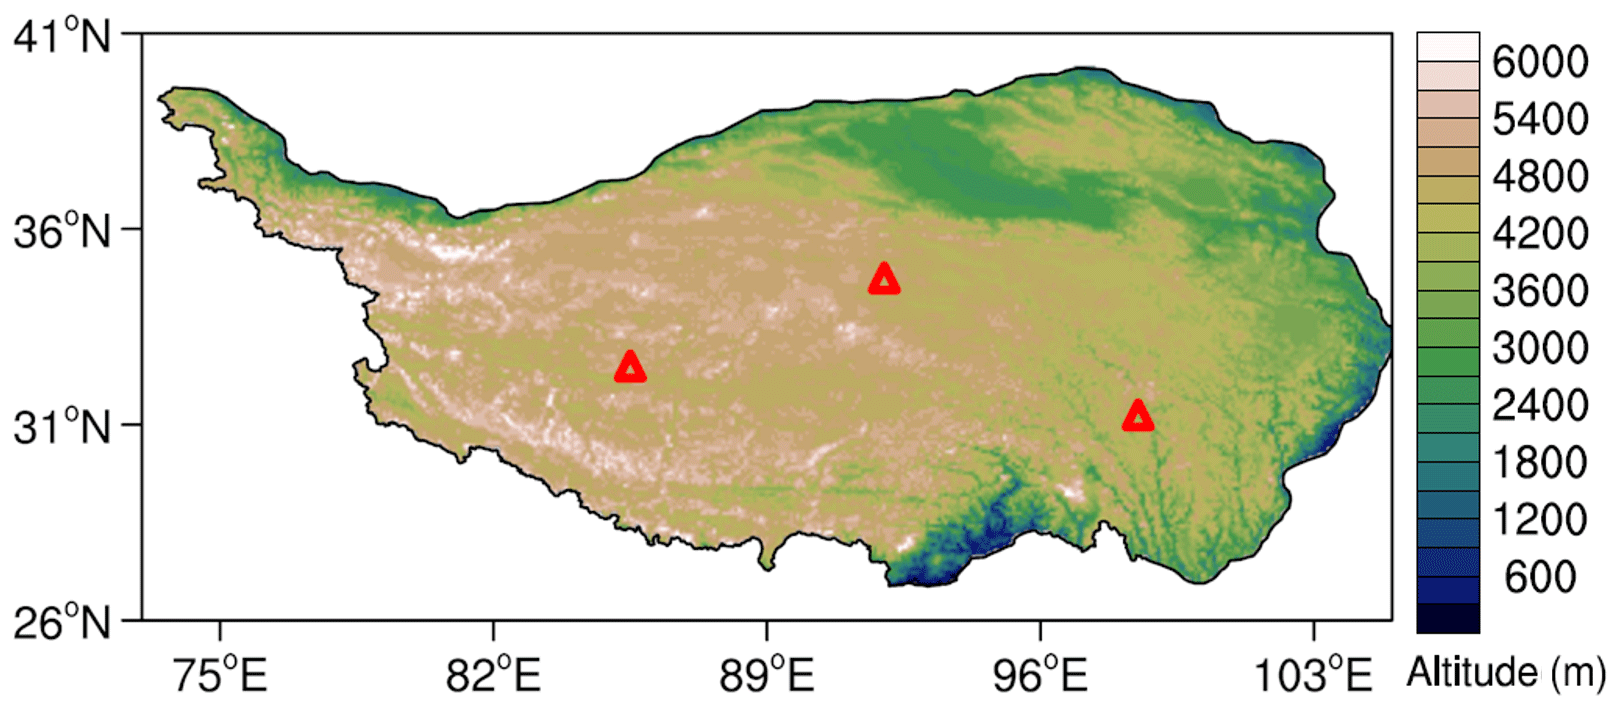
Figure 8Locations of the three points (marked by red triangles) used to carry out sensitivity tests of the input data. The legend of the color map indicates the elevation above mean sea level in meters.
As shown in Figs. 9 and 10, in terms of changing trend and range, DSR has different responses to fluctuations of each input variable under different sky conditions. The sensitivity test results show that the DSR exhibits a positive correlation with Pair and ozone layer thickness and a negative correlation with Tair under both clear and cloudy conditions, with a nearly linear relationship (Figs. 9a, b, d and 10a, b, d). The DSR exhibits a negative correlation with SH and AOD with a nonlinear relationship under both clear and cloudy conditions (Figs. 9c, e and 10c, e). In addition, the DSR exhibits a positive correlation with CER and a nonlinear negative correlation with CWP under cloudy-sky conditions (Fig. 10g and h). However, the DSR exhibits a linear positive correlation with surface albedo under clear-sky conditions, while it displays a nonlinear positive correlation under cloudy-sky conditions (Figs. 9f and 10f). This phenomenon indicates that multiple-scattering effects occur between the atmospheric medium (aerosols and clouds) and the land surface (Ma et al., 2020).

Figure 9Sensitivity of DSR to (a) air temperature Tair, (b) air pressure Pair, (c) specific humidity SH, (d) ozone layer thickness, (e) aerosol optical depth AOD and (f) surface albedo under clear-sky conditions.
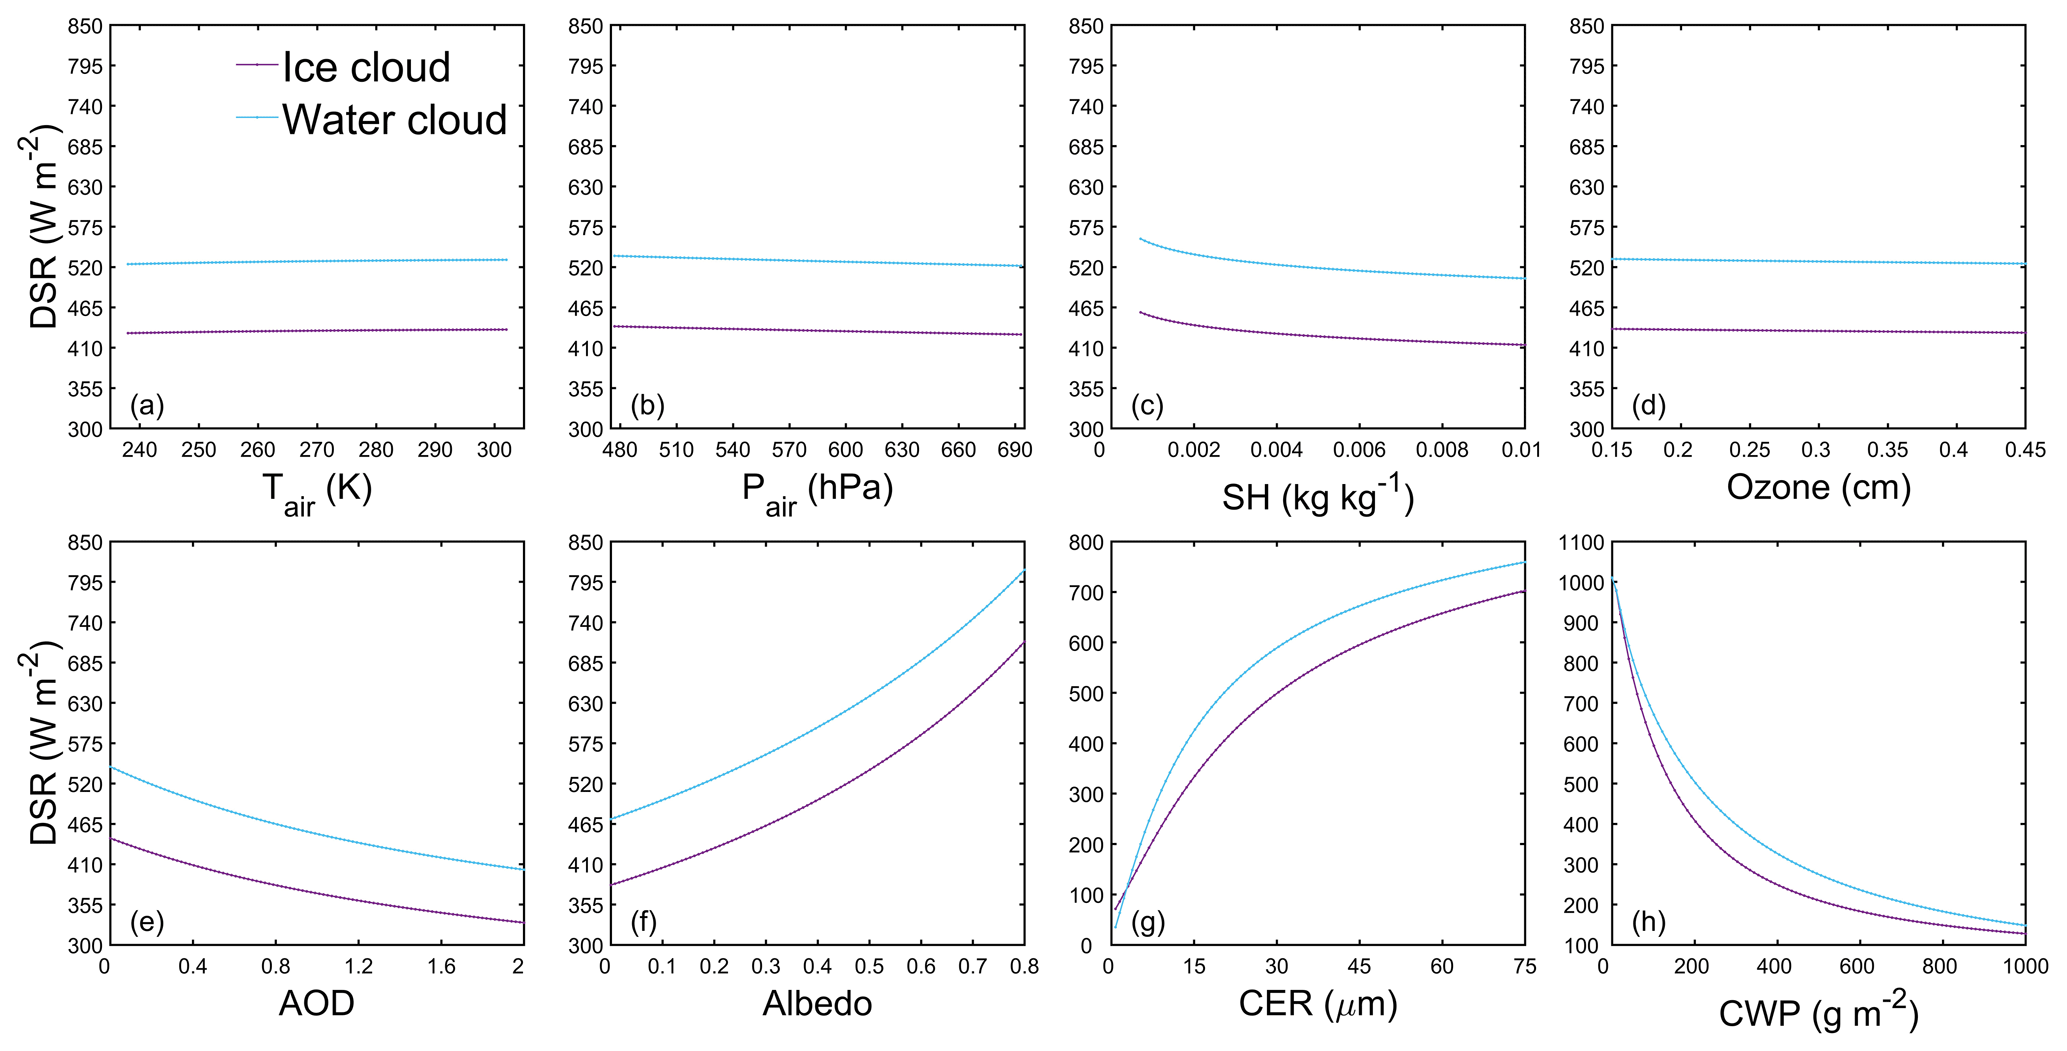
Figure 10Sensitivity of DSR to (a) air temperature Tair, (b) air pressure Pair, (c) specific humidity SH, (d) ozone layer thickness, (e) aerosol optical depth AOD, (f) surface albedo, (g) cloud effective radius CER and (h) cloud water path CWP under cloudy-sky conditions for ice clouds (purple line) and water clouds (blue line).
Moreover, the fluctuating range of input variables within 1 standard deviation (1σ) and the induced DSR fluctuation under different sky conditions are summarized in Table 6. Under clear-sky conditions, the DSR is highly sensitive to AOD and SH and only slightly sensitive to other input variables. The AOD and SH within 1σ correspond to ranges of approximately 0–0.23 and 0.0004–0.0047 kg kg−1, respectively, which would lead to DSR fluctuating by approximately 100.6 and 87.4 W m−2, respectively. Other input variables only induce fluctuations in DSR smaller than 15 W m−2. Under cloudy-sky conditions, the DSR shows significant sensitivity to CWP and CER; moderate sensitivity to albedo, SH and AOD; and slight sensitivity to other input variables. The CWP within the 1σ range would lead to DSR fluctuating by approximately 768.1 and 526.7 W m−2 for ice clouds and water clouds, respectively. The CER within the 1σ range would lead to DSR fluctuating by approximately 212.2 and 202.3 W m−2 for ice clouds and water clouds, respectively. The magnitude of DSR fluctuations induced by the remaining input variables is much smaller than that caused by CWP and CER. In addition, the sensitivity of DSR to albedo is higher under cloudy-sky conditions than under clear-sky conditions, while the sensitivity of DSR to AOD and SH is lower under cloudy-sky conditions than under clear-sky conditions.
Table 6Fluctuating range of input variables within 1 standard deviation (1σ) and the induced DSR fluctuation under clear-sky and cloudy-sky conditions.
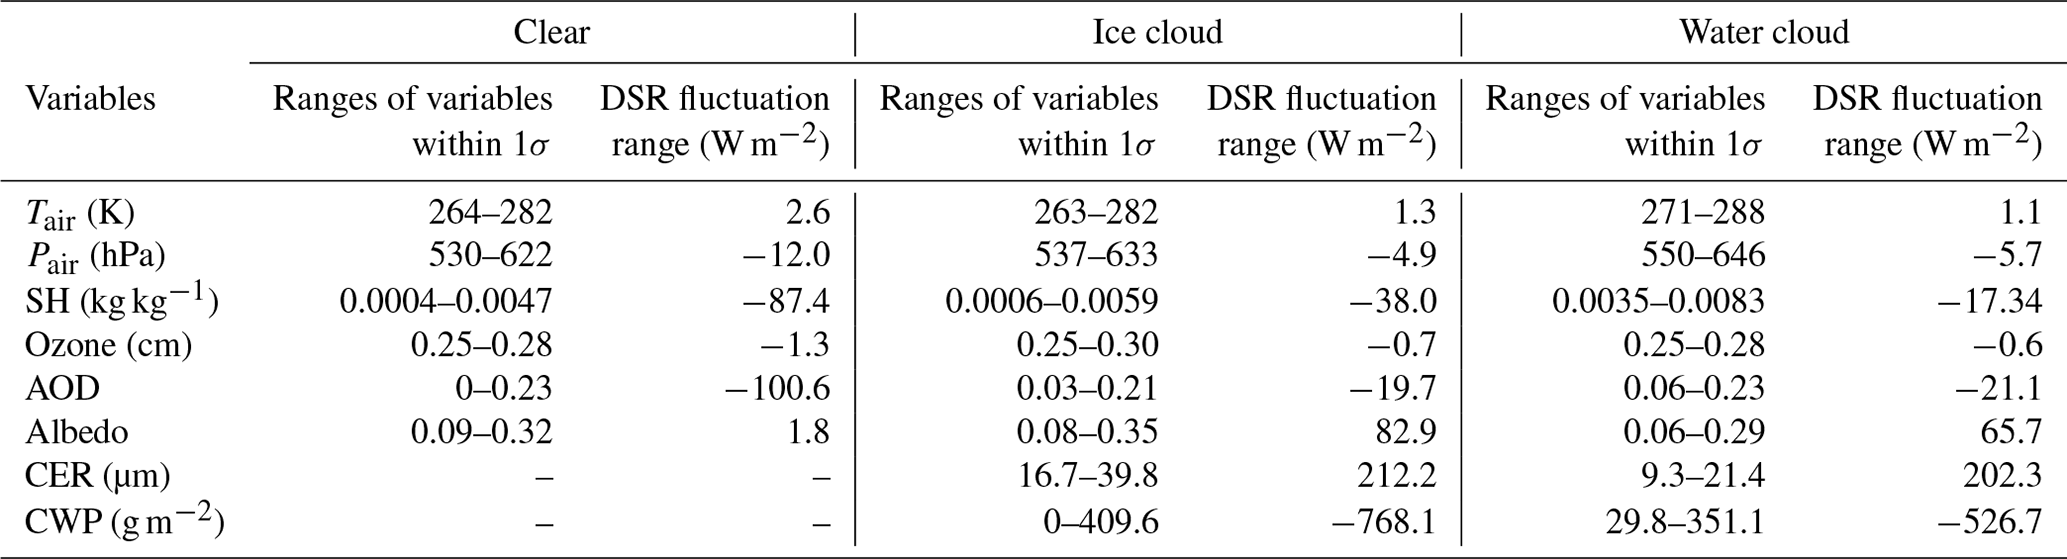
In general, the inputs of cloud parameters CWP and CER are crucial variables, and their sensitivities are consistently high. AOD, surface albedo and SH are of secondary importance, with moderate sensitivity. AOD and surface albedo are more sensitive to DSR estimation than SH. Tair, Pair and ozone layer thickness only have a slight sensitivity to DSR estimation, of which ozone layer thickness is the least sensitive. The sensitivity test results indicate that the uncertainties in the input data of cloud parameters, aerosol parameters, surface albedo and water vapor content are important error sources in the estimation of DSR (Huang et al., 2020; Letu et al., 2020).
Various satellite-based methods for estimating DSR have been developed during the past few decades, but some of them rarely operate effectively over the TP due to its complex terrain, high elevation and unique climatology. Current surface radiation products ignore the influence of topographic variability on the DSR by simply assuming that the surface is horizontal and uniform, resulting in unreliable estimations in rugged regions. Due to the complexity and heterogeneity of the underlying surface of the TP, considering the topographic variability in the process of DSR estimation is indispensable. However, few models take the terrain effect into account on the large spatial scale of the whole TP. Unlike aerosol scattering and Rayleigh scattering, multiple scattering plays an important role in DSR attenuations caused by clouds. However, radiative extinctions due to cloud multiscattering tend to be ignored in existing DSR estimation methods under cloudy-sky conditions.
Thus, an improved parameterization scheme for deriving DSR over the TP under all-sky conditions is proposed in this paper. Based on meteorological forcing data and satellite data, the effects caused by ozone, aerosol, water vapor, Rayleigh scattering, permanent gas, cloud single scattering, cloud multiple scattering and topography are comprehensively considered in the improved parameterization scheme. The estimated DSR was validated against in situ observations collected at 12 stations over the TP, which cover a variety of elevations, climates and land cover types. The validation results on different temporal scales show that the derived DSR based on the developed scheme is in good agreement with ground measurements. By comparing with existing, widely used DSR products based on the same in situ observations, the derived DSR of this study performed better with the smallest RMSE, the lowest absolute-value MB and comparable R values on different spatiotemporal scales. Furthermore, the derived DSR of this study can capture the temporal-variation characteristics as revealed by in situ observations. The proposed methodology also provided reasonable spatial distribution patterns. Specifically, this method demonstrated its superiority in characterizing more details and high dynamics of the spatial pattern of DSR due to its higher resolution (1 km) and terrain correction. In addition, the differences in the verification results and spatial distribution of different DSR products also prove that there are still great uncertainties in current DSR products over the TP.
It should be noted that there are still some discrepancies for estimated DSR. Several aspects may contribute to these discrepancies. First, the accuracy of the parameterization method depends on the accuracy of the input data, such as cloud and aerosol information, to some extent. At present, the inhomogeneity of the horizontal and vertical directions of clouds in nature cannot be fully reflected with the plane-parallel assumption, which is used for most cloud physical parameter inversions (Letu et al., 2020). The defects will lead to uncertainties in cloud parameters. For the atmospheric input parameters, the retrieval of AOD is quite challenging. The current popular Dark Target algorithm cannot deal well with AOD retrievals on bright surfaces, such as snow or ice cover. Some studies have shown that MODIS AOD products have high uncertainties in the TP compared with other regions (Wang et al., 2007; Xu et al., 2015). Second, there are many areas of snow or ice cover in the TP, and snow or ice and clouds are hard to distinguish due to their similar reflective optical characteristics in many spectral regions. The ground radiation field becomes extremely complex when the surface is covered by snow or ice. These factors make it still a very challenging task to estimate the DSR on snow or ice cover, especially under cloudy-sky conditions. Finally, kilometer-level satellite-based DSR is susceptible to the 3D radiative effects of clouds. It is difficult to tackle the 3D variability in clouds in DSR retrieval algorithms, especially for instantaneous DSR (Huang et al., 2019). Furthermore, because convective clouds are abundant and easily lead to precipitation over the TP (Fu et al., 2020), the 3D effect of clouds may be more difficult to address on the TP.
The improved parameterization scheme can provide an independent reference for surface radiation budget and land–atmosphere interaction studies over the TP. In this study, topographic effects are coupled in the DSR parameterization scheme by taking shading and terrain reflections into account. The sky view factor is also an important factor for DSR in mountainous areas (Ma et al., 2023). Further improvements may be achieved by introducing the sky view factor into the parameterization scheme. It is still a great challenge to evaluate DSR products over mountainous areas. Currently, it is difficult to perform full evaluations for this complex topography due to lack of in situ measurements at different aspects and on different slopes over the TP (Yan et al., 2020; Ma et al., 2023). Additionally, the generation of datasets of daily shortwave radiation remains a challenge. New-generation geostationary satellites with higher temporal and spectral resolutions, such as FengYun-4 and Himawari-8, have been launched successfully (Bessho et al., 2016; Guo et al., 2017). This provides an opportunity to obtain hourly and daily DSR. Moreover, this allows us to further extend this method to obtain more details of surface radiation components over the TP in the future.
where τa, τoz, τg, τw and τr refer to the broadband radiative transmittance for ozone aerosol extinction (aerosol scattering and absorption), ozone absorption, permanent-gas absorption, water vapor absorption and Rayleigh scattering, respectively. The above transmittances, τa, τoz, τg, τw and τr, were obtained primarily by the parameterizations of Yang et al. (2006a).
where τcld, τcld,a and τcld,ss refer to the broadband radiative transmittance, broadband radiative absorption transmittance and broadband radiative scattering transmittance caused by cloud single-scattering actions, respectively. τaa, τas and τcld,ms refer to the broadband radiative transmittance for aerosol absorption, aerosol scattering and cloud radiation multiple actions, respectively.
μ is the cosine of the solar zenith angle, and faer(μ) is the aerosol forward-scattering fraction, which is parameterized as
and τas can be described as follows:
The atmosphere hemispherical albedo ρa,cld is parameterized as
where the coefficients ( for different types of clouds can be found in the study by Huang et al. (2018). ωa is the aerosol single-scattering albedo, and its value depends on the type of aerosol (Levy et al., 2007; Huang et al., 2020).
Here, we assume that ozone absorption and air molecule scattering both take place above clouds (Qin et al., 2015; Tang et al., 2016; Huang et al., 2018). and can represent the part of diffuse radiation (caused by Rayleigh scattering and aerosol scattering, respectively) that finally reaches the surface after cloud multiscattering. can represent the part of diffuse radiation (caused by cloud single scattering) that finally reaches the surface after cloud multiscattering.
The topographic effects are taken into account in DSR estimation parameterization schemes by the solar zenith angle θ, the solar altitude angle α and the tilt angle of the surface (slope) s. According to this knowledge, Chen et al. (2013) provided a scheme that can be applied in mountainous areas based on high-resolution DEM datasets.
where L is latitude. δs is the declination of the Earth. hs is the hour angle. γ is the surface aspect angle.
The BSA and WSA are the surface albedos under the condition of complete direct and diffuse solar radiation, not the actual surface albedo. According to Pinty et al. (2005) and Stokes and Schwartz (1994), the actual surface albedo can be obtained by
The precipitable water w (cm) is estimated from relative humidity RH (%) and air temperature Tair (K) by a semiempirical formula (Yang et al., 2006, 2010):
The in situ measurements used in this study were obtained from the National Tibetan Plateau Data Center (http://data.tpdc.ac.cn, Ma, 2020) and National Cryosphere Desert Data Center (https://doi.org/10.12072/ncdc.ZPWERS.db1993.2022 and https://doi.org/10.12072/ncdc.ZPWERS.db2002.2022, Meng and Lv, 2022a, b; https://doi.org/10.12072/ncdc.CCI.db0016.2020 and https://doi.org/10.12072/ncdc.CCI.db0017.2020, Xiao and Qiao, 2020a, b). The MODIS products we used can be freely downloaded via the NASA website (https://modis.gsfc.nasa.gov/data/, last access: 1 November 2022, NASA, 2023).
PL and ZL designed and implemented the study. PL prepared the manuscript with help from ZL, YM and YF. MC and XW contributed to analysis of the data. YQ and ZW collected the in situ data. All commented on the paper.
The contact author has declared that none of the authors has any competing interests.
Publisher's note: Copernicus Publications remains neutral with regard to jurisdictional claims in published maps and institutional affiliations.
This work was funded by the Second Tibetan Plateau Scientific Expedition and Research (STEP) program (grant no. 2019QZKK0103), the Chinese Academy of Sciences (grant no. XDA20060101), the National Natural Science Foundation of China (grant nos. 41875031, 91837208, 41522501, 41275028), and CLIMATE-Pan-TPE in the framework of the ESA–MOST Dragon 5 program (grant no. 58516).
This research has been supported by the Second Tibetan Plateau Scientific Expedition and Research (STEP) program (grant no. 2019QZKK0103), the Chinese Academy of Sciences (grant no. XDA20060101), the National Natural Science Foundation of China (grant nos. 41875031, 91837208, 41522501, 41275028), and CLIMATE-Pan-TPE in the framework of the ESA–MOST Dragon 5 program (grant no. 58516).
This paper was edited by Odran Sourdeval and reviewed by three anonymous referees.
Ahn, C., Torres, O., and Bhartia, P. K.: Comparison of ozone monitoring instrument UV aerosol products with Aqua/Moderate Resolution Imaging Spectroradiometer and multiangle imaging spectroradiometer observations in 2006, J. Geophys. Res., 113, D16S27, https://doi.org/10.1029/2007jd008832, 2008.
Bessho, K., Date, K., Hayashi, M., Ikeda, A., Imai, T., Inoue, H., Kumagai, Y., Miyakawa, T., Murata, H., Ohno, T., Okuyama, A., Oyama, R., Sasaki, Y., Shimazu, Y., Shimoji, K., Sumida, Y., Suzuki, M., Taniguchi, H., Tsuchiyama, H., Uesawa, D., Yokota, H., and Yoshida, R.: An introduction to Himawari-8/9 – Japan's new-generation geostationary meteorological satellites, J. Meteorol. Soc. Jpn., 94, 151–183, https://doi.org/10.2151/jmsj.2016-009, 2016.
Bisht, G. and Bras, R. L.: Estimation of net radiation from the MODIS data under all sky conditions: Southern Great Plains case study, Remote Sens. Environ., 114, 1522–1534, https://doi.org/10.1016/j.rse.2010.02.007, 2010.
Bisht, G., Venturini, V., Islam, S., and Jiang, L.: Estimation of the net radiation using MODIS (Moderate Resolution Imaging Spectroradiometer) data for clear sky days, Remote Sens. Environ., 97, 52–67, https://doi.org/10.1016/j.rse.2005.03.014, 2005.
Chen, J., Hu, Z., Dou, S., and Zeyu, Q.: Yin–Yang Slope problem along Qinghai–Tibetan Lines and its radiation mechanism, Cold Reg. Sci. Technol., 44, 217–224, https://doi.org/10.1016/j.coldregions.2005.12.001, 2006.
Chen, X., Su, Z., Ma, Y., Yang, K., and Wang, B.: Estimation of surface energy fluxes under complex terrain of Mt. Qomolangma over the Tibetan Plateau, Hydrol. Earth Syst. Sci., 17, 1607–1618, https://doi.org/10.5194/hess-17-1607-2013, 2013.
Decker, M., Brunke, M. A., Wang, Z., Sakaguchi, K., Zeng, X., and Bosilovich, M. G.: Evaluation of the reanalysis products from GSFC, NCEP, and ECMWF using flux tower observations, J. Climate, 25, 1916–1944, https://doi.org/10.1175/jcli-d-11-00004.1, 2012.
Fu, Y., Ma, Y., Zhong, L., Yang, Y., Guo, X., Wang, C., Xu, X., Yang, K., Xu, X., Liu, L., Fan, G., Li, Y., and Wang, D.: Land-surface processes and summer-cloud-precipitation characteristics in the Tibetan Plateau and their effects on downstream weather: a review and perspective, Natl. Sci. Rev., 7, 500–515, https://doi.org/10.1093/nsr/nwz226, 2020.
Fujinami, H., Nomura, S., and Yasunari, T.: Characteristics of diurnal variations in convection and precipitation over the southern Tibetan Plateau during summer, Sola, 1, 49–52, https://doi.org/10.2151/sola.2005-014, 2005.
Gueymard, C. A.: Clear-sky irradiance predictions for solar resource mapping and large-scale applications: Improved validation methodology and detailed performance analysis of 18 broadband radiative models, Sol. Energy, 86, 2145–2169, https://doi.org/10.1016/j.solener.2011.11.011, 2012.
Guo, Q., Lu, F., Wei, C., Zhang, Z., and Yang, J.: Introducing the new generation of Chinese geostationary weather satellites, Fengyun-4, B. Am. Meteorol. Soc., 98, 1637–1658, https://doi.org/10.1175/bams-d-16-0065.1, 2017.
Hakuba, M. Z., Folini, D., Sanchez-Lorenzo, A., and Wild, M.: Spatial representativeness of ground-based solar radiation measurements, J. Geophys. Res.-Atmos., 118, 8585–8597, https://doi.org/10.1002/jgrd.50673, 2013.
Hans, H., Bell, W., Berrisford, P., Andras, H., Muñoz-Sabater, J., Nicolas, J., Raluca, R., Dinand, S., Adrian, S., Cornel, S., and Dick, D.: Global reanalysis: goodbye ERA-Interim, hello ERA5, ECMWF Newsletter No. 159 – Spring 2019, 17–24, 2019.
He, J., Yang, K., Tang, W., Lu, H., Qin, J., Chen, Y., and Li, X.: The first high-resolution meteorological forcing dataset for land process studies over China, Sci. Data, 7, 25, https://doi.org/10.1038/s41597-020-0369-y, 2020.
Hong, S.-Y., Kanamitsu, M., Kim, J.-E., and Koo, M.-S.: Effects of diurnal cycle on a simulated Asian summer monsoon, J. Climate, 25, 8394–8408, https://doi.org/10.1175/jcli-d-12-00069.1, 2012.
Huang, C., Shi, H., Gao, L., Liu, M., Chen, Q., Fu, D., Wang, S., Yuan, Y., and Xia, X. A.: Fengyun-4 geostationary satellite-based solar energy nowcasting system and its application in North China, Adv. Atmos. Sci., 39, 1316–1328, https://doi.org/10.1007/s00376-022-1464-0, 2022.
Huang, G., Li, X., Ma, M., Li, H., and Huang, C.: High resolution surface radiation products for studies of regional energy, hydrologic and ecological processes over Heihe river basin, northwest China, Agr. Forest. Meteorol, 230–231, 67–78, https://doi.org/10.1016/j.agrformet.2016.04.007, 2016a.
Huang, G., Li, X., Huang, C., Liu, S., Ma, Y., and Chen, H.: Representativeness errors of point-scale ground-based solar radiation measurements in the validation of remote sensing products, Remote Sens. Environ., 181, 198–206, https://doi.org/10.1016/j.rse.2016.04.001, 2016b.
Huang, G., Liang, S., Lu, N., Ma, M., and Wang, D.: Toward a broadband parameterization scheme for estimating surface solar irradiance: Development and preliminary results on MODIS products, J. Geophys. Res.-Atmos., 123, 12180–112193, https://doi.org/10.1029/2018jd028905, 2018.
Huang, G., Li, Z., Li, X., Liang, S., Yang, K., Wang, D., and Zhang, Y.: Estimating surface solar irradiance from satellites: Past, present, and future perspectives, Remote Sens. Environ., 233, 111371, https://doi.org/10.1016/j.rse.2019.111371, 2019.
Huang, G., Li, X., Lu, N., Wang, X., and He, T.: A general parameterization scheme for the estimation of incident photosynthetically active radiation under cloudy skies, IEEE T. Geosci. Remote, 58, 6255–6265, https://doi.org/10.1109/tgrs.2020.2976103, 2020.
Hwang, K., Choi, M., Lee, S. O., and Seo, J.-W.: Estimation of instantaneous and daily net radiation from MODIS data under clear sky conditions: a case study in East Asia, Irrigation Sci., 31, 1173–1184, https://doi.org/10.1007/s00271-012-0396-3, 2012.
Immerzeel, W. W., van Beek, L. P., and Bierkens, M. F.: Climate change will affect the Asian water towers, Science, 328, 1382–1385, https://doi.org/10.1126/science.1183188, 2010.
Kim, D.-H.: Aerosol optical properties over east Asia determined from ground-based sky radiation measurements, J. Geophys. Res., 109, D02209, https://doi.org/10.1029/2003jd003387, 2004.
Kuang, X. and Jiao, J. J.: Review on climate change on the Tibetan Plateau during the last half century, J. Geophys. Res.-Atmos., 121, 3979–4007, https://doi.org/10.1002/2015jd024728, 2016.
Kukulies, J., Chen, D., and Wang, M.: Temporal and spatial variations of convection, clouds and precipitation over the Tibetan Plateau from recent satellite observations. Part II: Precipitation climatology derived from global precipitation measurement mission, Int. J. Climatol., 40, 4858–4875, https://doi.org/10.1002/joc.6493, 2020.
Letu, H., Shi, J., Li, M., Wang, T., Shang, H., Lei, Y., Ji, D., Wen, J., Yang, K., and Chen, L.: A review of the estimation of downward surface shortwave radiation based on satellite data: Methods, progress and problems, Science China Earth Sciences, 63, 774–789, https://doi.org/10.1007/s11430-019-9589-0, 2020.
Letu, H., Nakajima, T. Y., Wang, T., Shang, H., Ma, R., Yang, K., Baran, A. J., Riedi, J., Ishimoto, H., Yoshida, M., Shi, C., Khatri, P., Du, Y., Chen, L., and Shi, J.: A new benchmark for surface radiation products over the East Asia–Pacific region retrieved from the Himawari-8/AHI next-generation geostationary satellite, B. Am. Meteorol. Soc., 103, E873–E888, https://doi.org/10.1175/bams-d-20-0148.1, 2022.
Levy, R. C., Remer, L. A., and Dubovik, O.: Global aerosol optical properties and application to Moderate Resolution Imaging Spectroradiometer aerosol retrieval over land, J. Geophys. Res.-Atmos., 112, D13210, https://doi.org/10.1029/2006jd007815, 2007.
Li, J., Tang, W., Yang, K., Xie, Y., Gueymard, C. A., Qin, J., and Sengupta, M.: An improved algorithm for estimating surface shortwave radiation: Preliminary evaluation with MODIS products, IEEE T. Geosci. Remote, 60, 1–9, https://doi.org/10.1109/tgrs.2021.3098742, 2022.
Li, Y., Wang, Y., Song, Y., Hu, L., Gao, S., and Rong, F.: Characteristics of summer convective systems initiated over the Tibetan Plateau. Part I: Origin, track, development, and precipitation, J. Appl. Meteorol. Clim., 47, 2679–2695, https://doi.org/10.1175/2008jamc1695.1, 2008.
Li, Z., Lyu, S., Wen, L., Zhao, L., Ao, Y., and Wang, S.: Effect of a cold, dry air incursion on atmospheric boundary layer processes over a high-altitude lake in the Tibetan Plateau, Atmos. Res., 185, 32–43, https://doi.org/10.1016/j.atmosres.2016.10.024, 2017.
Li, Z., Lyu, S., Wen, L., Zhao, L., Ao, Y., and Meng, X.: Study of freeze-thaw cycle and key radiation transfer parameters in a Tibetan Plateau lake using LAKE2.0 model and field observations, J. Glaciol., 67, 91–106, https://doi.org/10.1017/jog.2020.87, 2020.
Li, Z., Lyu, S., Chen, S., Ao, Y., Zhao, L., Chen, H., and Meng, X.: Observed characteristics of the water and heat transfer of the soil–snow–atmosphere system through the snowpack in the eastern Tibetan Plateau, Atmos. Res., 248, 105195, https://doi.org/10.1016/j.atmosres.2020.105195, 2021.
Li, Z. Q., Barker, H. W., and Moreau, L.: The variable effect of clouds on atmospheric absorption of solar-radiation, Nature, 376, 486–490, https://doi.org/10.1038/376486a0, 1995.
Li, Z. Q., Moreau, L., and Arking, A.: On solar energy disposition: A perspective from observation and modeling, B. Am. Meteorol. Soc., 78, 53–70, https://doi.org/10.1175/1520-0477(1997)078<0053:Osedap>2.0.Co;2, 1997.
Liang, S., Zheng, T., Liu, R., Fang, H., Tsay, S.-C., and Running, S.: Estimation of incident photosynthetically active radiation from Moderate Resolution Imaging Spectrometer data, J. Geophys. Res., 111, D15208, https://doi.org/10.1029/2005jd006730, 2006.
Liang, S., Wang, K., Zhang, X., and Wild, M.: Review on estimation of land surface radiation and energy budgets from ground measurement, remote sensing and model simulations, IEEE J. Sel. Top. Appl., 3, 225–240, https://doi.org/10.1109/jstars.2010.2048556, 2010.
Liang, S., Wang, D., He, T., and Yu, Y.: Remote sensing of earth's energy budget: synthesis and review, Int. J. Digit. Earth, 12, 737–780, https://doi.org/10.1080/17538947.2019.1597189, 2019.
Loeb, N. G., Kato, S., Rose, F. G., Doelling, D. R., Rutan, D. A., Caldwell, T. E., Yu, L., and Weller, R. A.: Surface irradiances consistent with CERES-derived top-of-atmosphere shortwave and longwave irradiances, J. Climate, 26, 2719–2740, https://doi.org/10.1175/jcli-d-12-00436.1, 2013.
Lu, N., Liu, R., Liu, J., and Liang, S.: An algorithm for estimating downward shortwave radiation from GMS 5 visible imagery and its evaluation over China, J. Geophys. Res., 115, D18102, https://doi.org/10.1029/2009jd013457, 2010.
Lu, N., Qin, J., Yang, K., and Sun, J.: A simple and efficient algorithm to estimate daily global solar radiation from geostationary satellite data, Energy, 36, 3179–3188, https://doi.org/10.1016/j.energy.2011.03.007, 2011.
Ma, R., Letu, H., Yang, K., Wang, T., Shi, C., Xu, J., Shi, J., Shi, C., and Chen, L.: Estimation of surface shortwave radiation from Himawari-8 satellite data based on a combination of radiative transfer and deep neural network, IEEE T. Geosci. Remote, 58, 5304–5316, https://doi.org/10.1109/tgrs.2019.2963262, 2020.
Ma, Y., Wang, Y., Wu, R., Hu, Z., Yang, K., Li, M., Ma, W., Zhong, L., Sun, F., Chen, X., Zhu, Z., Wang, S., and Ishikawa, H.: Recent advances on the study of atmosphere-land interaction observations on the Tibetan Plateau, Hydrol. Earth Syst. Sci., 13, 1103–1111, https://doi.org/10.5194/hess-13-1103-2009, 2009.
Ma, Y., Zhu, Z., Zhong, L., Wang, B., Han, C., Wang, Z., Wang, Y., Lu, L., Amatya, P. M., Ma, W., and Hu, Z.: Combining MODIS, AVHRR and in situ data for evapotranspiration estimation over heterogeneous landscape of the Tibetan Plateau, Atmos. Chem. Phys., 14, 1507–1515, https://doi.org/10.5194/acp-14-1507-2014, 2014.
Ma, Y., Ma, W., Zhong, L., Hu, Z., Li, M., Zhu, Z., Han, C., Wang, B., and Liu, X.: Monitoring and modeling the Tibetan Plateau's climate system and its impact on East Asia, Sci. Rep., 7, 44574, https://doi.org/10.1038/srep44574, 2017.
Ma, Y., Hu, Z., Xie, Z., Ma, W., Wang, B., Chen, X., Li, M., Zhong, L., Sun, F., Gu, L., Han, C., Zhang, L., Liu, X., Ding, Z., Sun, G., Wang, S., Wang, Y., and Wang, Z.: A long-term (2005–2016) dataset of hourly integrated land–atmosphere interaction observations on the Tibetan Plateau, Earth Syst. Sci. Data, 12, 2937–2957, https://doi.org/10.5194/essd-12-2937-2020, 2020a.
Ma, Y.: A long-term dataset of integrated land-atmosphere interaction observations on the Tibetan Plateau (2005–2016), TPDC [data set], http://data.tpdc.ac.cn (last access: 1 November 2022), 2020.
Ma, Y., He, T., Liang, S., McVicar, T. R., Hao, D., Liu, T., and Jiang, B.: Estimation of fine spatial resolution all-sky surface net shortwave radiation over mountainous terrain from Landsat 8 and Sentinel-2 data, Remote Sens. Environ., 285, 113364, https://doi.org/10.1016/j.rse.2022.113364, 2023.
Ma, Y. M., Kang, S. C., Zhu, L. P., Xu, B. Q., Tian, L. D., and Yao, T. D.: Tibetan observation and research platform atmosphere-land interaction over a heterogeneous landscape, B. Am. Meteorol. Soc., 89, 1487, https://doi.org/10.1175/2008bams2545.1, 2008.
Masuda, K., Leighton, H. G., and Li, Z. Q.: A new parameterization for the determination of solar flux absorbed at the surface from satellite measurements, J. Climate, 8, 1615–1629, https://doi.org/10.1175/1520-0442(1995)008<1615:Anpftd>2.0.Co;2, 1995.
Meng, X. and Lv, S.: Routine meteorological observation data of grassland observation points in erling Lake Basin, NCDC [data set], https://doi.org/10.12072/ncdc.ZPWERS.db1993.2022 (last access: 1 November 2022), 2022a.
Meng, X. and Lv, S.: Routine meteorological observation data of lakeside observation points in erling Lake Basin, NCDC [data set], https://doi.org/10.12072/ncdc.ZPWERS.db2002.2022 (last access: 1 November 2022), 2022b.
NASA: MODIS Moderate Resolution Imaging Spectroradiometer, NASA [data set], https://modis.gsfc.nasa.gov/data/ (last access: 1 November 2022), 2023.
Niemela, S., Raisanen, P., and Savijarvi, H.: Comparison of surface radiative flux parameterizations – Part II. Shortwave radiation, Atmos. Res., 58, 141–154, https://doi.org/10.1016/S0169-8095(01)00085-0, 2001.
Olson, M. and Rupper, S.: Impacts of topographic shading on direct solar radiation for valley glaciers in complex topography, The Cryosphere, 13, 29–40, https://doi.org/10.5194/tc-13-29-2019, 2019.
Piao, S., Ciais, P., Huang, Y., Shen, Z., Peng, S., Li, J., Zhou, L., Liu, H., Ma, Y., Ding, Y., Friedlingstein, P., Liu, C., Tan, K., Yu, Y., Zhang, T., and Fang, J.: The impacts of climate change on water resources and agriculture in China, Nature, 467, 43–51, https://doi.org/10.1038/nature09364, 2010.
Pinker, R. T. and Laszlo, I.: Modeling surface solar irradiance for satellite applications on a global scale, J. Appl. Meteorol., 31, 194–211, https://doi.org/10.1175/1520-0450(1992)031<0194:Mssifs>2.0.Co;2, 1992.
Pinker, R. T., Zhang, B., and Dutton, E. G.: Do satellites detect trends in surface solar radiation?, Science, 308, 850–854, https://doi.org/10.1126/science.1103159, 2005.
Pinker, R. T., Li, X., Meng, W., and Yegorova, E. A.: Toward improved satellite estimates of short-wave radiative fluxes – Focus on cloud detection over snow: 2. Results, J. Geophys. Res., 112, D09204, https://doi.org/10.1029/2005jd006699, 2007.
Pinty, B., Lattanzio, A., Martonchik, J. V., Verstraete, M. M., Gobron, N., Taberner, M., Widlowski, J. L., Dickinson, R. E., and Govaerts, Y.: Coupling diffuse sky radiation and surface albedo, J. Atmos. Sci., 62, 2580–2591, https://doi.org/10.1175/Jas3479.1, 2005.
Platnick, S., King, M. D., Ackerman, S. A., Menzel, W. P., Baum, B. A., Riedi, J. C., and Frey, R. A.: The MODIS cloud products: algorithms and examples from terra, IEEE T. Geosci. Remote, 41, 459–473, https://doi.org/10.1109/tgrs.2002.808301, 2003.
Platnick, S., Meyer, K. G., King, M. D., Wind, G., Amarasinghe, N., Marchant, B., Arnold, G. T., Zhang, Z., Hubanks, P. A., Holz, R. E., Yang, P., Ridgway, W. L., and Riedi, J.: The MODIS cloud optical and microphysical products: Collection 6 updates and examples from Terra and Aqua, IEEE T. Geosci. Remote, 55, 502–525, https://doi.org/10.1109/TGRS.2016.2610522, 2017.
Qin, J., Chen, Z., Yang, K., Liang, S., and Tang, W.: Estimation of monthly-mean daily global solar radiation based on MODIS and TRMM products, Appl. Energ., 88, 2480–2489, https://doi.org/10.1016/j.apenergy.2011.01.018, 2011.
Qin, J., Tang, W., Yang, K., Lu, N., Niu, X., and Liang, S.: An efficient physically based parameterization to derive surface solar irradiance based on satellite atmospheric products, J. Geophys. Res.-Atmos., 120, 4975–4988, https://doi.org/10.1002/2015jd023097, 2015.
Qiu, J.: The third pole, Nature, 454, 393–396, https://doi.org/10.1038/454393a, 2008.
Roupioz, L., Jia, L., Nerry, F., and Menenti, M.: Estimation of daily solar radiation budget at kilometer resolution over the Tibetan Plateau by integrating MODIS data products and a DEM, Remote Sens.-Basel, 8, 504, https://doi.org/10.3390/rs8060504, 2016.
Schaaf, C. B., Gao, F., Strahler, A. H., Lucht, W., Li, X. W., Tsang, T., Strugnell, N. C., Zhang, X. Y., Jin, Y. F., Muller, J. P., Lewis, P., Barnsley, M., Hobson, P., Disney, M., Roberts, G., Dunderdale, M., Doll, C., d'Entremont, R. P., Hu, B. X., Liang, S. L., Privette, J. L., and Roy, D.: First operational BRDF, albedo nadir reflectance products from MODIS, Remote Sens. Environ., 83, 135–148, https://doi.org/10.1016/S0034-4257(02)00091-3, 2002.
Sengupta, M., Xie, Y., Lopez, A., Habte, A., Maclaurin, G., and Shelby, J.: The National Solar Radiation Data Base (NSRDB), Renew. Sust. Energ. Rev., 89, 51–60, https://doi.org/10.1016/j.rser.2018.03.003, 2018.
Stephens, G. L., Li, J., Wild, M., Clayson, C. A., Loeb, N., Kato, S., L'Ecuyer, T., Stackhouse, P. W., Lebsock, M., and Andrews, T.: An update on Earth's energy balance in light of the latest global observations, Nat. Geosci., 5, 691–696, https://doi.org/10.1038/ngeo1580, 2012.
Stokes, G. M. and Schwartz, S. E.: The Atmospheric Radiation - Measurement (Arm) program – programmatic background and design of the cloud and radiation Test-Bed, B. Am. Meteorol. Soc., 75, 1201–1221, https://doi.org/10.1175/1520-0477(1994)075<1201:Tarmpp>2.0.Co;2, 1994.
Tanaka, K., Ishikawa, H., Hayashi, T., Tamagawa, I., and Ma, Y. M.: Surface energy budget at Amdo on the Tibetan Plateau using GAME/Tibet IOP98 data, J. Meteorol. Soc. Jpn., 79, 505–517, https://doi.org/10.2151/jmsj.79.505, 2001.
Tang, W., Qin, J., Yang, K., Liu, S., Lu, N., and Niu, X.: Retrieving high-resolution surface solar radiation with cloud parameters derived by combining MODIS and MTSAT data, Atmos. Chem. Phys., 16, 2543–2557, https://doi.org/10.5194/acp-16-2543-2016, 2016.
Tang, W., Yang, K., Qin, J., Li, X., and Niu, X.: A 16-year dataset (2000–2015) of high-resolution (3 h, 10 km) global surface solar radiation, Earth Syst. Sci. Data, 11, 1905–1915, https://doi.org/10.5194/essd-11-1905-2019, 2019.
Tovar, J., Olmo, F. J., and Aladosarboledas, L.: Local-scale variability of solar-radiation in a mountainous region, J. Appl. Meteorol., 34, 2316–2322, https://doi.org/10.1175/1520-0450(1995)034<2316:LSVOSR>2.0.CO;2, 1995.
Wang, D., Liang, S., Zhang, Y., Gao, X., Brown, M. G. L., and Jia, A.: A new set of MODIS land products (MCD18): Downward shortwave radiation and photosynthetically active radiation, Remote Sens., 12, 168, https://doi.org/10.3390/rs12010168, 2020.
Wang, G., Wang, T., and Xue, H.: Validation and comparison of surface shortwave and longwave radiation products over the three poles, Int. J. Appl. Earth Obs., 104, 102538, https://doi.org/10.1016/j.jag.2021.102538, 2021.
Wang, K. and Dickinson, R. E.: Contribution of solar radiation to decadal temperature variability over land, P. Natl. Acad Sci. USA, 110, 14877–14882, https://doi.org/10.1073/pnas.1311433110, 2013.
Wang, L., Xin, J., Wang, Y., Li, Z., Liu, G., and Li, J.: Evaluation of the MODIS aerosol optical depth retrieval over different ecosystems in China during EAST-AIRE, Atmos. Environ., 41, 7138–7149, https://doi.org/10.1016/j.atmosenv.2007.05.001, 2007.
Wang, L., Gong, W., Hu, B., Lin, A., Li, H., and Zou, L.: Modeling and analysis of the spatiotemporal variations of photosynthetically active radiation in China during 1961–2012, Renew. Sust. Energ. Rev., 49, 1019–1032, https://doi.org/10.1016/j.rser.2015.04.174, 2015.
Wei, Y., Zhang, X., Hou, N., Zhang, W., Jia, K., and Yao, Y.: Estimation of surface downward shortwave radiation over China from AVHRR data based on four machine learning methods, Sol. Energy, 177, 32–46, https://doi.org/10.1016/j.solener.2018.11.008, 2019.
Wu, G., Liu, Y., He, B., Bao, Q., Duan, A., and Jin, F. F.: Thermal controls on the Asian summer monsoon, Sci. Rep., 2, 404, https://doi.org/10.1038/srep00404, 2012.
Xiao, Y. and Qiao, Y.: Meteorological dataset of Tanggula permafrost on Qinghai-Tibet Plateau from 2014 to 2016, NCDC [data set], https://doi.org/10.12072/ncdc.CCI.db0016.2020 (last access: 1 November 2022), 2020a.
Xiao, Y. and Qiao, Y.: Meteorological data set of permafrost in Xidatan, Qinghai-Tibet Plateau, 2014–2016, NCDC [data set], https://doi.org/10.12072/ncdc.CCI.db0017.2020 (last access: 1 November 2022), 2020b.
Xie, Y., Sengupta, M., and Dudhia, J.: A Fast All-sky Radiation Model for Solar applications (FARMS): Algorithm and performance evaluation, Sol. Energy, 135, 435–445, https://doi.org/10.1016/j.solener.2016.06.003, 2016.
Xu, C., Ma, Y. M., You, C., and Zhu, Z. K.: The regional distribution characteristics of aerosol optical depth over the Tibetan Plateau, Atmos. Chem. Phys., 15, 12065–12078, https://doi.org/10.5194/acp-15-12065-2015, 2015.
Xu, W., Ma, L., Ma, M., Zhang, H., and Yuan, W.: Spatial–temporal variability of snow cover and depth in the Qinghai–Tibetan Plateau, J. Climate, 30, 1521–1533, https://doi.org/10.1175/jcli-d-15-0732.1, 2017.
Xu, X., Lu, C., Shi, X., and Gao, S.: World water tower: An atmospheric perspective, Geophys. Res. Lett., 35, L20815, https://doi.org/10.1029/2008gl035867, 2008.
Yan, G., Chu, Q., Tong, Y., Mu, X., Qi, J., Zhou, Y., Liu, Y., Wang, T., Xie, D., Zhang, W., Yan, K., Chen, S., and Zhou, H.: An operational method for validating the downward shortwave radiation over rugged terrains, IEEE T. Geosci. Remote, 1–18, 714–731, https://doi.org/10.1109/tgrs.2020.2994384, 2020.
Yang, D., Wang, W., and Xia, X. A.: A concise overview on solar resource assessment and forecasting, Adv. Atmos. Sci., 39, 1239–1251, https://doi.org/10.1007/s00376-021-1372-8, 2022.
Yang, K., Koike, T., and Ye, B.: Improving estimation of hourly, daily, and monthly solar radiation by importing global data sets, Agr. Forest Meteorol., 137, 43–55, https://doi.org/10.1016/j.agrformet.2006.02.001, 2006a.
Yang, K., Koike, T., Stackhouse, P., Mikovitz, C., and Cox, S. J.: An assessment of satellite surface radiation products for highlands with Tibet instrumental data, Geophys. Res. Lett., 33, L22403, https://doi.org/10.1029/2006gl027640, 2006b.
Yang, K., Pinker, R. T., Ma, Y., Koike, T., Wonsick, M. M., Cox, S. J., Zhang, Y., and Stackhouse, P.: Evaluation of satellite estimates of downward shortwave radiation over the Tibetan Plateau, J. Geophys. Res., 113, D17204, https://doi.org/10.1029/2007jd009736, 2008.
Yang, K., He, J., Tang, W., Qin, J., and Cheng, C. C. K.: On downward shortwave and longwave radiations over high altitude regions: Observation and modeling in the Tibetan Plateau, Agr. Forest Meteorol., 150, 38–46, https://doi.org/10.1016/j.agrformet.2009.08.004, 2010.
Yang, K., Wu, H., Qin, J., Lin, C., Tang, W., and Chen, Y.: Recent climate changes over the Tibetan Plateau and their impacts on energy and water cycle: A review, Global Planet. Change, 112, 79–91, https://doi.org/10.1016/j.gloplacha.2013.12.001, 2014.
Yang, M., Nelson, F. E., Shiklomanov, N. I., Guo, D., and Wan, G.: Permafrost degradation and its environmental effects on the Tibetan Plateau: A review of recent research, Earth-Sci. Rev., 103, 31–44, https://doi.org/10.1016/j.earscirev.2010.07.002, 2010.
Yao, J., Zhao, L., Gu, L., Qiao, Y., and Jiao, K.: The surface energy budget in the permafrost region of the Tibetan Plateau, Atmos. Res., 102, 394–407, https://doi.org/10.1016/j.atmosres.2011.09.001, 2011.
Yao, T., Thompson, L., Yang, W., Yu, W., Gao, Y., Guo, X., Yang, X., Duan, K., Zhao, H., Xu, B., Pu, J., Lu, A., Xiang, Y., Kattel, D. B., and Joswiak, D.: Different glacier status with atmospheric circulations in Tibetan Plateau and surroundings, Nat. Clim. Change, 2, 663–667, https://doi.org/10.1038/nclimate1580, 2012.
Zhang, H., Xin, X., Li, L., and Liu, Q.: Estimating global solar radiation using a hybrid parametric model from MODIS data over the Tibetan Plateau, Sol. Energy, 112, 373–382, https://doi.org/10.1016/j.solener.2014.12.015, 2015.
Zhang, J., Zhao, L., Deng, S., Xu, W., and Zhang, Y.: A critical review of the models used to estimate solar radiation, Renew. Sust. Energ. Rev., 70, 314–329, https://doi.org/10.1016/j.rser.2016.11.124, 2017.
Zhang, K., Zhao, L., Tang, W., Yang, K., and Wang, J.: Global and regional evaluation of the CERES edition-4A surface solar radiation and its uncertainty quantification, IEEE J. Sel. Top. Appl., 15, 2971–2985, https://doi.org/10.1109/jstars.2022.3164471, 2022.
Zhang, T., Stackhouse, P. W., Chandler, W. S., and Westberg, D. J.: Application of a global-to-beam irradiance model to the NASA GEWEX SRB dataset: An extension of the NASA surface meteorology and solar energy datasets, Sol. Energy, 110, 117–131, https://doi.org/10.1016/j.solener.2014.09.006, 2014.
Zhao, C., Chen, Y., Li, J., Letu, H., Su, Y., Chen, T., and Wu, X.: Fifteen-year statistical analysis of cloud characteristics over China using Terra and Aqua Moderate Resolution Imaging Spectroradiometer observations, Int. J. Climatol., 39, 2612–2629, https://doi.org/10.1002/joc.5975, 2019.
Zhao, L., Zou, D., Hu, G., Wu, T., Du, E., Liu, G., Xiao, Y., Li, R., Pang, Q., Qiao, Y., Wu, X., Sun, Z., Xing, Z., Sheng, Y., Zhao, Y., Shi, J., Xie, C., Wang, L., Wang, C., and Cheng, G.: A synthesis dataset of permafrost thermal state for the Qinghai–Tibet (Xizang) Plateau, China, Earth Syst. Sci. Data, 13, 4207–4218, https://doi.org/10.5194/essd-13-4207-2021, 2021.
Zhao, P., Xu, X., Chen, F., Guo, X., Zheng, X., Liu, L., Hong, Y., Li, Y., La, Z., Peng, H., Zhong, L., Ma, Y., Tang, S., Liu, Y., Liu, H., Li, Y., Zhang, Q., Hu, Z., Sun, J., Zhang, S., Dong, L., Zhang, H., Zhao, Y., Yan, X., Xiao, A., Wan, W., Liu, Y., Chen, J., Liu, G., Zhaxi, Y., and Zhou, X.: The third atmospheric scientific experiment for understanding the earth–atmosphere coupled system over the Tibetan Plateau and its effects, B. Am. Meteorol. Soc., 99, 757–776, https://doi.org/10.1175/bams-d-16-0050.1, 2018.
Zhao, P., Zhou, X., Chen, J., Liu, G., and Nan, S.: Global climate effects of summer Tibetan Plateau, Sci. Bull., 64, 1–3, https://doi.org/10.1016/j.scib.2018.11.019, 2019.
Zhong, L., Ma, Y., Su, Z., and Salama, M. S.: Estimation of land surface temperature over the Tibetan Plateau using AVHRR and MODIS data, Adv. Atmos. Sci., 27, 1110–1118, https://doi.org/10.1007/s00376-009-9133-0, 2010.
Zhong, L., Ma, Y., Hu, Z., Fu, Y., Hu, Y., Wang, X., Cheng, M., and Ge, N.: Estimation of hourly land surface heat fluxes over the Tibetan Plateau by the combined use of geostationary and polar-orbiting satellites, Atmos. Chem. Phys., 19, 5529–5541, https://doi.org/10.5194/acp-19-5529-2019, 2019a.
Zhong, L., Zou, M., Ma, Y., Huang, Z., Xu, K., Wang, X., Ge, N., and Cheng, M.: Estimation of downwelling shortwave and longwave radiation in the Tibetan Plateau under all-sky conditions, J. Geophys. Res.-Atmos., 124, 11086–11102, https://doi.org/10.1029/2019jd030763, 2019b.
Zhou, Y., Li, Z., Li, J., Zhao, R., and Ding, X.: Glacier mass balance in the Qinghai–Tibet Plateau and its surroundings from the mid-1970s to 2000 based on Hexagon KH-9 and SRTM DEMs, Remote Sens. Environ., 210, 96–112, https://doi.org/10.1016/j.rse.2018.03.020, 2018.