the Creative Commons Attribution 4.0 License.
the Creative Commons Attribution 4.0 License.
 | 11 Aug 2023
Influence of natural and anthropogenic aerosols on cloud base droplet size distributions in clouds over the South China Sea and West Pacific
Robert M. Rauber
Larry Di Girolamo
Matthew Rilloraza
Dongwei Fu
Greg M. McFarquhar
Stephen W. Nesbitt
Luke D. Ziemba
Sarah Woods
Kenneth Lee Thornhill
Cumulus clouds are common over maritime regions. They are important regulators of the global radiative energy budget and global hydrologic cycle, as well as a key contributor to the uncertainty in anthropogenic climate change projections due to uncertainty in aerosol–cloud interactions. These interactions are regionally specific owing to their strong influences on aerosol sources and meteorology. Here, our analysis focuses on the statistical properties of marine boundary layer (MBL) aerosol chemistry and the relationships of MBL aerosol to cumulus cloud properties just above cloud base as sampled in 2019 during the NASA Cloud, Aerosol and Monsoon Processes Philippines Experiment (CAMP2Ex). The aerosol and clouds were sampled by instruments on the NASA P-3 aircraft over three distinct maritime regions around the Philippines: the West Pacific, the South China Sea, and the Sulu Sea.
Our analysis shows three primary sources influenced the aerosol chemical composition: clean marine (ocean source), industrial (Southeast Asia, Manila, and cargo and tanker ship emissions), and biomass burning (Borneo and Indonesia). The clean marine aerosol chemical composition had low values of all sampled chemical signatures, specifically median values of 2.2 µg m−3 of organics (ORG), 2.3 µg m−3 of SO4, 0.3 µg m−3 of NO3, 1.4 µg m−3 of NH4, 0.04 µg m−3 of Cl, and 0.0074 µg m−3 of refractory black carbon (BC). Chemical signatures of the other two aerosol source regions were industrial, with elevated SO4 having a median value of 6.1 µg m−3, and biomass burning, with elevated median concentrations of ORG 21.2 µg m−3 and BC 0.1351 µg m−3. Based on chemical signatures, the industrial component was primarily from ship emissions, which were sampled within 60 km of ships and within projected ship plumes. Normalized cloud droplet size distributions in clouds sampled near the MBL passes of the P-3 showed that clouds impacted by industrial and biomass burning contained higher concentrations of cloud droplets, by as much as 1.5 orders of magnitude for diameters < 13 µm compared to clean marine clouds, while at size ranges between 13.0–34.5 µm the median concentrations of cloud droplets in all aerosol categories were nearly an order of magnitude less than the clean marine category. In the droplet size bins centered at diameters > 34.5 µm concentrations were equal to, or slightly exceeded, the concentrations of the clean marine clouds. These analyses show that anthropogenic aerosols generated from industrial and biomass burning sources significantly influenced cloud base microphysical structure in the Philippine region enhancing the small droplet concentration and reducing the concentration of mid-sized droplets.
- Article
(10076 KB) - Full-text XML
- BibTeX
- EndNote


Aerosol and cloud interactions have long been one of the largest uncertainties in anthropogenic climate change predictions (IPCC, 2021). Efforts to intensify aerosol–cloud interaction research aimed at specific regions has been called for (e.g., Stevens and Feingold, 2009) to understand their responses to different aerosol sources and environmental conditions. Southeast Asia is a quintessential research location to investigate a variety of aerosol emissions and their subsequent impact on tropical clouds (Reid et al., 2013, 2015). Biomass burning (BB) aerosols in the Southeast Asia region, which result from fires that are both natural and anthropogenic, have both a direct and semi-direct radiative effect (e.g., Lin et al., 2014; Ding et al., 2021; Mallet et al., 2021). BB aerosols absorb and scatter solar radiation that affects the lifetime and properties of clouds (e.g., Andreae, 1991; Penner et al., 1992; Ackerman et al., 2000; Bond et al., 2013) and influence regional and global climate (Crutzen and Andreae, 1990). BB aerosols also impact cloud condensation nuclei (CCN) concentrations, their activation, and droplet formation (Hallet et al., 1989; Kacarab et al., 2020; Zheng et al., 2020). In the Southeast Asia region, the semi-direct effect of BB aerosols in the vertical direction intensifies low cloud cover over ocean and land (Ding et al., 2021).
Other aerosols produced in this region result from both anthropogenic and natural sources. Natural aerosols include sea salt and mineral dust, amongst others, while anthropogenic aerosols are dominated by organics, sulfates, black carbon (BC), and nitrates. BC aerosols are formed from the incomplete combustion of hydrocarbons, e.g., coal power plants, agricultural BB, and combustion engines (Zhang et al., 2012; Li et al., 2016), with primary sources in the large urban areas of Southeast Asia. Long-range southeastward transport of anthropogenic aerosols from East Asia has been measured in the South China Sea (Wang et al., 2013; Lin et al., 2014). Additionally, the Manila urban pollution has exceedingly high BC concentrations from diesel exhaust (Bond and Bergstrom, 2006). Nitrate aerosols scatter radiation more effectively, and their concentrations in the atmosphere may surpass sulfate levels in the near future (An et al., 2019; Zhang et al., 2012). The impact of anthropogenic aerosols such as sulfate, nitrate, and BC has been a main topic of interest for many years as they lead to an increase in CCN that increases the cloud droplet number concentration (Nc) and decreases the effective radius (re) of the droplets, producing more reflective clouds for the same liquid water path (e.g., Twomey, 1974, 1977; Ackerman et al., 2000; Hudson et al., 2009; Hudson and Noble, 2014). During a field campaign over the Indian Ocean in 1999, clouds impacted by anthropogenic aerosols had Nc up to 3 times greater than in clean marine clouds, along with an increase in cloud optical depth (Heymsfield and McFarquhar, 2001; Hudson and Yum, 2002; McFarqhuar et al., 2004).
Shipping and marine traffic also introduces aerosols over marine areas, particularly near shipping lanes (Marmer and Langmann, 2005). In terms of anthropogenic aerosols, shipping pollution is the largest and least regulated source of anthropogenic pollutants over oceans (Marmer and Langmann, 2005), emitting carbon monoxide (CO), sulfur oxides (SOx), nitrogen oxides (NOx), particulate matter (PM), volatile organic compounds (VOCs), and greenhouse gases constantly into the atmosphere (Corbett and Fischbeck, 1997). Ship tracks, and shipping emissions from individual ships, have been studied since the 1960s (Durkee et al., 2000; Eyring et al., 2005). Shipping is expected to contribute to 17 % of global CO2 emissions by 2050 (Cames et al., 2015). The impact of shipping pollution on marine clouds and precipitation has been explored in recent decades (Petzold et al., 2008; Rosenfeld et al., 2008; Stevens and Feingold, 2009; Coggon et al., 2012; Juwono et al., 2013; Russell et al., 2013; Gryspeerdt et al., 2019; Toll et al., 2019; Manshausen et al., 2022). For example, Radke et al. (1989) observed an increase in total cloud droplet concentrations but a decrease in cloud droplet sizes in clouds over shipping lanes. Cloud droplet number has also been reported to increase with aerosol loading over the East China Sea (Bennartz et al., 2011). Ships emit carbonaceous particles from burning fuel. They also produce sulfur dioxide and sulfates that lead to increased CCN (Capaldo et al., 1999; Hobbs et al., 2000; Hudson et al., 2000).
Previous field campaigns in the Southeast Asia region, such as the Seven South East Asian Studies (7SEAS) (Reid et al., 2013), were aimed at understanding aerosol radiative effects and aerosol particle characteristics using ground- and ship-based measurements (Reid et al., 2015, 2016; Hilario et al., 2020). The impact of aerosols on low clouds in this region has been difficult to observe from satellite due to heavy cirrus cloud cover (Reid et al., 2013; Hong and Di Girolamo, 2020) and to model because of our current poor understanding of cloud properties in lower-level clouds beneath the cirrus (Wang et al., 2013; Xian et al., 2013). Past studies of aerosol and cloud properties on aircraft-based platforms in the Southeast Asia region include the Indian Ocean Experiment (INDOEX) (Twohy et al., 2001; Ramanathan et al., 2002), the Atmospheric Chemistry Experiment in Asia (ACE-Asia) (Huebert et al., 2003), the Atmospheric Brown Clouds project (Ramanathan et al., 2005; Nakajima et al., 2007), and the East Asian Study of Tropospheric Aerosols: an International Regional Experiment (EAST-AIRE) (Z. Li et al., 2011).
During late August through October 2019, the Cloud, Aerosol and Monsoon Processes Philippines Experiment (CAMP2Ex), which operated out of Clark International Airport on Luzon Island in the Philippines, offered an opportunity to conduct airborne sampling in tropical maritime convective environments that are closer to the Philippines, employing an extensive suite of aerosol, cloud, and radiation measurements. The CAMP2Ex sampling area was over the Philippine waters comprising the easternmost part of the South China Sea, the West Pacific just east of Luzon, and the Sulu Sea. CAMP2Ex used two research aircraft, namely the National Aeronautics and Space Administration (NASA) P-3 and the Stratton Park Engineering Company (SPEC), Inc. Learjet 35, to sample aerosol from three different sources, marine, BB, and industrial, and to sample the clouds influenced by these aerosols. This paper only uses data collected by the P-3.
The Southeast Asia regional meteorological and climate features, described in Reid et al. (2013), are key factors for aerosol transport and cloud formation and propagation throughout the region. Large-scale features include circulations such as those associated with the Southern Oscillation (Rasmusson and Wallace, 1983; McBride et al., 2003) and monsoonal flows tied to seasonal shifts in the Intertropical Convergence Zone (ITCZ) (Chang et al., 2005; Wang et al., 2009). Smaller-scale meteorological features affecting aerosol transport and clouds include tropical cyclones (Yasunaga et al., 2003; Zhang et al., 2003), land and sea breezes, and shallow to moderate convection typical of fair weather in trade wind regions (e.g., Schafer et al., 2001; Zuidema et al., 2012).
The first part of CAMP2Ex (24 August–22 September 2019) occurred when the southeast Asian monsoon trough was located north of the Philippines, and the flow was directed from the maritime continent northeastward, transporting aerosol associated with biomass burning toward the sampling region. The second part of CAMP2Ex (23 September–5 October 2019) occurred after the monsoon trough retreated south of the archipelago and the northwest monsoon flow moved across the sampling region (see Fig. 2 in Reid et al., 2023). The monsoon flow during CAMP2Ex was impacted occasionally by the passage of tropical cyclones which moved westward north of Luzon along the monsoon trough.
During both monsoon periods, clouds over the sampling regions were primarily small maritime cumulus, with deeper convection and associated cold pools developing, for example, by heating over local islands or lifting along cold pool outflows.
Three aerosol source regions influence the boundary layer air over the Philippine region (Fig. 1). When the southwest monsoon flow is present, BB aerosols are advected northward over the Sulu Sea south of Luzon from regions in Malaysia and Indonesia (Xian et al., 2013). These regions are prone to peatland fires and human-caused agricultural fires, which are enhanced during periods of drought and El Niño conditions (Reid et al., 2012; Yin, 2020). Long-range southeastward transport of anthropogenic aerosols from large cities of East Asia into the South China Sea can be present year-around (Wang et al., 2013; Lin et al., 2014). Also several international shipping lanes transect the South China Sea and Sulu Sea. All of these aerosols combine with natural marine aerosols to produce the characteristic aerosol populations found in the oceanic boundary layer regions surrounding the Philippines.
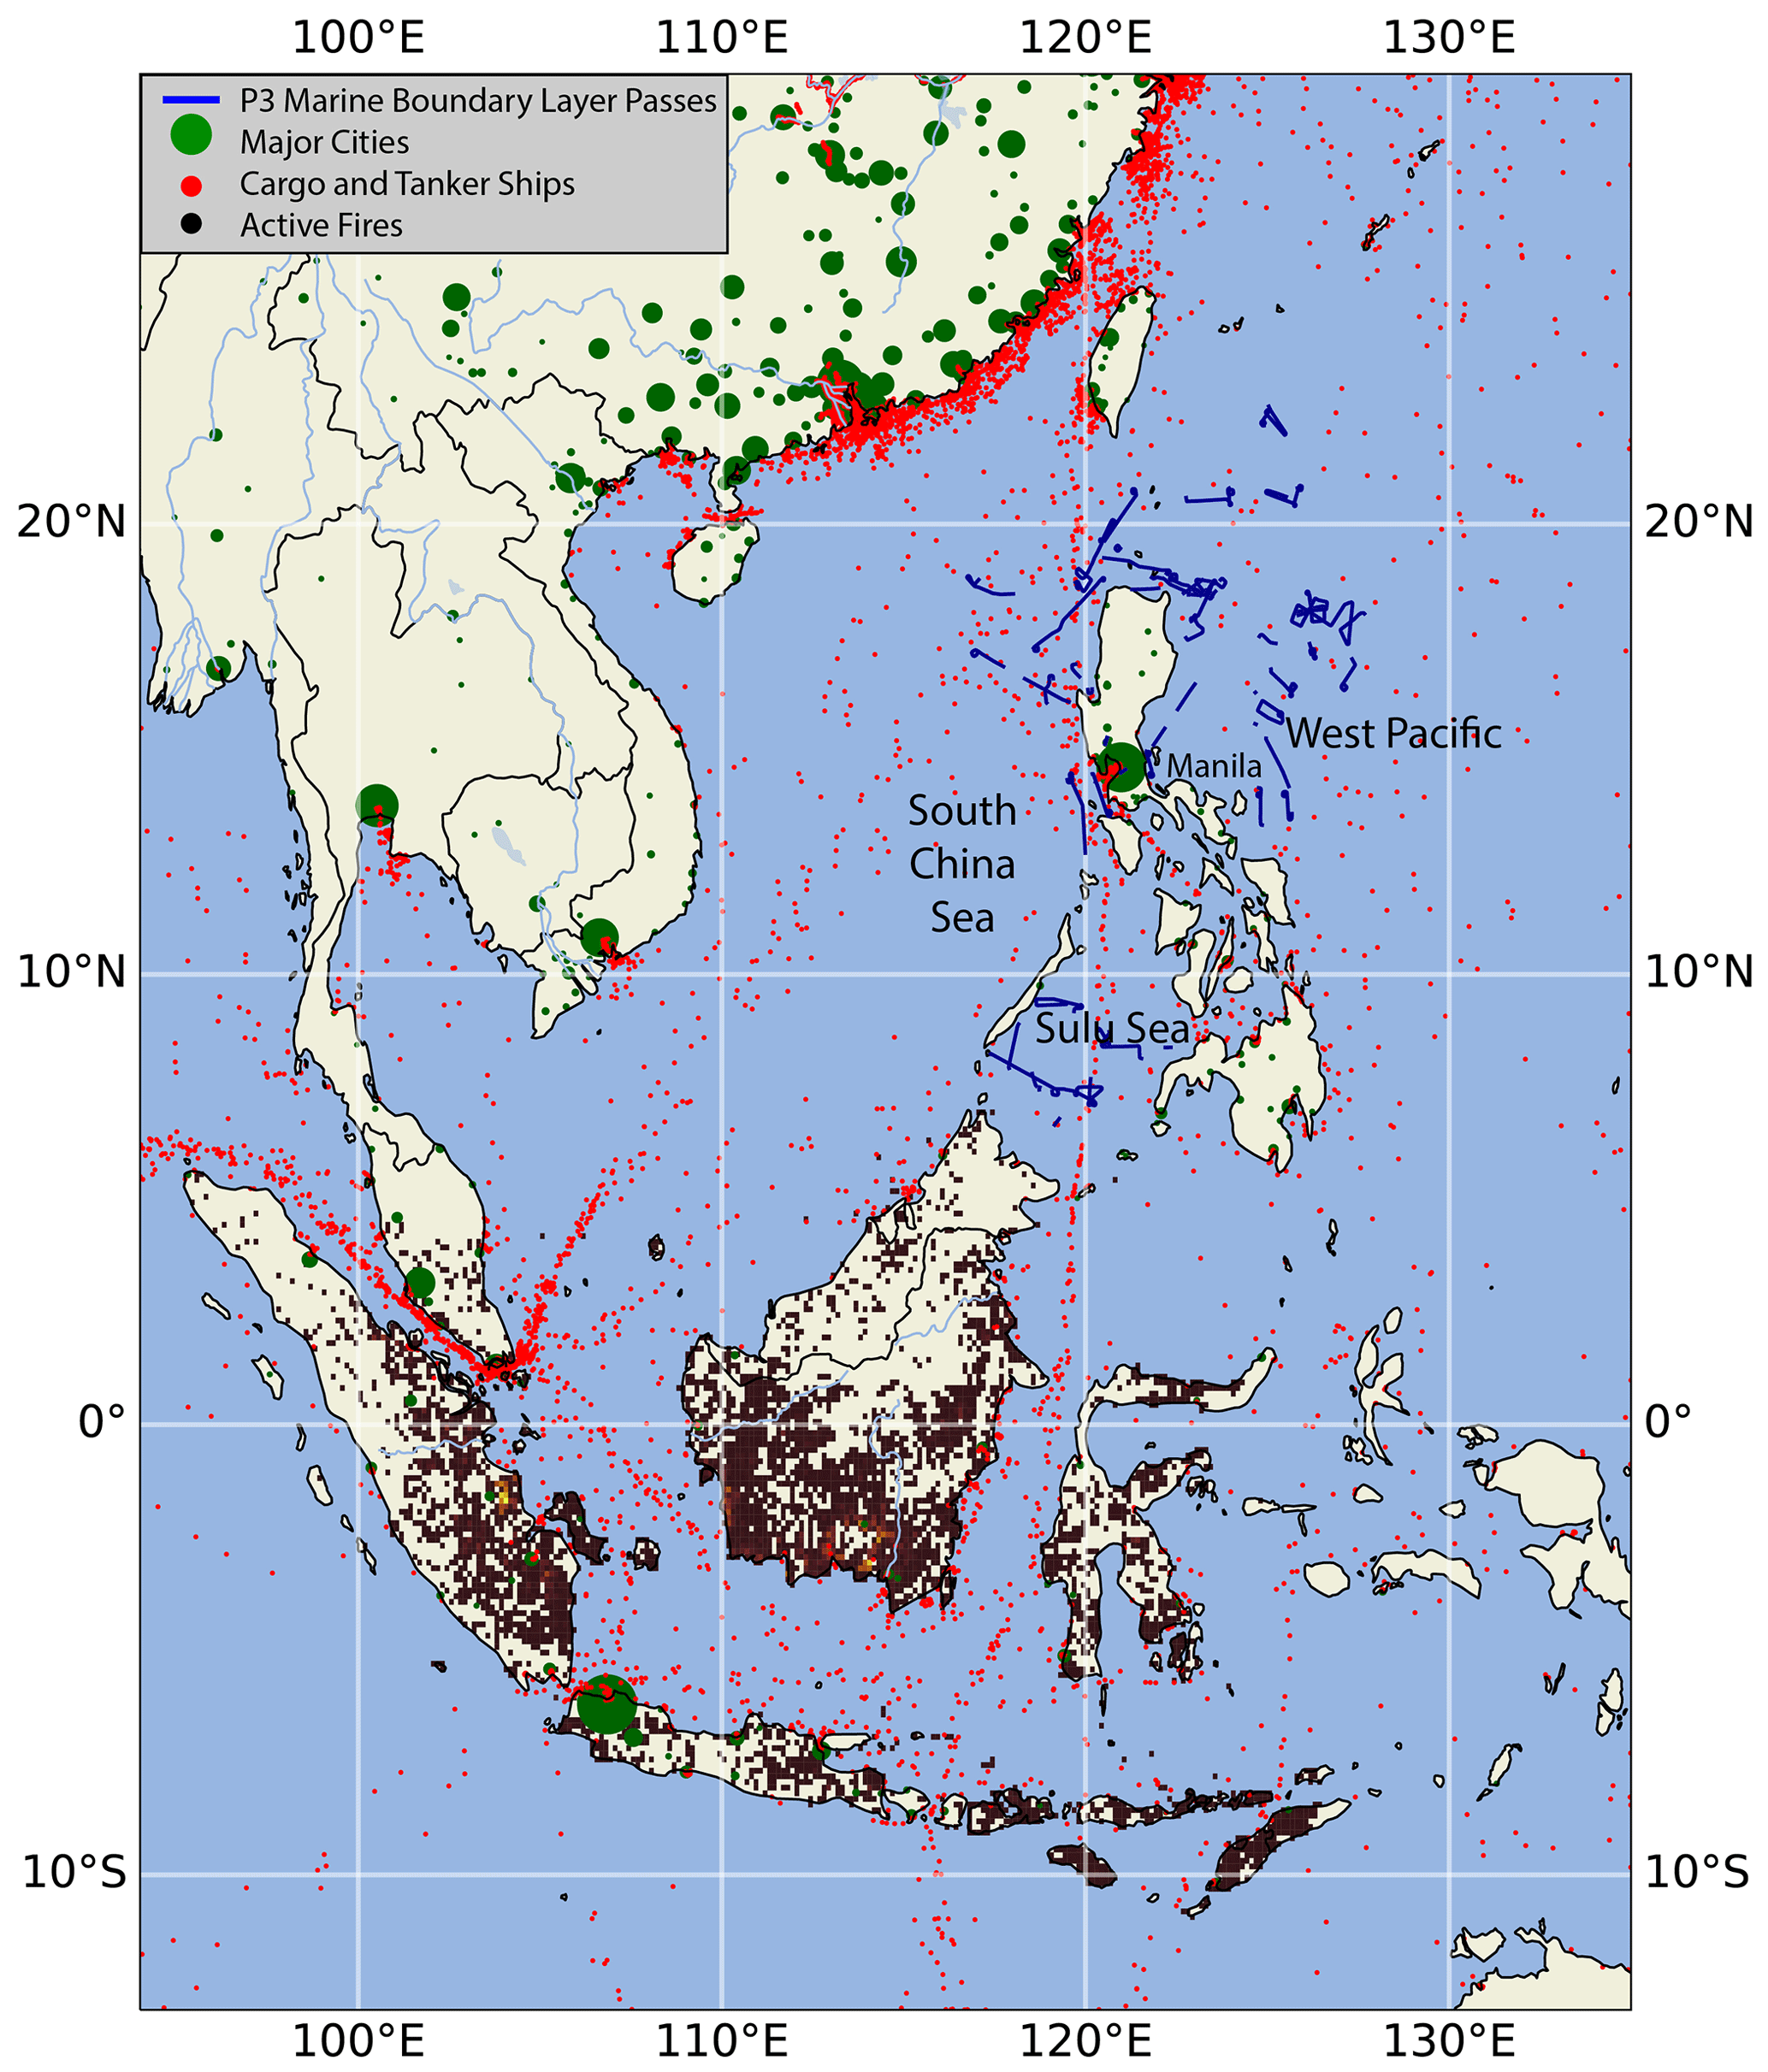
Figure 1Overview map and location of the Cloud, Aerosol and Monsoon Processes Philippines Experiment campaign based out of Clark International Airport in central Luzon, Philippines. Blue lines indicate all marine boundary layer flight legs from 19 research flights from the P-3. Active fires from Fire Information for Resource Management System MODIS 6 (black dots) and cargo and tanker ship locations (red dots) are from 19 September 2019. Location of major cities with populations over 1 million near the sampling area (green dots) with larger dots indicating larger populations.
Herein, data from the CAMP2Ex campaign are used to determine the chemical composition of aerosol over the Philippine region from each of these three sources. Observational data of aerosol sampled over the ocean in the marine boundary layer (MBL) are categorized into clean marine aerosols, ship emissions and aged and fresh industrial pollution from mainland East Asia and Manila, and BB aerosols. The impacts of aerosol and chemical compositional differences on warm tropical cumulus clouds are then analyzed just above cloud base over the sampling region. This paper then examines how each of these aerosol types influence droplet size distributions in tropical maritime cumulus clouds just above cloud base.
2.1 CAMP2Ex
The CAMP2Ex campaign, based out of Clark International Airport, Philippines, from 24 August–5 October 2019 with a sampling region around the Philippine islands, was designed to characterize aerosol composition, optical and radiative properties, and their role in modulating precipitation during the southwest monsoon and fall transition period. The NASA P-3 aircraft conducted 19 research flights with a payload of in situ and remote sensing instrumentation. Here we focus on MBL passes of the P-3 aircraft used for the characterization of aerosol chemical composition in the MBL, as well as aircraft passes sampling maritime convective clouds just above cloud base (Fig. 2).
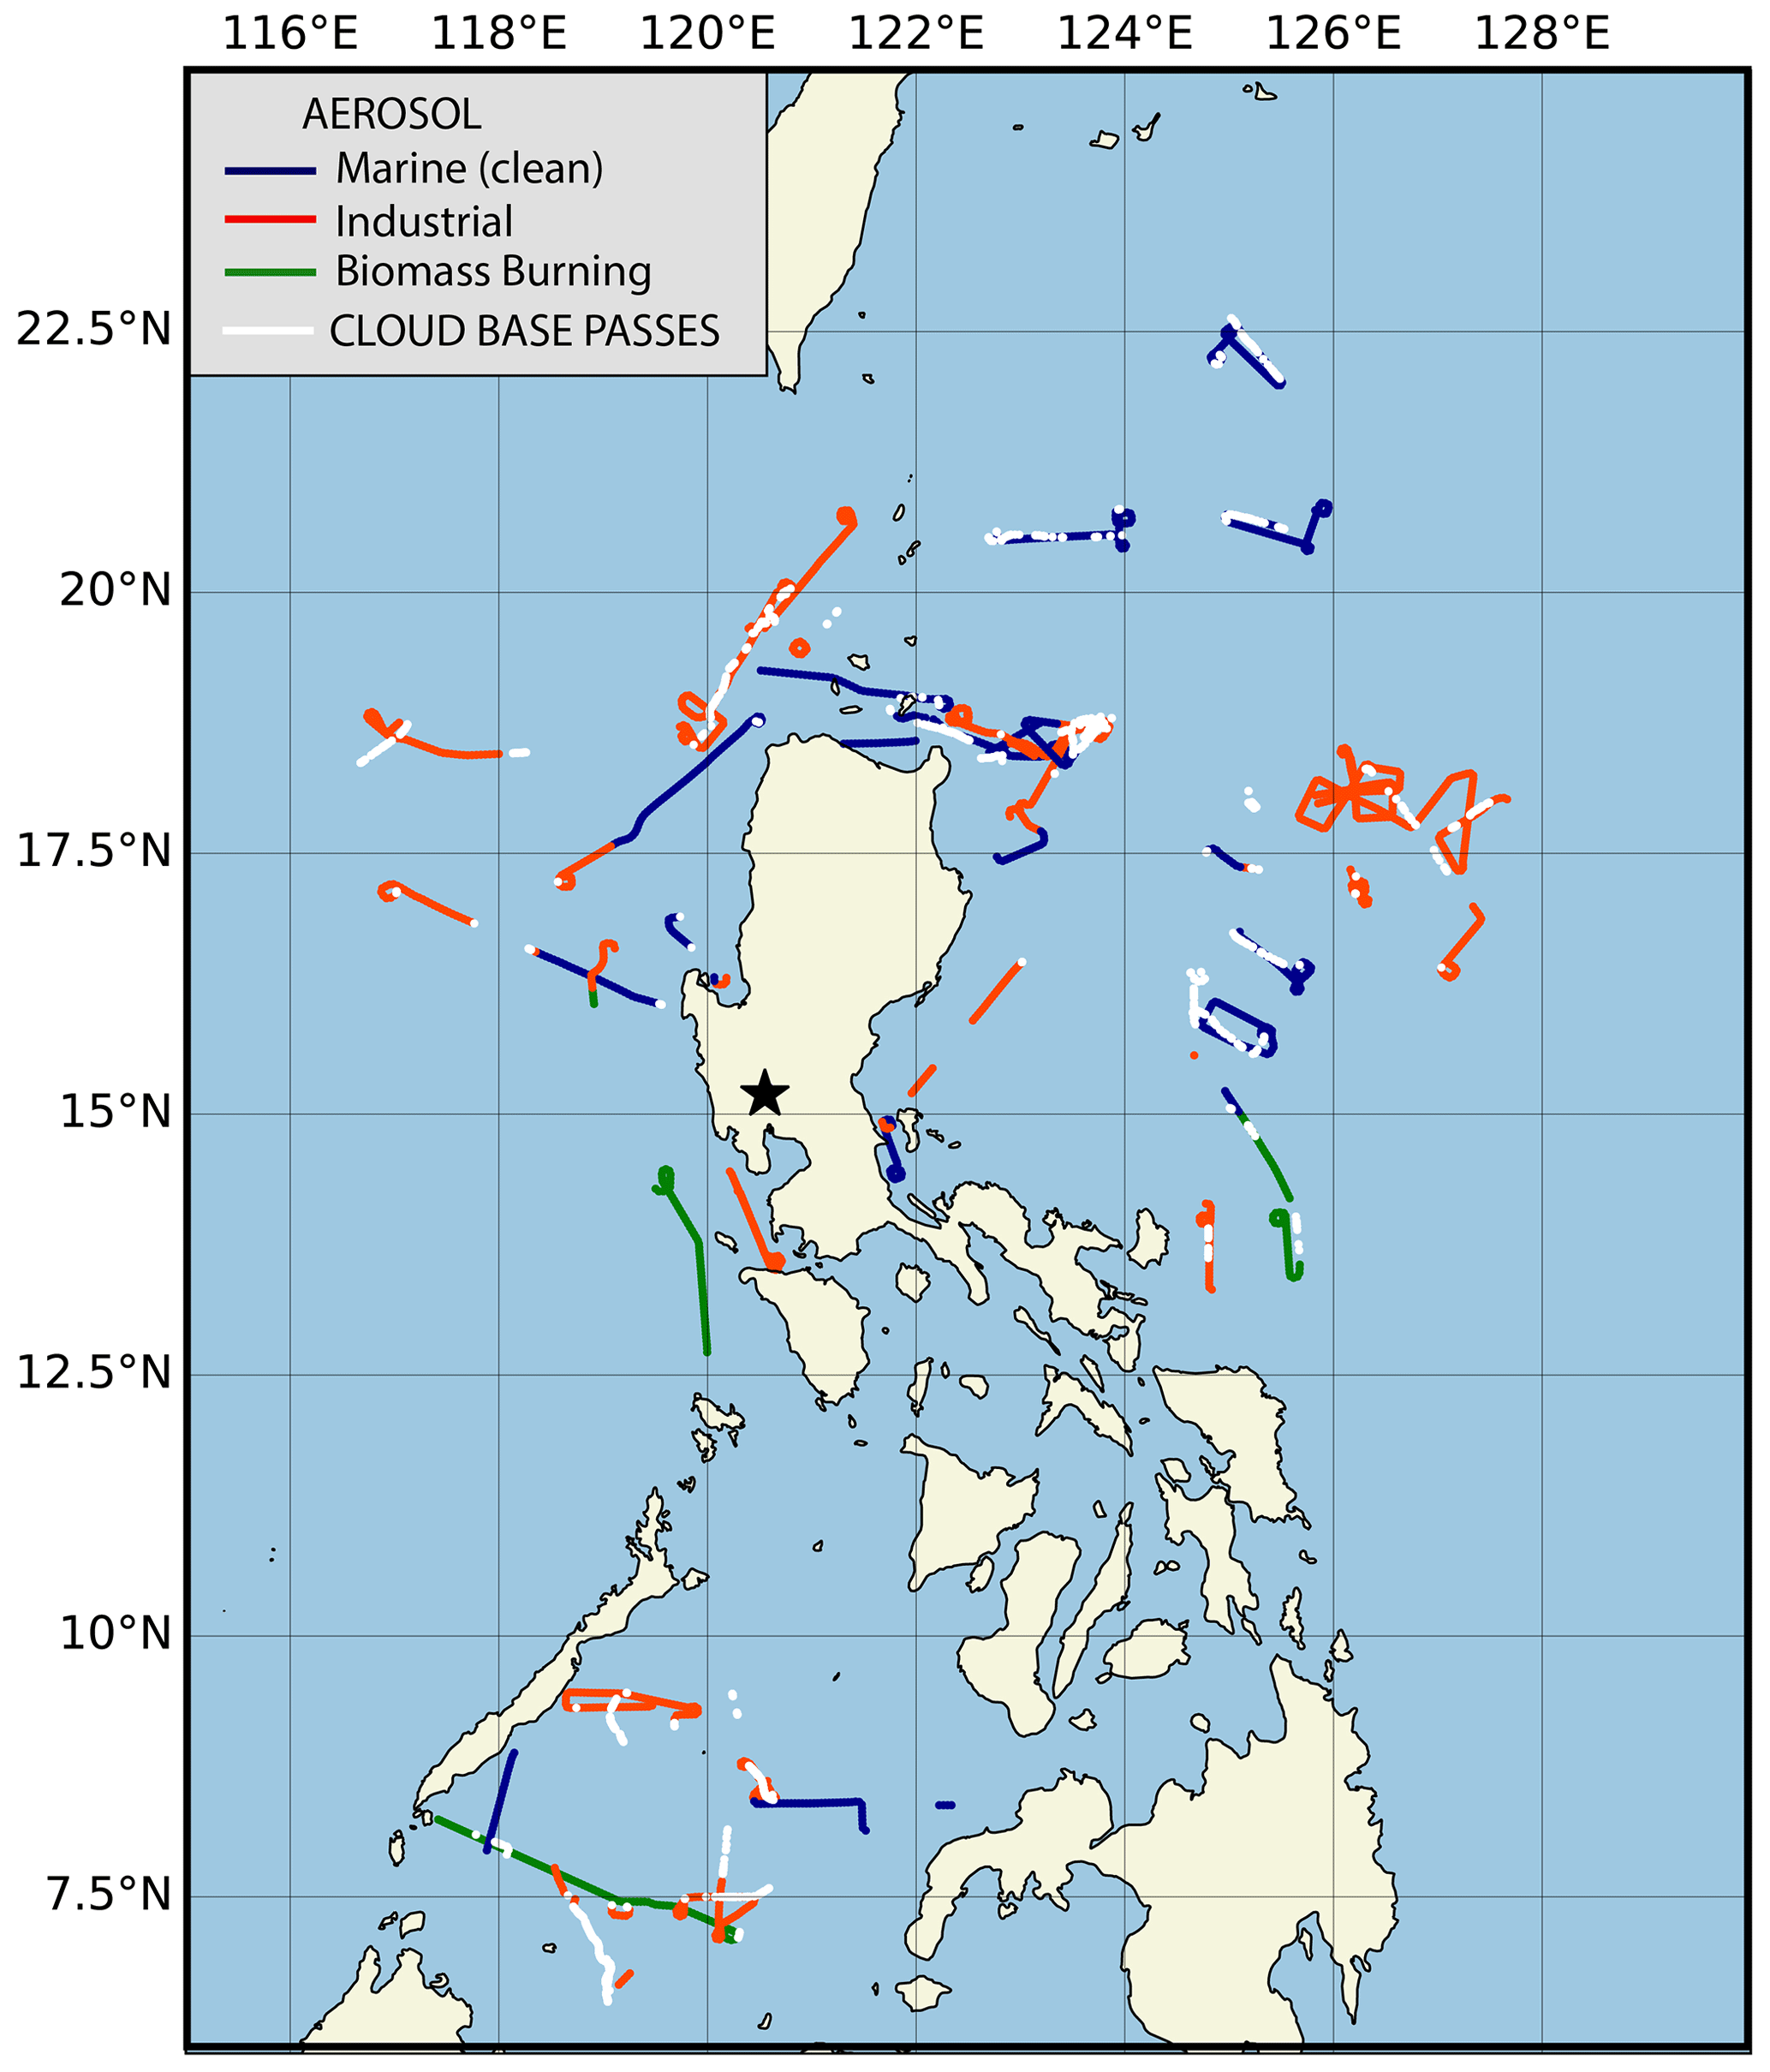
Figure 2Location of all marine boundary passes (colors) from 24 August 2019–5 October 2019 in accordance with their assigned aerosol source region. Cloud base passes (white) are shown for all P-3 research flights where cloud base sampling occurred.
2.2 Aerosol and cloud physics instrumentation
2.2.1 Aerosol Clarke inlet
The P-3 aerosol Clarke inlet is a forward-facing shrouded solid diffuser that is operated isokinetically that limits in situ sampling to particles with aerodynamic diameters less than 5.0 µm (McNaughton et al., 2007). This inlet supplied sample flow to the aerosol mass spectrometer and single particle soot photometer. All aerosol concentrations are reported at standard temperature and pressure and have been screened to remove cloud artifacts.
2.2.2 Aerosol mass spectrometer
The Aerodyne time-of-flight aerosol mass spectrometer (AMS; Aerodyne Research Inc.), operated by the Langley Aerosol Research Group, was used to determine non-refractory submicron aerosol composition within aerosol plumes (Jayne et al., 2000; DeCarlo et al., 2006; Shank et al., 2012; Howell et al., 2014; Hilario et al., 2021). AMS data were used to quantitatively determine aerosol mass composition within the MBL and to classify aerosol regimes at 30 s resolution for sizes < 1 µm. The instrument team recommended a minimum 10 min averaging interval (20 data points) to obtain representative chemical signatures.
2.2.3 Single particle soot spectrometer
A single particle soot spectrometer (SP2; Droplet Measurement Technologies) was used to detect refractory black carbon (rBC). The SP2 detects individual rBC particles through laser-induced incandescence (Schwarz et al., 2006; Moteki and Kondo, 2007). Black carbon is emitted through incomplete combustion processes and is used as a conserved tracer for anthropogenic aerosol sources and biomass burning emissions (Bond et al., 2013).
2.2.4 Turbulent Air Motion Measurement System
The 3-D winds were measured from the aircrafts' attitude, position, velocity, pressure, and acceleration using the Turbulent Air Motion Measurement System (TAMMS) instrumentation from flow-angle and temperature sensors and inertial navigation and flight management systems. These measurements were made using a Rosemount model 102 (Lenschow, 1986; Barrick et al., 1996; Thornhill et al., 2003), and derived measurements of wind components u, v, and w were calculated at 20 Hz resolution.
2.2.5 Fast cloud droplet probe
The fast cloud droplet probe (FCDP) SPEC model FCDP-100 is a forward scattering probe that measures cloud hydrometeor concentration size distributions from 2 to 50 µm in particle diameter at 1–3 µm resolution at 1 Hz frequency. This instrument was used to collect cloud droplet number concentrations and size distributions above cloud base.
2.3 Remote sensing instrumentation
Cloud transect length was determined three ways, using the FCDP, the NASA high-spectral-resolution lidar (HSRL-2, Burton et al., 2018; Sawamura et al., 2017), and the research scanning polarimeter (RSP; Cairns et al., 1999). The use of the instruments in CAMP2Ex and the approach to determine cloud transect length is presented in detail in Fu et al. (2022).
2.4 Dropsondes
During CAMP2Ex 197 Vaisala RD41 dropsondes were successfully launched from the P-3 using the Airborne Vertical Atmospheric Profiling System operated by Colorado State University. The data from these dropsondes were used to determine the mean lifting condensation level (LCL) and the vertical extent of the MBL. First, dropsondes that were launched near deep convection or over or near known cold pools or rain shafts were eliminated. Rosner's outlier test was then used to detect outliers in the remaining dropsonde dataset. Two outliers remained, and these dropsondes were removed. The height of the LCL was then calculated for each of the remaining 181 dropsondes. The height of the LCL for all dropsondes was found to be 466 ± 89 m. A distribution of the calculated heights of the LCL for all dropsondes used in the calculations is shown in Fig. 3a. The cloud penetration altitudes are shown in Fig. 3b. Together the panels in the figure show that the cloud base penetrations used in this analysis occurred no more than 400 m above cloud base.
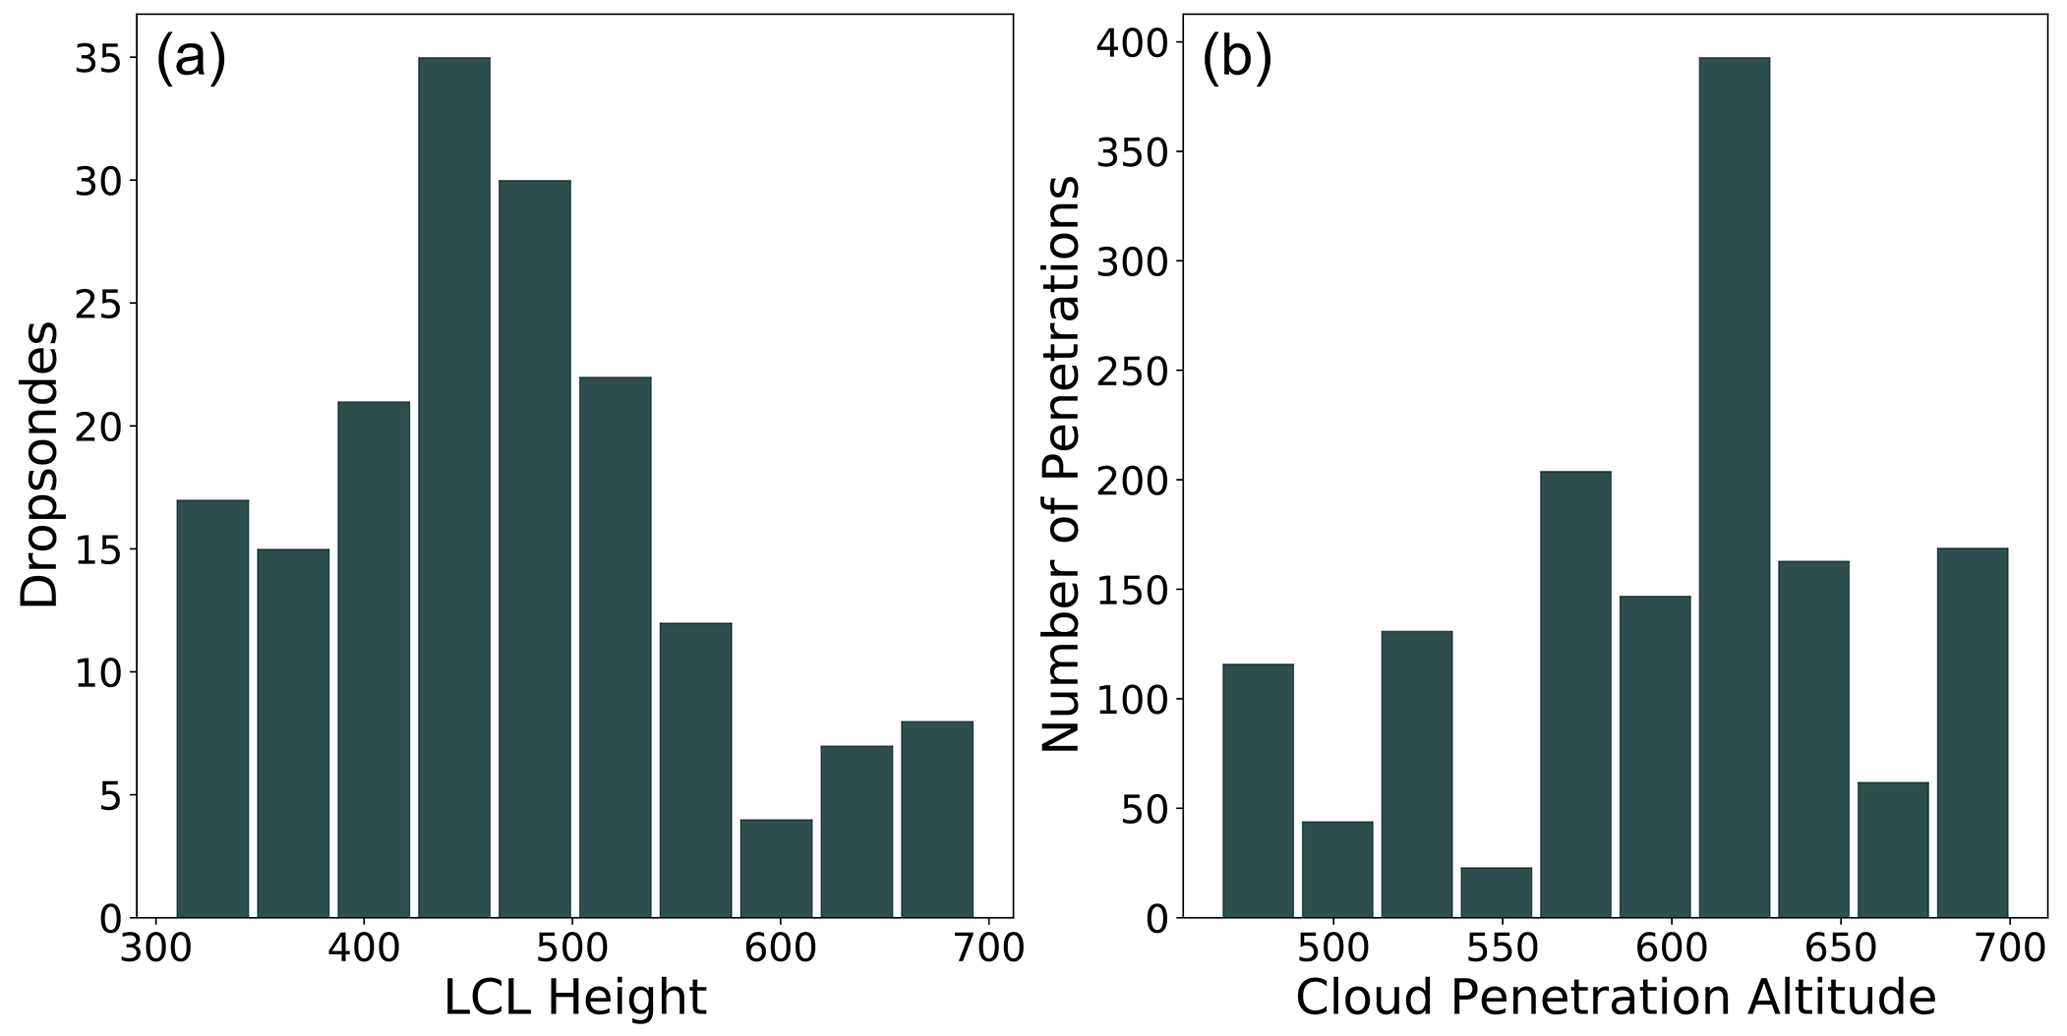
Figure 3(a) Distribution of lifting condensation level heights determined from CAMP2Ex dropsondes; (b) cloud penetration altitudes of the P-3 near cloud base.
2.5 Ship locations and ship plume trajectories
A dataset was constructed to predict the locations of cargo and tanker ship emissions in the vicinity of the P-3 during CAMP2Ex (for methods see the Appendix). The dataset provided information on the P-3 MBL status, the distance from Manila, the number of ships within a 60 and 100 km radius of the P-3, the number of discrete ship plumes within 60 and 100 km of the P-3, the time of a plume–aircraft intersection (if such an intersection occurred), the age of the intersected plume, and the Maritime Mobile Service Identity (MMSI) location of the ship that produced that plume. A video of ship plume and P-3 locations through each of the flight periods is included as a supplement to this article. Lv et al. (2018) indicate that shipping emissions measured within 22 km of a ship were normally the dominant contributor to PM2.5 aerosol. They found that shipping emissions could be detected within 370 km of ships and shipping lanes along the China coastline. The MMSI ship data purchased from Astra Paging Ltd provided ship information covering the region of flights around the Philippines at 3 h frequency between the hours of 22:00 and 09:00 UTC the next day (Philippine local time is UTC +8 h). Wind data from the ERA5 reanalysis (Hersbach et al., 2022) at 1000 hPa was used to calculate aerosol plumes produced by each ship every 600 s (Fig. 4; see also the Appendix).
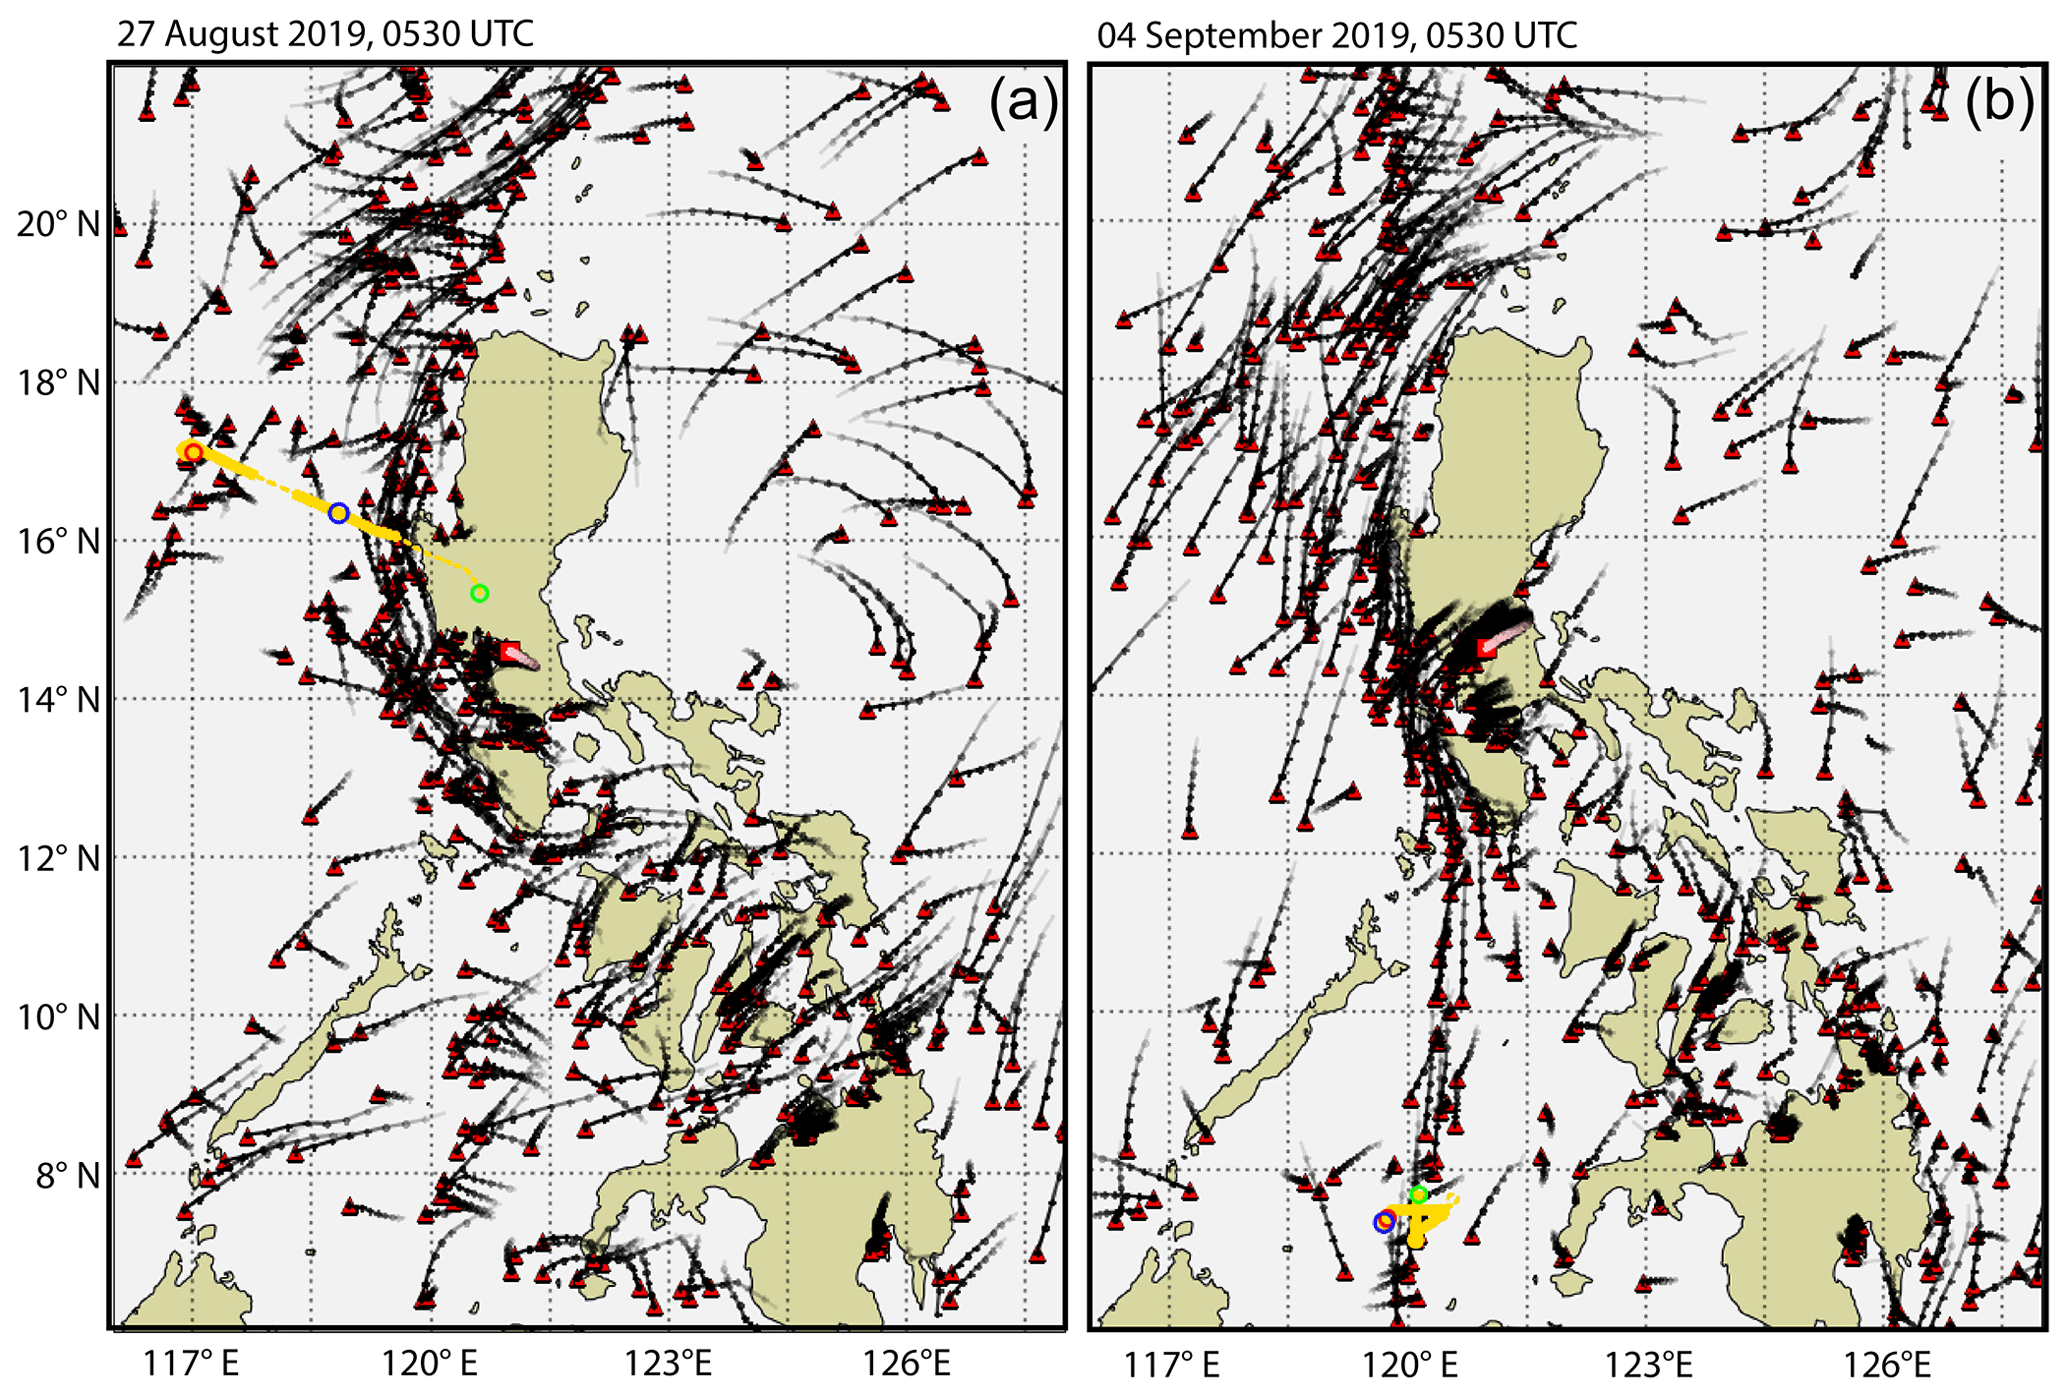
Figure 4Example of ship emission projections based on European Centre for Medium-Range Weather Reanalysis Forecasts ERA5 1000 hPa winds on (a) 27 August 2019 and (b) 4 September 2019 at 05:30 UTC, along with flight segments of the P-3 research aircraft (yellow). Individual cargo and tanker ships are denoted as red triangles, and projected ship plumes at 30 min intervals are shown as black lines and dots over the sampling region. On both days the red ring is the P-3 research aircraft location at 05:00 UTC, the blue ring at 05:30 UTC, and the green ring at 06:00 UTC. The red square denotes the city of Manila, and its corresponding projected pollution plume (red with white interior) is for the same period as the ship emission plumes. The thickness of the yellow line denoted when the P-3 research aircraft is at an altitude of < 466 m (thick) and > 466 m (dashed).
2.6 Air parcel trajectories
NOAA's HYSPLIT model, January 2017 revision (854) version 4 (Draxler and Hess, 1998; Stein et al., 2015), was used to calculate air parcel backward trajectories to determine air mass source regions during CAMP2Ex. The HYSPLIT model was initialized with the Global Data Assimilation System (GDAS) at a 0.25∘ grid spacing. For every 10 min of each MBL sampling leg, HYSPLIT backward trajectories were calculated to estimate the origin of the air parcels. Backward trajectories from all MBL locations were initialized at or below 466 m and ran for 100 h. The trajectories were used to determine the possible location of air parcels and establish source relationships between the different aerosol source regions and the cloud base passes.
2.7 Flight strategy
All CAMP2Ex flights were conducted during daylight between 00:00–09:00 UTC (08:00–17:00 local). Sampling of the MBL occurred during segments of CAMP2Ex flights below cloud base. All MBL measurements reported in this paper occurred below 466 m above mean sea level (MSL), the median height of the LCL. The passes were divided into 10 min intervals to ensure sufficient sampling of the chemical species. Passes or segments of passes shorter than 10 min were not included in this study. Cloud sampling reported in this paper was conducted at 1 Hz resolution (Fig. 3b) right above cloud base in cumulus clouds below an altitude of 700 m. A cloud base pass was recorded if the FCDP reported Nc > 10 cm−3 and liquid water content (LWC) > 0.05 g m−3. A total of 112 MBL passes of 10 min and 1416 s of cloud base passes were recorded.
To identify the chemical signatures of the three distinct aerosol source regions discussed in Sect. 1, MBL passes of the P-3 in regions with a high likelihood of having those chemical signatures were identified. The chemical signatures used were collected from the AMS and SP2 instruments that measured refractory black carbon (BC), chlorine (Cl), sulfates (SO4), organics (ORG), nitrates (NO3), and ammonium (NH4). Specifically, an MBL pass over the Pacific Ocean east of the Philippines was used to characterize the MBL aerosol chemistry in the absence of anthropogenic aerosols (Fig. 5a). A pass directly within Manila's boundary layer was used to characterize recently emitted industrial and automobile emissions (Fig. 5b). The nearest pass through a BB plume over the Sulu Sea was used to characterize BB aerosols (Fig. 5c). Finally, a pass directly through the emissions plume of the R/V Sally Ride, which was conducting a complementary project, the Propagation of Intra-Seasonal Tropical Oscillation (PISTON), was used to characterize ship emissions (Fig. 5d). The R/V Sally Ride uses finer-grade diesel fuel compared to the bunker fuel used by cargo and tanker ships at the time of CAMP2Ex, although similar chemical components can be detected in the ship plumes from both fuel types.
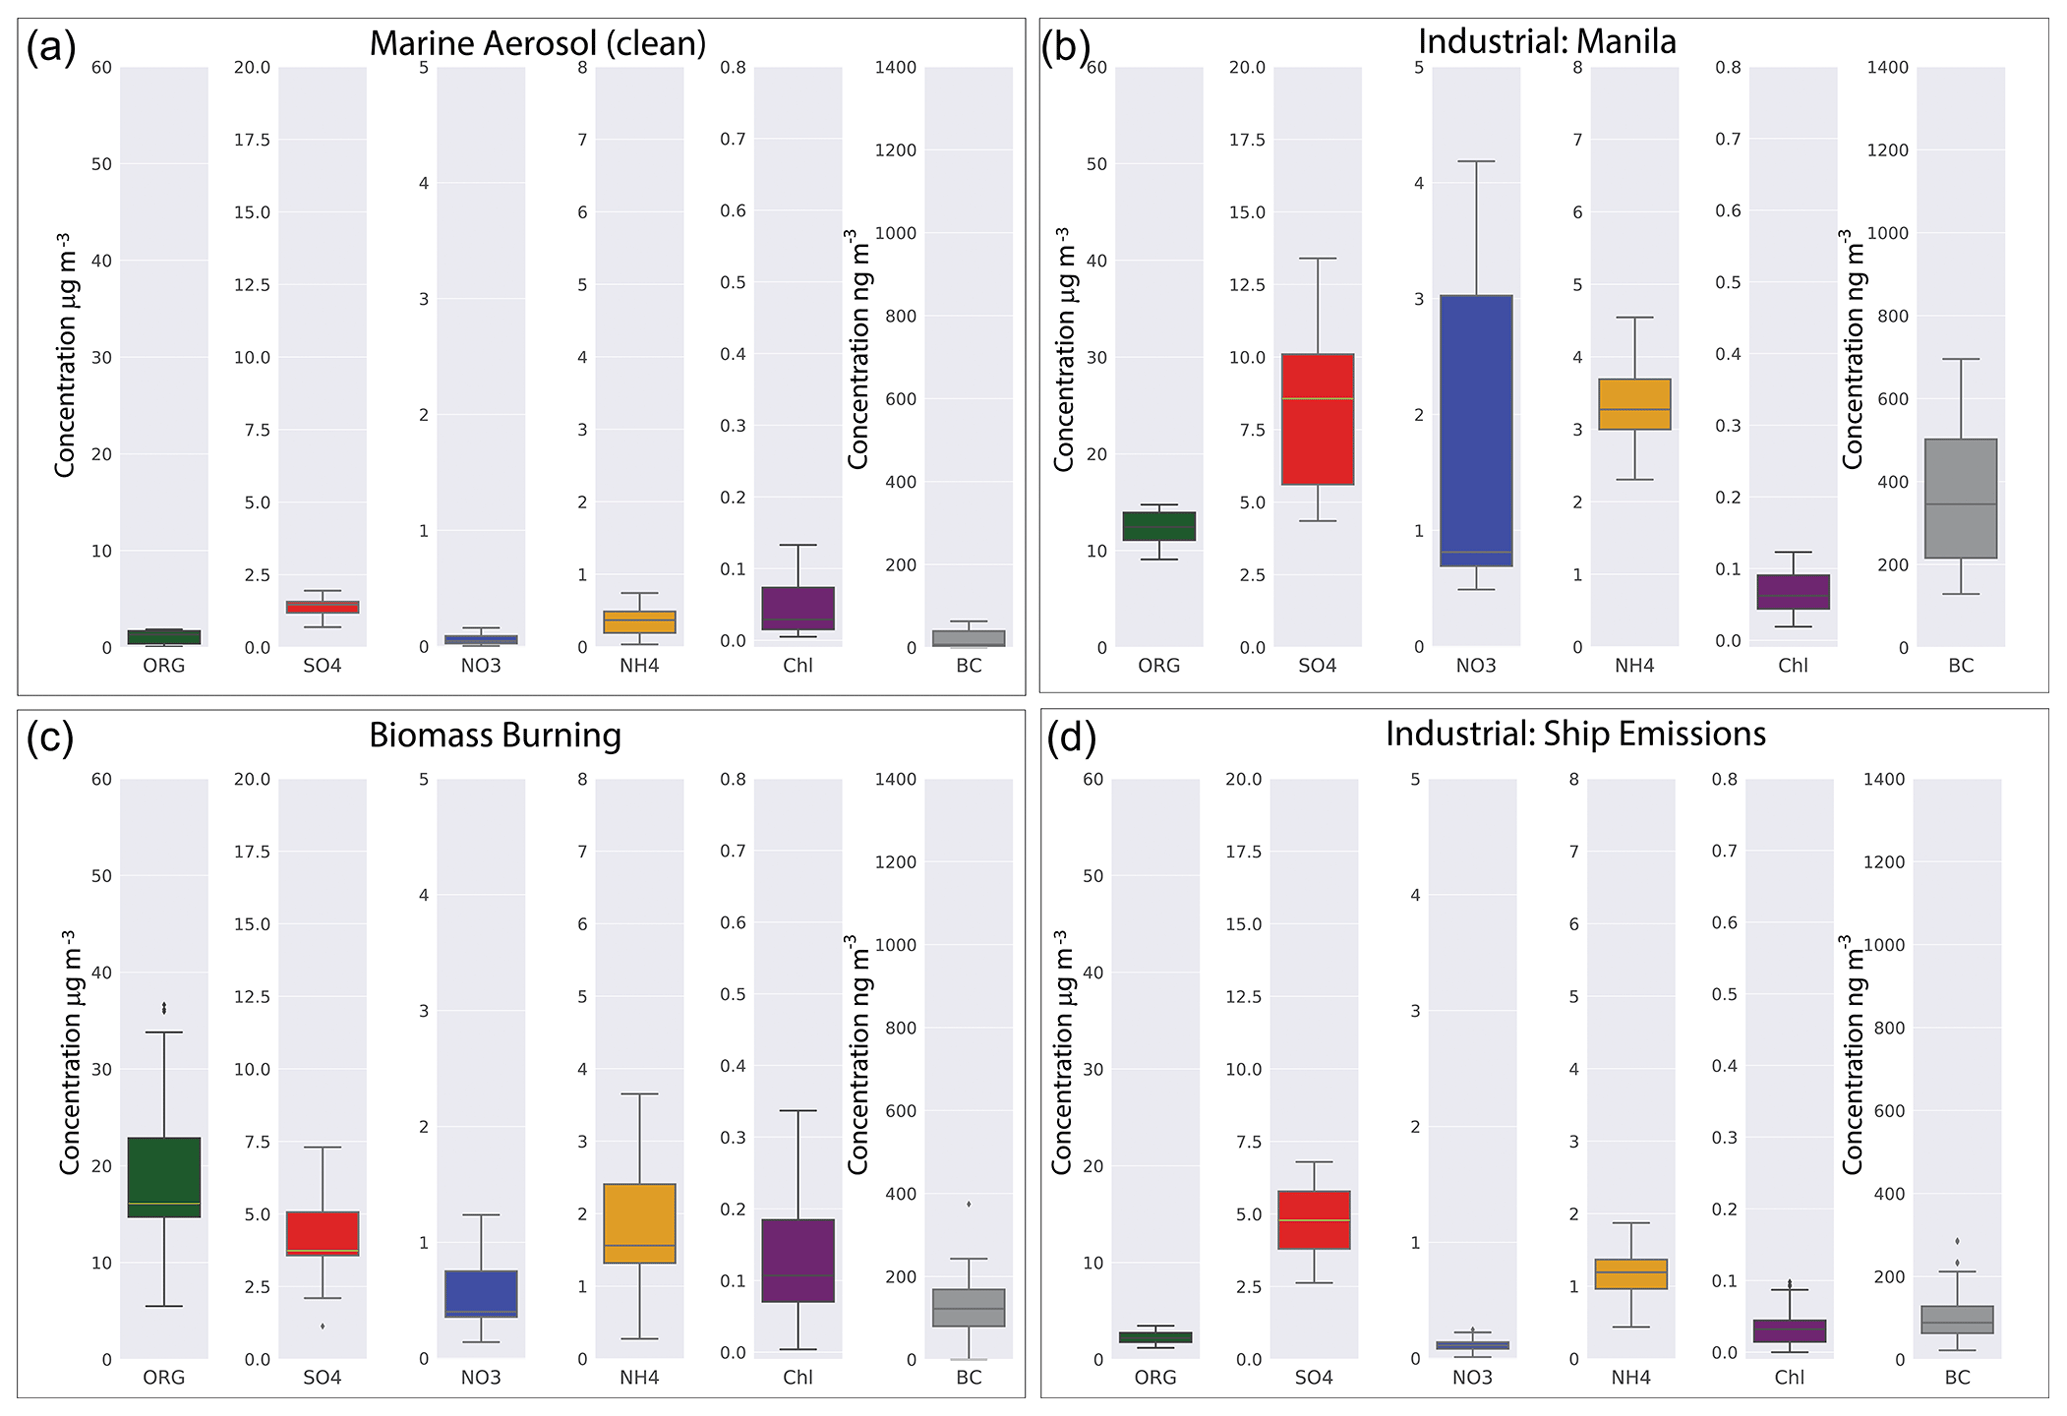
Figure 5Chemical mass signatures of aerosol from boundary layer passes through (a) clean marine environment over the West Pacific Ocean east of the Philippines (01:25:28–01:35:28 UTC, 5 October 2019), (b) Manila industrial region (00:31:21–00:41:21 UTC, 4 October 2019), (c) a biomass burning plume over the Sulu Sea (00:47:10–00:57:10 UTC, 16 October 2019), and (d) a pass through the R/V Sally Ride ship plume northeast of Luzon (04:03:42–04:13:42 UTC, 2 October 2019).
The clean MBL had low concentrations of all chemical species. The Manila boundary layer chemical composition was dominated by higher concentrations of NO3, SO4, NH4, and BC with median values of NO3 (0.9 µg m−3), SO4 (8.7 µg m−3), NH4 (3.3 µg m−3), and BC (381.3 ng m−3). The most prominent feature is the large presence of NO3, which likely formed from automobile combustion. The elevated values of ORG and BC are most likely from diesel exhaust and local BB (Bond et al., 2004; Kecorius et al., 2017). Although ORG and BC were elevated in the Manila boundary layer, it is unlikely that they would be from large BB events since none were influencing that region during the time of sampling based on backward HYSPLIT trajectories. The key chemical signature of BB is elevated ORG. The median values of ORG and all other species within the BB plume were ORG (17.2 µg m−3), NO3 (0.5 µg m−3), SO4 (3.7 µg m−3), NH4 (1.6 µg m−3), and BC (163 ng m−3). Shipping emission, in the absence of other sources, displayed elevated concentrations of SO4 and NH4 with median values of SO4 (4.9 µg m−3) and NH4 (1.2 µg m−3) and minimal concentrations of ORG, NO3, and BC. These characteristics were used to categorize the remaining MBL passes.
Additionally, the three aerosol regimes were defined by categorizing and analyzing the 112 MBL passes from 19 research flights through a scikit-learn K-means cluster algorithm, taking into consideration all six chemical signatures. The K-means cluster centers identified four different groupings. Each individual cluster's chemical composition was apparently dominated by either marine (clean), Manila industrial, BB, or ship emissions and aged industrial aerosols. In all cases, marine aerosols were present as the research flights were all done over the ocean, but in the cases of Manila industrial, BB, and ship emissions, elevated levels of specific aerosol chemical species were found. To provide additional evidence that the suspected source regions were consistent with the chemical signatures and groupings, 100 h HYSPLIT backward trajectories were run for each MBL pass to confirm that the hypothesized primary aerosol source region was consistent with the interpretation of the chemical signatures (Fig. 6). Clean marine MBL passes (Fig. 6a) mostly originated 100 h earlier from air mass sources over the West Pacific Ocean east of the Philippines. Three backward trajectories originated west of Borneo prior to the primary BB season in Borneo and Indonesia and were not near any ships or shipping lanes. Shipping emissions were from MBL passes over known shipping lanes (see methods in the Appendix and Fig. 4) or from the R/V Sally Ride (Fig. 6b). These may have been combined with aged industrial aerosols from mainland Asia over the South China Sea, but as will be shown, the NO3 signature of automobile emissions found near Manila were not present over the South China Sea, suggesting that most of the particles sampled came from ship emissions or aged industrial aerosols from which NO3 had decayed. This region also had remnants of elevated SO4 from aged and secondary aerosol formation (Crosbie et al., 2022). HYSPLIT backward trajectories associated with industrial sources (Fig. 6b) were associated with air masses of Asian origin. Figure 6c confirmed that the BB MBL legs were sampled during a large BB event on 15–16 September 2019 that occurred throughout Indonesia, Brunei, and Malaysia (Fig. 1).
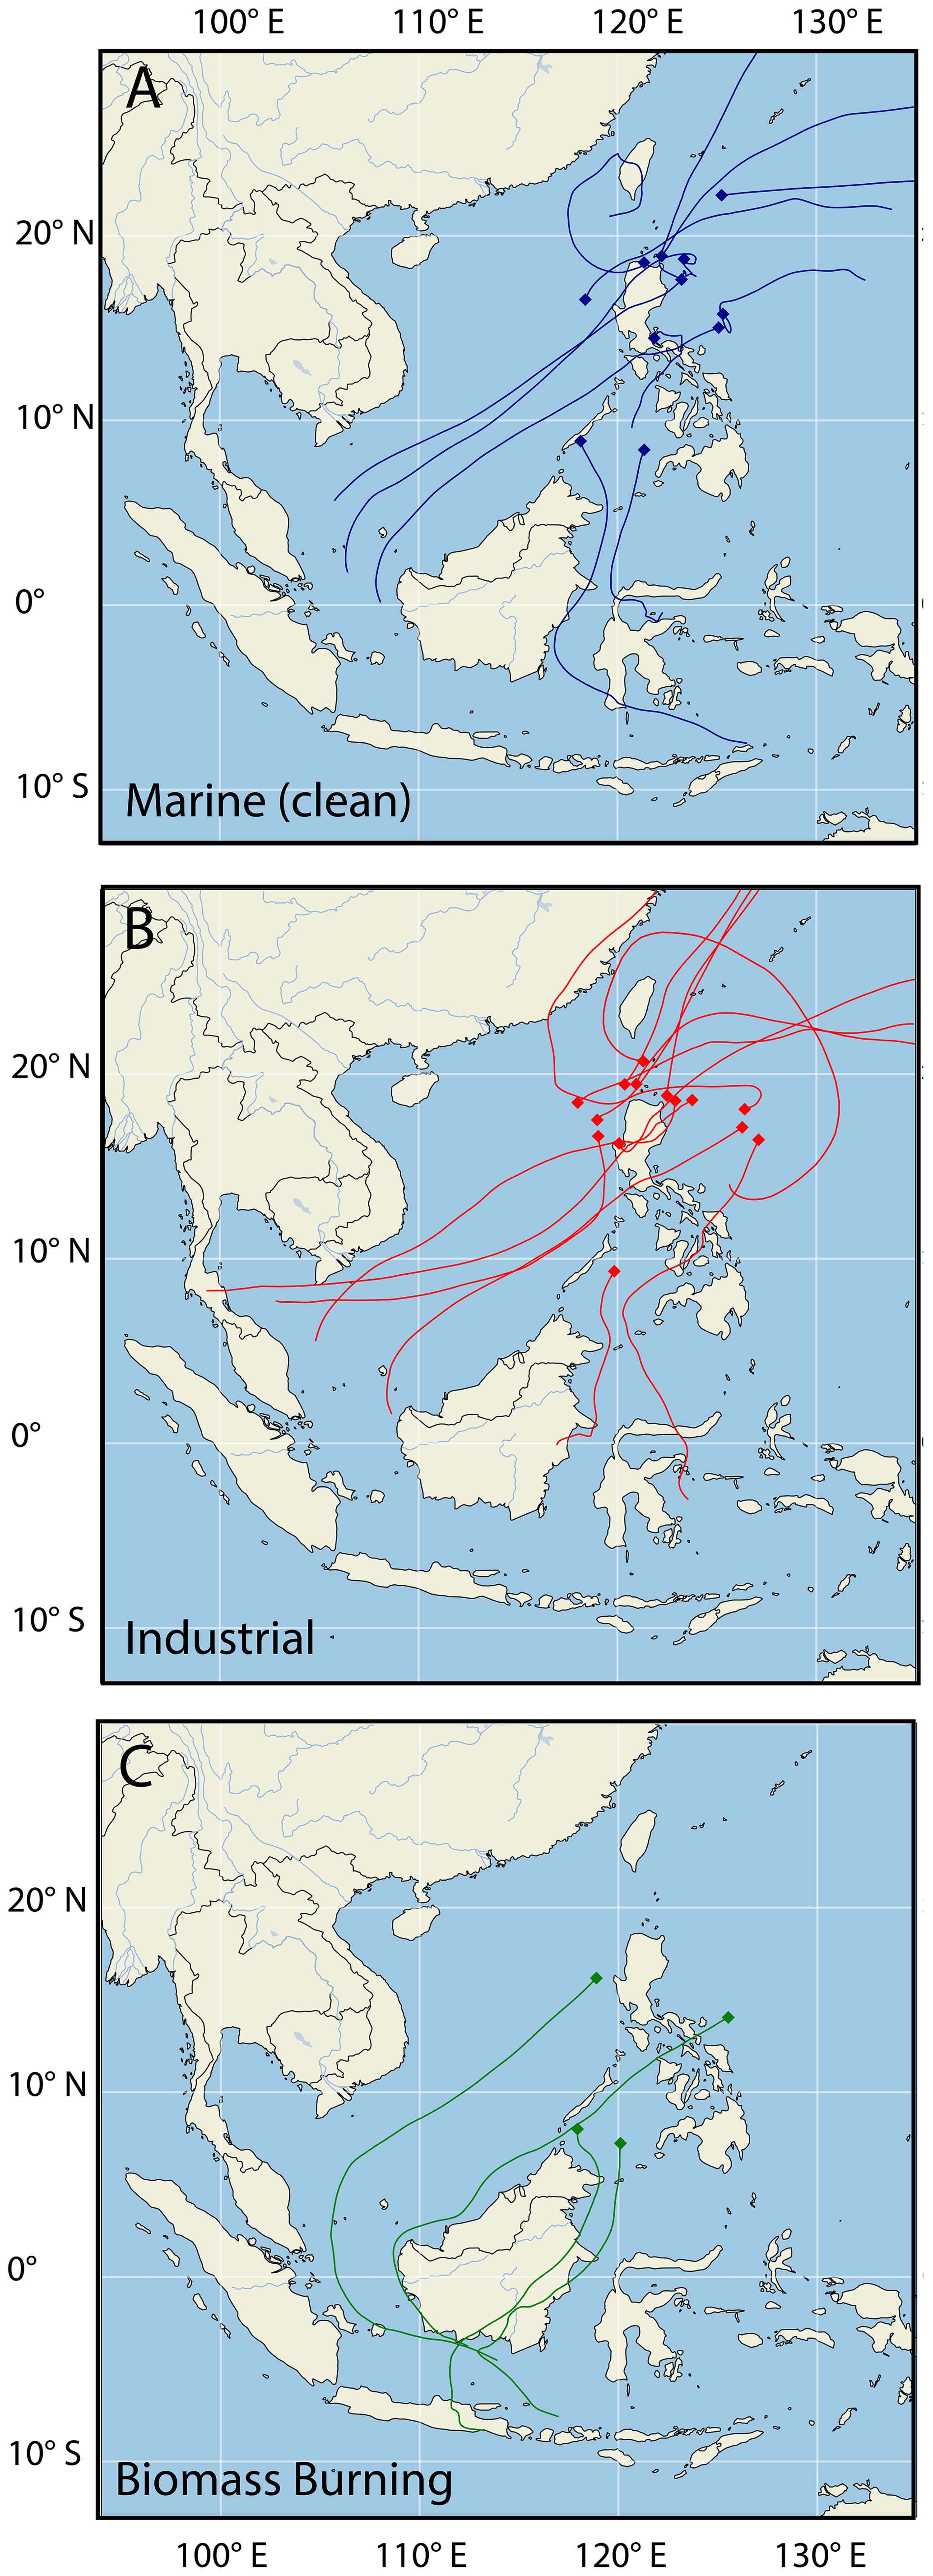
Figure 6Example ensemble-averaged NOAA HYSPLIT 100 h backward trajectories from 19 research flights between 24 August 2019 and 5 October 2019 within the marine boundary layer categorized by aerosol regime. (a) Marine (clean), (b) industrial, and (c) biomass burning.
A total of 112 MBL passes of 10 min were analyzed and categorized into the four categories: 49 clean marine, 10 BB, 7 passes in the Manila plume, and 46 passes sampling shipping emissions and aged and industrial aerosols (Table 1). Unfortunately no cloud base passes were made near Manila or within the Manila plume. Figure 5b is representative of the chemical signatures of the Manila plume for the seven passes through the plume in the boundary layer. These were all conducted on the same research flight. The data for the remaining groups are consolidated in statistical summaries presented in Fig. 7.
Table 1The total number of 10 min boundary layer passes and number of seconds sampling in cloud just above cloud base, categorized into their corresponding aerosol source type from all 19 research flights.
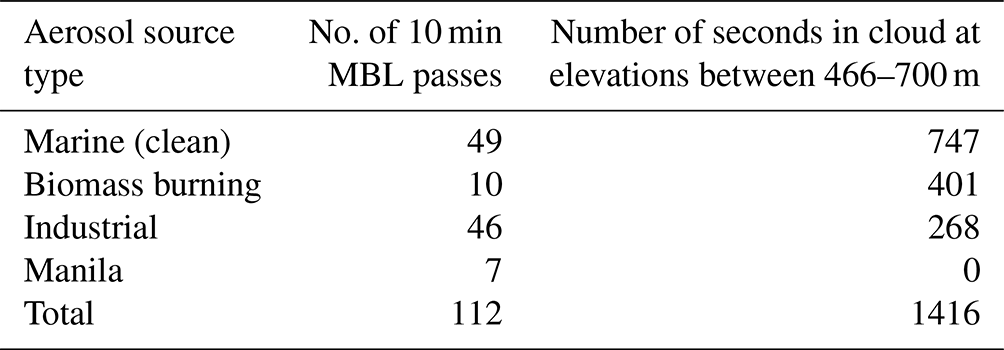
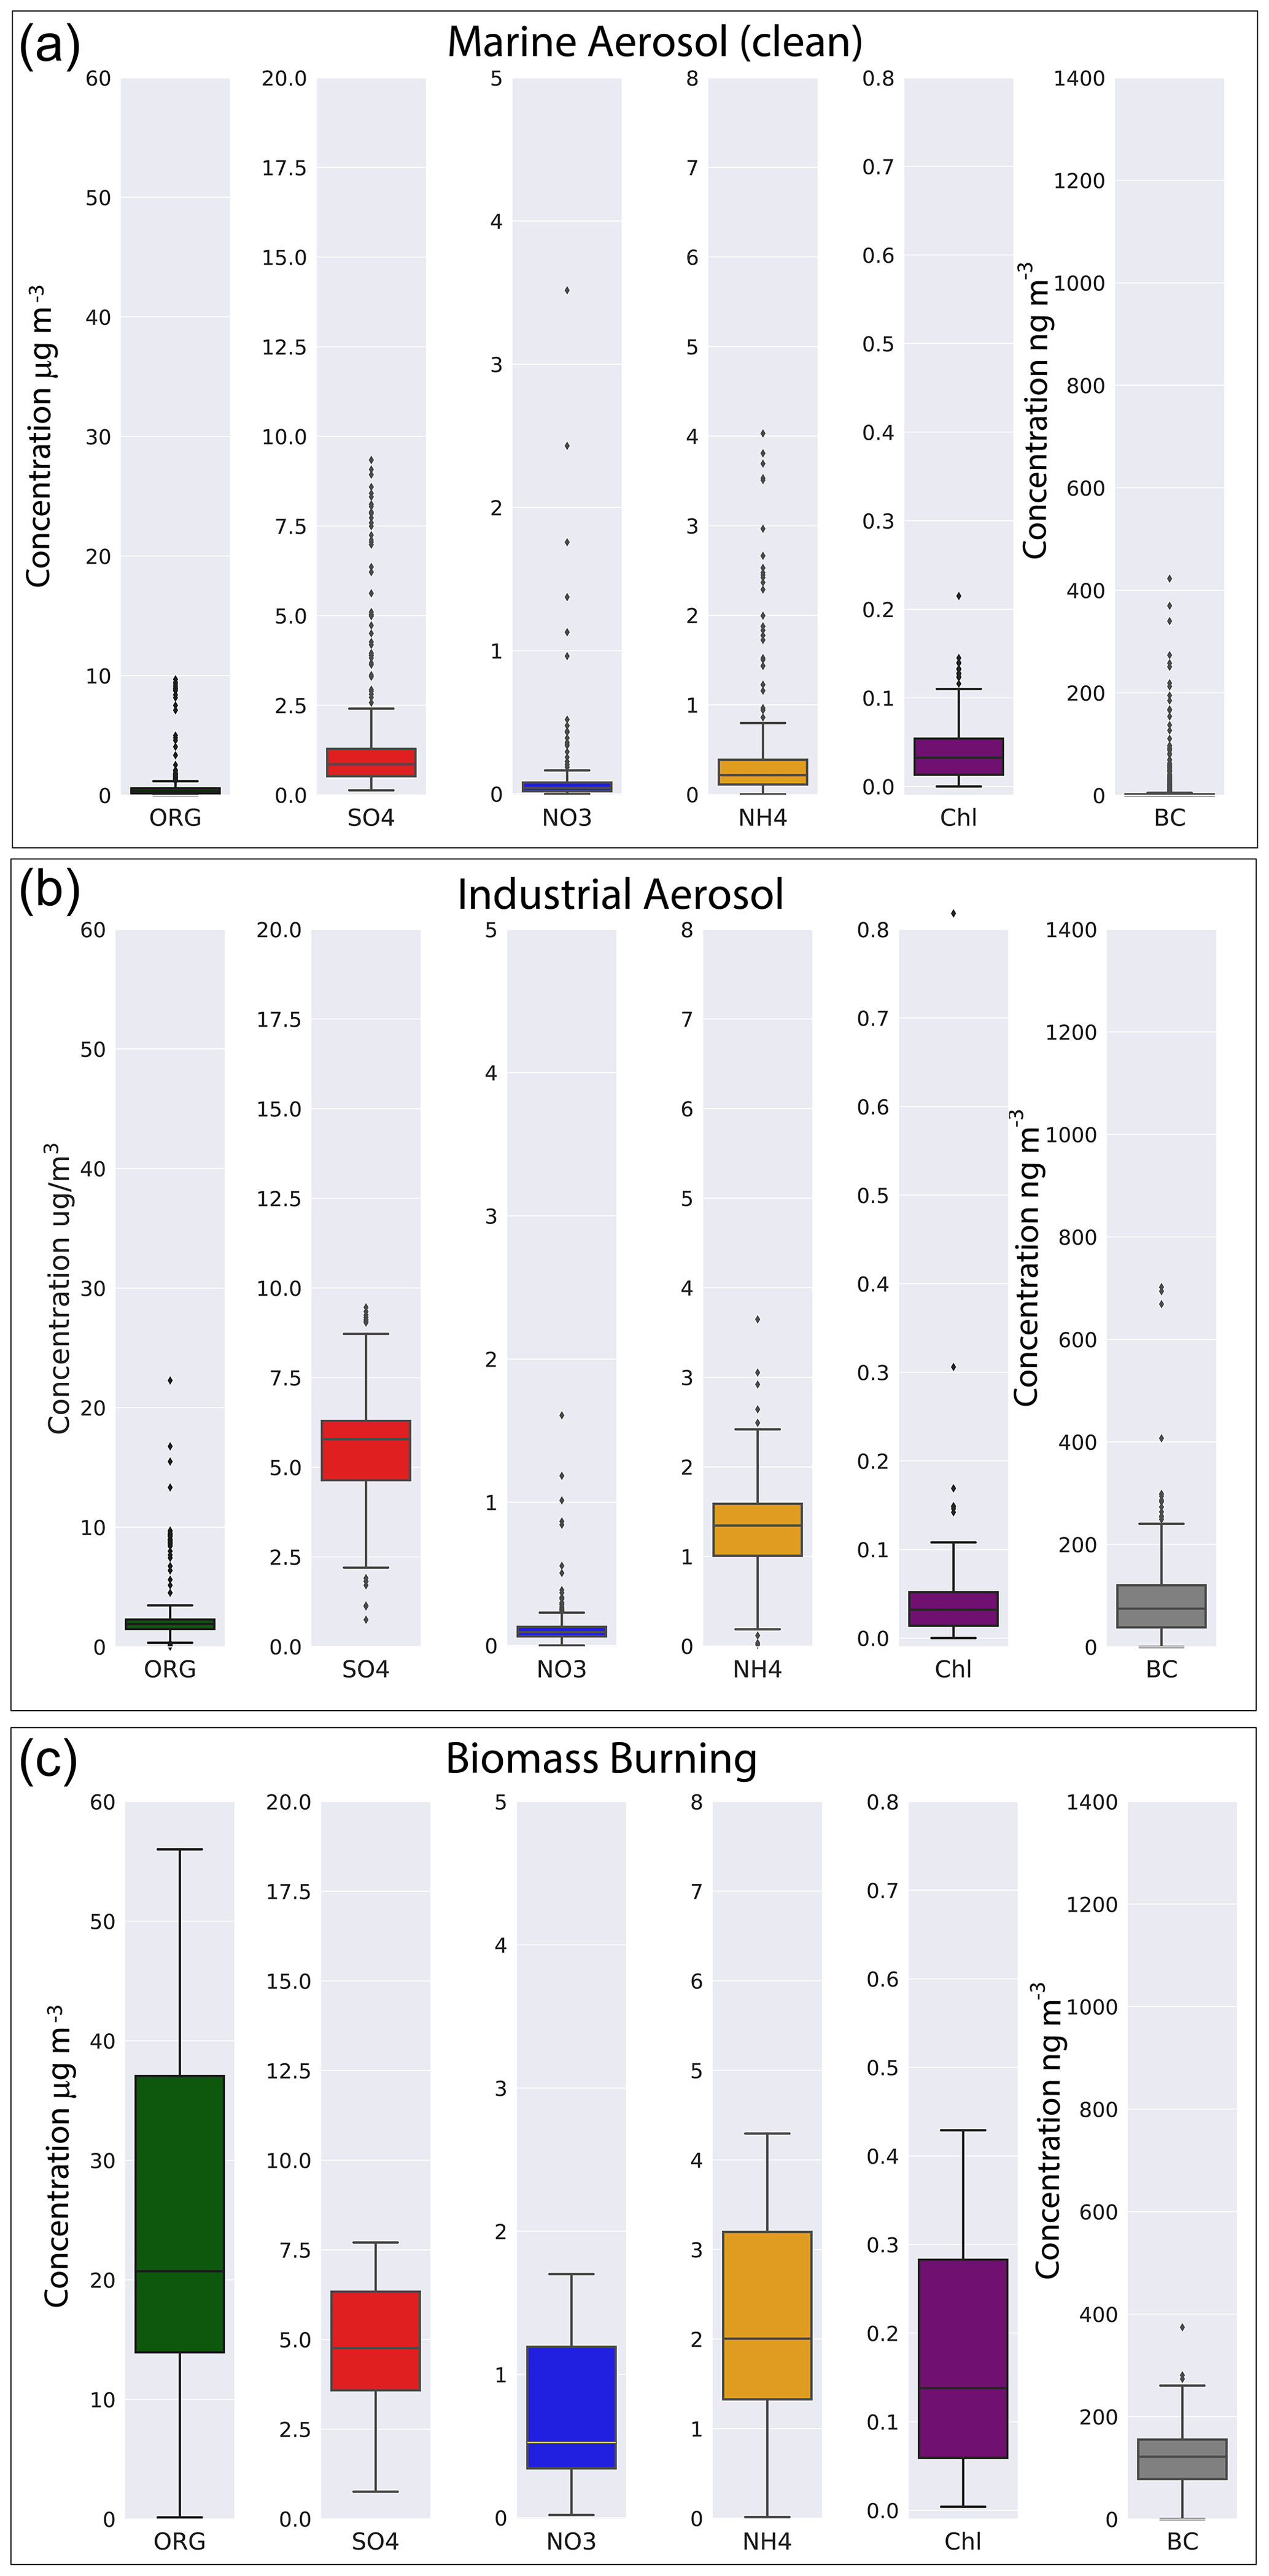
Figure 7Averaged compositional chemistry samples from the aerosol mass spectrometer and single soot photometer depicting the difference in aerosol chemistry regimes. (a) Clean marine, (b) ship emissions and aged industrial, and (c) biomass burning.
4.1 Marine
The clean MBL had minimal concentrations of aerosols of all chemical species (Fig. 7a). Most of these passes were located over the open ocean away from major industrial or BB locations and shipping lanes (Fig. 2). Marine passes were sampled away from major active BB sources and industrial centers, as confirmed by both HYSPLIT and the ERA5 winds. There were 49 clean MBL passes. The compositional chemistry of clean MBL sampling had median values of 2.2 µg m−3 of ORG, 2.3 µg m−3 of SO4, 0.1 µg m−3 of NO3, 0.3 µg m−3 of NH4, 0.04 µg m−3 of Cl, and 7.4 ng m−3 of BC (Fig. 7a).
4.2 Ship emissions and aged industrial aerosols
Ship emission aerosol were identified when the P-3 flight path intersected ship plume projections or near-ship locations over the ocean (see Video supplement). When the P-3 was in the MBL within 60 km of a cargo or tanker ship and intersected its projected ship plume or sampled directly over shipping lanes, the MBL pass and cloud base pass were recorded as being influenced by ship emissions (Fig. 4). A majority of the ship emission aerosols were sampled between 30 min–4 h after being emitted from the ships. The ship emissions were likely mixed with aged aerosol from sources over Southeast Asia. Industrial anthropogenic aged aerosols away from shipping lanes were also sampled over the East China Sea. These over-ocean samples likely originated from mainland Asia and Taiwan based on HYSPLIT backward trajectories. These were nearly all sampled late in the project after the retreat of the southwest monsoon over the Philippine region. The aerosol chemical composition influenced by ships and distant industrial sources had lower concentrations of SO4, NH4, and particularly NO3 compared to aerosol measured near metro Manila (Fig. 5b). There were 46 legs associated with ship emissions and aged industrial pollution aerosols. The compositional chemistry of these aerosols had median values of 2.3 µg m−3 of ORG, 6.1 µg m−3 of SO4, 0.1 µg m−3 of NO3, 1.4 µg m−3 of NH4, 0.04 µg m−3 of Cl, and 74.2 ng m−3 of BC. Dominant species in these industrial MBL legs were SO4 and NH4 (Fig. 7b).
4.3 Biomass burning
BB passes all showed high concentrations of ORG and BC aerosols. The passes observing BB aerosols were over the Sulu Sea during a prominent BB event in Borneo on 15 September 2019 and just east of the southern Luzon and Samar islands on 16 September 2019. HYSPLIT backward trajectories and ERA5 reanalysis both indicate the aerosols in the MBL were from the Borneo region. Given the backward trajectories and the high concentrations of BC, these MBL passes were indicative of BB aerosols (Bond et al., 2004; Massoli et al., 2015; Crosbie et al., 2022). The compositional chemistry sampled from the 10 BB MBL legs had median values of 21.2 µg m−3 of ORG, 4.9 µg m−3 of SO4, 0.5 µg m−3 of NO3, 2.1 µg m−3 of NH4, 0.14 µg m−3 of Cl, and 135.1 ng m−3 of BC (Fig. 7c).
5.1 Cloud sampling and statistics
Cloud sampling during CAMP2Ex was conducted in small warm cumulus and congestus clouds. The horizontal transects of clouds during cloud base passes ranged from 0.1 to 4.5 km with most clouds in the range of 0.2–0.3 km (Fig. 8a, b). The high-spectral-resolution lidar (HSRL) (Sawamura et al., 2017; Burton et al., 2018) and the research scanning polarimeter (RSP; Cairns et al., 1999) showed that 50 % of all transect lengths at all altitudes were < 0.6 km. A cloud base pass with the FCDP was recorded if Nc > 10 cm−3 and liquid water content (LWC) > 0.05 g m−3. In situ measurements from the FCDP showed that 50 % of the cloud base transect lengths were < 0.2 km and 95 % < 1.0 km (Fig. 8).
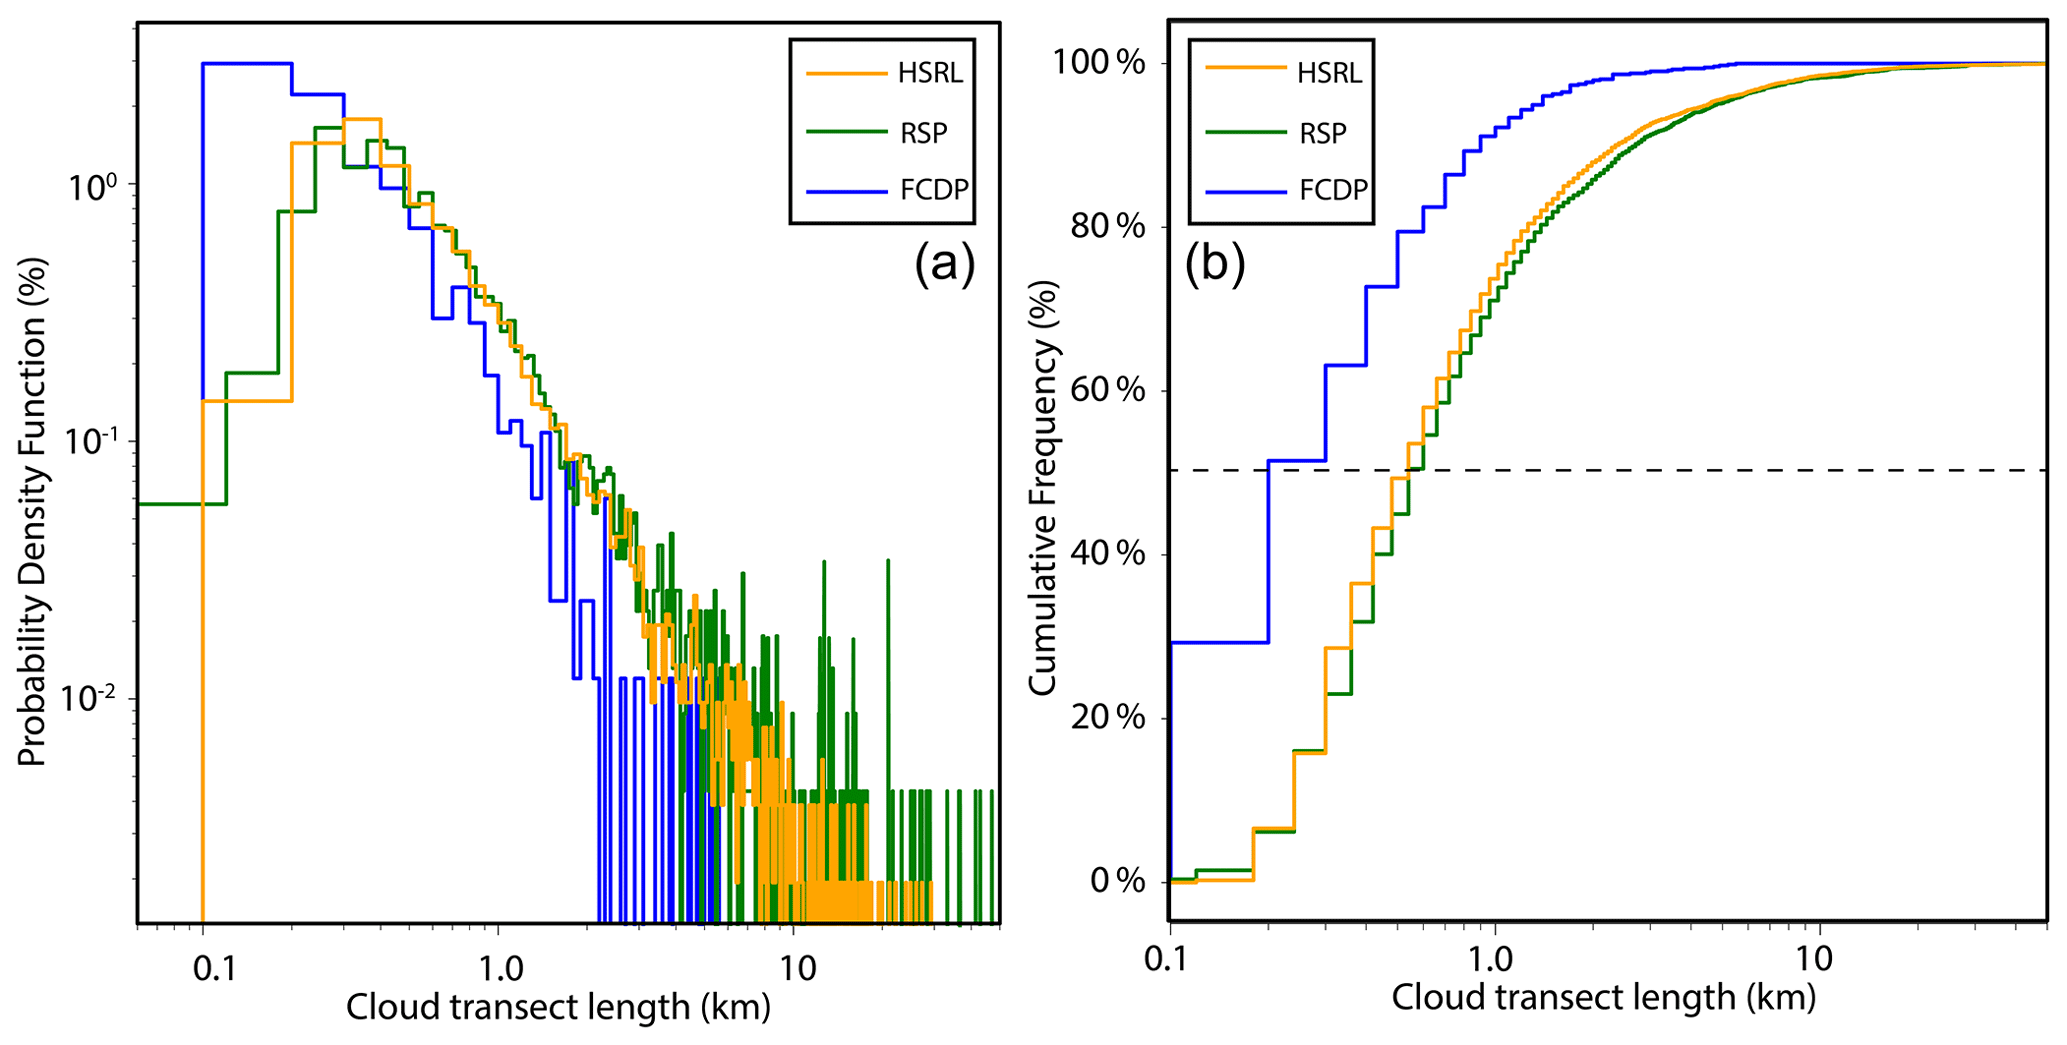
Figure 8(a) The distribution of all cloud transects sampled on all 19 research flights by two remote sensing instruments, the high-spectral-resolution lidar (HSRL, orange), and the research scanning polarimeter (RSP, green). The fast cloud droplet probe (FCDP, blue) transect lengths are only for the passes just above cloud base. (b) Cumulative frequency diagram of the cloud transect lengths.
When sampling near cloud base, the stage in the lifetime of the sampled cloud was unknown. It was also not possible to correctly identify what part of the cloud was sampled, whether the edge or the core updraft. Updraft strengths just above cloud base, measured by TAMMS, ranged from 0.1 to 3.0 m s−1 (Fig. 9a). Median updraft speeds did not differ greatly in the clouds sampled over the three oceanic regions: the West Pacific (0.4 m s−1), the Sulu Sea (0.4 m s−1), and the South China Sea (0.5 m s−1). Based on Fig. 9b, 50 % of the updrafts sampled had vertical velocities exceeding 0.4 m s−1. To ensure that clouds sampled were drawing air from the MBL and were near the core of the updraft, only cloud base passes with updrafts > 0.4 m s−1 were included in the subsequent analysis.
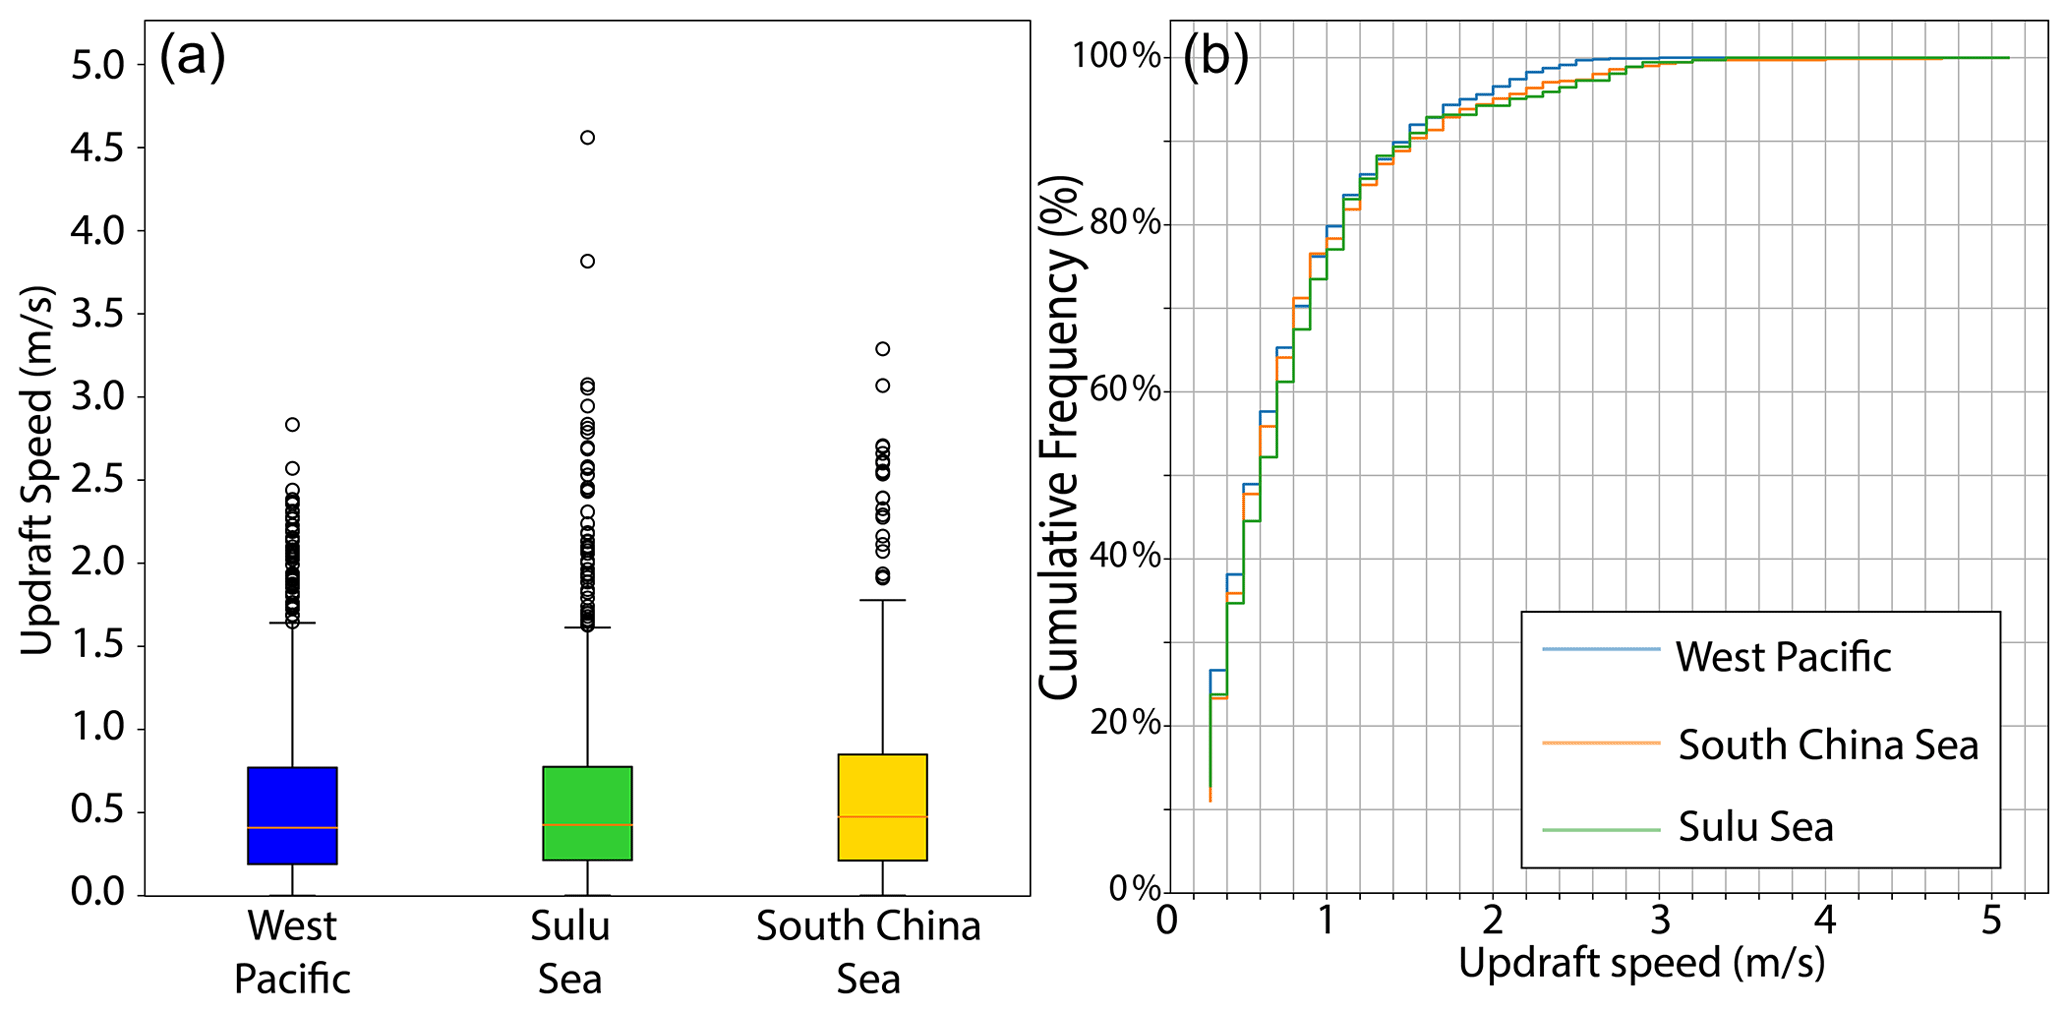
Figure 9(a) The distribution of the updraft speeds measured at cloud base using data from the Turbulent Air Motion Measurement System (TAMMS) over three oceanic regions around the Philippines. The median (red line), the 25th and 75th percentiles (colored boxes), the 5th and 95th percentiles (black whiskers), and outliers (circles) are shown. (b) Cumulative frequency diagram of updrafts over the three regions.
Nearly all cloud base passes were completed in the same region immediately following MBL passes (Fig. 2). There were two legs with cloud base passes over the southern Sulu Sea where the cloud base passes were delayed to sample growing clouds to the north. The aircraft then returned to the location of the MBL passes and sampled the cloud base.
In total, 1416 s of cloud base passes were categorized into the three aerosol regimes (Table 1). There were no clouds sampled at cloud base during flights around the city of Manila, so all cloud base passes categorized as ship emissions and aged industrial were sampled over the open ocean.
The updraft speeds in regions where biomass burning aerosols and industrial aerosols were located were typically about 0.2 m s−1 stronger with some larger outliers compared to the clouds sampled in the clean marine boundary layer (Fig. 10a, b). This difference may contribute to somewhat greater droplet concentrations in the cloud base region for the biomass burning and industrial impacted clouds (see next section).
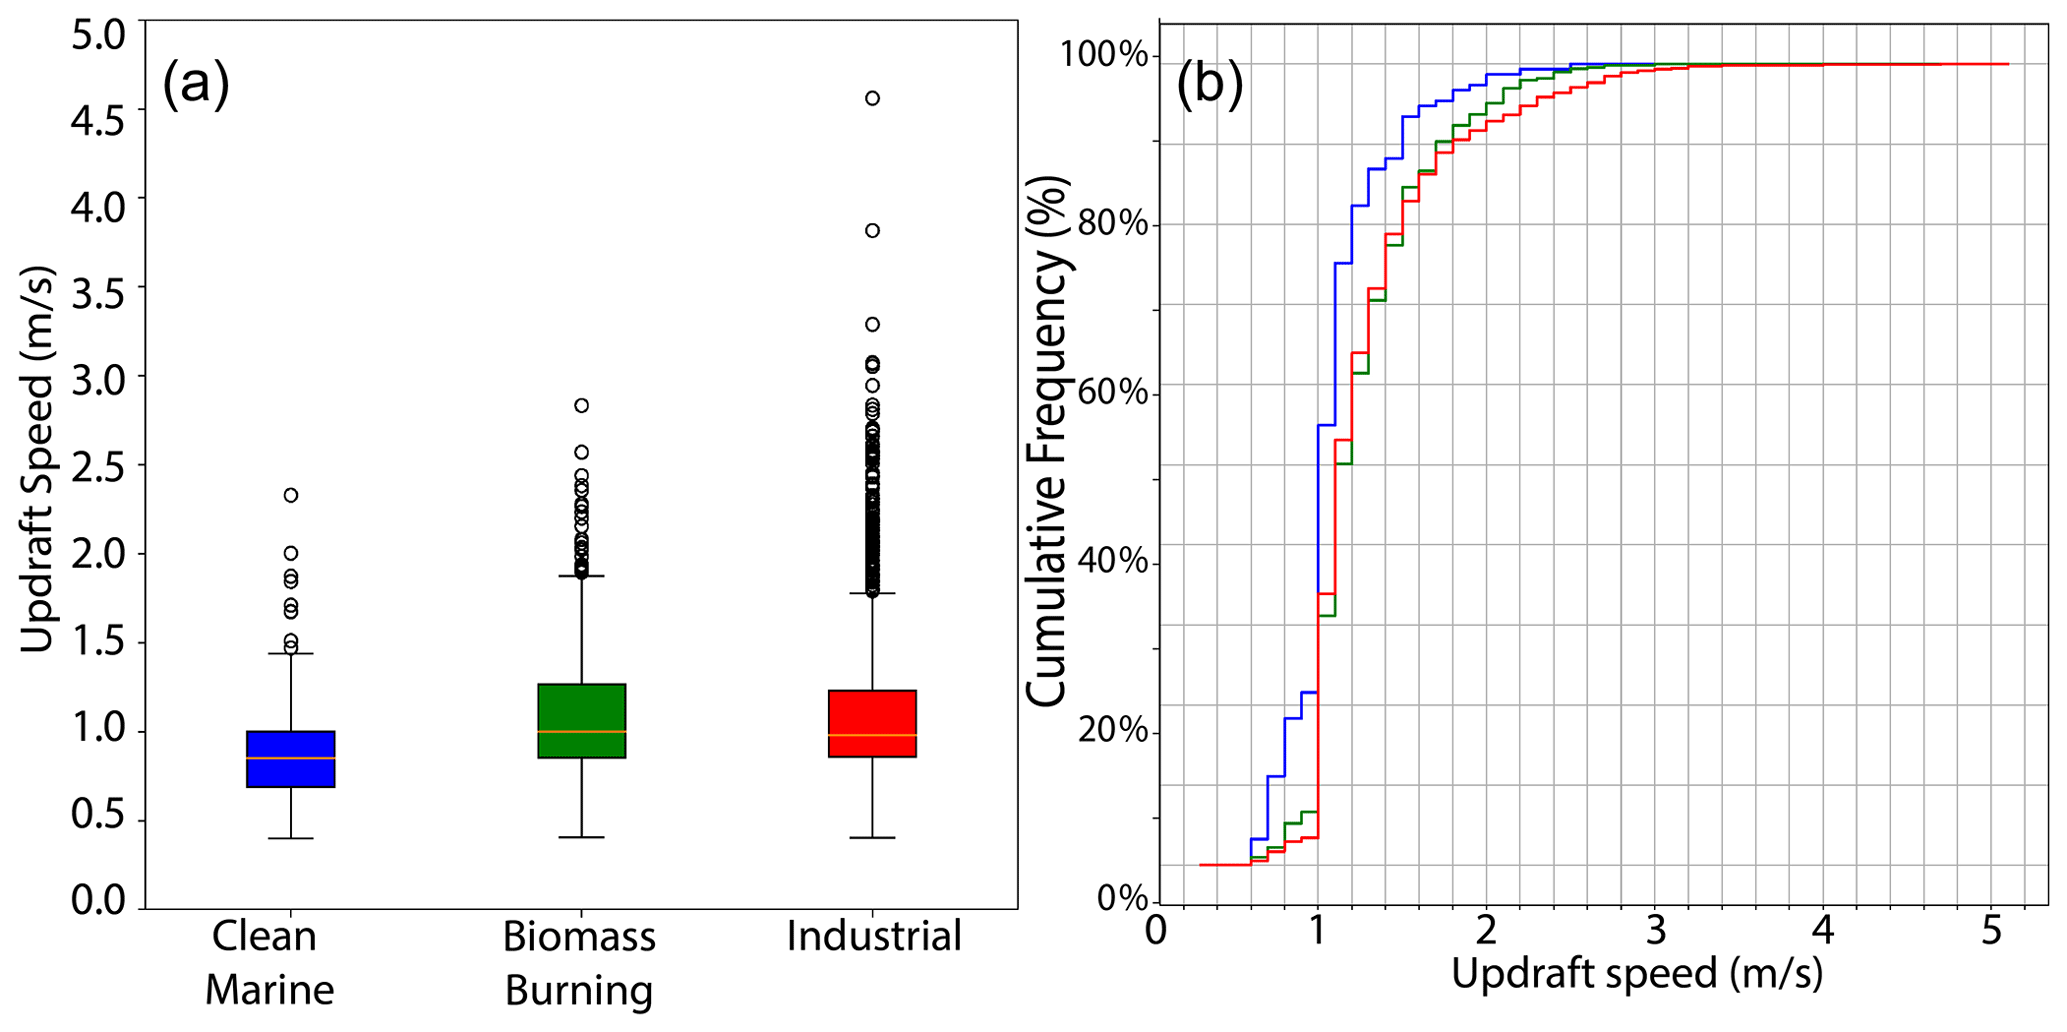
Figure 10(a) The distribution of the updraft speeds measured at cloud base using data from the Turbulent Air Motion Measurement System (TAMMS) for the three aerosol types discussed in Sect. 4. The median (orange line), the 25th and 75th percentiles (colored boxes), the 5th and 95th percentiles (black whiskers), and outliers (circles) are shown. (b) Cumulative frequency diagram of updrafts for the three aerosol types.
5.2 Cloud droplet size distributions
For clouds with updrafts > 0.4 m s−1, the median Nc just above cloud base for the clean marine clouds was 36.3 cm−3, while industrial was 112.2 cm−3 and BB 251.2 cm−3 (Fig. 11). The 75th percentile values for marine clouds was 63.5 cm−3, industrial 273.8 cm−3, and BB 541.1 cm−3, while the 95th percentile values for marine clouds was 149.4 cm−3, industrial 788.0 cm−3, and BB 1308.7 cm−3.
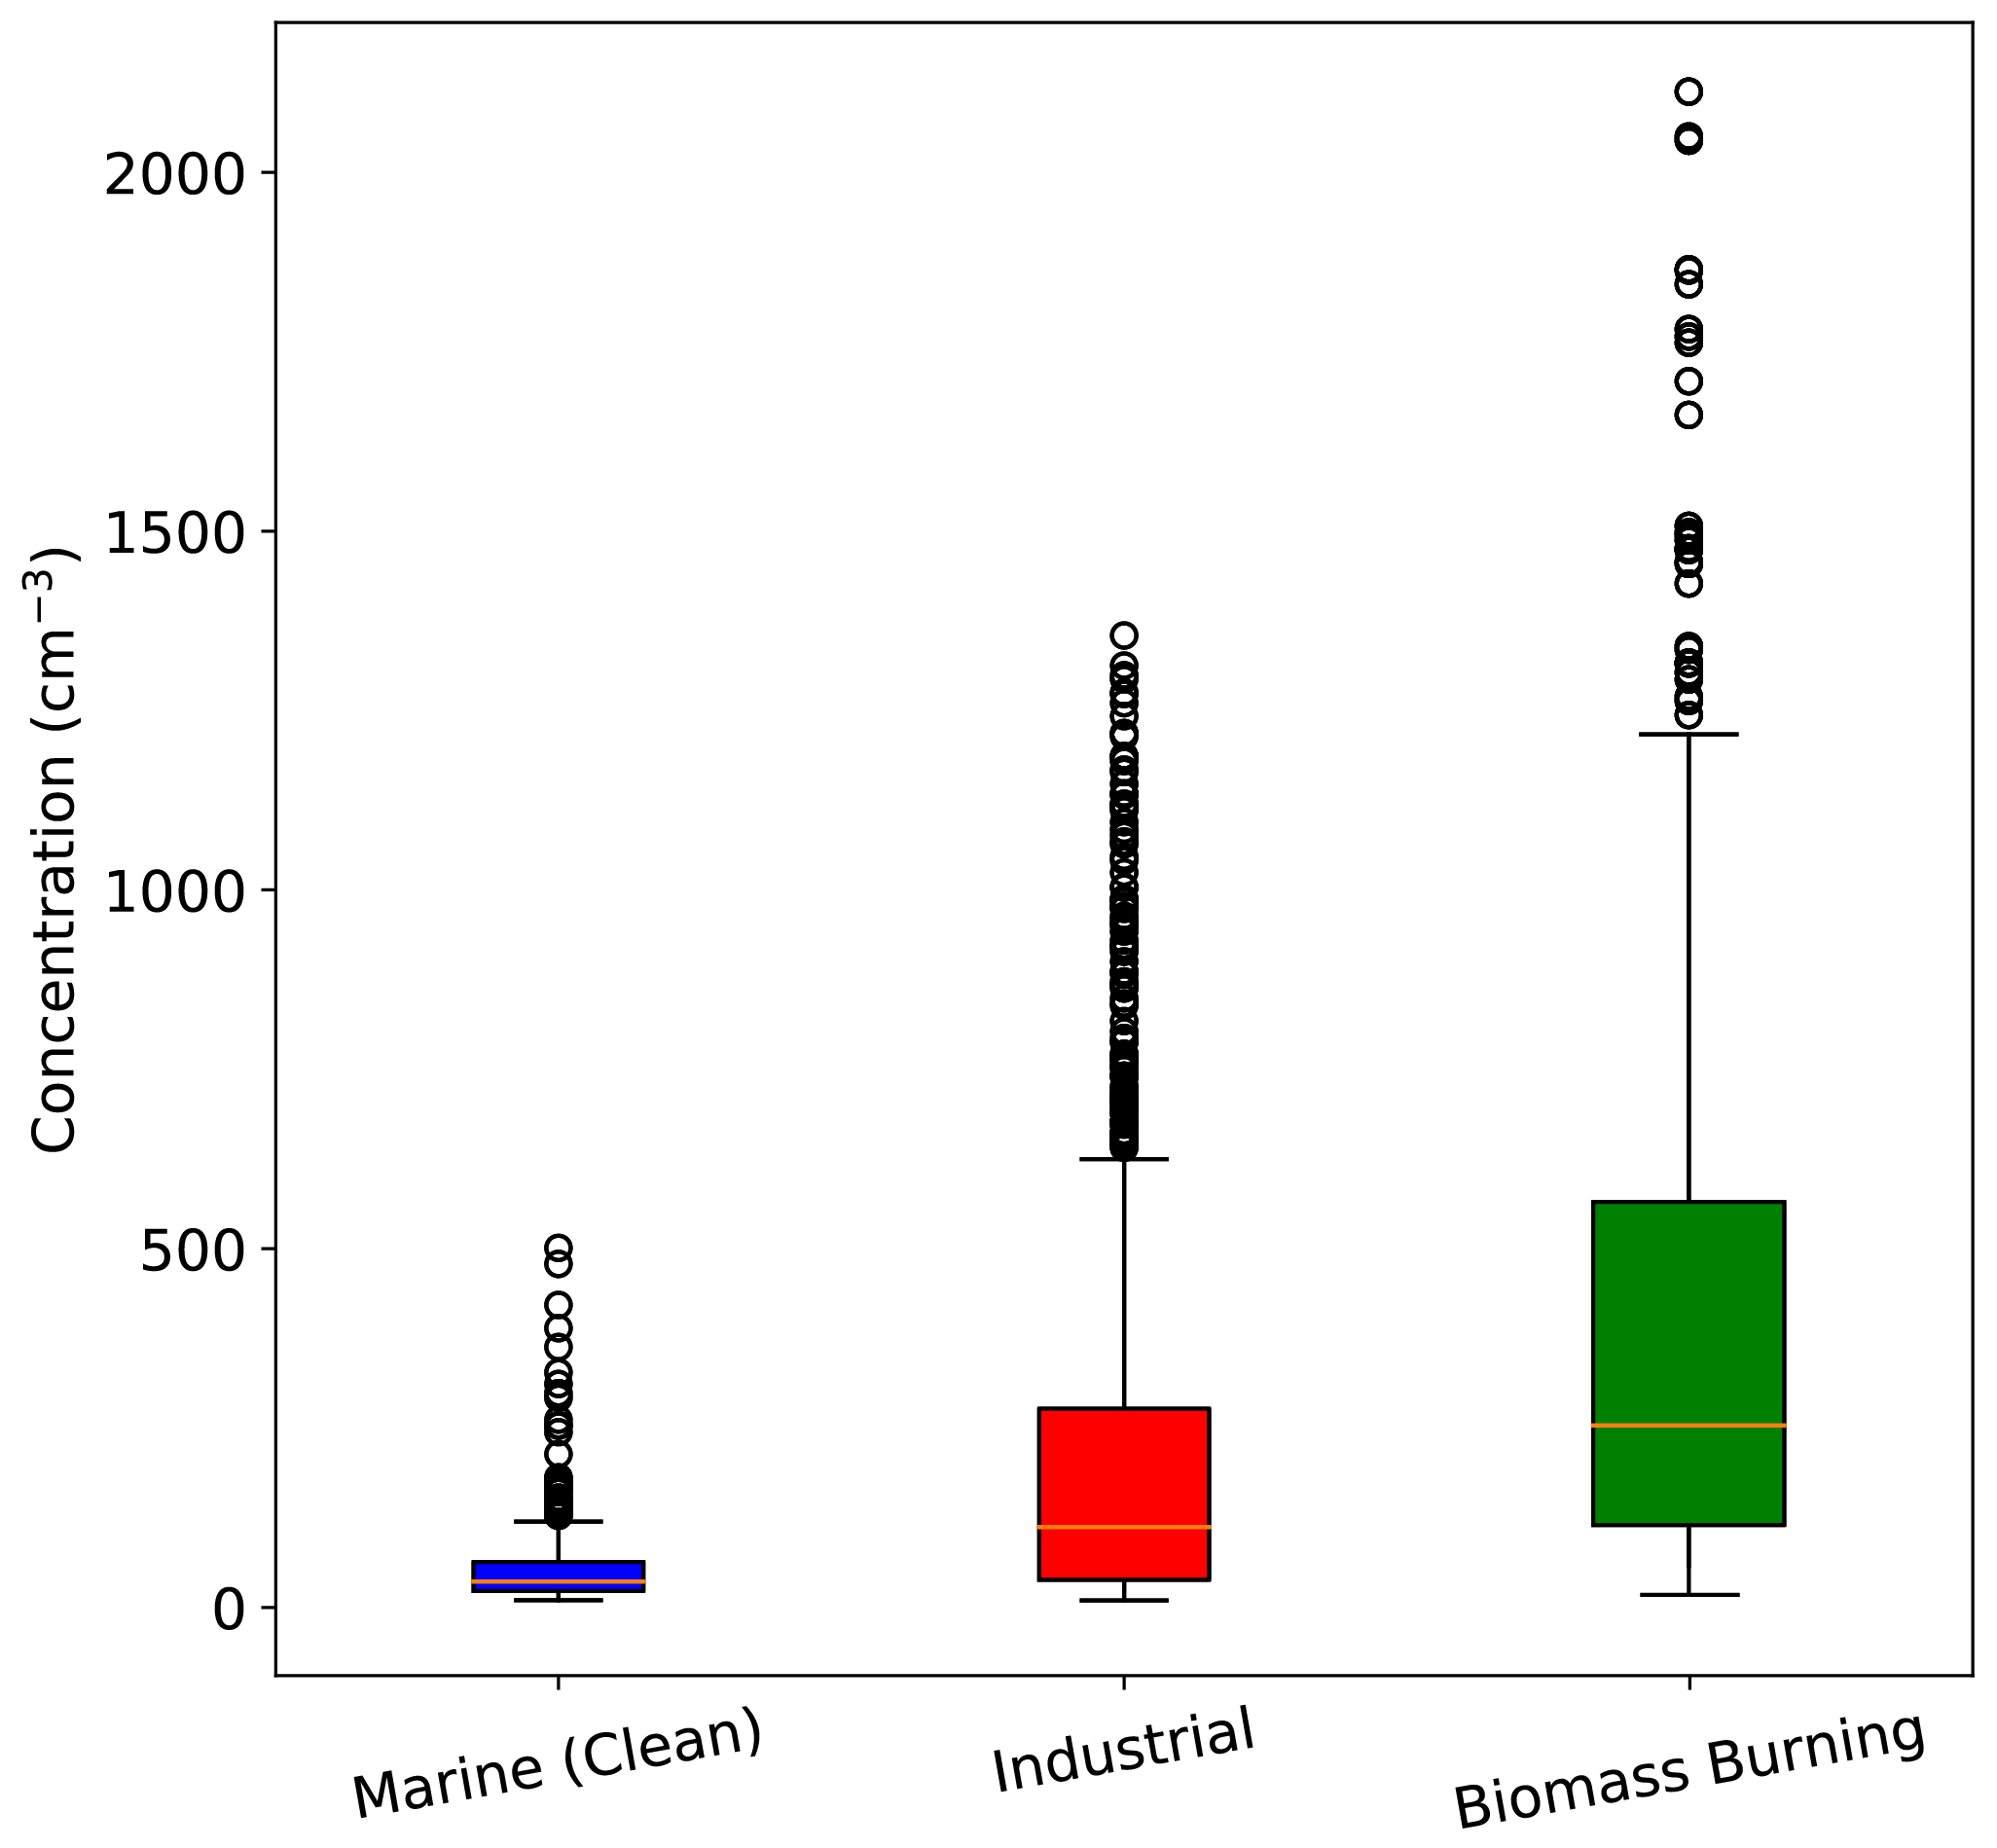
Figure 11Cloud droplet concentration just above cloud base for the three aerosol source regions. The median (orange line), the 25th and 75th percentiles (colored boxes), the 5th and 95th percentiles (black whiskers), and outliers (circles) are shown.
Figure 12a shows the statistics of the normalized mass distribution function defined as
for all the droplet spectra in the marine category. The normalized mass distribution function was used to account for the fact that the aircraft sampled at different distances above cloud base and therefore encountered measured droplet spectra with different values of LWC. The remaining panels (Fig. 12b, c) show the statistics of the normalized mass distribution functions for the other two aerosol source regions together with the marine spectra. Clouds impacted by BB and ship emission and aged industrial aerosols contained higher concentrations of cloud droplets in size ranges corresponding to bins < 13 µm, with concentrations in the 8.0–10.0 µm size bin almost 1.5 orders of magnitude greater than the marine clouds. At size ranges between 13.0–34.5 µm the concentrations in all categories were almost an order of magnitude less than the marine category. In the size bins > 34.5 µm concentrations were equal to, or slightly exceeded, the concentrations of the marine clouds. In the largest bins no drops were recorded for the BB category, while the ship emission and aged industrial aerosol category had a higher concentration of droplets in all three of the largest bins.
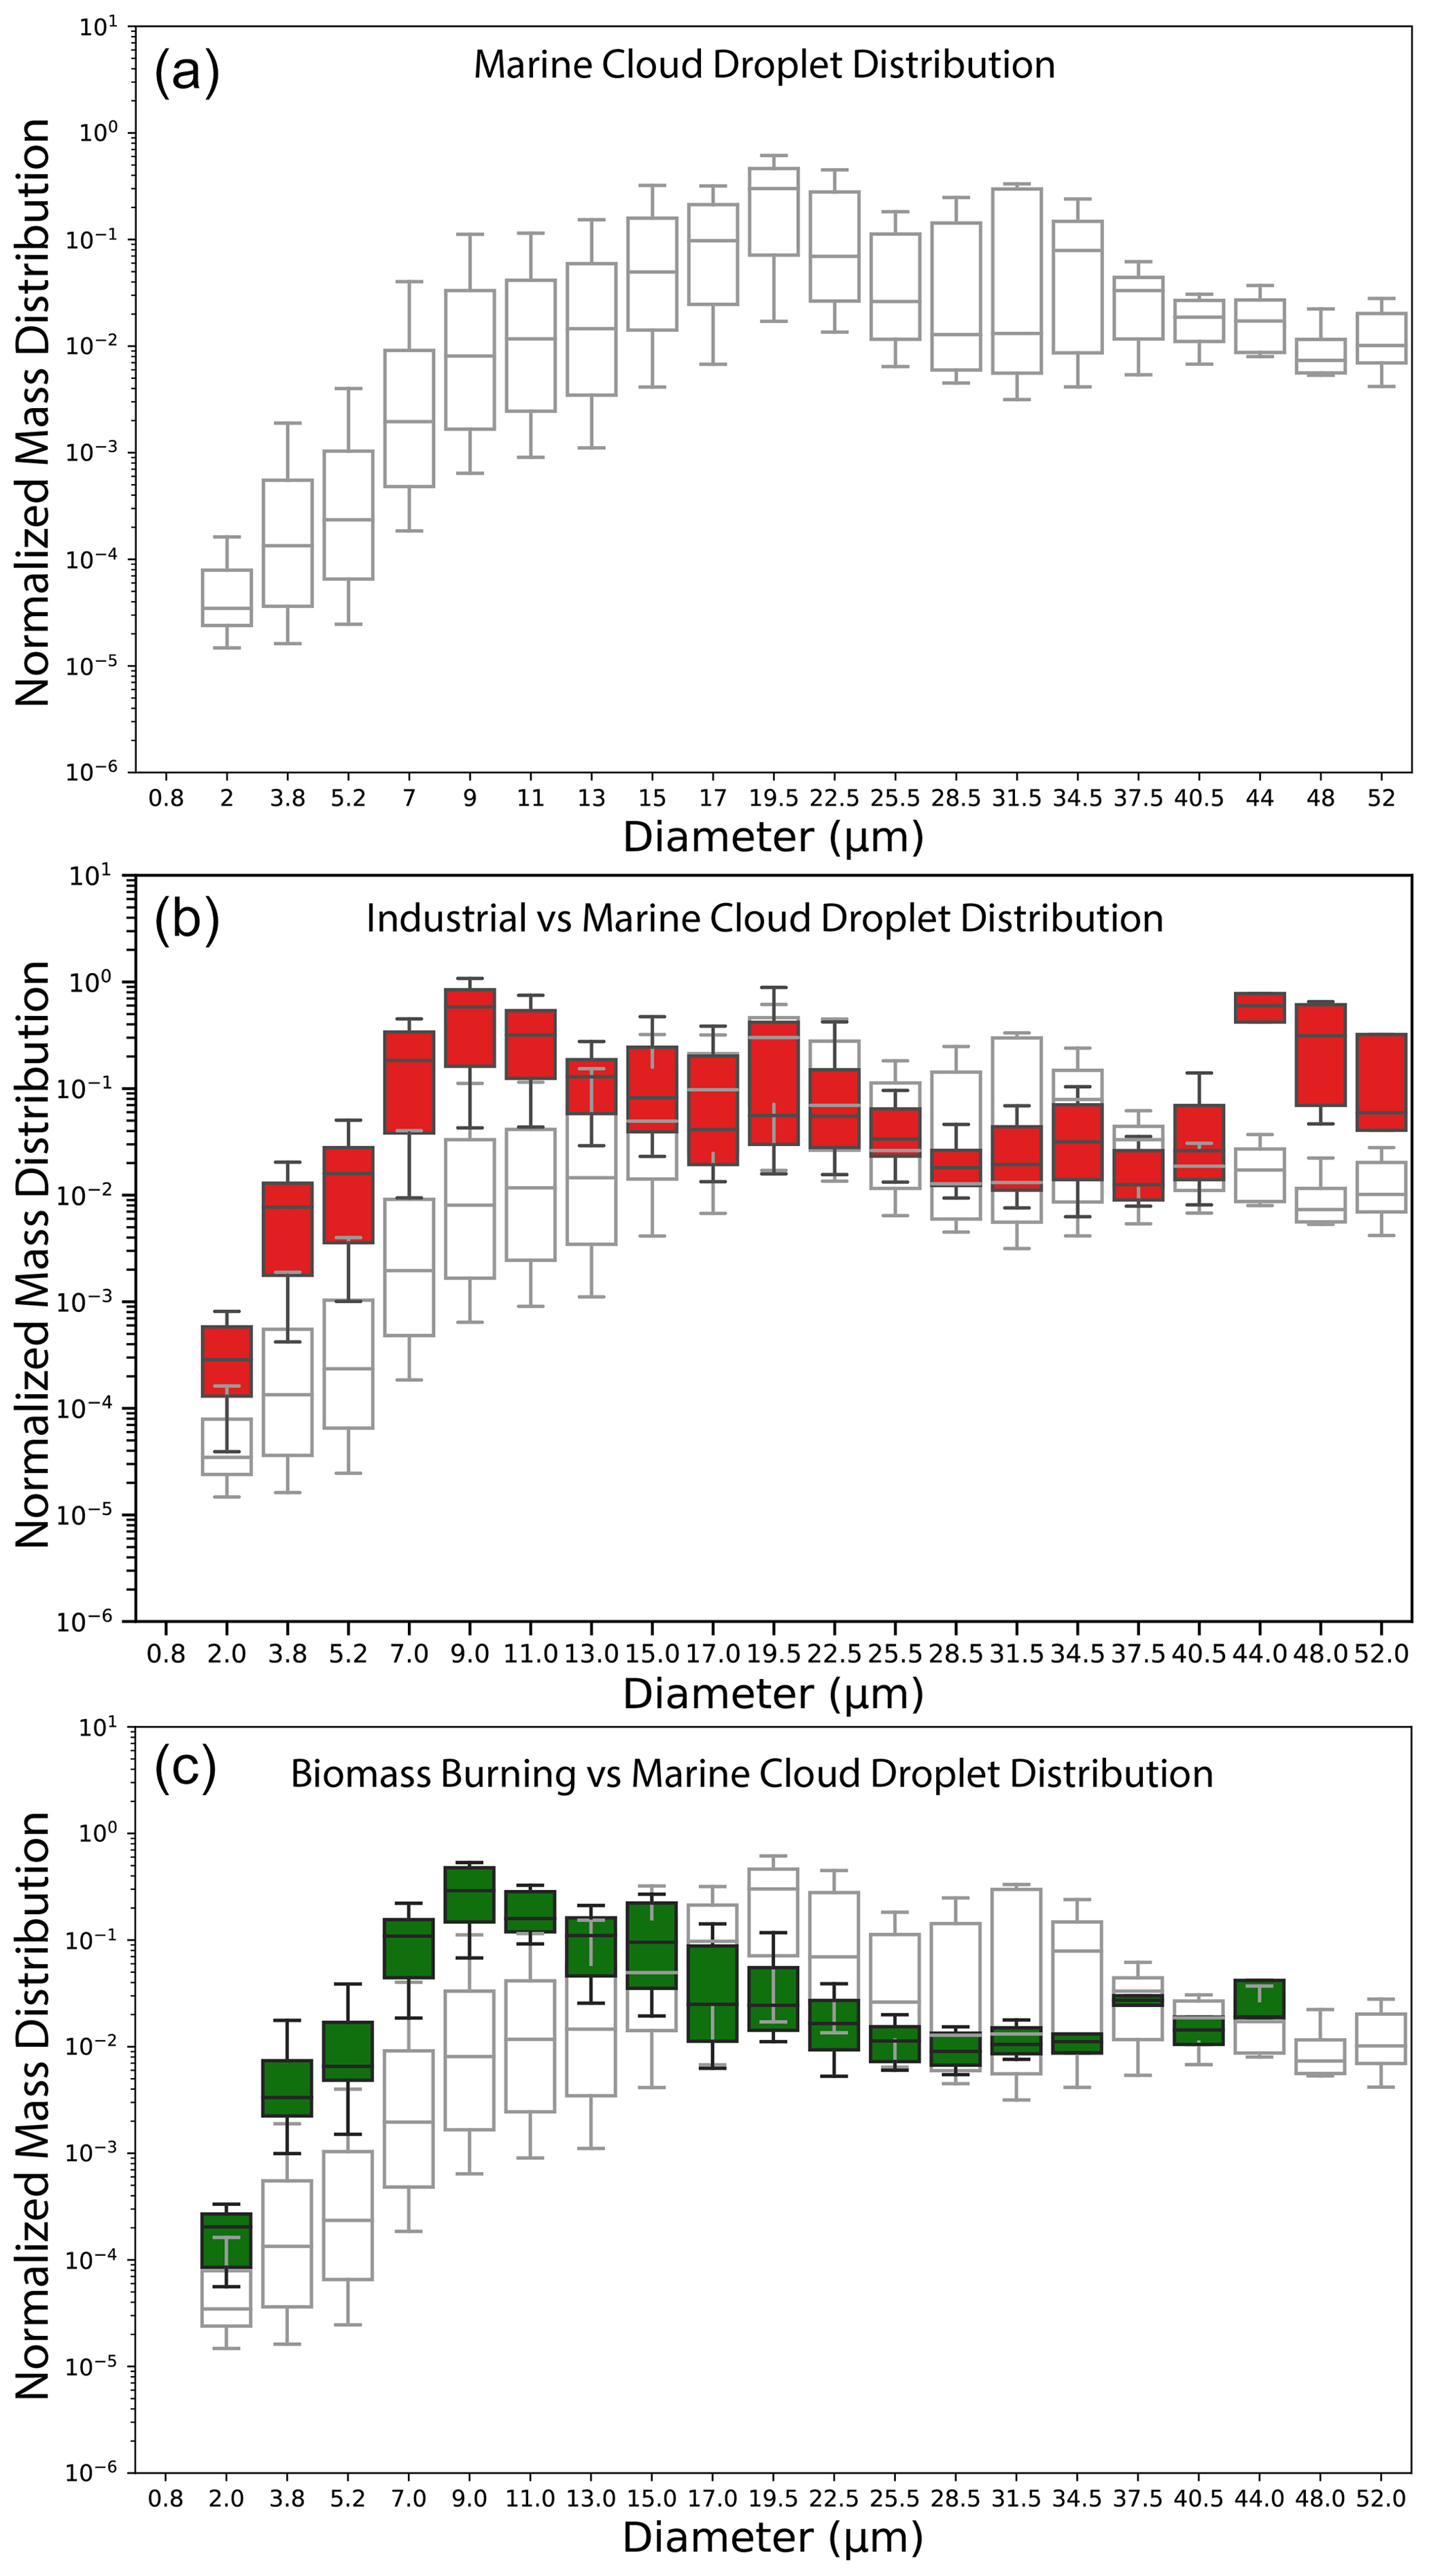
Figure 12Normalized mass distribution functions from the fast cloud droplet probe (FCDP) just above cloud base for the three aerosol categories. (a) Cloud base spectra in clean marine environments (white) compared with (b) industrial (red), and (c) biomass burning (green).
The Clouds, Aerosol and Monsoon Processes Philippines Experiment (CAMP2Ex) provided an opportunity to examine the impact of different aerosol sources on cloud base microphysical properties using data from 19 research flights flown around the Philippine islands between 24 August–5 October 2019. In total 112 marine boundary layer (MBL) legs of 10 min from the aerosol mass spectrometer were analyzed. Four different aerosol source regions were identified within the MBL from chemical analysis of the aerosol, HYSPLIT backward trajectories, cargo and tanker ship emission projections, and a K-means cluster algorithm. The Manila aerosol source region did not have cloud passes to determine the impact of the Manila aerosol plume on cloud base microphysics. Cloud droplet size distributions from the remaining three regions influenced by different aerosol sources were measured using the fast cloud droplet probe (FCDP). Small cumulus and congestus clouds were analyzed for this study. Over 50 % of the cloud transects were < 0.2 km, with 95 % < 0.9 km in length. The cloud droplet spectrum analyses were restricted to those periods when the measured updraft was > 0.4 m s−1 to ensure that the core updraft was sampled and the cloud was drawing air upward from the MBL. There were 1416 s of cloud base sampling meeting this criterion. The key findings of this analysis are as follows.
Four sources were found to influence the aerosol chemical composition in the Philippine region. These were marine (ocean source), ship emissions mixed with aged industrial aerosols from urban sources in mainland Southeast Asia, fresh industrial and automobile-generated aerosol from the city of Manila, and aerosol from biomass burning originating from Borneo and Indonesia.
The marine aerosol chemical composition, which was not influenced by anthropogenic aerosols, had low values of all sampled chemical signatures, specifically median values of 2.2 µg m−3 of organics (ORG), 2.3 µg m−3 of SO4, 0.1 µg m−3 of NO3, 0.3 µg m−3 of NH4, 0.04 µg m−3 of Cl, and 7.4 ng m−3 of refractory black carbon (BC).
The key chemical signatures of the other three aerosol source regions were (1) ship emissions and aged industrial: elevated SO4 concentrations with a median value of 6.1 µg m−3; (2) biomass burning: elevated concentrations of ORG of 21.2 µg m−3 and BC of 135.1 ng m−3; (3) Manila: median values of NO3 of 0.9 µg m−3.
Normalized cloud droplet size distributions showed that clouds impacted by ship emissions and aged industrial aerosols and biomass burning contained higher concentrations of cloud droplets by as much as 1.5 orders of magnitude in the size ranges < 13 µm compared to marine clouds.
At size ranges between 13.0–34.5 µm the median concentrations in all categories were nearly an order of magnitude less than the marine category. For droplets with diameters > 34.5 µm, concentrations were equal to, or slightly exceeded, the concentrations of the marine clouds.
These analyses show that the anthropogenic aerosols generated from industrial, ship, and biomass burning sources have a significant influence on the cloud base microphysical structure of clouds in the Philippine region, particularly over the South China Sea. Future studies will examine how these changes in cloud droplet spectra as a result of aerosol pollution manifest in the higher regions of the clouds and impact precipitation, radiative properties, and lifetime in small cumulus and congestus clouds.
This appendix describes the methods used to produce a dataset with the predicted locations of cargo and tanker ship aerosols in the vicinity of the P-3 aircraft during CAMP2Ex. The dataset provides information on the P-3 MBL status, the distance from Manila, the number of ships within a 60 and 100 km radius of the P-3, the number of discrete plumes within 60 and 100 km of the P-3, the time of a plume–aircraft intersection (if such an intersection occurred), the age of the intersected plume, and the MMSI location of the ship that produced that plume.
A1 Cargo and tanker ship data
The MMSI ship dataset purchased from Astra Paging Ltd provided ship information covering the region of flights around the Philippines at 3 h frequency between the hours of 22:00 UTC and 09:00 UTC the next day. The heading, course, and speed information of each ship was used to estimate coordinates of the ships at 1 Hz resolution using the World Geodetic System 1984 Coordinate Reference System (WGS84 CRS), with precautions made for ships that were projected to arrive on land.
A2 Initial backwards projection
To initiate the ship position, ship locations before 22:00 UTC were projected backwards in time to the hour of 15:00 UTC to prepare complete predicted plume positions present before the P-3 takeoff. Using the earliest reported position of each ship (referred to here as a ping), all ships were projected to predicted locations at 15:00 UTC. To do this, each course was flipped by 180∘, i.e., in the opposite direction. Ship speed and the time duration between 15:00 UTC and the earliest position at 22:00 UTC were used to produce a travel distance. Paired with the flipped course, a geodesic was used to project each ship's coordinates using the WGS84 model. If a ship was projected to go into port, it was ignored. Only two ships were projected to arrive on land across the dataset. For these two ships, they were placed at the coordinates reported by their earliest location and were given a speed of 0 kn between 15:00 and 22:00 UTC. Thus, the ship was treated as stationary at the location of its earliest report.
A3 Projection of ship positions to 22:00 UTC
After this initial back projection, ship positions were projected via the geodesic generated from their course and speed. The time duration between each update was one second.
A4 Treatment of ship pings
Beginning at 22:00 UTC, the ship ping data were used to update the ships' position. At each time step, the ship dataset was checked for a ping. Ship projections were overwritten with the relevant information given by the ping – the latitude, longitude, course, and speed. The ping data for each ship is not continuous; there were some cases where the coordinates described by a ship ping were much further from the ship's previous coordinates, far enough that it would be impossible for the ship to traverse this distance during the time step. Ships that move with a velocity greater than 50 kn (approx. 25 m s−1) were labeled as “teleporting”. This phenomenon was taken into account when generating plumes, specifically plume lines.
A5 Ship plumes
The aerosol plumes produced by each ship were treated separately. Every 600 s, a plume was generated at the location of each ship. Wind data from the ERA5 level 1 reanalysis were used to calculate plume advection. In much the same way that the ship positions were projected, a geodesic was used to determine a plume's expected coordinates. The u and v wind components were used to find the azimuth and length of the geodesic used to project each plume. The time resolution of the ERA5 dataset is 1 h. Since ship positions were estimated at 1 Hz, the step's current time was rounded to the nearest hour for indexing the ERA5 winds. The coordinate resolution of the ERA5 dataset is 0.25∘; thus the indexable coordinate nearest to each plume was used for plume projection. Each plume was assigned an age, starting at zero when the plume was initially generated. Each second, the age was incremented. At an age of 14 400 s (4 h), the plumes were assumed to have mixed out into the environment (Aliabadi et al., 2016), and the plume was terminated.
To approximate continuous aerosol production, lines were drawn between plumes based on which ship produced them, producing a chain of plumes from each ship. Each link in the chain was given an age equal to that of the younger plume to which it was connected.
As mentioned earlier, the intermittent shipping data cause some ships to appear to move quicker than is possible. In the event that a plume was produced by a ship that had just “teleported”, the plume line that would connect this newly produced plume with the previous plume was discarded, creating a discontinuity in the ship's plume streak.
A6 Data collection
When the P-3 data were integrated with the ship plume projections, the following information was recorded at each second of the research flight.
-
Boundary layer indication. This is a simple Boolean value representing if the P-3 aircraft was below the MBL median altitude, 466 m. A value of 1 indicates that it was under 466 m; a value of 0 indicates that it was above.
-
Distance from Manila. This is the distance between the P-3 aircraft's present coordinates and Manila, defined at 14.5995∘ N, 120.9842∘ E.
-
Ships within 60 and 100 km. The number of ships within radii of 60 and 100 km of the aircraft was recorded.
-
Plume line intersection data. The path that the P-3 aircraft takes during the interval 30 s before and 30 s after the present time step was used to determine if the P-3 aircraft intersected a plume line. If this path did indeed intersect a plume line, the time of this intersection, the age of the plume line, and the MMSI of the ship that produced the plume were all recorded.
-
Animation description. The video animation includes a map showing ships as red arrows sized by ship length, their smoke plumes, and the track of each plume sample for 4 h after it was emitted. The aircraft appears as a larger arrow, colored by aircraft altitude, with the aircraft's track for the previous hour as a wide line and the next hour as a narrow line. A table of plume crossing times with one entry per minute notes the time, age of plume (hours since the ship emitted it), the ship length in meters, the ship type (7× for cargo ships, 8× for tankers), aircraft altitude, and the highest atmospheric sampling values detected during the crossing of that plume of SO4, NO3, NH4, ORG, and Cl.
All CAMP2Ex in situ data used in this study are publicly available at https://www-air.larc.nasa.gov/cgi-bin/ArcView/camp2ex (NASA-Langley, 2023). The ERA5 data (Hersbach et al., 2022) are downloadable at https://cds.climate.copernicus.eu/cdsapp#!/dataset/reanalysis-era5-complete?tab=form. Cargo and tanker ship data (Astrapaging, 2023) can be ordered from http://www.astrapaging.com/.
The video animation includes a map showing ships as red arrows sized by ship length; their smoke plumes, tracking each plume sample for 4 h after it is emitted; the aircraft as a larger arrow, colored by aircraft altitude; and the aircraft's track for the previous hour (wide line) and the next hour (narrow line). Each smoke plume dot represents a 10 min interval. Plumes from smaller ships (length < 180 m) are in brown, and those from longer ships are dark gray, with plumes drawn increasingly more pale in proportion to their age. A strip chart graph shows aircraft altitude and atmospheric constituents NO3, NH4, Cl, and SO4, centered on the present moment and extending for ± 20 min. Along the top of this graph, triangles mark times when the aircraft's track crosses an advected ship plume; triangles are colored as the smoke plumes are – in brown for ships under 180 m in length and dark gray for longer ships. All 19 CAMP2Ex research flights are shown in turn, played at a rate of 15 flight minutes per animation second. The complete video animation is about 10 min long (https://doi.org/10.5446/62465, Miller et al., 2023).
RMM, RMR, and LDG conceived the study design and analysis. RMM analyzed the data with inputs from RMR, LDG, GMM, and SWN. RMM, GMM, and LDG acquired funding. LZ, SW, and KT collected data on board the NASA P-3. DF provided HSRL- and RSP-derived data. MR analyzed ship plume projections. RMM wrote the paper with reviews from co-authors.
Publisher's note: Copernicus Publications remains neutral with regard to jurisdictional claims in published maps and institutional affiliations.
This article is part of the special issue “Cloud, Aerosol and Monsoon Processes Philippines Experiment (CAMP2Ex) (ACP/AMT inter-journal SI)”. It is not associated with a conference.
The authors wish to acknowledge the entire CAMP2Ex science team, NASA Ames Earth Science Project Office, and the NASA P-3 crew for the successful deployment. In addition, we would like to thank Michael Shook for creating the merged instrument data files for the CAMP2Ex campaign. We would also like to thank the NASA Ames Earth Science Project Office for their endless help and support throughout the mission. We thank Jim Hudson and Fan Mei for their helpful comments on the paper.
This research has been supported by a NASA award (grant no. 80NSSC18K0150) and NASA headquarters under the NASA Future Investigators in NASA Earth and Space Sciences and Technology (grant nos. 80NSSC19K1371, 80NSSC18K0144, and 80NSSC21K1449.)
This paper was edited by Zhanqing Li and reviewed by Fan Mei and James Hudson.
Ackerman, A. S., Toon, O. B., Stevens, D. E., Heymsfield, A. J., Ramanathan, V., and Welton, E. J.: Reduction of tropical cloudiness by soot, Science, 288, 1042–1047, 2000.
Aliabadi, A. A., Thomas, J. L., Herber, A. B., Staebler, R. M., Leaitch, W. R., Schulz, H., Law, K. S., Marelle, L., Burkart, J., Willis, M. D., Bozem, H., Hoor, P. M., Köllner, F., Schneider, J., Levasseur, M., and Abbatt, J. P. D.: Ship emissions measurement in the Arctic by plume intercepts of the Canadian Coast Guard icebreaker Amundsen from the Polar 6 aircraft platform, Atmos. Chem. Phys., 16, 7899–7916, https://doi.org/10.5194/acp-16-7899-2016, 2016.
An, Q., Zhang, H., Wang, Z., Liu, Y., Xie, B., Liu, Q., Wang, Z., and Gong, S.: The development of an atmospheric aerosol/chemistry–climate model, BCC_AGCM_CUACE2.0, and simulated effective radiative forcing of nitrate aerosols, J. Adv. Model. Earth Sy., 11, 3816–3835, 2019.
Andreae, M. O.: Biomass burning: Its history, use and distribution and its impact on environmental quality and global climate, in: Global Biomass Burning: Atmospheric, Climate and Biospheric Implications, edited by: Levine, J. S., MIT Press, Cambridge, Mass, 3–21, ISBN 9780262310895, 1991.
Astrapaging: Vessel Tracking Data, Astrapaging, http://www.astrapaging.com, last access: 23 January 2023.
Barrick, J., Ritter, W., Watson, C., Wynkoop, M., Quinn, J., and Norfolk, D.: Calibration of NASA turbulent air motion measurement system, NASA Tech. Pap. TP-310, NASA, Washington, D. C., https://ntrs.nasa.gov/api/citations/19970010469/downloads/19970010469.pdf (last access: 29 July 2023), 1996.
Bennartz, R., Fan, J., Rausch, J., Leung, L., and Heidinger, A.: Pollution from China increases cloud droplet number, suppresses rain over the East China Sea, Geophys. Res. Lett., 38, L09704, https://doi.org/10.1029/2011GL047235, 2011.
Bond, T. C., Streets, D. G., Yarber, K. F., Nelson, S. M., Woo, J.-H., and Klimont, Z.: A technology-based global inventory of black and organic carbon emissions from combustion, J. Geophys. Res., 109, D14203, https://doi.org/10.1029/2003JD003697, 2004.
Bond, T. C. and Bergstrom, R. W.: Light absorption by carbonaceous particles: An investigative review, Aerosol Sci. Tech., 40, 27–67, 2006.
Bond, T. C., Doherty, S. J., Fahey, D. W., Forster, P. M., Berntsen, T., DeAngelo, B. J., Flanner, M. G., Ghan, S., Kärcher, B., Koch, D., Kinne, S., Kondo, Y., Quinn, P. K., Sarofim, M. C., Schultz, M. G., Schulz, M., Venkataraman, C., Zhang, H., Zhang, S., Bellouin, N., Guttikunda, S. K., Hopke, P. K., Jacobson, M. Z., Kaiser, J. W., Klimont, Z., Lohmann, U., Schwarz, J. P., Shindell, D., Storelvmo, T., Warren, S. G., and Zender, C. S.: Bounding the role of black carbon in the climate system: A scientific assessment, J. Geophys. Res.-Atmos., 118, 5380–5552, https://doi.org/10.1002/jgrd.50171, 2013.
Burton, S. P., Hostetler, C. A., Cook, A. L., Hair, J. W., Seaman, S. T., Scola, S., Harper, D. B., Smith, J. A., Fenn, M. A., Ferrare, R. A., Saide, P. E., Chemyakin, E. V., and Müller, D.: Calibration of a high spectral resolution lidar using a Michelson interferometer, with data examples from ORACLES, Appl. Optics, 57, 6061–6075, https://doi.org/10.1364/AO.57.006061, 2018.
Cairns, B., Russell, E. E., and Travis, L. D.: Research Scanning Polarimeter: calibration and ground-based measurements, Proc. SPIE 3754, Polarization: Measurement, Analysis, and Remote Sensing II, Denver, CO, USA, https://doi.org/10.1117/12.366329, 1999.
Cames, M., Graichen, J., Siemons, A., and Cook, V.: Emission Reduction Targets for International Aviation and Shipping, European Parliament – Policy Department A: Economic and Scientific Policy, https://www.europarl.europa.eu/RegData/etudes/STUD/2015/569964/IPOL_STU(2015)569964_EN.pdf (last access: 2 August 2023), 2015.
Capaldo, P., Kasibhatla, P., and Pandis, S.: Is aerosol production within the remote marine boundary layer sufficient to maintain observed concentrations?, J. Geophys. Res., 104, 3483–3500, 1999.
Chang, C.-P., Wang, Z., McBride, J., and Liu, C.-H.: Annual cycle of Southeast Asia-Maritime Continent rainfall and asymmetric monsoon transition, J. Climate, 18, 287–301, 2005.
Coggon, M. M., Sorooshian, A., Wang, Z., Metcalf, A. R., Frossard, A. A., Lin, J. J., Craven, J. S., Nenes, A., Jonsson, H. H., Russell, L. M., Flagan, R. C., and Seinfeld, J. H.: Ship impacts on the marine atmosphere: insights into the contribution of shipping emissions to the properties of marine aerosol and clouds, Atmos. Chem. Phys., 12, 8439–8458, https://doi.org/10.5194/acp-12-8439-2012, 2012.
Corbett, J. and Fischbeck, P.: Emissions from ships, Science, 278, 823–824, 1997.
Crosbie, E., Ziemba, L. D., Shook, M. A., Robinson, C. E., Winstead, E. L., Thornhill, K. L., Braun, R. A., MacDonald, A. B., Stahl, C., Sorooshian, A., van den Heever, S. C., DiGangi, J. P., Diskin, G. S., Woods, S., Bañaga, P., Brown, M. D., Gallo, F., Hilario, M. R. A., Jordan, C. E., Leung, G. R., Moore, R. H., Sanchez, K. J., Shingler, T. J., and Wiggins, E. B.: Measurement report: Closure analysis of aerosol–cloud composition in tropical maritime warm convection, Atmos. Chem. Phys., 22, 13269–13302, https://doi.org/10.5194/acp-22-13269-2022, 2022.
Crutzen, P. J. and Andreae, M. O.: Biomass Burning in the Tropics: Impact on Atmospheric Chemistry and Biogeochemical Cycles, Science, 250, 1669–1678, https://doi.org/10.1126/science.250.4988.1669, 1990.
DeCarlo, P. F., Kimmel, R. J., Trimborn, A., Northway, J. M., Jayne, T. J., Aiken, C. A., Gonin, M., Fuhrer, K., Horvath, T., Docherty, S. K., Worsnop, D., and Jimenez Palacios, J.: Field-Deployable, High-Resolution, Time-of-Flight Aerosol Mass Spectrometer, Anal. Chem., 78, 8281–8289, https://doi.org/10.1021/ac061249n, 2006.
Ding, K., Huang, X., Ding, A., Wang, M., Su, H., Kerminen, V. M., Petäjä, T., Tan, Z., Wang, Z., Zhou, D., and Sun, J.: Aerosol-boundary-layer-monsoon interactions amplify semi-direct effect of biomass smoke on low cloud formation in Southeast Asia, Nat. Commun., 12, 1–9, 2021.
Draxler, R. R. and Hess, G. D.: An overview of the HYSPLIT_4 modeling system of trajectories, dispersion, and deposition, Aust. Meteor. Mag., 47, 295–308, 1998.
Durkee, P. A., Noone, K. J., Ferek, R. J., Johnson, D. W., Taylor, J. P., Garrett, T. J., Hobbs, P. V., Hudson, J. G., Bretherton, C. S., Innis, G., Frick, G. M., Hoppel, W. A., O'Dowd, C. D., Russell, L. M., Gasparovic, R., Nielsen, K. E., Tessmer, S. A., Öström, E., Osborne, S. R., Flagan, R. C., Seinfeld, J. H., and Rand, H.: The Impact of Ship-ProducedAerosols on the Microstructure and Albedo of Warm Marine Stratocumulus Clouds: A Test of MAST Hypotheses 1i and 1ii, J. Atmos. Sci., 57, 16, 2554–2569, 2000.
Eyring, V., Köhler, H., van Aardenne, J., and Lauer, A.: Emissions from international shipping: 1. The last 50 years, J. Geophys. Res., 110, D17305, https://doi.org/10.1029/2004JD005619, 2005.
Fu, D., Di Girolamo, L., Rauber, R. M., McFarquhar, G. M., Nesbitt, S. W., Loveridge, J., Hong, Y., van Diedenhoven, B., Cairns, B., Alexandrov, M. D., Lawson, P., Woods, S., Tanelli, S., Schmidt, S., Hostetler, C., and Scarino, A. J.: An evaluation of the liquid cloud droplet effective radius derived from MODIS, airborne remote sensing, and in situ measurements from CAMP2Ex, Atmos. Chem. Phys., 22, 8259–8285, https://doi.org/10.5194/acp-22-8259-2022, 2022.
Gryspeerdt, E., Smith, T., O'Keeffe, E., Christensen, M., and Goldsworth, F.: The impact of ship emission controls recorded by cloud properties, Geophys. Res. Lett., 46, 12547–12555, 2019.
Hallett, J., Hudson, G. J., and Rogers, F. C.: Characterization of combustion aerosols for haze and cloud formation, J. Aerosol Sci. Tech., 10, 70–83, 1989.
Hersbach, H., Bell, B., Berrisford, P., Hirahara, S., Horányi, A., Muñoz-Sabater, J., Nicolas, J., Peubey, C., Radu, R., Schepers, D., Simmons, A., Soci, C., Abdalla, S., Abellan, X., Balsamo, G., Bechtold, P., Biavati, G., Bidlot, J., Bonavita, M., De Chiara, G., Dahlgren, P., Dee, D., Diamantakis, M., Dragani, R., Flemming, J., Forbes, R., Fuentes, M., Geer, A., Haimberger, L., Healy, S., Hogan, R. J., Hólm, E., Janisková, M., Keeley, S., Laloyaux, P., Lopez, P., Lupu, C., Radnoti, G., de Rosnay, P., Rozum, I., Vamborg, F., Villaume, S., and Thépaut, J.-N.: The ERA5 Global Reanalysis, Q. J. Roy. Meteor. Soc., 146, 1999–2049, https://doi.org/10.1002/qj.3803, 2022 (data available at: https://cds.climate.copernicus.eu/cdsapp#!/dataset/reanalysis-era5-complete?tab=form, last access: 4 April 2022).
Heymsfield, A. and McFarquhar, G.: Microphysics of INDOEX clean and polluted trade cumulus clouds, J. Geophys. Res.-Atmos., 106, 28653–28673, https://doi.org/10.1029/2000JD900776, 2001.
Hilario, M. R. A., Cruz, M. T., Cambaliza, M. O. L., Reid, J. S., Xian, P., Simpas, J. B., Lagrosas, N. D., Uy, S. N. Y., Cliff, S., and Zhao, Y.: Investigating size-segregated sources of elemental composition of particulate matter in the South China Sea during the 2011 Vasco cruise, Atmos. Chem. Phys., 20, 1255–1276, https://doi.org/10.5194/acp-20-1255-2020, 2020.
Hilario, M. R. A., Crosbie, E., Shook, M., Reid, J. S., Cambaliza, M. O. L., Simpas, J. B. B., Ziemba, L., DiGangi, J. P., Diskin, G. S., Nguyen, P., Turk, F. J., Winstead, E., Robinson, C. E., Wang, J., Zhang, J., Wang, Y., Yoon, S., Flynn, J., Alvarez, S. L., Behrangi, A., and Sorooshian, A.: Measurement report: Long-range transport patterns into the tropical northwest Pacific during the CAMP2Ex aircraft campaign: chemical composition, size distributions, and the impact of convection, Atmos. Chem. Phys., 21, 3777–3802, https://doi.org/10.5194/acp-21-3777-2021, 2021.
Hobbs, P. V., Garrett, T. J., Ferek, R. J., Strader, S. R., Hegg, D. A., Frick, G. M., Hoppel, W. A., Gasparovic, R. F., Russell, L. M., Johnson, D. W., O'Dowd, C., Durkee, P. A., Nielsen, K. E., and Innis, G.: Emissions from Ships with respect to Their Effects on Clouds, J. Atmos. Sci., 57, 2570–2590, 2000.
Hong, Y. and Di Girolamo, L.: Cloud phase characteristics over Southeast Asia from A-Train satellite observations, Atmos. Chem. Phys., 20, 8267–8291, https://doi.org/10.5194/acp-20-8267-2020, 2020.
Howell, S. G., Clarke, A. D., Freitag, S., McNaughton, C. S., Kapustin, V., Brekovskikh, V., Jimenez, J.-L., and Cubison, M. J.: An airborne assessment of atmospheric particulate emissions from the processing of Athabasca oil sands, Atmos. Chem. Phys., 14, 5073–5087, https://doi.org/10.5194/acp-14-5073-2014, 2014.
Hudson, J. G. and Yum, S. S.: Cloud condensation nuclei spectra and polluted and clean clouds over the Indian Ocean, J. Geophys. Res., 107, 8022, https://doi.org/10.1029/2001JD000829, 2002.
Hudson, J. G. and Noble, S.: CCN and cloud droplet concentrations at a remote ocean site, Geophys. Res. Lett., 36, L13812, https://doi.org/10.1029/2009GL038465, 2014.
Hudson, J. G., Garrett, T. J., Hobbs, P. V., Strader, S. R., Xie, Y. X., and Yum, S. S.: Cloud condensation nuclei and ship track clouds, J. Atmos. Sci., 57, 2696–2706, 2000.
Hudson, J. G., Noble, S., Jha, V., and Mishra, S.: Correlations of small cumuli droplet and drizzle drop concentrations with cloud condensation nuclei concentrations, J. Geophys. Res., 114, D05201, https://doi.org/10.1029/2008JD010581, 2009.
Huebert, B. J., Bates, T., Russell, P. B., Shi, G., Kim, Y. J., Kawamura, K., Carmichael, G., and Nakajima, T.: An overview of ACE-Asia: Strategies for quantifying the relationships between Asian aerosols and their climatic impacts, J. Geophys. Res., 108, 8633, https://doi.org/10.1029/2003JD003550, 2003.
IPCC, 2021: Climate Change 2021: The Physical Science Basis. Contribution of Working Group I to the Sixth Assessment Report of the Intergovernmental Panel on Climate Change, edited by: Masson-Delmotte, V., Zhai, P., Pirani, A., Connors, S. L., Péan, C., Berger, S., Caud, N., Chen, Y., Goldfarb, L., Gomis, M. I., Huang, M., Leitzell, K., Lonnoy, E., Matthews, J. B. R., Maycock, T. K., Waterfield, T., Yelekçi, O., Yu, R., and Zhou, B., Cambridge University Press, Cambridge, United Kingdom and New York, NY, USA, in press, https://doi.org/10.1017/9781009157896, 2021.
Jayne, J., Leard, D., Zhang, X., Davidovits, P., Smith, K., Kolb, C., and Worsnop, D.: Development of an Aerosol Mass Spectrometer for Size and Composition Analysis of Submicron Particles, Aerosol Sci. Tech., 33, 49–70, https://doi.org/10.1080/027868200410840, 2000.
Juwono, A. M., Johnson, G. R., Mazaheri, M., Morawska, L., Roux, F., and Kitchen, B.: Investigation of the airborne submicrometer particles emitted by dredging vessels using a plume capture method, Atmos. Environ., 73, 112–123, https://doi.org/10.1016/j.atmosenv.2013.03.024, 2013.
Kacarab, M., Thornhill, K. L., Dobracki, A., Howell, S. G., O'Brien, J. R., Freitag, S., Poellot, M. R., Wood, R., Zuidema, P., Redemann, J., and Nenes, A.: Biomass burning aerosol as a modulator of the droplet number in the southeast Atlantic region, Atmos. Chem. Phys., 20, 3029–3040, https://doi.org/10.5194/acp-20-3029-2020, 2020.
Kecorius, S., Madueno, L., Vallar, E., Alas, H., Betito, G., Birmili, W., Cambaliza, M. O., Catipay, G., Gonzaga-Cayetano, M., Galvez, M. C., Lorenzo, G., Muller, T., Simpas, J. B., Tamayo, E. G., and Wiedensohler, A.: Aerosol particle mixing state, refractory particle number size distributions and emission factors in a polluted urban environment: Case study of Metro Manila, Philippines, Atmos. Environ., 170, 169–183, https://doi.org/10.1016/j.atmosenv.2017.09.037, 2017.
Lenschow, D. H.: Aircraft measurements in the boundary layer, in: Probing the Atmospheric Boundary Layer, edited by: Lenschow, D. H., Amer. Meteor. Soc., 39–55, https://doi.org/10.1007/978-1-944970-14-7_5, 1986.
Li, Z., Li, C., Hualan, C., Tsay, S.-C, Holben, B., Huang, J., Li, B., Maring, H., Qian, Y., Shi, G., Xia, X., and Yin, Y.: East Asian Studies of Tropospheric Aerosols and their Impact on Regional Climate (EAST-AIRC): An overview, J. Geophys. Res., 116, 13026–13054, https://doi.org/10.1029/2010JD015257, 2011.
Li, Z., Lau, W. K.-M., Ramanathan, V., Wu, G., Ding, Y., Manoj, M. G., Liu, J., Qian, Y., Li, J., Zhou, T., Fan, J., Rosenfeld, D., Ming, Y., Wang, Y., Huang, J., Wang, B., Xu, X., Lee, S.-S., Cribb, M., Zhang, F., Yang, X., Zhao, C., Takemura, T., Wang, K., Xia, X., Yin, Y., Zhang, H., Guo, J., Zhai, P. M., Sugimoto, N., Babu, S. S., and Brasseur, G. P.: Aerosol and monsoon climate interactions over Asia, Rev. Geophys., 54, 866–929, https://doi.org/10.1002/2015RG000500, 2016.
Lin, N.-H., Sayer, A., Wang, S., Loftus, A., Hsiao, T., Sheu, G., Hsu, N., Tsay, S., and Chantara, S.: Interactions between biomass-burning aerosols and clouds over Southeast Asia: current status, challenges, and perspectives, Environ. Pollut., 195, 292–307, 2014.
Lv, Z., Liu, H., Ying, Q., Fu, M., Meng, Z., Wang, Y., Wei, W., Gong, H., and He, K.: Impacts of shipping emissions on PM2.5 pollution in China, Atmos. Chem. Phys., 18, 15811–15824, https://doi.org/10.5194/acp-18-15811-2018, 2018.
Mallet, M., Nabat, P., Johnson, B., Michou, M., Haywood, J. M., Chen, C., and Dubovik, O.: Climate models generally underrepresent the warming by Central Africa biomass-burning aerosols over the Southeast Atlantic, Sci. Adv., 7, EABG9998, https://doi.org/10.1126/sciadv.abg9998, 2021.
Manshausen, P., Watson-Parris, D., Christensen, M., Jalkanen, J., and Stier, P.: Invisible ship tracks show large cloud sensitivity to aerosol, Nature, 610, 101–106, https://doi.org/10.1038/s41586-022-05122-0, 2022.
Marmer, E. and Langmann, B.: Impact of ship emissions on the Mediterranean summertime pollution and climate: A regional model study, Atmos. Environ., 39, 4659–4669, 10.1016/j.atmosenv.2005.04.014, 2005.
Massoli, P., Onasch, T., Cappa, C., Nuamaan, I., Hakala, J., Hayden, K., Li, S., Sueper, D., Bates, T., Quinn, P., Jayne, J., and Worsnop, D.: Characterization of black carbon-containing particles from soot particle aerosol mass spectrometer measurements on the R/V Atlantis during CalNex 2010, J. Geophys. Res.-Atmos., 120, 2575–2593, https://doi.org/10.1002/2014JD022834, 2015.
McBride, J., Haylock, M., and Nicholls, N.: Relationships between the Maritime Continent Heat Source and the El Niño–Southern Oscillation Phenomenon, J. Climate, 16, 2905–2914, 2003.
McFarquhar, G. M., Platnick, S., Di Girolamo, L., Wang, H., Wind, G., and Zhao, G.: Trade wind cumuli statistics in clean and polluted air over the Indian Ocean from in situ and remote sensing measurements, Geophys. Res. Lett., 31, L21105, https://doi.org/10.1029/2004GL020412, 2004.
McNaughton, C., Clarke, A., Howell, S., Pinkerton, M., Anderson, B., Thornhill, L., Hudgins, C., Winstead, E., Dibb, J., Scheuer, E., and Maring, H.: Results from the DC-8 Inlet Characterization Experiment (DICE): Airborne Versus Surface Sampling of Mineral Dust and Sea Salt Aerosols, Aerosol Sci. Tech., 41, 136–159, https://doi.org/10.1080/02786820601118406, 2007.
Moteki, N. and Kondo, Y.: Effects of mixing state on black carbon measurements by laser-induced incandescence, Aerosol Sci. Tech., 41, 398–417, https://doi.org/10.1080/02786820701199728, 2007.
Miller, R. M., Levy S., Rilloraza, M., Di Girolamo, L., and Rauber, R. M.: Influence of natural and anthropogenic aerosol on cloud base droplet size distributions in clouds over the South China Sea and Western Pacific, TIB-AV PORTAL [video], https://doi.org/10.5446/62465, 2023.
Nakajima, T., Yoon, S., Ramanathan, V., Shi, G., Takemura, T., Higurashi, A., Takamura, T., Aoki, K., Sohn, B., Kim, S., Tsuruta, H., Sugimoto, N., Shimizu, A., Tanimoto, H., Sawa, Y., Lin, N., Lee, C., Goto, D., and Schutgens, N.: Overview of the Atmospheric Brown Cloud East Asian Regional Experiment 2005 and a study of the aerosol direct radiative forcing in east Asia, J. Geophys. Res.-Atmos, 112, D24S91, https://doi.org/10.1029/2007JD009009, 2007.
NASA-Langley: CAMP2EX_PISTON, CAMP2EX-PISTON archive [data set], https://www-air.larc.nasa.gov/cgi-bin/ArcView/camp2ex, last access: 15 April 2022.
Penner, J., Dickinson, R., and O'Neill, C.: Effects of Aerosol from Biomass Burning on the Global Radiation Budget, Science, 256, 1432–1434, 1992.
Petzold, A., Hasselbach, J., Lauer, P., Baumann, R., Franke, K., Gurk, C., Schlager, H., and Weingartner, E.: Experimental studies on particle emissions from cruising ship, their characteristic properties, transformation and atmospheric lifetime in the marine boundary layer, Atmos. Chem. Phys., 8, 2387–2403, https://doi.org/10.5194/acp-8-2387-2008, 2008.
Radke, L. F., Coakley Jr, J. A., and King, M. D.: Direct and remote sensing observations of the effects of ships on clouds, Science, 246, 1146–1149, 1989.
Ramanathan, V., Crutzen, P. J., Mitra, A. P., and Sikka, D.: The Indian Ocean Experiment and the Asian Brown Cloud, Current Sci., 83, 947–955, 2002.
Ramanathan, V., Chung, C., Kim, D., Bettge, T., Buja, L., Kiehl, J., Washington, W. M., Fu, Q., Sikka, D., and Wild, M.: Atmospheric brown clouds: Impacts on South Asian climate and hydrological cycle, P. Natl. Acad. Sci. USA, 102, 5326–5333, 2005.
Rasmusson, E. and Wallace, J.: Meteorological aspects of the El Niño/Southern Oscillation, Science, 222, 1195–1202, 1983.
Reid, J. S., Hyer, E. J., Johnson, R. S., Holben, B. N., Yokelson, R. J., Zhang, J., Campbell, J. R., Christopher, S. A., Di Girolamo, L., Giglio, L., Holz, R. E., Kearney, C., Miettinen, J., Reid, E. A., Turk, F. J., Wang, J., Xian, P., Zhao, G., Balasubramanian, R., Chew, B. N., Janjai, S., Lagrosas, N., Lestari, P., Lin, N.-H., Mahmud, M., Nguyen, A. X., Norris, B., Oanh, N. T. K., Oo, M., Salinas, S. V., Welton, E. J., and Liew, S. C.: Observing and understanding the Southeast Asian aerosol system by remote sensing: An initial review and analysis for the Seven Southeast Asian Studies (7SEAS) program, Atmos. Res., 122, 403–468, https://doi.org/10.1016/j.atmosres.2012.06.005, 2013.
Reid, J. S., Lagrosas, N. D., Jonsson, H. H., Reid, E. A., Sessions, W. R., Simpas, J. B., Uy, S. N., Boyd, T. J., Atwood, S. A., Blake, D. R., Campbell, J. R., Cliff, S. S., Holben, B. N., Holz, R. E., Hyer, E. J., Lynch, P., Meinardi, S., Posselt, D. J., Richardson, K. A., Salinas, S. V., Smirnov, A., Wang, Q., Yu, L., and Zhang, J.: Observations of the temporal variability in aerosol properties and their relationships to meteorology in the summer monsoonal South China Sea/East Sea: the scale-dependent role of monsoonal flows, the Madden–Julian Oscillation, tropical cyclones, squall lines and cold pools, Atmos. Chem. Phys., 15, 1745–1768, https://doi.org/10.5194/acp-15-1745-2015, 2015.
Reid, J. S., Xian, P., Holben, B. N., Hyer, E. J., Reid, E. A., Salinas, S. V., Zhang, J., Campbell, J. R., Chew, B. N., Holz, R. E., Kuciauskas, A. P., Lagrosas, N., Posselt, D. J., Sampson, C. R., Walker, A. L., Welton, E. J., and Zhang, C.: Aerosol meteorology of the Maritime Continent for the 2012 7SEAS southwest monsoon intensive study – Part 1: regional-scale phenomena, Atmos. Chem. Phys., 16, 14041–14056, https://doi.org/10.5194/acp-16-14041-2016, 2016.
Rosenfeld, D., Lohmann, U., Raga, G., O'Dowd, C., Kulmala, M., Fuzzi, S., Reissell, A., and Andreae, M.: Flood or drought: how do aerosols affect precipitation?, Science, 321, 1309–1313. https://doi.org/10.1126/science.1160606, 2008.
Russell, L. M., Sorooshian, A., Seinfeld, J., Albrecht, B., Nenes, A., Ahlm, L., and Wonaschütz, A.: Eastern Pacific Emitted Aerosol Cloud Experiment, B. Am. Meteorol. Soc., 94, 709–729, 2013.
Sawamura, P., Moore, R. H., Burton, S. P., Chemyakin, E., Müller, D., Kolgotin, A., Ferrare, R. A., Hostetler, C. A., Ziemba, L. D., Beyersdorf, A. J., and Anderson, B. E.: HSRL-2 aerosol optical measurements and microphysical retrievals vs. airborne in situ measurements during DISCOVER-AQ 2013: an intercomparison study, Atmos. Chem. Phys., 17, 7229–7243, https://doi.org/10.5194/acp-17-7229-2017, 2017.
Schafer, R., May, P., Keenan, T., McGuffie, K., Ecklund, W., Johnson, P., and Gage, K.: Boundary layer development over a tropical island during the Maritime Continent thunderstorm experiment, J. Atmos. Sci., 58, 2163–2179, 2001.
Schwarz, J., Gao, R., Fahey, D., Thomson, D., Watts, L., Wilson, J., Reeves, J., Baumgardner, D., Kok, G., Chung, S., Schulz, M., Hendricks, J., Lauer, A., Kärcher, B., Slowik, J., Rosenlof, K., Thompson, T., Langford, A., Loewenstein, M., and Aikin, K.: Single-particle Measurements of Mid Latitude Black Carbon and Light-Scattering Aerosols from the Boundary Layer to the Lower Stratosphere, J. Geophys. Res., 111, D16207, https://doi.org/10.1029/2006JD007076, 2006.
Shank, L. M., Howell, S., Clarke, A. D., Freitag, S., Brekhovskikh, V., Kapustin, V., McNaughton, C., Campos, T., and Wood, R.: Organic matter and non-refractory aerosol over the remote Southeast Pacific: oceanic and combustion sources, Atmos. Chem. Phys., 12, 557–576, https://doi.org/10.5194/acp-12-557-2012, 2012.
Stein, A., Draxler, R., Rolph, G., Stunder, B., Cohen, M., and Ngan, F.: NOAA's HYSPLIT Atmospheric Transport and Dispersion Modeling System, B. Am. Meteorol. Soc., 96, 2059–2077, https://doi.org/10.1175/BAMS-D-14-00110.1, 2015.
Stevens, B. and Feingold, G.: Untangling aerosol effects on clouds and precipitation in a buffered system, Nature, 461, 607–613, 2009.
Thornhill, K. L., Anderson, B. E., Barrick, J. D. W., Bagwell, D. R., Friesen, R., and Lenschow, D. H.: Air motion intercomparison flights during Transport and Chemical Evolution in the Pacific (TRACE-P)/ACE-ASIA, J. Geophys. Res., 108, 9001, https://doi.org/10.1029/2002JD003108, 2003.
Toll, V., Christensen, M., Quaas, J., and Bellouin, N.: Weak average liquid-cloud-water response to anthropogenic aerosols, Nature, 572, 51–55, 2019.
Twohy, C. H., Hudson, G. J., Yum, S. S., Anderson, R. J., Durlak, K. S., and Baumgardner, D.: Characteristics of cloud nucleating aerosols in the Indian Ocean region, J. Geophys. Res., 106, 28699–28710, 2001.
Twomey, S.: Pollution and the planetary albedo, Atmos. Environ., 8, 1251–1256, 1974.
Twomey, S.: The Influence of Pollution on the Shortwave Albedo of Clouds, J. Atmos. Sci., 34, 1149-1152, 1977.
Wang, B., Huang, F., Wu, Z., Yang, J., Fu, X., and Kikuchi, K.: Multi-scale climate variability of the South China Sea monsoon: a review, Dynam. Atmos. Oceans, 47, 15–37, 2009.
Wang, C.: Impact of anthropogenic absorbing aerosols on clouds and precipitation, A review of recent progresses, Atmos. Res., 122, 237–249, https://doi.org/10.1016/j.atmosres.2012.11.005, 2013.
Wang, J., Ge, C., Yang, Z., Hyer, E. J., Reid, J. S., Chew, B.-N., Mahmud, M., Zhang, Y., and Zhang, M.: Mesoscale modeling of smoke transport over the Southeast Asian Maritime Continent: Interplay of sea breeze, trade wind, typhoon, and topography, Atmos. Res., 122, 486–503, https://doi.org/10.1016/j.atmosres.2012.05.009, 2013.
Xian, P., Reid, J. S., Atwood, S. A., Johnson, R. S., Hyer, E. J., Westphal, D. L., and Sessions, W.: Smoke aerosol transport patterns over the Maritime Continent, Atmos. Res., 122, 469–485, https://doi.org/10.1016/j.atmosres.2012.05.006, 2013.
Yasunaga, K., Kida, H., and Satomura, T.: The 600–750 hPa relative humidity minimum observed during PEM-Tropics B, Geophys. Res. Lett. 30, 2282, https://doi.org/10.1029/2003GL018739, 2003.
Yin, S.: Biomass burning spatiotemporal variations over South and Southeast Asia, Environ. Int., 145, 106153, https://doi.org/10.1016/j.envint.2020.106153, 2020.
Zhang, C., Mapes, B., and Soden, B.: Bimodality in tropical water vapor, Q. J. Roy. Meteor. Soc., 129, 2847–2866, 2003.
Zhang, R., Khalizov, F., Wang, L., Hsu, M., and Xu, W.: Nucleation and growth of nanoparticles in the atmosphere, Chem. Rev., 112, 1957–2011, 2012.
Zheng, B., Chevallier, F., Ciais, P., Broquet, G., Wang, Y., Lian, J., and Zhao, Y.: Observing carbon dioxide emissions over China's cities and industrial areas with the Orbiting Carbon Observatory-2, Atmos. Chem. Phys., 20, 8501–8510, https://doi.org/10.5194/acp-20-8501-2020, 2020.
Zuidema, P., Li, Z., Hill, R.J., Bariteau, L., Rilling, B., Fairall, C., Brewer, W., Albrecht, B., and Hare, J.: On trade wind cumulus cold pools, J. Atmos. Sci., 69, 258–280, 2012.