the Creative Commons Attribution 4.0 License.
the Creative Commons Attribution 4.0 License.
 | 19 Jan 2023
Hemispheric-wide climate response to regional COVID-19-related aerosol emission reductions: the prominent role of atmospheric circulation adjustments
Nora L. S. Fahrenbach
Massimo A. Bollasina
The national and global restrictions in response to the COVID-19 pandemic led to a sudden, albeit temporary, emission reduction of many greenhouse gases (GHGs) and anthropogenic aerosols, whose near-term climate impact were previously found to be negligible when focusing on global- and/or annual-mean scales. Our study aims to investigate the monthly scale coupled climate-and-circulation response to regional, COVID-19-related aerosol emission reductions, using the output from 10 Earth system models participating in the Covid model intercomparison project (CovidMIP). We focus on January–February and March–May 2020, which represent the seasons of largest emission changes in sulfate (SO2) and black carbon (BC). During January–February (JF), a marked decrease in aerosol emissions over eastern China, the main emission region, resulted in a lower aerosol burden, leading to an increase in surface downwelling radiation and ensuing surface warming. Regional sea-level pressure and circulation adjustments drive a precipitation increase over the Maritime Continent, embedded in a negative Pacific Decadal Oscillation (PDO)- and/or El Niño–Southern Oscillation (ENSO)-like response over the Pacific, in turn associated with a northwestward displacement and zonal shrinking of the Indo-Pacific Walker cell. Remote climate anomalies across the Northern Hemisphere, including a weakening of the Siberian High and Aleutian Low, as well as anomalous temperature patterns in the northern mid-latitudes, arise primarily as a result of stationary Rossby wave trains generated over East Asia. The anomalous climate pattern and driving dynamical mechanism reverse polarity between JF and MAM (March–May) 2020, which is shown to be consistent with an underlying shift of the dominant region of SO2 emission reduction from eastern China in JF to India in MAM. Our findings highlight the prominent role of large-scale dynamical adjustments in generating a hemispheric-wide aerosol climate imprint even on short timescales, which are largely consistent with longer-term (decadal) trends. Furthermore, our analysis shows the sensitivity of the climate response to the geographical location of the aerosol emission region, even after relatively small, but abrupt, emission changes. Scientific advances in understanding the climate impact of regional aerosol perturbations, especially the rapidly evolving emissions over China and India, are critically needed to reduce current uncertainties in near-future climate projections and to develop scientifically informed hazard mitigation and adaptation policies.
- Article
(11388 KB) - Full-text XML
-
Supplement
(24767 KB) - BibTeX
- EndNote


The emergence of the coronavirus disease-19 (COVID-19) was first identified in Wuhan, China, in December 2019, and COVID-19 was declared a global pandemic on 11 March 2020 by the World Health Organization (Sohrabi et al., 2020). Government-enforced measures to reduce the transmission and spread of COVID-19 included travel restrictions, home confinements (so-called lockdowns) and limitations of industrial activities. The first national lockdown alongside regulation of socio-economic activity occurred in China from late January 2020 onwards. Many nations implemented similar policies, for instance India from 25 March, and by April 2020 half of the global population was under home confinement (Sandford, 2020).
These regulations led to a sudden, albeit temporary, emission reduction of many greenhouse gases (GHGs) and anthropogenic aerosols (e.g. Forster et al., 2020b; Le Quéré et al., 2020; Gkatzelis et al., 2021). Global fossil CO2 emissions were estimated to have decreased by around 7 % (median estimate) in 2020 relative to 2019 based on sector activity data and energy statistics (Forster et al., 2020b; Friedlingstein et al., 2020; Le Quéré et al., 2020). This emission decline was mainly influenced by reduced emissions from transport and industry, while residential ones increased, albeit minimally (Forster et al., 2020b; Le Quéré et al., 2020). Nonetheless, the global concentration of atmospheric CO2 still increased in 2020 compared to previous years, with no COVID-19-induced concentration changes identifiable from satellite data due to small overall emission reductions in comparison to the larger signal from inter-annual variability (Chevallier et al., 2020).
The decline in traffic and industrial productivity also led to a marked regional decrease in emissions of aerosols and precursor gases (e.g. Gkatzelis et al., 2021), reducing air pollution and improving air quality in most regions of the world (Venter et al., 2020). When accounting for meteorological variability, median reductions of 13 %–46 % in nitrogen dioxide (NO2) concentrations and 10 %–33 % in particulate matter (PM) were observed alongside a marginal increase in ozone (O3) of 0 %–4 % (Gkatzelis et al., 2021). The change in aerosol burden led to a clear pattern of negative aerosol optical depth (AOD) anomalies across the Northern Hemisphere (NH), as found in observational (e.g. Gkatzelis et al., 2021; Fiedler et al., 2021) and modelling studies (e.g. Yang et al., 2020), despite the potential compounding influence of negative (long-term) regional trends in aerosol emissions and variability in natural aerosol emissions and meteorology (Diamond and Wood, 2020; Le et al., 2020; van Heerwaarden et al., 2021).
An abatement in aerosol emissions, such as that due to COVID-19 regulations, is expected to have impacts not only on atmospheric composition but also on weather and climate. Anthropogenic aerosols can influence the Earth's radiation budget directly by scattering and absorbing solar radiation (aerosol–radiation interactions; e.g. Boucher et al., 2013) and also indirectly by changing cloud microphysical properties and precipitation processes (aerosol–cloud interactions; Twomey, 1977 and Albrecht, 1989). The major anthropogenic-scattering and anthropogenic-absorbing aerosols and/or aerosol precursors are sulfur dioxide (SO2) and black carbon (BC), and these are known to exert a significant radiative forcing (RF) on climate (Szopa et al., 2021). The global circulation can also be markedly modulated by aerosols, extending their impact beyond the local emission region and promoting remote climate responses via the generation of Rossby waves (Ming et al., 2011; Wilcox et al., 2019). In particular, previous studies have linked aerosol-induced cooling to a southward shift of the intertropical convergence zone (ITCZ) (e.g. Ming and Ramaswamy, 2009), alteration of the strength and width of the Hadley cell circulation (e.g. Allen and Sherwood, 2011), fluctuations in the Pacific decadal oscillation (PDO) via modulation of the Aleutian Low (e.g. Dow et al., 2021), a weakening of the southern Asian summer monsoon (e.g. Bollasina et al., 2014) and changes in the El Niño–Southern Oscillation (ENSO) (e.g. Westervelt et al., 2018). Nonetheless, aerosol–climate interactions have been repeatedly identified as the largest source of uncertainty in estimates of the present-day anthropogenic RF (Szopa et al., 2021).
The near-term climate response to COVID-19-related aerosol and GHG emission reductions has been investigated by several studies using observational and modelling data (e.g. Forster et al., 2020b; Fiedler et al., 2021; Fyfe et al., 2021; Gettelman et al., 2021; Jones et al., 2021; Ming et al., 2021). Global-mean changes in effective RF were found to be small in 2020 (less than 0.2 W m−2 during the peak reductions in spring 2020) relative to ongoing trends (Szopa et al., 2021). Regional RF changes over East Asia, while unequivocal, were also found to be within the detection limit due to compounding effects of weather variability (Ming et al., 2021). Consistently with the small RF and accounting for large influences of internal variability, several Earth system model (ESM) studies concluded that COVID-19-induced annual-mean changes in regional and global surface temperature were small to negligible during 2020 and over the following years (Forster et al., 2020b; Gettelman et al., 2021; Jones et al., 2021). For instance, climate modelling results from Forster et al. (2020b) showed a small near-term global surface air warming due to decreased SO2 emissions, balanced by cooling from a NOx-driven atmospheric loss of O3. Gettelman et al. (2021), extending the results of Forster et al. (2020b), used two ESMs with prescribed sea surface temperatures (SSTs) and found that land surface temperature anomalies due to COVID-19-induced aerosol emission reductions peaked at around 0.3 ∘C at higher northern latitudes and 0.03 ∘C globally during spring 2020. Similarly, modelled effects on global precipitation between 2020–2024 were found to be minimal (e.g. Jones et al., 2021). Overall, these studies indicate that the simulated anomalies in temperature and precipitation were probably too small to be detected in observations due to meteorological variability (Fyfe et al., 2021). However, there is consensus on aerosols being the main drivers of these climate responses, dominating over other forcings like CO2 (e.g. Gettelman et al., 2021).
In order to facilitate the identification of even small COVID-19-induced climate signals in a consistent and multi-model setting, addressing some of the deficiencies of the studies mentioned above and without prescribing SSTs, the COVID-19 multi-ESM intercomparison project (CovidMIP) was proposed (Lamboll et al., 2021). The input data for aerosol and GHG emission changes were reconstructed from mobility data following the methodology from Forster et al. (2020b). Jones et al. (2021) presented the initial analysis of the CovidMIP simulations, focusing on the near-term climate changes (2020–2024). The models showed a reduction in AOD, especially over southern and East Asia, and a subsequent increase in downwelling shortwave radiation (SW) over parts of Asia. However, global near-term changes in precipitation and near-surface temperature were too minimal to be detected in the aggregated CovidMIP data. Hence, Jones et al. (2021) concluded that the duration and magnitude of the emission reductions were too short lived and small to affect annual-mean global climate noticeably.
Yet, given the strong interaction of aerosols with precipitation and atmospheric circulation (e.g. Samset et al., 2016; Liu et al., 2018; Wilcox et al., 2019; Xie et al., 2020; Williams et al., 2022), it is certainly plausible for COVID-19 aerosol variations to induce large-scale climate responses at short timescales (i.e. monthly) via rapid circulation adjustments, especially given the tropical location of the emission sources. These signals could be largely damped in annual and/or global means due to the partial cancellation of the anomalies by near-simultaneous emission changes in different regions or by compensating variations due to the spatial heterogeneity of the response. Previous studies demonstrated the sensitivity of the global climate response to the geographical location of the emission region (e.g. Liu et al., 2018; Persad and Caldeira, 2018; Westervelt et al., 2020). A sub-annual analysis will also better serve to elucidate the underlying physical mechanism and to identify links between emission changes and climate responses, especially as some emission regions (e.g. Asia) can instigate downstream hemispheric-wide responses (e.g. Wilcox et al., 2019). This study builds on the initial analysis by Jones et al. (2021) of the CovidMIP simulations, addressing the above issues and providing a mechanistic understanding of the impact of regional, COVID-19-induced aerosol emission changes. From this perspective, the analysis represents a test bed to investigate the aerosol-related climate imprint and dynamical mechanisms. We specifically focus on the super-fast response which we define as the climate response to emission changes at a monthly timescale and which is inclusive of feedback due to sea surface temperature (SST) changes. This super-fast response is distinct from the traditional fast response, which includes atmospheric-only changes (simulated by fixing SSTs) averaged over multiple years. Importantly, the analysis of the super-fast response is key to improve the understanding of the multifaceted and multiscale climate response patterns to aerosol forcing by bridging the gap with the more commonly studied, longer timescales (i.e. oceanic equilibrium response), as well as to realistically estimate climate anomalies due to strong but rapidly changing near-term aerosol emissions (e.g. Samset et al., 2019).
We analysed climate model simulations from the Covid model intercomparison project (CovidMIP; Lamboll et al., 2021), which is incorporated into the CMIP6-endorsed DAMIP (Detection and Attribution Model Intercomparison Project; Gillett et al., 2016). An in-depth description of the CovidMIP protocol is provided by Lamboll et al. (2021), and only the key points are summarised here.
The CovidMIP baseline scenario follows the Shared Socioeconomic Pathway 2-4.5 (SSP2-4.5, hereafter ssp245), the most middle-of-the-road future pathway in terms of political and economic changes (O'Neill et al., 2016). Here, we examined the two-year blip scenario (hereafter ssp245-covid), which branches from ssp245 on 1 January 2020 and is adjusted according to reconstructed country-specific trajectories up to and including June 2020. These changes in aerosol emissions and GHG concentrations were inferred from mobility data (Forster et al., 2020b) and supplementary confinement index analysis (Le Quéré et al., 2020). Emissions were then projected to continue at 66 % of the June 2020 value until the end of 2021, reverting to the baseline by the end of 2022 and equalling it thereafter. The difference between ssp45 and ssp245-covid thus represents the climate effect due to COVID-19 time-evolving emission reductions.
Table 1 contains details of the participating CovidMIP models and their respective spatial resolution, aerosol treatment and number of ensembles. Most of the models simulate aerosols interactively from primary and secondary emissions, with the exception of EC-Earth3 and MPI-ESM1-2-LR, which use prescribed aerosols based on the MACv-SP parameterisation (Fiedler et al., 2021). We examined multi-model ensemble mean (MEM) quantities across 10 of the 12 models, interpolated to a common horizontal longitude–latitude grid. Two models, CanESM5 and MIROC-ES2L, were excluded from the MEM due to their coarse resolution (Table 1), although a comparison showed consistency of the large-scale anomalies simulated by these two models with those of the MEM (not shown).
Table 1List of CovidMIP models and their main model characteristics. Table adapted from Jones et al. (2021). Note: n/a stands for applicable.
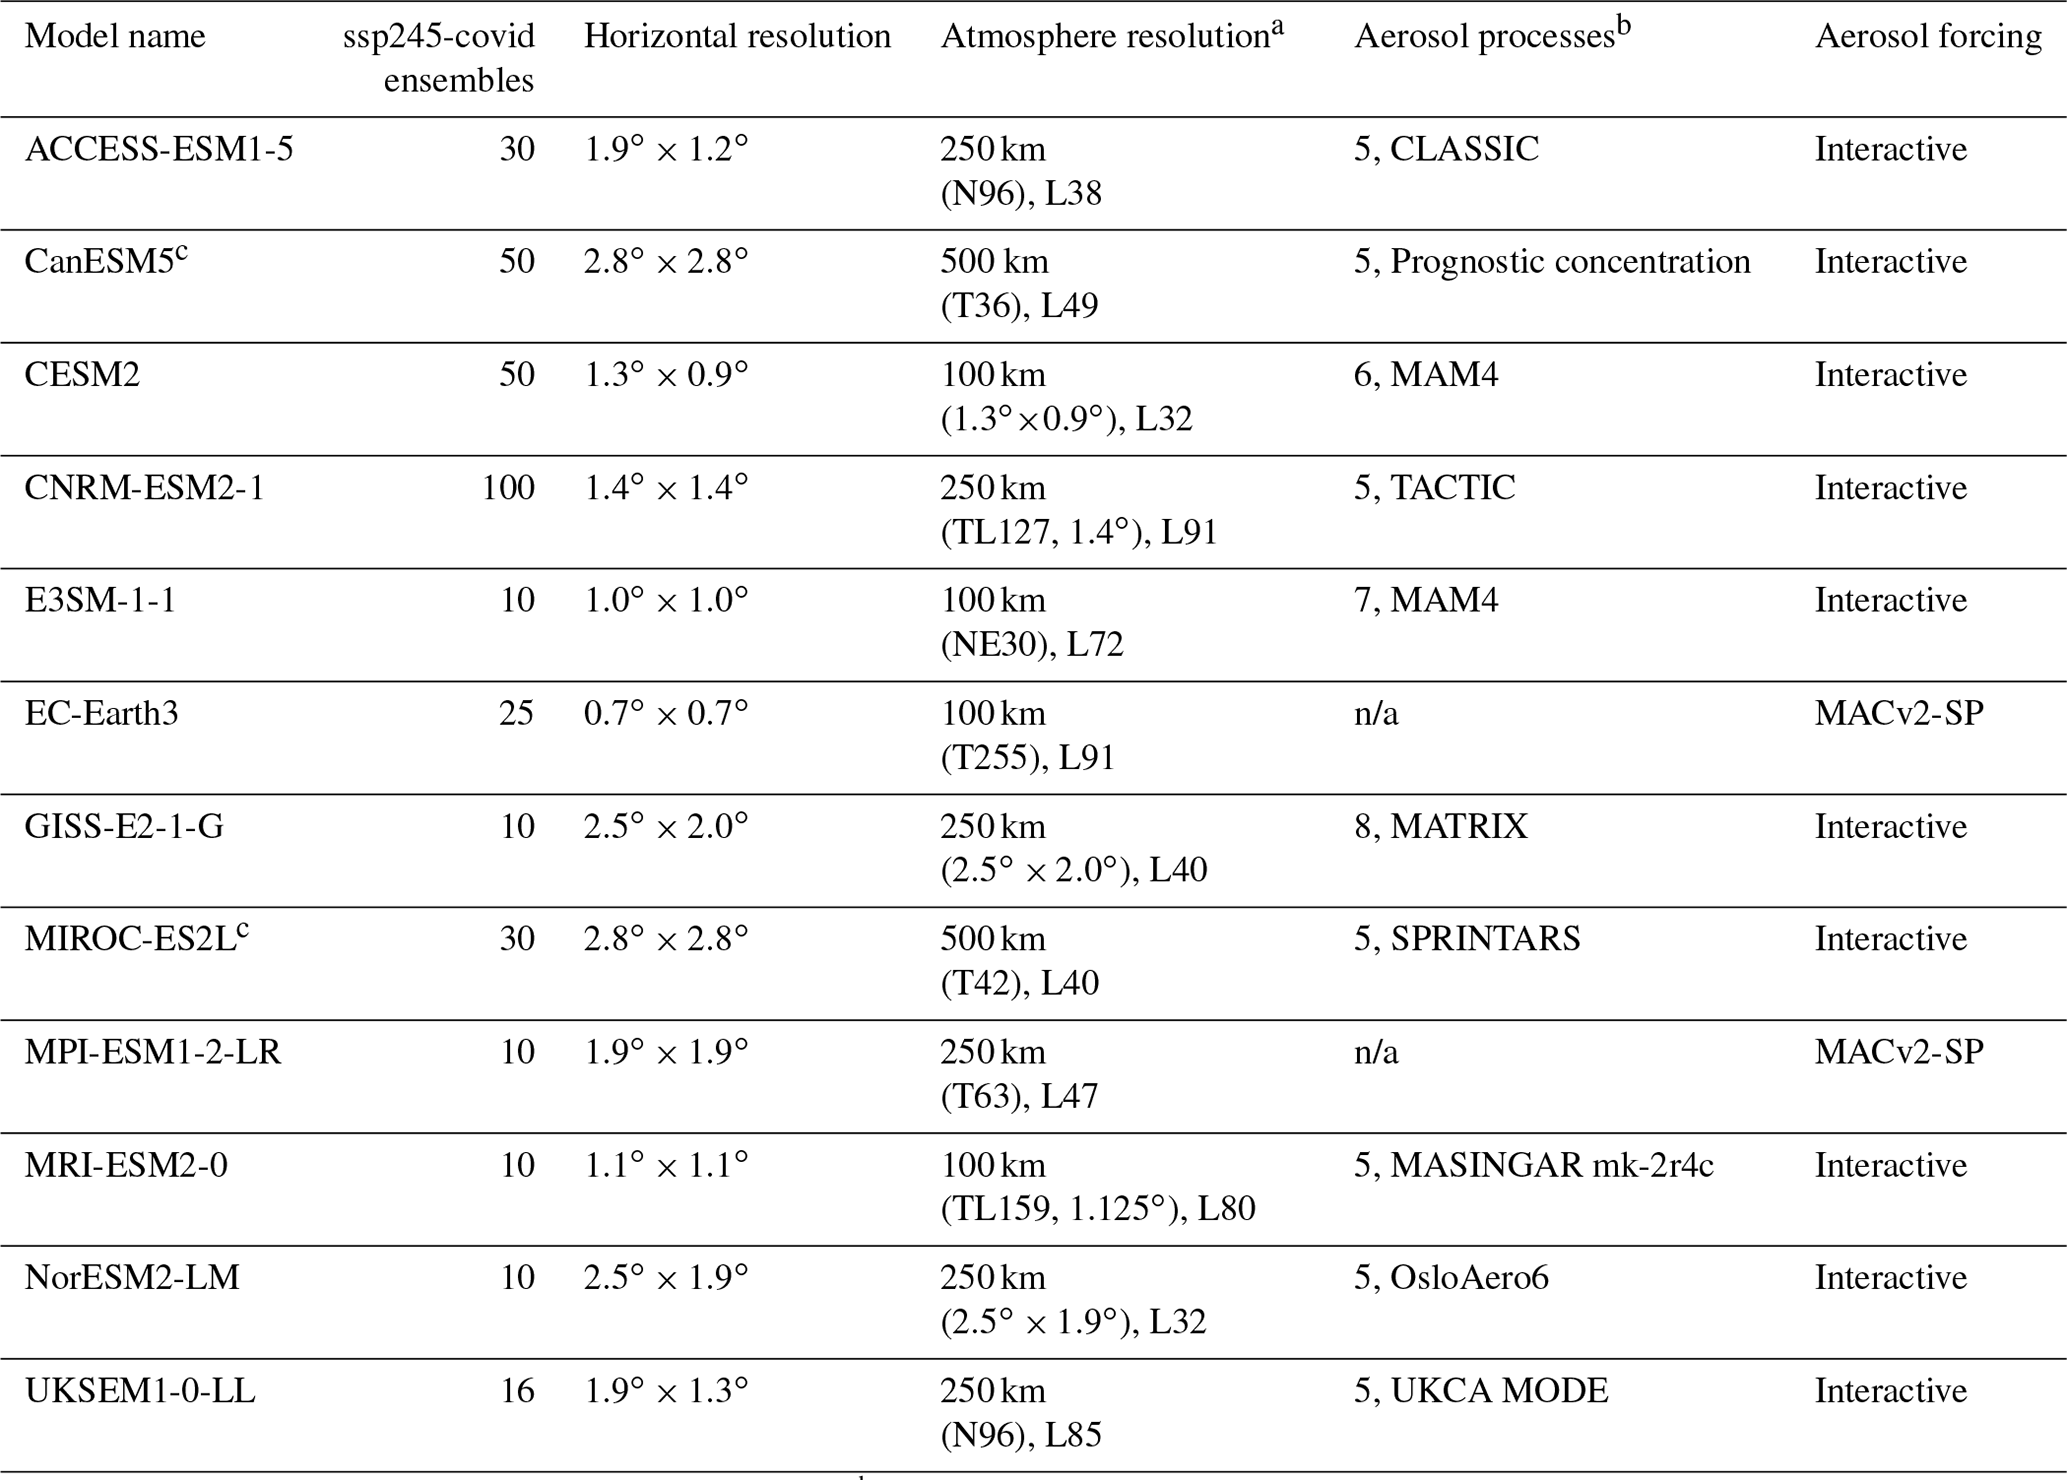
a CMIP “nominal resolution” in km, “L” denotes number of vertical levels. b Number of aerosol species and name or description of aerosol sub-models. c Models which were not included in this multi-model study due to their coarse resolution.
The main analysis focuses on MEM quantities averaged separately for January–February (JF) and March–May (MAM) 2020, which represent the periods of most significant aerosol emission reductions. In addition, daily MPI-ESM1-2-LR data were used to conduct a sub-monthly analysis of the generation of COVID-19-induced large-scale atmospheric circulation anomalies. Only three models (ACCESS-ESM1-5, EC-Earth3, MPI-ESM1-2-LR) provided output for daily wind fields, with the latter model showing the best agreement with the MEM (not shown).
A comparison between the ssp245-covid MEM and ERA5 reanalysis (Hersbach et al., 2020) shows that the models can accurately simulate the key features of the JFMAM 2020 climate (Figs. S1 and S2 in the Supplement), with high global spatial correlations and low root mean square errors compared to observations. This comparison is essential in order to exclude the possibility that the response to perturbed emissions is affected by significant model biases in representing the reference conditions. The robustness of the simulated climate anomalies was estimated by the agreement of the models on the sign of change. Regions where at least 70 % of the models (i.e. 7 out of 10) show anomalies of the same sign are stippled.
Simulations from PDRMIP (Precipitation Driver Response Model Intercomparison Project; Myhre et al., 2022) were also used to corroborate the analysis of the CovidMIP experiments and, in particular, the identification of the signal from Asian aerosol changes. While climate responses to the idealised step perturbations in PDRMIP will differ from the real-world transient changes, this set-up has the advantage that signals emerge more rapidly from internal variability for sufficiently large forcing. All PDRMIP models include direct sulfate and BC effects, as well as semi-direct BC effects. However, the complexity of simulated aerosol–cloud interactions varies across models, with only some models including these interactions or including only the first indirect effect (Table S1). Additionally, some models are emission-driven, while others use fixed aerosol concentrations.
We focused on PDRMIP experiments involving a 10-fold concentration and/or emission increase in sulfate (hereafter SULx10a) and BC (hereafter BCx10a) over Asia (10∘–50∘ N, 60∘–140∘ E) relative to the year 2000 baseline (six CMIP5 models; Table S1). In order to isolate the super-fast climate response to aerosol emission changes and to enable a direct comparison with CovidMIP results, we analysed MEM anomalies averaged over JF and MAM of the first year of the fully coupled atmosphere–ocean PDRMIP simulations. All model data are interpolated to a common longitude–latitude grid, and the robustness of the anomalies was evaluated as for CovidMIP data but using a 85 % robustness threshold (i.e. 5 out of 6 models).
3.1 Emission changes
The COVID-19 pandemic resulted in a significant decline of emissions from transportation and industry (Forster et al., 2020b) and an associated relative decrease in carbon dioxide (CO2) and methane (CH4) concentrations amounting to around −0.15 % by the end of 2020 compared to the baseline (Fig. S3). Nitrous oxide (N2O) emissions decreased only minimally, as changes in agricultural production, which is the main emission source, were modest (Elleby et al., 2020).
All aerosol and precursor emissions (BC, SO2, NOx, CO, OC, NH3 and NMVOCs) show a prominent abatement in 2020 over Asia and a peak in global reduction in April relative to the baseline (Fig. S4 shows monthly global changes in SO2). Although national emission reductions over the eastern USA and Europe reach a maximum of 5 % and 30 % in April 2020, respectively, these changes are around 1 order of magnitude smaller than those over Asia due to the lower baseline levels.
Emission changes in SO2, which alongside BC is the dominant aerosol species in the climatology, are characterised by a dipole pattern during the period January–May 2020 (Fig. 1a, b). During January and February, SO2 reductions are only located over eastern China (a maximum area-weighted decline of in February (Fig. 1e), equivalent to a 32 % reduction relative to the baseline), the first country to introduce regulations and to impose a national lockdown. In the following months, SO2 reductions are also seen over other countries. India in particular shows large decreases from March 2020 and, despite continued significant emission reduction over China, dominates the March–May worldwide changes (a maximum decrease of in April (Fig. 1e), equivalent to a 40 % reduction relative to the baseline). BC emission changes are similarly dominated by China in JF, with a gradual shift towards India in MAM (Fig. 1c, d), but are of 1 order of magnitude smaller than those for SO2.

Figure 1Changes in (a, b) SO2 and (c, d) BC emissions over East and South Asia during JF 2020 (a, c) and MAM 2020 (b, d). (e) Land-only, area-weighted changes in SO2 and BC (scaled by a factor of 10) emissions from East China (21–42∘ N, 102–125∘ E) and India (6–32∘ N, 70–87∘ E), as defined in (a)–(d). The JF and MAM 2020 periods used for later analysis are indicated by light- and dark-grey shading, respectively.
3.2 Near-surface climate response
Consistently with observations (Gkatzelis et al., 2021), a large decline in AOD at 550 nm is simulated over eastern China in JF (Fig. 2a) and over both eastern China and India in MAM (Fig. S5), which stands out compared to smaller AOD reductions over Europe and the USA.
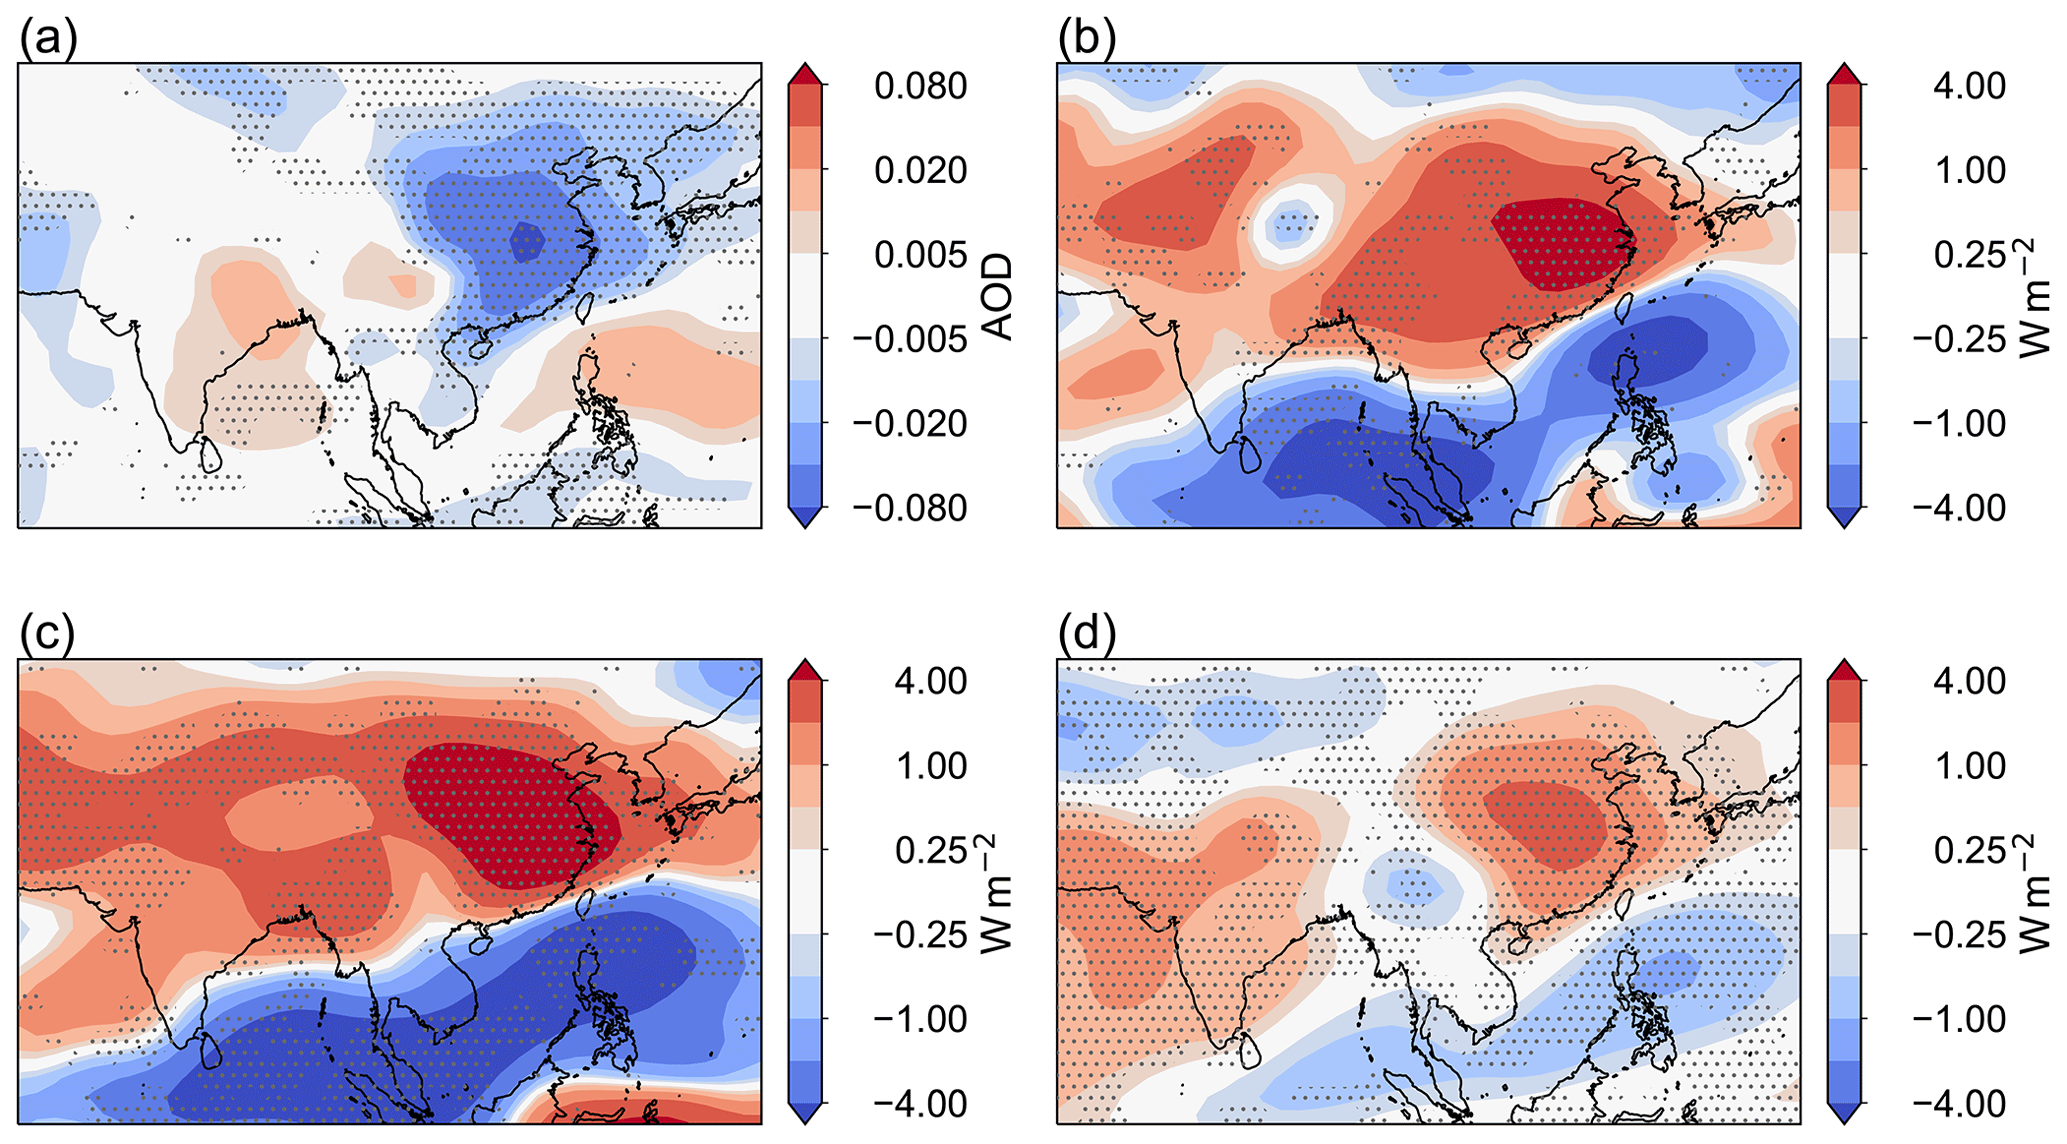
Figure 2Spatial patterns of MEM anomalies in (a) AOD at 550 nm, (b) all-sky net top-of-atmosphere (TOA) SW radiation, (c) all-sky surface downwelling SW radiation and (d) clear-sky surface downwelling SW radiation for JF 2020. Stippling indicates where at least 70 % of the models agree on the sign of change.
Decreased aerosol loading over eastern China during JF compared to the baseline experiment results in decreased net SW radiation at the top of the atmosphere (TOA) and surface (Fig. 2). TOA and surface anomalies are of comparable magnitude over China and can be as large as −10 W m−1, indicating the dominant role of scattering by sulfate aerosols. The differences between all-sky (i.e. including clouds) and clear-sky (i.e. without clouds) SW radiation anomalies represent the cloud SW radiative forcing and can be used to infer aerosol–cloud effects. Over the dominant aerosol source region, changes in cloud forcing between scenarios are evident, although not always large (Fig. 2c, d). It is possible that aerosol–cloud interactions play a role in this anomalous forcing. Changes in SW radiation and differences between all-sky and clear-sky SW anomalies are also seen outside of Asia (not shown). These are partially linked to changes in cloud cover which arise indirectly from Asian aerosol changes rather than from direct aerosol-induced cloud modification.
Lower aerosol loading compared to the reference experiment over eastern China leads to regional surface warming (Fig. 3a), consistent with enhanced surface radiation and brightening. Yet, aerosol-induced temperature anomalies extend over areas downstream of the aerosol source region despite negligible variations in aerosol emissions and loading there. Marked anomalous cooling extends from northern and eastern Eurasia across the whole Arctic Circle. Conversely, marked positive temperature anomalies are centred over the Middle East, stretching from southern Europe to northern Asia, as well as over northeastern Canada and across most of North America. A robust horseshoe-like warming pattern is present over the central Pacific, corresponding to a region of high all-sky but no clear-sky SW radiation and thus suggesting decreased scattering by clouds (not shown). Correspondingly, cold anomalies are found over the tropical Pacific, with a cold tongue extending over the south-equatorial central and eastern Pacific. The Pacific SST response is reminiscent of the anomalous pattern associated with La Niña and, at basin-wide scale, the negative phase of the PDO.
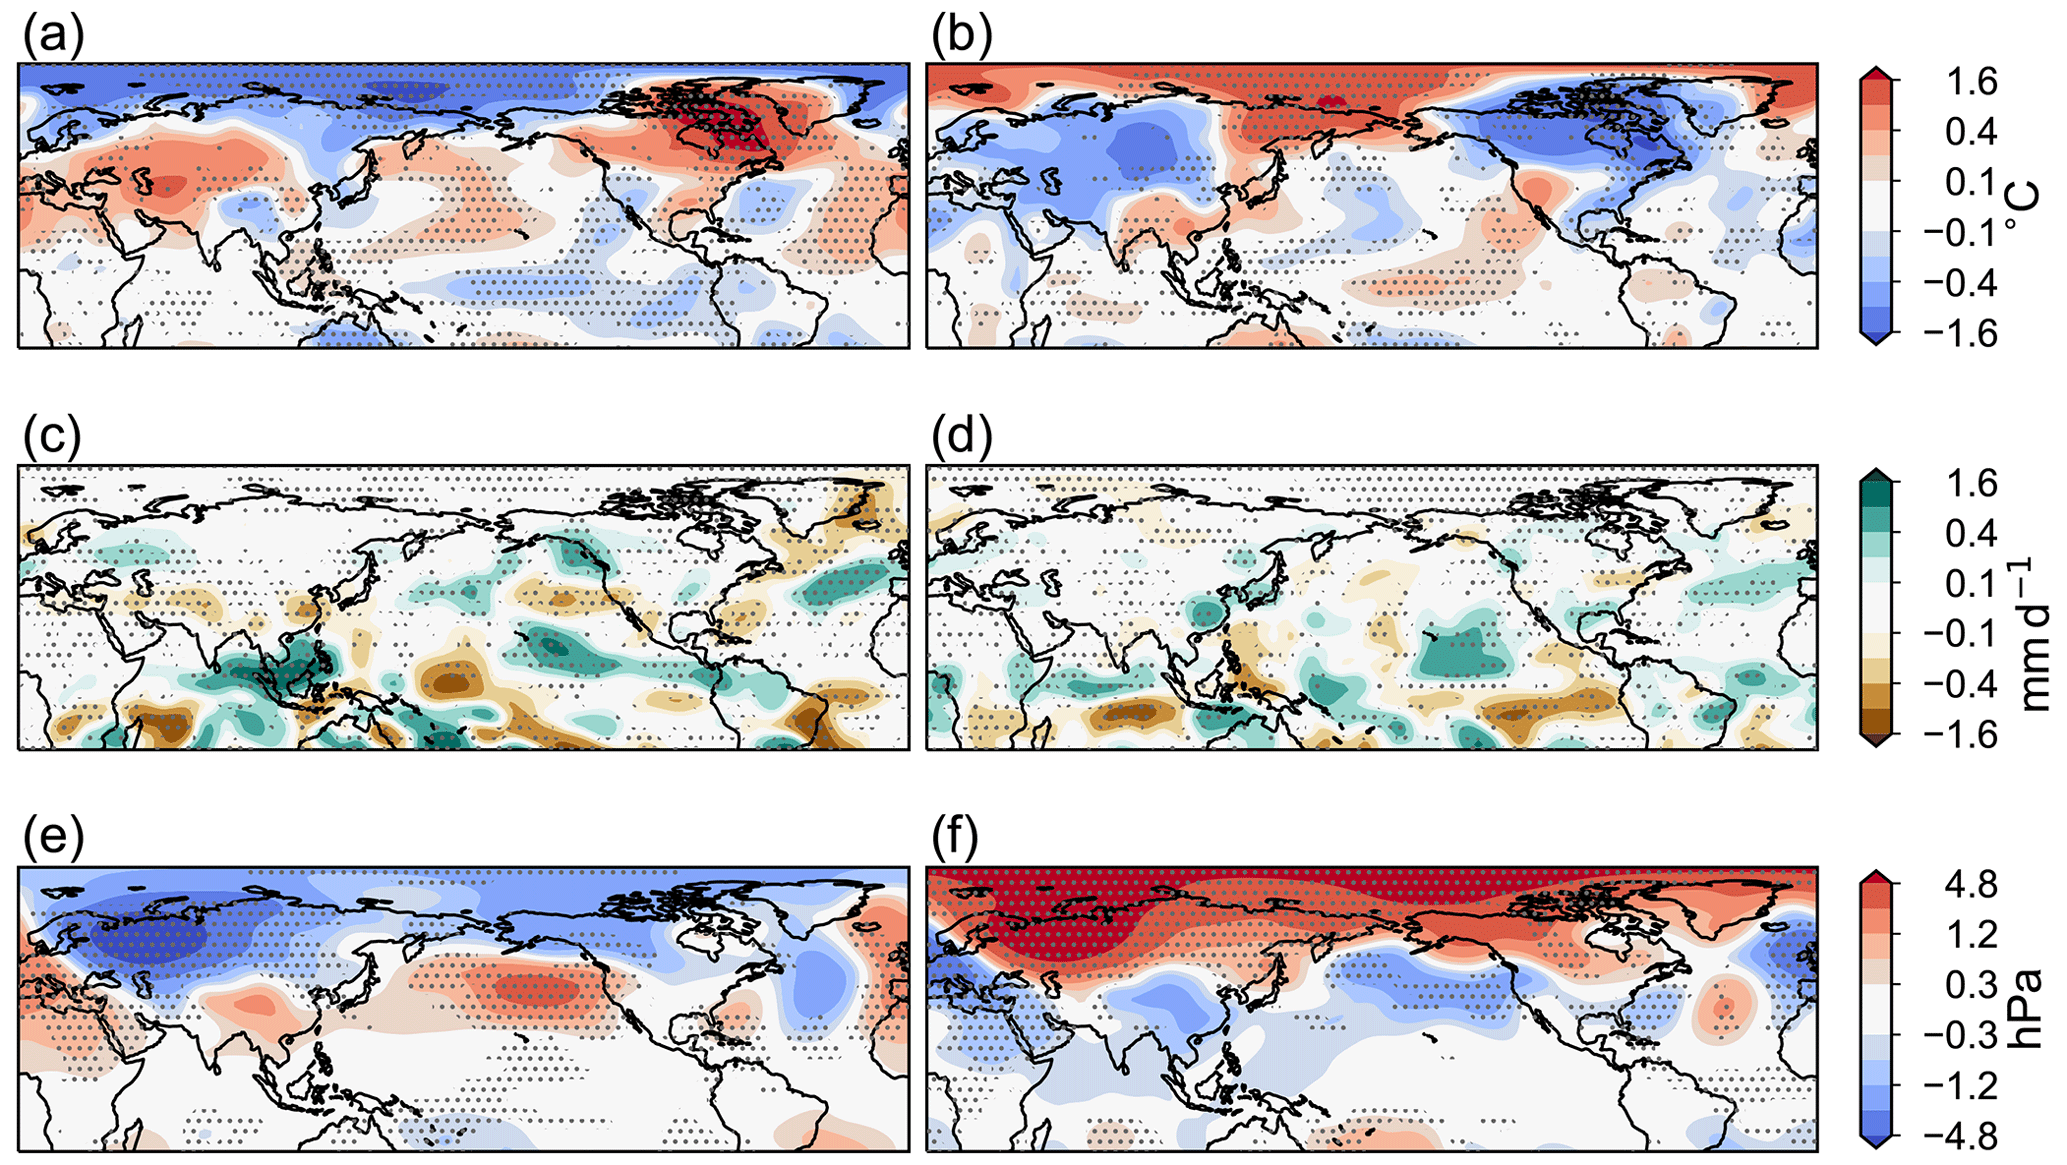
Figure 3Spatial patterns of MEM anomalies in (a, b) near-surface air temperature, (c, d) precipitation rate and (e, f) sea-level pressure during JF (a, c, e) and MAM 2020 (b, d, f). Subfigures (b) and (f) are shown as incremental changes (MAM minus JF). Stippling indicates where at least 70 % of the models agree on the sign of change.
The JF precipitation response shows the largest anomalies over the tropical oceans, particularly over the Indo-Pacific sector (Fig. 3c). In the zonal mean, this results in a minor drying south and wettening north of the Equator, indicating a northward shift of the ITCZ. Locally, most of eastern and southeastern Asia feature precipitation reduction, which is noteworthy despite its small magnitude given the modest climatological amounts. The drying is in stark contrast and forms a meridional dipole with the large, widespread wettening to the south, extending from the northeastern Indian Ocean across the NW Maritime Continent (MC) to the western Pacific. In turn, decreased precipitation is present to the southeast over the south-equatorial MC, suggesting a northwestern shift of rainfall, which climatologically features a winter equatorial maximum over the MC. The precipitation shift coincides with a prominent NW–SE dipole in the all-sky but not in the clear-sky SW radiation pattern (Fig. 2). The radiation anomalies are thus indicative of an increased cloud fraction in the NW, with an associated increase in precipitation and vice versa in the SE. Marked dry anomalies are also present over the southwestern Indian Ocean and over the central equatorial Pacific, which correspond to the zonal edges of the Indo-Pacific climatological rainfall maximum, suggesting its zonal shrinking (Fig. 3c). At a larger scale, the tropical Pacific precipitation anomalies show features consistent with the La-Niño-like response found in SSTs, including a drying over the cooler eastern equatorial Pacific, as well as wettening over northern Australia. In the extratropics, it is worth noting the intensification of precipitation along the Pacific storm tracks and an eastward shift and extension of the storm tracks over the Atlantic.
An anomalous meridional sea-level pressure dipole forms over East Asia (Fig. 3e), featuring an anticyclone over Southeast Asia and a low-pressure anomaly over northeastern China, which is consistent, albeit slightly northeastward shifted, with the regional anomalous surface warming due to decreased aerosol emissions. The latter induces a low-tropospheric westerly divergent flow which opposes the climatological northwesterlies over southern and eastern China, leading to the local drying mentioned above. The subsequent mass redistribution leads to an anomalous anticyclone over Southeast Asia, strengthening the meridional sea-level pressure gradient and ensuing low-tropospheric westerlies from the western Pacific to the eastern Indian Ocean along its southern flank. The enhanced moisture transport from the Pacific results in the anomalous wettening centred over the northern MC.
From a large-scale perspective, the anomalous cyclone over northeastern China is part of a widespread low centred over northern Eurasia, which acts to weaken the climatological Siberian High. In turn, negative hemispheric-wide sea-level pressure anomalies at high latitudes are suggestive of a strengthening of the Arctic Oscillation (AO). A large anticyclonic anomaly stretches across the North Pacific basin, weakening the climatological Aleutian Low and merging with the high-pressure anomaly over Southeast Asia. Sea-level pressure anomalies across the mid-latitudes reveal a coherent wave pattern, particularly evident from the central Pacific across the Atlantic to Europe, which will be discussed later in conjunction with the upper-tropospheric circulation anomalies. Interestingly, there is a noticeable broad-scale association between the extra-tropical sea-level pressure distribution and the pattern of temperature and precipitation anomalies, suggesting a strong dynamical control on surface climate. For example, the deep anomalous cyclonic circulation over Eurasia induces warm southerly temperature advection along its eastern flank, and thus the formation of warm anomalies over central Asia, while the cold anomaly over northern Europe is associated with cold northerlies on the western flank of the low. Similarly, the extensive trough over Alaska is bounded to the west by lower temperatures over northeastern Siberia and to the east by the widespread warming over northeastern Canada. Sea-level pressure anomalies also have an imprint on storm track changes: in the North Pacific, the anomalous anticyclone, centred on the eastern side of the basin, causes the storm tracks to shift northwards, while in the Atlantic the weakening (strengthening) of the storm tracks on their climatological western (eastern) flank is associated with an anomalous high (low) in the western (central) basin. A link between sea-level pressure and SST anomalies is also apparent over the extratropical Pacific: the eastward displacement of the anomalous anticyclone with respect to the centre of the Aleutian Low in the baseline leads to a stronger northward (southward) flow over the north-central (subtropical-eastern) Pacific, with associated formation of warm (cold) SST anomalies by wind stress forcing (see, for example, Boo et al., 2015). Finally, despite the relatively modest amplitude, the anomalous sea-level pressure distribution across the equatorial Pacific favours near-surface easterlies over the western basin, strengthening the trade winds there and, together with equatorial upwelling driven by divergent wind anomalies, result in a La-Niño-like SST pattern.
In MAM, a decrease in AOD across South and East Asia leads to an increase in all-sky and clear-sky surface downwelling SW radiation (Fig. S5), subsequent regional warming and the development of anomalous low sea-level pressure compared to the baseline, with larger anomalies over southeastern China and the nearby South China Sea (Fig. 3b, f). An important feature is the weakening and eastward shift of the western Pacific subtropical high (WPSH), which is a key climatological element controlling moisture transport towards East Asia. As a result, anomalous moisture-rich southwesterly winds blow from the southwestern Indian Ocean across Southeast Asia to eastern China, reinforcing the climatological flow (manifested, for example, in a stronger and northward shift of the Mascarene High and associated anticlockwise circulation over the south-equatorial Indian Ocean). The climatological rainfall front advances northward, leading to wetter conditions across the equatorial Indian Ocean, southern Southeast Asia and southern China, with drier anomalies to the south (e.g. across the south-equatorial Indian Ocean and over the equatorial MC) (Fig. 3d). In contrast, relative higher pressure over South Asia compared to regions to the east prevents the anomalous flow from reaching the Indian subcontinent where stronger dry westerlies lead to negative continental precipitation anomalies. Also, the anomalous southwesterlies weaken the climatological westward moisture transport along the southern flank of the WPSH, leading to a precipitation deficit over the western subtropical Pacific. As a result of the above adjustments, precipitation features a quadrupole-like anomalous pattern around the MC, with positive anomalies in the NW–SE direction, corresponding to a widening of the ascending branch of the Indo-Pacific Walker cell, and negative poles along the E–SW direction, where the climatological maximum ascent is located.
Overall, the anomalous patterns in temperature and pressure during MAM display remarkable similarity, but largely opposite sign, to those during JF. The contrast between JF and MAM is particularly evident by displaying incremental changes (i.e. difference of MAM to JF) to provide a more dynamic depiction of the changes with respect to the underlying evolving seasonal cycle. This, for example, shows the significant cooling over central Asia and Canada more clearly and results in a relative strengthening and zonal widening of the Aleutian Low and negative AO-like anomaly at high latitudes. As for JF, there is a broad-scale correspondence between the sea-level pressure and near-surface temperature distributions: for example, the large continental ridges over northern Eurasia and northwestern Canada favour the advection of air of Arctic origin along their eastern flanks, resulting in cold anomalies over central and northern Asia and most of North America, respectively. Relative to JF, the North Pacific storm tracks weaken and shift south, while in the North Atlantic the eastward shift is less pronounced, and storm tracks strengthen, albeit modestly, on their western edge. Similarly, Pacific basin-wide relative SST changes tend towards a pattern resembling the positive phase of the PDO, with, as in JF, a close association with the overlying wind pattern and wind-driven upwelling and/or downwelling. The associated warming and precipitation deficit in the eastern equatorial Pacific, together with weaker trade winds and evaporation cooling, suggest a shift towards an El-Niño-like response pattern.
3.3 Large-scale atmospheric circulation adjustments
The coherent and consistent hemispheric-wide response patterns in near-surface variables discussed above – including the consistency between climate anomalies across Asia and regional aerosol variations, the wave-like structure and the seasonal phase reversal (Figs. 1–3) – are all suggestive of an underlying strong dynamical mechanism, with its possible origin rooted in the adjustment to aerosol emissions. Therefore, analysis of the upper-tropospheric circulation anomalies and related diagnostics will help to gain further insights into the driving mechanism and associated large-scale setting.
The JF 250 hPa meridional wind and streamfunction – preferred to the geopotential height to highlight the tropical structure – display an alternating pattern of positive and negative anomalies across the NH in the 30–60∘ N band (Fig. 4a). This is indicative of an upper-tropospheric wave pattern of approximately zonal wavenumber 4 to 5. The wave activity flux – calculated following Takaya and Nakamura (2001) for regions outside the deep tropics (i.e. north of 18∘ N) – suggests that the wave train emanates from the tropical western Pacific and propagates northeastward along the East Asian jet, getting amplified over North America and across the Atlantic where it is strengthened by interacting with the North American–Atlantic jet (Fig. 4c). The wave then turns southeastward and finally bifurcates over the Atlantic region, with one branch directed northeastward over Central Eurasia and the other southeastward across the Mediterranean. The equivalent barotropic nature of this wave train, with lower-tropospheric streamfunction anomalies collocated with those in the upper troposphere (but of smaller magnitude), is suggestive of a remotely forced wave response (Qin and Robinson, 1993).
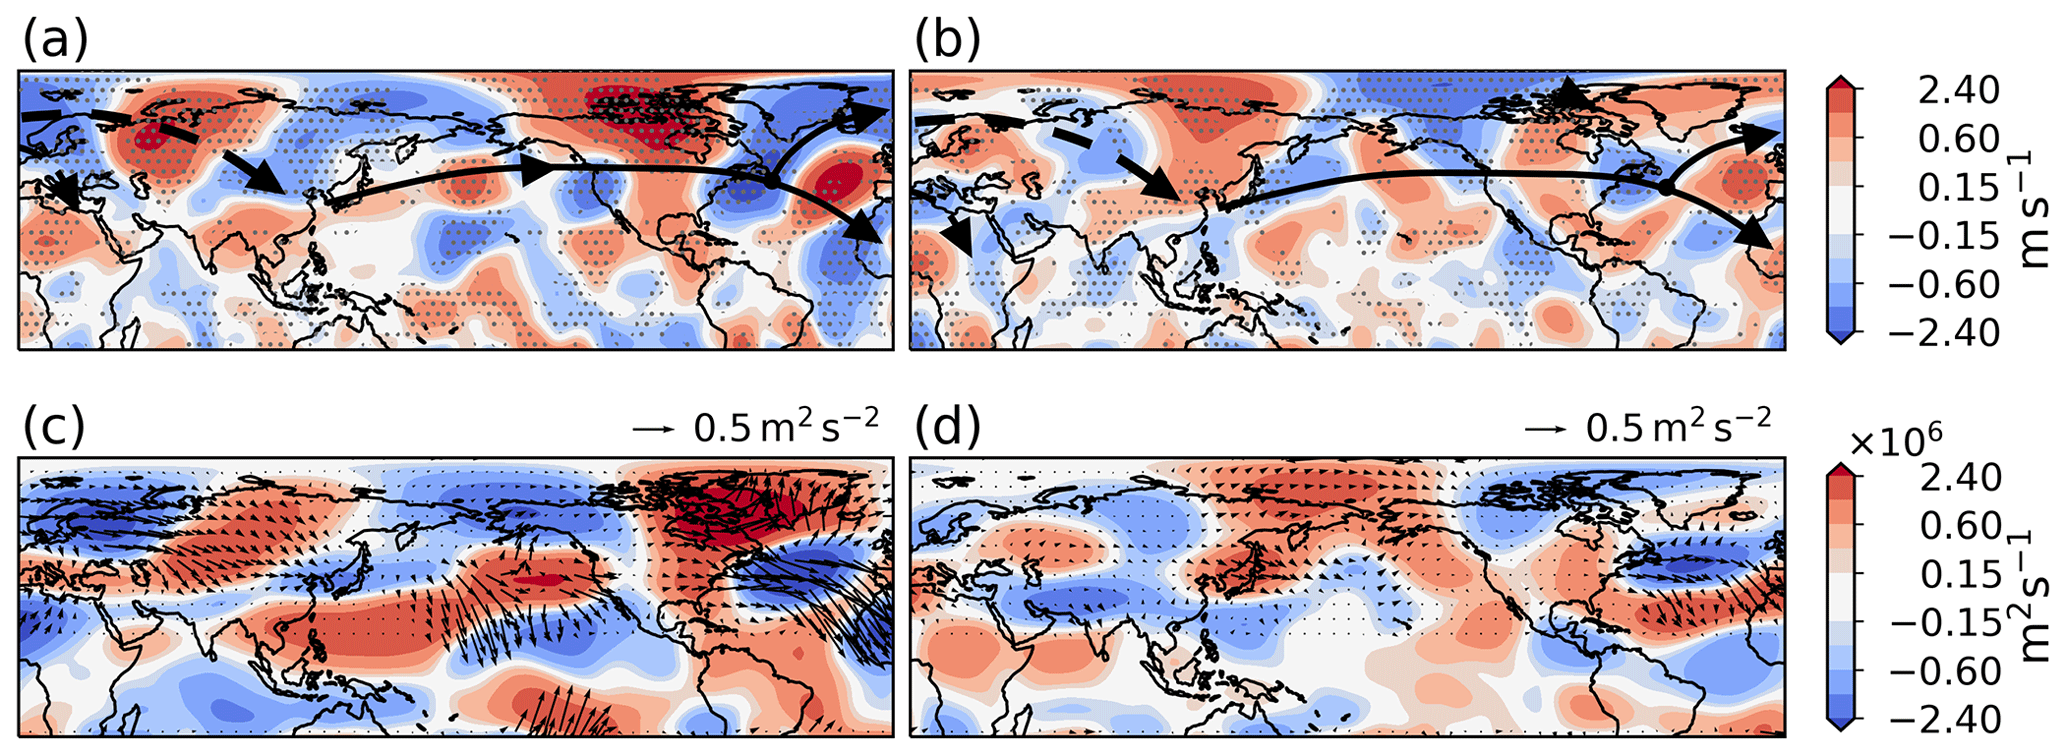
Figure 4Spatial patterns of MEM anomalies in (a, b) meridional wind speed and (c, d) zonal-mean-corrected streamfunction (shades) and wave activity flux (arrows; computed for regions north of 18∘ N) at 250 hPa during JF (a, c) and MAM 2020 (b, d). In (a, b), black arrows show the suggested path of the Rossby wave train, and stippling indicates where at least 70 % of the models agree on the sign of change.
The anomalous hemispheric-wide wave pattern described above, originating from aerosol-induced circulation anomalies over Asia and subsequent precipitation redistribution around the MC and adjacent oceanic regions, is pivotal to the generation of downstream surface climate anomalies in the extratropics. The relationship is suggested already by the close resemblance between the distribution of the NH surface temperature anomalies and the wave pattern in the 250 hPa streamfunction (e.g. colder temperature anomalies generally collocated with upper-level troughs), indicating the former to be strongly modulated by adiabatic redistribution of temperature as a result of the travelling wave train. The three-dimensional mechanistic link can be more rigorously identified by invoking the large-scale vorticity (Sverdrup) balance (e.g. Rodwell and Hoskins, 2001) and associated inferred pattern of vertical motion. For example, descent, precipitation suppression and near-surface high pressure would occur in association with the southward flow along the western flank of the upper-tropospheric trough centred over northeastern Europe. Conversely, over central Asia and northwestern Russia, near-surface low-pressure anomalies, ascent and increased precipitation would be associated with the northward flow on the eastern flank of the upper-tropospheric anomalous trough. Inspection of Fig. 3 allows one to ascertain that the broad-scale features shown there are consistent with the above picture. An opposite pattern occurs in association with the large upper-level anticyclone centred over northern Canada and the Midwest of North America, namely anomalous near-surface cyclone and wet anomalies over Alaska and descent and higher surface pressure anomalies over the northeastern US and Canada.
The MAM meridional wind pattern also features alternating anomalies across the NH, with the corresponding wave activity flux suggestive of propagating Rossby waves (Fig. 4b, d). These anomalies show a similar spatial pattern and magnitude as during JF but of broadly reversed polarity over Eurasia, the Arctic and North America. As for JF, there is broad-scale correspondence between the upper-tropospheric circulation and surface climate anomalies. For example, the prominent ridge between northeastern Siberia and Alaska induces warm advection, large-scale ascent and precipitation excess along its western flank (i.e. over northeastern Asia) and opposite anomalies to the east (i.e. over Alaska and northern Canada). This consistency of upper- and lower-tropospheric anomalies also indicates that the Asian aerosol imprint dominates over possible impacts of local, albeit relatively modest, emission changes over North America and Europe during MAM.
Further evidence for the Rossby-wave-generating region is found in the patterns of the Rossby wave source (RWS). During JF, the strongest RWS anomalies are evident over eastern China, co-located with the East Asian jet core (Fig. 5a). While the RWS pattern features other minor centres in the extratropical regions, these can be interpreted as secondary sources generated by the circulation adjustment to the primary source region.
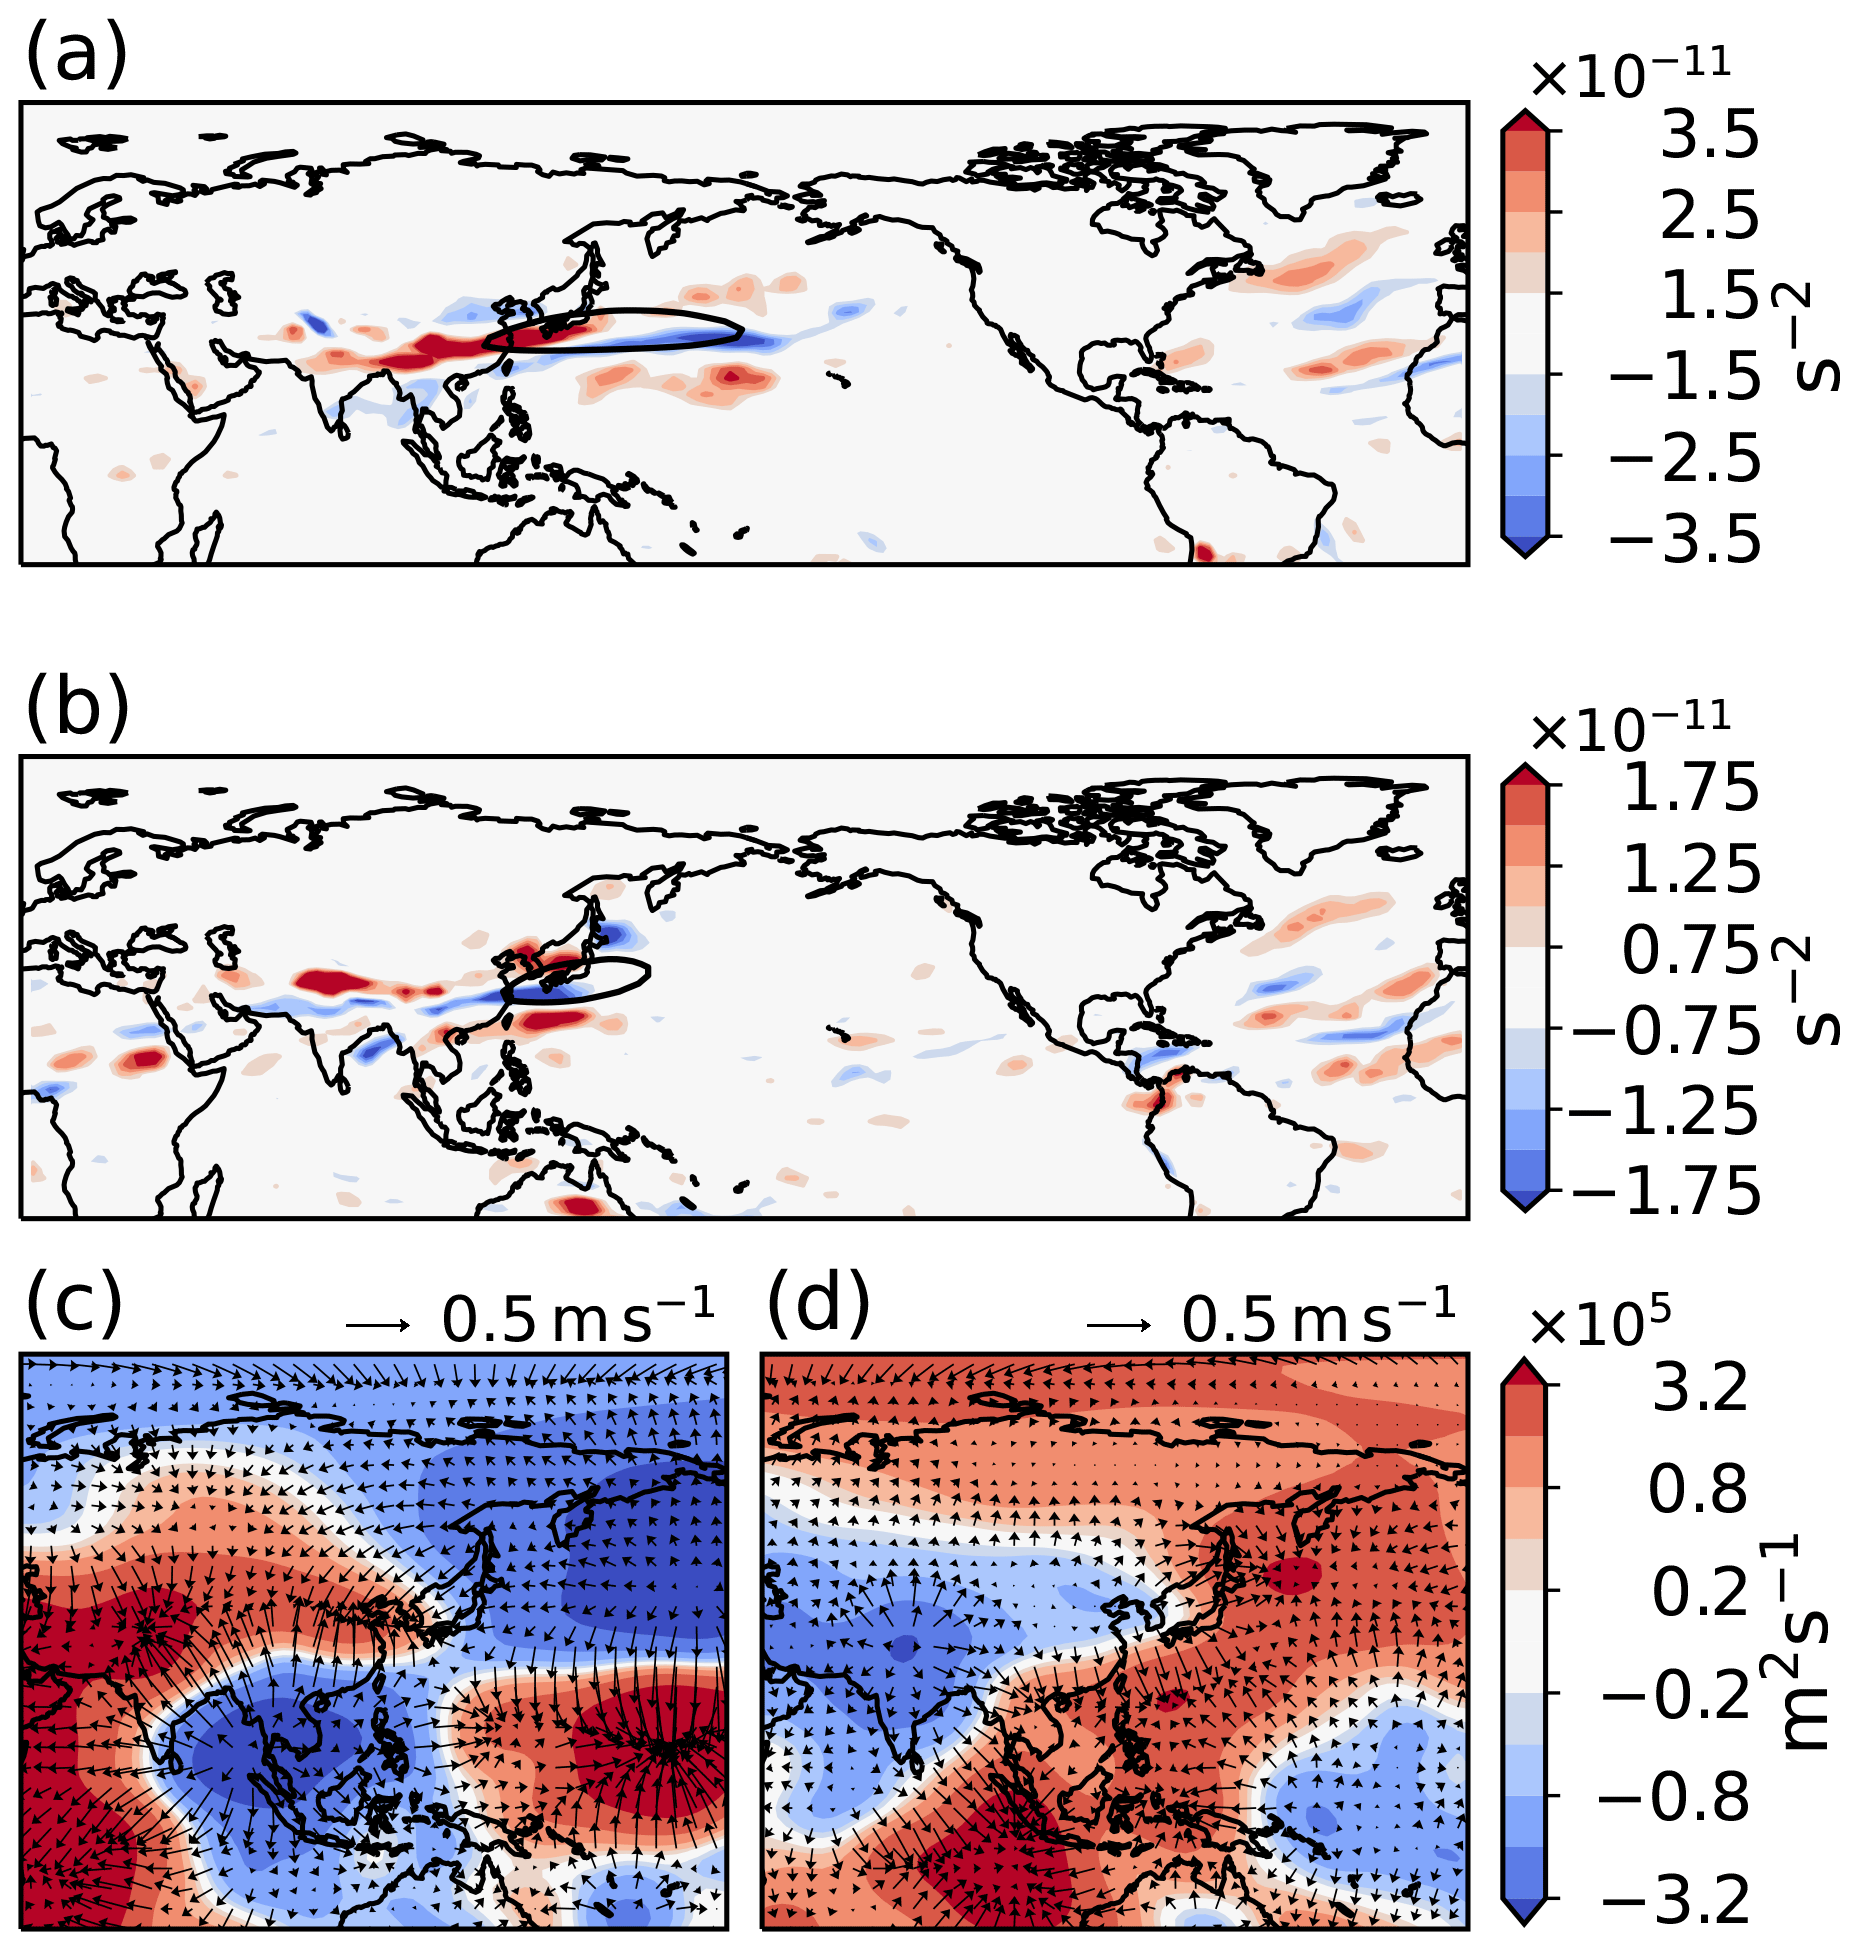
Figure 5Spatial patterns of MEM anomalies in (a, b) Rossby wave source and (c, d) velocity potential (shades) with divergent flow (arrows) at 250 hPa during JF (a, c) and MAM 2020 (b, d). Note that the colour bar scale in (b) is halved in comparison to (a). Black ellipses in (a, b) indicate the East Asian jet core, where values of the baseline 250 hPa zonal wind are greater than 60 m s−1 in JF and 40 m s−1 in MAM.
Analysis of velocity potential and divergent flow anomalies at 250 hPa provides insights into the mechanism underpinning the generation of Rossby waves and the link with changes in aerosol emissions over Asia (Fig. 5c). The tropical and sub-tropical regions are characterised by an approximate balance between diabatic heating (e.g. condensational heating from precipitation anomalies) and mid-tropospheric vertical motion, with ensuing upper-tropospheric divergence (convergence) and low-tropospheric convergence (divergence) associated with positive (negative) rainfall anomalies. Thus, the presence of a strong upper-level outflow and negative velocity potential anomaly over the MC and southern Southeast Asia is not surprising given the large precipitation excess there. In turn, the divergent flow converges over two regions: a wide semi-elliptical area extending from eastern China to eastern Africa and the southwestern Indian Ocean, and a more confined, but equally important, region over the central equatorial Pacific. Consistently, these areas feature anomalous descent and reduced precipitation. The anomalous zonal circulation along the Equator is thus indicative of a northwestward shift of the Indo-Pacific Walker cell and a zonal contraction of the spatial extent of its upward branch. Note that alternating anomalies in velocity potential around the tropical belt (not shown) indicate a large-scale shift of the zonal circulation with associated precipitation changes across the whole equatorial region, not just across the Indo-Pacific sector. The strong northward outflow from the ascending branch of the anomalous Walker cell then interacts with the Asian-Pacific jet and the large regional meridional vorticity gradients, giving rise to the dominant RWS there (Fig. 5a).
The RWS distribution during MAM 2020 also shows a large triplet (positive–negative–positive) over eastern China and the adjoining ocean, indicating a primary wave source region (Fig. 5b). Compared to JF 2020, the main RWS anomaly is of reversed polarity in MAM 2020. Velocity potential and divergent circulation anomalies in MAM suggest a weakening of the core of the upward branch of the Indian Ocean–Pacific Walker cell, as well as a northwestward and southeastward widening, with subsidence and drier conditions over the northeastern MC (Fig. 5d). The associated upper-level northerly inflow across the South China Sea is thus opposite to the prevalent southerlies during JF 2020, generating Rossby waves of opposite polarity by a similar mechanism.
The generation and evolution of the wave-like teleconnection pattern found above based on the MEM can be investigated in more temporal detail by using daily data from the MPI-ESM1-2-LR model. We applied a 5 d centred, unweighted rolling mean to the daily data to reduce the influence of daily variability while highlighting the longer-lived patterns. Figure 6 shows the evolution of the 250 hPa meridional wind anomalies during January 2020. While the anomalies are initially weak and do not show a coherent pattern, a Rossby wave train starts to emerge around mid-January, consistent with the temporal evolution of aerosol emissions over China. Large anomalies appear first over the central and eastern Pacific and subsequently circumnavigate the globe eastwards in 15–20 d, as shown by the alternating anomalies in the NH mid-latitudes. The anomalies reach their peak magnitude at the end of January. Thereafter, they remain quasi-stationary in space, resulting in a wave pattern of zonal wavenumber 4 to 5 in the NH mid-latitudes (around 30 and 60∘ N) (Fig. S6).
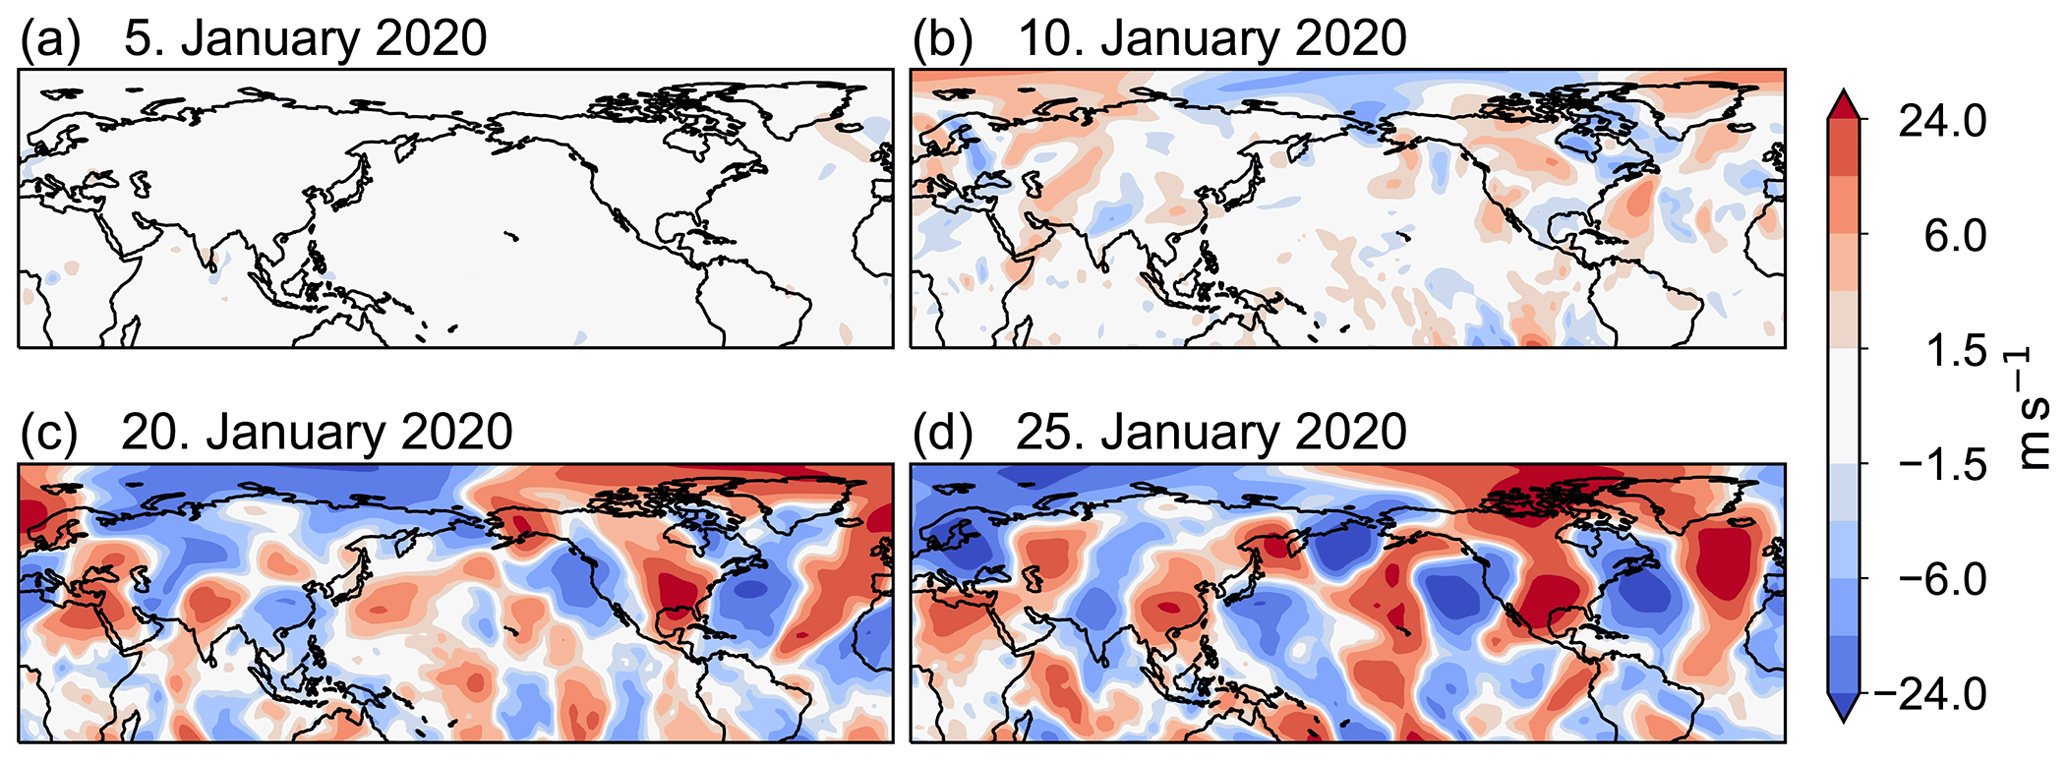
Figure 6Spatial pattern of MPI-ESM1-2-LR anomalies in 250 hPa meridional wind speed during January 2020 using a 5 d centred, unweighted rolling mean.
3.4 Climate response in PDRMIP
In order to provide further support to the findings above and, particularly, the key role of Asian aerosols in instigating the hemispheric-wide wave pattern and associated remote climate anomalies, we examined the PDRMIP regional aerosol perturbation experiments SULx10a and BCx10a in conjunction with the control simulations. The availability of individual forcing experiments for the two aerosol species in PDRMIP also allows us to disentangle the relative role of sulfate and BC in driving the climate responses seen in CovidMIP. For this comparison, anomaly patterns of opposite signs between the PDRMIP and CovidMIP simulations would imply agreement, as the design of the experiments is opposite between the two MIPs (i.e. they impose an increase and decrease in emissions, respectively).
Figure 7 displays the spatial patterns of changes in emissions and relevant climate anomalies for SULx10a and BCx10a during JF (it is worth pointing out that some of the PDRMIP models are concentration driven – see Table S1). Sulfate and BC emissions increase primarily over eastern China, with smaller changes (about 20 %–25 % of the baseline levels) over India (Fig. 7a, b). Note, however, that BC emission changes are approximately 1 order of magnitude smaller than those of sulfate. These patterns bear close resemblance to those used in CovidMIP for JF 2020, with emissions over eastern China dominating over those from India (Fig. 1a, c). It is worth highlighting that the response patterns show anomalies of similar magnitude between the two forcing agents despite a 10-fold lower emission and concentration increase in BC than in sulfate, indicative of the strong BC forcing on these timescales.
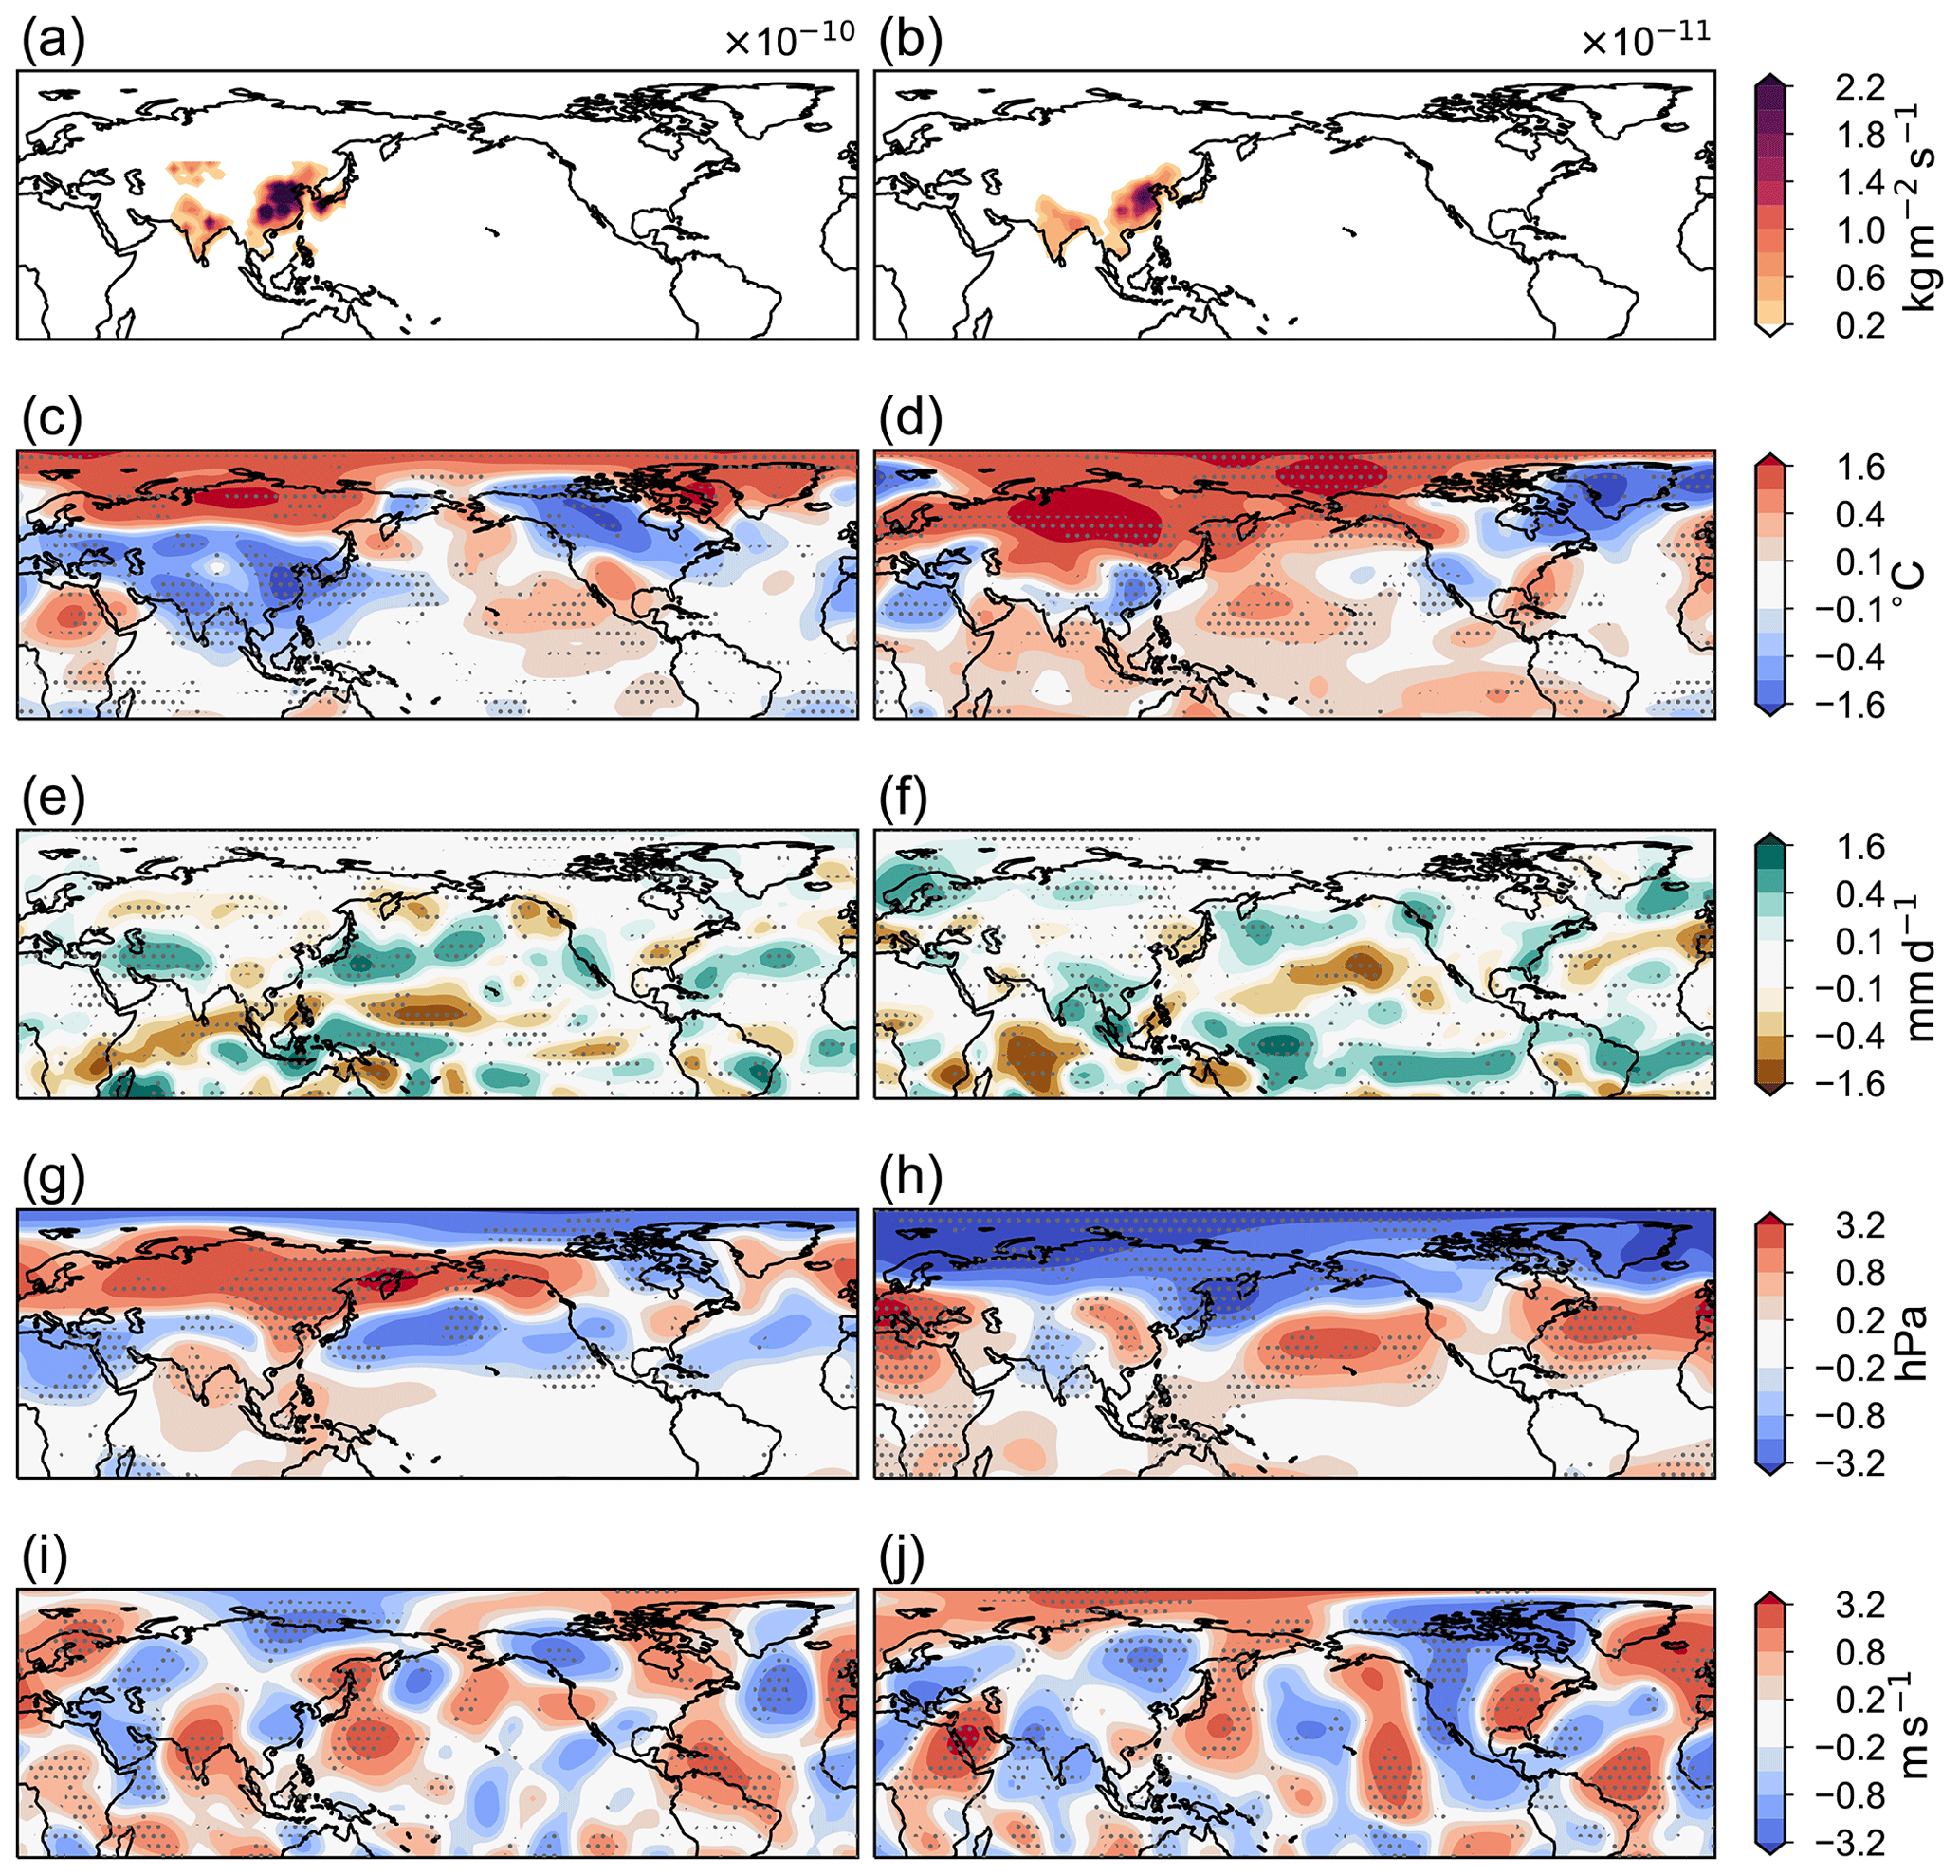
Figure 7Spatial patterns of PDRMIP anomalies in (a, b) emissions, (c, d) near-surface air temperature, (e, f) precipitation rate, (g, h) sea-level pressure and (i, j) 200 hPa meridional wind speed for coupled SULx10a (left) and BCx10a (right) during JF of year 1. Stippling indicates where at least 85 % of the models agree on the sign of change.
The SULx10a near-surface temperature anomalies feature a widespread warming over the Arctic region, extending southward over northern Eurasia and Greenland, as well as cooling over central and southern Eurasia and over Canada and the northern US (Fig. 7c). A remarkably similar northern hemispheric pattern, but of opposite sign, is evident in CovidMIP (Fig. 3a), also including the PDO-like response in the extratropical Pacific. Opposite temperature anomalies also occur in the eastern subtropical Pacific, although ENSO-like anomalies in PDRMIP tend to emerge more clearly from the second year of the simulations. Conversely, CovidMIP and BCx10a display little resemblance in the spatial patterns, especially over the Pacific and across Eurasia (Figs. 3c, 7f).
The SULx10a precipitation response shows a SE shift and zonal widening of the Indo-Pacific Walker cell, indicated by the increase (decrease) of precipitation over the SE (NW) region of the MC, as well as marked wet anomalies over the western and central sub-equatorial Pacific (Fig. 7e). Remote precipitation anomalies feature a wet–dry–wet–dry anomalous pattern stretching from Scandinavia towards South Asia, a southern shift of both the Atlantic and Pacific storm tracks and ENSO-like drying over the central and eastern equatorial Pacific. These key features, again of opposite sign, are also present in CovidMIP, whereas BCx10a and CovidMIP show little similarity in the spatial changes (Figs. 3c, 7e, f).
SULx10a and CovidMIP display similar sea-level pressure response patterns (Figs. 3e, 7g), consistent with the large agreement of temperature and precipitation changes mentioned above. For example, SULx10a features a strengthened Aleutian Low, as well as a widespread anticyclone over the region of the climatological Siberian High extending towards Alaska. The anticyclonic anomalies spread around the whole Arctic Circle from the second simulated year (Fig. 7g). Also, cyclonic anomalies, albeit of smaller extent, are seen over the Mediterranean, northern Africa and the Arabian peninsula. BCx10a shows a predominantly opposite pattern to SULx10a and thus poor correspondence with CovidMIP (Figs. 3e, 7h).
Upper-tropospheric meridional wind anomalies (here displayed at 200 hPa given the unavailability of data at 250 hPa) show distinct wave-like patterns with zonal wavenumber 4–5 in the extratropics in both PDRMIP experiments (Fig. 7i, j). The correspondence between the BCx10a and CovidMIP anomalies is weak over the polar regions and Eurasia. However, the overall wind anomaly patterns of SULx10a and CovidMIP agree well, with key anomalies of opposite polarity centred over the same regions of North America, the Atlantic Ocean and Eurasia (e.g. the SE-tilted quadruplet anomalies from northern Europe to southeastern Asia and the dipole across Canada). The patterns are less consistent over the Pacific Ocean, with the SULx10a wave train propagating further northward than that in CovidMIP.
This comparison, albeit not devoid of limitations, indicates a striking similarity and consistency between the CovidMIP and Sulx10a response patterns but a much weaker correspondence with BCx10a, providing further evidence of the driving role of East Asian sulfate aerosols for the hemispheric-wide anomalies in JF 2020 in CovidMIP. A related aspect to note is the large agreement between the SULx10a climate response during JF and coupled and uncoupled PDRMIP experiments (where year 2 is analysed in the latter ensemble to account for the model spin-up after being initialised from coupled simulations; Bjørn Hallvard Samset, personal communication, 2022). This is further indicative of the primary atmospheric nature of the climate response, although atmosphere–ocean-coupled processes and internal variability appear to be key to explaining, for instance, the precipitation pattern over the eastern central Pacific and pressure anomalies over the Arctic region.
In MAM, climate anomalies in coupled PDRMIP simulations remain relatively similar to those during JF, and incremental changes are inconsistent with those in CovidMIP in several variables (not shown). This is presumably related to differences in the underlying main emission patterns of the two MIPs. For CovidMIP, both aerosol species show a dipole pattern with a relative decrease over eastern China but an increase over India from JF to MAM (Fig. 1). For PDRMIP, relative BC emission changes do show a dipole pattern (of opposite sign), whereas sulfate emission changes only show a relative increase over eastern China but no changes over India between JF and MAM.
This study aimed to investigate the large-scale, super-fast (on a monthly timescale and including coupled air–sea interactions) climate response to COVID-19 emission reductions using output from 10 Earth system models participating in CovidMIP. While the prescribed emission pathways also include small changes in GHG emissions, this analysis sought to disentangle the climate response to anthropogenic aerosol variations and to understand the underpinning physical mechanism, in particular the role of atmospheric dynamical adjustments in generating the hemispheric-wide response. In particular, we focused on and contrasted two different periods, January–February and March–May 2020, the seasons of the largest emission changes in SO2 and BC.
Aerosols, rather than GHGs, are deemed pivotal to explain the climate imprint (extending Forster et al., 2020b; Yang et al., 2020; Gettelman et al., 2021) due to comparatively larger COVID-19-related changes than those of GHGs and the aerosol heterogeneous distribution. This conclusion is further strengthened by the significant agreement between CovidMIP and the PDRMIP single-forcing regional aerosol simulations. Importantly, the mobility-data-based estimates of aerosol emission changes, as used in CovidMIP, were found to agree well with aerosol measurements conducted during aircraft campaigns, e.g. measuring BC reductions over Europe in May and June 2020 (Krueger et al., 2022).
We find a substantial aerosol signature of, in particular, Asian aerosols on atmospheric dynamics, as well as associated local and remote climate responses at seasonal timescales. Our results are at odds with previous studies which, focusing on COVID-19-induced global-mean and/or multi-year average changes in temperature and precipitation, concluded that the COVID-19-related aerosol emission changes were temporally and spatially too small to result in detectable climate anomalies (Forster et al., 2020b; Gettelman et al., 2021; Jones et al., 2021; Szopa et al., 2021). This discrepancy might be explained by the seasonal focus of our study and, especially, the finding that JF and MAM 2020 anomalies show a large spatial agreement but are of opposite sign, resulting in near-zero net changes when averaged. During both time periods, these response patterns show large areas of model agreement and consistent changes across different variables, highlighting the common generating mechanism.
We further investigated the question of whether the aerosol-generated response (signal) in 2020 is distinguishable from internal climate variability (noise). The study by Ming et al. (2021) concluded that around one-third of the TOA clear-sky radiation anomaly over the East Asian marginal seas during March 2020 can be attributed to the COVID-19 aerosol emission reductions and the rest to weather variability and long-term trends in emissions. For this analysis, Ming et al. (2021) compared the anomalies in 2020 to those in the previous 20 years to ascertain whether the former falls outside the range (i.e. the standard deviation) of the latter. In order to more robustly isolate internal variability from externally forced changes, we compare the TOA radiation anomalies in CovidMIP during JF and MAM 2020 to the standard deviations of the pre-industrial (PI) control simulations (based on 150-year segments for the corresponding CovidMIP models). While the anomalies in 2020 in all-sky TOA radiation are generally significantly below 1 standard deviation of the corresponding PI anomalies (figure not shown), the signal emerges more distinctly in the clear-sky anomalies (Fig. S8). These findings are consistent with Ming et al. (2021). This suggests that the impact of COVID-19 aerosol emission changes in clear-sky radiation is detectable outside the bounds of internal variability, which further underscores the importance of aerosol–radiation interactions in generating the impact.
Overall, the mechanism underlying JF anomalies can be summarised as follows (see also the schematic Fig. 8). Locally, a marked decrease in aerosol emissions over eastern China relative to the baseline results in lower aerosol burden and AOD, leading to an increase in surface downwelling SW radiation and ensuing near-surface air warming. Regionally, the circulation adjusts thermodynamically to the warming by developing an anomalous lower-tropospheric cyclone over eastern China, which in turn leads to the formation of an anomalous sea-level pressure high over Southeast Asia. Enhanced moisture-rich westerlies along the southern flank of the anticyclone cause a northwestward rainfall shift from the equatorial region in the climatology towards the MC, leading to a large diabatic heating anomaly and upper-tropospheric divergence there. On a larger scale, the above changes in circulation and precipitation patterns are indicative of a northwestern shift and longitudinal shrinking of the Indo-Pacific Walker cell. The strong northward divergent outflow from the precipitation excess over Indonesia interacts with the East Asian jet, exciting a stationary, equivalent barotropic Rossby wave train which propagates eastward around the NH mid-latitudes and leads to remote climate anomalies.
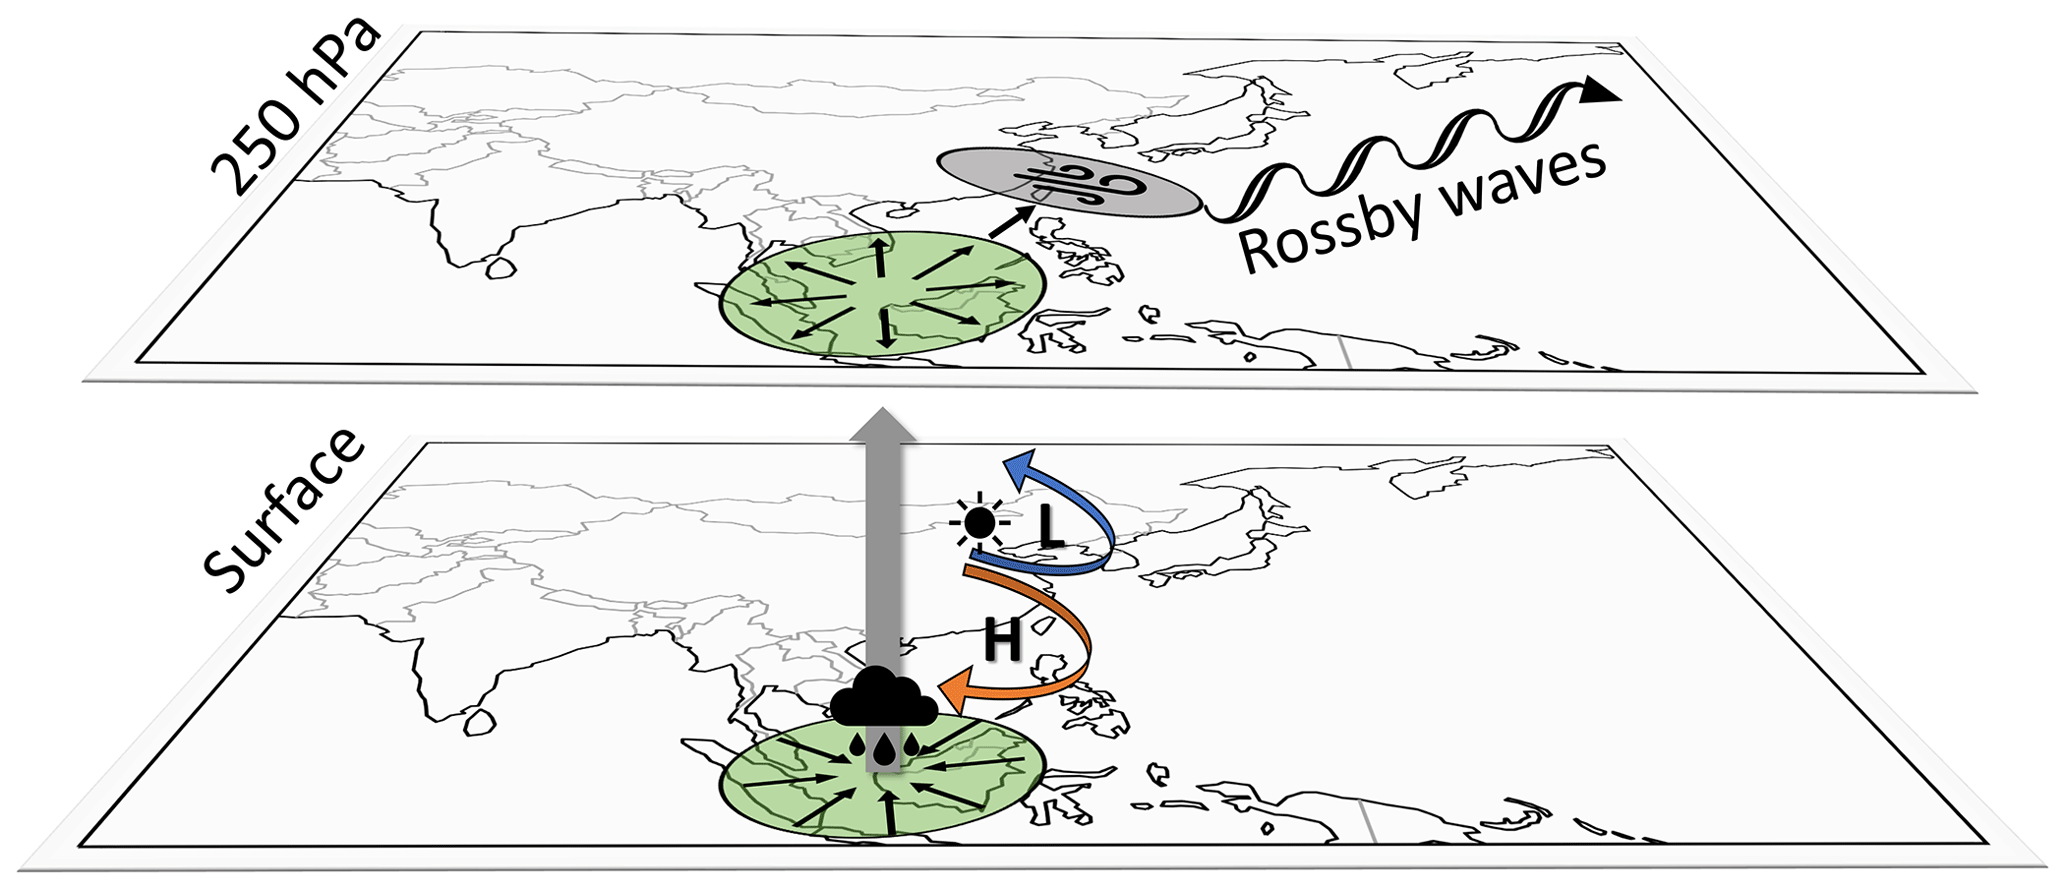
Figure 8Schematic of the generation of Rossby waves associated with the reduction of aerosol emissions over eastern China in JF 2020. The grey arrow represents vertical ascending air motion, and the curved blue and orange arrows show low-pressure and high-pressure anomalies, respectively. Centres of divergence and convergence are shown as green circles, and the associated circulation is shown with black arrows. The East Asian jet core is indicated by a grey ellipse.
The mechanism during MAM (schematic Fig. S7) initiates from decreased aerosol emissions over India and, to a lesser extent, over eastern China, resulting in more SW downwelling radiation at the surface and widespread warming. Regionally, the warming leads to the development of an anomalous cyclone over India and China and an associated northeastward shift of the climatological WPSH. In turn, precipitation is shifted northward over the Indian Ocean, linked to a weakening of the core and a zonal widening of the ascending branch of the Indo-Pacific Walker circulation. The negative diabatic heating anomaly over the MC associated with the rainfall deficit yields a northerly upper-tropospheric convergent inflow, which in turn initiates Rossby waves. The mechanism is thus similar to that in JF, with the opposite polarity of Rossby wave centres and ensuing anomalies across the NH related to the opposite pattern of the divergent flow around the MC.
A comparison between PDRMIP and CovidMIP simulations then provides insights into the role of different aerosol species and emission regions in driving the aerosol-forced climate patterns in JF and MAM 2020. In particular, during JF, the coupled SULx10a and CovidMIP anomalies show striking resemblance (but opposite sign, consistent with the opposite experimental setting) in key regional and hemispheric-wide features – including PDO-like SST changes, precipitation anomalies around the MC and the wave trains across the NH – which highlights the key role of sulfate emissions from China. The associated climate response is mainly related to atmospheric processes, although modulated by atmosphere–ocean interactions and internal variability, as indicated by the large agreement between coupled and fixed sea surface temperature simulations on these timescales. A shift of the main sulfate emission reduction region in CovidMIP, namely from China to India, is likely responsible for the sign reversal of the aerosol-related patterns in MAM. The small sulfate reduction over China during MAM might additionally strengthen the climate response to the significant emission reduction over India. In contrast, the PDRMIP SULx10a experiments are driven by smaller Indian than Chinese sulfate emissions in MAM and no relative changes in Indian sulfate emissions from JF to MAM. Thus, the missing correspondence between SULx10a- and CovidMIP-modelled climate anomalies during MAM might be related to the large influence of India in modulating the CovidMIP climate response. Instead, BCx10a is found to show little resemblance to the CovidMIP climate patterns, despite similar emission changes from JF to MAM (i.e. a relative increase over eastern China and decrease over India for CovidMIP and vice versa for PDRMIP). This supports the findings that changes in sulfate rather than in BC are the main drivers of climate anomalies in CovidMIP during both JF and MAM. Nonetheless, it is noteworthy that the climate anomalies to both forcing agents are of a similar magnitude on super-fast timescales, despite a 10-fold lower emission and concentration increase in BC than in sulfate. This calls for close examination of the climate adjustments to sulfate and BC changes, not just at equilibrium but during transient time frames.
A key finding of our study is the importance of wave propagation in generating the downstream aerosol climate imprint and the possibility to induce significant remote anomalies after abrupt, but relatively limited, emission changes. In particular, our analysis shows that remote responses to COVID-19-related aerosol emission changes are associated with a stationary, equivalent barotropic Rossby wave train propagating eastward from East Asia, generated by precipitation shifts over the MC and the western equatorial Pacific due to changes in Asian aerosol emissions. A similar mechanism has been previously suggested to underpin a hemispheric-wide response to aerosol changes (Ming et al., 2011; Lewinschal et al., 2013; Wilcox et al., 2019; Bartlett et al., 2018), albeit in different contexts (e.g. historical changes) and seasons (e.g. summer). An important discrepancy between earlier studies regards the source region of the Rossby waves. Some works (Wilcox et al., 2019; Bartlett et al., 2018) proposed that waves were generated around the East Asian jet exit, as also shown here, while others (Ming et al., 2011; Lewinschal et al., 2013) found that wave trains were mainly generated over the tropical Pacific. This discrepancy could be related to the fact that the former (and our) studies focused on the effect of Asian aerosols only, whereas the latter works simulated the climate response to an increase in global aerosol emissions, with a potential competition between locally and remotely forced responses. Far-field responses were shown to possibly even dominate over local effects of radiative forcing in certain regions (Lewinschal et al., 2013). More research is needed to determine if the wave-generating region depends on the location of the aerosol emissions and the interplay between local and remote dynamical responses.
The significant role of circulation adjustments and atmospheric teleconnections in realising the aerosol imprint is especially important in the context of the interplay between external forcing and internal climate variability, whereby the latter can contribute substantially to modulating, if not masking, the externally forced signal (e.g. Deser et al., 2012; O'Reilly et al., 2021). Furthermore, circulation adjustments to external forcing have been previously found to project strongly onto underlying modes of variability (Deser et al., 2004; Allen and Sherwood, 2011; Lewinschal et al., 2013; Wilcox et al., 2019; Dow et al., 2021), which makes the two driving factors even more intrinsically intertwined. Indeed, our results show that the aerosol response features a modulation of the AO and the Aleutian Low, as well as a projection onto Pacific wind-driven SSTs and near-surface wind changes that resemble a PDO–ENSO pattern. Importantly, these findings highlight the critical, but overlooked, ability of super-fast atmospheric circulation adjustments to generate climate anomalies consistent in their spatial structure with longer-term signals. While internal climate feedbacks and slow oceanic processes certainly also play a role, one may wonder whether and to what extent long-term (decadal) trends are initiated by short-term atmospheric circulation changes. This has, in particular, significant implications for generating rapid and important climate adjustments with even relatively small, but abrupt, aerosol emission changes. Insights into this field are critically needed in order to reduce uncertainties in future projections of regional climate change (Shepherd, 2014), especially in the light of emerging aerosol emission patterns over Asia during the last decade (Samset et al., 2019) and also those that could emerge due to uncertainties in future aerosol emission trajectories (Bartlett et al., 2018).
The sensitivity of the climate response patterns to the location of the key aerosol emission region found here provides further evidence to recent literature documenting how both global and regional climates are highly dependent on regional aerosol emissions and their rates of change (e.g. Liu et al., 2018; Tang et al., 2018; Undorf et al., 2018). This has recently become a topic of active research (e.g. Persad and Caldeira, 2018; Wilcox et al., 2019; Westervelt et al., 2020; Williams et al., 2022), as limited knowledge of the climate impacts of heterogeneous aerosol distributions, alongside their potentially strong nonlinear interactions, hinders our understanding of historical climate change and its attribution. More importantly, it also limits achieving more robust projections of climate change and associated hazards in the coming decades. This is a timely and pressing issue, as, for example, in the most recent years, Chinese SO2 emissions have been markedly reduced, while emissions of both SO2 and BC from India have increased, leading to a dipole change over South and East Asia (Samset et al., 2019), which are not accounted for in the scenarios developed for the Sixth Assessment Report (AR6) of the IPCC (Wang et al., 2021). Even more, the AR6 Shared Socioeconomic Pathways project a wide range of possible trajectories of aerosol emissions from different regions, depending on national and international air quality and energy policies, among others (Lund et al., 2019). Rapid progress in understanding how these emission trends will affect near-term regional and global climates is thus urgently needed.
Although our findings are based on ensemble means across multiple ESMs, with varied aerosol parameterisations and effective RF estimates, a more robust assessment of the role of internal variability in modulating the climate response on very short timescales would be possible, for example, by analysing large-ensemble single-forcing experiments. Multi-model ensemble experiments driven by transient, realistic regional aerosol emission changes and using a consistent experimental set-up are also key to disentangle the importance of different source regions in driving large-scale climate adjustments. Further studies should also take into consideration the role of climate model biases, including the spatial distribution of precipitation across the tropics, which may affect the identification and attribution of regional and remote climate responses to anthropogenic aerosols (e.g. Samset et al., 2016; Stjern et al., 2017; Westervelt et al., 2020), for example, by modulating local aerosol–cloud interactions or remotely affecting the mechanism of Rossby wave generation. Overall, our findings emphasise the prominent role of large-scale dynamical adjustments to regional aerosol forcing, even on short timescales, using COVID-19 changes as a test bed and highlight the critical need for clear scientific advances in this field in order to accurately predict near-future climate risks at a regional scale and to provide scientifically based mitigation and adaptation strategies.
ERA5 monthly data from 1959 to present are publicly available at https://doi.org/10.24381/cds.6860a573 (Hersbach et al., 2019). Monthly input4MIPS data for aerosol emissions and greenhouse gas concentrations (v4.0) used in CovidMIP can be accessed via https://doi.org/10.5281/zenodo.3957826 (Forster et al., 2020a). We thank the support of the team in charge of CNRM-CM climate model who provided the CovidMIP output for the CNRM-ESM-2 simulations. All other model datasets for CovidMIP are published on the CMIP6 archive available via the Earth System Grid Federation (ESGF) at https://esgf-index1.ceda.ac.uk/search/cmip6-ceda/ (World Climate Research Programme, 2023; Lamboll et al., 2021). The PDRMIP data can be accessed via the World Data Center for Climate (WDCC) data server at https://doi.org/10.26050/WDCC/PDRMIP_2012-2021 (Andrews et al., 2021).
The supplement related to this article is available online at: https://doi.org/10.5194/acp-23-877-2023-supplement.
NLSF carried out the analysis, visualised the results and wrote the initial draft. MAB contributed to the analysis and helped with the discussion of the results. Both authors edited the paper.
The contact author has declared that neither of the authors has any competing interests.
Publisher’s note: Copernicus Publications remains neutral with regard to jurisdictional claims in published maps and institutional affiliations.
Nora L. S. Fahrenbach and Massimo A. Bollasina have been funded by the Research Council of Norway (grant no. 324182; CATHY). Massimo A. Bollasina has been supported by the Natural Environment Research Council (grant no. NE/N006038/1).
This paper was edited by Toshihiko Takemura and reviewed by two anonymous referees.
Albrecht, B. A.: Aerosols, cloud microphysics, and fractional cloudiness, Science, 245, 1227–1230, https://doi.org/10.1126/science.245.4923.1227, 1989. a
Allen, R. J. and Sherwood, S. C.: The impact of natural versus anthropogenic aerosols on atmospheric circulation in the Community Atmosphere Model, Clim. Dynam., 36, 1959–1978, https://doi.org/10.1007/s00382-010-0898-8, 2011. a, b
Andrews, T., Boucher, O., Fläschner, D., Kasoar, M., Kharin, V., Kirkevåg, A., Lamarque, J.-F., Myhre, G., Mülmenstädt, J., Oliviè, D. J. L., Samset, B., Sandstad, M., Shawki, D., Shindell, D., Stier, P., Takemura, T., Voulgarakis, A., and Watson-Parris, D.: Precipitation Driver Response Model Intercomparison Project data sets 2013–2021, World Data Center for Climate (WDCC) at DKRZ [data set], https://doi.org/10.26050/WDCC/PDRMIP_2012-2021, 2021. a
Bartlett, R. E., Bollasina, M. A., Booth, B. B. B., Dunstone, N. J., Marenco, F., Messori, G., and Bernie, D. J.: Do differences in future sulfate emission pathways matter for near-term climate? A case study for the Asian monsoon, Clim. Dynam., 50, 1863–1880, https://doi.org/10.1007/s00382-017-3726-6, 2018. a, b, c
Bollasina, M. A., Ming, Y., Ramaswamy, V., Schwarzkopf, M. D., and Naik, V.: Contribution of local and remote anthropogenic aerosols to the twentieth century weakening of the South Asian Monsoon, Geophys. Res. Lett., 41, 680–687, https://doi.org/10.1002/2013GL058183, 2014. a
Boo, K.-O., Booth, B. B. B., Byun, Y.-H., Lee, J., Cho, C., Shim, S., and Kim, K.-T.: Influence of aerosols in multidecadal SST variability simulations over the North Pacific, J. Geophys. Res.-Atmos., 120, 517–531, https://doi.org/10.1002/2014JD021933, 2015. a
Boucher, O., Randall, D., Artaxo, P., Bretherton, C., Feingold, G., Forster, P. M., Kerminen, V.-M., Kondo, Y., Liao, H., Lohmann, U., Rasch, P., Satheesh, S. K., Sherwood, S., Stevens, B., and Zhang, X.-Y.: Clouds and aerosols, in: Climate change 2013: The physical science basis. Contribution of working group I to the fifth assessment report of the Intergovernmental Panel on Climate Change, edited by: Stocker, T., Qin, D., Plattner, G.-K., Tignor, M., Allen, S., Boschung, J., Nauels, A., Xia, Y., Bex, V., and Midgley, P., Cambridge University Press, 571–658, https://doi.org/10.1017/CBO9781107415324.016, 2013. a
Chevallier, F., Zheng, B., Broquet, G., Ciais, P., Liu, Z., Davis, S. J., Deng, Z., Wang, Y., Breon, F.-M., and O'Dell, C. W.: Local anomalies in the column-averaged dry air mole fractions of carbon dioxide across the globe during the first months of the coronavirus recession, Geophys. Res. Lett., 47, e2020GL090244, https://doi.org/10.1029/2020GL090244, 2020. a
Deser, C., Magnusdottir, G., Saravanan, R., and Phillips, A.: The effects of North Atlantic SST and sea ice anomalies on the winter circulation in CCM3. Part II: Direct and indirect components of the response, J. Climate, 17, 877–889, https://doi.org/10.1175/1520-0442(2004)017<0877:TEONAS>2.0.CO;2, 2004. a
Deser, C., Phillips, A., Bourdette, V., and Teng, H.: Uncertainty in climate change projections: the role of internal variability, Clim. Dynam., 38, 527–546, https://doi.org/10.1007/s00382-010-0977-x, 2012. a
Diamond, M. S. and Wood, R.: Limited regional aerosol and cloud microphysical changes despite unprecedented decline in nitrogen oxide pollution during the February 2020 COVID-19 shutdown in China, Geophys. Res. Lett., 47, e2020GL088913, https://doi.org/10.1029/2020GL088913, 2020. a
Dow, W. J., Maycock, A. C., Lofverstrom, M., and Smith, C. J.: The effect of anthropogenic aerosols on the Aleutian Low, J. Climate, 34, 1725–1741, https://doi.org/10.1175/JCLI-D-20-0423.1, 2021. a, b
Elleby, C., Dominguez, I. P., Adenauer, M., and Genovese, G.: Impacts of the COVID-19 pandemic on the global agricultural markets, Environ. Resour. Econ., 76, 1067–1079, https://doi.org/10.1007/s10640-020-00473-6, 2020. a
Fiedler, S., Wyser, K., Rogelj, J., and van Noije, T.: Radiative effects of reduced aerosol emissions during the COVID-19 pandemic and the future recovery, Atmos. Res., 264, 105866, https://doi.org/10.1016/j.atmosres.2021.105866, 2021. a, b, c
Forster, P. M., Lamboll, R. D., and Rogelj, J.: Emissions changes in 2020 due to Covid-19 (v4.0), Zenodo [data set], https://doi.org/10.5281/zenodo.3957826, 2020a. a
Forster, P. M., Forster, H. I., Evans, M. J., Gidden, M. J., Jones, C. D., Keller, C. A., Lamboll, R. D., Le Quéré, C., Rogelj, J., Rosen, D., Schleussner, C.-F., Richardson, T. B., Smith, C. J., and Turnock, S. T.: Current and future global climate impacts resulting from COVID-19, Nat. Clim. Change, 10, 913–919, https://doi.org/10.1038/s41558-020-0883-0, 2020b. a, b, c, d, e, f, g, h, i, j, k, l
Friedlingstein, P., O'Sullivan, M., Jones, M. W., Andrew, R. M., Hauck, J., Olsen, A., Peters, G. P., Peters, W., Pongratz, J., Sitch, S., Le Quéré, C., Canadell, J. G., Ciais, P., Jackson, R. B., Alin, S., Aragão, L. E. O. C., Arneth, A., Arora, V., Bates, N. R., Becker, M., Benoit-Cattin, A., Bittig, H. C., Bopp, L., Bultan, S., Chandra, N., Chevallier, F., Chini, L. P., Evans, W., Florentie, L., Forster, P. M., Gasser, T., Gehlen, M., Gilfillan, D., Gkritzalis, T., Gregor, L., Gruber, N., Harris, I., Hartung, K., Haverd, V., Houghton, R. A., Ilyina, T., Jain, A. K., Joetzjer, E., Kadono, K., Kato, E., Kitidis, V., Korsbakken, J. I., Landschützer, P., Lefèvre, N., Lenton, A., Lienert, S., Liu, Z., Lombardozzi, D., Marland, G., Metzl, N., Munro, D. R., Nabel, J. E. M. S., Nakaoka, S.-I., Niwa, Y., O'Brien, K., Ono, T., Palmer, P. I., Pierrot, D., Poulter, B., Resplandy, L., Robertson, E., Rödenbeck, C., Schwinger, J., Séférian, R., Skjelvan, I., Smith, A. J. P., Sutton, A. J., Tanhua, T., Tans, P. P., Tian, H., Tilbrook, B., van der Werf, G., Vuichard, N., Walker, A. P., Wanninkhof, R., Watson, A. J., Willis, D., Wiltshire, A. J., Yuan, W., Yue, X., and Zaehle, S.: Global Carbon Budget 2020, Earth Syst. Sci. Data, 12, 3269–3340, https://doi.org/10.5194/essd-12-3269-2020, 2020. a
Fyfe, J. C., Kharin, V. V., Swart, N., Flato, G. M., Sigmond, M., and Gillett, N. P.: Quantifying the influence of short-term emission reductions on climate, Science Advances, 7, eabf7133, https://doi.org/10.1126/sciadv.abf7133, 2021. a, b
Gettelman, A., Lamboll, R., Bardeen, C. G., Forster, P. M., and Watson-Parris, D.: Climate impacts of COVID-19 induced emission changes, Geophys. Res. Lett., 48, e2020GL091805, https://doi.org/10.1029/2020GL091805, 2021. a, b, c, d, e, f
Gillett, N. P., Shiogama, H., Funke, B., Hegerl, G., Knutti, R., Matthes, K., Santer, B. D., Stone, D., and Tebaldi, C.: The Detection and Attribution Model Intercomparison Project (DAMIP v1.0) contribution to CMIP6, Geosci. Model Dev., 9, 3685–3697, https://doi.org/10.5194/gmd-9-3685-2016, 2016. a
Gkatzelis, I, G., Gilman, J. B., Brown, S. S., Eskes, H., Gomes, A. R., Lange, A. C., McDonald, B. C., Peischl, J., Petzold, A., Thompson, C. R., and Kiendler-Scharr, A.: The global impacts of COVID-19 lockdowns on urban air pollution: A critical review and recommendations, Elementa-Science of the Anthropocene, 9, 00176, https://doi.org/10.1525/elementa.2021.00176, 2021. a, b, c, d, e
Hersbach, H., Bell, B., Berrisford, P., Biavati, G., Horányi, A., Muñoz Sabater, J., Nicolas, J., Peubey, C., Radu, R., Rozum, I., Schepers, D., Simmons, A., Soci, C., Dee, D., and Thépaut, J.-N.: ERA5 monthly averaged data on pressure levels from 1959 to present, Copernicus Climate Change Service (C3S) Climate Data Store (CDS) [data set], https://doi.org/10.24381/cds.6860a573, 2019. a
Hersbach, H., Bell, B., Berrisford, P., Hirahara, S., Horanyi, A., Munoz-Sabater, J., Nicolas, J., Peubey, C., Radu, R., Schepers, D., Simmons, A., Soci, C., Abdalla, S., Abellan, X., Balsamo, G., Bechtold, P., Biavati, G., Bidlot, J., Bonavita, M., De Chiara, G., Dahlgren, P., Dee, D., Diamantakis, M., Dragani, R., Flemming, J., Forbes, R., Fuentes, M., Geer, A., Haimberger, L., Healy, S., Hogan, R. J., Holm, E., Janiskova, M., Keeley, S., Laloyaux, P., Lopez, P., Lupu, C., Radnoti, G., de Rosnay, P., Rozum, I., Vamborg, F., Villaume, S., and Thepaut, J.-N.: The ERA5 global reanalysis, Q. J. Roy. Meteor. Soc., 146, 1999–2049, https://doi.org/10.1002/qj.3803, 2020. a
Jones, C. D., Hickman, J. E., Rumbold, S. T., Walton, J., Lamboll, R. D., Skeie, R. B., Fiedler, S., Forster, P. M., Rogelj, J., Abe, M., Botzet, M., Calvin, K., Cassou, C., Cole, J. N. S., Davini, P., Deushi, M., Dix, M., Fyfe, J. C., Gillett, N. P., Ilyina, T., Kawamiya, M., Kelley, M., Kharin, S., Koshiro, T., Li, H., Mackallah, C., Mueller, W. A., Nabat, P., van Noije, T., Nolan, P., Ohgaito, R., Olivie, D., Oshima, N., Parodi, J., Reerink, T. J., Ren, L., Romanou, A., Seferian, R., Tang, Y., Timmreck, C., Tjiputra, J., Tourigny, E., Tsigaridis, K., Wang, H., Wu, M., Wyser, K., Yang, S., Yang, Y., and Ziehn, T.: The climate response to emissions reductions due to COVID-19: Initial results from CovidMIP, Geophys. Res. Lett., 48, e2020GL091883, https://doi.org/10.1029/2020GL091883, 2021. a, b, c, d, e, f, g, h
Krüger, O. O., Holanda, B. A., Chowdhury, S., Pozzer, A., Walter, D., Pöhlker, C., Andrés Hernández, M. D., Burrows, J. P., Voigt, C., Lelieveld, J., Quaas, J., Pöschl, U., and Pöhlker, M. L.: Black carbon aerosol reductions during COVID-19 confinement quantified by aircraft measurements over Europe, Atmos. Chem. Phys., 22, 8683–8699, https://doi.org/10.5194/acp-22-8683-2022, 2022. a
Lamboll, R. D., Jones, C. D., Skeie, R. B., Fiedler, S., Samset, B. H., Gillett, N. P., Rogelj, J., and Forster, P. M.: Modifying emissions scenario projections to account for the effects of COVID-19: protocol for CovidMIP, Geosci. Model Dev., 14, 3683–3695, https://doi.org/10.5194/gmd-14-3683-2021, 2021. a, b, c, d
Le, T., Wang, Y., Liu, L., Yang, J., Yung, Y. L., Li, G., and Seinfeld, J. H.: Unexpected air pollution with marked emission reductions during the COVID-19 outbreak in China, Science, 369, 702–706, https://doi.org/10.1126/science.abb7431, 2020. a
Le Quéré, C., Jackson, R. B., Jones, M. W., Smith, A. J. P., Abernethy, S., Andrew, R. M., De-Gol, A. J., Willis, D. R., Shan, Y., Canadell, J. G., Friedlingstein, P., Creutzig, F., and Peters, G. P.: Temporary reduction in daily global CO2 emissions during the COVID-19 forced confinement, Nat. Clim. Change, 10, 647–653, https://doi.org/10.1038/s41558-020-0797-x, 2020. a, b, c, d
Lewinschal, A., Ekman, A. M. L., and Kornich, H.: The role of precipitation in aerosol-induced changes in Northern Hemisphere wintertime stationary waves, Clim. Dynam., 41, 647–661, https://doi.org/10.1007/s00382-012-1622-7, 2013. a, b, c, d
Liu, L., Shawki, D., Voulgarakis, A., Kasoar, M., Samset, B. H., Myhre, G., Forster, P. M., Hodnebrog, O., Sillmann, J., Aalbergsjo, S. G., Boucher, O., Faluvegi, G., Iversen, T., Kirkevag, A., Lamarque, J. F., Olivie, D., Richardson, T., Shindell, D., and Takemura, T.: A PDRMIP multimodel study on the impacts of regional aerosol forcings on global and regional precipitation, J. Climate, 31, 4429–4447, https://doi.org/10.1175/JCLI-D-17-0439.1, 2018. a, b, c
Lund, M. T., Myhre, G., and Samset, B. H.: Anthropogenic aerosol forcing under the Shared Socioeconomic Pathways, Atmos. Chem. Phys., 19, 13827–13839, https://doi.org/10.5194/acp-19-13827-2019, 2019. a
Ming, Y. and Ramaswamy, V.: Nonlinear climate and hydrological responses to aerosol effects, J. Climate, 22, 1329–1339, https://doi.org/10.1175/2008JCLI2362.1, 2009. a
Ming, Y., Ramaswamy, V., and Chen, G.: A model investigation of aerosol-induced changes in boreal winter extratropical circulation, J. Climate, 24, 6077–6091, https://doi.org/10.1175/2011JCLI4111.1, 2011. a, b, c
Ming, Y., Lin, P., Paulot, F., Horowitz, L. W., Ginoux, P. A., Ramaswamy, V., Loeb, N. G., Shen, Z., Singer, C. E., Ward, R. X., Zhang, Z., and Bellouin, N.: Assessing the influence of COVID-19 on the shortwave radiative fluxes over the East Asian Marginal Seas, Geophys. Res. Lett., 48, e2020GL091699, https://doi.org/10.1029/2020GL091699, 2021. a, b, c, d, e
Myhre, G., Samset, B., Forster, P., Hodnebrog, Ã., Sandstad, M., Mohr, C., Sillmann, J., Stjern, C., Andrews, T., Boucher, O., Faluvegi, G., Iversen, T., Lamarque, J.-F., Kasoar, M., Kirkevåg, A., Kramer, R., Liu, L., Mülmenstädt, J., Olivié, D., and Watson-Parris, D.: Scientific data from Precipitation Driver Response Model Intercomparison Project, Sci., 9, 123, https://doi.org/10.1038/s41597-022-01194-9, 2022. a
O'Neill, B. C., Tebaldi, C., van Vuuren, D. P., Eyring, V., Friedlingstein, P., Hurtt, G., Knutti, R., Kriegler, E., Lamarque, J.-F., Lowe, J., Meehl, G. A., Moss, R., Riahi, K., and Sanderson, B. M.: The Scenario Model Intercomparison Project (ScenarioMIP) for CMIP6, Geosci. Model Dev., 9, 3461–3482, https://doi.org/10.5194/gmd-9-3461-2016, 2016. a
O'Reilly, C. H., Befort, D. J., Weisheimer, A., Woollings, T., Ballinger, A., and Hegerl, G.: Projections of northern hemisphere extratropical climate underestimate internal variability and associated uncertainty, Commun. Earth Environ., 2, 194, https://doi.org/10.1038/s43247-021-00268-7, 2021. a
Persad, G. G. and Caldeira, K.: Divergent global-scale temperature effects from identical aerosols emitted in different regions, Nat. Commun., 9, 3289, https://doi.org/10.1038/s41467-018-05838-6, 2018. a, b
Qin, J. C. and Robinson, W. A.: On the Rossby-wave source and the steady linear-response to tropical forcing, J. Atmos. Sci., 50, 1819–1823, https://doi.org/10.1175/1520-0469(1993)050<1819:OTRWSA>2.0.CO;2, 1993. a
Rodwell, M. J. and Hoskins, B. J.: Subtropical anticyclones and summer monsoons, J. Climate, 14, 3192–3211, https://doi.org/10.1175/1520-0442(2001)014<3192:SAASM>2.0.CO;2, 2001. a
Samset, B. H., Myhre, G., Forster, P. M., Hodnebrog, O., Andrews, T., Faluvegi, G., Flaeschner, D., Kasoar, M., Kharin, V., Kirkevag, A., Lamarque, J.-F., Olivie, D., Richardson, T., Shindell, D., Shine, K. P., Takemura, T., and Voulgarakis, A.: Fast and slow precipitation responses to individual climate forcers: A PDRMIP multimodel study, Geophys. Res. Lett., 43, 2782–2791, https://doi.org/10.1002/2016GL068064, 2016. a, b
Samset, B. H., Lund, M. T., Bollasina, M., Myhre, G., and Wilcox, L.: Emerging Asian aerosol patterns, Nat. Geosci., 12, 582–584, https://doi.org/10.1038/s41561-019-0424-5, 2019. a, b, c
Sandford, A.: Coronavirus: Half of humanity now on lockdown as 90 countries call for confinement, euronews, https://www.euronews.com/2020/04/02/coronavirus-in-europe-spain-s-death-toll-hits-10-000-after-record-950-new-deaths-in-24-hou (last access: 5 August 2022), 2020. a
Shepherd, T. G.: Atmospheric circulation as a source of uncertainty in climate change projections, Nat. Geosci., 7, 703–708, https://doi.org/10.1038/NGEO2253, 2014. a
Sohrabi, C., Alsafi, Z., O'Neill, N., Khan, M., Kerwan, A., Al-Jabir, A., Iosifidis, C., and Agha, R.: World Health Organization declares global emergency: A review of the 2019 novel coronavirus (COVID-19), Int. J. Surg., 76, 71–76, https://doi.org/10.1016/j.ijsu.2020.02.034, 2020. a
Stjern, C. W., Samset, B. H., Myhre, G., Forster, P. M., Hodnebrog, O., Andrews, T., Boucher, O., Faluvegi, G., Iversen, T., Kasoar, M., Kharin, V., Kirkevag, A., Lamarque, J.-F., Olivie, D., Richardson, T., Shawki, D., Shindell, D., Smith, C. J., Takemura, T., and Voulgarakis, A.: Rapid adjustments cause weak surface temperature response to increased black carbon concentrations, J. Geophys. Res.-Atmos., 122, 11462–11481, https://doi.org/10.1002/2017JD027326, 2017. a
Szopa, S., Naik, V.and Adhikary, B., Artaxo, P., Berntsen, T., Collins, W. D., Fuzzi, S., Gallardo, L., Kiendler Scharr, A., Klimont, Z., Liao, H., Unger, N., and Zanis, P.: Short-lived climate forcers, in: Climate change 2021: The physical science basis. Contribution of working group I to the sixth assessment report of the Intergovernmental Panel on Climate Change, edited by: Masson-Delmotte, V., Zhai, P., Pirani, A., Connors, S. L., Péan, C., Berger, S., Caud, N., Chen, Y., Goldfarb, L., Gomis, M. I., Huang, M., Leitzell, K., Lonnoy, E., Matthews, J. B. R., Maycock, T. K., Waterfield, T., Yelekçi, O., Yu, R., and Zhou, B., chap. 6, Cambridge University Press, 817–922, https://www.ipcc.ch/report/ar6/wg1/chapter/chapter-6/ (last access: 15 January 2023), 2021. a, b, c, d
Takaya, K. and Nakamura, H.: A formulation of a phase-independent wave-activity flux for stationary and migratory quasigeostrophic eddies on a zonally varying basic flow, J. Atmos. Sci., 58, 608–627, https://doi.org/10.1175/1520-0469(2001)058<0608:AFOAPI>2.0.CO;2, 2001. a
Tang, T., Shindell, D., Samset, B. H., Boucher, O., Forster, P. M., Hodnebrog, Ø., Myhre, G., Sillmann, J., Voulgarakis, A., Andrews, T., Faluvegi, G., Fläschner, D., Iversen, T., Kasoar, M., Kharin, V., Kirkevåg, A., Lamarque, J.-F., Olivié, D., Richardson, T., Stjern, C. W., and Takemura, T.: Dynamical response of Mediterranean precipitation to greenhouse gases and aerosols, Atmos. Chem. Phys., 18, 8439–8452, https://doi.org/10.5194/acp-18-8439-2018, 2018. a
Twomey, S.: Influence of pollution on shortwave albedo of clouds, J. Atmos. Sci., 34, 1149–1152, https://doi.org/10.1175/1520-0469(1977)034<1149:TIOPOT>2.0.CO;2, 1977. a
Undorf, S., Polson, D., Bollasina, M. A., Ming, Y., Schurer, A., and Hegerl, G. C.: Detectable impact of local and remote anthropogenic aerosols on the 20th century changes of West African and South Asian monsoon precipitation, J. Geophys. Res.-Atmos., 123, 4871–4889, https://doi.org/10.1029/2017JD027711, 2018. a
van Heerwaarden, C. C., Mol, W. B., Veerman, M. A., Benedict, I., Heusinkveld, B. G., Knap, W. H., Kazadzis, S., Kouremeti, N., and Fiedler, S.: Record high solar irradiance in Western Europe during first COVID-19 lockdown largely due to unusual weather, Commun. Earth Env., 2, 37, https://doi.org/10.1038/s43247-021-00110-0, 2021. a
Venter, Z. S., Aunan, K., Chowdhury, S., and Lelieveld, J.: COVID-19 lockdowns cause global air pollution declines, P. Natl. Acad. Sci. USA, 117, 18984–18990, https://doi.org/10.1073/pnas.2006853117, 2020. a
Wang, Z., Lin, L., Xu, Y., Che, H., Zhang, X., Zhang, H., Dong, W., Wang, C., Gui, K., and Xie, B.: Incorrect Asian aerosols affecting the attribution and projection of regional climate change in CMIP6 models, NPJ Clim. Atmos. Sci., 4, 2, https://doi.org/10.1038/s41612-020-00159-2, 2021. a
Westervelt, D. M., Conley, A. J., Fiore, A. M., Lamarque, J.-F., Shindell, D. T., Previdi, M., Mascioli, N. R., Faluvegi, G., Correa, G., and Horowitz, L. W.: Connecting regional aerosol emissions reductions to local and remote precipitation responses, Atmos. Chem. Phys., 18, 12461–12475, https://doi.org/10.5194/acp-18-12461-2018, 2018. a
Westervelt, D. M., Mascioli, N. R., Fiore, A. M., Conley, A. J., Lamarque, J.-F., Shindell, D. T., Faluvegi, G., Previdi, M., Correa, G., and Horowitz, L. W.: Local and remote mean and extreme temperature response to regional aerosol emissions reductions, Atmos. Chem. Phys., 20, 3009–3027, https://doi.org/10.5194/acp-20-3009-2020, 2020. a, b, c
Wilcox, L. J., Dunstone, N., Lewinschal, A., Bollasina, M., Ekman, A. M. L., and Highwood, E. J.: Mechanisms for a remote response to Asian anthropogenic aerosol in boreal winter, Atmos. Chem. Phys., 19, 9081–9095, https://doi.org/10.5194/acp-19-9081-2019, 2019. a, b, c, d, e, f, g
Williams, A. I. L., Stier, P., Dagan, G., and Watson-Parris, D.: Strong control of effective radiative forcing by the spatial pattern of absorbing aerosol, Nat. Clim. Change, 12, 735–742, https://doi.org/10.1038/s41558-022-01415-4, 2022. a, b
World Climate Research Programme (WCRP): CovidMIP data, CMIP6-CEDA, https://esgf-index1.ceda.ac.uk/search/cmip6-ceda/, last access: 15 January 2023. a
Xie, X., Myhre, G., Liu, X., Li, X., Shi, Z., Wang, H., Kirkevåg, A., Lamarque, J.-F., Shindell, D., Takemura, T., and Liu, Y.: Distinct responses of Asian summer monsoon to black carbon aerosols and greenhouse gases, Atmos. Chem. Phys., 20, 11823–11839, https://doi.org/10.5194/acp-20-11823-2020, 2020. a
Yang, Y., Ren, L., Li, H., Wang, H., Wang, P., Chen, L., Yue, X., and Liao, H.: Fast climate responses to aerosol emission reductions during the COVID-19 pandemic, Geophys. Res. Lett., 47, e2020GL089788, https://doi.org/10.1029/2020GL089788, 2020. a, b