the Creative Commons Attribution 4.0 License.
the Creative Commons Attribution 4.0 License.
 | 04 Aug 2023
Measurement report: A 1-year study to estimate maritime contributions to PM10 in a coastal area in northern France
Frédéric Ledoux
Cloé Roche
Gilles Delmaire
Gilles Roussel
Olivier Favez
Dominique Courcot
This work focuses on filling the knowledge gap associated with the contribution of natural and anthropogenic marine emissions to PM10 concentrations in northern France. For this purpose, a 1-year measurement and sampling campaign for PM10 has been conducted at a French coastal site situated at the Strait of Dover. The characterization of PM10 samples was performed considering major and trace elements, water-soluble ions, organic carbon (OC), elemental carbon (EC), and organic markers of biomass burning and primary biogenic emissions. Furthermore, the source apportionment of PM10 was achieved using the constrained weighted non-negative matrix factorization (CW-NMF) model. The annual average PM10 was 24.3 µg m−3, with six species contributing 69 % of its mass (NO, OC, SO, Cl−, Na+, and NH). The source apportionment of PM10 led to the identification of 9 sources. On average yearly, fresh and aged sea salts contributed 37 % of PM10, while secondary nitrate and sulfate contributed 42 %, biomass burning contributed 8 %, and heavy-fuel-oil (HFO) combustion from shipping emissions contributed almost 5 %. Additionally, monthly evolution of the sources' contribution evidenced different behaviors with high contributions of secondary nitrate and biomass burning during winter. In the summer season, 15-times-higher concentrations for HFO combustion (July compared to January) and the predominance of aged sea salts versus fresh sea salts were observed.The concentration-weighted trajectory model showed that the sources contributing more than 80 % of PM10 at Cap Gris-Nez are of regional and/or long-range origins, with the North Sea and the English Channel as hotspots for natural and anthropogenic marine emissions and Belgium, the Netherlands, and the west of Germany as hotspots for secondary inorganic aerosols.
- Article
(2416 KB) - Full-text XML
-
Supplement
(2025 KB) - BibTeX
- EndNote


Maritime transport is considered nowadays to be a crucial transportation system used to ship goods and people over long distances. Due to globalization of production processes and the growth of global trade, this means of transportation has been increasing, with over 80 % of the volume of international trade of goods carried by sea in the last decades (Marmer et al., 2009; UNCTAD, 2021). In the meantime, shipping is known to be a significant atmospheric source of pollutants, especially near harbors and surrounding coastal areas (Contini and Merico, 2021; Jonson et al., 2020; Ausmeel et al., 2020). It is an important source of carbon monoxide (CO), nitrogen oxides (NOx), sulfur oxides (SOx), volatile organic compounds (VOCs), and particulate matter (Lv et al., 2018; Seppälä et al., 2021). In particular, several studies have highlighted the impact of shipping emissions on human health (Andersson et al., 2009; Corbett et al., 2007) since most of their emissions are estimated to occur within 400 km of land (Endresen et al., 2003; Jutterström et al., 2021). According to Zhang et al. (2021), 94 200 premature deaths worldwide were associated with particulate matter (PM) exposure due to maritime shipping in 2015.
Over the last decades, European countries have made great effort to reduce emissions from several anthropogenic sources such as road traffic, industry, and power generation, which led to the indirect increase in the contribution of shipping to the overall anthropogenic emissions (Viana et al., 2014). In order to reduce shipping emissions, different coastal areas (such as the North Sea, the English Channel, and the Baltic Sea) have been classified as sulfur emission control areas (SECAs) (EEA, 2013). In the latter areas, the sulfur content in marine fuels was limited to 0.1 % starting 2015, after it was 1 % between 2010 and 2015 and 1.5 % before 2010 (Tang et al., 2020). The European Union has set a limit of 0.1 % sulfur content in fuel on ships at berth at EU ports since 2010 (EEA, 2021).
Several papers in the literature have estimated the contributions from shipping emissions (combustion of heavy fuel oil, HFO) to air quality across Europe and mainly focused on coastal areas of Italy, Spain, and Ireland (Mazzei et al., 2008; Viana et al., 2009; Pandolfi et al., 2011; Becagli et al., 2012; Contini et al., 2011; Hellebust et al., 2010; Donateo et al., 2014; Viana et al., 2014; Cesari et al., 2014; Bove et al., 2016; Amato et al., 2009). The annual mean contributions to PM in these studies varied between 1 % and 12 %. However, there were no studies focusing on the maritime contribution to PM in coastal areas of France and more specifically in the southern North Sea region, which encompasses large harbors in different areas such as Dunkirk, Calais, Rotterdam, and Antwerp (EEA, 2013).
In northern France, studies focusing on the characterization of PM10 and the identification of its emission sources were conducted in urban and industrial areas (Crenn et al., 2015; Kfoury et al., 2016; Waked et al., 2014; Rimetz-Planchon et al., 2008; Ledoux et al., 2017). However, coastline sites can also be impacted by high levels of particulate matter in the atmospheric background even without any direct influence from urban and/or industrial sources. On one hand, this might be due to the long-range transport influence as well as the gas-to-particle conversion (Waked et al., 2014; Matthias et al., 2010). On the other hand, there is still a lack of information regarding the impact of natural maritime emissions such as sea salts (Manders et al., 2010) and anthropogenic emissions such as marine traffic. It is worth noting that the southern North Sea is considered to have one of the highest ship traffic densities in the world (EEA, 2013). This is due to the fact that the northern France region is bordered by the North Sea and the English Channel, which together with the Strait of Dover form a narrow corridor with one of the highest shipping concentrations in the world (EEA, 2013).
According to Ledoux et al. (2018), the impact of shipping emissions on PM10 concentration in the Calais urban area may increase to an average of 30 µg m−3 when compared to background levels in the situation where the winds are blowing from the whole harbor area. Ship emissions led to a marked increase in PM10 mass of 78.9 µg m−3 for a 1 min time interval.
Several years before 2013, the EU issued Directive 2008/50/EC, which limits daily PM10 concentrations to 50 µg m−3, with a maximum of 35 d of exceedance authorized per year. The directive is binding and forces countries that do not comply with it to seek solutions for improvement. In this period, several regions in France were concerned by the high number of exceedances, especially in and around Paris as well as in the northern, the eastern, and the southeastern parts of the country (EEA, 2014). This is why it was important to focus on the PM10 fraction in order to understand the reasons behind these exceedances on a regional and national scale.
The main objective of this work is to understand the impact of emissions from the maritime sector in coastal areas in northern France. Therefore, a 1-year PM10 sampling and measurement campaign was conducted in 2013 at Cap Gris-Nez, a French coastal site situated at the Strait of Dover. The collected samples were chemically characterized for their carbonaceous, ionic, and elemental fractions, as well as some organic tracers. Additionally, PM10 sources were apportioned and studied, specifically natural emissions such as sea sprays and anthropogenic emissions linked to maritime traffic. This paper also highlights the seasonal variations in these PM10 sources and the study of the regional influence. Even though the sampling campaign was conducted in 2013, and the regulations in SECAs have evolved since, this study is still relevant today due to the scarcity of literature studies at the Strait of Dover, which is considered to be one of the world's busiest shipping lanes. Additionally, despite the International Maritime Organization (IMO) regulation for the global sulfur limit of 0.5 % in ship fuel oil in effect since January 2020, different countries are still adopting higher sulfur limits. It is worth noting that these limits were only set for sulfur content in marine fuels in order to reduce not only SO2 emissions but also primary PM emissions (Zetterdahl et al., 2016; Shen and Li, 2020). Hence, this study aims at highlighting the contribution of natural and anthropogenic marine emissions to PM10 concentrations at a French rural coastal site.
2.1 Sampling site
The PM10 filter sampling was conducted at Cap Gris-Nez, located in northern France. It is a rural coastal site (50∘52′08′′ N, 1∘35′49′′ E; 50 m altitude) located on the edge of a cliff, 200 m from the sea and therefore strongly subject to marine influence from wind sectors 210 to 50∘ via the north (Fig. 1). The Strait of Dover, connecting the English Channel and the North Sea, is an intense navigation area with more than 500 boats passing every day (passage of oil tankers, merchant ships, and fishing boats). It is considered to be a strategic passage between northern Europe and China on one hand and the Americas on the other through the ports of Antwerp, Rotterdam, and Hamburg, representing nearly a quarter of the world's freight traffic.
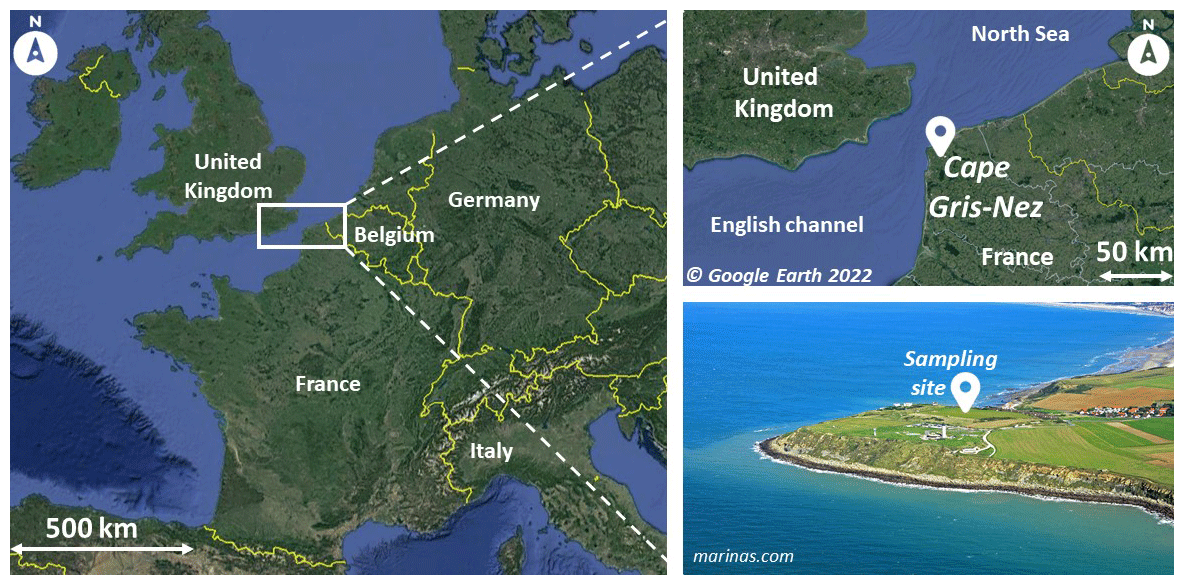
Figure 1Location of the sampling site (© Google Earth).
The sampling site is far from major continental pollution sources. The nearest town to the sampling site is Boulogne-sur-Mer, which is 16 km to the south, while Calais – the city with the fourth-largest port in France – is about 21 km to the northeast. The A16 motorway is at a minimum distance of 10 km to the southeast. It is also worth noting that the study area is located in a SECA where sulfur content was limited to 1 % (between 2010 and 2015) for marine vessels, including passenger ships, and 0.1 % for ships docked at the port since the sampling was conducted in 2013.
2.2 Sample collection
The PM10 sampling and measurement campaign was carried out on a 24 h basis from 1 January 2013 to 17 April 2014. During the sampling period, PM10 concentrations were monitored using a MP101 beta gauge analyzer (Environment SA®). The analyzer was calibrated at the beginning of the campaign and routinely checked by the regional air quality network Atmo Hauts-de-France. Moreover, PM10 samples were collected onto 150 mm Pall® Tissuquartz™ 2500 QAT-UP filters (no binder) using an automated high-volume sampler (DA80, Digitel®, Switzerland) operating at 30 m3 h−1. Filters were pre-heated for 4 h at 450 ∘C before sampling to decrease the impurities. In total, 362 samples were collected in 2013 and 107 in 2014. Field blanks (two per month) were also considered by placing a blank filter under sampling conditions but without pumping. Additionally, meteorological data (temperature and wind speed and direction) were recorded on site using the WMT 52 ultrasonic wind sensor (Vaisala WINDCAP) coupled to the Digitel® DA80.
Among these samples, 158 (122 in 2013 and 36 in 2014) corresponding to a sampling of 1 d over 3 d, 64 (51 in 2013 and 13 in 2014) corresponding to wind directions under-represented by the selection done by a sampling of 1 d over 3 d (non-exceedance days), and 20 (11 in 2013 and 9 in 2014) representing exceedance days were chosen for the chemical analysis and the source apportionment. We only present the results of the 122 samples representing a sampling of 1 d over 3 d in 2013.
2.3 PM10 chemical characterization
PM10 chemical characterization included the analysis of the carbonaceous subfractions (organic carbon, OC, and elemental carbon, EC), major and trace elements, water-soluble ions, and some organic tracers. The detailed methods can be found in the Supplement and are briefly presented hereafter.
The analysis of OC and EC was done using a thermo-optical technique implementing the EUSAAR-2 protocol (Cavalli et al., 2010). Major and trace elements were analyzed following the protocol described in Ledoux et al. (2006) and Kfoury et al. (2016). Major elements (Al, Ba, Fe, Mn, P, Sr, Ti, and Zn) were analyzed by inductively coupled plasma atomic emission spectrometry (ICP-AES), while trace elements (V, Cr, Ni, Sc, Co, Cu, As, Rb, Nb, Ag, Cd, Sn, Sb, Te, La, Ce, Tl, Pb, and Bi) were analyzed by ICP coupled to a mass spectrometer (ICP–MS). Cl−, SO, NO, Ca2+, Mg2+, K+, Na+, and NH were analyzed by liquid ion chromatography following the protocol detailed in Ledoux et al. (2006) and Fadel et al. (2022). Finally, the analysis of organic compounds included the characterization of anhydrosugars (levoglucosan, mannosan, and galactosan), sugar alcohols (arabitol and mannitol), and monosaccharides (glucose and mannose) by high-performance liquid chromatography (HPLC) coupled to a pulsed amperometric detector (PAD) (Srivastava et al., 2018).
2.4 Data analysis
2.4.1 Constrained weighted non-negative matrix factorization (CW-NMF)
A constrained weighted non-negative factorization (CW-NMF) model was applied in this study in order to identify and quantify the contribution of the sources to PM10 concentrations. This model, developed by the LISIC (Laboratoire d'Informatique Signal et Image de la Côte d'Opale) at the University of Littoral Côte d'Opale, has the same principles as the United States Environmental Protection Agency Positive Matrix Factorization model (USEPA PMF; Delmaire et al., 2010; Kfoury, 2013; Limem et al., 2014; Scerri et al., 2023, 2019). Moreover, the model was adjusted in order to guide it in its calculations by adding constraints. The constraints added to this model are of two types: the “equality” constraints that define the presence or the absence of an element in the profile and the “boundary” constraints that impose a wide range of values in which the optimal solution can be found. These constraints were added in order to consider the “a priori” knowledge of the chemical composition of the sources. For example, the concentration of levoglucosan was set to zero in all the profiles except for the biomass burning source. Further details regarding the model can be found in Ledoux et al. (2017) and Kfoury et al. (2016).
The input data of the model consisted of the concentrations of 25 species in the 242 samples as well as their uncertainties. The chosen species were OC; EC; water-soluble ions (Cl−, SO, NO, Ca2+, Mg2+, K+, Na+, and NH); elements (Al, Fe, P, Sr, Ti, Zn, V, Ni, Co, Cu, Cd, Sb, and Pb); and organic tracers, namely levoglucosan for biomass burning and the sum of the concentrations of sugar alcohols and monosaccharides (named polyols) as tracers for primary biogenic emissions. Uncertainties were calculated by summing errors related to the analytical and sampling procedures. For trace elements, an uncertainty of 10 % was added to the calculated uncertainty, as is usually reported (Prendes et al., 1999). Species concentration below the detection limit (D.L.) was replaced by D.L. 2 and given an uncertainty of 100 %. Missing data were replaced by the mean value and assigned an uncertainty of 400 % (Polissar et al., 1998; Kim et al., 2004). Additionally, the stability of the solution was evaluated by bootstrap analysis. It is based on the same principles of the bootstrap analysis used in EPA PMF 5.0. The profile of a source was validated if more than 80 % of the bootstrap profiles were correlated (with r>0.6) to the reference one (the one obtained by considering the original dataset).
2.4.2 Conditional bivariate probability function (CBPF)
The conditional bivariate probability function (CBPF) combines wind speed with the conditional probability function (CPF). The latter is calculated as the probability that the concentration of a species, in a certain wind direction, is greater than a specific concentration value (which is the 75th percentile concentration of the different species in this study). CBPF will help to further understand the dependencies of the sources to the wind speed (Uria-Tellaetxe and Carslaw, 2014). These representations were drawn using the open-source software R and the openair package (Carslaw, 2015). The dataset used consisted of the species concentrations for each PM10 sample for the 24 h period distributed amongst the 48 corresponding wind speeds and directions (one measurement every 30 min). With that, the full dataset used to draw these representations counts 122×48 lines.
2.4.3 Concentration-weighted trajectory (CWT) approach
The concentration-weighted trajectory (CWT) approach investigates potential transport of pollutants and/or sources over large geographical scales (Polissar et al., 2001). It consists of combining species concentrations and/or source contributions with back trajectories and uses residence time information to identify air parcels that might be responsible for high concentrations observed at the receptor site (Petit et al., 2017).
Air mass back trajectories were calculated using the HYSPLIT model considering the Gridded Meteorological Data Archives (GDAS1). For each sample, eight 72 h backward trajectories were assigned, and the source contribution values for the 24 h period were combined with the corresponding trajectories. These representations were achieved through the ZeFir 4.0 software, which is an Igor-based package (Petit et al., 2017).
3.1 PM10 concentration and composition
The concentrations of PM10 as well as the concentrations of OC, EC, water-soluble ions, and elements are reported in Table 1, and the concentrations of the analyzed organic tracers are reported in Table 2. The yearly mean concentration of PM10 for the 362 samples was 22.8 µg m−3 in 2013. As for the 122 samples corresponding to a sampling of 1 d over 3 d, the mean PM10 is 24.3 µg m−3. The closeness of the two values is indicative that the sample selection is representative of the whole year. These values are higher than the WHO PM10 annual guideline value of 20 µg m−3 that was applicable in 2013 (WHO, 2006) and the new annual guideline value of 15 µg m−3 (WHO, 2021). Even though it is a rural site, the average PM10 concentration found at Cap Gris-Nez (CGN) was similar to the ones reported for urban and industrial sites in the northern region of France in 2013 (24 µg m−3) (Atmo, 2013), suggesting that PM10 sources were mainly of regional influence rather than local (Ledoux et al., 2018).
Table 1Average, standard deviation (SD), and minimum (min) and maximum (max) concentrations of PM10 and its chemical components (OC, EC, water-soluble ions in micrograms per cubic meter, and elements in nanograms per cubic meter) at Cap Gris-Nez (CGN) during the sampling period in 2013.
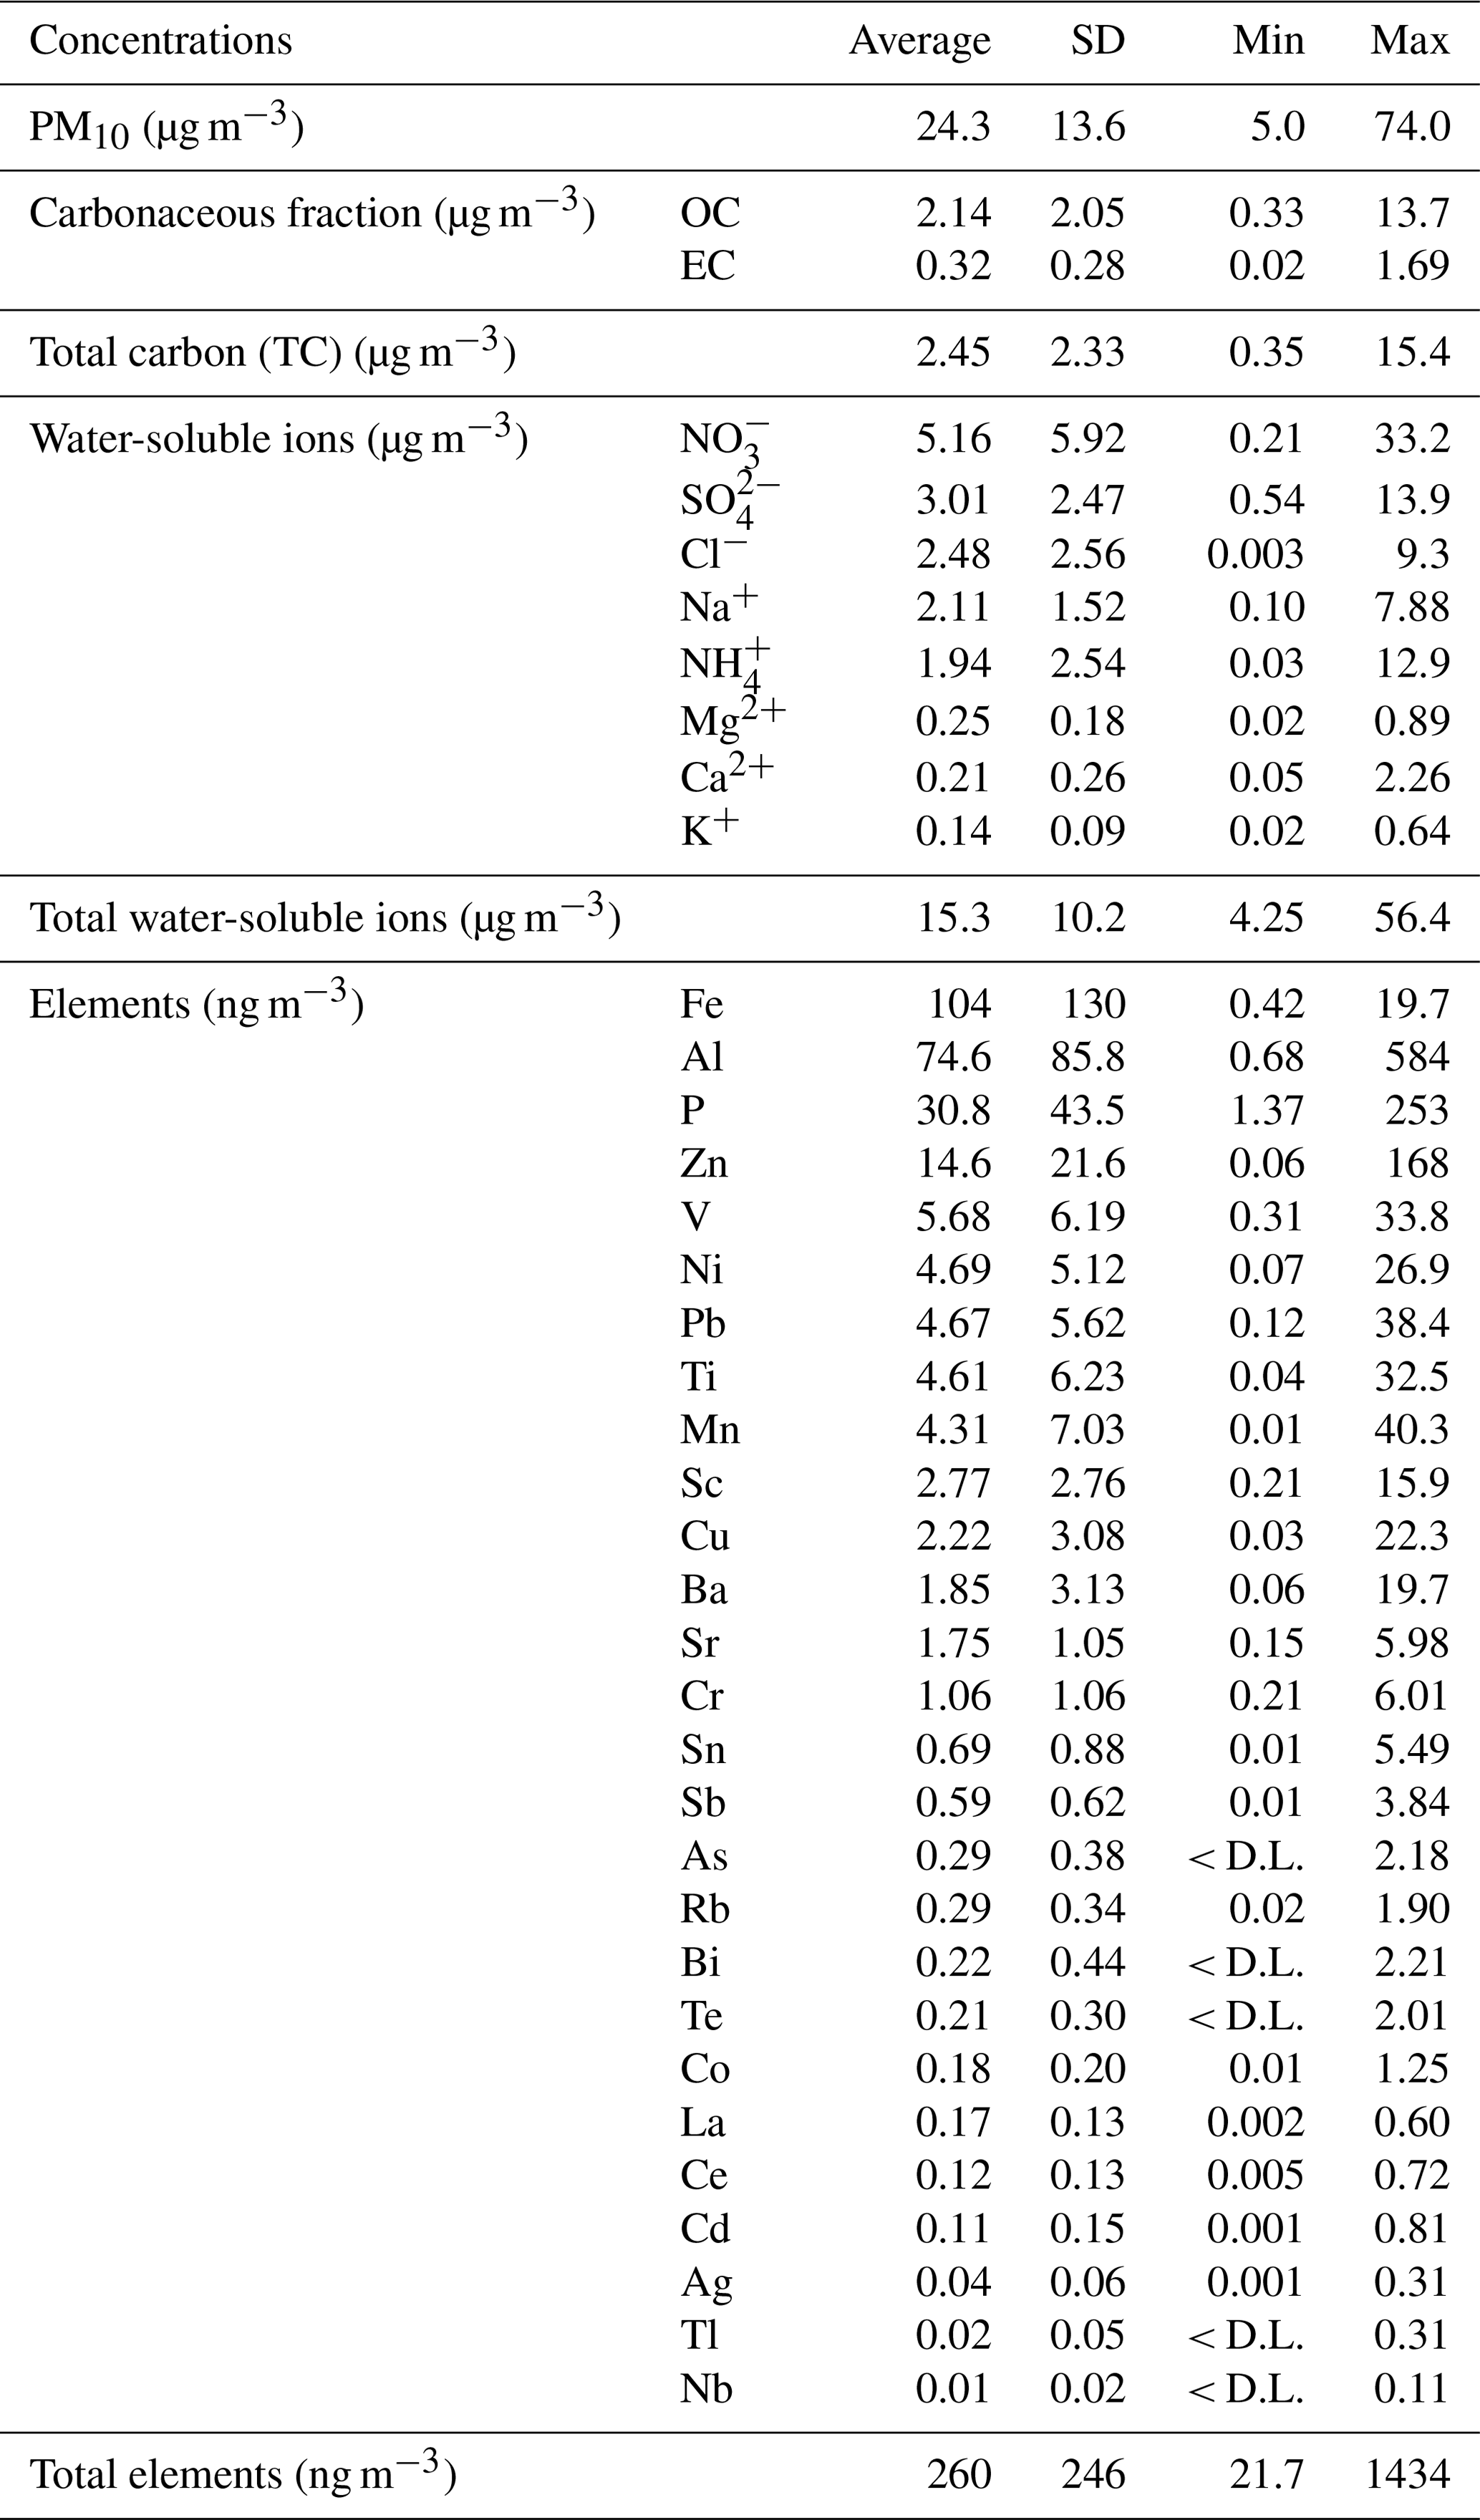
The predominant chemical species were OC, Cl−, Na+, and secondary inorganic ions (NO, SO, and NH), accounting for 69 % of the average PM10 concentrations (Table 1). Secondary inorganic ions are found in the atmosphere due to the gas-to-particle conversion of their corresponding precursors (NOx, SO2, and NH3) emitted by different anthropogenic activities. The neutralization ratio between NH and the sum of SO and NO close to 1 shows that ammonium is predominately found in the atmosphere as ammonium sulfate and ammonium nitrate. The evaluation of the concentration ratios between SO and NH on one hand and SO NO and NH on the other hand shows that ammonium nitrate (67 %) is approximately twice as abundant compared to ammonium sulfate (33 %).
Na+ and Cl− are typical seawater components and highlight the importance of the marine influence on air quality at the investigated site. Most of the other analyzed species contribute less than 0.1 % of the average PM10 concentration, with the exception of EC (1.3 %), Mg2+ (1 %), Ca2+ (0.9 %), K+ (0.6 %), Al (0.3 %), Fe (0.4 %), and levoglucosan (0.2 %) (Tables 1 and 2).
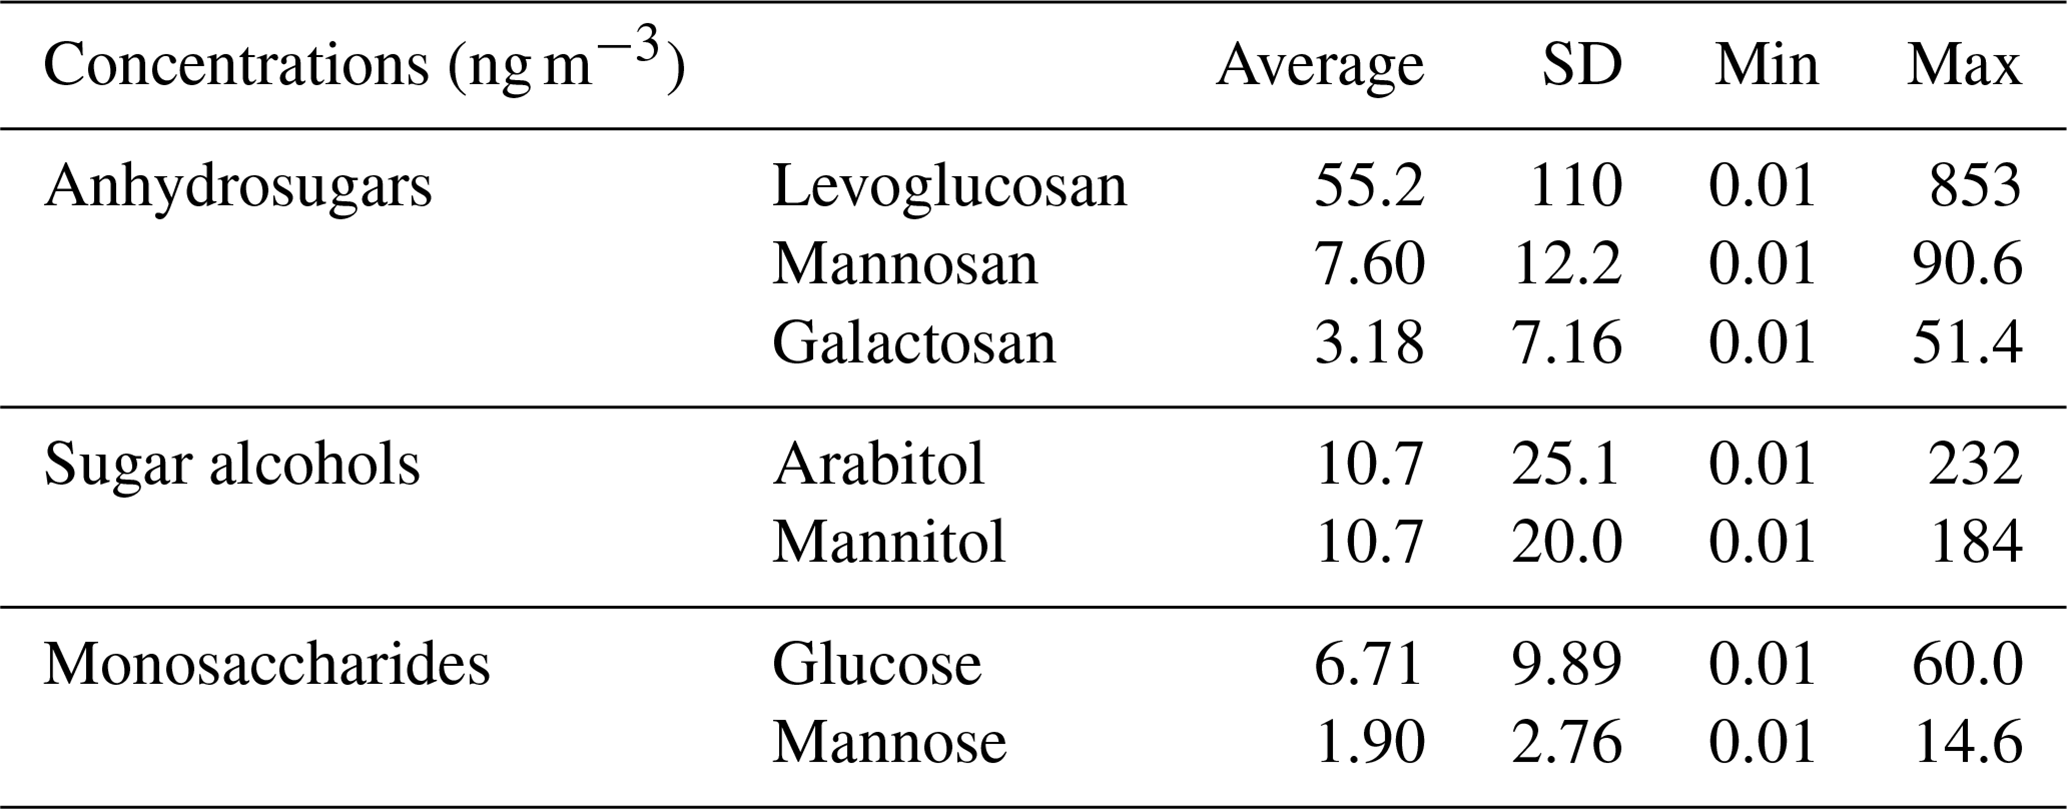
Table 2Average, standard deviation (SD), and minimum (min) and maximum (max) concentrations of organic tracer species (ng m−3) in PM10 at Cap Gris-Nez (CGN) during the sampling period in 2013.
OC and EC showed a very strong correlation during the sampling period (r=0.89, p<0.05), meaning that these species were mainly emitted from the same sources. According to the literature, OC-to-EC concentration ratios between 0.3 and 1 were reported for vehicles running on diesel, and higher values were reported for biomass burning (3.4–14), while emissions from heavy-fuel-oil vessels show OC-to-EC ratios higher than 10 (Zhang et al., 2020; Moldanová et al., 2009; Fadel et al., 2022; Khan et al., 2021). The OC-to-EC ratio obtained in this study varied between 2.7 and 26.3, with an average ratio of 7.6. The high variability in the OC-to-EC ratio shows that these species are emitted from several sources, and the interval found highlights that the traffic exhaust emissions might not contribute highly to the emissions of carbonaceous matter at CGN.
The polar plot representations of OC and EC showed that the highest concentrations of carbonaceous matter were observed for winds blowing from the northeastern (NE) and southeastern (SE) sectors consisting mainly of continental winds (Fig. S1a and b). Furthermore, a pollution rose of the OC-to-EC ratio was done in order to understand if different sources of carbonaceous matter exist in the different wind sectors (Fig. S1c). Without considering the wind speed parameter, the highest OC-to-EC ratios were observed in the southwestern sector (values higher than 10), followed by the northeastern (NE) and southeastern (SE) sectors, where values were between 6 and 10.
The evaluation of the polar plot representation of the OC-to-EC ratio (Fig. S1d) shows that ratios higher than 20 are observed in the southwestern sector when wind speed is higher than 10 m s−1 (Fig. S1d). When examining the concentrations of OC and EC in these samples, the high OC-to-EC ratios were mainly due to the low EC concentrations (<200 ng m−3) found in these samples under maritime influence, which increases the obtained values of the considered ratio. When removing these samples, OC-to-EC ratios were observed to be higher than 6 in the northeastern and southwestern sectors, emphasizing the influence of shipping emissions, biomass burning, and primary biogenic emissions (Fig. S1e).
Anhydrosugars are mainly considered to be tracers of biomass burning (Vincenti et al., 2022). These compounds show higher concentrations during the cold periods of the year. The average concentration of these compounds was 185 ng m−3 between January and March 2013, 45 ng m−3 between November and December and 22 ng m−3 for the rest of the year (warmer months). According to the literature, a high levoglucosan-to-mannosan concentration ratio (close to 15) is indicative of hardwood combustion, while low values (between 2 and 6) are mainly attributed to softwood combustion (Schmidl et al., 2008). The average ratio in this study is 7.3, which may be considered to be indicative of a mix between the two types of wood.
Finally, the sugar alcohols and monosaccharides identified in this study are mainly of primary biogenic emissions. These compounds show concentrations during summer (June–August 2013) that are at least 3 times higher compared to the rest of the sampling days in 2013 (64 vs. 19 ng m−3, respectively). Similar observations were reported by Samaké et al. (2019) at 28 French sites, where the maximum concentrations were observed in the summer season. This might be linked to higher-temperature and higher-humidity conditions in summer that lead to the growth and sporulation of fungal and prokaryotic cell activity (Samaké et al., 2019).
3.2 Source profiles
A progressive approach has been adopted in order to find the best solution by CW-NMF, consisting of increasing the number of factors and evaluating the profiles. The best results were obtained for the nine-factor solution. The stability of the results was examined via bootstrap analysis, and the different source profiles satisfied the validation criterion (Table S1) with a mapping percentage of at least 99 % (higher than 80 %), showing the robustness of the obtained solution. Additionally, the reconstructed and observed PM10 concentrations were very strongly correlated (slope of 0.96, r2=0.99) (Fig. S2). Furthermore, the different species considered in the CW-NMF model were well reconstructed, with slopes close to 1 (varying between 0.8 and 1.1) and r2 higher than 0.8 (Fig. S2).
The normalized profiles of the nine identified sources at CGN are presented in Fig. 2, and the profiles along with the 25th and 75th percentiles calculated via the bootstrap analysis can be found in Fig. S3. The time series of the different profiles are presented in the Supplement (Fig. S4). Additionally, the distribution of the chemical species in the nine identified sources is presented in Fig. S5.
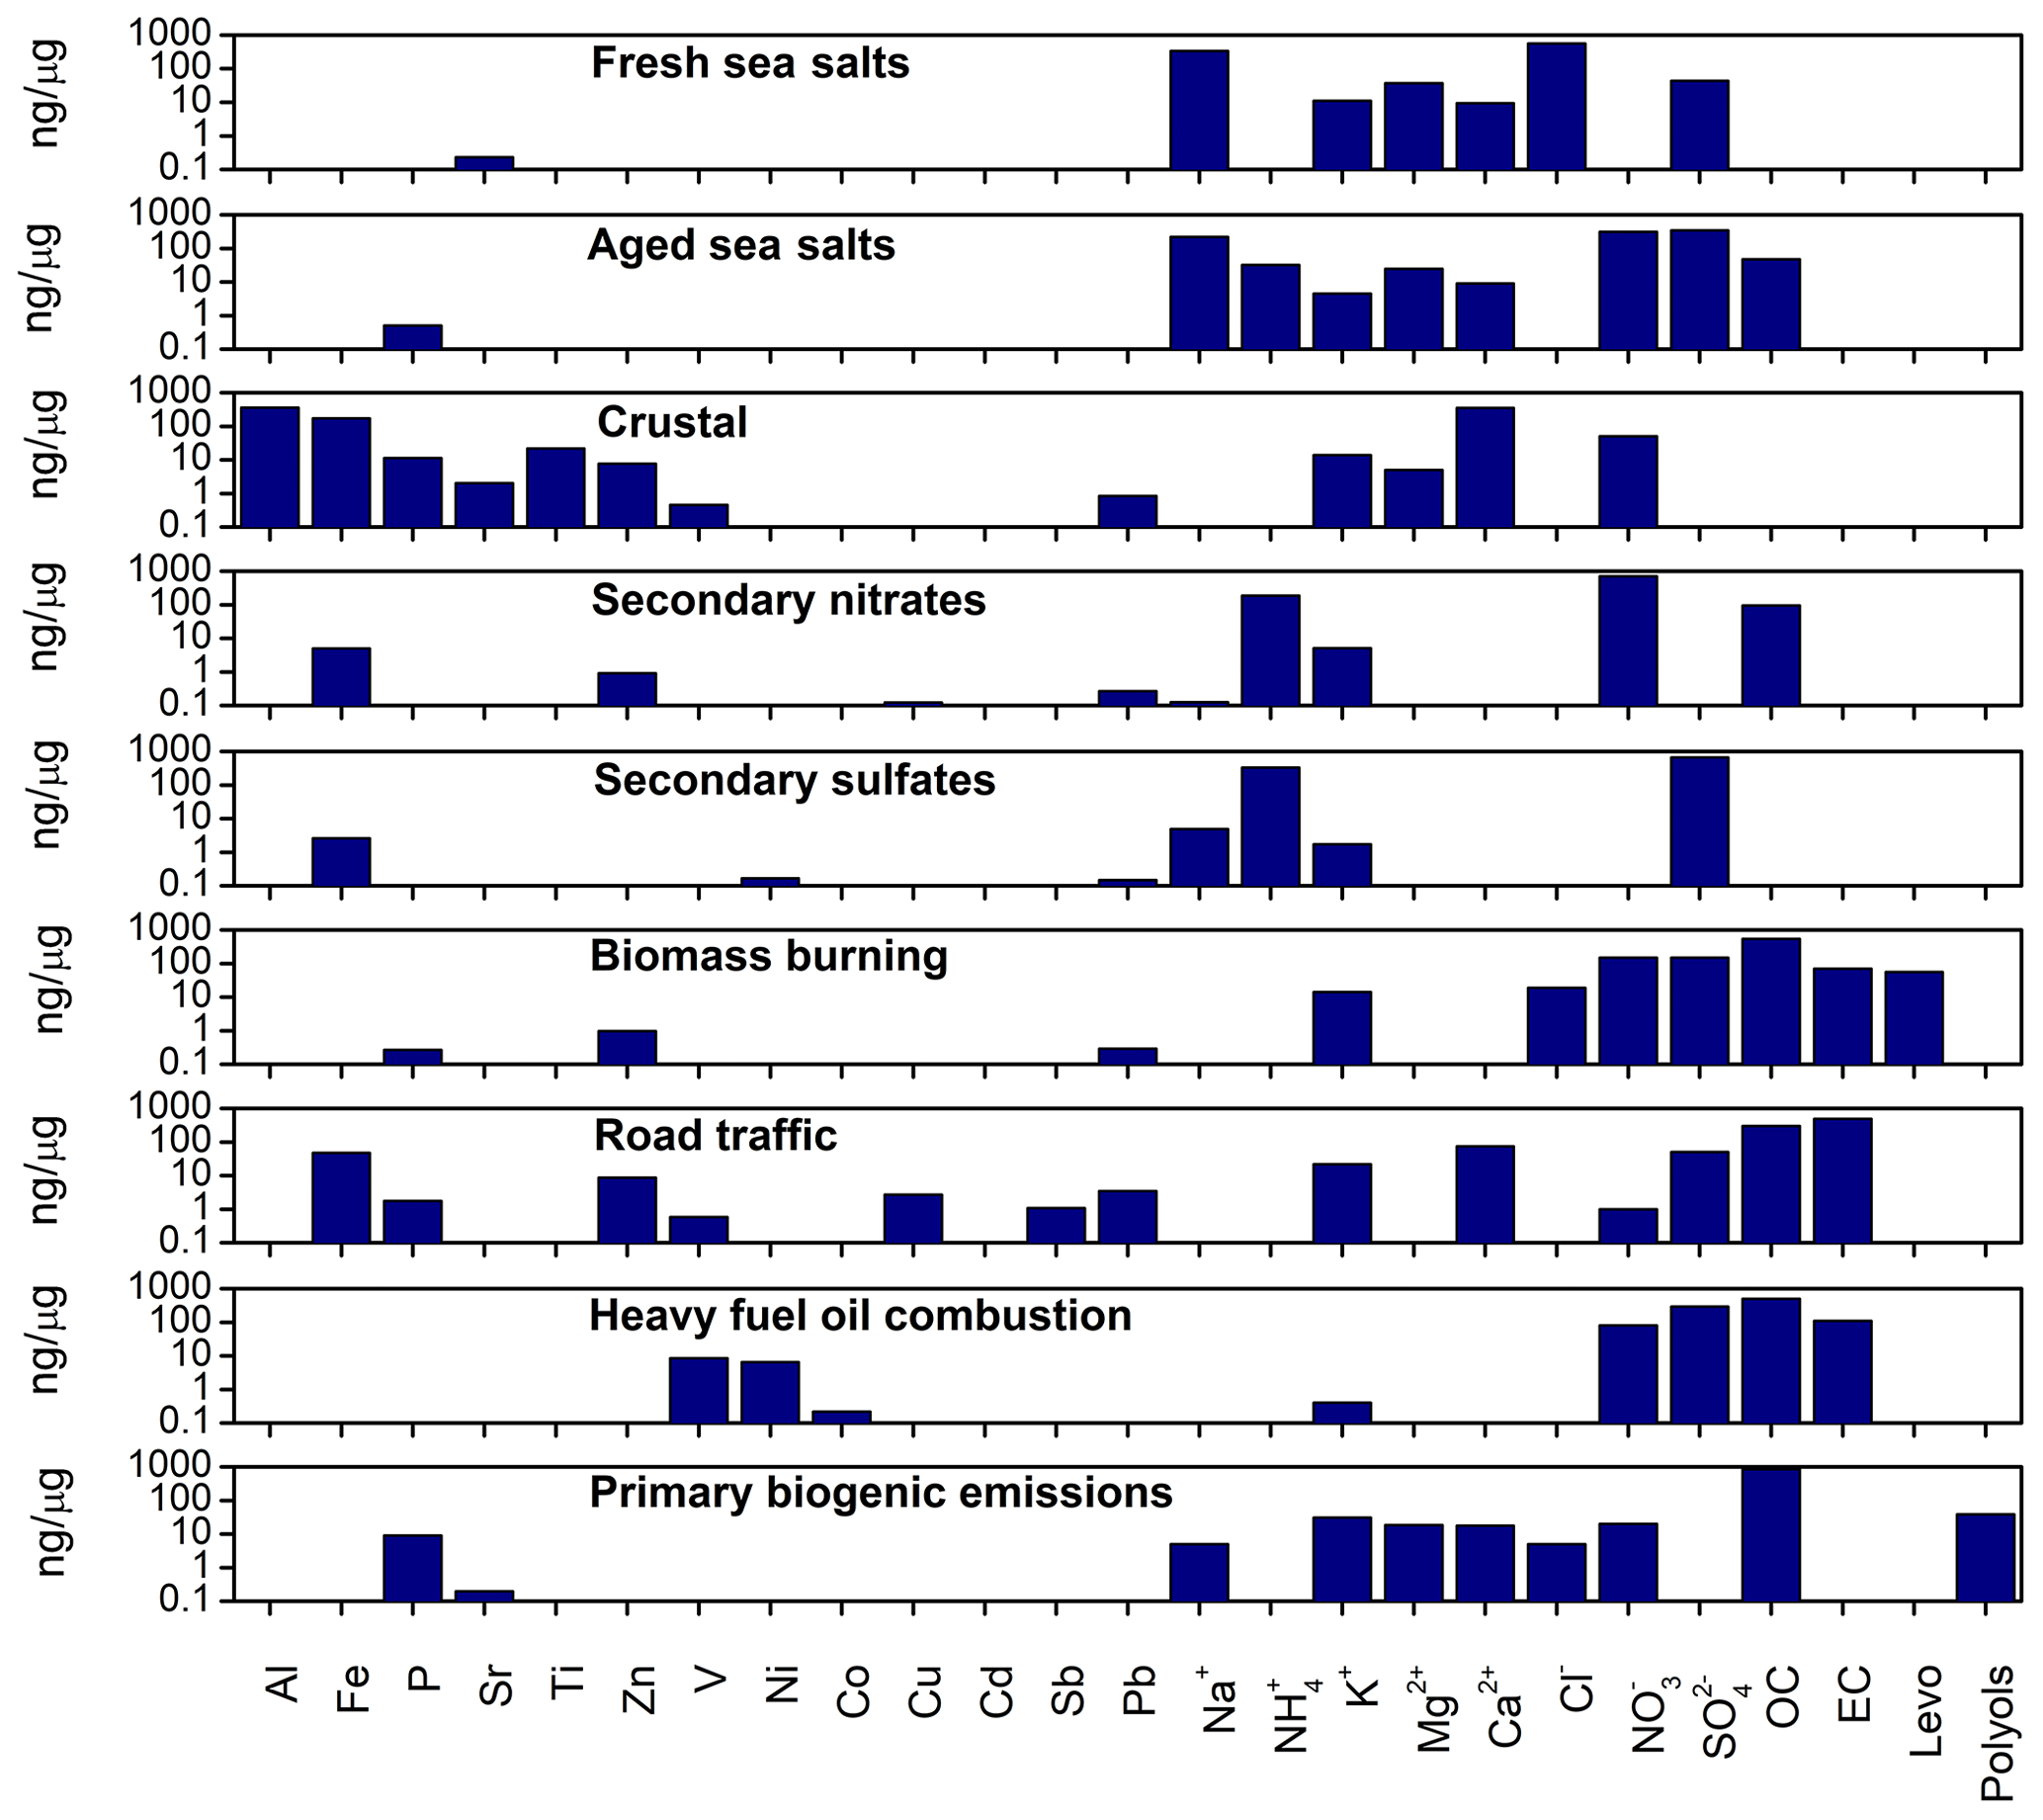
Two profiles related to sea salt emissions were identified. The first profile shows the highest loading of Na+ and Cl− between the profiles (Fig. S5), with an average Cl−-to-Na+ ratio of 1.7, which is commonly observed for fresh sea salts (Seinfeld and Pandis, 2016). This profile also included other ionic species such as K+, Mg2+, Ca2+, and SO. The concentration ratios between the other ionic species were also valid for seawater composition: , , , and . The second source profile was dominated by high contributions of Na+, but no Cl− was found. This might be due to the Cl− depletion resulting from the reaction between sea salts and NOx and SO2 gas (Seinfeld and Pandis, 2006). Cl− was compensated by much higher contributions of NO and SO in this profile compared to the fresh sea salts as well as some elements from anthropogenic origins, leading to the attribution of this profile to aged sea salts. The ionic balance is respected in this factor, with a cation-to-anion ratio of 1.14.
The third profile contained a high proportion of Al, Fe, Ca2+, and K+, which are mainly the signature of crustal dust resuspension (Moreno et al., 2013). Two profiles show high loadings of secondary inorganic ions: the first one shows high loadings of NO and NH and was identified as “secondary nitrate”, while the second one shows an abundance of SO and NH and was ascribable to “secondary sulfate”. The secondary nitrate profile also shows a considerable contribution of OC as well as some elements from anthropogenic origins. The presence of these species in the profile is mainly linked to the aging of the secondary inorganic aerosols and/or the effect of mixing with particles emitted from combustion sources (Koçak et al., 2015; Kfoury et al., 2016).
The following profile was attributed to biomass burning due to the presence of levoglucosan, OC, and EC, as well as K+, SO, and NO (Fadel et al., 2022). The OC-to-levoglucosan concentration ratio found in this profile (which is equal to 9.6) is within the range found in different studies for wood burning (between 7 and 17) (Fine et al., 2002). Additionally, the OC-to-EC ratio, which is found to be equal to 7.8, is also indicative of biomass burning emissions (Sonwani et al., 2021).
A profile attributed to road traffic was identified due to high loading of species emitted from the exhaust emissions (such as OC and EC) as well as elements emitted from non-exhaust emissions (such as Fe, Al, Zn, Cu, and Sb). The OC-to-EC ratio of 0.6 is within the range of diesel traffic exhaust (0.3–1) (Amato et al., 2011; Waked et al., 2014).
The heavy-fuel-oil (HFO) combustion profile was composed of high loadings of carbonaceous matter (OC and EC) as well as high contributions of V, Ni, NO, and SO. The concentration of OC in this profile is 4.5 times higher than EC, which is consistent with other studies (Zhang et al., 2016). The evaluation of the V-to-Ni concentration ratio shows a value of 1.3 in this study, which is lower than the ones usually found (close to 3) from shipping emissions (Pandolfi et al., 2011; Becagli et al., 2012). Similar observations (V-to-Ni ratio of 1.6) were previously reported for other sites in the northern region of France (Ledoux et al., 2017). This is mainly due to the position of the sampling sites reported in the latter study as well as the site of this study, which are located in a SECA where sulfur content in marine fuels is limited to 1 % during the sampling period in 2013, whereas the sites reported by Pandolfi et al. (2011) and Becagli et al. (2012) were not. The quality of the fuel with low sulfur content used for shipping was shown to have low V and Ni content as well, thus changing their ratio (Zhang et al., 2016; Streibel et al., 2017). Gregoris et al. (2016) also found concentration ratios that were less than 3 in Venice, and the species were mainly attributed to HFO combustion from shipping.
Finally, the primary-biogenic-emissions factor was identified due to the high contribution of carbonaceous matter as well as the sum of sugar alcohols and monosaccharides, considered to be tracers of the source (Bauer et al., 2008). Additionally, we can observe a contribution of P in the profile. It is known that one of the sources of atmospheric P might be primary biogenic emissions (Shi et al., 2019).
3.3 PM10 source contributions
The average contribution of the nine sources to the PM10 concentration at CGN in 2013 is presented in Fig. 3. The secondary-inorganic-aerosol sources, namely secondary nitrate and secondary sulfate, contribute the most to the PM10 concentration, with a cumulative contribution of 42 % (8.2 µg m−3). The concentrations of secondary inorganic aerosols found in our study are higher than those found in Lens, an urban background site in northern France, for a study in 2011–2012 (28 % of PM10, 5.9 µg m−3) and in Nogent-sur-Oise, an urban site in northern France in 2013 (27 % of PM10, 7.1 µg m−3) (Oliveira, 2017; Waked et al., 2014).
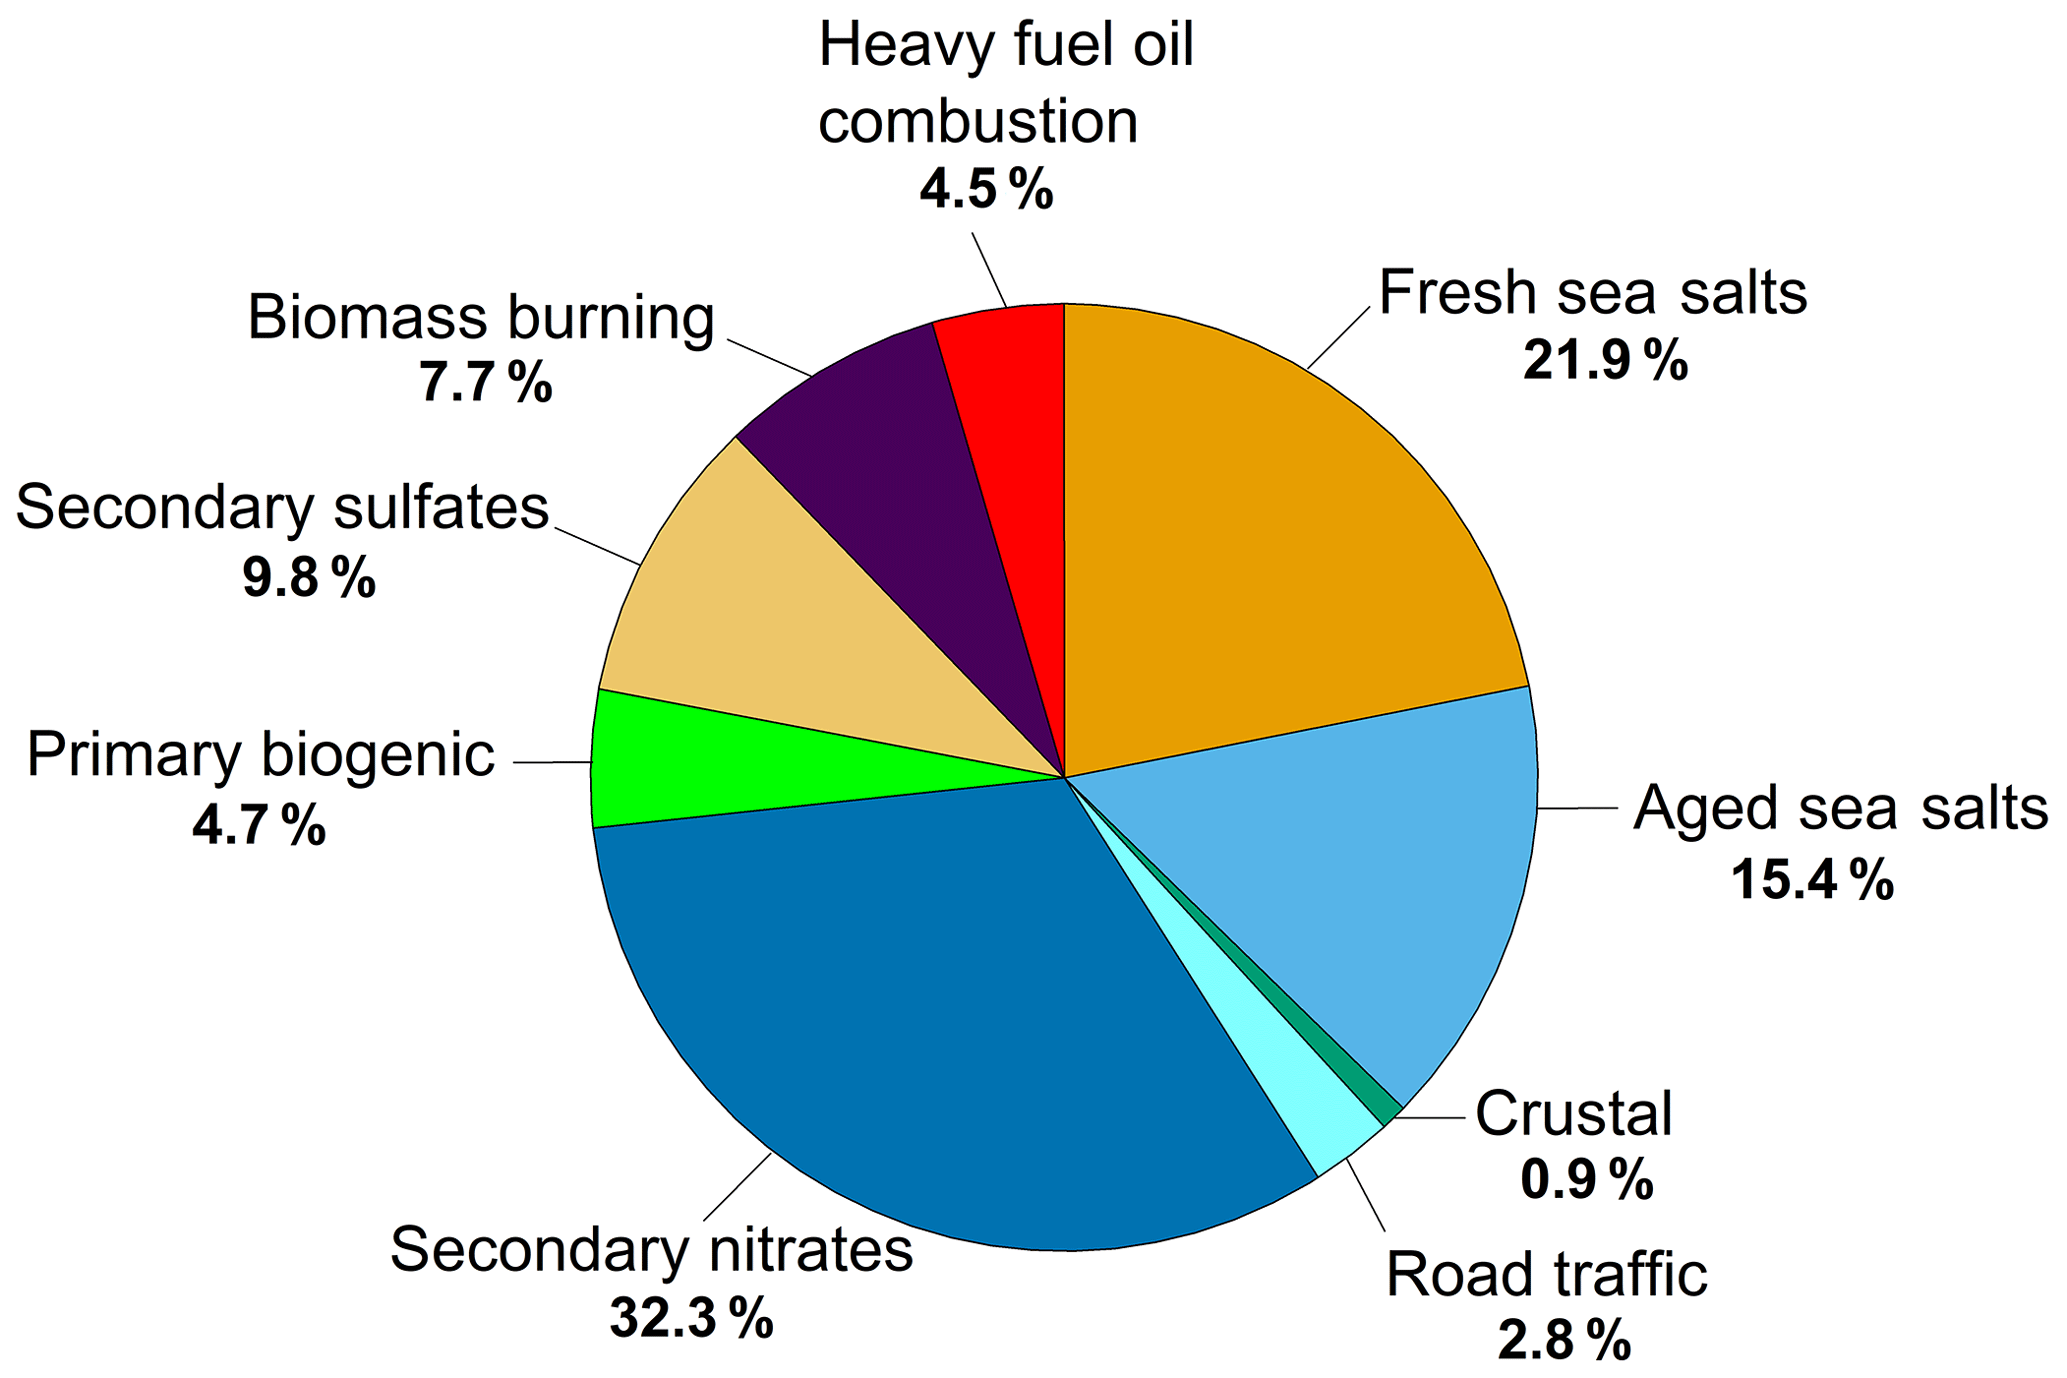
The sea salts (fresh and aged) contribute together 37 % of the PM10 concentration (7.2 µg m−3) (Table S2), with a higher contribution found from the fresh sea salts compared to the aged ones. These contributions are found to be higher than those found for non-coastal sites in the northern region such as in Rouen between 2010 and 2011 (21 % of PM10, 4.6 µg m−3) and in Lens between 2011 and 2012 (8 % of PM10, 1.6 µg m−3) (Waked et al., 2014; Favez et al., 2011), showing the high influence of sea spray emissions at the CGN site.
Biomass burning is also considered to be an important source of PM10 at CGN, contributing 8 % (1.5 µg m−3) (Table S2). This phenomenon is mainly observed at rural sites, where wood burning for residential heating is remarkably high (Golly et al., 2019). The contribution found in this study is similar to the yearly average concentration found in France for biomass burning, estimated at 2.5±1.2 µg m−3 (Favez et al., 2021). This source is considered to be the largest contributor to organic aerosols, influencing the overall urban air quality in the country (Favez et al., 2021).
The four remaining sources contribute together 12.8 % of PM10 (Fig. 3). Due to the rural typology of the site, the road traffic contribution to PM10 (2.8 %, 0.54 µg m−3) is lower than those found in Lens (6 %, 1.2 µg m−3) and at other urban sites in France (15±7 % of PM10) (Waked et al., 2014; Weber et al., 2021). It is important to mention that at CGN, the contribution of HFO combustion that might be mainly related to shipping emissions (4.5 %) is higher than the road traffic contribution. This percentage is in the range of the contribution from shipping emissions (1 %–7 %) to PM10 in different European coastal areas (Barcelona, Venice, Melilla, Algeciras, Lampedusa) (Pandolfi et al., 2011; Becagli et al., 2012; Viana et al., 2014; Amato et al., 2009; Viana et al., 2009). In addition to the contribution of shipping emissions to the PM10 mass concentration, Viana et al. (2014) reported that this source may also influence new particle formation and thus further contribute to the air quality degradation. It is worth noting that the contribution to PM10 presented in this work corresponds to the direct emissions from the source. However, considerable amounts of SO2 and NOx can be emitted from shipping activity and, by gas-to-particle conversion, can be transformed into secondary compounds that largely contribute to PM mass. Ledoux et al. (2018) reported that the impact of shipping in the harbor of Calais in northern France could be ascribed to estimated average NO, SO2, and NO2 concentrations of 35 %, 51 %, and 15 %, respectively. Nevertheless, the transformation reaction of SO2 emitted from the shipping emissions to SO is probably not at equilibrium yet, and SO2 emissions may contribute to the formation of more SO than the quantity sampled close to the sea.
3.4 Monthly variations in the major PM10 sources
The monthly variations in the contributions of the nine identified sources at CGN in 2013 are presented in Fig. S6. Secondary inorganic aerosols (secondary nitrate and sulfate) show a similar trend, with higher contributions recorded during the winter period. In this study, the highest contribution for ammonium nitrate was recorded in March (14 µg m−3 on average), when PM pollution episodes in western Europe are dominated by secondary aerosols (Petit et al., 2019).
Secondary nitrate shows higher contributions during spring (March–May) and lower contributions during summer (June–August) compared to ammonium sulfate. This might be partially explained by the meteorological conditions and the semi-volatility of nitrate, while ammonium sulfate is considered to be more thermally stable (Petit et al., 2019). Similar seasonal trends were observed by Waked et al. (2014) and Weber et al. (2019). Biomass burning shows a strong seasonality, with the highest contributions during the cold period (January to March) due to wood burning for residential heating. The average contribution of biomass burning to PM10 during these 3 months is 15.4 %, which is twice as high as the average contribution during the whole year (Fig. S6).
Fresh and aged sea salts as well as HFO combustion from shipping emissions, which contribute together 42 % of PM10 during the total sampling period, also show some temporal differences and are presented in Fig. 4, which also presents their conditional bivariate probability function (CBPF) plots in order to further interpret the highest contributions observed for these sources. Different trends of contributions were observed for the fresh and aged sea salts. Higher contributions of fresh-sea-salt sources were recorded in November (6.9 µg m−3) and in December (7.5 µg m−3), while those of aged sea salts were recorded in May (5.6 µg m−3) and June (5.4 µg m−3). Additionally, the aged-sea-salt contribution is found to be lower than the fresh salts throughout the sampling period except for summer months, when the average concentration contributions of aged sea salts were 2.7 and 2.0 µg m−3 compared to 2.0 and 0.7 µg m−3 for fresh sea salts in July and August, respectively. The main reason for these differences might be the meteorological conditions as well as the seasonality. Indeed, the CBPF representation of fresh sea salts clearly evidenced that the maximum concentrations were observed for winds blowing from the southwestern (SW) and northeastern (NE) wind sectors and for medium to high wind speeds (>10 m s−1). This is mainly due to the position of the sampling site, strongly subjected to fresh marine influence from wind sectors 210 to 50∘ via the north, corresponding to the English Channel and the North Sea, respectively (Fig. 1). These wind directions were predominant during all months of the year except for the summer season, which could explain the higher concentrations of fresh compared to aged sea salts. On the other hand, the maximum concentrations of aged sea salts were obtained when the wind blew from the northeastern wind sector with wind speeds higher than 10 m s−1 (Fig. 4). This might be explained by the reaction of the fresh sea salts with SO2 and NO2, which also show the highest concentrations in the northeastern wind sector (Fig. S7), yielding aged sea salts in the Strait of Dover and the North Sea area (Fig. 1). This phenomenon occurs according to the trajectory of the air masses. With that, the aged sea salts may not come from the wind direction open to the sea but from land (northeastern wind sector), especially at a coastal site, which is the case of this study.
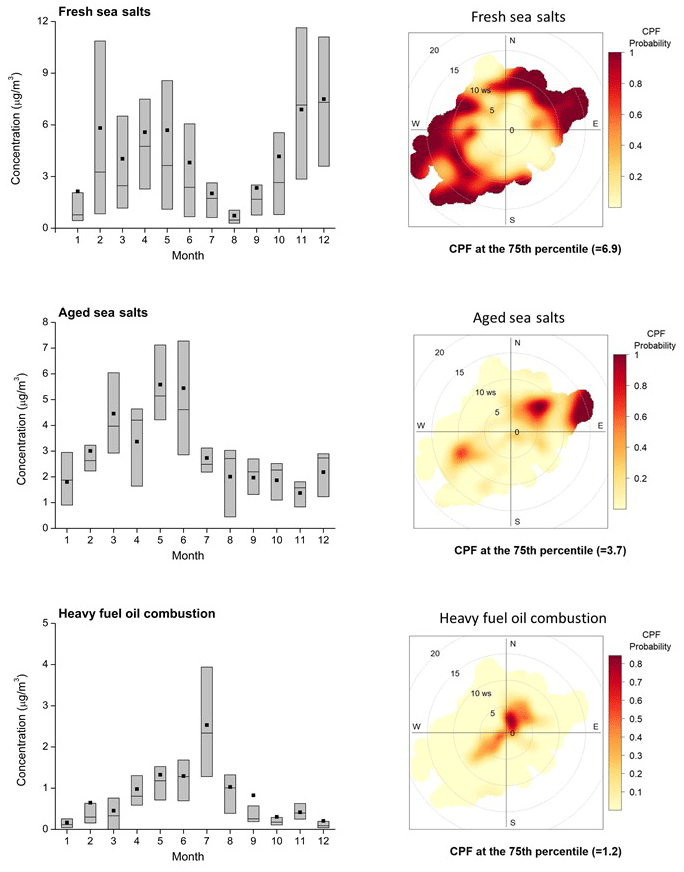
Figure 4Boxplot of the monthly contribution of the sources expressed in micrograms per cubic meter (25th, 50th, and 75th percentiles) along with the monthly average concentrations (black squares) as well as the conditional bivariate probability function (CBPF) plots.
As for the HFO combustion from shipping emissions, the highest contribution was observed during July, with an average concentration that is 15 times higher during this month (2.53 µg m−3) compared to January (0.17 µg m−3). This source contributes 18 % of PM10 concentration during July, which is approximately 4 times higher than the yearly average contribution (Fig. 3). The CBPF representation shows that the high concentration contributions of HFO combustion were observed for winds blowing from the northeastern and southwestern wind sectors with low wind speed (<5 m s−1). According to the Marine Management Organisation (MMO), the number of ferries was 1.5 times higher during this specific period, while the traffic in the English Channel and the North Sea remained constant, which could account for the higher contribution (MMO, 2014). In addition to that, meteorological conditions characterized by low wet deposition and low wind speed favor the accumulation of pollutants (Aulinger et al., 2016).
3.5 Regional influence
The representations of the source contributions with the air mass back trajectories using the CWT method are useful to study the impact of regional emissions on PM10 concentrations. The focus will be on the sources identified by CW-NMF that largely contribute to PM10 concentrations and that can be of regional origin. For this purpose, we present in Fig. 5 the CWT representations for fresh and aged sea salts, secondary nitrate and sulfate, and HFO combustion that correspond altogether to 84 % of PM10 during the sampling period at CGN (Fig. 3). The CWT analysis exhibits specific hotspots for sea salt factors over the North Sea and the English Channel. Additionally, the coastal part of the Atlantic Ocean can be considered to be an additional hotspot for fresh sea salts (Fig. 5). This can also be observed in the CBPF representations that show high contributions of fresh sea salts when the air blows from the southwestern sector with high wind speeds (higher than 10 m s−1) (Fig. 4). The CWT model highlights once again the influence of HFO combustion, corresponding to shipping emissions, and shows that the North Sea, the English Channel, and the Strait of Dover can be considered to be hotspots for this source.
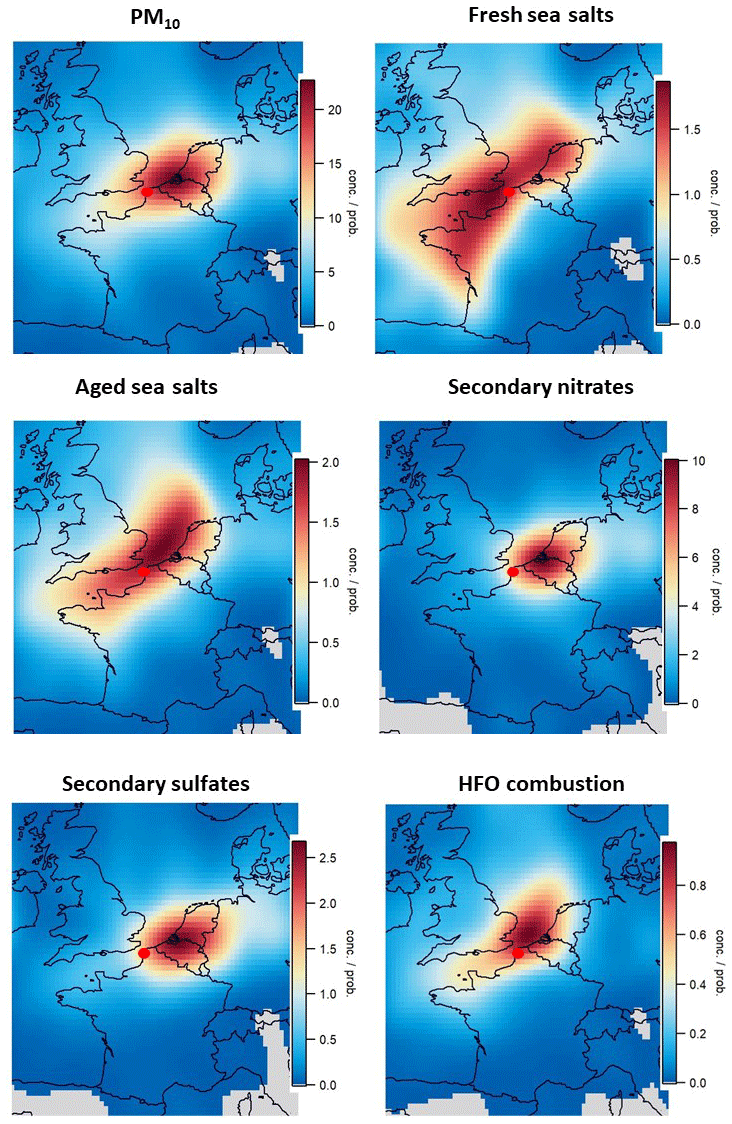
Figure 5CWT results for PM10 and some NMF factors (fresh sea salts, aged sea salts, secondary nitrate, secondary sulfate, and HFO combustion). Red colors highlight potential emission zones. Contribution scales are in micrograms per cubic meter.
On the other hand, secondary nitrate and secondary sulfate show similar geographical origins, with the main hotspots located over Belgium, the Netherlands, and western Germany.
These observations were consistent with other studies that highlighted that these sources are mainly inland and associated with continental air masses (Moufarrej et al., 2020; Petit et al., 2019). These regions were considered to be important SO2 emitters produced by power generation and transformation industries and NO2 emitters from road transport, power plants, and other fuel converters (2012; Pay et al., 2010, 2012). Nevertheless, the North Sea can also be seen as a hotspot for these sources.
As for PM10, the highest concentrations were traced back to marine areas such as the North Sea and the English Channel as well as some European countries such as northern France, Belgium, the Netherlands, and western Germany. Waked et al. (2018) investigated the geographical origins of PM10 impacting the north of France during the period between 2009 and 2013 and also found similar results where air masses crossing Belgium, the Netherlands, and the North Sea were associated with intense anthropogenic activity and were considered to be the highest potential source areas.
The main objective of this work was to determine the contribution of natural and anthropogenic maritime sources to PM10 levels at a coastal site in the north of France. In order to do that, a PM10 sampling and measurement campaign was conducted in 2013 at a coastal site at the Strait of Dover, named Cap Gris-Nez. PM10 was chemically characterized for its carbonaceous, elemental, and ionic fractions as well as some organic tracers of biomass burning and primary biogenic emissions. This exhaustive characterization was essential in order to explain the PM10 concentration levels observed in the north of France and to estimate the sources' contributions to PM10 using a receptor model, constrained weighted non-negative matrix factorization.
In 2013, at Cap Gris-Nez, the mean PM10 value was 24.3 µg m−3, which is very similar to those observed at several other sites in northern France. Six species account for about 70 % of the total mass of PM10: NO, OC, SO, Cl−, Na+, and NH. Using the CW-NMF model, nine source profiles were identified and were associated with natural and anthropogenic emissions. During the period of study, the mean contributions of the different sources were 37 % for fresh and aged sea salts, 42 % for secondary inorganic aerosols, 8 % for biomass combustion, and almost 5 % for marine traffic. Additionally, the study of the monthly evolution of the sources' contribution shows that secondary nitrate and biomass burning were predominant during the cold season. As for the summer season, the impact of marine traffic and the predominance of aged sea salts versus fresh sea salts were mainly evidenced. The contribution of HFO combustion from shipping in July was found to be 15 times higher than in January.
Finally, CWT analysis showed that the North Sea, the English Channel, and the coastal part of the Atlantic Ocean are important hotspots for maritime emissions, whereas Belgium, the Netherlands, and the west of Germany are hotspots for secondary sources, emphasizing the role of long-range transport in the air quality at Cap Gris-Nez in particular and in the north of France in general.
Data used for this study can be found at https://doi.org/10.5281/zenodo.8022729 (Ledoux et al., 2023).
The supplement related to this article is available online at: https://doi.org/10.5194/acp-23-8607-2023-supplement.
FL: data curation, conceptualization, supervision, investigation, review and editing, data analysis, and formal analysis. CR: sampling, chemical analysis, investigation, data curation, visualization, formal analysis, investigation, and writing. GD: software and formal analysis. GR: software and formal analysis. OF: supervision of chemical analysis and review and editing. MF: data curation, visualization, writing of the original draft, and review and editing. DC: funding acquisition, conceptualization, supervision, investigation, formal analysis, project administration, and review and editing.
The contact author has declared that none of the authors has any competing interests.
Publisher's note: Copernicus Publications remains neutral with regard to jurisdictional claims in published maps and institutional affiliations.
The authors would like to thank the “Centre Commun de Mesures, ULCO” and specifically Fabrice Cazier and Dorothée Dewaele, as well as the regional air quality monitoring network Atmo Hauts-de-France, for their contribution to this project. The authors would also like to thank Amaury Kasprowiak for his help in the ionic chromatography analysis.
This project is part of a scientific contribution included in the Atmosphere Protection Plan funded by the Regional Environment, Planning, and Housing Agency (Hauts-de-France) as well as by the French Ministry of Ecological Transition and Territorial Cohesion.
The “Unité de Chimie Environnementale et Interactions sur le Vivant”, UCEIV UR4492, participates in the CLIMIBIO project, which is financially supported by the Hauts-de-France Region Council, the Ministry of Higher Education and Research, and the European Regional Development Fund. Cloé Roche is grateful to the “Pôle Métropolitain Côte d'Opale” (PMCO) for the funding of her PhD.
This paper was edited by Eleanor Browne and reviewed by two anonymous referees.
Amato, F., Pandolfi, M., Escrig, A., Querol, X., Alastuey, A., Pey, J., Perez, N., and Hopke, P. K.: Quantifying road dust resuspension in urban environment by Multilinear Engine: A comparison with PMF2, Atmos. Environ., 43, 2770–2780, https://doi.org/10.1016/j.atmosenv.2009.02.039, 2009.
Amato, F., Viana, M., Richard, A., Furger, M., Prévôt, A. S. H., Nava, S., Lucarelli, F., Bukowiecki, N., Alastuey, A., Reche, C., Moreno, T., Pandolfi, M., Pey, J., and Querol, X.: Size and time-resolved roadside enrichment of atmospheric particulate pollutants, Atmos. Chem. Phys., 11, 2917–2931, https://doi.org/10.5194/acp-11-2917-2011, 2011.
Andersson, C., Bergström, R., and Johansson, C.: Population exposure and mortality due to regional background PM in Europe – Long-term simulations of source region and shipping contributions, Atmos. Environ., 43, 3614–3620, https://doi.org/10.1016/j.atmosenv.2009.03.040, 2009.
Atmo: Bilan territorial de la qualité de l'air, https://www.atmo-hdf.fr/publications/bilan-de-la-qualite-de-lair-du-conseil-general-du-nord-2013 (last access: 3 February 2023), 2013.
Aulinger, A., Matthias, V., Zeretzke, M., Bieser, J., Quante, M., and Backes, A.: The impact of shipping emissions on air pollution in the greater North Sea region – Part 1: Current emissions and concentrations, Atmos. Chem. Phys., 16, 739–758, https://doi.org/10.5194/acp-16-739-2016, 2016.
Ausmeel, S., Eriksson, A., Ahlberg, E., Sporre, M. K., Spanne, M., and Kristensson, A.: Ship plumes in the Baltic Sea Sulfur Emission Control Area: chemical characterization and contribution to coastal aerosol concentrations, Atmos. Chem. Phys., 20, 9135–9151, https://doi.org/10.5194/acp-20-9135-2020, 2020.
Bauer, H., Claeys, M., Vermeylen, R., Schüller, E., Weinke, G., Berger, A., and Puxbaum, H.: Arabitol and mannitol as tracers for a quantification of airborne fungal spores, Atmos. Environ., 42, 588–593, https://doi.org/10.1016/j.atmosenv.2007.10.013, 2008.
Becagli, S., Sferlazzo, D. M., Pace, G., di Sarra, A., Bommarito, C., Calzolai, G., Ghedini, C., Lucarelli, F., Meloni, D., Monteleone, F., Severi, M., Traversi, R., and Udisti, R.: Evidence for heavy fuel oil combustion aerosols from chemical analyses at the island of Lampedusa: a possible large role of ships emissions in the Mediterranean, Atmos. Chem. Phys., 12, 3479–3492, https://doi.org/10.5194/acp-12-3479-2012, 2012.
Bove, M. C., Brotto, P., Calzolai, G., Cassola, F., Cavalli, F., Fermo, P., Hjorth, J., Massabò, D., Nava, S., Piazzalunga, A., Schembari, C., and Prati, P.: PM10 source apportionment applying PMF and chemical tracer analysis to ship-borne measurements in the Western Mediterranean, Atmos. Environ., 125, 140–151, https://doi.org/10.1016/j.atmosenv.2015.11.009, 2016.
Carslaw, D. C.: The openair manual – open-source tools for analysing air pollution data, Manual for version 1.1-4, King's College London, 2015.
Cavalli, F., Viana, M., Yttri, K. E., Genberg, J., and Putaud, J.-P.: Toward a standardised thermal-optical protocol for measuring atmospheric organic and elemental carbon: the EUSAAR protocol, Atmos. Meas. Tech., 3, 79–89, https://doi.org/10.5194/amt-3-79-2010, 2010.
Cesari, D., Genga, A., Ielpo, P., Siciliano, M., Mascolo, G., Grasso, F. M., and Contini, D.: Source apportionment of PM2.5 in the harbour-industrial area of Brindisi (Italy): identification and estimation of the contribution of in-port ship emissions, Sci. Total Environ., 497–498, 392–400, https://doi.org/10.1016/j.scitotenv.2014.08.007, 2014.
Contini, D. and Merico, E.: Recent Advances in Studying Air Quality and Health Effects of Shipping Emissions, Atmosphere, 12, 92, https://doi.org/10.3390/atmos12010092, 2021.
Contini, D., Gambaro, A., Belosi, F., De Pieri, S., Cairns, W. R. L., Donateo, A., Zanotto, E., and Citron, M.: The direct influence of ship traffic on atmospheric PM2.5, PM10 and PAH in Venice, J. Environ. Manag., 92, 2119–2129, https://doi.org/10.1016/j.jenvman.2011.01.016, 2011.
Corbett, J. J., Winebrake, J. J., Green, E. H., Kasibhatla, P., Eyring, V., and Lauer, A.: Mortality from Ship Emissions: A Global Assessment, Environ. Sci. Tech., 41, 8512–8518, https://doi.org/10.1021/es071686z, 2007.
Crenn, V., Fronval, I., Petitprez, D., and Riffault, V.: Fine particles sampled at an urban background site and an industrialized coastal site in Northern France – Part 1: Seasonal variations and chemical characterization, Sci. Total Environ., 578, 203–218, https://doi.org/10.1016/j.scitotenv.2015.11.165, 2015.
Delmaire, G., Roussel, G., Hleis, D., and Ledoux, F.: Une version pondérée de la Factorisation Matricielle Non négative pour l'identification de sources de particules atmosphériques. Application au littoral de la Mer du Nord, J. Eur. Syst. Autom., 44, 201–222, https://doi.org/10.3166/jesa.44.547-566, 2010.
Donateo, A., Gregoris, E., Gambaro, A., Merico, E., Giua, R., Nocioni, A., and Contini, D.: Contribution of harbour activities and ship traffic to PM2.5, particle number concentrations and PAHs in a port city of the Mediterranean Sea (Italy), Environ. Sci. Pollut. Res. Int., 21, 9415–9429, https://doi.org/10.1007/s11356-014-2849-0, 2014.
EEA: The impact of international shipping on European air quality and climate forcing, European Environmental agency, Technical report No 4/2013, https://www.eea.europa.eu/publications/the-impact-of-international-shipping (last access: 3 February 2023) 2013.
EEA: Air quality in Europe 2014 report, EEA report, Publications Office of the European Union, Luxembourg, https://doi.org/10.2800/22775, 2014.
EEA: European Maritime Transport Environmental Report 2021, https://www.eea.europa.eu/publications/maritime-transport (last access: 3 February 2023) 2021.
Endresen, Ø., Sørgård, E., Sundet, J. K., Dalsøren, S. B., Isaksen, I. S. A., Berglen, T. F., and Gravir, G.: Emission from international sea transportation and environmental impact, J. Geophys. Res.-Atmos., 108, 4560, https://doi.org/10.1029/2002JD002898, 2003.
Fadel, M., Ledoux, F., Seigneur, M., Oikonomou, K., Sciare, J., Courcot, D., and Afif, C.: Chemical profiles of PM2.5 emitted from various anthropogenic sources of the Eastern Mediterranean: Cooking, wood burning, and diesel generators, Environ. Res., 211, 113032, https://doi.org/10.1016/j.envres.2022.113032, 2022.
Favez, O., Lemeur, S., and Petit, J.-E.: Suivi de la composition chimique journalière des PM2.5 et PM10 sur la station Petit Quevilly (agglomération de Rouen) d'Air Normand entre octobre 2010 et octobre 2011, NOTE DU LCSQA – Métrologie des particules, 2011.
Favez, O., Weber, S., Petit, J.-E., Alleman, L. Y., Albinet, A., Riffault, V., Chazeau, B., Amodeo, T., Salameh, D., Zhang, Y., Srivastava, D., Samaké, A., Aujay-Plouzeau, R., Papin, A., Bonnaire, N., Boullanger, C., Chatain, M., Chevrier, F., Detournay, A., Dominik-Sègue, M., Falhun, R., Garbin, C., Ghersi, V., Grignion, G., Levigoureux, G., Pontet, S., Rangognio, J., Zhang, S., Besombes, J.-L., Conil, S., Uzu, G., Savarino, J., Marchand, N., Gros, V., Marchand, C., Jaffrezo, J.-L., and Leoz-Garziandia, E.: Overview of the French Operational Network for In Situ Observation of PM Chemical Composition and Sources in Urban Environments (CARA Program), Atmosphere, 12, 207, https://doi.org/10.3390/atmos12020207, 2021.
Fine, P. M., Cass, G. R., and Simoneit, B. R. T.: Chemical characterization of fine particle emissions from the fireplace combustion of woods grown in the southern United States, Environ. Sci. Tech., 36, 1442–1451, https://doi.org/10.1021/es0108988, 2002.
Golly, B., Waked, A., Weber, S., Samake, A., Jacob, V., Conil, S., Rangognio, J., Chrétien, E., Vagnot, M. P., Robic, P. Y., Besombes, J. L., and Jaffrezo, J. L.: Organic markers and OC source apportionment for seasonal variations of PM2.5 at 5 rural sites in France, Atmos. Environ., 198, 142–157, https://doi.org/10.1016/j.atmosenv.2018.10.027, 2019.
Gregoris, E., Barbaro, E., Morabito, E., Toscano, G., Donateo, A., Cesari, D., Contini, D., and Gambaro, A.: Impact of maritime traffic on polycyclic aromatic hydrocarbons, metals and particulate matter in Venice air, Environ. Sci. Pollut. Res., 23, 6951–6959, https://doi.org/10.1007/s11356-015-5811-x, 2016.
Hellebust, S., Allanic, A., O'Connor, I. P., Jourdan, C., Healy, D., and Sodeau, J. R.: Sources of ambient concentrations and chemical composition of PM2.5–0.1 in Cork Harbour, Ireland, Atmos. Res., 95, 136–149, https://doi.org/10.1016/j.atmosres.2009.09.006, 2010.
Jonson, J. E., Gauss, M., Schulz, M., Jalkanen, J.-P., and Fagerli, H.: Effects of global ship emissions on European air pollution levels, Atmos. Chem. Phys., 20, 11399–11422, https://doi.org/10.5194/acp-20-11399-2020, 2020.
Jutterström, S., Moldan, F., Moldanová, J., Karl, M., Matthias, V., and Posch, M.: The impact of nitrogen and sulfur emissions from shipping on the exceedance of critical loads in the Baltic Sea region, Atmos. Chem. Phys., 21, 15827–15845, https://doi.org/10.5194/acp-21-15827-2021, 2021.
Kfoury, A.: Origin and physicochemical behaviour of atmospheric PM in cities located in the areas in the area of the Nord-Pas-de-Calais region, France, Université du Littoral Côte d'Opale, 2013.
Kfoury, A., Ledoux, F., Roche, C., Delmaire, G., Roussel, G., and Courcot, D.: PM2.5 source apportionment in a French urban coastal site under steelworks emission influences using constrained non-negative matrix factorization receptor model, J. Environ. Sci., 40, 114–128, https://doi.org/10.1016/j.jes.2015.10.025, 2016.
Khan, J. Z., Sun, L., Tian, Y., Shi, G., and Feng, Y.: Chemical characterization and source apportionment of PM1 and PM2.5 in Tianjin, China: Impacts of biomass burning and primary biogenic sources, J. Environ. Sci., 99, 196–209, https://doi.org/10.1016/j.jes.2020.06.027, 2021.
Kim, E., Hopke, P. K., and Edgerton, E. S.: Improving source identification of Atlanta aerosol using temperature resolved carbon fractions in positive matrix factorization, Atmos. Environ., 38, 3349–3362, https://doi.org/10.1016/j.atmosenv.2004.03.012, 2004.
Koçak, M., Mihalopoulos, N., Tutsak, E., Theodosi, C., Zarmpas, P., and Kalegeri, P.: PM10 and PM2.5 composition over the Central Black Sea: origin and seasonal variability, Environ. Sci. Pollut. Res., 22, 18076–18092, https://doi.org/10.1007/s11356-015-4928-2, 2015.
Ledoux, F., Laversin, H., Courcot, D., Courcot, L., Zhilinskaya, E. A., Puskaric, E., and Aboukaïs, A.: Characterization of iron and manganese species in atmospheric aerosols from anthropogenic sources, Atmos. Res., 82, 622–632, https://doi.org/10.1016/j.atmosres.2006.02.018, 2006.
Ledoux, F., Kfoury, A., Delmaire, G., Roussel, G., El Zein, A., and Courcot, D.: Contributions of local and regional anthropogenic sources of metals in PM2.5 at an urban site in northern France, Chemosphere, 181, 713–724, https://doi.org/10.1016/j.chemosphere.2017.04.128, 2017.
Ledoux, F., Roche, C., Cazier, F., Beaugard, C., and Courcot, D.: Influence of ship emissions on NOx, SO2, O3 and PM concentrations in a North-Sea harbor in France, J. Environ. Sci., 71, 56–66, https://doi.org/10.1016/j.jes.2018.03.030, 2018.
Ledoux, F., Roche, C., Delmaire, G., Roussel, G., Favez, O., Fadel, M., and Courcot, D.: Data for “Measurement report: A one-year study to estimate maritime contributions to PM10 in a coastal area in Northern France.”, Zenodo [data set], https://doi.org/10.5281/zenodo.8022729, 2023.
Limem, A., Delmaire, G., Puigt, M., Roussel, G., and Courcot, D.: Non-negative Matrix Factorization under equality constraints – a study of industrial source identification, Appl. Numer. Math., 85, 1–15, https://doi.org/10.1016/j.apnum.2014.05.009, 2014.
Lv, Z., Liu, H., Ying, Q., Fu, M., Meng, Z., Wang, Y., Wei, W., Gong, H., and He, K.: Impacts of shipping emissions on PM2.5 pollution in China, Atmos. Chem. Phys., 18, 15811–15824, https://doi.org/10.5194/acp-18-15811-2018, 2018.
Manders, A., Schaap, M., Querol, X., Albert, M. F. M. A., Vercauteren, J., Kuhlbusch, T. A. J., and Hoogerbrugge, R.: Sea salt concentrations across the European continent, Atmos. Environ., 44, 2434–2442, https://doi.org/10.1016/j.atmosenv.2010.03.028, 2010.
Marmer, E., Dentener, F., Aardenne, J. v., Cavalli, F., Vignati, E., Velchev, K., Hjorth, J., Boersma, F., Vinken, G., Mihalopoulos, N., and Raes, F.: What can we learn about ship emission inventories from measurements of air pollutants over the Mediterranean Sea?, Atmos. Chem. Phys., 9, 6815–6831, https://doi.org/10.5194/acp-9-6815-2009, 2009.
Matthias, V., Bewersdorff, I., Aulinger, A., and Quante, M.: The contribution of ship emissions to air pollution in the North Sea regions, Environ. Pollut., 158, 2241–2250, https://doi.org/10.1016/j.envpol.2010.02.013, 2010.
Mazzei, F., D'Alessandro, A., Lucarelli, F., Nava, S., Prati, P., Valli, G., and Vecchi, R.: Characterization of particulate matter sources in an urban environment, Sci. Total Environ., 401, 81–89, https://doi.org/10.1016/j.scitotenv.2008.03.008, 2008.
MMO: Mapping UK shipping density and routes from AIS, Marine Management Organisation, https://assets.publishing.service.gov.uk/government/uploads/system/uploads/attachment_data/file/317770/1066.pdf (last access: 3 February 2023), 2014.
Moldanová, J., Fridell, E., Popovicheva, O., Demirdjian, B., Tishkova, V., Faccinetto, A., and Focsa, C.: Characterisation of particulate matter and gaseous emissions from a large ship diesel engine, Atmos. Environ., 43, 2632–2641, https://doi.org/10.1016/j.atmosenv.2009.02.008, 2009.
Moreno, T., Karanasiou, A., Amato, F., Lucarelli, F., Nava, S., Calzolai, G., Chiari, M., Coz, E., Artíñano, B., Lumbreras, J., Borge, R., Boldo, E., Linares, C., Alastuey, A., Querol, X., and Gibbons, W.: Daily and hourly sourcing of metallic and mineral dust in urban air contaminated by traffic and coal-burning emissions, Atmos. Environ., 68, 33–44, https://doi.org/10.1016/j.atmosenv.2012.11.037, 2013.
Moufarrej, L., Courcot, D., and Ledoux, F.: Assessment of the PM2.5 oxidative potential in a coastal industrial city in Northern France: Relationships with chemical composition, local emissions and long range sources, Sci. Total Environ., 748, 141448, https://doi.org/10.1016/j.scitotenv.2020.141448, 2020.
Oliveira, D.: Identification of the main sources and geographical origins of PM10 in the northern part of France, Université Lille 1, https://pepite-depot.univ-lille.fr/LIBRE/EDSMRE/2017/50376-2017-Barros_de_Oliveira.pdf (last access: 3 February 2023), 2017.
Pandolfi, M., Gonzalez-Castanedo, Y., Alastuey, A., de la Rosa, J. D., Mantilla, E., de la Campa, A. S., Querol, X., Pey, J., Amato, F., and Moreno, T.: Source apportionment of PM10 and PM2.5 at multiple sites in the strait of Gibraltar by PMF: impact of shipping emissions, Environ. Sci. Pollut. Res. Int., 18, 260–269, https://doi.org/10.1007/s11356-010-0373-4, 2011.
Pay, M. T., Piot, M., Jorba, O., Gassó, S., Gonçalves, M., Basart, S., Dabdub, D., Jiménez-Guerrero, P., and Baldasano, J. M.: A full year evaluation of the CALIOPE-EU air quality modeling system over Europe for 2004, Atmos. Environ., 44, 3322–3342, https://doi.org/10.1016/j.atmosenv.2010.05.040, 2010.
Pay, M. T., Jiménez-Guerrero, P., and Baldasano, J. M.: Assessing sensitivity regimes of secondary inorganic aerosol formation in Europe with the CALIOPE-EU modeling system, Atmos. Environ., 51, 146–164, https://doi.org/10.1016/j.atmosenv.2012.01.027, 2012.
Petit, J.-E., Favez, O., Albinet, A., and Canonaco, F.: A user-friendly tool for comprehensive evaluation of the geographical origins of atmospheric pollution: Wind and trajectory analyses, Environ. Model. Softw., 88, 183–187, https://doi.org/10.1016/j.envsoft.2016.11.022, 2017.
Petit, J.-E., Pallarès, C., Favez, O., Alleman, L. Y., Bonnaire, N., and Rivière, E.: Sources and Geographical Origins of PM10 in Metz (France) Using Oxalate as a Marker of Secondary Organic Aerosols by Positive Matrix Factorization Analysis, Atmosphere, 10, 370, https://doi.org/10.3390/atmos10070370, 2019.
Polissar, A. V., Hopke, P. K., Paatero, P., Malm, W. C., and Sisler, J. F.: Atmospheric aerosol over Alaska: 2. Elemental composition and sources, J. Geophys. Res.-Atmos., 103, 19045–19057, https://doi.org/10.1029/98JD01212, 1998.
Polissar, A. V., Hopke, P. K., and Poirot, R. L.: Atmospheric Aerosol over Vermont: Chemical Composition and Sources, Environ. Sci. Tech., 35, 4604–4621, https://doi.org/10.1021/es0105865, 2001.
Prendes, P., Andrade, J. M., López-Mahía, P., and Prada, D.: Source apportionment of inorganic ions in airborne urban particles from Coruña city (N.W. of Spain) using positive matrix factorization, Talanta, 49, 165–178, https://doi.org/10.1016/s0039-9140(98)00356-7, 1999.
Rimetz-Planchon, J., Perdrix, E., Sobanska, S., and Brémard, C.: PM10 air quality variations in an urbanized and industrialized harbor, Atmos. Environ., 42, 7274–7283, https://doi.org/10.1016/j.atmosenv.2008.07.005, 2008.
Samaké, A., Jaffrezo, J.-L., Favez, O., Weber, S., Jacob, V., Canete, T., Albinet, A., Charron, A., Riffault, V., Perdrix, E., Waked, A., Golly, B., Salameh, D., Chevrier, F., Oliveira, D. M., Besombes, J.-L., Martins, J. M. F., Bonnaire, N., Conil, S., Guillaud, G., Mesbah, B., Rocq, B., Robic, P.-Y., Hulin, A., Le Meur, S., Descheemaecker, M., Chretien, E., Marchand, N., and Uzu, G.: Arabitol, mannitol, and glucose as tracers of primary biogenic organic aerosol: the influence of environmental factors on ambient air concentrations and spatial distribution over France, Atmos. Chem. Phys., 19, 11013–11030, https://doi.org/10.5194/acp-19-11013-2019, 2019.
Scerri, M., Genga, A., Iacobellis, S., Delmaire, G., Giove, A., Siciliano, M., Siciliano, T., and Weinbruch, S.: Investigating the plausibility of a PMF source apportionment solution derived using a smaller dataset: A case study from a receptor in a rural receptor in Apulia - South East Italy, Chemosphere, 236, 124376, https://doi.org/10.1016/j.chemosphere.2019.124376, 2019.
Scerri, M. M., Weinbruch, S., Delmaire, G., Mercieca, N., Nolle, M., Prati, P., and Massabò, D.: Exhaust and non-exhaust contributions from road transport to PM10 at a Southern European traffic site, Environ. Pollut., 316, 120569, https://doi.org/10.1016/j.envpol.2022.120569, 2023.
Schmidl, C., Bauer, H., Dattler, A., Hitzenberger, R., Weissenboeck, G., Marr, I. L., and Puxbaum, H.: Chemical characterisation of particle emissions from burning leaves, Atmos. Environ., 42, 9070–9079, https://doi.org/10.1016/j.atmosenv.2008.09.010, 2008.
Seinfeld, J. H. and Pandis, S. N.: Atmospherifc chemistry and physics: from air pollution to climatic change, John Wiley & Sons, Hobroken, N.J., ISBN 9780471720188, 0471720186, 2006.
Seinfeld, J. H. and Pandis, S. N.: Atmospheric Chemistry and Physics: From Air Pollution to Climate Change, 3rd edition, John Wiley & Sons, ISBN: 9781119221166, 9781119221173, 9781118947401, 1119221161, 111922117X, 1118947401, 2016.
Seppälä, S. D., Kuula, J., Hyvärinen, A.-P., Saarikoski, S., Rönkkö, T., Keskinen, J., Jalkanen, J.-P., and Timonen, H.: Effects of marine fuel sulfur restrictions on particle number concentrations and size distributions in ship plumes in the Baltic Sea, Atmos. Chem. Phys., 21, 3215–3234, https://doi.org/10.5194/acp-21-3215-2021, 2021.
Shen, F. and Li, X.: Effects of fuel types and fuel sulfur content on the characteristics of particulate emissions in marine low-speed diesel engine, Environ. Sci. Pollut. Res., 27, 37229–37236, https://doi.org/10.1007/s11356-019-07168-6, 2020.
Shi, J., Wang, N., Gao, H., Baker, A. R., Yao, X., and Zhang, D.: Phosphorus solubility in aerosol particles related to particle sources and atmospheric acidification in Asian continental outflow, Atmos. Chem. Phys., 19, 847–860, https://doi.org/10.5194/acp-19-847-2019, 2019.
Sonwani, S., Saxena, P., and Shukla, A.: Carbonaceous Aerosol Characterization and Their Relationship With Meteorological Parameters During Summer Monsoon and Winter Monsoon at an Industrial Region in Delhi, India, Earth Space Sci., 8, e2020EA001303, https://doi.org/10.1029/2020EA001303, 2021.
Srivastava, D., Favez, O., Bonnaire, N., Lucarelli, F., Haeffelin, M., Perraudin, E., Gros, V., Villenave, E., and Albinet, A.: Speciation of organic fractions does matter for aerosol source apportionment. Part 2: Intensive short-term campaign in the Paris area (France), Sci. Total Environ., 634, 267–278, https://doi.org/10.1016/j.scitotenv.2018.03.296, 2018.
Streibel, T., Schnelle-Kreis, J., Czech, H., Harndorf, H., Jakobi, G., Jokiniemi, J., Karg, E., Lintelmann, J., Matuschek, G., Michalke, B., Müller, L., Orasche, J., Passig, J., Radischat, C., Rabe, R., Reda, A., Rüger, C., Schwemer, T., Sippula, O., Stengel, B., Sklorz, M., Torvela, T., Weggler, B., and Zimmermann, R.: Aerosol emissions of a ship diesel engine operated with diesel fuel or heavy fuel oil, Environ. Sci. Pollut. Res., 24, 10976–10991, https://doi.org/10.1007/s11356-016-6724-z, 2017.
Tang, L., Ramacher, M. O. P., Moldanová, J., Matthias, V., Karl, M., Johansson, L., Jalkanen, J.-P., Yaramenka, K., Aulinger, A., and Gustafsson, M.: The impact of ship emissions on air quality and human health in the Gothenburg area – Part 1: 2012 emissions, Atmos. Chem. Phys., 20, 7509–7530, https://doi.org/10.5194/acp-20-7509-2020, 2020.
UNCTAD: Review of Maritime Transport 2021, United Nations, ISBN 978-92-1-113026-3, 2021.
Uria-Tellaetxe, I. and Carslaw, D. C.: Conditional bivariate probability function for source identification, Environ. Model. Softw., 59, 1–9, https://doi.org/10.1016/j.envsoft.2014.05.002, 2014.
Viana, M., Amato, F., Alastuey, A., Querol, X., Moreno, T., García Dos Santos, S., Herce, M. D., and Fernández-Patier, R.: Chemical Tracers of Particulate Emissions from Commercial Shipping, Environ. Sci. Tech., 43, 7472–7477, https://doi.org/10.1021/es901558t, 2009.
Viana, M., Hammingh, P., Colette, A., Querol, X., Degraeuwe, B., Vlieger, I. d., and van Aardenne, J.: Impact of maritime transport emissions on coastal air quality in Europe, Atmos. Environ., 90, 96–105, https://doi.org/10.1016/j.atmosenv.2014.03.046, 2014.
Vincenti, B., Paris, E., Carnevale, M., Palma, A., Guerriero, E., Borello, D., Paolini, V., and Gallucci, F.: Saccharides as Particulate Matter Tracers of Biomass Burning: A Review, Int. J. En. Res. Pu. He., 19, 4387, https://doi.org/10.3390/ijerph19074387, 2022.
Waked, A., Favez, O., Alleman, L. Y., Piot, C., Petit, J.-E., Delaunay, T., Verlinden, E., Golly, B., Besombes, J.-L., Jaffrezo, J.-L., and Leoz-Garziandia, E.: Source apportionment of PM10 in a north-western Europe regional urban background site (Lens, France) using positive matrix factorization and including primary biogenic emissions, Atmos. Chem. Phys., 14, 3325–3346, https://doi.org/10.5194/acp-14-3325-2014, 2014.
Waked, A., Bourin, A., Michoud, V., Perdrix, E., Alleman, L. Y., Sauvage, S., Delaunay, T., Vermeesch, S., Petit, J.-E., and Riffault, V.: Investigation of the geographical origins of PM10 based on long, medium and short-range air mass back-trajectories impacting Northern France during the period 2009–2013, Atmos. Environ., 193, 143–152, https://doi.org/10.1016/j.atmosenv.2018.08.015, 2018.
Weber, S., Salameh, D., Albinet, A., Alleman, L., Waked, A., Besombes, J.-L., Jacob, V., Guillaud, G., Meshbah, B., Rocq, B., Hulin, A., Dominik-Sègue, M., Chrétien, E., Jaffrezo, J.-L., and Favez, O.: Comparison of PM10 Sources Profiles at 15 French Sites Using a Harmonized Constrained Positive Matrix Factorization Approach, Atmosphere, 10, 310, https://doi.org/10.3390/atmos10060310, 2019.
Weber, S., Uzu, G., Favez, O., Borlaza, L. J. S., Calas, A., Salameh, D., Chevrier, F., Allard, J., Besombes, J.-L., Albinet, A., Pontet, S., Mesbah, B., Gille, G., Zhang, S., Pallares, C., Leoz-Garziandia, E., and Jaffrezo, J.-L.: Source apportionment of atmospheric PM10 oxidative potential: synthesis of 15 year-round urban datasets in France, Atmos. Chem. Phys., 21, 11353–11378, https://doi.org/10.5194/acp-21-11353-2021, 2021.
WHO: WHO air quality guidelines for particulate matter, ozone, nitrogen dioxide and sulfur dioxide: global assessment 2005: summary of risk assessment, https://apps.who.int/iris/bitstream/handle/10665/69477/WHO_SDE_PHE_OEH_06.02_eng.pdf?sequence=1&isAllowed=y (last access: 3 February 2023), 2006.
WHO: WHO air quality guidelines, Particulate matter (PM2.5 and PM10), ozone, nitrogen dioxide, sulfur dioxide and carbon monoxide, Geneva: World Health Organization Switzerland, Licence: CC BY-NC-SA 3.0 IGO, 2021.
Zetterdahl, M., Moldanová, J., Pei, X., Pathak, R. K., and Demirdjian, B.: Impact of the 0.1 % fuel sulfur content limit in SECA on particle and gaseous emissions from marine vessels, Atmos. Environ., 145, 338–345, https://doi.org/10.1016/j.atmosenv.2016.09.022, 2016.
Zhang, F., Chen, Y., Tian, C., Lou, D., Li, J., Zhang, G., and Matthias, V.: Emission factors for gaseous and particulate pollutants from offshore diesel engine vessels in China, Atmos. Chem. Phys., 16, 6319–6334, https://doi.org/10.5194/acp-16-6319-2016, 2016.
Zhang, F., Guo, H., Chen, Y., Matthias, V., Zhang, Y., Yang, X., and Chen, J.: Size-segregated characteristics of organic carbon (OC), elemental carbon (EC) and organic matter in particulate matter (PM) emitted from different types of ships in China, Atmos. Chem. Phys., 20, 1549–1564, https://doi.org/10.5194/acp-20-1549-2020, 2020.
Zhang, Y., Eastham, S. D., Lau, A. K. H., Fung, J. C. H., and Selin, N. E.: Global air quality and health impacts of domestic and international shipping, Environ. Res. Lett., 16, 084055, https://doi.org/10.1088/1748-9326/ac146b, 2021.