the Creative Commons Attribution 4.0 License.
the Creative Commons Attribution 4.0 License.
 | 02 Aug 2023
Interaction of microphysics and dynamics in a warm conveyor belt simulated with the ICOsahedral Nonhydrostatic (ICON) model
Annette K. Miltenberger
Christian M. Grams
Corinna Hoose
Warm conveyor belts (WCBs) produce a major fraction of precipitation in extratropical cyclones and modulate the large-scale extratropical circulation. Diabatic processes, in particular associated with cloud formation, influence the cross-isentropic ascent of WCBs into the upper troposphere and additionally modify the potential vorticity (PV) distribution, which influences the larger-scale flow. In this study we investigate heating and PV rates from all diabatic processes, including microphysics, turbulence, convection, and radiation, in a case study that occurred during the North Atlantic Waveguide and Downstream Impact Experiment (NAWDEX) campaign using the Icosahedral Nonhydrostatic (ICON) modeling framework. In particular, we consider all individual microphysical process rates that are implemented in ICON's two-moment microphysics scheme, which sheds light on (i) which microphysical processes dominate the diabatic heating and PV structure in the WCB and (ii) which microphysical processes are the most active during the ascent and influence cloud formation and characteristics, providing a basis for detailed sensitivity experiments. For this purpose, diabatic heating and PV rates are integrated for the first time along online trajectories across nested grids with different horizontal resolutions. The convection-permitting simulation setup also takes the reduced aerosol concentrations over the North Atlantic into account. Our results confirm that microphysical processes are the dominant diabatic heating source during ascent. Near the cloud top longwave radiation cools WCB air parcels. Radiative heating and corresponding PV modification in the upper troposphere are non-negligible due to the longevity of the WCB cloud band. In the WCB ascent region, the process rates from turbulent heating and microphysics partially counteract each other. From all microphysical processes condensational growth of cloud droplets and vapor deposition on frozen hydrometeors most strongly influence diabatic heating and PV, while below-cloud evaporation strongly cools WCB air parcels prior to their ascent and increases their PV value. PV production is the strongest near the surface with substantial contributions from condensation, melting, evaporation, and vapor deposition. In the upper troposphere, PV is reduced by diabatic heating from vapor deposition, condensation, and radiation. Activation of cloud droplets as well as homogeneous and heterogeneous freezing processes have a negligible diabatic heating contribution, but their detailed representation is important for, e.g., hydrometeor size distributions. Generally, faster-ascending WCB trajectories are heated markedly more than more slowly ascending WCB trajectories, which is linked to larger initial specific humidity content providing a thermodynamic constraint on total microphysical heating. Yet, the total diabatic heating contribution of convectively ascending trajectories is relatively small due to their small fraction in this case study. Our detailed case study documents the effect of different microphysical processes implemented in ICON's two-moment scheme for heating and PV rates in a WCB from a joint Eulerian and Lagrangian perspective. It emphasizes the predominant role of microphysical processes and provides a framework for future experiments on cloud microphysical sensitivities in WCBs.
- Article
(9827 KB) - Full-text XML
- BibTeX
- EndNote


Extratropical cyclones (ETCs) are often characterized by a vertically extended cloud band in their warm sector with a long-lived cirrus shield, which is formed by a strongly ascending airstream, the so-called warm conveyor belt (WCB; Wernli and Davies, 1997; Eckhardt et al., 2004; Madonna et al., 2014; Oertel et al., 2019). WCBs are responsible for a major part of precipitation associated with ETCs (Pfahl et al., 2014), interact with and modify the upper-level flow (Grams et al., 2011; Rodwell et al., 2017; Grams et al., 2018; Berman and Torn, 2019; Oertel et al., 2023b), and influence the extratropical cloud radiative forcing (Joos, 2019). During the WCB's ascent from the lower into the upper troposphere a wide range of cloud processes take place, ranging from warm-phase to mixed-phase and ice-phase processes (Forbes and Clark, 2003; Joos and Wernli, 2012; Crezee et al., 2017; Gehring et al., 2020; Mazoyer et al., 2021, 2023). The representation of cloud processes is one of the key challenges in numerical weather prediction (NWP; e.g., Khain et al., 2015; Dearden et al., 2016; Hande and Hoose, 2017; Field et al., 2017) and influences cloud characteristics, dynamics, and surface precipitation. Hence, uncertainty in microphysical processes may modify a WCB's cloud and precipitation structure. For example, cloud condensation nuclei (CCN) concentrations affect cloud internal dynamics and surface precipitation in convective systems (e.g., Seifert and Beheng, 2006b; Noppel et al., 2010; Barthlott and Hoose, 2018; Igel and van den Heever, 2021; Barthlott et al., 2022). The response to changing CCN concentrations is not unidirectional and depends on the applied NWP model and microphysics scheme, as well as on the synoptic conditions (Tao et al., 2012; Fan et al., 2016). Due to the very different dynamics and associated microphysical process pathways between convective systems and large-scale WCB ascent in extratropical cyclones, these results cannot directly be transferred to WCBs where updraft velocities are substantially smaller and markedly influenced by synoptic conditions. A climatological comparison of precipitation characteristics during WCB ascent in polluted versus clean conditions in a simulation with a relatively low spatial resolution of showed only a small impact of aerosols on WCB-associated surface precipitation (Joos et al., 2017), whereby polluted conditions slightly delayed precipitation formation. Observations and idealized numerical model simulations suggest that the cloud liquid water path in WCBs is influenced to some extent by the cloud droplet number concentration (CDNC), which modifies cloud albedo (McCoy et al., 2018), and thus the cloud radiative forcing. In the upper troposphere the microphysical and macrophysical properties of cirrus clouds also substantially affect cloud radiative forcing (e.g., Zhang et al., 1999; Joos et al., 2014), which to some extent depends on the formation pathways of the cirrus clouds (Krämer et al., 2016; Luebke et al., 2016; Wernli et al., 2016).
Aside from modifying cloud properties, microphysical processes and their associated latent heating play an important role in the dynamics and structure of extratropical cyclones (e.g., Reed et al., 1992; Rossa et al., 2000; Wernli et al., 2002; Binder et al., 2016). Uncertainty in the representation of latent heat release can represent a dominant source of initial error growth (Baumgart et al., 2019). In general, WCBs influence the large-scale flow both through direct potential vorticity (PV) modification in the lower and upper troposphere (e.g., Rossa et al., 2000; Pomroy and Thorpe, 2000; Joos and Forbes, 2016; Oertel et al., 2020; Mazoyer et al., 2021) and through their related divergent outflow in the upper troposphere (e.g., Grams and Archambault, 2016; Steinfeld and Pfahl, 2019; Teubler and Riemer, 2021). The latter is strongly linked to the WCB ascent strength and its isentropic outflow level, which again is driven by latent heat release. Thus uncertainty in the representation of latent heat release substantially influences the WCB's cross-isentropic ascent and the WCB's impact on the large-scale upper-level flow (e.g., Martínez-Alvarado et al., 2014; Schäfler and Harnisch, 2015; Joos and Forbes, 2016; Mazoyer et al., 2021; Pickl et al., 2022), which might lead to forecast busts (Grams et al., 2018).
Moreover, WCB-related diabatic heating modifies the PV distribution in extratropical cyclones (see, e.g., Wernli and Davies, 1997; Joos and Wernli, 2012; Spreitzer et al., 2019; Attinger et al., 2019; Rivière et al., 2021, for more details). On larger scales, where vertical diabatic heating gradients dominate, diabatic heating during slantwise WCB ascent increases low-level PV values, which can lead to an intensification of cyclones (Rossa et al., 2000; Joos and Wernli, 2012; Binder et al., 2016). In the upper troposphere, PV values are decreased, which can modify the upper-level flow evolution (e.g., Wernli and Davies, 1997; Pomroy and Thorpe, 2000; Grams et al., 2011; Madonna et al., 2014; Methven, 2015; Saffin et al., 2021). Hence, as ascending air parcels pass through the quasi-vertical PV dipole related to mid-tropospheric diabatic heating from cloud formation, their PV values on average increase before they decrease to values close to their initial PV value (e.g., Madonna et al., 2014; Methven, 2015). On smaller scales, horizontal diabatic heating gradients become increasingly important and form quasi-horizontal PV dipoles in an environment where vertical wind shear is aligned with smaller-scale horizontal diabatic heating gradients (Chagnon and Gray, 2009; Harvey et al., 2020; Oertel et al., 2020, 2021). These smaller-scale PV anomalies are particularly relevant for convective activity embedded in the WCB airstream and can modify the mesoscale circulation (Oertel et al., 2020, 2021; Oertel and Schemm, 2021). Case studies have showed that the major contribution to the PV modification from microphysics results from condensation and vapor deposition on frozen hydrometeors in the lower and upper troposphere, respectively (Joos and Wernli, 2012; Joos and Forbes, 2016; Mazoyer et al., 2021, 2023), and point towards sensitivities on the model representation of ice-phase (Mazoyer et al., 2021) and mixed-phase microphysics (Mazoyer et al., 2023).
In summary, uncertainty related to the parameterization of microphysical processes influences the WCB cloud structure as well as the associated diabatic heating and PV structure, both important factors for NWP. Previous case studies applying one-moment or quasi-two-moment microphysics schemes have showed that the detailed WCB ascent and net diabatic heating vary depending on the applied microphysics scheme, the NWP model, and the WCB case (Martínez-Alvarado et al., 2014; Joos and Forbes, 2016; Mazoyer et al., 2021; Choudhary and Voigt, 2022; Mazoyer et al., 2023). An improved understanding of individual processes relevant for the cloud structure and diabatic heating in a WCB and in different models will facilitate the identification of microphysical processes and related model parameters that are uncertain but particularly relevant for WCB ascent. For example, detailed sensitivity studies typically rely on the selection of a few uncertain parameters. Understanding which processes are active, interact, and influence diabatic heating and the cloud structure provides added value for targeted parameter selection.
Building upon aforementioned studies focusing on one-moment and/or quasi-two-moment schemes, this study aims to yield a consistent and detailed view on microphysical processes, their interactions, and partially compensating processes in a two-moment microphysics scheme in the Icosahedral Nonhydrostatic (ICON) model (Zängl et al., 2015), which may – aside from enhanced physical understanding – ultimately contribute to model development and ensemble configuration (e.g., Ollinaho et al., 2017). Specifically, we combine Lagrangian and Eulerian perspectives to quantify diabatic heating and PV rates, considering diabatic heating contributions from all physics parameterizations with a strong focus on individual microphysical process rates represented in ICON's two-moment scheme (Seifert and Beheng, 2006a). We address the following research questions:
-
Which non-conservative processes dominate the total diabatic heating in a WCB case study?
-
Which microphysical processes are active during WCB ascent in the two-moment scheme, and how large are their individual contributions to the total diabatic heating?
-
What is the influence of the non-conservative processes on the PV distribution in the WCB?
The study is structured as follows: we first introduce the ICON model and novel Lagrangian and Eulerian diagnostics (Sect. 2). Section 2 also explains the modifications to the CCN activation scheme to account for reduced aerosol concentrations in the North Atlantic region. Next, we introduce the WCB case study (Sect. 3) and quantify the total integrated diabatic heating associated with the individual (micro-)physics processes (Sect. 4). Before concluding with a summary (Sect. 6), we show the processes that impact the spatiotemporal PV structure of the WCB using complementary Lagrangian and Eulerian perspectives (Sect. 5).
Diabatic processes in a WCB case study and their impact on the PV structure are investigated in a high-resolution ICON simulation. Lagrangian metrics providing insight into WCB air parcel history are combined with an Eulerian perspective providing spatial context for the WCB air parcel analysis. The following describes the numerical model, the individual microphysical processes from the two-moment scheme (Sect. 2.1–2.2), and the model diagnostics used in our analysis, i.e., diabatic heating and PV rates (Sect. 2.4) and online trajectories which are applied for the first time including trajectory transfer across refined grids (Sect. 2.5). Details on the composite analysis of WCB-related cloud characteristics used for the Eulerian analysis are provided in Sect. 2.6. To account for aerosol concentrations over the North Atlantic we modify the CCN activation scheme, which is briefly described in Sect. 2.3 and in more detail in Sect. A1.
2.1 ICON model setup
We employ the Icosahedral Nonhydrostatic (ICON) modeling framework (version 2.6.2.2; Zängl et al., 2015) to simulate a WCB case that occurred in the North Atlantic in October 2016 during the North Atlantic Waveguide and Downstream Impact Experiment (NAWDEX) campaign (IOP 7; Schäfler et al., 2018). The WCB case was selected as it is associated with a large-scale and strongly amplified downstream ridge (Sect. 3) and also due to the availability of airborne observations of aerosol concentrations (Appendix A1). We run a global simulation with a R03B07 grid (approx. 13 km effective grid spacing, corresponding to the operational resolution of the global ICON model setup used by the German weather service) and with a time step of 120 s. Additionally, two higher-resolution refined domains are nested in the global simulation on R03B08 and R03B09 grids (approx. 6.5 and 3.3 km effective grid spacing, Fig. 1). The time step for the refined nests is by definition halved from the respective lower-resolution parent domain, i.e., 60 and 30 s. The higher-resolution simulations are coupled by two-way nesting to the next lower-resolution simulation; i.e., the lower-resolution simulation provides lateral boundary conditions for the next higher-resolution nest at every time step, and in turn, the lower-resolution prognostic fields are nudged towards the solution from the respective higher resolution. The first refined domain encompasses the majority of the WCB inflow, ascent, and outflow region (R03B08 grid with approx. 6.5 km), and the second higher-resolution domain (R03B09 grid with approx. 3.3 km) is nested in the first one and focuses on the WCB ascent region (Fig. 1). The vertical dimension is represented by terrain-following smooth level vertical (SLEVE) coordinates (Leuenberger et al., 2010) with 90 levels. The level number is identical in all nests, but the coordinate systems in higher-resolution nests reflect the higher resolution of topography. The simulation is initialized from the ECMWF analysis at 18:00 UTC on 3 October 2016 and runs freely for 72 h. Deep convection is treated explicitly in the nested domains, and the Tiedtke–Bechtold convection scheme is used for the global domain (Tiedtke, 1989; Bechtold et al., 2008; ECMWF, 2016). Shallow convection is parameterized in all domains. Turbulence (Raschendorfer, 2018) as well as sub-grid-scale orographic drag (Lott and Miller, 1997) and non-orographic gravity wave drag (Orr et al., 2010) are parameterized by the standard schemes used in ICON. Radiation is described by the Rapid Radiative Transfer Model (RRTM; Mlawer et al., 1997). Cloud microphysical processes are represented by a two-moment microphysics scheme (Seifert and Beheng, 2006a) with six hydrometeor types (cloud, ice, rain, snow, graupel, and hail) and prognostic variables for the hydrometeor mass mixing ratios (cloud liquid (qc), ice (qi), rain (qr), snow (qs), graupel (qg), and hail (qh)), and corresponding number concentrations.
2.2 Microphysical processes
We focus on the microphysical processes that are associated with phase changes of water and hence diabatic heating or cooling (and do not explicitly analyze adiabatic processes such as accretion, autoconversion, or ice collision processes). In the following, the microphysical processes are discussed in the order in which they are called in ICON, complemented by temperature tendencies from the other physics parameterizations in ICON.
-
Saturation adjustment I (SATAD I).
The saturation adjustment removes sub- or supersaturation with respect to liquid water and establishes thermodynamic equilibrium between water vapor and liquid water by condensation or evaporation of cloud droplets, respectively, assuming that clouds relax instantly to a thermodynamic equilibrium. In ICON the saturation adjustment is called twice: once before the explicit microphysical processes and once afterwards. -
Turbulence scheme (TURB).
Turbulent diffusion in the free troposphere is represented by a second-order closure scheme developed by Raschendorfer (2018) which uses a prognostic equation for turbulent kinetic energy. -
CCN activation (QCACT).
The activation of CCN is based on a modification of the Hande et al. (2016) parameterization (see Sect. 2.3 and Appendix A1 for details). -
Homogeneous and heterogeneous ice nucleation (QIFRZ).
Homogeneous freezing is parameterized following Kärcher and Lohmann (2002) and Kärcher et al. (2006). The heterogeneous freezing parameterization is adapted from Hande et al. (2015) and includes parameterizations for immersion and deposition freezing. Their freezing rates increase with decreasing temperature. If cloud droplets are present, immersion freezing is active below −12 ∘C. Deposition nucleation takes place in a temperature range from −20 to −53 ∘C and is scaled by grid-scale variables, such as supersaturation with respect to ice. -
Homogeneous freezing of cloud droplets (QCFRZ).
Freezing of cloud droplets is described by a homogeneous freezing rate increasing exponentially with decreasing temperature (Jeffery and Austin, 1997). Below −50 ∘C all cloud droplets freeze immediately. -
Depositional growth of all ice-phase hydrometeors (QXDEP).
Deposition of vapor on and sublimation from frozen hydrometeors are computed with a relaxation timescale approach (Morrison et al., 2005). The deposition parameters are calculated for the four ice hydrometeor types (ice, snow, graupel, and hail) explicitly. We individually consider diabatic heating from vapor deposition on ice (QIDEP) and snow (QSDEP), as well as the sum of vapor deposition on graupel and hail (QGDEP). -
Riming (QXRIM).
Riming is treated explicitly between the individual hydrometeor types (see Seifert and Beheng, 2006a). A fraction of the rimed mass is redistributed to smaller ice particles if the temperature conditions for the Hallett and Mossop ice multiplication process are met, but this is not associated with any additional latent heat release. We consider heating from the sum of all individual riming processes. -
Freezing of rain (QRFRZ).
The heterogeneous freezing rate of rain increases with decreasing temperature and increasing mean rain drop mass following Bigg (1953). Below −40 ∘C all rain instantly freezes. -
Melting of ice hydrometeors (QXMLT).
Above 0 ∘C frozen hydrometeors melt. Melting rates for snow, graupel, and hail are represented explicitly, while all cloud ice melts immediately. Above 10 ∘C all snow immediately melts, too. We consider the sum of all melting processes. -
Evaporation of melting ice hydrometeors (QSGHEVAP).
Above 0 ∘C, liquid surfaces of melting ice hydrometeors can evaporate (Seifert and Beheng, 2006a). Evaporation of melting ice hydrometeors is treated similarly to evaporation of rain with a constant surface temperature of 273 K. Again we consider the sum of the processes rates for snow, graupel, and hail. -
Evaporation of rain (QREVAP).
Evaporation of rain in subsaturated conditions is based on a parameterization by Seifert (2008) taking into account the rain drop size distribution, which, e.g., allows smaller rain drops to evaporate faster. -
Second saturation adjustment (SATAD II).
The second saturation adjustment after the explicit microphysical processes is called to start the subsequent slow physics parameterizations in an equilibrated state. -
Slow physics parameterizations.
The slow physics processes are only called at a reduced frequency and include parameterizations of convection (CON, dt=600 s), radiation (RAD, dt=1800 s), and non-orographic and orographic gravity wave drag (DRAG, dt=600 s). Furthermore, radiation is calculated from a coarser grid (R03B06). Diabatic temperature tendencies from these processes are also considered in our analysis.
2.3 CCN activation
The recently developed CCN activation scheme (Hande et al., 2016) for the ICON model is optimized for aerosol number concentrations over Germany and based on extensive campaign measurements of aerosol size distributions over land. However, air mass characteristics over continental regions can differ substantially from those over the open ocean (Hudson and Xie, 1999; Wang et al., 2021). As the representation of aerosol concentrations and associated CCN activation influences the cloud droplet number concentration, this can influence WCB cloud characteristics (McCoy et al., 2018). To account for the substantially differing aerosol characteristics over the North Atlantic compared to continental Germany, we modified the CCN activation parameterization based on airborne measurements of size-resolved aerosol number concentrations from three research flights of the British Facility for Airborne Atmospheric Measurements (FAAM) BAe-146 that took place during the NAWDEX campaign in September and October 2016 (CEDA et al., 2016a, b, c; CEDA, 2016). Based on the observed aerosol size distributions a modified parameterization of CCN activation was developed that provides the number of activated cloud droplets Nc as a function of vertical velocity w and pressure p (see Appendix A1 for details):
where Na(p) is the number concentration of aerosols estimated from the observational data, and B(p), C(p) are determined by detailed parcel model simulations of CCN activation (including explicit representation of supersaturation evolution). CCN activation was limited to temperatures above −38 ∘C to prevent production of very large ice number concentrations by CCN activation at low temperatures and immediate subsequent homogeneous freezing of the activated cloud droplets.
Vertical profiles of the predicted CCN number densities from the original parameterization by Hande et al. (2016) (dashed lines) and our modified version (solid lines) are shown in Fig. 2. Both parameterizations have a distinct dependence of CCN number density on vertical velocity (colors) and pressure. The new parameterization broadly reflects lower CCN concentrations over the North Atlantic compared to central Europe. However, aerosol concentrations over the North Atlantic are subject to substantial variability (as already evident from the three flights shown in Fig. A1c and used here). This variability cannot be captured by the parameterization, but for future analysis, systematic sensitivity experiments with varying CCN concentrations taking into account the variability of aerosol number concentrations will be performed.
Appendix A2 provides a comparison of two limited-area simulations applying the modified and original CCN activation schemes. While qualitatively the key diabatic heating contributions do not significantly depend on the adjustment of the CCN activation scheme, this provides a baseline for subsequent detailed CCN sensitivity experiments with more realistic assumptions about marine CCN variability.
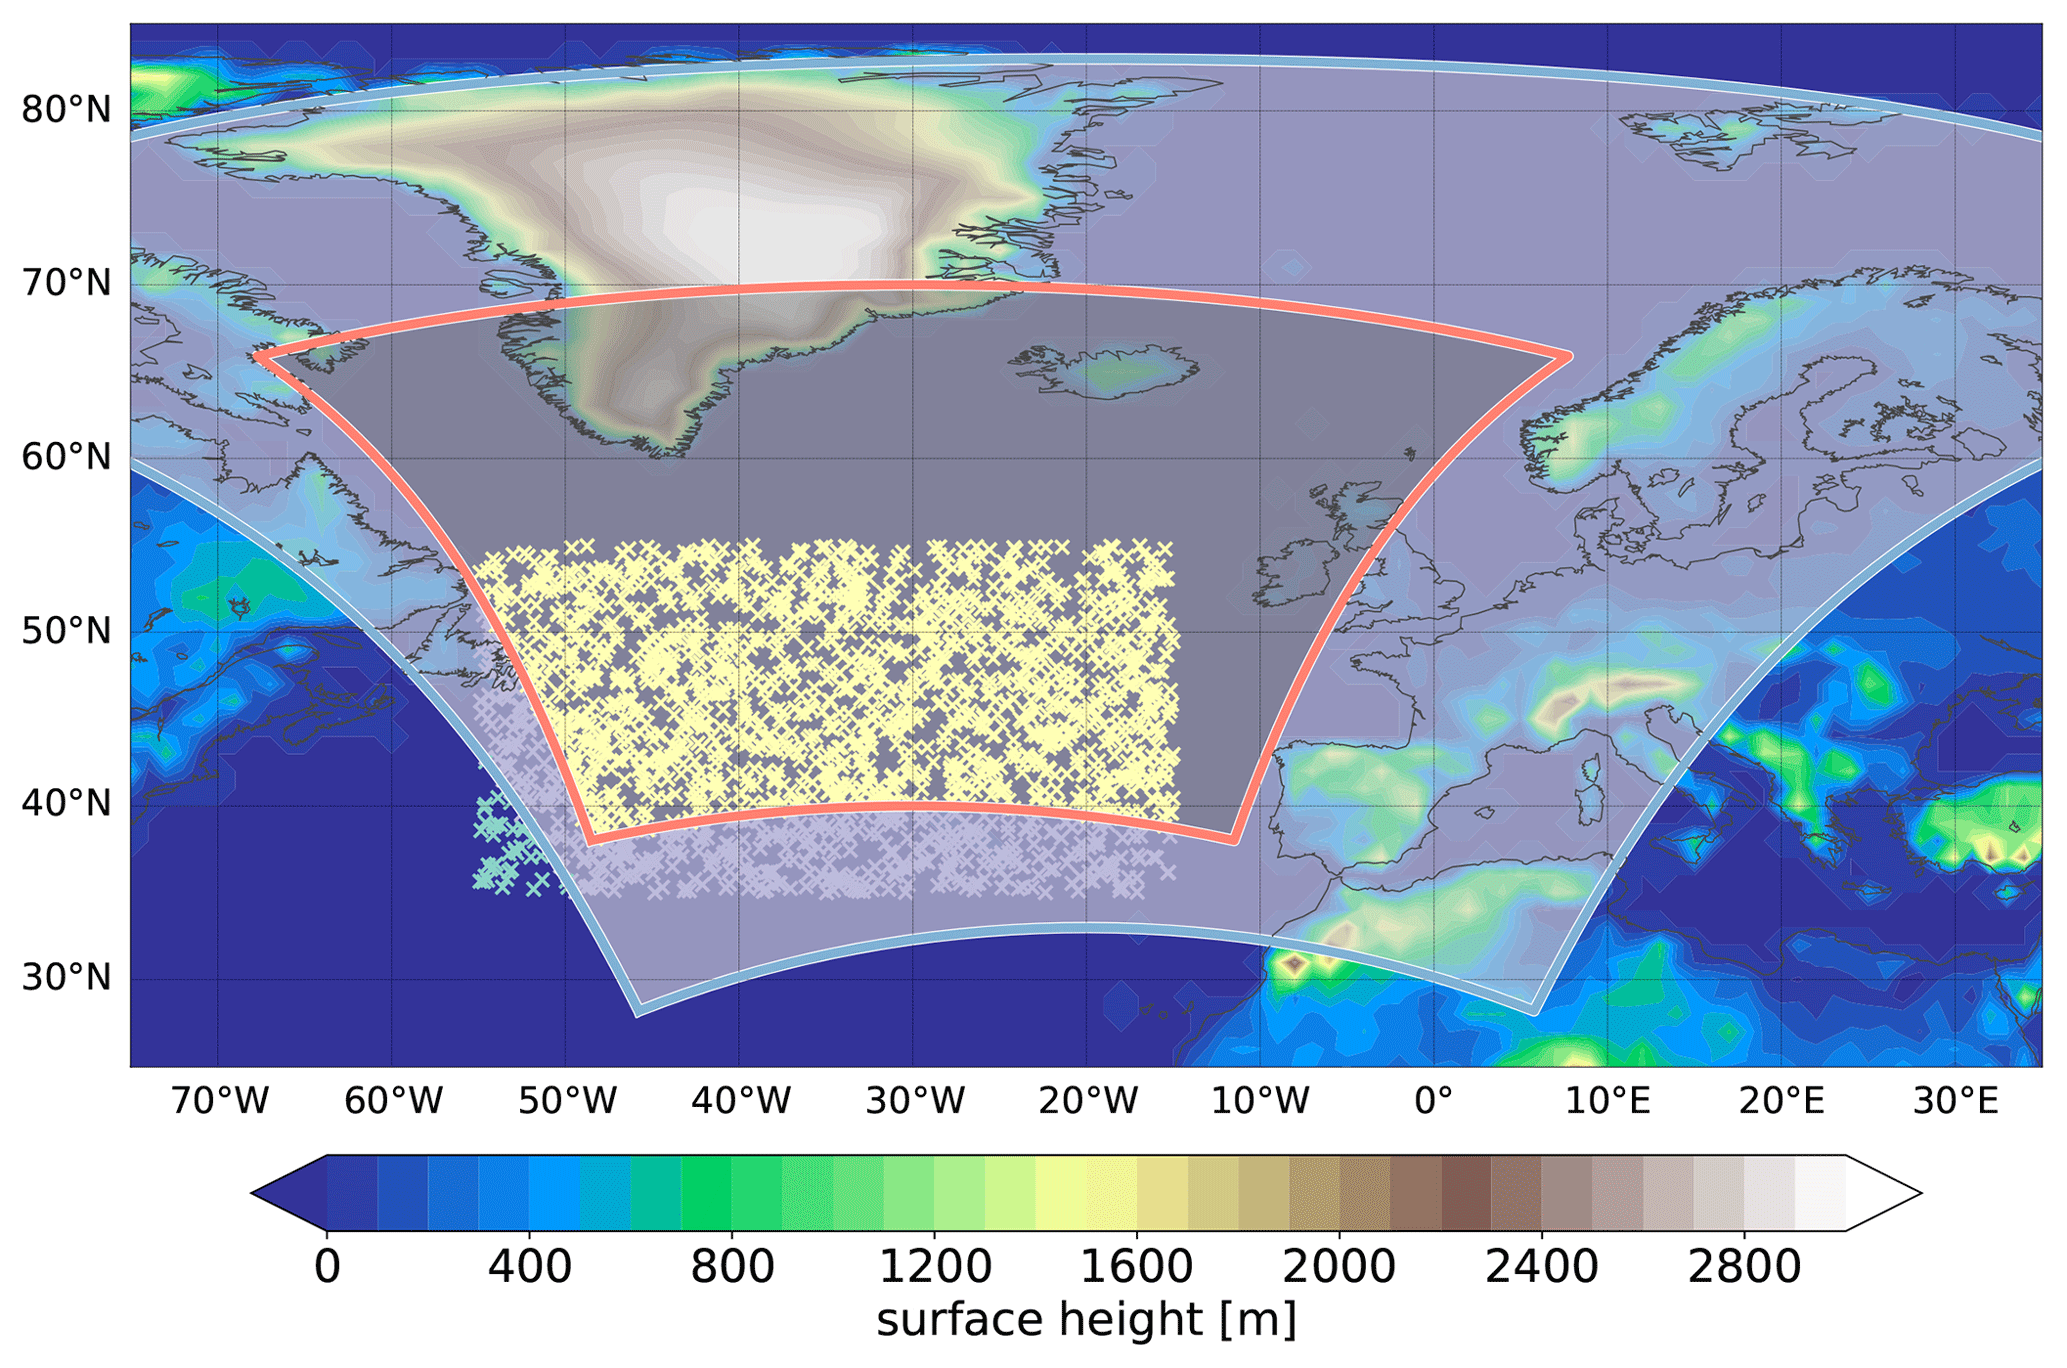
Figure 1Refined nested domains and trajectory starting position in the global domain (R03B07, green x) in the first refined nest (R03B08, purple x) and in the second refined convection-permitting nest (R03B09, yellow x). Domain boundaries of both refined nests are shown in blue and red. The shading shows the surface altitude (in m).
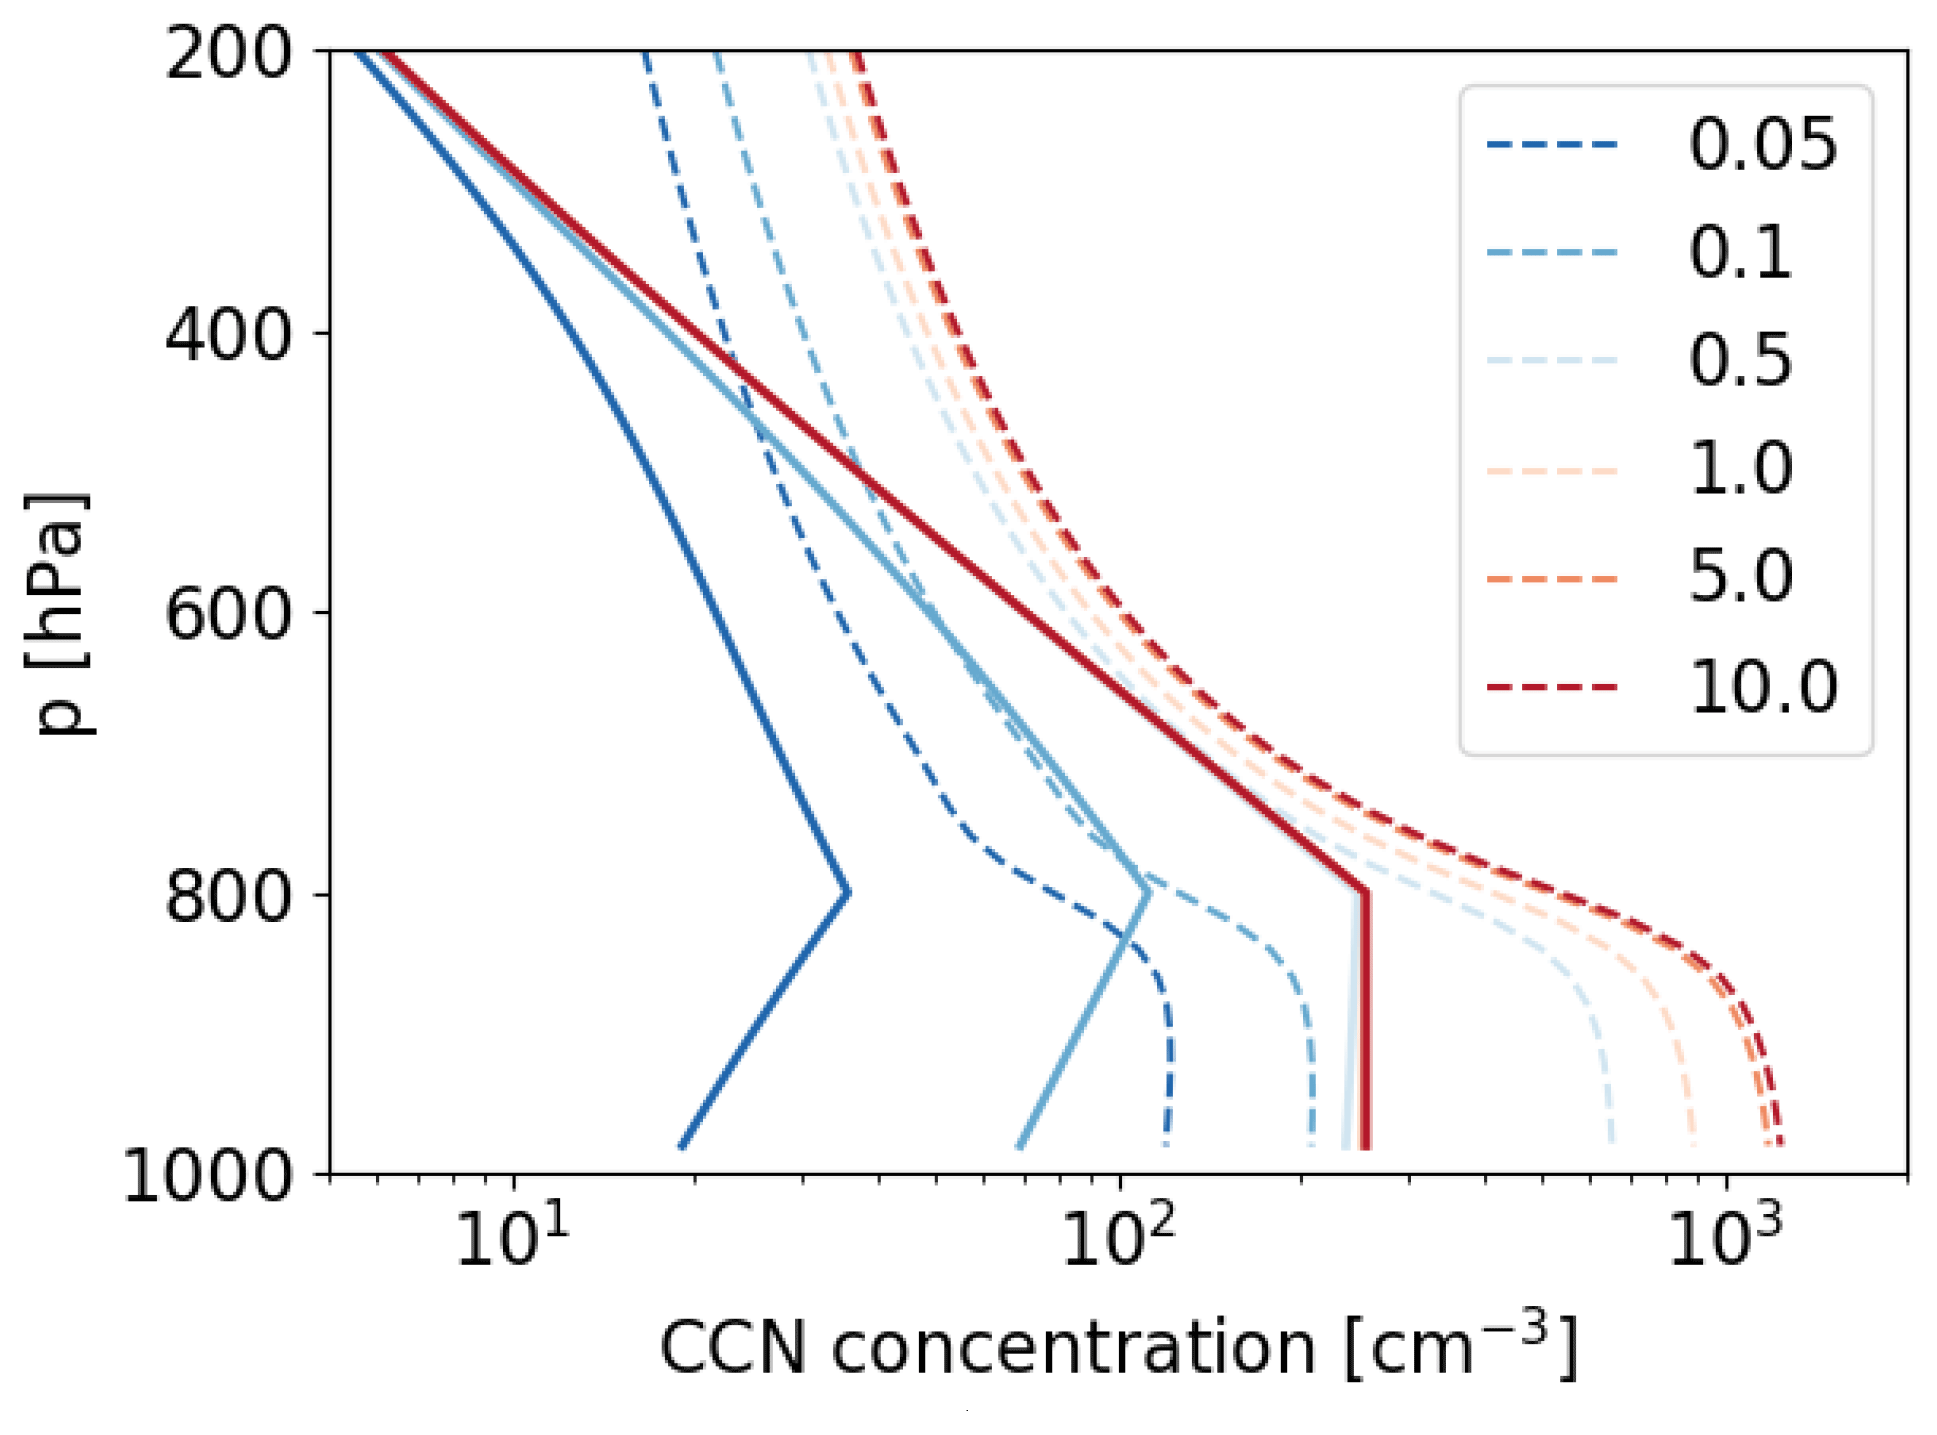
Figure 2Vertical profiles of original (dashed) and modified (solid) parameterized CCN concentrations (in cm−3) for different vertical velocities (colors, in m s−1).
2.4 Diabatic heating and PV rates
Latent heat release during phase changes of water is associated with diabatic heating. We calculate potential temperature tendencies from all individual microphysical processes described in Sect. 2.1 following Joos and Wernli (2012). The diabatic heating rates (DHRs) are defined for each individual microphysical process as
with the individual microphysical process rates Sj (i.e., the hydrometeor source and sink terms of the respective microphysical processes listed in Table 1 and Sect. 2.2) and the according latent heat of freezing ( J kg−1), sublimation ( J kg−1), or vaporization ( J kg−1); the specific heat at constant pressure cp=1004.64 J kg−1 K−1; the potential temperature θ; and , with the specific gas constant of air R=287 J kg−1 K−1.
Analogously, the instantaneous PV rates (PVRs) from individual microphysical processes are calculated (e.g., Joos and Wernli, 2012; Crezee et al., 2017; Spreitzer et al., 2019) as
with
where ρ is density, and ζ is the 3D vorticity vector.
For comparison, bulk diabatic heating and related PV tendencies from other parameterization schemes, i.e., long- and shortwave radiation, turbulence, convection, and drag, are also considered (Table 1). Note that Eq. (3) neglects the change in PV from momentum tendencies (,,), which can arise from friction, diffusion, and turbulence (Spreitzer et al., 2019; Rivière et al., 2021). Thus, the modification of PV through momentum tendencies that are parameterized in the turbulence, convection, and drag schemes is not included in this analysis.
2.5 Online trajectories
Although WCBs are large-scale airstreams that can readily be identified with offline trajectories, i.e., trajectories calculated after the model simulation based on wind field output with low temporal resolution, recent studies have employed high-resolution online trajectories to represent smaller-scale heterogeneities in the WCB cloud band (e.g., Rasp et al., 2016; Oertel et al., 2020, 2021; Blanchard et al., 2020). These trajectories are computed during the model simulation, i.e., solving the trajectory equation with the actual wind fields at each model time step. A high temporal resolution of the solution is particularly useful if detailed microphysical processes are considered (Miltenberger et al., 2016, 2020; Mazoyer et al., 2021). The major advantages of using online trajectories for this study are (i) the wind fields which are used to compute the trajectory position are considered at every model time step, and (ii) the microphysical process rates are integrated online at every model time step (Eq. 5). The available online trajectory module in ICON (Miltenberger et al., 2020) is based on the COSMO online trajectory module (Miltenberger et al., 2013, 2014) with modifications to accommodate the unstructured ICON grid.
In the two-way nested simulations we use here, it is not sufficient to follow air parcels in only one nest if the full evolution of the WCB from pre-ascent to outflow is of interest, which covers a scale of approximately 1000 km. Therefore, we implemented nesting support in the ICON online trajectory module; i.e., for the first time trajectories are allowed to enter or leave a refined nest and are passed on across the border of the nest. The trajectories' positions and properties are always calculated from the resolved wind fields in the nest with the highest spatial resolution at a given geolocation and using the corresponding model time step. This way, trajectories profit from the high resolution in the refined nest; however, they are not limited to this region. As the trajectory positions are calculated from resolved wind fields, convective updrafts parameterized by the deep convection scheme used in the global domain cannot explicitly be represented.
To reduce the number of trajectories, starting positions are limited to six vertical levels between 200 and 1500 m and approximately 1900 longitude and latitude positions pre-defined based on offline WCB calculations with LAGRANTO (Sprenger and Wernli, 2015) for this case study (Fig. 1). The starting region between −55 to −15∘ E and 35 to 55∘ N encompasses all three domains; however, the largest number of trajectories starts in the innermost convection-permitting nest which covers the main WCB ascent region. In total, approximately 11 500 online trajectories are started every 1 h during the 72 h simulation.
Along online trajectories we compute the accumulated diabatic heating (ADH) and PV change (APV), similar to the methodology developed and applied by Crezee et al. (2017), Spreitzer et al. (2019), and Attinger et al. (2019) for offline trajectories. Accumulated heating and PV change are defined by the sum of instantaneous rates along the path of the trajectory at every domain-specific model time step Δt, i.e., 120, 60, and 30 s for the global domain and both refined nests, respectively (see Sect. 2.1):
with i=1 corresponding to initialization of each trajectory and being the length of the trajectory (difference between initialization time tinit of each trajectory and end time of the ICON simulation tend). Trajectory position and properties (Table 1) are subsequently output every 15 min.
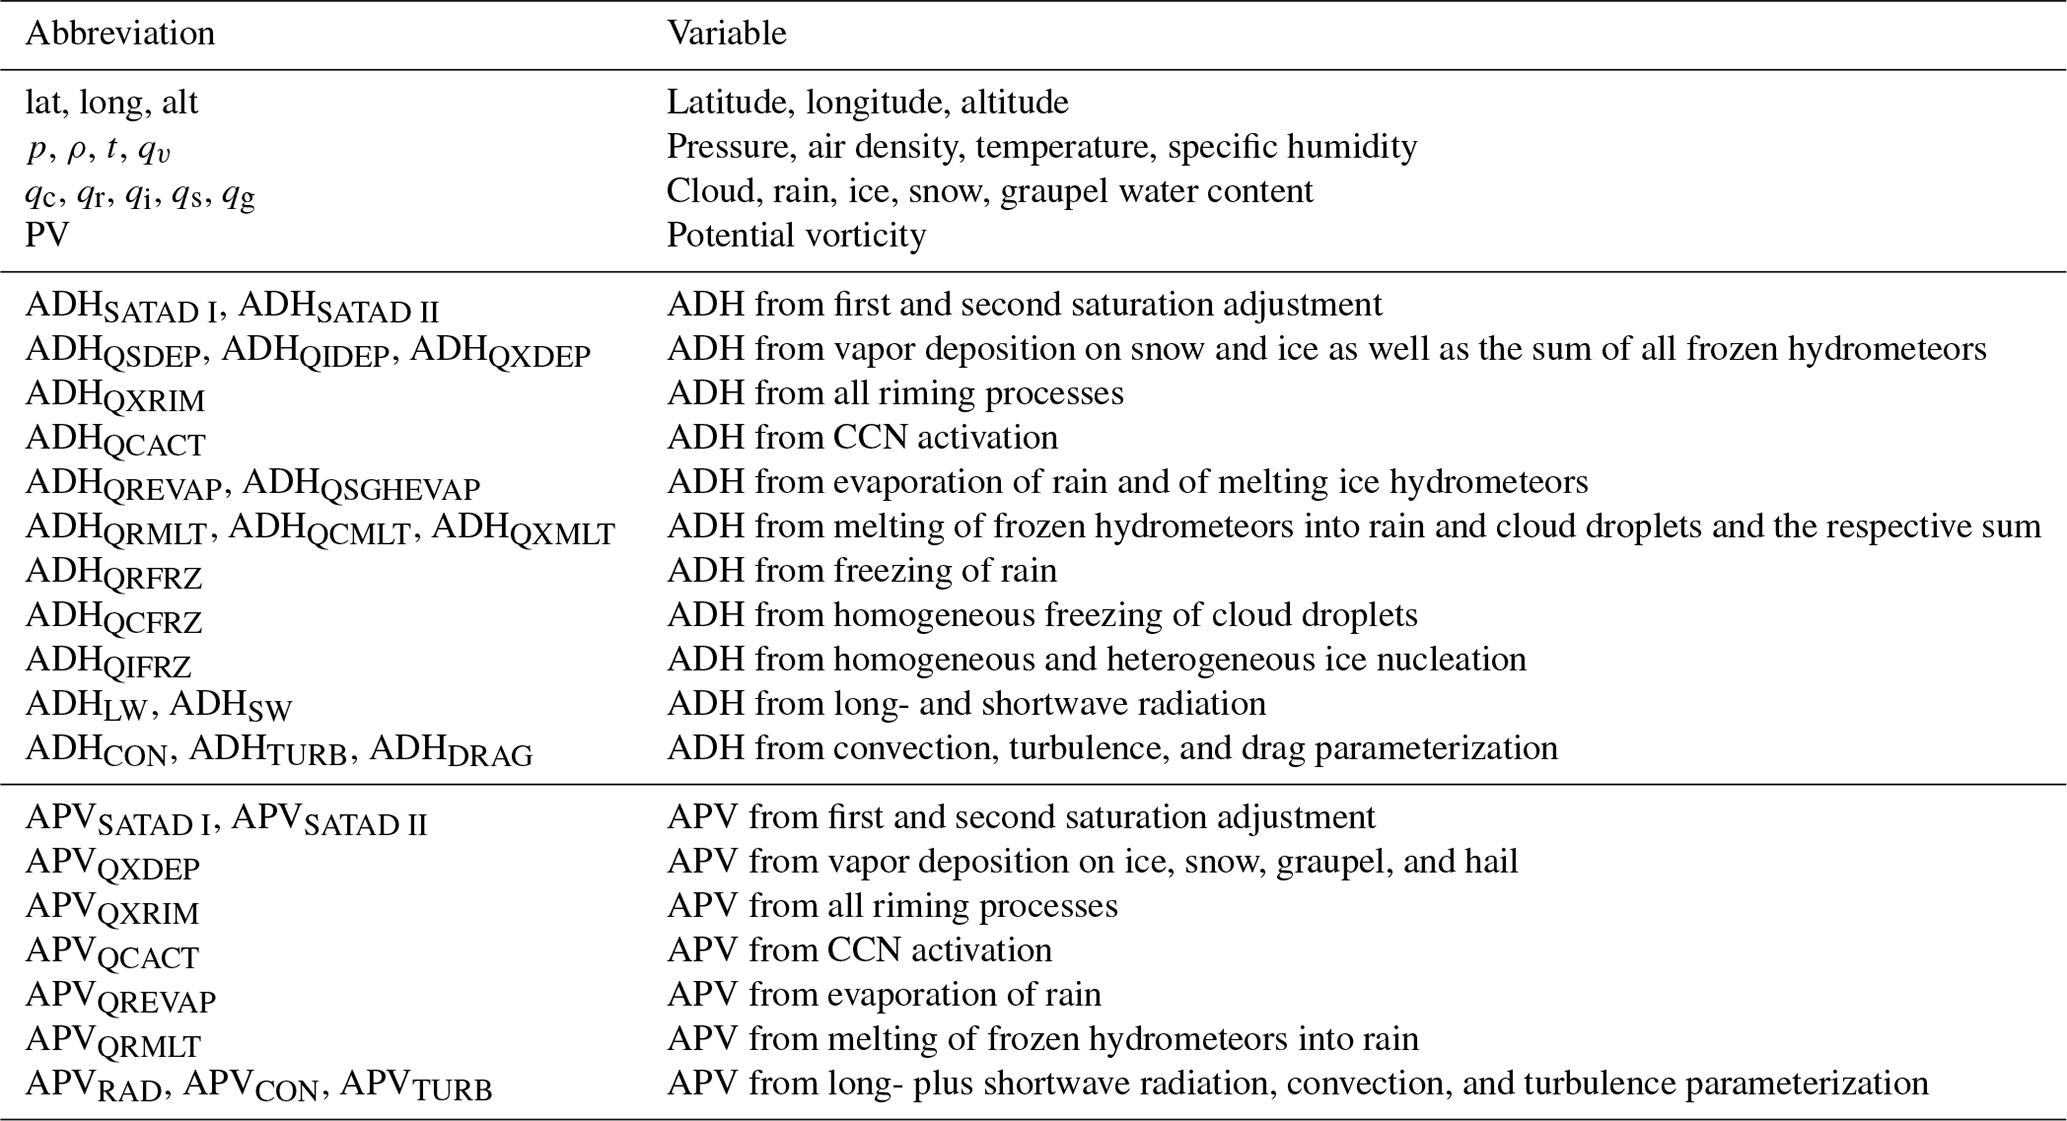
Table 1List of available variables along online trajectories. The variables are grouped in (i) atmospheric state variables (whose values are output instantaneously), (ii) integrated diabatic heating rates (ADHs), and (iii) integrated diabatic PV rates (APVs).
From all online trajectories, we select WCB trajectories as trajectories with an ascent rate of at least 600 hPa in 48 h (Wernli and Davies, 1997; Madonna et al., 2014; Oertel et al., 2019) and subsequently define the ascent phase as the period encompassing the fastest 600 hPa ascent. This 600 hPa ascent phase can be described by a timescale (τ600), which defines the minimum time required to ascend 600 hPa (Oertel et al., 2021).
The start of the fastest 600 hPa ascent (t0) along each trajectory is defined as the start of WCB ascent. To compare the heating among trajectories with differing lengths prior to t0, ADH is set to 0 at the start of the fastest 600 hPa ascent phase; i.e., ADH at t0 is subtracted from ADH.
2.6 Front-relative WCB composites
In addition to the trajectory perspective, we consider cold-front-relative vertical cross-section composites across the WCB cloud band, which encompass a primary WCB ascent region (see Sect. 3 for details). Figure 3a–c (black markers) illustrate WCB air parcel locations ascending in the cyclone's warm sector ahead of the front, and Fig. 3d–f show the corresponding large-scale cloud band. Therefore, west–east-oriented vertical cross-section composites are considered, which are centered at the western edge of the WCB ascent region identified from Eulerian model fields by the convolutional neural network (CNN) model for WCB ascent, ELIAS 2.0 (Quinting and Grams, 2022). The CNN model computes conditional WCB ascent probabilities based on the distribution of horizontal wind speed, temperature, geopotential, and specific humidity on selected pressure levels which are taken from the global ICON simulation and are interpolated to a regular 1.0∘ × 1.0∘ grid. As shown by Quinting and Grams (2022), ELIAS 2.0 adequately represents the WCB ascent footprint and provides a smooth mask of the WCB ascent region. Quinting et al. (2022) compared WCB ascent footprints based on coarse-grained Eulerian fields from a high-resolution ICON simulation with offline trajectories that were computed from a 0.1∘ × 0.1∘ grid and found a good agreement between the location of trajectory ascent and the CNN-based footprint. Section 3 and Fig. 3 illustrate that this also applies to the online trajectories.
The vertical cross-section composites are calculated from individual zonal cross-sections through the WCB ascent region ahead of the cold front (here defined as the region where the conditional probability of the CNN exceeds 0.3; Quinting and Grams, 2022) using data from the first refined nest (R03B08) with a zonal grid spacing of 0.1∘. The composites include all individual cross-sections within the latitudinal band covered by the CNN ascent mask during 4 to 5 October. The cross-section composites illustrate the vertical cloud structure associated with the ascending WCB airstream and demonstrate the spatial distribution of diabatic heating and PV change.
The surface cyclone associated with the WCB initially develops on 2 October 2016 as weak sea level pressure (SLP) depression in a strong baroclinic zone east of 60∘ W at approximately 45∘ N and is associated with a local positive low-level PV anomaly. It propagates across the North Atlantic along the baroclinic zone at 45∘ N and has characteristics of a so-called diabatic Rossby wave (DRW; Boettcher and Wernli, 2013). On 3 October, the surface cyclone interacts with the approaching upper-level trough, intensifies further, and develops clear warm and cold frontal structures. At this stage, the cyclone forms an extended cloud band, which is associated with poleward-directed WCB ascent, and subsequently propagates northward ahead of the upper-level trough. On 4 and 5 October, the WCB (represented by green contours in Fig. 3) ascends in the cyclone's warm sector ahead of the upper-level trough and into an amplifying ridge downstream (red contour in Fig. 3), which extends far north to 70∘ N. The ridge subsequently merged with a precursor ridge built up by an intense precursor cyclone (Steinfeld et al., 2020; Flack et al., 2021) and contributed to the long-lasting block Thor (Maddison et al., 2019). Here, we focus on the period from 4–6 October when the WCB ascent is the most pronounced and forms a large-scale cloud band (Fig. 3d–f).
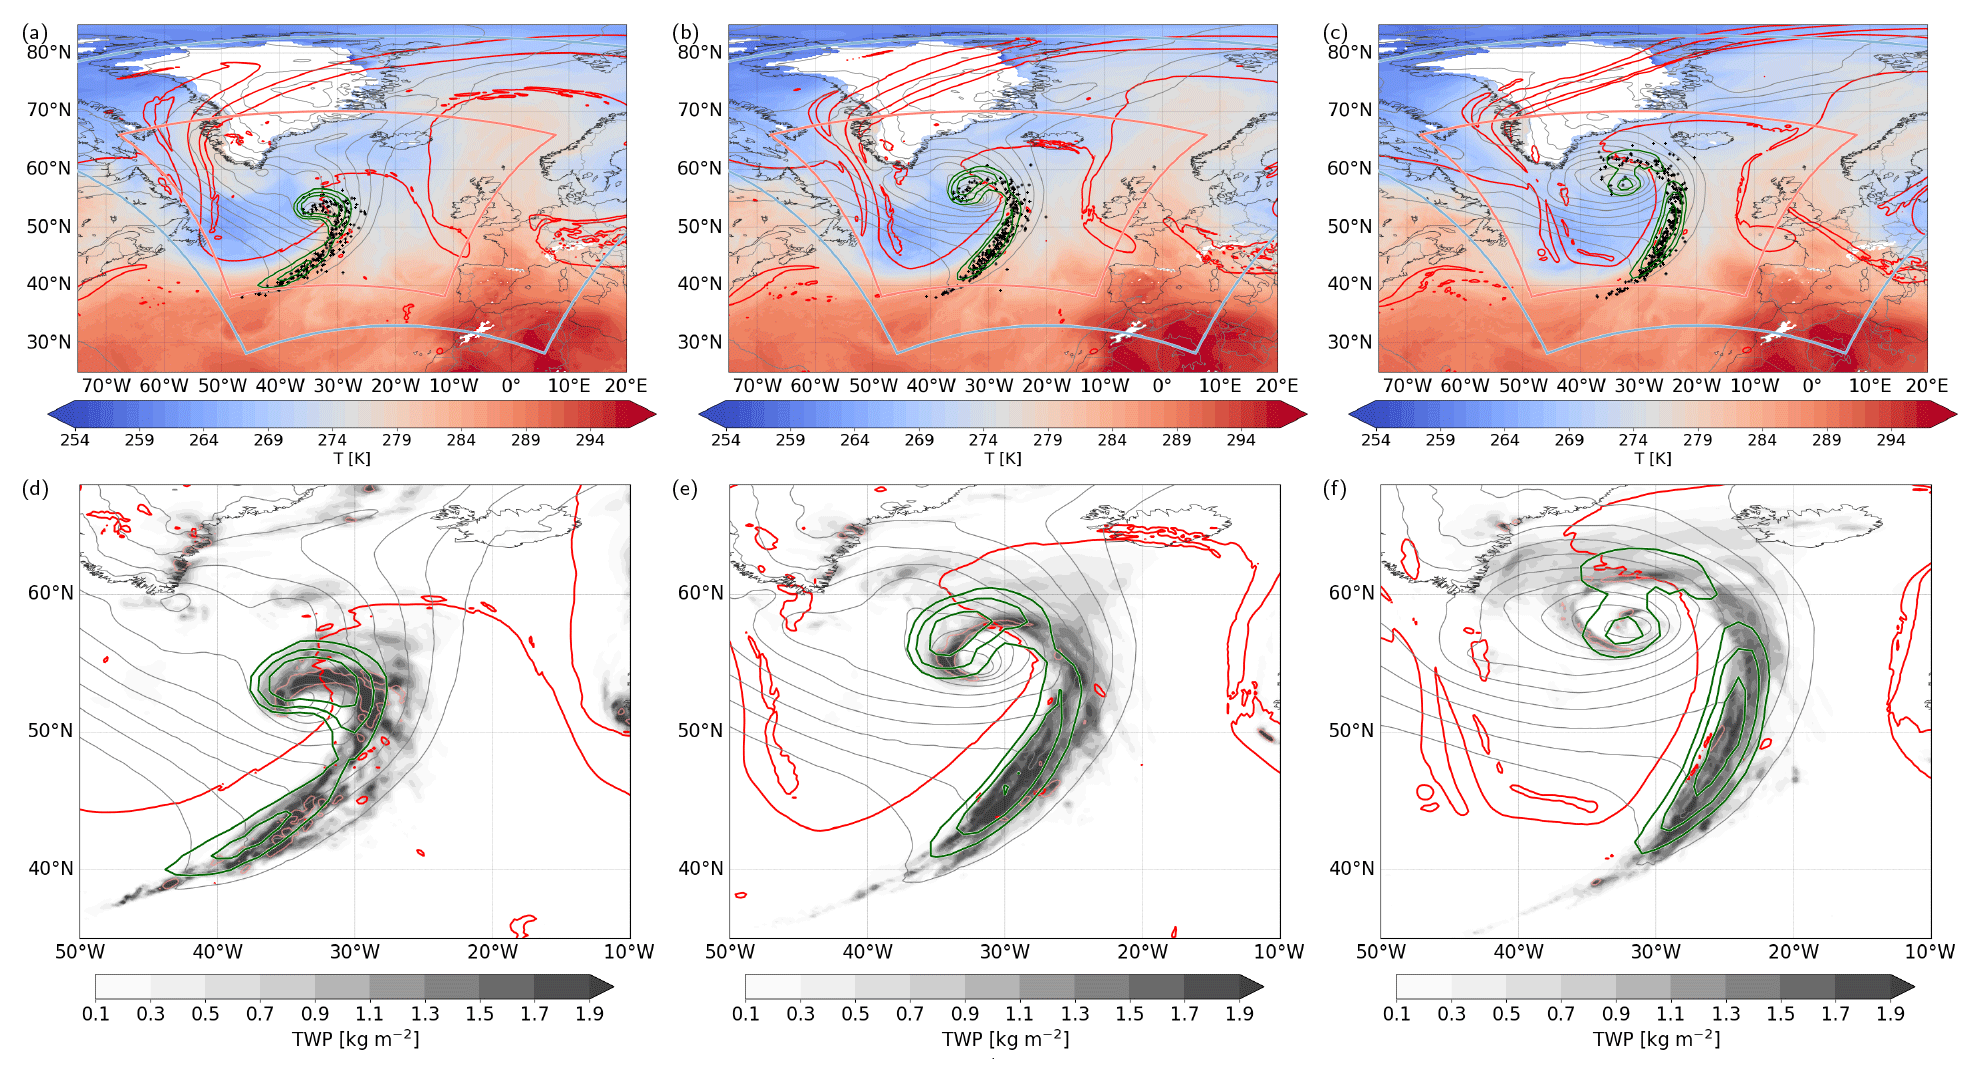
Figure 3(a–c) Temperature at 850 hPa (shading, in K); SLP (grey contours, every 5 hPa); 2 PVU at 320 K isentrope (red contour); WCB ascent probability (at conditional probabilities of 0.3, 0.5, and 0.7, green contours); and online WCB trajectory positions for trajectories ascending at least 25 hPa in 2 h (black markers; only every 50th trajectory is shown) for (a) 12:00 UTC on 4 October, (b) 18:00 UTC on 4 October, (c) and 00:00 UTC on 5 October. The first and second refined nests are outlined in blue and red. (d–f) Total water path (TWP; shading, in kg m−2) and graupel water path (pink contour, at 0.3 kg m−2), SLP (grey contours, every 5 hPa), 2 PVU at 320 K isentrope (red contour), and WCB ascent probability (at conditional probabilities of 0.3, 0.5, and 0.7, green contours) for the same times as shown above. All data are from the R03B07 grid.
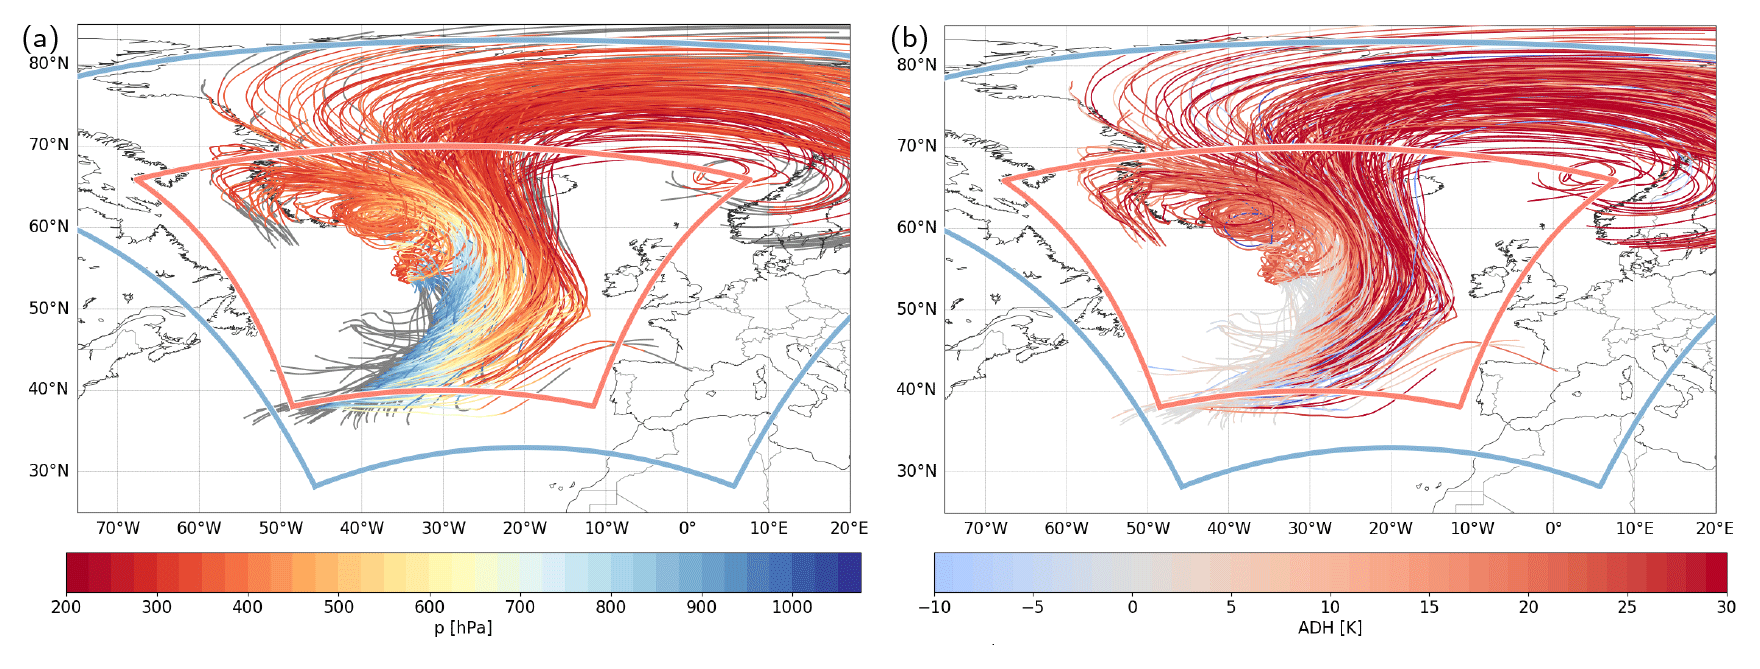
Figure 4Online WCB trajectories starting their fastest 600 hPa ascent at 12:00 UTC on 4 October, colored according to (a) pressure (p, in hPa) and (b) ascent-integrated diabatic heating from all microphysical processes (ADH, in K). In (a) the WCB trajectory positions prior to the start of the fastest ascent and after 48 h ascent time are shown in grey. The refined nests are outlined in blue and red.
Between 4 and 5 October, WCB air parcel locations, identified from online trajectories, ascend poleward in the warm sector of the cyclone ahead of the surface cold front, above the warm front, and near the cyclone center (black markers in Fig. 3a–c). Their ascent is associated with the formation of an extended, dense cloud band (Fig. 3d–f), including the formation of graupel near the frontal regions in the early ascent phase (Fig. 3d). Although WCB trajectories spread out in the ridge once they reach the upper troposphere, the major ascending motion is confined to the near-frontal regions (Fig. 3a–c), where WCB ascent occurs primarily in a narrow and elongated north–south-oriented band. In general, the location of the ascending segment of the online WCB trajectories is well captured by the CNN-based WCB ascent diagnostic (green contours in Fig. 3a–c), which thus proves useful for diagnosing footprints of WCB ascent from Eulerian data in high-resolution simulations as well.
The ascent of the selected approximately 36 000 WCB trajectories predominantly takes place in the innermost convection-permitting nest providing a high resolution for WCB trajectory computation (Figs. 3a–c and 4). Some WCB trajectories move into the highest-resolution nest before or during their ascent (Fig. 4). Moreover, many trajectories leave the highest-resolution nest once they reach the upper troposphere near the strong jet region. This emphasizes that the transfer of trajectories between different nests is important, in particular if the upstream evolution and the downstream impact of WCB trajectories are of interest. During the transfer of the trajectories across the nest boundaries, no discontinuities in location or WCB trajectories' properties can be observed, which is illustrated exemplarily for the evolution of pressure (Fig. 4a) and integrated diabatic heating from all microphysical processes along WCB trajectories (Fig. 4b; see Sect. 4 for a detailed description of diabatic heating along WCB trajectories).
Figure 5 illustrates the vertical WCB cloud structure and hydrometeor distribution in west–east-oriented vertical cross-section composites centered relative to the western boundary of the CNN-based WCB ascent region during 2 d of WCB ascent (see Sect. 2.6). WCB ascent (black contour in Fig. 5d) occurs in the warm sector ahead of the sloping cold front (isentropes and temperature in Fig. 5a) and upper-tropospheric trough (reflected in the reduced height of the dynamical 2 PVU tropopause, shading in Fig. 5b) and is associated with a vertically extended cloud (Fig. 5c). The precipitating WCB cloud band, reflected in the high values of the total hydrometeor content (shading in Fig. 5c), extends from the surface to approximately 11 km height and slopes towards the east into the upper-level ridge, which is characterized by an elevated tropopause height, warmer temperature, and low upper-tropospheric PV values (Fig. 5a, b). Within the WCB cloud band, the 0 ∘C isotherm is located at approximately 3 km altitude, and the mixed-phase region of the cloud extends from approximately 2 to 6 km (Fig. 5c). The presence of supercooled liquid water facilitates riming and graupel formation between 2–4 km altitude. The microphysical processes lead to a large net diabatic heating in the cloud, while below the cloud, microphysical processes are associated with a net cooling (Fig. 5d). Diabatic heating contributions from individual microphysical processes are discussed in Sect. 4. As expected, the cloud band coincides with ascending motion on the order of 0.01 to 0.08 m s−1 averaged across all individual cross-sections, while the postfrontal region west of the cold front is characterized by descent (Fig. 5d). The vertical cross-section composites illustrate the general characteristics of the WCB cloud band and ascent region; however, the compositing technique hides the heterogeneity of WCB ascent behavior and characteristics reported in previous studies (Oertel et al., 2019; Blanchard et al., 2020; Boettcher et al., 2021; Oertel et al., 2021) and which is evident in instantaneous cross-sections. The online trajectories enable a more detailed perspective of the individual processes and detailed WCB ascent behavior.
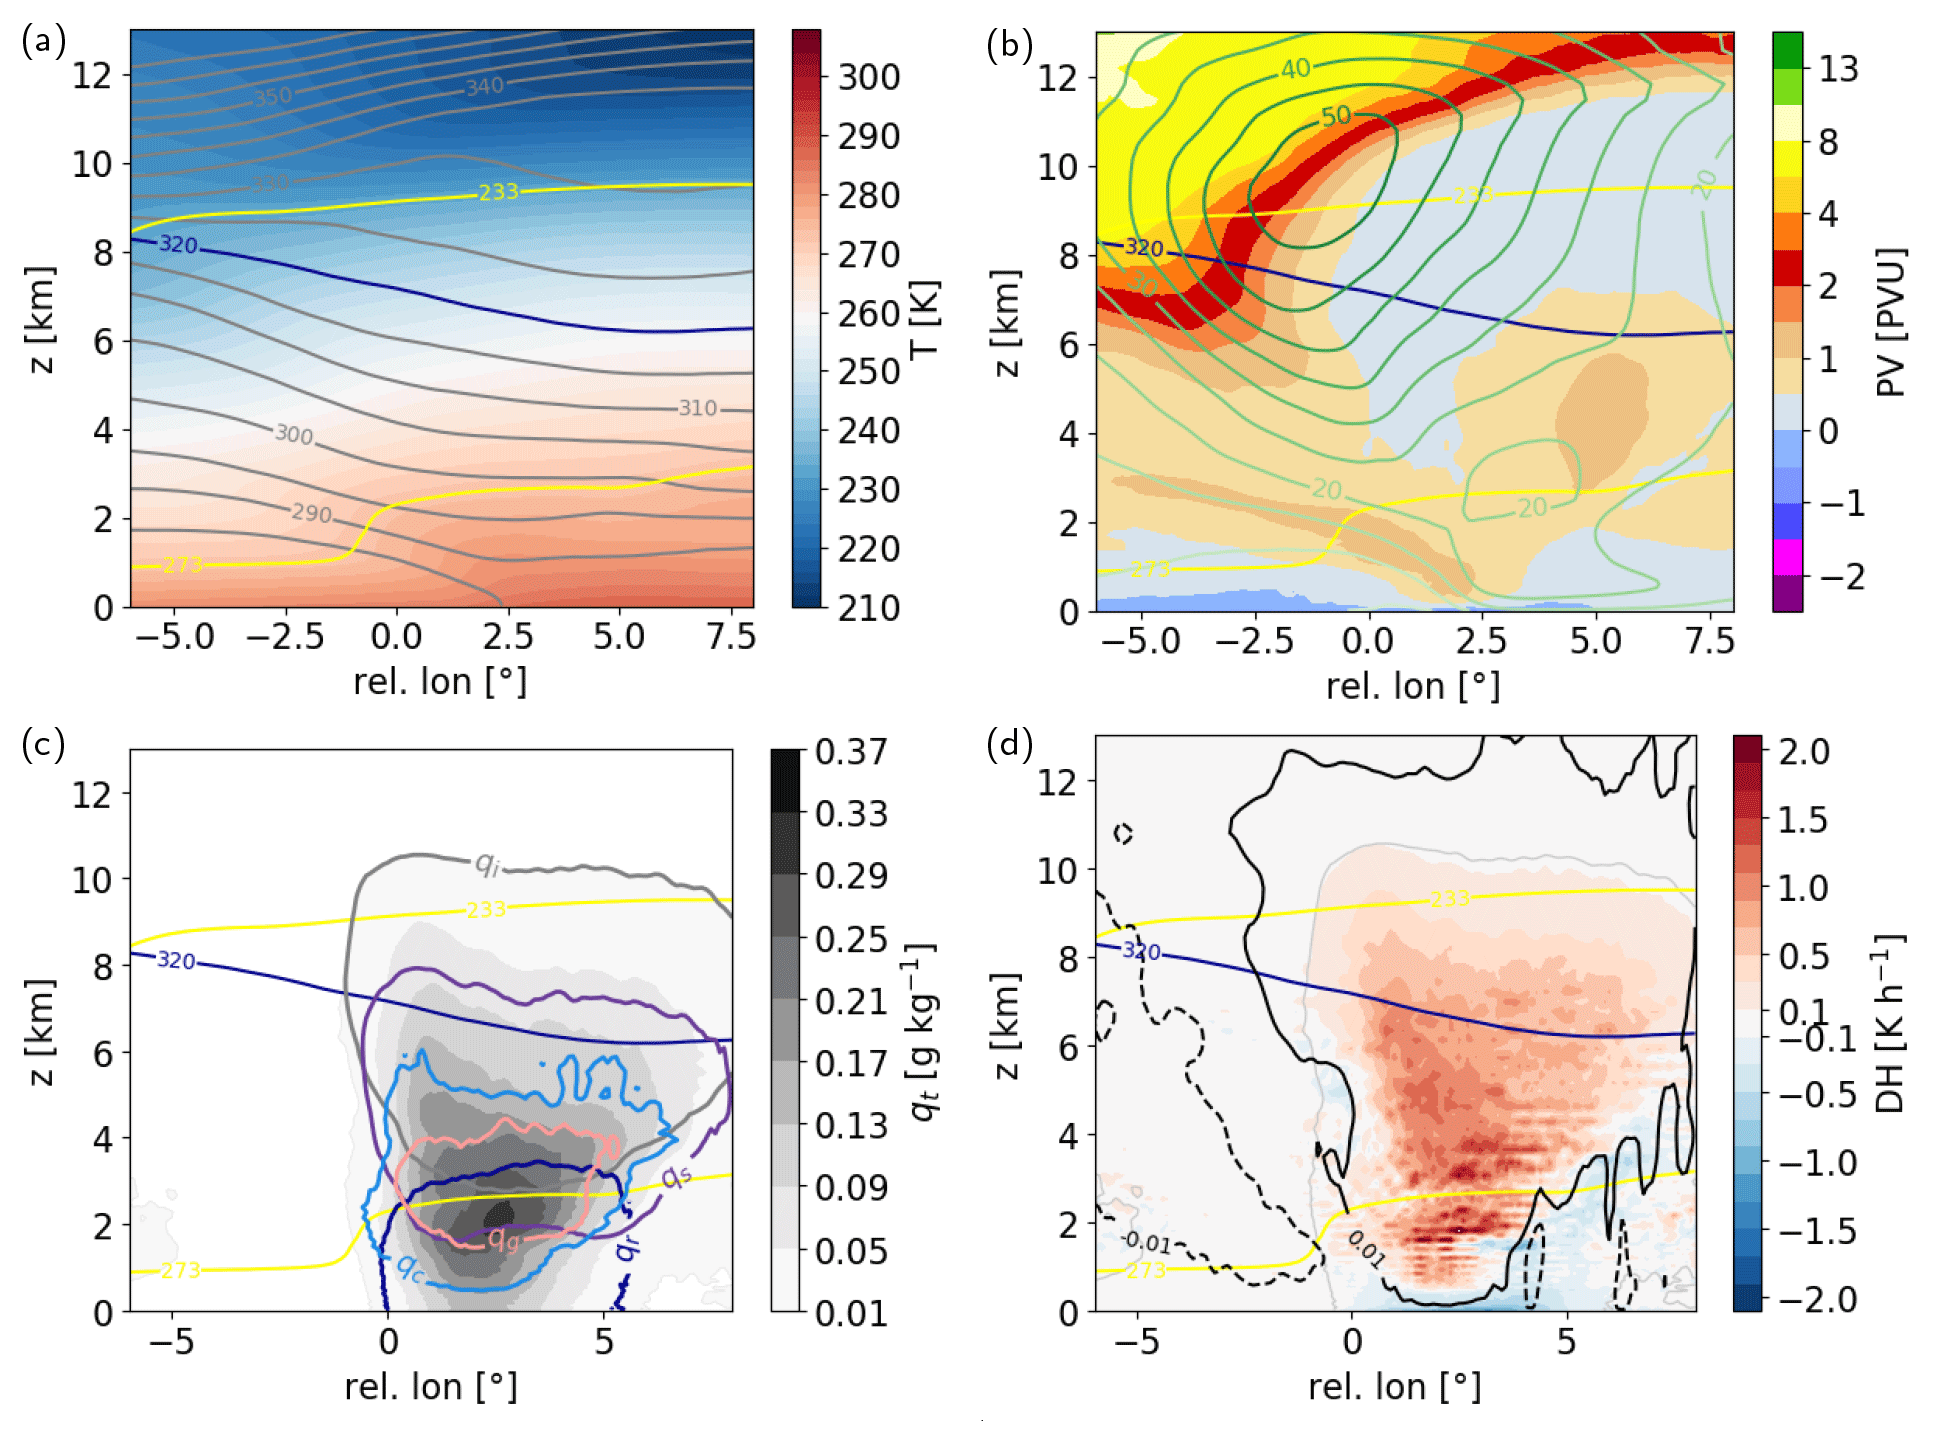
Figure 5Vertical cross-section composites through the WCB ascent region ahead of the cold front for (a) temperature (T, in K) and potential temperature (every 5 K, grey lines); (b) potential vorticity (PV, in PVU) and wind speed (every 5 m s−1); (c) total hydrometeor content (qt, in g kg−1; shading) and rain (qr; blue contour, at 0.02 g kg−1), cloud (qc; light blue contour, at 0.02 g kg−1), snow (qs; purple contour, at 0.01 g kg−1), ice (qi; grey contour, at 0.01 g kg−1), and graupel (qg; pink contour, at 0.02 g kg−1) water content; and (d) total microphysical diabatic heating rate (DH; in K h−1), vertical velocity (black contours at −0.01 and 0.01 m s−1), and outline of WCB cloud (grey line, at qt=0.01 g kg−1). All panels show 273 and 233 K isotherms (yellow) and 320 K isentrope (blue).
During the trajectories' 48 h ascent from on average 950 hPa to 300–400 hPa (Fig. 6a), they are heated diabatically by on average approximately 25 K (Fig. 6c), resulting in a cross-isentropic ascent from around 290 K to about 315 K (Fig. 6b). However, substantial variability in ascent behavior and associated diabatic heating is present. The ascent timescale for 600 hPa ascent (τ600) exhibits a large variability and includes both very rapid convective WCB ascent with timescales of a few hours and slow and gradual WCB ascent (Fig. 7), which is hidden in the composite perspective. The frequency distribution of τ600 values shows that most WCB trajectories ascend 600 hPa in 20–30 h (Fig. 7a). Thus, the average trajectory ascent timescale is considerably lower than 48 h and amounts to on average 25 h, similar to WCB ascent timescales reported in previous high-resolution case studies (Rasp et al., 2016; Oertel et al., 2020, 2021; Blanchard et al., 2020). In general, the 600 hPa integrated diabatic heating ranges from 15 K to more than 35 K (Fig. 7a). The latter is only found in rapidly ascending, convective WCB trajectories. Due to the large variability in ascent rates, the entire set of WCB trajectories is stratified into three subsets according to their ascent timescale, which influences the average diabatic heating and detailed microphysical processes. In the following, fast ascent is characterized by τ600 values below 18 h (25th percentile), and slow and gradual ascent is characterized by τ600 values above 30 h (75th percentile). The intermediate subset includes all trajectories with τ600 values in between and, hence, comprises the largest number of trajectories (Fig. 7a). The mean evolution of the three subsets of WCB trajectories is shown in Fig. 6.
As on average the faster-ascending trajectories are heated more strongly, they also reach higher isentropic surfaces (Figs. 7a and 6b, c) than the slowly ascending trajectories, in line with previous case studies (Oertel et al., 2020, 2021). Despite the relationship between total diabatic heating and ascent timescale, there is still considerable variability per ascent timescale bin (Fig. 7a). Generally, the faster trajectories ascend and also reach the upper troposphere further south ahead of the upper-level trough (not shown).
Recent WCB case studies have highlighted that convective motion can frequently be embedded in the gradual WCB ascent (Rasp et al., 2016; Oertel et al., 2019, 2021; Blanchard et al., 2020, 2021). Yet, the total diabatic heating contribution of embedded convection in WCBs has remained unclear. Figure 7b shows the cumulative distribution of the relative heating contribution of trajectories binned into 1 h τ600 bins. For example, trajectories with a 600 hPa ascent timescale below 10 h contribute on average 10 % to total diabatic heating in this case study (Fig. 7b), although their averaged diabatic heating is substantially larger (Fig. 7c) compared to trajectories with slower ascent timescales. For example, WCB trajectories with ascent timescales above 25 h are on average heated 10 K less but, due to their larger number, still contribute more than 43 % to total heating (Fig. 7b). Selecting thresholds of τ600 of 3, 4, and 7 h (the latter shows a sudden drop of mean ADH in this case study) for embedded convective or rapid ascent results in contributions to the total heating of 1.4 %, 2.1 %, and 4.9 %, respectively. Thus, although rapidly ascending WCB trajectories are heated significantly more than gradually ascending trajectories, their total diabatic heating contribution is relatively small due to the small fraction of embedded convection. Relative contributions may, however, be more relevant in other case studies that are characterized by a larger amount of embedded convection than this WCB (e.g., Oertel et al., 2021).
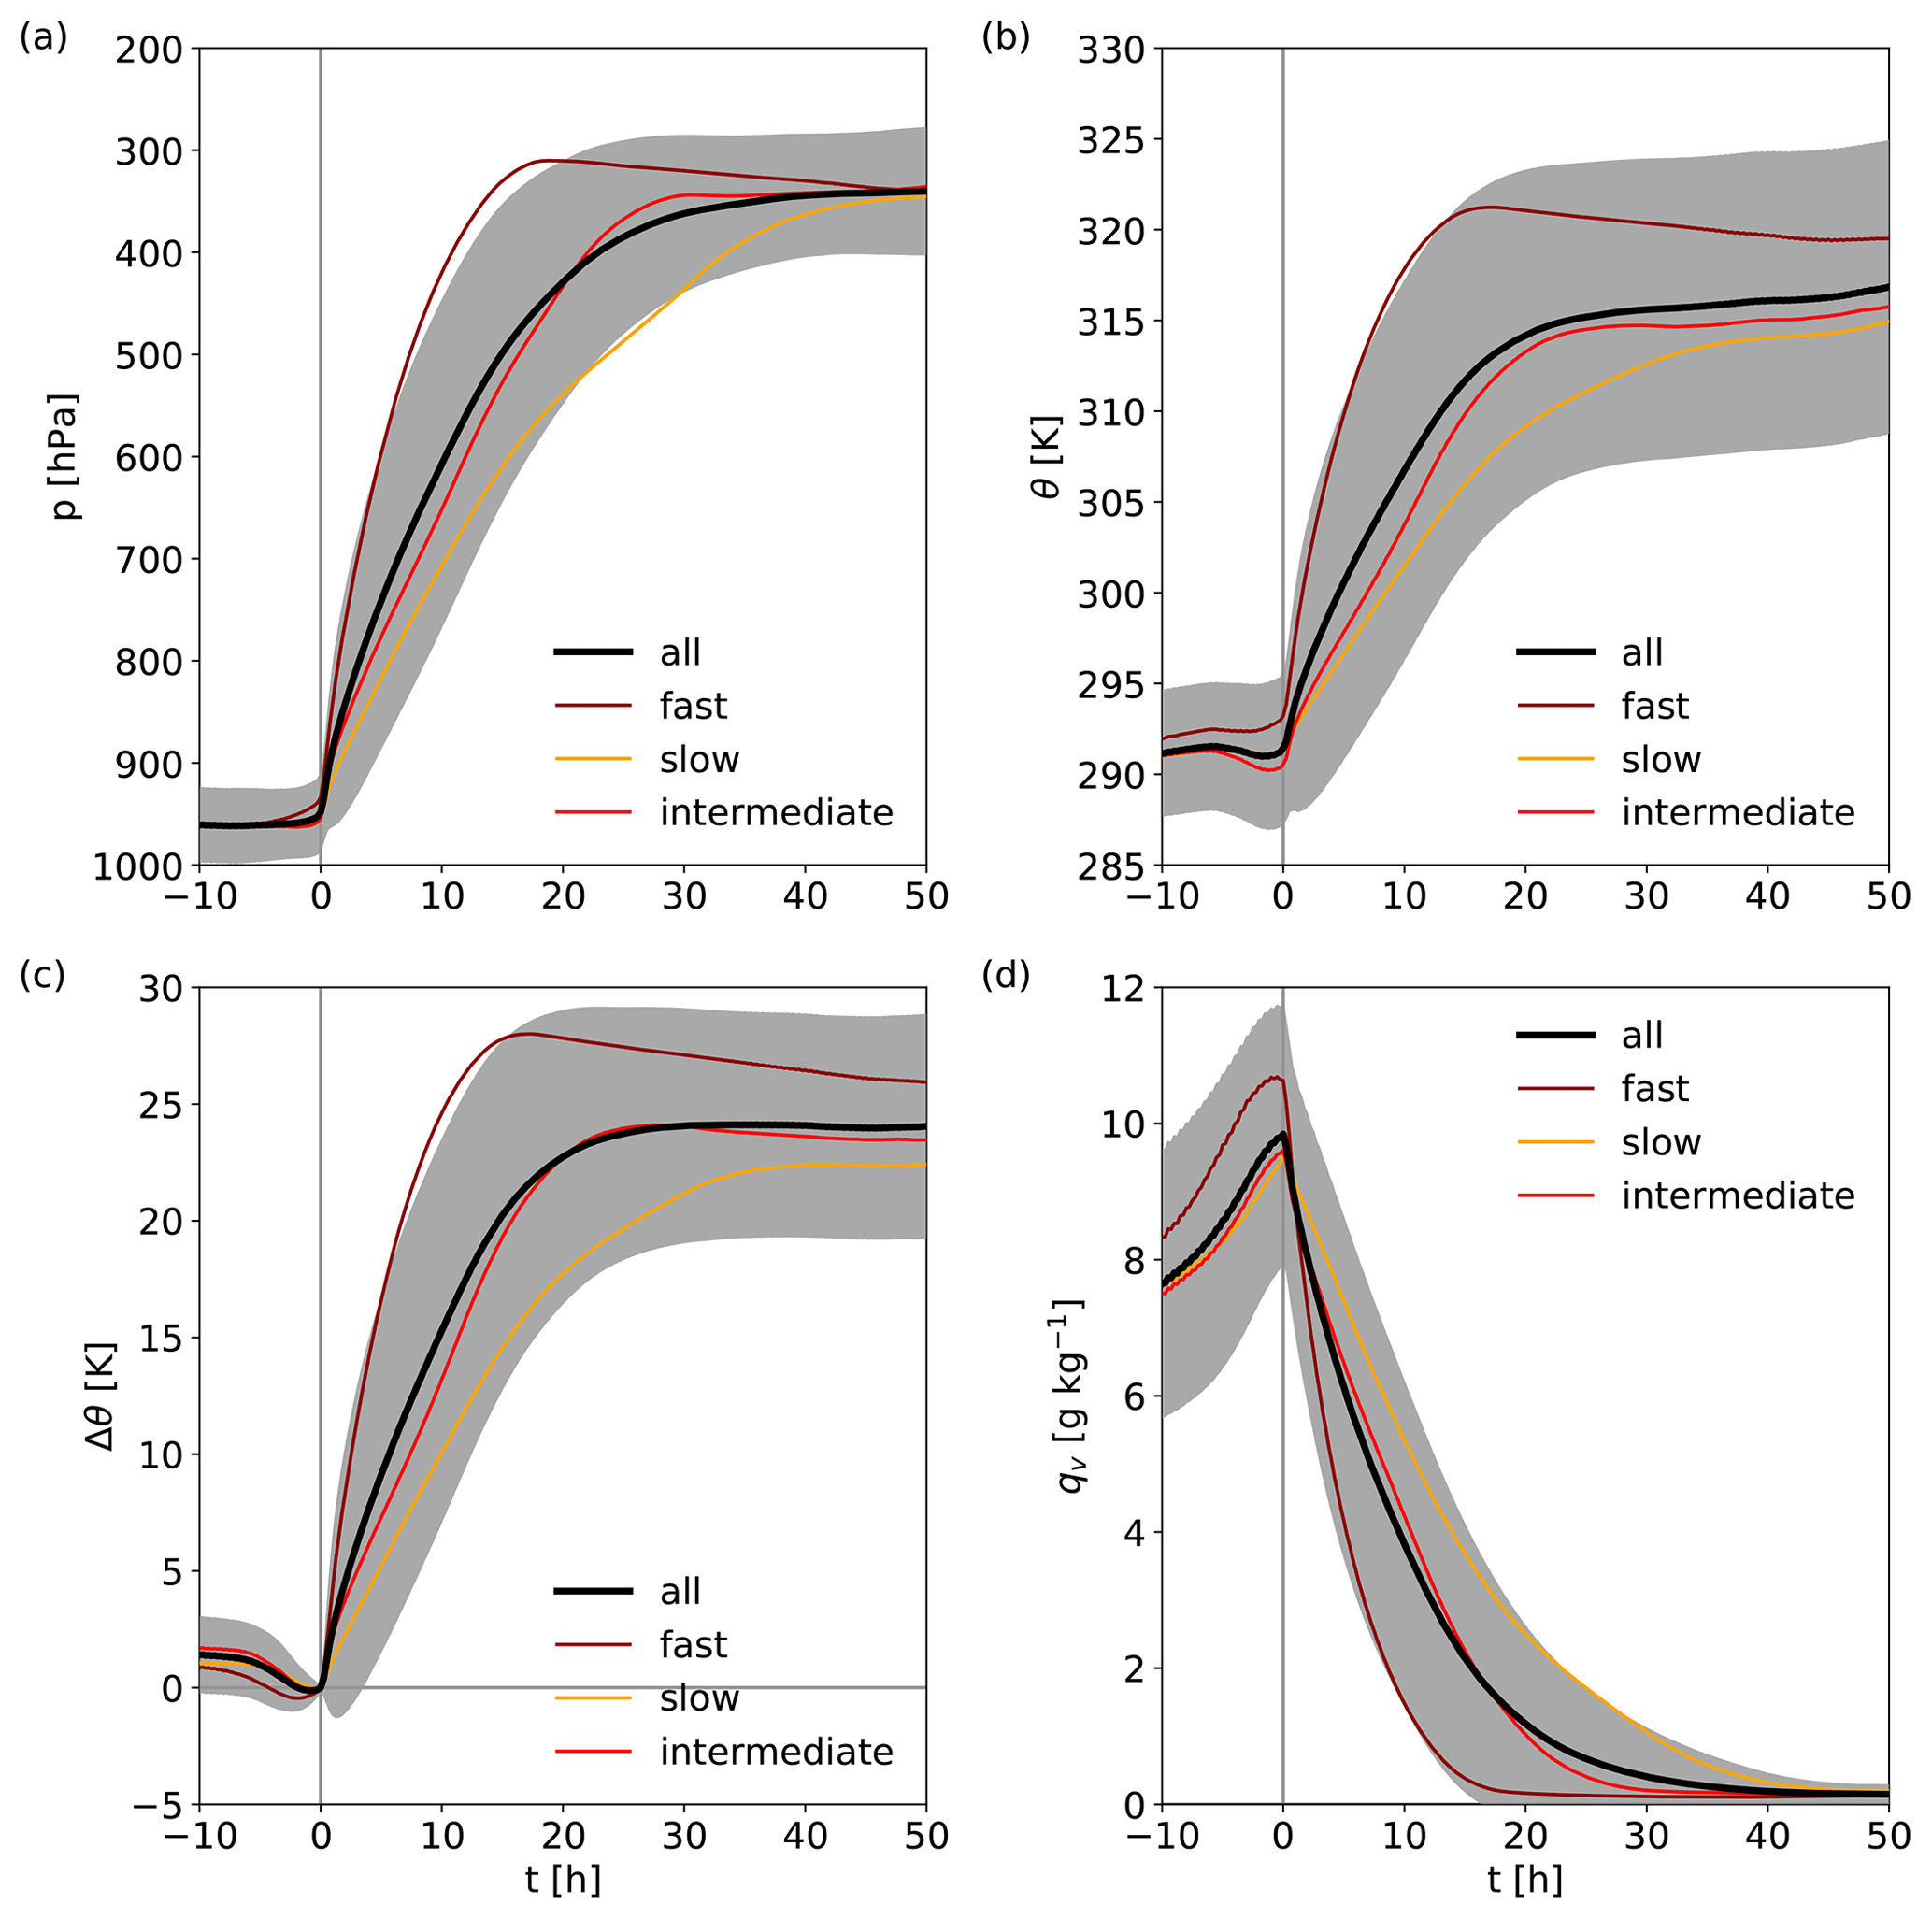
Figure 6Mean evolution of (a) pressure (p, in hPa), (b) potential temperature (θ, in K), (c) accumulated change in potential temperature (Δθ, in K), and (d) specific humidity (qv, in g kg−1) since the start of the fastest 600 hPa ascent phase for all WCB trajectories (black line; grey shading shows ± standard deviation) and for the fastest 25 % (dark red), intermediate (red), and the slowest 25 % (orange).
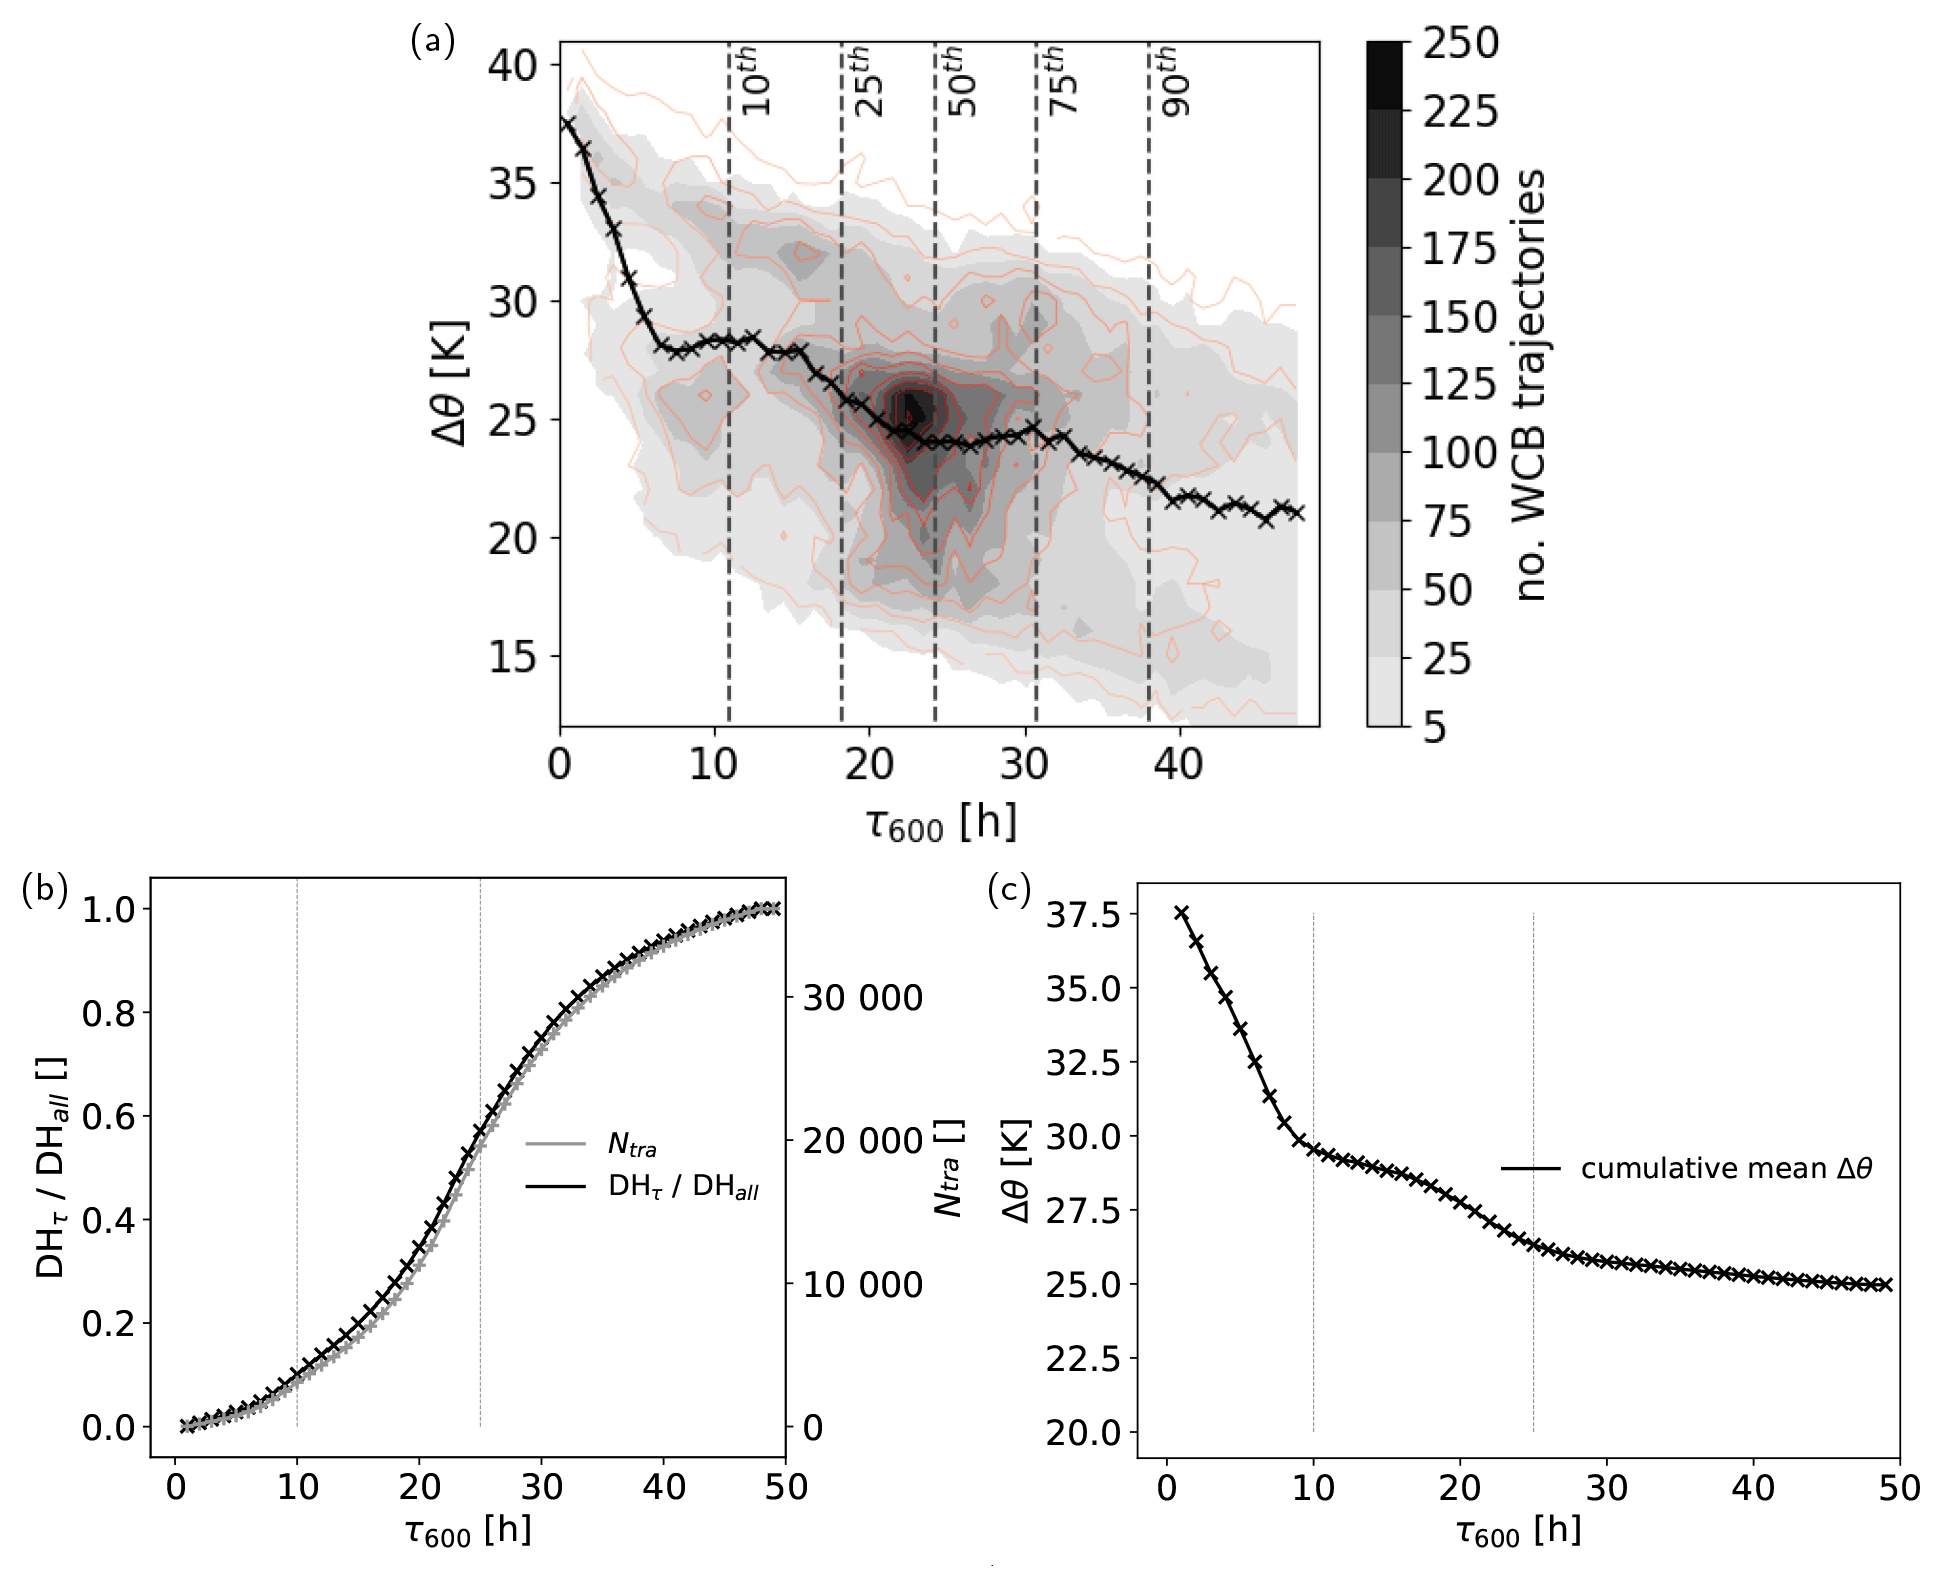
Figure 7(a) 2D histogram of the duration of the fastest 600 hPa WCB ascent phases (τ600, in h) and the change in potential temperature during this ascent phase (Δθ, in K). Red contours show the maximum change in potential temperature along WCB trajectories. The black line and markers show the mean diabatic heating per τ600 bin. Vertical lines show 10th, 25th, 50th, 75th, and 90th percentiles of τ600. (b, c) Cumulative distributions of 600 hPa ascent-integrated diabatic heating as a function of τ600. (b) Relative contribution to total diabatic heating (black) and WCB trajectory number (Ntra, grey) and (c) cumulative mean diabatic heating (black). The vertical lines are placed at τ600=10 h and τ600=25 h.
4.1 ADH from bulk physics processes
During their ascent, trajectories are heated and also cooled diabatically from a large variety of non-conservative processes, which together result in the large total diabatic heating discussed above. The mean integrated diabatic heating for individual physics processes at the end of each trajectories' 600 hPa ascent phase for fast-, intermediate-, and slowly ascending WCB trajectories is shown in Fig. 8. On average, the total 600 hPa integrated heating (Δθ) amounts to 25 K, whereby the fast WCB trajectories are heated 3.8 K more than the intermediate WCB trajectories and 5.5 K more than the slowly ascending WCB trajectories (Fig. 8a).
The by-far largest diabatic heating contribution results from microphysical processes (Fig. 8a). The evolution of ADH along WCB trajectories is shown in Fig. 9. During their ascent, WCB trajectories are rapidly heated through cloud formation, and after traversing through the mid-troposphere, the heating rate slows down (Fig. 9a–c). Turbulent diffusion, heating from the convection scheme (deep or shallow convection only, depending on the local resolution of the grid; see Sect. 2), and shortwave radiation also lead to a net heating of the trajectories during the ascent, while longwave radiative cooling is important in particular when trajectories approach the cloud top (Figs. 9a–c and 8a). Diabatic heating from non-orographic and orographic gravity wave drag has a minor contribution and is, hence, not explicitly considered in the following.
Microphysical heating has by far the largest contribution to the total diabatic heating with on average 95 % of total heating and, thus, substantially determines the cross-isentropic ascent of WCB trajectories. The larger total heating for fast WCB ascent compared to slow WCB ascent is strongly related to larger diabatic heating through microphysical processes (Fig. 8a). In contrast, prior to the ascent, when trajectories are located in the lower troposphere, they are markedly cooled by microphysical processes (Fig. 9a–c). Individual processes that contribute to the total microphysical heating are discussed in detail in the next section (Sect. 4.2).
In the lower troposphere, diabatic heating by turbulent diffusion is the second most important process associated with a net heating. Integrated over the entire 600 hPa ascent, net turbulent heating amounts to 1.4 K on average (Fig. 8a) and is slightly larger for fast WCB ascent (ADHTURB=1.8 K) than for intermediate and slow WCB ascent (ADHTURB=1.1 K and 1.6 K, respectively). The turbulent diffusion scheme is primarily active ahead of the approaching cold front in the warm sector between the surface and approximately 4 km height and forms a vertically oriented heating–cooling dipole (Fig. 10c, solid and dashed black contours). Gradient Richardson numbers are large in the WCB ascent region1, and thus, a pronounced heating–cooling dipole was not expected, although a recent study by Wimmer et al. (2022, see their Figs. S3 and S4) also shows such a heating–cooling dipole below 600 hPa height in the WCB ascent region. We assume that the turbulent diffusion scheme reacts to the pronounced vertical heating from the first saturation adjustment (Fig. 10a), which is called before the turbulence scheme and instantly modifies the local temperature profile.
The average heating from the convection scheme is comparatively small and amounts to only 1.7 % of total ADH (Figs. 8a and 9a–c), primarily because deep convection is treated explicitly in the innermost nest, where most trajectories ascend. As outlined above, this does not imply that embedded convection is absent or irrelevant, as convective WCB ascent can explicitly be represented in the high-resolution nest. On average, ADHcon amounts to 0.5 K and is the smallest for the fast WCB trajectories (0.3 K for fast ascent compared to 0.5 K for intermediate and 0.6 K for slow ascent). ADHcon is larger for the more slowly ascending WCB trajectories, as they remain longer in the lower troposphere, where the primary heating source from the (shallow) convection scheme is located (Fig. 11e, black contour).
While shortwave radiation has a small heating contribution of on average 0.5 K during WCB ascent, longwave radiation substantially cools the ascending air near the cloud top in the upper troposphere and, hence, reduces the isentropic outflow level of WCB trajectories (Figs. 8a, 9a–c, and 11d). This upper-level cooling contribution is non-negligible and amounts to on average −2 K integrated over the 600 hPa ascent. As the upper-level WCB cloud band can be relatively long-lived and the WCB trajectories remain in the cloud for several hours, cloud-top cooling continues to reduce the potential temperature of the WCB air parcels even after they have finished their main ascent.
4.2 ADH from individual microphysical processes
In the following, we discuss the heating contributions from the individual microphysical processes. Net microphysical heating is dominated by condensation in the lower troposphere, which is realized by a first saturation adjustment, and leads to a rapid warming at the onset of the WCB ascent (Figs. 8b, 9d–f). Condensation is the strongest in the warm-phase region of the WCB as reflected by the diabatic heating from the first saturation adjustment ahead of the cold front (Fig. 10a, black contour); however, it is also relevant in the mixed-phase region up to approximately 6 km height. In the upper troposphere, vapor deposition on frozen hydrometeors takes over and dominates the subsequent cross-isentropic ascent (Fig. 10b, black contour; Fig. 9d–f). Together, condensation (on average 17 K) and vapor deposition on frozen hydrometeors (on average 13 K) dominate the microphysical heating budget (Figs. 8b, 9d–f), as expected from previous case studies (Joos and Wernli, 2012; Mazoyer et al., 2021). Vapor deposition is additionally split into its contributions from deposition on ice, snow, and graupel plus hail. In total, integrated heating from vapor deposition on ice ADHQIDEP is the largest with an average heating of 7 K along the ascent. It also continues at higher altitudes and in lower temperature ranges where depositional growth of snow is small (Fig. 9d–f). ADHQSDEP amounts to on average 4 K, while vapor deposition on graupel ADHQGDEP has the smallest contribution of on average 1 K. The Eulerian perspective illustrates that the heating maximum of depositional growth of frozen hydrometeors is located at around 6 km height (Fig. 10b, black contours). Although heating dominates along the ascending WCB trajectories, the forward-sloping shape of the cloud band results in sublimation of sedimenting snow between 3–5 km height at the eastern edge of the cloud band. Cooling from sublimation also occurs in a small region above the cold front.
The initial riming process prior to the growth of rimed particles by vapor deposition is associated with an averaged heating contribution of only 0.7 K (Fig. 8b), which is partially related to the small value of the specific latent heat of freezing, which is released during riming. Riming takes place in the mixed-phase region of the cloud between 2–6 km height (Fig. 11a).
Another major contribution included in the microphysical budget is related to the second saturation adjustment, which is associated with substantial cooling of an average of 5 K during WCB ascent (Fig. 8b), and, thus, reduces the heating from the first saturation adjustment and vapor deposition. The second saturation adjustment forms a vertically oriented cooling–heating–cooling tripole in the lowest 7 km (Fig. 10c, black contour), which leads to a non-monotonic ADHSATAD II evolution when trajectories ascend through this region (Fig. 9e, f). The cooling from the second saturation adjustment results from an evaporation of cloud droplets in subsaturated conditions as a response to established non-equilibrium conditions from processes that are called between the first and the second saturation adjustment (i.e., the turbulence scheme and all explicit microphysical processes; see Sect. 2.2). The cooling–heating dipole below 4 km height is to a large extent a response of the saturation adjustment to the turbulence scheme, which is characterized by a dipole of opposite sign (see Fig. 10c, d). Hence, to a large extent, the diabatic heating and cooling from the second saturation adjustment in the warm phase can be understood as a quasi-compensation of the heating dipole from the turbulence scheme, which leads to sub- and supersaturated conditions and ultimately to the response of the second saturation adjustment (see discussion in Sect. 4.1). In contrast, the second saturation adjustment's local cooling maximum in the mixed-phase cloud region above the 0 ∘C isotherm results to some extent from the model representation of the Wegener–Bergeron–Findeisen process (Storelvmo and Tan, 2015) and reduces the substantial heating from vapor deposition in the mixed-phase region (Fig. 10b, d).
Evaporation of rain and melting of ice hydrometeors that are sedimenting into ascending WCB air represent important cooling processes. The total cooling through rain evaporation during the fastest 600 hPa ascent is relatively small and amounts to 0.4 K on average (Fig. 8b) and can arise during embedded phases of trajectory descent. Evaporative cooling is indeed important prior to the start of the WCB ascent when trajectories are located in the inflow region in the lower troposphere below the cloud band (Figs. 11b, 9d–f) where evaporative cooling dominates the total microphysical budget (Fig. 5d). Evaporative cooling within 10 h prior to the ascent amounts to on average 2 K (Fig. 9d–f) and, thus, can play an important role in the pre-conditioning of WCB air masses prior to their ascent. Melting from falling ice hydrometeors becomes important once trajectories approach the 0 ∘C isotherm, where the maximum cooling through melting is located (Fig. 11c, black contour). Integrated along the WCB ascent, cooling from melting processes amounts to on average 1 K and, thus, has a comparable magnitude to depositional growth of rimed particles (Fig. 8b). Overall, cooling from these processes offsets the strong heating from primarily condensational growth and can reduce the isentropic outflow level by on average 6 K along the ascent.
The remaining microphysical processes explicitly represented in the two-moment scheme (CCN activation; freezing of cloud and rain droplets; and homogeneous, deposition, and immersion nucleation, as well as evaporation from melting ice hydrometeors) have comparably small heating contributions (Figs. 9g–i, 8c). Thus, in terms of total heating they are almost negligible, which is primarily related to the small amount of mass conversion. Nevertheless, we hypothesize that the representation of these processes is important because they influence the number concentrations of liquid and frozen hydrometeors (see Fig. A2), which subsequently influences the strength of other microphysical processes.
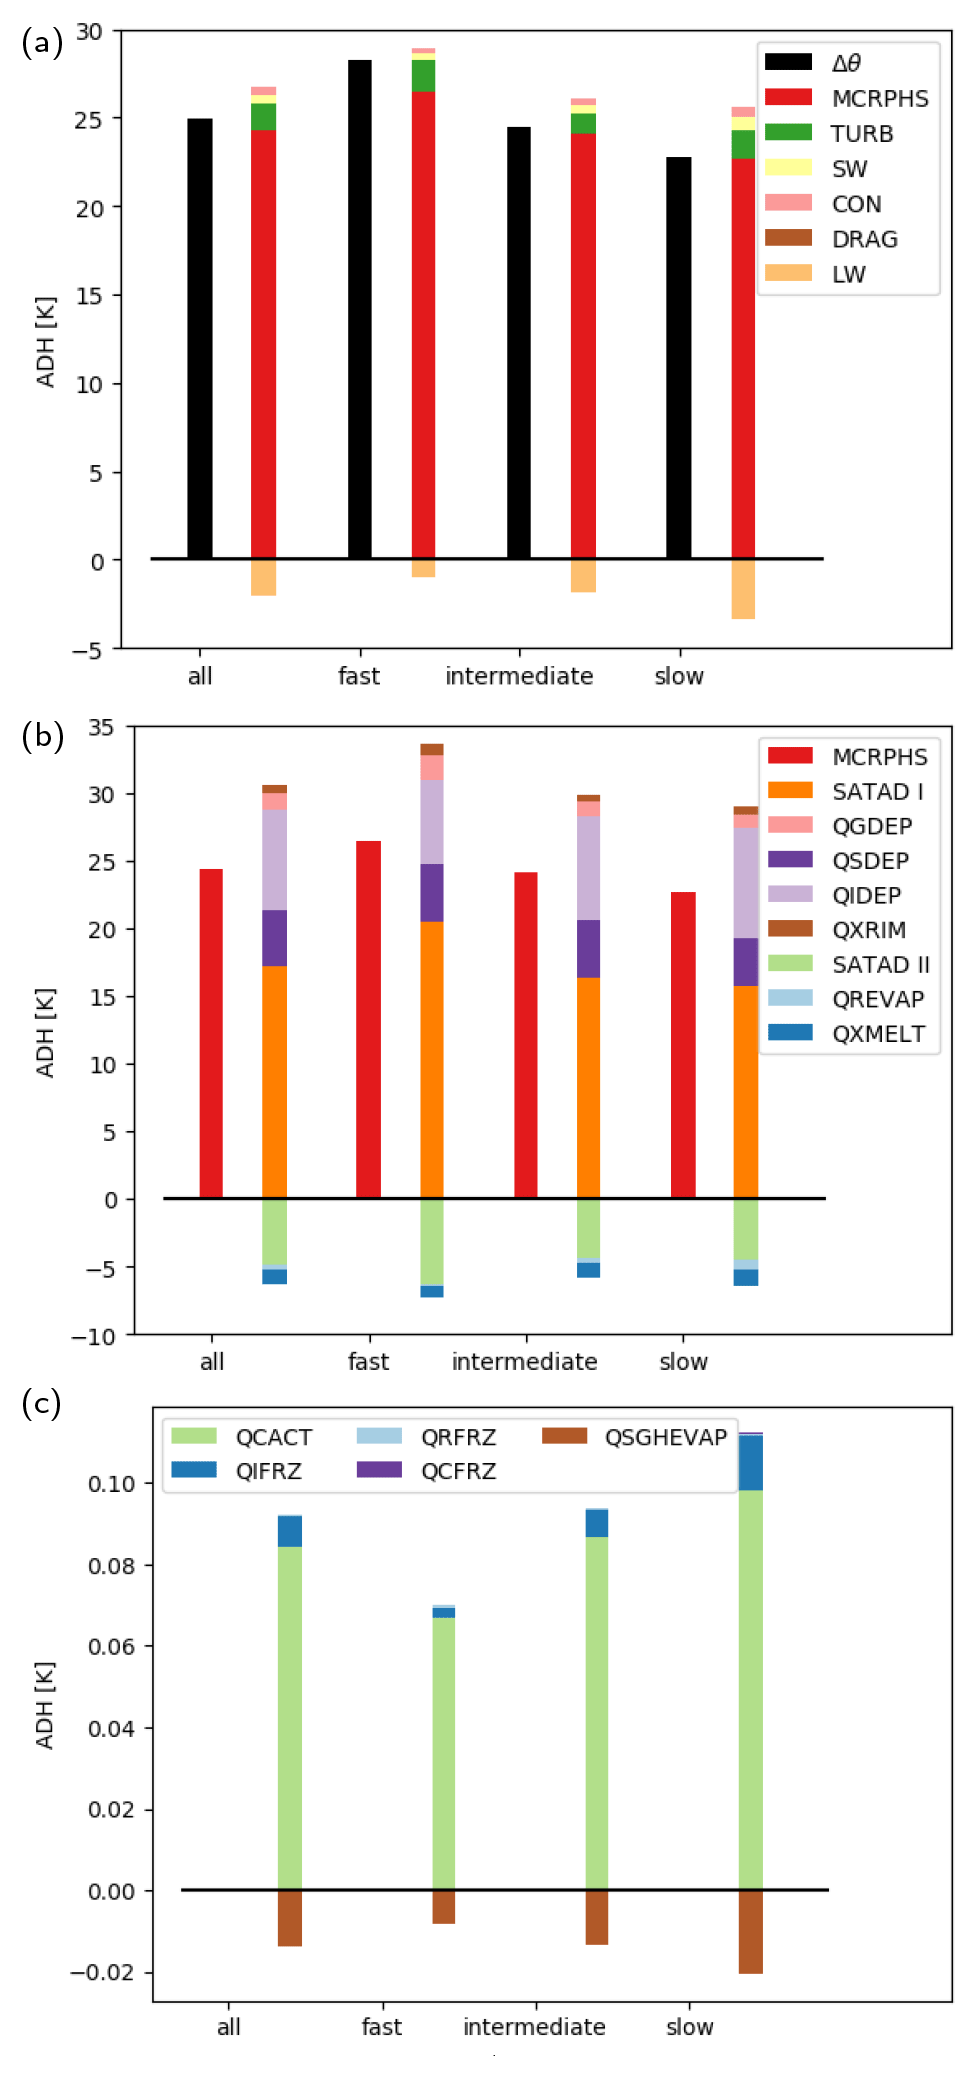
Figure 8Mean 600 hPa ascent-integrated diabatic heating (ADH, in K) for all WCB trajectories and the fastest 25 %, intermediate, and slowest 25 % of all WCB trajectories for all processes shown in Fig. 9. Panel (a) shows the net change in potential temperature (Δθ) as well as ADH from MCRPHS, TURB, DRAG, LW, and SW. Panel (b) shows ADH from MCRPHS, SATAD I and II, QSDEP, QIDEP, QGDEP, QXRIM, QREVAP, and QXMLT. Panel (c) shows ADH from QSGHEVAP, QIFRZ, QCACT, QRFRZ, and QCFRZ.
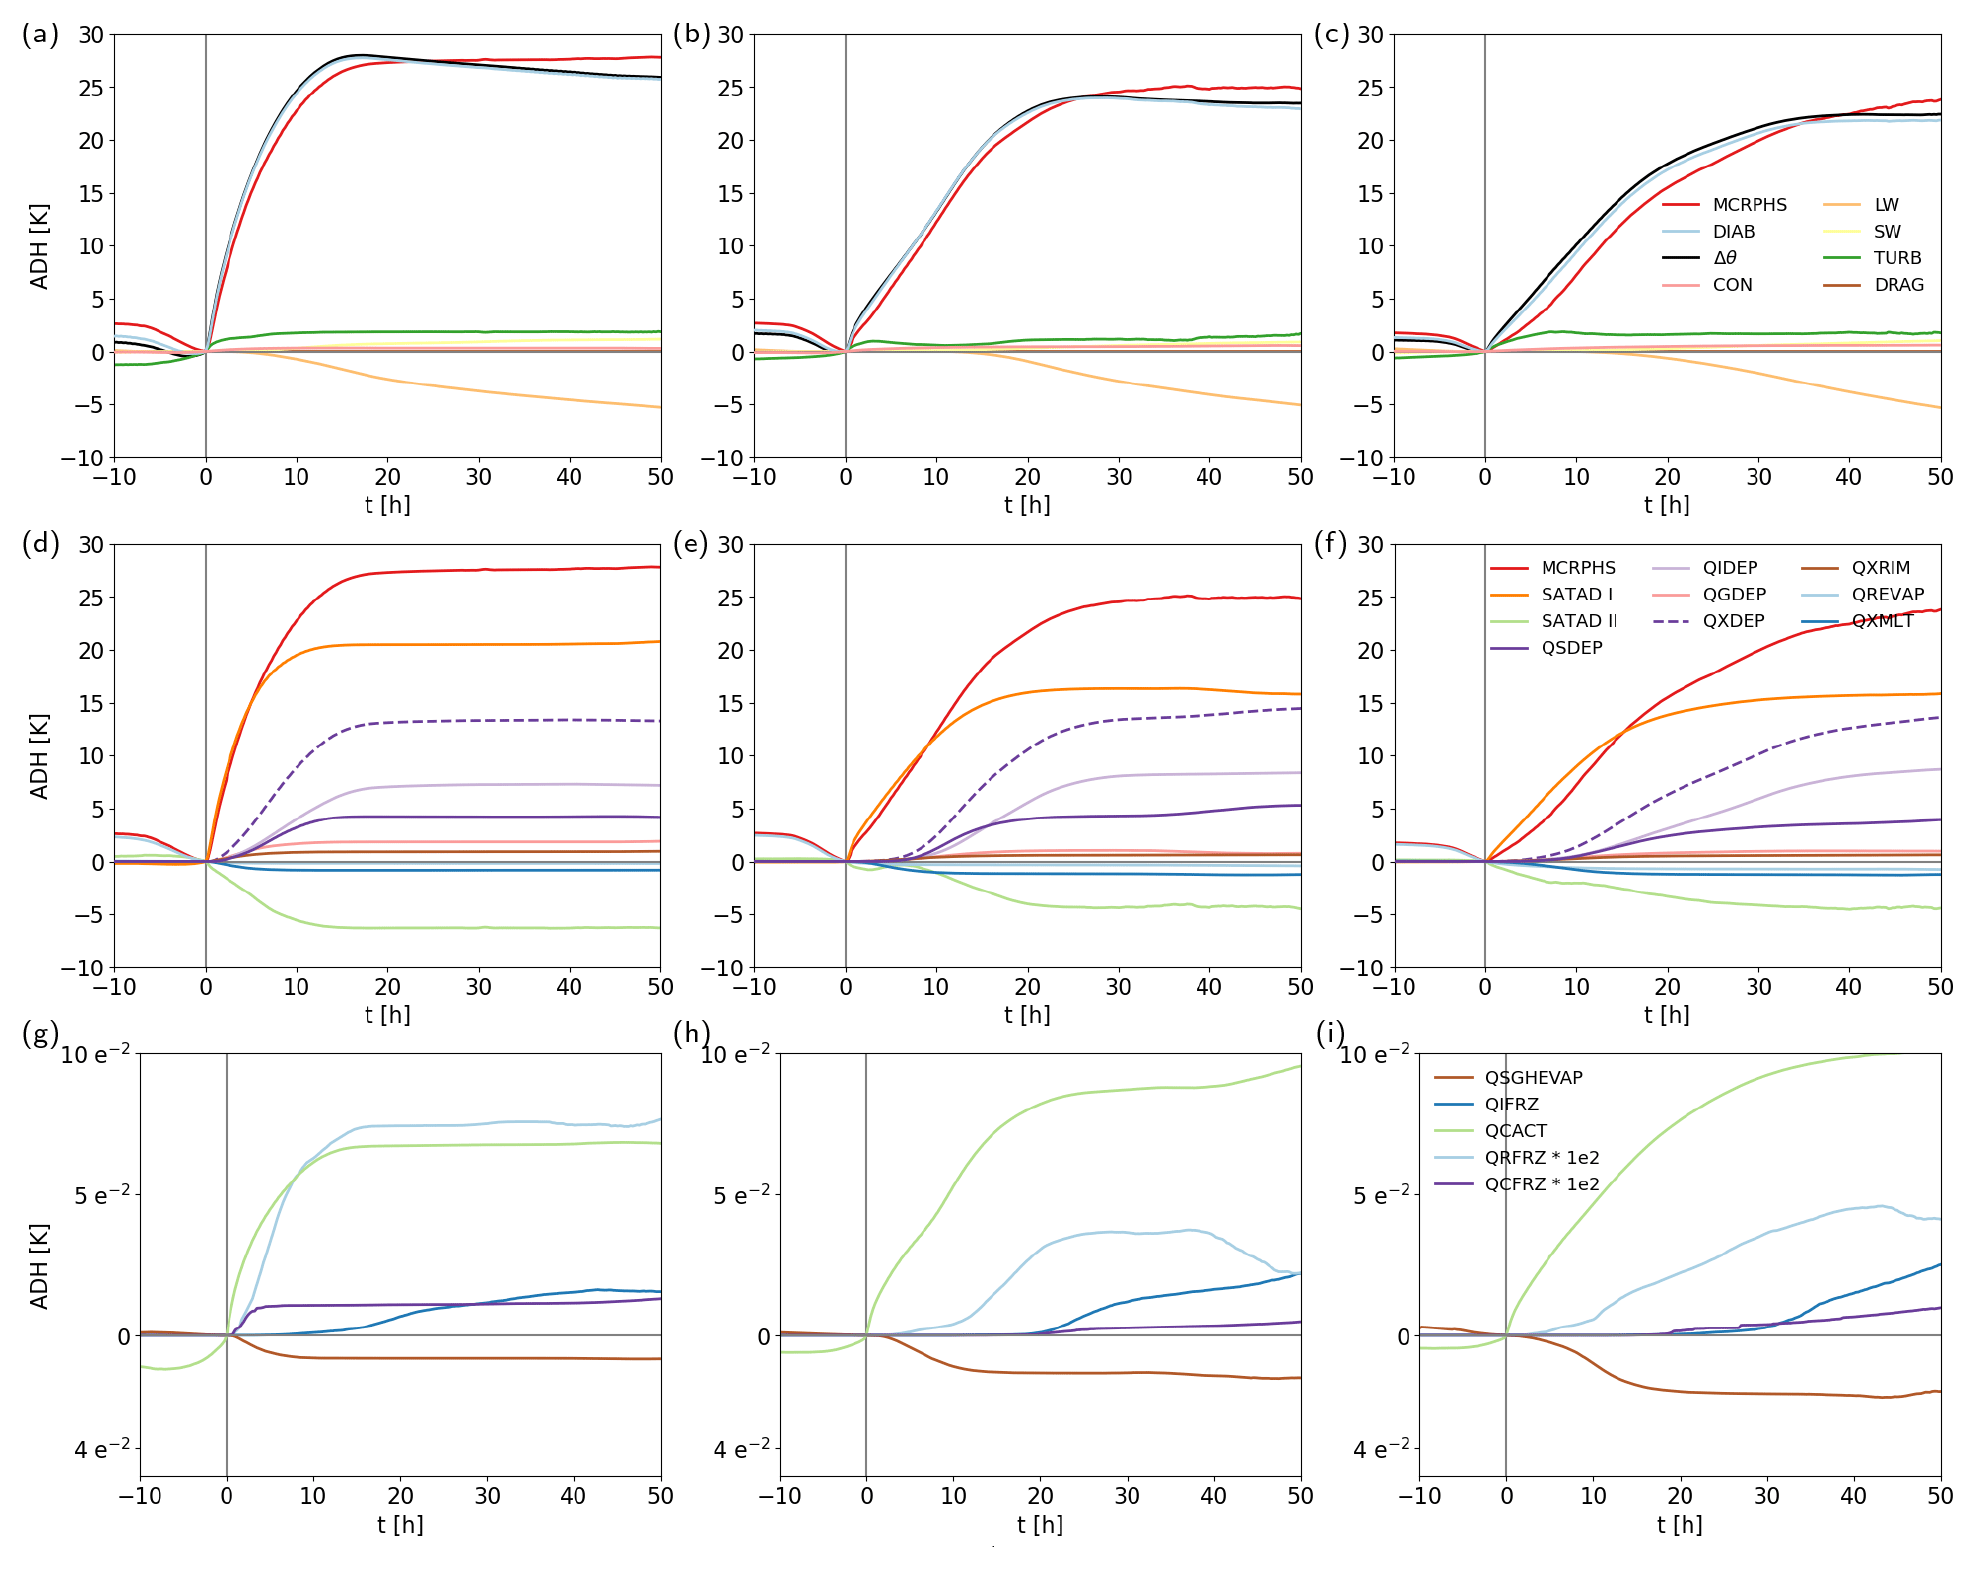
Figure 9Mean evolution of accumulated diabatic heating (ADH, in K) along (a, d, g) fast, (b, e, h) intermediate, and (c, f, i) slow WCB trajectories since the start of the fastest 600 hPa ascent phase (see Fig. 6). Panels (a)–(c) show ADH for turbulence (TURB), sub-grid-scale orographic and gravity wave drag (DRAG), short- and longwave radiation (SW and LW), microphysics (MCRPHS), and the sum of all diabatic processes (DIAB), as well as the net change in potential temperature (Δθ). Panels (d)–(f) show ADH from the first and second saturation adjustment (SATAD I and II); vapor deposition on snow, ice, and graupel plus hail, as well as the respective sum (QSDEP, QIDEP, QGDEP, and QXDEP); riming (QXRIM); rain evaporation (QREVAP); and melting (QXMLT). Panels (g–i) show ADH from evaporation from melting hydrometeors (QSGHEVAP), homogeneous and heterogeneous ice nucleation (QIFRZ), cloud droplet activation (QCACT), and freezing of rain (QRFRZ) and cloud droplets (QCFRZ). Note that QRFRZ and QCFRZ are scaled by 100.
4.3 Relationship between WCB ascent behavior and microphysical processes
Faster-ascending trajectories are associated with larger ADH, which to a large extent results from stronger total microphysical heating (Sect. 4.1, Figs. 7a, 8a). The latter is linked to on average larger initial moisture content of faster-ascending WCB trajectories, which represents a thermodynamic constraint on the total diabatic heating from microphysics along the WCB airstream. A particularly large difference arises from the saturation adjustment. ADHSATAD I for quickly ascending trajectories is 5 K larger than for slowly ascending trajectories. In contrast, ADHQXDEP differs less than 1 K between different ascent categories. Hence, in this case study the larger cross-isentropic ascent of the faster-ascending WCB trajectories is substantially driven by larger initial moisture content of the rapidly ascending WCB trajectories (Fig. 6d), which is available for condensation. Considering the relative contributions of depositional growth of snow, ice, and graupel for the different WCB ascent categories additionally shows that for slower ascent vapor deposition on ice becomes increasingly more important. Prolonged residence time and enhanced hydrometeor growth in faster updrafts favor riming; thus, heating from particle riming and depositional growth of rimed particles are considerably larger for fast WCB ascent compared to slower WCB ascent (Fig. 8b). The representation of graupel in the WCB is relevant, as total diabatic heating from riming and growth of rimed particles (i.e., QGDEP plus QXRIM) on average exceed 2.5 K along fast-ascending WCB trajectories. Besides the second saturation adjustment, melting of frozen hydrometeors and evaporation of rain have the largest microphysical cooling contributions during the ascent (Fig. 9d–f). Cooling contributions of evaporation and melting are both smaller for fast WCB ascent because WCB air parcels ascend faster through the relatively well-constrained vertical layers of the atmosphere where evaporation and melting are the most pronounced (Fig. 11b, c, black contours). In contrast, the slower-ascending WCB trajectories remain longer near the surface and near the melting level, where rain evaporation and melting are the strongest (Fig. 11b, c, black contours). Thus, the slowly ascending WCB air parcels experience not only less heating, but also enhanced cooling from below-cloud evaporation and melting.
In the following, we consider processes associated with smaller mass conversion and related diabatic heating (Figs. 9g–i and 8c). Counterintuitively, ascent-integrated heating from activation of cloud droplets (Fig. 8c) is larger for slow ascent, although stronger updraft velocity is implicitly associated with larger supersaturation and an increase in CCN activation (Eq. 1; Fig. 2). Indeed, the initial increase in ADHQCACT is the strongest along fast WCB trajectories; however, the prescribed activation rate of cloud droplets decreases quickly with altitude (Fig. 2). The larger ADHQCACT for more slowly ascending WCB trajectories is attributed to the time integration as the slower WCB trajectories remain longer in the lower to mid-troposphere where CCN activation, as prescribed in the parameterization, is the most active (Fig. 2). The latter is probably entirely dependent on the CCN activation parameterization, as no secondary CCN activation above cloud base would be expected at the typical evolution of updraft velocities along WCB ascent, which, however, is not accounted for in the ICON microphysics.
Freezing of cloud droplets and rain drops is more important during faster WCB ascent, as the timescale of transport in fast updrafts is smaller than the timescale of rain formation. Consequently more condensate is transported to colder temperatures and is available for freezing (Figs. 8c, 9g–i). In particular the homogeneous freezing of cloud droplets, which can produce large ice number concentrations, influences the cloud structure via changes to the ice crystal number concentration.
Homogeneous freezing and heterogeneous freezing (immersion and deposition freezing) also have a negligible direct effect on the diabatic heating in the WCB due to the small mass conversion (Figs. 8c, 9g–i). Moreover, they mostly occur once WCB air parcels are finishing their main ascent. Evaporation from melting of frozen hydrometeors is associated with a small cooling of the ascending WCB air. Similarly to ADHQCACT, the temporal integration accounting for the time trajectories' spend in the region influenced by evaporative cooling is decisive for total ascent-integrated cooling.
In summary, shorter ascent timescales (i.e., faster ascent) are associated with larger heating from the first saturation adjustment, riming, and freezing of rain, in contrast to the relative contribution of vapor deposition, which is reduced compared to longer ascent timescales (i.e., slower ascent). Simultaneously, longwave radiative cooling, evaporative cooling, and cooling from melting of frozen hydrometeors are reduced due to the shorter integration timescale. Vice versa, the slower WCB trajectories ascend, the less important heating is from the first saturation adjustment and riming and the more important heating becomes in the ice phase from vapor deposition compared to the mean over all trajectories. The larger diabatic heating from microphysical processes for faster-ascending trajectories is related to enhanced specific humidity at the start of the ascent, which provides a thermodynamic constraint and emphasizes the relevance of WCB inflow moisture for total diabatic heating from microphysical processes and WCB trajectories' cross-isentropic ascent.
The heterogeneity of WCB ascent behavior is in line with previous results, highlighting the heterogeneous cloud structure of the WCB and its embedded convection (e.g., Crespo and Posselt, 2016; Oertel et al., 2019; Gehring et al., 2020). We further find that the heterogeneity is influenced by different microphysical processes that influence the cloud structure but also latent heating and cooling along the ascent, which finally determines the total cross-isentropic ascent. Detailed representation of these processes in high-resolution NWP simulations allows us to represent some of the variability in the cloud structure of WCBs. The stratification according to ascent behavior also emphasizes the relevance of WCB air parcels' residence time at a certain altitude for the total ascent-integrated diabatic heating.
5.1 Overview of diabatic PV changes
The strong ascent and diabatic heating of the WCB airstream typically result in low-level positive and upper-level negative PV anomalies (e.g., Madonna et al., 2014; Methven, 2015). Generally, the evolution of PV along the WCB trajectories (Fig. 12a–c) shows the well known increase in PV during the first part of the ascent followed by a PV decrease later on (e.g., Wernli and Davies, 1997; Madonna et al., 2014; Joos and Wernli, 2012; Methven, 2015). On average, the WCB trajectories arrive in the upper troposphere near the tropopause with PV values below 0.5 PVU (Fig. 12a–c). The PV evolution along the ascent-centered trajectories shows a strong local maximum of 1–1.5 PVU immediately after the start of the ascent, which quickly decreases before reaching a plateau phase that is more pronounced for the intermediate- and slowly ascending WCB trajectories and is followed by further PV decrease. The initial PV increase along the ascent is much more rapid than has been shown in previous studies (e.g., Madonna et al., 2014; Joos and Wernli, 2012; Martínez-Alvarado et al., 2014), emphasizing the pronounced PV production in the lowermost 1 km (Fig. 11f; Fig. 5b) and its subsequent redistribution. The strong initial PV increase is likely emphasized by centering the trajectories relative to the start of their fastest 600 hPa ascent and/or may be model and case dependent.
Integrating the PV tendencies from selected individual physics processes along the trajectories (APV) shows their contribution to the total change in PV (Fig. 12). The integrated effect of all diabatic PV tendencies (APVDIAB, Fig. 12; neglecting PV change from momentum tendencies) approximately follows the evolution of total PV. The integrated effect of all microphysical processes (APV(∑MCRPHS)) is responsible for the rapid PV increase in the lower troposphere and also results in a subsequent decrease in PV. However, PV reduction is underestimated if the PV tendency from turbulent heat transfer is neglected (cf. APV(∑DIAB) and APV(∑MCRPHS) in Fig. 12a–c and APVTURB in Fig. 12d–f).
Furthermore, differences between APVDIAB and the PV evolution partially result from neglecting the momentum tendencies (e.g., Spreitzer et al., 2019; Rivière et al., 2021), which can be important in the lower troposphere (Stoelinga, 1996; Attinger et al., 2021) and near the jet (Spreitzer et al., 2019). Further, the computation of PV tendencies on the original high-resolution ICON grid can result in very large tendencies, as locally large diabatic heating gradients can occur in the simulation (see also Rivière et al., 2021). These artificially large tendencies are interpolated to the trajectory positions and can degrade the total PV budget (see Rivière et al., 2021; Wimmer et al., 2022). This in particular applies to the PV tendencies from turbulence and the second saturation adjustment, which can take locally very high instantaneous values.
5.2 Contributions from individual diabatic processes
Similarly to the diabatic heating contributions, the largest PV modifications along WCB ascent result from both saturation adjustments, vapor deposition, and turbulent diabatic heating (Fig. 12d–f). Moreover, PV modification from rain evaporation also substantially contributes to an increase in WCB trajectories' PV values. Melting, riming, and radiative processes, as well as diabatic heating from the convection scheme, contribute less to PV modification in the WCB.
APV from the first saturation adjustment, vapor deposition, and riming are characterized by the characteristic positive and subsequently negative PV rates (Fig. 12d–f), as the WCB trajectories pass through the respective local heating maxima and the related vertical dipoles of PV production and reduction (Figs. 10a, b and 11a). The increase in APVSATAD I at the cloud base is very sudden and pronounced. Its local maximum of PV production in the lower troposphere results from strong vertical gradients of diabatic heating below 1 km height that occur in an environment with large cyclonic vertical vorticity (Fig. 10a), which strengthens the diabatic PV production. Above 1 km height and above the local heating maximum PV is reduced. The magnitude of PV reduction is smaller than PV production in the lowermost troposphere but has a larger vertical extent.
Evaporation of rain strongly cools the boundary layer and lower troposphere below the cloud base. The low-level cooling results in PV production close to the surface and at 1 and 2 km height (Fig. 11b). Thus, APVQREVAP along trajectories increases considerably, with the largest increase in PV prior to the ascent when WCB trajectories are located in the lowermost troposphere (Fig. 9d–f). In total, PV increase from evaporative cooling along the WCB trajectories amounts to approximately 0.5–0.7 PVU. Hence, evaporative cooling has a substantial contribution to the PV maximum along WCB ascent and to the lower tropospheric positive PV anomaly.
PV modification from vapor deposition is important between 3–9 km height. The net PV change from vapor deposition along WCB trajectories is approximately 0 PVU. Figure 10b shows the formation of a slightly tilted PV rate dipole, whereby PV reduction is stronger near the jet-facing side (Eq. 3). Its formation results from horizontal heating gradients in a vertically sheared environment below the strong upper-level jet (Harvey et al., 2020; Oertel et al., 2020). Reduction in PV near the jet region enhances the negative PV anomaly and contributes to the PV gradient across the tropopause.
Similarly to their respective heating rates, the PV rates of the second saturation adjustment and turbulence partially counteract each other, in particular below the 0 ∘C isotherm. Due to locally large spatial heating gradients, the associated PV rates are very patchy and can take locally very large values (Fig. 10c, d), which influences the mean APV evolution along trajectories and can introduce interpolation errors. The vertically alternating patterns of strong PV reduction and production from the second saturation adjustment and turbulence (Fig. 10c, d) result from the vertical tripole of ADHSATAD II and dipole of ADHTURB, respectively (Sect. 4.1). These PV rate patterns are to some extent reflected along the ascending WCB trajectories (Fig. 12d–f), which, as mentioned above, additionally include interpolation errors and can be influenced from locally high values. Although both SATAD II and TURB are associated with very large individual PV rates, their combined effect, and thus their feedback to the dynamical core, is limited, as these processes to some extent compensate each other. Hence, we recommend that detailed process studies using the ICON model consider the combined effect of TURB and SATAD II if total microphysical heating budgets, including the second saturation adjustment, are considered.
The PV rates from the other microphysical processes are substantially smaller, as their associated spatial heating gradients are smaller. Similar to APVQXDEP, APVQXRIM forms a vertical dipole of PV production and reduction, albeit with a smaller magnitude (Figs. 9d–f, 11a). As the diabatic heating maximum from riming is located near the 0 ∘C isotherm, PV production and reduction take place just below and above the melting level, respectively (Fig. 11a). In this region around the 0 ∘C isotherm, the cooling maximum from melting of frozen hydrometeors is associated with PV reduction below 2 km height and PV production above (Fig. 11c). Accordingly, APVQRMLT decreases along WCB trajectories before it increases as trajectories pass through the melting minimum. The net PV change along the ascent is approximately 0 PVU, and the magnitude of APVQRMLT is larger than PV modification from riming.
The heating tendencies from the remaining non-microphysical parameterization schemes are also associated with small PV rates. As diabatic heating from the convection scheme is small (Sect. 4), the associated APVCON is also comparatively small (Fig. 12). The convective heating in the boundary layer forms a low-level vertical dipole of PV production and reduction (Fig. 11e). Longwave radiative cooling near the cloud top and the associated PV rate dipole in the WCB ascent region are the largest between 8–11 km height (Fig. 11d). The negative PVR below the longwave cooling maximum overlaps with the negative PVR from vapor deposition and together contribute to low PV values in the upper troposphere. While ADHLW continuously decreases once WCB trajectories approach the cloud top, APVRAD depends on the WCB ascent behavior and outflow height relative to the cloud top. Fast WCB trajectories also reach higher altitudes and traverse the cloud-top cooling minimum, resulting in initial PV reduction below and PV production above the cooling maximum, respectively (Fig. 9d–f). The more slowly ascending WCB trajectories remain below the cloud-top cooling maximum. Thus, APVRAD continuously decreases along their ascent.
In the cold sector of the cyclone (at relative longitude −3 to −6∘), isolated shallow cumulus clouds form with cloud tops between 1–3 km height (Fig. 11d). Radiative cooling by these shallow cumuli is one of the most important factors for PV change in the cold sector and contributes to the low PV values at low altitudes. Near the surface PVRRAD is negative in the cold sector and contributes to the negative near-surface PV values (Fig. 5b). PVR from radiative cooling is partially compensated by opposing PV tendencies from the shallow convection scheme (Fig. 11e), which is active in the cold sector and forms a PV tendency dipole near the 0 ∘C isotherm. These processes are not directly relevant for the considered WCB; however, the pre-conditioning of the lower troposphere can influence potential successor cyclones and their WCBs (Papritz et al., 2021).
5.3 Summary of diabatic PV changes
In summary, the different physics processes considerably modify PV during WCB ascent. While the evolution of PV along WCB trajectories is generally described as a sequence of PV increase followed by PV decrease as trajectories pass through the heating maximum (e.g., Wernli and Davies, 1997; Madonna et al., 2014), our detailed analysis illustrates the complicated interplay and differing, partially opposing contributions of all physics processes to the overall evolution of PV. The ascent-centered Lagrangian perspective as well as the Eulerian composites emphasize the strong PV production in the lowermost troposphere by condensation and rain evaporation before PV values along the ascending WCB air parcels are reduced and eventually approximately approach their inflow values. PV reduction in the mid- to upper troposphere primarily results from condensation, vapor deposition, and longwave radiative cooling. Thereby, the PV evolution along the trajectories is influenced by the trajectories' ascent behavior, i.e., the time the individual trajectories remain in regions which are predominantly influenced by either PV production or reduction.
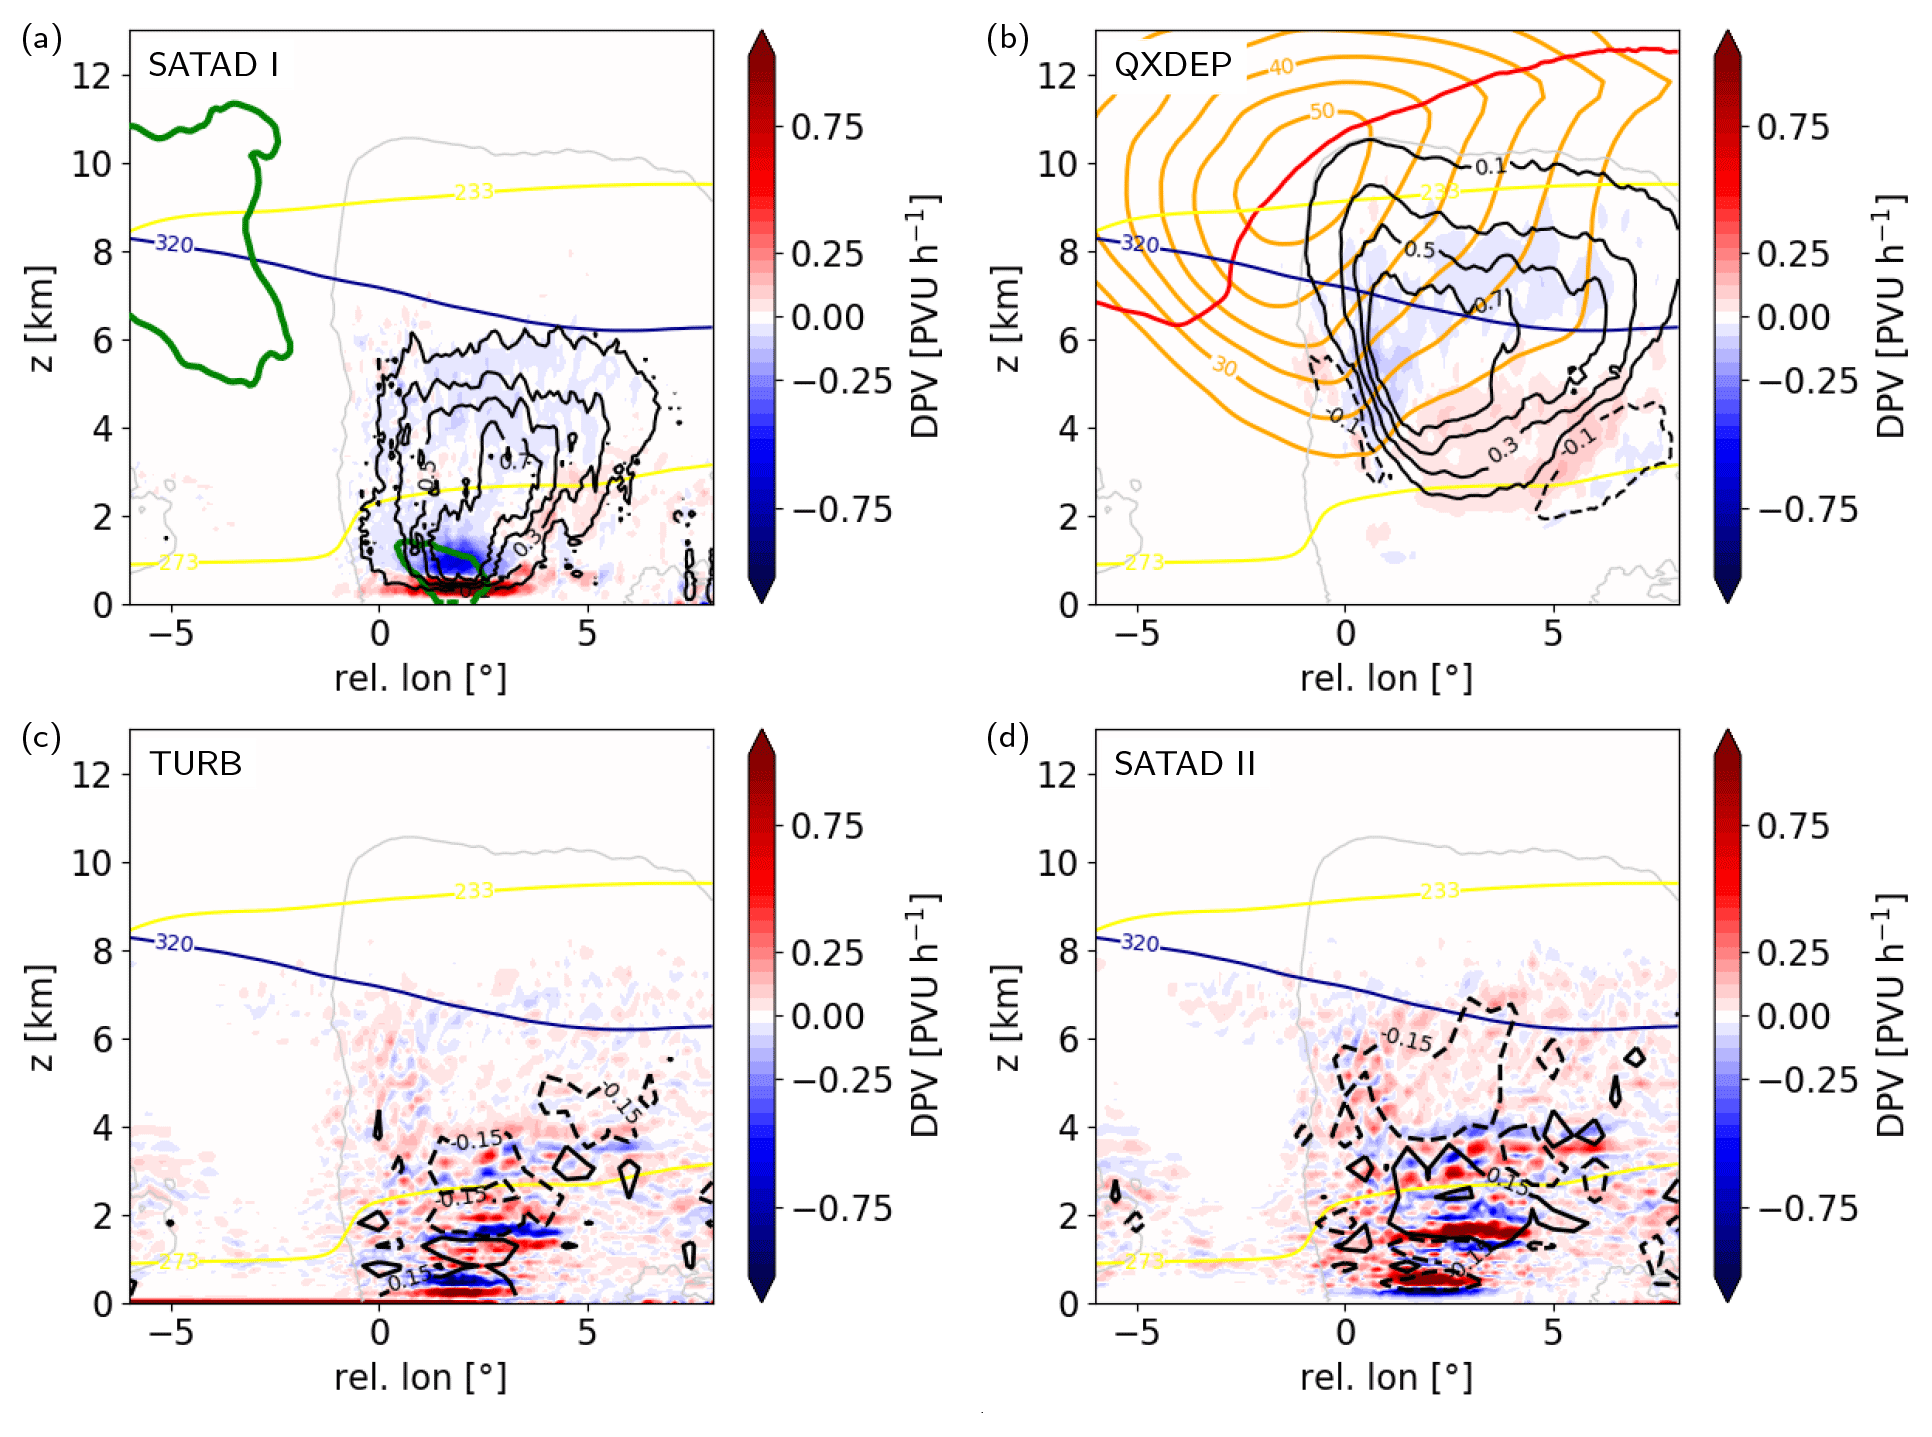
Figure 10Vertical cross-section composites through the WCB ascent region ahead of the cold front for PV rates (PVR, in PVU h−1, in colors) and diabatic heating rates (black, in K h−1) from the (a) first saturation adjustment (SATAD I), (b) total vapor deposition (QXDEP), (c) turbulent temperature tendency (TURB), and (d) second saturation adjustment (SATAD II). Also shown are (a) vertical vorticity (green line, at 10−4 s−1) as well as (b) wind speed (orange, every 5 m s−1) and the dynamical 2 PVU tropopause (red). All panels show 273 and 233 K isotherms (yellow), 320 K isentrope (blue), and the cloudy region (grey line, at qt=0.01 g k−1). Note that diabatic heating in (c) and (d) is interpolated to a coarser resolution for visualization of regions dominated by heating or cooling due the patchiness of the respective diabatic heating rates.
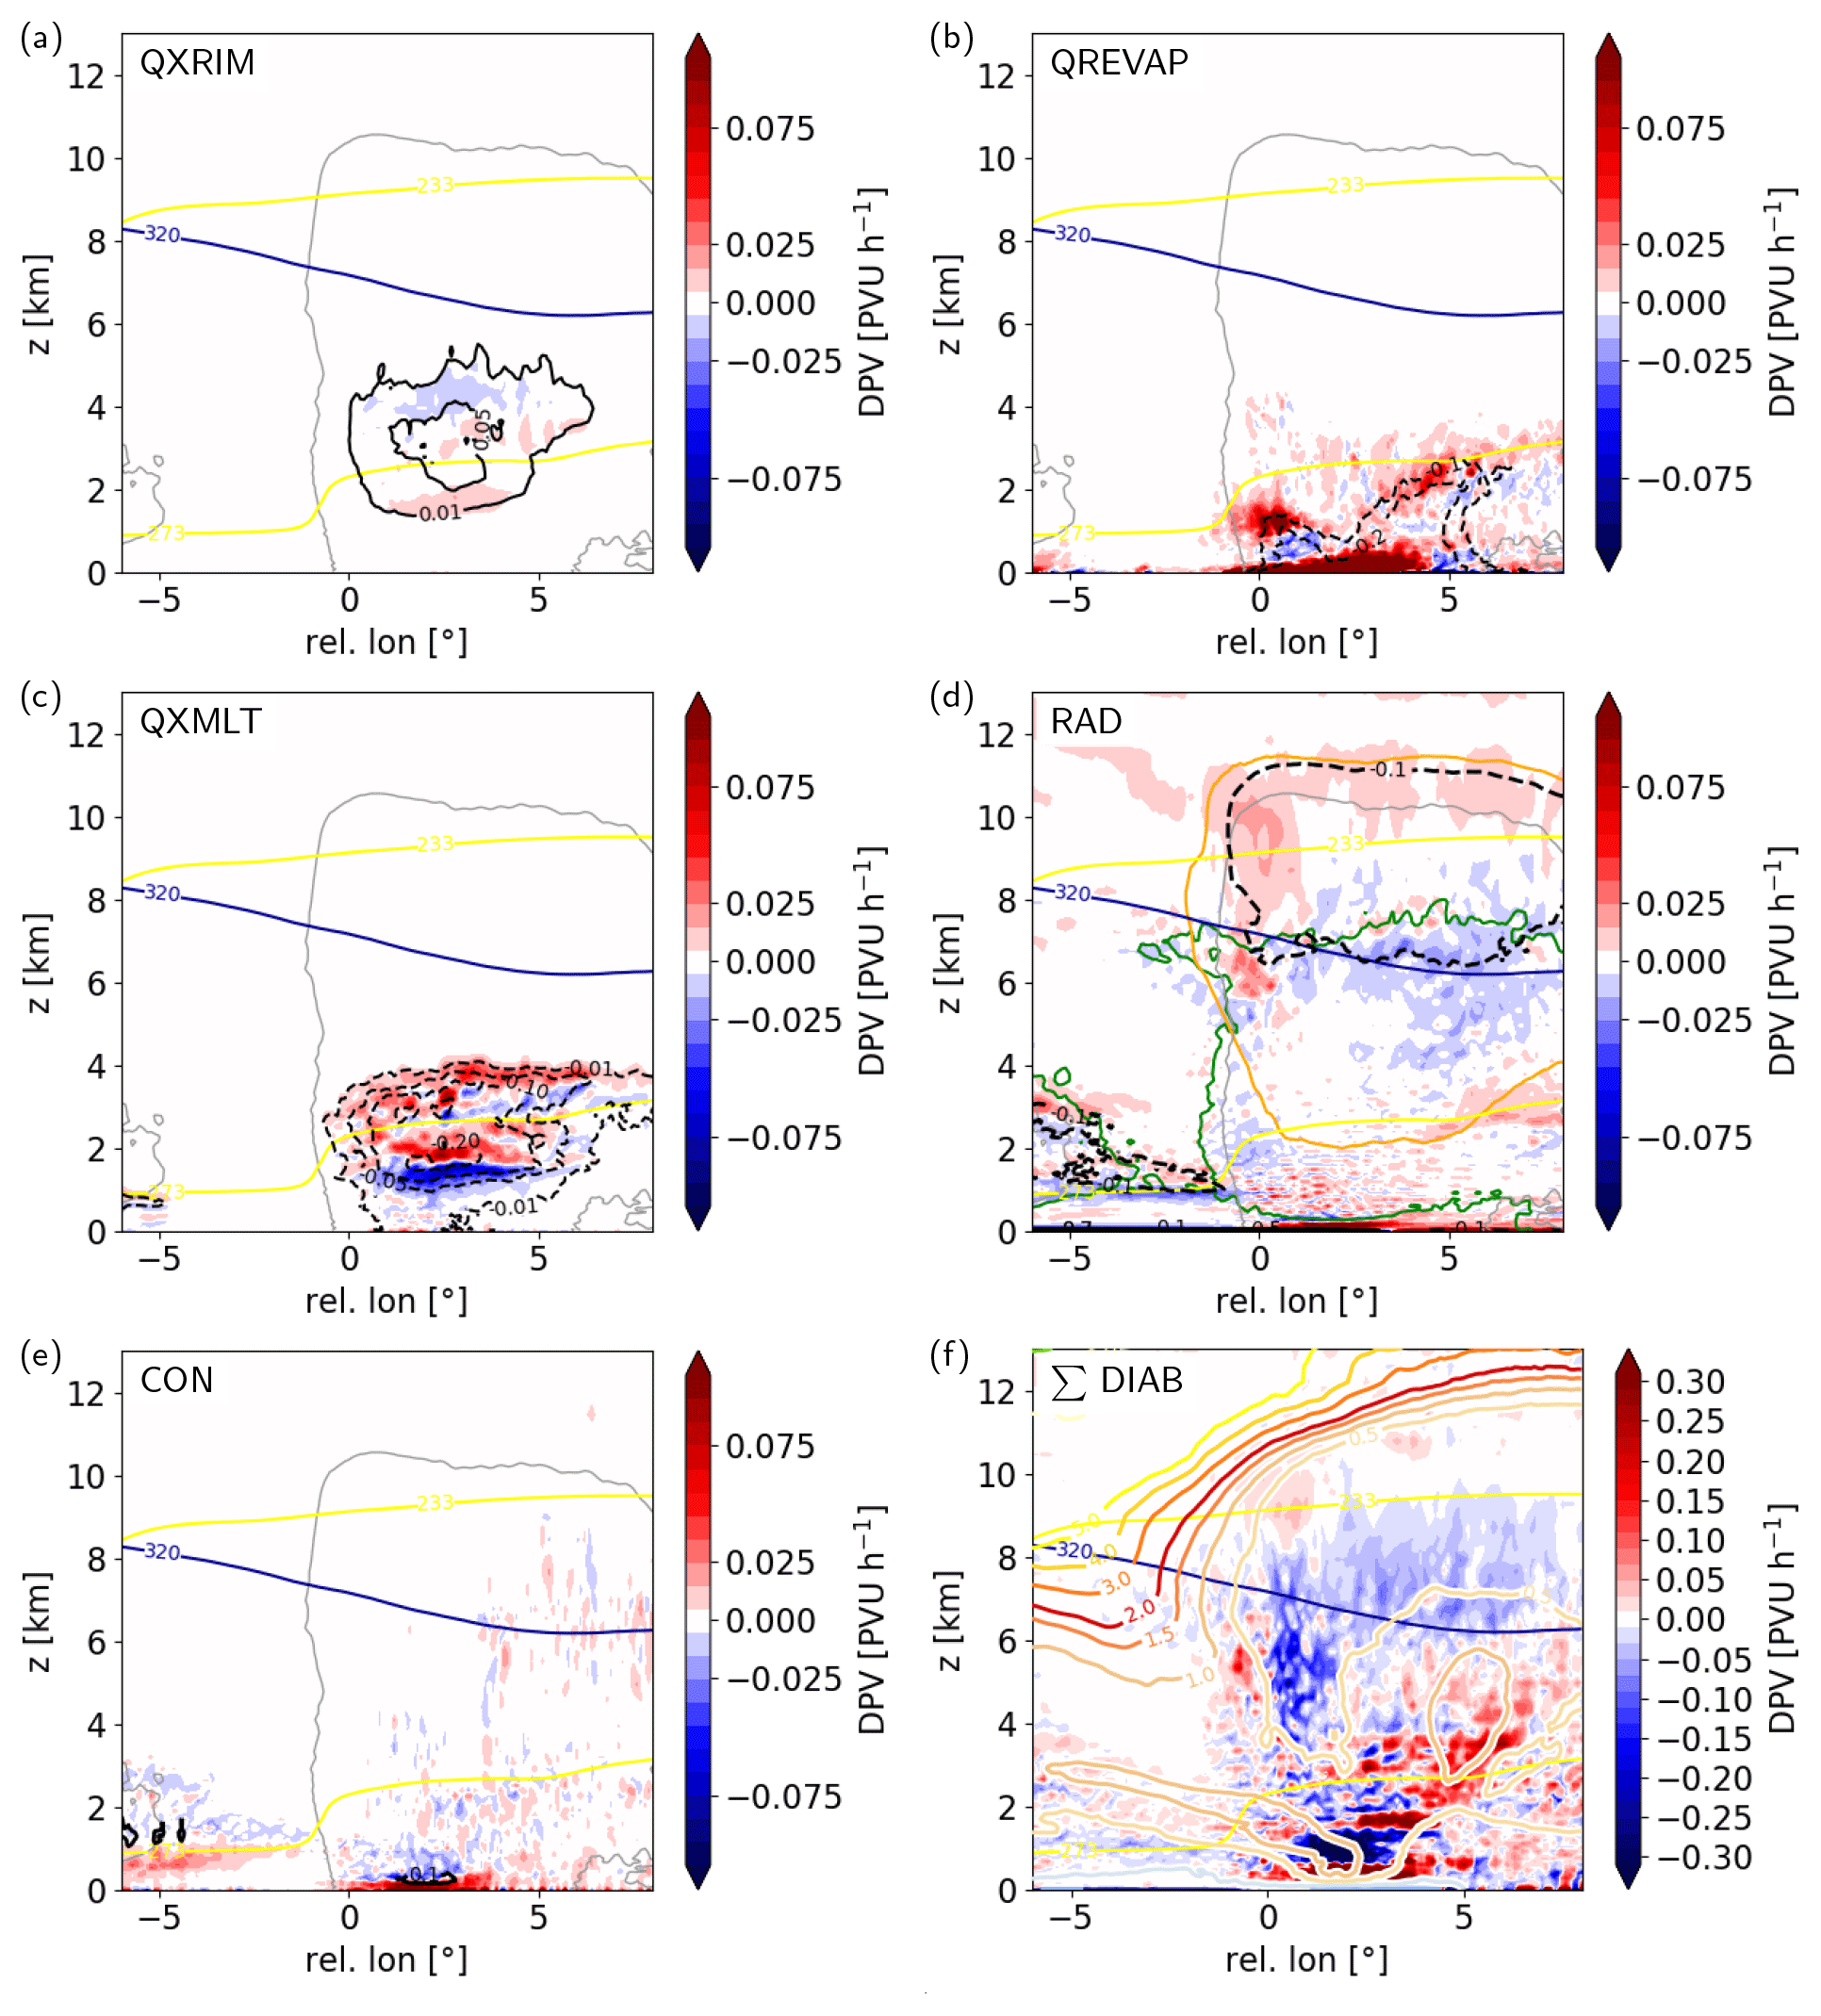
Figure 11As Fig. 10 but for (a) riming (QXRIM), (b) evaporation of rain (QREVAP), (c) melting (QXMLT), (d) the sum of long- and shortwave radiation (RAD), (e) the convection scheme (CON), and (f) the sum of PV tendencies from all considered diabatic heating processes. Panel (d) also outlines cloud and ice water content (green and orange contours, at 2 mg kg1), and (f) includes the potential vorticity distribution (colored contours, in PVU). All panels show 273 and 233 K isotherms (yellow), 320 K isentrope (blue), and the cloudy region (qt=0.01 g k−1, grey line). Note that PV tendencies in (a)–(e) are 1 order of magnitude lower than those in Fig. 10.
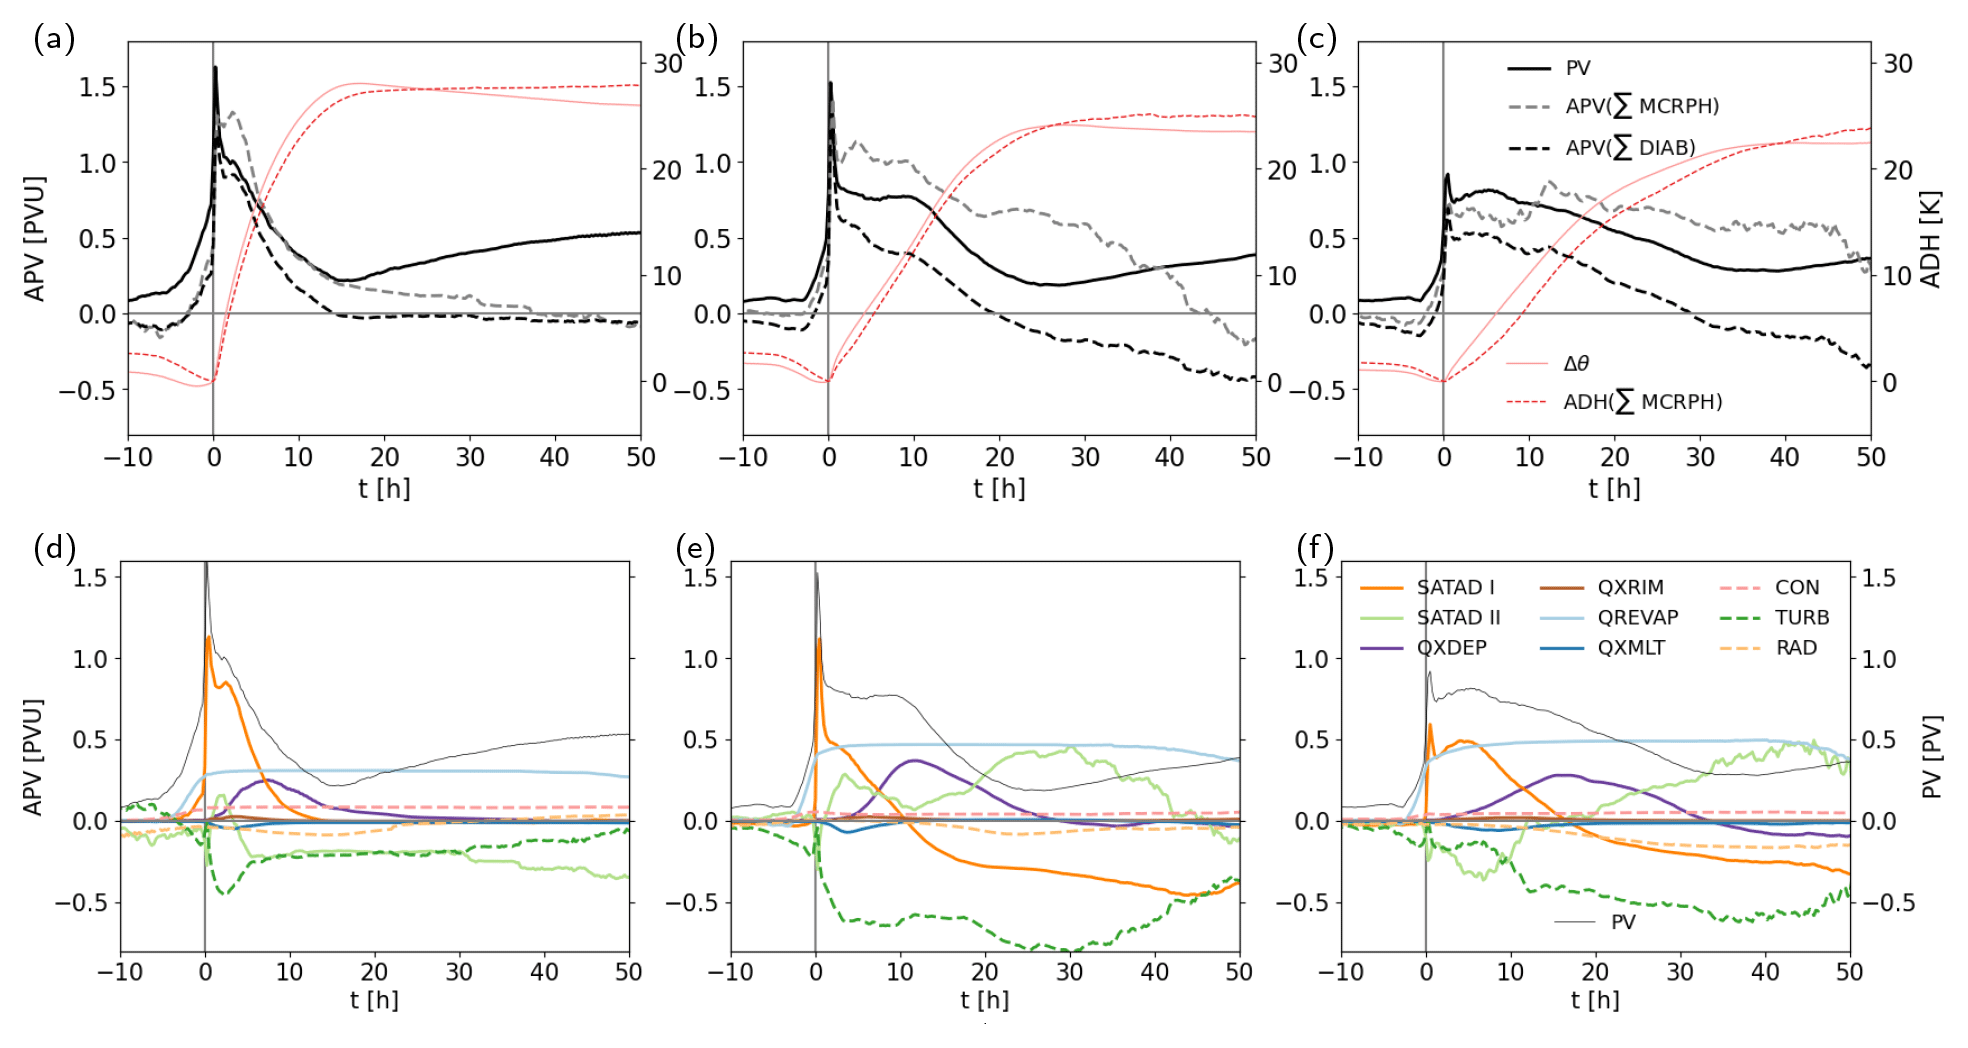
Figure 12Mean evolution of PV and accumulated diabatic PV rates (APV, in PVU) along (a, d) fast, (b, e) intermediate, and (c, f) slow WCB trajectories centered at the start of the fastest 600 hPa ascent phase (see Fig. 6). (a–c) PV and APV for relevant microphysical processes (∑MCRPHS; SATAD I and II, QXDEP, QXMLT, QXRIM, and QREVAP), as well as microphysics plus TURB, CON, and RAD (∑DIAB). Accumulated diabatic heating (ADH, in K) from all microphysical processes (blue dashed) and the net change in potential temperature (red, Δθ) are shown in the secondary axis. (d–f) APV from individual non-conservative processes: SATAD I and II, QXDEP, QXRIM, QREVAP, QXMLT, CON, TURB, and RAD. Full PV is shown in the secondary axis.
This study quantifies the individual diabatic heating contributions that determine the cross-isentropic WCB ascent using online trajectories in a two-way nested ICON simulation of a case study in the North Atlantic and discusses the resultant diabatic PV modification. We provide a detailed ICON model perspective of microphysical process that are active in the WCB airstream and thus influence WCB ascent as well as cloud and precipitation structure. In addition to improved process and model understanding this lays the foundation for subsequent sensitivity experiments on the role of microphysical uncertainty in WCB ascent. To account for reduced aerosol loading in the North Atlantic compared to continental regions, the ICON simulations were performed with a modified CCN activation scheme. The newly implemented nesting support for online trajectories allows for the flexibility to use higher-resolution nesting without being too limited in terms of the size of the refined area, which is particularly important for larger-scale systems, such as WCBs. In addition to quantifying the dominant (micro-)physical heating contributions for this WCB case study, we present complementary Lagrangian and Eulerian perspectives that illustrate diabatic heating contributions (Fig. 13) as well as the interaction between detailed non-conservative processes and their effect on the PV distribution. The established Lagrangian perspective (e.g., Joos and Wernli, 2012; Joos and Forbes, 2016; Mazoyer et al., 2021) allows for the quantification of processes that dominate the heat transport into the upper troposphere and, hence, determine the isentropic outflow level of the WCB airstream (Fig. 13b). The complementary Eulerian perspective based on WCB-centered composites of vertical cross-section gives an overview of where the most important diabatic heating takes place (Fig. 13a) and how this modifies the PV distribution.
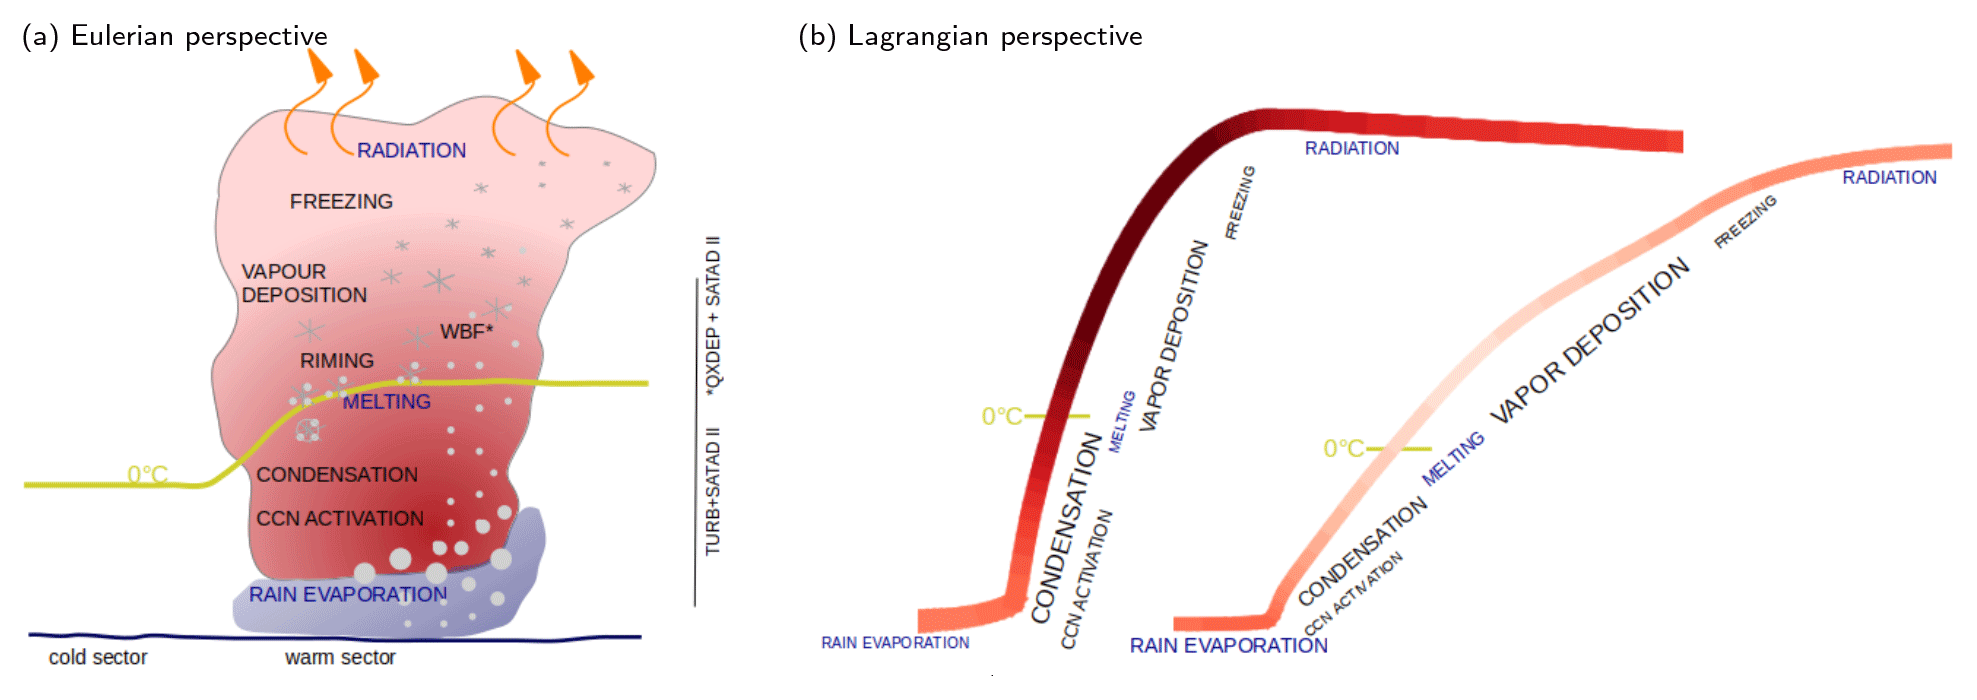
Figure 13Schematic (a) Eulerian and (b) Lagrangian perspectives of non-conservative processes in a WCB represented by the ICON model. Additionally, (a) indicates the Wegener–Bergeron–Findeisen process (WBF), which is represented through the interaction of vapor deposition (QXDEP) and the second saturation adjustment (SATAD II), as well as the quasi-compensation of SATAD II and the turbulent temperature tendencies (TURB) in the lower troposphere. (b) The colors along fast and slow ascent indicate the respective ascent-integrated diabatic heating anomalies, and the font size indicates the diabatic heating strength of the individual microphysical processes. The 0 ∘C isotherm is slightly elevated along fast WCB ascent.
In agreement with previous case studies (Rasp et al., 2016; Oertel et al., 2019, 2021), we find a large heterogeneity in the WCB ascent behavior, which affects not only the total ascent-integrated diabatic heating but also the heating contributions from individual (micro-)physics processes. The fast or convectively ascending WCB trajectories are on average heated substantially more than more gradually ascending trajectories and, thus, also reach a higher isentropic surface. However, their total heating contribution is still relatively small due to the small percentage of rapidly ascending WCB trajectories in this case study.
Consideration of all parameterized non-conservative processes shows that the ascent-integrated diabatic heating is dominated by microphysics with smaller contributions from turbulent processes and (shallow) convection. Longwave radiative cooling near the cloud top decreases the trajectories' isentropic level after their ascent.
From all microphysical processes, the first saturation adjustment, i.e., condensational growth of cloud droplets, and vapor deposition on frozen hydrometeors dominate the total heating in the lower and upper troposphere, respectively, which is in agreement with previous case studies (Joos and Wernli, 2012; Martínez-Alvarado et al., 2014; Mazoyer et al., 2021). Riming has only a small diabatic heating contribution due to the small latent heat of freezing. During ascent, the WCB air is cooled by melting of sedimenting frozen hydrometeors near the 0 ∘C isotherm. Evaporation of rain in the lower troposphere substantially cools the WCB air, in particular prior to WCB trajectory ascent. Integrated over the WCB ascent, the second saturation adjustment, which is called after the explicit microphysical processes, contributes to a cooling. In the mixed-phase region, it is associated with the Wegener–Bergeron–Findeisen process and evaporates cloud droplets after vapor deposition on frozen hydrometeors. Moreover, the diabatic heating tendencies from turbulent diffusion and the second saturation adjustment to a large extent compensate each other in the lower troposphere. Hence, we suggest that if diabatic heating from the second saturation adjustment is included in any microphysics budgets, the counteracting effects between the turbulent diffusion and second saturation adjustment should be additionally considered, in particular because the individual heating tendencies of both processes locally can be very large but tend to counteract each other. The remaining microphysical processes that are explicitly represented in ICON's two-moment scheme (such as freezing and activation of cloud droplets) have negligible heating contributions, mainly due to small mass conversion. Although this has not yet been analyzed systematically, we hypothesize that assumptions about the representation of these processes are still relevant, as they may to some extent influence processes with major diabatic heating contributions, such as vapor deposition, rain evaporation, or radiation, and due to their relevance for precipitation formation. For example, the modifications to the CCN activation scheme (Sect. 2.3) suggest that changes in CCN concentration slightly modify averaged heating rate profiles (Fig. A2d) and more strongly influence hydrometeor mass and number concentration distributions (Fig. A2a, b). Previous studies using coarser-resolution numerical models and including observations (Joos et al., 2017; McCoy et al., 2018) have found some impacts of aerosol concentrations on WCB-related precipitation and cloud structure. Mazoyer et al. (2021) reported only a minor impact of changing CCN concentrations on the entire simulation of a WCB case. Future studies should more systematically analyze the influence of CCN activation on microphysical processes, cloud and precipitation formation, and cloud–radiation interactions in WCBs, similar to impact studies of aerosol concentrations in convective environments (e.g., Seifert and Beheng, 2006b; van den Heever et al., 2011; Barthlott et al., 2017; Marinescu et al., 2021; Barthlott and Hoose, 2018; Barthlott et al., 2022).
While the detailed diabatic heating contributions, in particular from individual microphysical process rates, are model specific and vary depending on the parameterization scheme (Joos and Forbes, 2016; Mazoyer et al., 2021; Wimmer et al., 2022), several studies using different WCB case studies, models, and parameterization schemes have consistently suggested that heating from condensation and vapor deposition are the dominant processes (Joos and Wernli, 2012; Joos and Forbes, 2016; Mazoyer et al., 2021). Therefore, we also expect that diabatic heating in other WCB case studies, which typically occur in an environment with strong dynamic forcing, is primarily determined by thermodynamic constraints. Thus, in future climate conditions the increase in specific humidity in the WCB inflow will result in enhanced diabatic heating and a higher outflow level (Joos et al., 2023).
We further analyze which PV tendencies strongly contribute to low-level PV production and upper-level PV reduction in the WCB. A local maximum of PV production is located in the lowermost troposphere, which is related to strong vertical gradients of the initial saturation adjustment in an environment with large vertical vorticity. Prior to the ascent, evaporation of rain near the surface also substantially contributes to PV production near the surface. These large positive near-surface PV values are transported upward by the ascending WCB before the air parcels' PV values decrease towards their initially low PV values due to PV reduction from condensation, vapor deposition, and longwave radiative cooling. Large integrated PV tendencies also result from the second saturation adjustment and heating from the turbulence scheme. However, similar to their diabatic heating rates, the PV tendencies to some extent compensate each other and on average contribute to a PV reduction, although the detailed PV evolution should be considered with care due to interpolation errors of the locally large values. The additional microphysical processes such as evaporation, riming, and melting have smaller but non-negligible contributions to PV modification due to their smaller diabatic heating rates and resulting smaller heating gradients. The relative contributions of the physics processes to the overall PV evolution depend on the detailed model representation of cloud and other physics processes and are therefore probably model dependent.
The model representation of microphysical processes, in particular assumptions about aerosol concentrations or ice microphysics, is associated with large uncertainties. It is still not clear how sensitive WCB ascent and the associated cloud structure and precipitation formation are to the detailed representation of individual microphysical parameters and how such uncertainties propagate to the larger scale. For example, it is yet to be known if environmental conditions, such as air pollution or dust outbreaks modifying CCN and ice nucleating particle concentrations, influence WCB ascent or if the total ascent is insensitive to the detailed representation of cloud formation, as the bulk heating is dominated by the total conversion of specific humidity and therefore thermodynamic constraints. Therefore, sensitivity experiments employing the presented analysis framework will be conducted in future work, using varying assumptions about uncertain key parameters for WCB ascent. Such experiments can reveal if, and how, uncertainties in the microphysics parameterizations influence WCB ascent behavior and integrated diabatic heating as well as propagate to the larger-scale flow. Additionally, extending the analysis to further case studies, and to different microphysics schemes and NWP models, would shed more light on the role of detailed representation of individual microphysical processes in WCB ascent, the cloud structure, and associated precipitation characteristics.
A1 Modified CCN activation parameterization
The CCN activation scheme (Hande et al., 2016) for the regional ICON domain over Germany (ICON-D2) is optimized for aerosol number concentrations over Germany and based on extensive simulations and measurements of aerosol size distributions during the HD(CP)2 Observational Prototype Experiment (HOPE) field campaign. The CCN activation is parameterized as a function of updraft velocity and pressure, accounting for thermodynamic conditions and vertical distributions of aerosols, respectively (Fig. 2). Generally, the CCN concentration is high in the boundary layer and strongly decreases above.
Aerosol number concentrations over continental regions can differ substantially from concentrations over the open ocean. Previous studies have showed that aerosol number concentrations over the ocean decrease less strongly with height than over continental regions, especially in the lower troposphere (Hudson and Xie, 1999; Wang et al., 2021), although variability in aerosol amount and its vertical distribution is large and, among others, varies with season and synoptic conditions. The modified CCN activation parameterization takes the substantially differing aerosol characteristics over the North Atlantic compared to continental Germany into account and is based on airborne measurements of size-resolved aerosol number concentrations from three research flights of the British Facility for Airborne Atmospheric Measurements (FAAM) BAe-146 that took place during the NAWDEX campaign in September and October 2016 (CEDA et al., 2016a, b, c; CEDA, 2016). Size-binned aerosol number concentrations were measured with a passive cavity aerosol spectrometer probe (PCASP) in the range of 0.2 to 3 µm (Nott, 2013; Droplet Measurement Technologies, 2017). The individual steps for the modification of the CCN activation scheme are outlined below.
Observations
The FAAM aircraft operated from the United Kingdom (UK), and measurements were taken to the west and north of the UK over the Atlantic and Scotland (Fig. A1a). To account for the air mass origin of PCASP measurements, 24 h backward trajectories were calculated with LAGRANTO (Sprenger and Wernli, 2015) from 3 h ERA5 reanalysis data (Hersbach et al., 2019, 2020). Trajectories were started in the region around the flight tracks and every 100 hPa in the vertical. The backward trajectories show that the flights in September were influenced by long-range transport of maritime air advected from the North Atlantic during the transition to and presence of a zonal weather regime (Schäfler et al., 2018; Grams et al., 2017), while air measured during the October flight is potentially more strongly influenced by continental aerosol concentrations with low-level and mid-level air masses advected from the North Sea region during a Scandinavian blocking (Fig. A1a).
PCASP measurements with a temporal resolution of 1 s are available. Data during strong sinking or rising flight segments were removed, which substantially reduced the number of available data (Fig. A1b); 10 min along-flight averages were calculated prior to computing the median size distribution (ddln(D)) for the marine boundary layer (MBL) and the free troposphere (FT) separately (Fig. A1c). Both aerosol size distributions show two local maxima; hence, two lognormal aerosol size distributions for the accumulation and the coarse mode were fitted (Fig. A1c).
Cloud parcel model simulations
To obtain activated cloud droplet number concentrations based on the observed aerosol population, we conduct parcel model simulation with pyrcel (Rothenberg and Wang, 2016), which due to a very short time step allows us to explicitly predict the supersaturation evolution. The latter is key for CCN activation and is not represented in ICON. Parcel model simulations use the fitted aerosol size distributions, assuming ammonium sulfate for the accumulation mode and sea salt for the coarse mode (note that results are not very sensitive to these assumptions). Simulations were started at different pressure values (1000–400 hPa) with constant vertical velocities of 0.01 to 50 m s−1. Initial temperature values for the parcel simulations follow a dry adiabatic temperature profile, and initial relative humidity is set to 99 %. Parcel model simulations are computed for 3000 s. From each parcel model simulation the cloud droplet number concentration (CDNC) after the activation event, i.e., after reaching the maximum supersaturation, is retrieved.
Parameterization for CCN activation
The resulting CDNC values were used to fit a parameterization for CCN activation depending on pressure and vertical velocity (Eq. A1), similar to the CCN activation scheme developed by Hande et al. (2016, Fig. 2). The aerosol number concentration Na is assumed to be quasi-constant in the well-mixed boundary layer and to decay exponentially above with a scale height of 150 hPa for the accumulation mode and 400 hPa for the coarse mode (Fig. 2, Eq. A1). The following equation describes the number concentration of activated cloud droplets Nc as a function of vertical velocity w and pressure p:
with
and
CCN activation was limited to temperatures above −38 ∘C to prevent production of very large ice number concentrations by CCN activation at low temperatures and immediate subsequent homogeneous freezing of the activated cloud droplets. Vertical profiles of the predicted CCN number densities from the original parameterization by Hande et al. (2016) (dashed lines) and our modified version (solid lines) are shown in Fig. 2.
A2 Comparison of modified and original CCN activation scheme
The influence of the modification of the CCN activation scheme has been tested in a limited-area setup for the case study presented in detail above. Figure A2 shows averaged vertical profiles of hydrometeor number concentrations, water content, and selected diabatic heating rates in the WCB cloud band from two 24 h limited-area simulations using the (i) original and (ii) modified Hande scheme (in both simulations CCN activation was limited to temperatures above −38 ∘C). Both limited-area simulations were run for 24 h on the R03B09 grid and were initialized at 00:00 UTC on 4 October 2016 from the ICON analysis. Lateral boundary conditions are provided every 3 h from ICON analysis fields. As expected, the CCN activation with the modified CCN activation scheme is reduced, in particular in the lower troposphere (Fig. A2c). This is associated with an expected reduction in cloud droplet number concentrations and cloud water content, while rain water content and number concentrations are increased (Fig. A2a, b). Although the effect on averaged vertical profiles of diabatic heating rates, such as condensation, evaporation, and vapor deposition on ice hydrometeors, is relatively small (Fig. A2d), some differences in averaged diabatic heating rates are discernible that may influence WCB ascent (Fig. A2d).
Figure A1(a) Flight tracks for the NAWDEX British FAAM flights on 23 September 2016 (orange), 27 September 2016 (green), and 14 October 2016 (blue), including mean 24 h backward trajectories from the flight tracks of all three flights (colored in orange, green, and blue, respectively). Trajectory positions are averaged and shown for the lower (dashed lines, p>850 hPa), middle (dotted lines, 850 hPa 300 hPa), and upper (solid lines, p<300 hPa) troposphere. (b) Zoomed-in flight tracks of (a). The highlighted tracks show regions where data are available. (c) Median lognormal aerosol size distribution for the marine boundary layer (MBL) and the free troposphere (FT) for measurements from all three flights and from the flights individually.
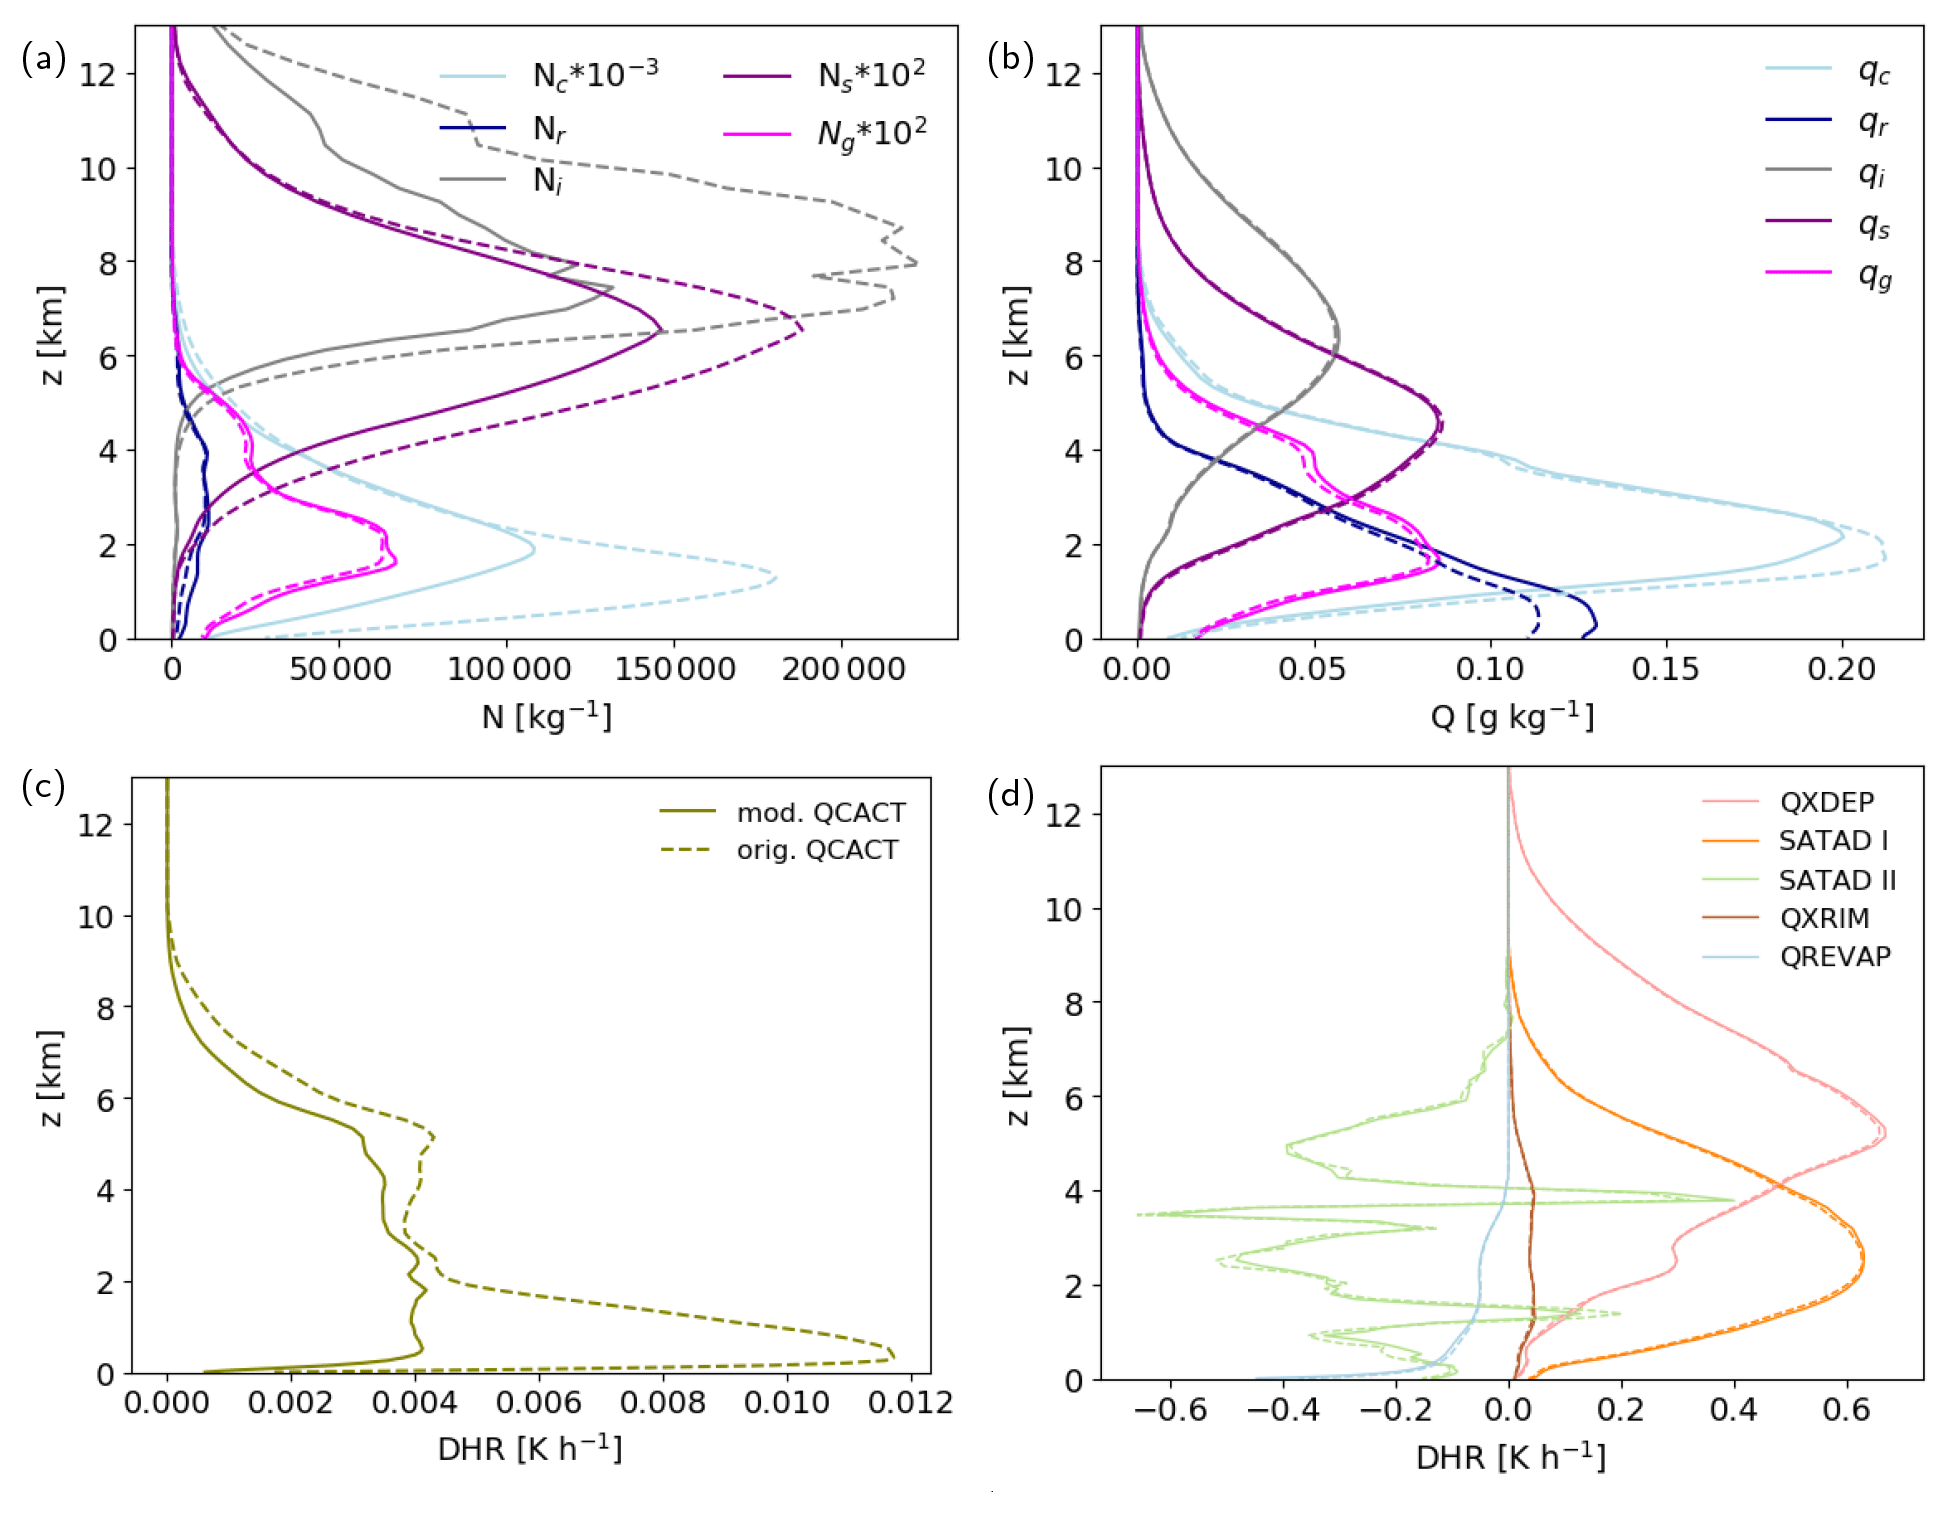
Figure A2Averaged vertical profiles in the WCB cloud band (selected as the region where total water path exceeds 1 kg m−2) from two 24 h long limited-area simulations of the WCB case study, illustrating the differences that arise from a modification of the original CCN activation scheme. Solid lines show results from a simulation with the modified CCN activation scheme, and dashed lines show results from the original CCN activation scheme. Shown are (a) hydrometeor number concentrations (N, in kg−1)); (b) hydrometeor masses (q, in g kg−1); (c) diabatic heating rate from CCN activation (DHR, in K h−1); and (d) diabatic heating rates (DHRs, in K h−1) from both saturation adjustments (SATAD I and II), vapor deposition (QXDEP), riming (QXRIM), and evaporation of rain (QREVAP).
The ICON source code is distributed under an institutional license issued by the German Weather Service (DWD). For more information see https://code.mpimet.mpg.de/projects/iconpublic (DWD and MPI, 2015). The model output of the ICON simulation is available from the authors upon request. The vertical cross-section composites and WCB trajectory data are accessible through the public KITopenData repository https://doi.org/10.5445/IR/1000159000 (Oertel et al., 2023a). Information and the source code for the convolutional neural network model ELIAS 2.0 are available from Quinting and Grams (2022). Size-binned aerosol number concentrations for the British FAAM flights during NAWDEX are available from the Centre for Environmental Data Analysis (CEDA) Archive (https://catalogue.ceda.ac.uk, CEDA, 2016).
AKM and AO implemented the additional online diagnostics and performed the analysis. All authors continuously discussed the results and contributed to the final paper.
At least one of the (co-)authors is a member of the editorial board of Atmospheric Chemistry and Physics. The peer-review process was guided by an independent editor, and the authors also have no other competing interests to declare.
Publisher's note: Copernicus Publications remains neutral with regard to jurisdictional claims in published maps and institutional affiliations.
The research leading to these results has been done within the subproject B8 of the Transregional Collaborative Research Center SFB/TRR 165 Waves to Weather (https://www.wavestoweather.de, last access: July 2023) funded by the German Research Foundation (DFG). Christian M. Grams is supported by the Helmholtz Association as part of the Young Investigator Group Sub-seasonal Predictability: Understanding the Role of Diabatic Outflow (SPREADOUT, grant no. VH-NG-1243). The authors acknowledge support by the state of Baden-Württemberg through bwHPC. The high-resolution ICON simulation was performed on the supercomputer Mogon II at the Johannes Gutenberg University Mainz, which is a member of the AHRP (Alliance for High-Performance Computing in Rhineland-Palatinate) and the Gauss Alliance e.V. The development of the special diagnostics in ICON was additionally carried out on the supercomputers ForHLR II and HoreKa at Karlsruhe Institute of Technology Karlsruhe, which are funded by the Ministry of Science, Research and the Arts Baden-Württemberg, Germany, and the German Federal Ministry of Education and Research. The authors gratefully acknowledge the computing time granted on the supercomputers Mogon II at the Johannes Gutenberg University Mainz and on ForHLR II and HoreKa at Karlsruhe Institute of Technology Karlsruhe. The authors kindly acknowledge the CEDA data archive for providing access to the FAAM flight data.
This research has been supported by the Deutsche Forschungsgemeinschaft (Transregional Collaborative Research Center SFB/TRR 165 Waves to Weather grant) and the Helmholtz-Gemeinschaft (grant no. VH-NG-1243).
This paper was edited by Matthew Lebsock and reviewed by Ambrogio Volonté and Gwendal Rivière.
Attinger, R., Spreitzer, E., Boettcher, M., Forbes, R., Wernli, H., and Joos, H.: Quantifying the role of individual diabatic processes for the formation of PV anomalies in a North Pacific cyclone, Q. J. Roy. Meteor. Soc., 145, 2454–2476, https://doi.org/10.1002/qj.3573, 2019. a, b
Attinger, R., Spreitzer, E., Boettcher, M., Wernli, H., and Joos, H.: Systematic assessment of the diabatic processes that modify low-level potential vorticity in extratropical cyclones, Weather Clim. Dynam., 2, 1073–1091, https://doi.org/10.5194/wcd-2-1073-2021, 2021. a
Barthlott, C. and Hoose, C.: Aerosol effects on clouds and precipitation over Central Europe in different weather regimes, J. Atmos. Sci., 75, 4247–4264, https://doi.org/10.1175/JAS-D-18-0110.1, 2018. a, b
Barthlott, C., Mühr, B., and Hoose, C.: Sensitivity of the 2014 Pentecost storms over Germany to different model grids and microphysics schemes, Q. J. Roy. Meteor. Soc., 143, 1485–1503, https://doi.org/10.1002/qj.3019, 2017. a
Barthlott, C., Zarboo, A., Matsunobu, T., and Keil, C.: Importance of aerosols and shape of the cloud droplet size distribution for convective clouds and precipitation, Atmos. Chem. Phys., 22, 2153–2172, https://doi.org/10.5194/acp-22-2153-2022, 2022. a, b
Baumgart, M., Ghinassi, P., Wirth, V., Selz, T., Craig, G. C., and Riemer, M.: Quantitative view on the processes governing the upscale error growth up to the planetary scale using a stochastic convection scheme, Mon. Weather Rev., 147, 1713–1731, https://doi.org/10.1175/MWR-D-18-0292.1, 2019. a
Bechtold, P., Köhler, M., Jung, T., Doblas-Reyes, F., Leutbecher, M., Rodwell, M. J., Vitart, F., and Balsamo, G.: Advances in simulating atmospheric variability with the ECMWF model: From synoptic to decadal time-scales, Q. J. Roy. Meteor. Soc., 134, 1337–1351, https://doi.org/10.1002/qj.289, 2008. a
Berman, J. D. and Torn, R. D.: The impact of initial condition and warm conveyor belt forecast uncertainty on variability in the downstream waveguide in an ECWMF case study, Mon. Weather Rev., 147, 4071–4089, https://doi.org/10.1175/MWR-D-18-0333.1, 2019. a
Bigg, E. K.: The formation of atmospheric ice crystals by the freezing of droplets, Q. J. Roy. Meteor. Soc., 79, 510–519, https://doi.org/10.1002/qj.49707934207, 1953. a
Binder, H., Boettcher, M., Joos, H., and Wernli, H.: The role of warm conveyor belts for the intensification of extratropical cyclones in Northern Hemisphere winter, J. Atmos. Sci., 73, 3997–4020, https://doi.org/10.1175/JAS-D-15-0302.1, 2016. a, b
Blanchard, N., Pantillon, F., Chaboureau, J.-P., and Delanoë, J.: Organization of convective ascents in a warm conveyor belt, Weather Clim. Dynam., 1, 617–634, https://doi.org/10.5194/wcd-1-617-2020, 2020. a, b, c, d
Blanchard, N., Pantillon, F., Chaboureau, J.-P., and Delanoë, J.: Mid-level convection in a warm conveyor belt accelerates the jet stream, Weather Clim. Dynam., 2, 37–53, https://doi.org/10.5194/wcd-2-37-2021, 2021. a
Boettcher, M. and Wernli, H.: A 10-yr climatology of diabatic Rossby waves in the Northern Hemisphere, Mon. Weather Rev., 141, 1139–1154, https://doi.org/10.1175/MWR-D-12-00012.1, 2013. a
Boettcher, M., Schäfler, A., Sprenger, M., Sodemann, H., Kaufmann, S., Voigt, C., Schlager, H., Summa, D., Di Girolamo, P., Nerini, D., Germann, U., and Wernli, H.: Lagrangian matches between observations from aircraft, lidar and radar in a warm conveyor belt crossing orography, Atmos. Chem. Phys., 21, 5477–5498, https://doi.org/10.5194/acp-21-5477-2021, 2021. a
CEDA (Centre for Environmental Data Analysis): CEDA archive Catalogue, https://catalogue.ceda.ac.uk (last access: April 2021), 2016. a, b, c
CEDA, Facility for Airborne Atmospheric Measurements, Natural Environment Research Council, and Met Office: FAAM B984 ISMAR and T-NAWDEX flight: Airborne atmospheric measurements from core instrument suite on board the BAE-146 aircraft, Centre for Environmental Data Analysis [data set], https://catalogue.ceda.ac.uk/uuid/46ca2a2cc8ce497fbf06beaf31f67098 (last access: April 2021), 2016a. a, b
CEDA, Facility for Airborne Atmospheric Measurements, Natural Environment Research Council, and Met Office: FAAM B981 T-NAWDEX flight: Airborne atmospheric measurements from core instrument suite on board the BAE-146 aircraft, Centre for Environmental Data Analysis [data set], https://catalogue.ceda.ac.uk/uuid/eef7311cd4374738ad0272e0df189f34 (last access: April 2021), 2016b. a, b
CEDA, Facility for Airborne Atmospheric Measurements, Natural Environment Research Council, and Met Office: FAAM B980 T-NAWDEX flight: Airborne atmospheric measurements from core instrument suite on board the BAE-146 aircraft, Centre for Environmental Data Analysis [data set], https://catalogue.ceda.ac.uk/uuid/d802040267e141019fad89bf25b85675 (last access: April 2021), 2016c. a, b
Chagnon, J. M. and Gray, S. L.: Horizontal potential vorticity dipoles on the convective storm scale, Q. J. Roy. Meteor. Soc., 135, 1392–1408, https://doi.org/10.1002/qj.468, 2009. a
Choudhary, A. and Voigt, A.: Impact of grid spacing, convective parameterization and cloud microphysics in ICON simulations of a warm conveyor belt, Weather Clim. Dynam., 3, 1199–1214, https://doi.org/10.5194/wcd-3-1199-2022, 2022. a
Crespo, J. A. and Posselt, D. J.: A-Train-based case study of stratiform – convective transition within a warm conveyor belt, Mon. Weather Rev., 144, 2069–2084, https://doi.org/10.1175/MWR-D-15-0435.1, 2016. a
Crezee, B., Joos, H., and Wernli, H.: The microphysical building blocks of low-level potential vorticity anomalies in an idealized extratropical cyclone, J. Atmos. Sci., 74, 1403–1416, https://doi.org/10.1175/JAS-D-16-0260.1, 2017. a, b, c
Dearden, C., Vaughan, G., Tsai, T., and Chen, J.-P.: Exploring the diabatic role of ice microphysical processes in two North Atlantic summer cyclones, Mon. Weather Rev., 144, 1249–1272, https://doi.org/10.1175/MWR-D-15-0253.1, 2016. a
Droplet Measurement Technologies: Operator Manual: Passive Cavity Aerosol Spectrometer Probe (PCASP-100X), https://www.dropletmeasurement.com/manual/operations-manual-passive-cavity-aerosol-spectrometer-probe-pcasp-100x/, (last access: January 2022), 2017. a
DWD and MPI: ICON – Icosahedral Nonhydrostatic Weather and Climate Model, https://code.mpimet.mpg.de/projects/iconpublic (last access: July 2023), 2015. a
Eckhardt, S., Stohl, A., Wernli, H., James, P., Forster, C., and Spichtinger, N.: A 15-Year climatology of warm conveyor belts, J. Climate, 17, 218–237, https://doi.org/10.1175/1520-0442(2004)017<0218:AYCOWC>2.0.CO;2, 2004. a
ECMWF: IFS Documentation CY43R1 – Part IV: Physical processes, ECMWF Rep., https://doi.org/10.21957/sqvo5yxja, 2016. a
Fan, J., Wang, Y., Rosenfeld, D., and Liu, X.: Review of aerosol–cloud interactions: Mechanisms, significance, and challenges, J. Atmos. Sci., 73, 4221–4252, https://doi.org/10.1175/JAS-D-16-0037.1, 2016. a
Field, P. R., Lawson, R. P., Brown, P. R. A., Lloyd, G., Westbrook, C., Moisseev, D., Miltenberger, A., Nenes, A., Blyth, A., Choularton, T., Connolly, P., Buehl, J., Crosier, J., Cui, Z., Dearden, C., DeMott, P., Flossmann, A., Heymsfield, A., Huang, Y., Kalesse, H., Kanji, Z. A., Korolev, A., Kirchgaessner, A., Lasher-Trapp, S., Leisner, T., McFarquhar, G., Phillips, V., Stith, J., and Sullivan, S.: Secondary ice production: Current state of the science and recommendations for the future, Meteorol. Monogr., 58, 7.1–7.20, https://doi.org/10.1175/AMSMONOGRAPHS-D-16-0014.1, 2017. a
Flack, D. L. A., Rivière, G., Musat, I., Roehrig, R., Bony, S., Delanoë, J., Cazenave, Q., and Pelon, J.: Representation by two climate models of the dynamical and diabatic processes involved in the development of an explosively deepening cyclone during NAWDEX, Weather Clim. Dynam., 2, 233–253, https://doi.org/10.5194/wcd-2-233-2021, 2021. a
Forbes, R. M. and Clark, P. A.: Sensitivity of extratropical cyclone mesoscale structure to the parametrization of ice microphysical processes, Q. J. Roy. Meteor. Soc., 129, 1123–1148, https://doi.org/10.1256/qj.01.171, 2003. a
Gehring, J., Oertel, A., Vignon, É., Jullien, N., Besic, N., and Berne, A.: Microphysics and dynamics of snowfall associated with a warm conveyor belt over Korea, Atmos. Chem. Phys., 20, 7373–7392, https://doi.org/10.5194/acp-20-7373-2020, 2020. a, b
Grams, C., Beerli, R., Pfenninger, S., Staffell, I., and Wernli, H.: Balancing Europe's wind power output through spatial deployment informed by weather regimes, Nat. Clim. Change, 7, 557–562, https://doi.org/10.1038/nclimate3338, 2017. a
Grams, C. M. and Archambault, H. M.: The key role of diabatic outflow in amplifying the midlatitude flow: a representative case study of weather systems surrounding western North Pacific extratropical transition, Mon. Weather Rev., 144, 3847–3869, https://doi.org/10.1175/MWR-D-15-0419.1, 2016. a
Grams, C. M., Wernli, H., Boettcher, M., Čampa, J., Corsmeier, U., Jones, S. C., Keller, J. H., Lenz, C.-J., and Wiegand, L.: The key role of diabatic processes in modifying the upper-tropospheric wave guide: a North Atlantic case-study, Q. J. Roy. Meteor. Soc., 137, 2174–2193, https://doi.org/10.1002/qj.891, 2011. a, b
Grams, C. M., Magnusson, L., and Madonna, E.: An atmospheric dynamics perspective on the amplification and propagation of forecast error in numerical weather prediction models: A case study, Q. J. Roy. Meteor. Soc., 144, 2577–2591, https://doi.org/10.1002/qj.3353, 2018. a, b
Hande, L. B. and Hoose, C.: Partitioning the primary ice formation modes in large eddy simulations of mixed-phase clouds, Atmos. Chem. Phys., 17, 14105–14118, https://doi.org/10.5194/acp-17-14105-2017, 2017. a
Hande, L. B., Engler, C., Hoose, C., and Tegen, I.: Seasonal variability of Saharan desert dust and ice nucleating particles over Europe, Atmos. Chem. Phys., 15, 4389–4397, https://doi.org/10.5194/acp-15-4389-2015, 2015. a
Hande, L. B., Engler, C., Hoose, C., and Tegen, I.: Parameterizing cloud condensation nuclei concentrations during HOPE, Atmos. Chem. Phys., 16, 12059–12079, https://doi.org/10.5194/acp-16-12059-2016, 2016. a, b, c, d, e, f
Harvey, B., Methven, J., Sanchez, C., and Schäfler, A.: Diabatic generation of negative potential vorticity and its impact on the North Atlantic jet stream, Q. J. Roy. Meteor. Soc., 146, 1477–1497, https://doi.org/10.1002/qj.3747, 2020. a, b
Hersbach, H., Bell, W., Berrisford, P., Horányi, A., Sabater, J. M., Nicolas, J., Radu, R., Schepers, D., Simmons, A., Soci, C., and Dee, D.: Global reanalysis: goodbye ERA-Interim, hello ERA5, ECMWF Newsletter, 159, 17–24, https://doi.org/10.21957/vf291hehd7, 2019. a
Hersbach, H., Bell, B., Berrisford, P., Hirahara, S., Horányi, A., Muñoz-Sabater, J., Nicolas, J., Peubey, C., Radu, R., Schepers, D., Simmons, A., Soci, C., Abdalla, S., Abellan, X., Balsamo, G., Bechtold, P., Biavati, G., Bidlot, J., Bonavita, M., De Chiara, G., Dahlgren, P., Dee, D., Diamantakis, M., Dragani, R., Flemming, J., Forbes, R., Fuentes, M., Geer, A., Haimberger, L., Healy, S., Hogan, R. J., Hólm, E., Janisková, M., Keeley, S., Laloyaux, P., Lopez, P., Lupu, C., Radnoti, G., de Rosnay, P., Rozum, I., Vamborg, F., Villaume, S., and Thépaut, J.-N.: The ERA5 global reanalysis, Q. J. Roy. Meteor. Soc., 146, 1999–2049, https://doi.org/10.1002/qj.3803, 2020. a
Hudson, J. G. and Xie, Y.: Vertical distributions of cloud condensation nuclei spectra over the summertime northeast Pacific and Atlantic Oceans, J. Geophys. Res.-Atmos., 104, 30219–30229, https://doi.org/10.1029/1999JD900413, 1999. a, b
Igel, A. L. and van den Heever, S. C.: Invigoration or enervation of convective clouds by aerosols?, Geophys. Res. Lett., 48, e2021GL093804, https://doi.org/10.1029/2021GL093804, 2021. a
Jeffery, C. A. and Austin, P. H.: Homogeneous nucleation of supercooled water: Results from a new equation of state, J. Geophys. Res.-Atmos., 102, 25269–25279, https://doi.org/10.1029/97JD02243, 1997. a
Joos, H.: Warm conveyor belts and their role for cloud radiative forcing in the extratropical storm tracks, J. Climate, 32, 5325–5343, https://doi.org/10.1175/JCLI-D-18-0802.1, 2019. a
Joos, H. and Forbes, R. M.: Impact of different IFS microphysics on a warm conveyor belt and the downstream flow evolution, Q. J. Roy. Meteor. Soc., 142, 2727–2739, https://doi.org/10.1002/qj.2863, 2016. a, b, c, d, e, f, g
Joos, H. and Wernli, H.: Influence of microphysical processes on the potential vorticity development in a warm conveyor belt: a case-study with the limited-area model COSMO, Q. J. Roy. Meteor. Soc., 138, 407–418, https://doi.org/10.1002/qj.934, 2012. a, b, c, d, e, f, g, h, i, j, k, l
Joos, H., Spichtinger, P., Reutter, P., and Fusina, F.: Influence of heterogeneous freezing on the microphysical and radiative properties of orographic cirrus clouds, Atmos. Chem. Phys., 14, 6835–6852, https://doi.org/10.5194/acp-14-6835-2014, 2014. a
Joos, H., Madonna, E., Witlox, K., Ferrachat, S., Wernli, H., and Lohmann, U.: Effect of anthropogenic aerosol emissions on precipitation in warm conveyor belts in the western North Pacific in winter – a model study with ECHAM6-HAM, Atmos. Chem. Phys., 17, 6243–6255, https://doi.org/10.5194/acp-17-6243-2017, 2017. a, b
Joos, H., Sprenger, M., Binder, H., Beyerle, U., and Wernli, H.: Warm conveyor belts in present-day and future climate simulations – Part 1: Climatology and impacts, Weather Clim. Dynam., 4, 133–155, https://doi.org/10.5194/wcd-4-133-2023, 2023. a
Kärcher, B. and Lohmann, U.: A parameterization of cirrus cloud formation: Homogeneous freezing of supercooled aerosols, J. Geophys. Res.-Atmos, 107, AAC 4–1–AAC 4–10, https://doi.org/10.1029/2001JD000470, 2002. a
Kärcher, B., Hendricks, J., and Lohmann, U.: Physically based parameterization of cirrus cloud formation for use in global atmospheric models, J. Geophys. Res.-Atmos., 111, D01205, https://doi.org/10.1029/2005JD006219, 2006. a
Khain, A. P., Beheng, K. D., Heymsfield, A., Korolev, A., Krichak, S. O., Levin, Z., Pinsky, M., Phillips, V., Prabhakaran, T., Teller, A., van den Heever, S. C., and Yano, J.-I.: Representation of microphysical processes in cloud-resolving models: Spectral (bin) microphysics versus bulk parameterization, Rev. Geophys., 53, 247–322, https://doi.org/10.1002/2014RG000468, 2015. a
Krämer, M., Rolf, C., Luebke, A., Afchine, A., Spelten, N., Costa, A., Meyer, J., Zöger, M., Smith, J., Herman, R. L., Buchholz, B., Ebert, V., Baumgardner, D., Borrmann, S., Klingebiel, M., and Avallone, L.: A microphysics guide to cirrus clouds – Part 1: Cirrus types, Atmos. Chem. Phys., 16, 3463–3483, https://doi.org/10.5194/acp-16-3463-2016, 2016. a
Leuenberger, D., Koller, M., Fuhrer, O., and Schär, C.: A generalization of the SLEVE vertical coordinate, Mon. Weather Rev., 141, 3683–3689, https://doi.org/10.1175/2010MWR3307.1, 2010. a
Lott, F. and Miller, M. J.: A new subgrid-scale orographic drag parametrization: Its formulation and testing., Q. J. Roy. Meteor. Soc, 123, 101–127, https://doi.org/10.1002/qj.49712353704, 1997. a
Luebke, A. E., Afchine, A., Costa, A., Grooß, J.-U., Meyer, J., Rolf, C., Spelten, N., Avallone, L. M., Baumgardner, D., and Krämer, M.: The origin of midlatitude ice clouds and the resulting influence on their microphysical properties, Atmos. Chem. Phys., 16, 5793–5809, https://doi.org/10.5194/acp-16-5793-2016, 2016. a
Maddison, J. W., Gray, S. L., Martínez-Alvarado, O., and Williams, K. D.: Upstream cyclone influence on the predictability of block onsets over the Euro-Atlantic Region, Mon. Weather Rev., 147, 1277–1296, https://doi.org/10.1175/MWR-D-18-0226.1, 2019. a
Madonna, E., Wernli, H., Joos, H., and Martius, O.: Warm conveyor belts in the ERA-Interim dataset (1979–2010), Part I: Climatology and potential vorticity evolution, J. Climate, 27, 3–26, https://doi.org/10.1175/JCLI-D-12-00720.1, 2014. a, b, c, d, e, f, g, h
Marinescu, P. J., van den Heever, S. C., Heikenfeld, M., Barrett, A. I., Barthlott, C., Hoose, C., Fan, J., Fridlind, A. M., Matsui, T., Miltenberger, A. K., Stier, P., Vié, B., White, B. A., and Zhang, Y.: Impacts of varying concentrations of cloud condensation nuclei on deep convective cloud updrafts – A multimodel assessment, J. Atmos. Sci., 78, 1147–1172, https://doi.org/10.1175/JAS-D-20-0200.1, 2021. a
Martínez-Alvarado, O., Joos, H., Chagnon, J., Boettcher, M., Gray, S. L., Plant, R. S., Methven, J., and Wernli, H.: The dichotomous structure of the warm conveyor belt, Q. J. Roy. Meteor. Soc., 140, 1809–1824, https://doi.org/10.1002/qj.2276, 2014. a, b, c, d
Mazoyer, M., Ricard, D., Rivière, G., Delanoë, J., Arbogast, P., Vié, B., Lac, C., Cazenave, Q., and Pelon, P.: Microphysics impacts on the warm conveyor belt and ridge building of the NAWDEX IOP6 cyclone, Mon. Weather Rev., 149, 3961–3980, https://doi.org/10.1175/MWR-D-21-0061.1, 2021. a, b, c, d, e, f, g, h, i, j, k, l, m
Mazoyer, M., Ricard, D., Rivière, G., Delanoö, J., Riette, S., Augros, C., Borderies, M., and Vié, B.: Impact of mixed-phase cloud parameterization on warm conveyor belts and upper-tropospheric dynamics, Mon. Weather Rev., 151, 1073–1091, https://doi.org/10.1175/MWR-D-22-0045.1, 2023. a, b, c, d
McCoy, D. T., Field, P. R., Schmidt, A., Grosvenor, D. P., Bender, F. A.-M., Shipway, B. J., Hill, A. A., Wilkinson, J. M., and Elsaesser, G. S.: Aerosol midlatitude cyclone indirect effects in observations and high-resolution simulations, Atmos. Chem. Phys., 18, 5821–5846, https://doi.org/10.5194/acp-18-5821-2018, 2018. a, b, c
Methven, J.: Potential vorticity in warm conveyor belt outflow, Q. J. Roy. Meteor. Soc., 141, 1065–1071, https://doi.org/10.1002/qj.2393, 2015. a, b, c, d
Miltenberger, A. K., Pfahl, S., and Wernli, H.: An online trajectory module (version 1.0) for the nonhydrostatic numerical weather prediction model COSMO, Geosci. Model Dev., 6, 1989–2004, https://doi.org/10.5194/gmd-6-1989-2013, 2013. a
Miltenberger, A. K., Roches, A., Pfahl, S., and Wernli, H.: Online trajectory module in COSMO: A short user guide, COSMO Technical Report 24, https://www.cosmo-model.org/content/model/cosmo/techReports/docs/techReport24.pdf (last access: July 2023), 2014. a
Miltenberger, A. K., Reynolds, S., and Sprenger, M.: Revisiting the latent heating contribution to foehn warming: Lagrangian analysis of two foehn events over the Swiss Alps, Q. J. Roy. Meteor. Soc., 142, 2194–2204, https://doi.org/10.1002/qj.2816, 2016. a
Miltenberger, A. K., Lüttmer, T., and Siewert, C.: Secondary ice formation in idealised deep convection – Source of primary ice and impact on glaciation, Atmosphere, 11, 542, https://doi.org/10.3390/atmos11050542, 2020. a, b
Mlawer, E. J., Taubman, S. J., Brown, P. D., Iacono, M. J., and Clough, S. A.: Radiative transfer for inhomogeneous atmospheres: RRTM, a validated correlated-k model for the longwave, J. Geophys. Res.-Atmos., 102, 16663–16682, https://doi.org/10.1029/97JD00237, 1997. a
Morrison, H., Curry, J. A., and Khvorostyanov, V. I.: A new double-moment microphysics parameterization for application in cloud and climate models. Part I: Description, J. Atmos. Sci., 62, 1665–1677, https://doi.org/10.1175/JAS3446.1, 2005. a
Noppel, H., Blahak, U., Seifert, A., and Beheng, K. D.: Simulations of a hailstorm and the impact of CCN using an advanced two-moment cloud microphysical scheme, Atmos. Res., 96, 286–301, https://doi.org/10.1016/j.atmosres.2009.09.008, 2010. a
Nott, G.: FAAM CORE Passive Cavity Aerosol Spectrometer Probe, https://old.faam.ac.uk/index.php/science-instruments/aerosol/304-pcasp (last access: January 2022), 2013. a
Oertel, A. and Schemm, S.: Quantifying the circulation induced by convective clouds in kilometer-scale simulations, Q. J. Roy. Meteor. Soc., 147, 1752–1766, https://doi.org/10.1002/qj.3992, 2021. a
Oertel, A., Boettcher, M., Joos, H., Sprenger, M., Konow, H., Hagen, M., and Wernli, H.: Convective activity in an extratropical cyclone and its warm conveyor belt – a case-study combining observations and a convection-permitting model simulation, Q. J. Roy. Meteor. Soc., 145, 1406–1426, https://doi.org/10.1002/qj.3500, 2019. a, b, c, d, e, f
Oertel, A., Boettcher, M., Joos, H., Sprenger, M., and Wernli, H.: Potential vorticity structure of embedded convection in a warm conveyor belt and its relevance for large-scale dynamics, Weather Clim. Dynam., 1, 127–153, https://doi.org/10.5194/wcd-1-127-2020, 2020. a, b, c, d, e, f, g
Oertel, A., Sprenger, M., Joos, H., Boettcher, M., Konow, H., Hagen, M., and Wernli, H.: Observations and simulation of intense convection embedded in a warm conveyor belt – how ambient vertical wind shear determines the dynamical impact, Weather Clim. Dynam., 2, 89–110, https://doi.org/10.5194/wcd-2-89-2021, 2021. a, b, c, d, e, f, g, h, i, j
Oertel, A., Miltenberger, A. K., Grams, C. M., and Hoose, C.: Research data for “Interaction of microphysics and dynamics in a warm conveyor belt simulated with the ICON model”, Repository KITopen [data set], https://doi.org/10.5445/IR/1000159000, 2023a. a
Oertel, A., Pickl, M., Quinting, J. F., Hauser, S., Wandel, J., Magnusson, L., Balmaseda, M., Vitart, F., and Grams, C. M.: Everything hits at once: How remote rainfall matters for the prediction of the 2021 North American heat wave, Geophys. Res. Lett., 50, e2022GL100958, https://doi.org/10.1029/2022GL100958, 2023b. a
Ollinaho, P., Lock, S.-J., Leutbecher, M., Bechtold, P., Beljaars, A., Bozzo, A., Forbes, R. M., Haiden, T., Hogan, R. J., and Sandu, I.: Towards process-level representation of model uncertainties: stochastically perturbed parametrizations in the ECMWF ensemble, Q. J. Roy. Meteor. Soc., 143, 408–422, https://doi.org/10.1002/qj.2931, 2017. a
Orr, A., Bechtold, P., Scinocca, J., Ern, M., and Janiskova, M.: Improved middle atmosphere climate and forecasts in the ECMWF model through a nonorographic gravity wave drag parameterization, J. Climate, 23, 5905–5926, https://doi.org/10.1175/2010JCLI3490.1, 2010. a
Papritz, L., Aemisegger, F., and Wernli, H.: Sources and transport pathways of precipitating waters in cold-season deep North Atlantic cyclones, J. Atmos. Sci., 78, 3349–3368, https://doi.org/10.1175/JAS-D-21-0105.1, 2021. a
Pfahl, S., Madonna, E., Boettcher, M., Joos, H., and Wernli, H.: Warm conveyor belts in the ERA-Interim data set (1979–2010), Part II: Moisture origin and relevance for precipitation, J. Climate, 27, 27–40, https://doi.org/10.1175/JCLI-D-13-00223.1, 2014. a
Pickl, M., Lang, S. T. K., Leutbecher, M., and Grams, C. M.: The effect of stochastically perturbed parametrisation tendencies (SPPT) on rapidly ascending air streams, Q. J. Roy. Meteor. Soc., 148, 1242–1261, https://doi.org/10.1002/qj.4257, 2022. a
Pomroy, H. R. and Thorpe, A. J.: The evolution and dynamical role of reduced upper-tropospheric potential vorticity in intensive observing period one of FASTEX, Mon. Weather Rev., 128, 1817–1834, https://doi.org/10.1175/1520-0493(2000)128<1817:TEADRO>2.0.CO;2, 2000. a, b
Quinting, J. F. and Grams, C. M.: EuLerian Identification of ascending AirStreams (ELIAS 2.0) in numerical weather prediction and climate models – Part 1: Development of deep learning model, Geosci. Model Dev., 15, 715–730, https://doi.org/10.5194/gmd-15-715-2022, 2022. a, b, c, d
Quinting, J. F., Grams, C. M., Oertel, A., and Pickl, M.: EuLerian Identification of ascending AirStreams (ELIAS 2.0) in numerical weather prediction and climate models – Part 2: Model application to different datasets, Geosci. Model Dev., 15, 731–744, https://doi.org/10.5194/gmd-15-731-2022, 2022. a
Raschendorfer, M.: The new turbulence parameterization of LM, Cosmo news letter no. 1, Consortium for Small-Scale Modelling, http://www.cosmo-model.org/content/model/documentation/newsLetters/newsLetter01/newsLetter_01.pdf (last access: December 2021), 2018. a, b
Rasp, S., Selz, T., and Craig, G.: Convective and slantwise trajectory ascent in convection-permitting simulations of midlatitude cyclones, Mon. Weather Rev., 144, 3961–3976, https://doi.org/10.1175/MWR-D-16-0112.1, 2016. a, b, c, d
Reed, R. J., Stoelinga, M. T., and Kuo, Y.-H.: A model-aided study of the origin and evolution of the anomalously high potential vorticity in the inner region of a rapidly deepening marine cyclone, Mon. Weather Rev., 120, 893–913, https://doi.org/10.1175/1520-0493(1992)120<0893:AMASOT>2.0.CO;2, 1992. a
Rivière, G., Wimmer, M., Arbogast, P., Piriou, J.-M., Delanoë, J., Labadie, C., Cazenave, Q., and Pelon, J.: The impact of deep convection representation in a global atmospheric model on the warm conveyor belt and jet stream during NAWDEX IOP6, Weather Clim. Dynam., 2, 1011–1031, https://doi.org/10.5194/wcd-2-1011-2021, 2021. a, b, c, d, e
Rodwell, M., Forbes, R., and Wernli, H.: Why warm conveyor belts matter in NWP, ECMWF Newsletter, 154, 21–28, https://doi.org/10.21957/mr20vg, 2017. a
Rossa, A., Wernli, H., and Davies, H. C.: Growth and decay of an extra-tropical cyclone's PV-tower, Meteorol. Atmos. Phys., 73, 139–156, https://doi.org/10.1007/s007030050070, 2000. a, b, c
Rothenberg, D. and Wang, C.: Metamodeling of droplet activation for global climate models, J. Atmos. Sci., 73, 1255–1272, https://doi.org/10.1175/JAS-D-15-0223.1, 2016. a
Saffin, L., Methven, J., Bland, J., Harvey, B., and Sanchez, C.: Circulation conservation in the outflow of warm conveyor belts and consequences for Rossby wave evolution, Q. J. Roy. Meteor. Soc., 147, 3587–3610, https://doi.org/10.1002/qj.4143, 2021. a
Schäfler, A. and Harnisch, F.: Impact of the inflow moisture on the evolution of a warm conveyor belt, Q. J. Roy. Meteor. Soc., 141, 299–310, https://doi.org/10.1002/qj.2360, 2015. a
Schäfler, A., Craig, C., Wernli, H., Arbogast, P., Doyle, J. D., McTaggart-Cowan, R., Methven, J., Rivière, G., Ament, F., Boettcher, M., Bramberger, M., Cazenave, Q., Cotton, R., Crewell, S., Delanoë, J., Dörnbrack, A., Ehrlich, A., Ewald, F., Fix, A., Grams, C. M., Gray, S. L., Grob, H., Groß, S., Hagen, M., Harvey, B., Hirsch, L., Jacob, M., Kölling, T., Konow, H., Lemmerz, C., Lux, O., Magnusson, L., Mayer, B., Mech, M., Moore, R., Pelon, J., Quinting, J., Rahm, S., Rapp, M., Rautenhaus, M., Reitebuch, O., Reynolds, C. A., Sodemann, H., Spengler, T., Vaughan, G., Wendisch, M., Wirth, M., Witschas, B., Wolf, K., and Zinner, T.: The North Atlantic Waveguide and Downstream Impact Experiment, B. Am. Meteorol. Soc., 99, 1607–1637, https://doi.org/10.1175/BAMS-D-17-0003.1, 2018. a, b
Seifert, A.: On the parameterization of evaporation of raindrops as simulated by a one-dimensional rainshaft model, J. Atmos. Sci., 65, 3608–3619, https://doi.org/10.1175/2008JAS2586.1, 2008. a
Seifert, A. and Beheng, K.: A two-moment cloud microphysics parameterization for mixed-phase clouds. Part 1: Model description, Meteorol. Atmos. Phys., 92, 45–66, https://doi.org/10.1007/s00703-005-0112-4, 2006a. a, b, c, d
Seifert, A. and Beheng, K.: A two-moment cloud microphysics parameterization for mixed-phase clouds. Part 2: Maritime vs. continental deep convective storms, Meteorol. Atmos. Phys., 92, 67–82, https://doi.org/10.1007/s00703-005-0113-3, 2006b. a, b
Spreitzer, E., Attinger, R., Boettcher, M., Forbes, R., Wernli, H., and Joos, H.: Modification of potential vorticity near the tropopause by nonconservative processes in the ECMWF model, J. Atmos. Sci., 76, 1709–1726, https://doi.org/10.1175/JAS-D-18-0295.1, 2019. a, b, c, d, e, f
Sprenger, M. and Wernli, H.: The LAGRANTO Lagrangian analysis tool – version 2.0, Geosci. Model Dev., 8, 2569–2586, https://doi.org/10.5194/gmd-8-2569-2015, 2015. a, b
Steinfeld, D. and Pfahl, S.: The role of latent heating in atmospheric blocking dynamics: a global climatology, Clim. Dynam., 53, 6159–6180, https://doi.org/10.1007/s00382-019-04919-6, 2019. a
Steinfeld, D., Boettcher, M., Forbes, R., and Pfahl, S.: The sensitivity of atmospheric blocking to upstream latent heating – numerical experiments, Weather Clim. Dynam., 1, 405–426, https://doi.org/10.5194/wcd-1-405-2020, 2020. a
Stoelinga, M. T.: A potential vorticity-based study of the role of diabatic heating and friction in a numerically simulated baroclinic cyclone, Mon. Weather Rev., 124, 849–874, https://doi.org/10.1175/1520-0493(1996)124<0849:APVBSO>2.0.CO;2, 1996. a
Storelvmo, T. and Tan, I.: The Wegener-Bergeron-Findeisen process – Its discovery and vital importance for weather and climate, Meteorol. Z., 24, 455–461, https://doi.org/10.1127/metz/2015/0626, 2015. a
Tao, W.-K., Chen, J.-P., Li, Z., Wang, C., and Zhang, C.: Impact of aerosols on convective clouds and precipitation, Rev. Geophys., 50, RG2001, https://doi.org/10.1029/2011RG000369, 2012. a
Teubler, F. and Riemer, M.: Potential-vorticity dynamics of troughs and ridges within Rossby wave packets during a 40-year reanalysis period, Weather Clim. Dynam., 2, 535–559, https://doi.org/10.5194/wcd-2-535-2021, 2021. a
Tiedtke, M.: A comprehensive mass flux scheme for cumulus parameterization in large-scale models, Mon. Weather Rev., 117, 1779–1800, https://doi.org/10.1175/1520-0493(1989)117,1779:ACMFSF.2.0.CO;2, 1989. a
van den Heever, S. C., Stephens, G. L., and Wood, N. B.: Aerosol indirect effects on tropical convection characteristics under conditions of radiative–convective equilibrium, J. Atmos. Sci., 68, 699–718, https://doi.org/10.1175/2010JAS3603.1, 2011. a
Wang, Y., Zheng, G., Jensen, M. P., Knopf, D. A., Laskin, A., Matthews, A. A., Mechem, D., Mei, F., Moffet, R., Sedlacek, A. J., Shilling, J. E., Springston, S., Sullivan, A., Tomlinson, J., Veghte, D., Weber, R., Wood, R., Zawadowicz, M. A., and Wang, J.: Vertical profiles of trace gas and aerosol properties over the eastern North Atlantic: variations with season and synoptic condition, Atmos. Chem. Phys., 21, 11079–11098, https://doi.org/10.5194/acp-21-11079-2021, 2021. a, b
Wernli, H. and Davies, H. C.: A Lagrangian-based analysis of extratropical cyclones. I: The method and some applications, Q. J. Roy. Meteor. Soc., 123, 467–489, https://doi.org/10.1256/smsqj.53810, 1997. a, b, c, d, e, f
Wernli, H., Dirren, S., Liniger, M. A., and Zillig, M.: Dynamical aspects of the life cycle of the winter storm “Lothar” (24–26 December 1999), Q. J. Roy. Meteor. Soc., 128, 405–429, https://doi.org/10.1256/003590002321042036, 2002. a
Wernli, H., Boettcher, M., Joos, H., Miltenberger, A. K., and Spichtinger, P.: A trajectory-based classification of ERA-Interim ice clouds in the region of the North Atlantic storm track, Geophys. Res. Lett., 43, 6657–6664, https://doi.org/10.1002/2016GL068922, 2016. a
Wimmer, M., Rivière, G., Arbogast, P., Piriou, J.-M., Delanoë, J., Labadie, C., Cazenave, Q., and Pelon, J.: Diabatic processes modulating the vertical structure of the jet stream above the cold front of an extratropical cyclone: sensitivity to deep convection schemes, Weather Clim. Dynam., 3, 863–882, https://doi.org/10.5194/wcd-3-863-2022, 2022. a, b, c
Zängl, G., Reinert, D., Rípodas, P., and Baldauf, M.: The ICON (ICOsahedral Non-hydrostatic) modelling framework of DWD and MPI-M: Description of the non-hydrostatic dynamical core, Q. J. Roy. Meteor. Soc., 141, 563–579, https://doi.org/10.1002/qj.2378, 2015. a, b
Zhang, Y., Macke, A., and Albers, F.: Effect of crystal size spectrum and crystal shape on stratiform cirrus radiative forcing, Atmos. Res., 52, 59–75, https://doi.org/10.1016/S0169-8095(99)00026-5, 1999. a
Only in the lowest 1 km does the gradient Richardson number drop below 1.