the Creative Commons Attribution 4.0 License.
the Creative Commons Attribution 4.0 License.
 | 28 Jul 2023
Validation activities of Aeolus wind products on the southeastern Iberian Peninsula
Jesús Abril-Gago
Pablo Ortiz-Amezcua
Diego Bermejo-Pantaleón
Juana Andújar-Maqueda
Juan Antonio Bravo-Aranda
María José Granados-Muñoz
Francisco Navas-Guzmán
Lucas Alados-Arboledas
Inmaculada Foyo-Moreno
Juan Luis Guerrero-Rascado
In 2018, the European Space Agency launched the first Doppler wind lidar system into space, providing wind observation profiles from the lower stratosphere down to the surface in two different channels based on the scene classification: cloudy or clear. A statistical validation campaign of Aeolus wind products has been performed with a ground-based Doppler lidar system and radiosondes at the Aerosol, Clouds and Trace Gases Research Infrastructure (ACTRIS)–Andalusian Global ObseRvatory of the Atmosphere (AGORA) facility in Granada (Spain). The validation activities with the automatic ground-based lidar system lasted from July 2019 to the orbit shift of June 2021. Aeolus data from two different processing baselines (10 and 11) were validated with 30 min averages of coincident ground-based lidar measurements, using a 100 km horizontal spatial collocation criterion. This resulted in 109 collocations and a mean observation distance from the ground-based lidar system of ∼50 km. The comparison did not raise any significant over- or underestimation of Aeolus horizontal line-of-sight wind speed during that period for the Rayleigh-clear and Mie-cloudy configurations. However, the ground-based lidar measurements were limited to the lower 3.5 km of the atmosphere and, consequently, the obtained results. Multiple analyses were performed varying the criteria of maximum distance and the average period for the ground-based lidar measurements in order to confirm the reliability of the criteria considered. A separate study was performed with Aeolus products after the orbit shift (baseline 12) with different collocation criteria (mean observation distance of ∼75 km, to the station), from July 2021 to May 2022. A set of seven radiosondes were launched with the aim of increasing their coincidence in space and time with the satellite overpass (∼30 min before). The radiosondes could provide full vertical coverage of Aeolus profiles (from the surface up to ∼20 km above sea level), and the comparison did not yield any significant over- or underestimation of the Rayleigh-clear wind speed, while the Mie-cloudy wind speed was significantly overestimated. Multiple analyses were performed in order to test how the spatiotemporal collocation of the radiosonde affected the results. Radiosondes not ideally collocated were proven to still be useful for comparison with the Rayleigh-clear observations but not with the Mie-cloudy observations.
- Article
(3874 KB) - Full-text XML
- BibTeX
- EndNote


Numerical weather prediction (NWP) models need accurate wind profile observations in order to produce accurate weather forecasts. This is currently limited by the lack of globally distributed wind profiles in the World Meteorological Organization (WMO) Global Observing System (GOS), as reported by WMO (2004). Therefore, the European Space Agency (ESA) developed a satellite mission able to provide worldwide vertically resolved wind information, especially in poorly monitored regions such as the tropics, the poles and the oceans (Andersson, 2018; Stoffelen et al., 2020).
Aeolus was launched in August 2018. The satellite, with a single instrument, the Atmospheric LAser Doppler INstrument (ALADIN), was put into a Sun-synchronous orbit around the Earth. ALADIN is the first Doppler lidar system in space and the first system to measure global wind information in the line of sight (LOS) of the satellite's laser beam. ALADIN accommodates two interferometers, which allow the instrument to detect the Doppler shift caused by molecules (Rayleigh channel) and particles (Mie channel) in the backscattered signal (ESA, 2008; Ingmann and Straume, 2016; Rennie et al., 2020; Stoffelen et al., 2020). Since the satellite launch, the Aeolus on-ground data processing has been continuously improved, resulting in processor updates about every 6 months and hence new product versions. The updated processors contain improved calibration routines, bug fixes and retrieval algorithm improvements in order to provide valuable near-real-time information that can be assimilated by the NWP models. Aeolus provides different product levels, namely L1B preliminary wind data, L2B fully processed wind data and L2C wind fields where Aeolus L2B winds have been assimilated in the weather forecast model of the European Centre for Medium-Range Weather Forecasts (ECMWF), and the 3D wind field from the model has been stored at the location of the Aeolus observations. Aeolus also provides profiles of atmospheric backscatter and extinction coefficients along its line of sight, which are stored in the Aeolus L2A products (Flamant et al., 2020, 2021).
Aeolus performance and product quality have been widely studied. An operational monitoring of the Aeolus wind product quality was set up with the ECMWF, providing near-real-time information of the wind quality within 3 h of sensing. Additionally, prior to the satellite's launch, a wide set of calibration and validation (Cal/Val) activities were planned by ESA. Cal/Val activities have focused on Aeolus L2B wind products, which have been validated with NWP models (Chen et al., 2021; Martin et al., 2021), ground-based instrumentation (Khaykin et al., 2020; Belova et al., 2021; Guo et al., 2021; Iwai et al., 2021; Kottayil et al., 2022; Ratynski et al., 2023; Wu et al., 2022) and other suborbital instrumentation (Baars et al., 2020; Lux et al., 2020b, 2022a; Witschas et al., 2020, 2022; Bedka et al., 2021; Chen et al., 2021; Iwai et al., 2021; Martin et al., 2021). Parallelly, some Cal/Val activities have assessed Aeolus L2A optical products with ground-based instrumentation (Baars et al., 2021; Abril-Gago et al., 2022; Ehlers et al., 2022; Gkikas et al., 2023) and other spaceborne instrumentation (Feofilov et al., 2022). Thanks to these Cal/Val activities, Aeolus wind products have reached a high enough scientific quality and have already been assimilated by NWP models with positive impact, improving their reliability (Rennie et al., 2021; Rennie and Isaksen, 2020) and achieving an important mission objective within the mission's nominal life of 3 years. Aeolus nominal life was set to end in November 2021, although it was extended based on fuel availability.
This work presents Aeolus wind product Cal/Val activities carried out in Granada, at a facility belonging to the Aerosol, Clouds and Trace Gases Research Infrastructure (ACTRIS) and the Andalusian Global ObseRvatory of the Atmosphere (AGORA), with a collocated Doppler lidar system and radiosonde station. The article is structured as follows: Sect. 2 is devoted to the comparison experimental setup, the satellite and the instrumentation used in the ground-based station; Sect. 3 explains the methodology, criteria considered in the activities and quality control applied to the different datasets; Sect. 4 presents the results and discussion of the comparison activities; and Sect. 5 states the main findings of the Cal/Val activities and Aeolus wind product performance.
2.1 The Aeolus satellite
The Aeolus satellite is located in a Sun-synchronous orbit, at 320 km from the Earth surface and an inclination of around 97∘. It completes an orbit in around 90 min and provides full coverage of the Earth every week (orbit repeat cycle of 7 d). The main Aeolus payload is ALADIN, an instrument based on the Doppler lidar technique which allows the retrieval of wind velocity information based on the Doppler shift of the backscattered radiation. The instrument consists of an Nd:YAG laser transmitter generating 355 nm pulses and a dual-channel receiver, which is a Fabry–Pérot interferometer registering the Doppler shift from the atmospheric backscatter caused by molecules known as the Rayleigh channel and a Fizeau interferometer registering the Doppler shift of the atmospheric backscatter caused by particles (clouds and aerosols) known as the Mie channel (ESA, 2008; Reitebuch, 2012). In clear conditions, the Rayleigh channel provides the majority of the wind data, while the Mie channel provides significant wind data under scenarios of optically thin clouds and thick aerosol layers (Martin et al., 2021).
Aeolus on-ground data processing provides the horizontal projection of the wind velocity information in the LOS of the laser beam, i.e., the horizontal component of the LOS (HLOS wind speed), which is a variable able to sufficiently characterize wind fields (ESA, 2008). Wind speed is measured in vertical profiles from the surface up to around 30 km, divided into 24 vertical bins with a variable vertical resolution of, nominally, 0.5 km between 0 and 2 km, 1 km between 2 and 16 km, and 2 km between 16 and 30 km (ESA, 2008; Ingmann and Straume, 2016). However, this vertical resolution is not fixed and has changed for different time periods through the mission. Additionally, the Mie and Rayleigh bins' height grids do not coincide and may shift along the orbit. To achieve a high enough signal-to-noise ratio (SNR), each wind measurement corresponds to an accumulation of 20 laser pulses, ∼2.9 km horizontally, and 30 measurements are averaged into a single observation, of around 87 km, that sets Aeolus' horizontal resolution. Due to the larger backscatter caused by particles (i.e., larger SNR), the Mie channel horizontal resolution was increased to 10 km (Šavli et al., 2019).
Aeolus wind products are labeled L2B (preliminary Level-1 products are also available), containing HLOS wind speed information for the Mie and Rayleigh channels (Rennie et al., 2020). As part of the Aeolus on-ground data processing, L2B products are processed by the European Centre for Medium-Range Weather Forecasts (ECMWF) under ESA contract in order to provide improved wind fields (wind vectors), classified as L2C products. Aeolus products are available at the ESA Aeolus Online Dissemination System: https://aeolus-ds.eo.esa.int (last access: 10 February 2023).
The processing chain also provides quality flags and error estimates of the wind data. Additionally, a scattering-ratio-based atmospheric scene classification is available for the wind products (Rennie et al., 2020). First, the on-ground processing chain applies a scene classification based on the backscatter ratio (total-to-molecular backscatter coefficient ratio) to determine if the measurements correspond to a cloud or a clear atmospheric region (Tan et al., 2017; Reitebuch et al., 2018). Then, the measurements are averaged and processed to yield up to four separate wind configurations, namely Mie cloudy, Mie clear, Rayleigh cloudy and Rayleigh clear. However, only the Mie-cloudy and the Rayleigh-clear configurations are generally used (Lux et al., 2020b; Martin et al., 2021). For each observation, quality flags address different parameters related to the measured signal, from ground echo interference to SNR thresholds.
From the ECMWF near-real-time monitoring and validation of Aeolus products and previous Cal/Val activities, critical malfunctioning was identified and processing improvements were achieved. Aeolus on-ground processing chain updates were released in the form of baseline versions. Two main error sources were identified. Wind biases caused by variations in the primary telescope mirror temperature were detected and reduced, and fluctuations of the dark-current signals on the detectors were characterized (Rennie and Isaksen, 2020; Weiler et al., 2021a, b). With these updates, Aeolus wind products were included in NWP models and weather services, allowing the satellite to prove its positive impact on the accuracy of model forecasts, especially over the tropics and the poles (Rennie et al., 2021; Rennie and Isaksen, 2020). Since the start of the Aeolus mission, multiple baseline versions were released. On-ground processing chain updates are released approximately every 6 months, improving the product quality by implementing bug fixes and improved data calibration. About once a year, datasets are reprocessed under a single processor baseline in order to release longer-term datasets with the same data quality. Baseline 10 (B10, released in October 2020) entailed a reprocessing of a large dataset of Aeolus products (from July to December 2019 and from April to October 2020), including the fixing of the detected problems and errors. The Cal/Val community is encouraged to use versioning B10 onwards.
The satellite is constantly checked, and laser sensitivity tests (and other analysis) are frequently performed. For these reasons, validity flags have to be taken into account. However, the instrument regular operation is rarely interrupted (e.g., in March 2021 due to instrument anomalies). Additionally, Aeolus regular operation has undergone other major changes. In June 2019, the Aeolus operating laser changed from laser FM-A to laser FM-B. After the change, the laser output energy, directly related to the signal-to-noise ratio and subsequently to the products' random noise, steadily decreased over time and was regularly readjusted (increased) in order to ensure the reliability of Aeolus operation. The switch from laser FM-A to FM-B was described by Lux et al. (2020a) and Rennie et al. (2021). During the second half of June 2021, Aeolus orbit setting changed from ANX4.5 (ascending node crossing 4.5, where 4.5 is the longitude of the reference ascending-node orbit used to set the satellite orbit) to ANX2.0. The orbit shift took place in the framework of upcoming tropical campaigns activities in Cabo Verde (Fehr et al., 2021; Fehr, 2022; Lux et al., 2022b), the Joint Aeolus Tropical Atlantic Campaign (JATAC), causing the orbit characteristics (e.g., ground track) to significantly shift.
2.2 Granada ACTRIS–AGORA facility
AGORA (Andalusian Global ObseRvatory of the Atmosphere) is an observational platform in the frame of ACTRIS in Andalusia (Spain). The ACTRIS–AGORA station in Granada (37.164∘ N, 3.605∘ W; 680 m a.s.l.) is located in a rather populated region. The city is located in a natural basin at the foot of Sierra Nevada, with altitudes of up to 3000 m a.s.l., affecting the diurnal (thermal flow between the mountain and the basin) and night (katabatic winds from the mountain) wind regimes (Montávez et al., 2000; Ortiz-Amezcua et al., 2022a). Historical records yield mean winds of less than 2 m s−1 at the surface level, generally coming from the west and northwest (Bosque-Maurel, 1959; Viedma-Muñoz, 1998). A more detailed and recent description of wind patterns in the city of Granada is given by Ortiz-Amezcua et al. (2022a).
A wide variety of in situ and remote sensing instruments are routinely operated at the ACTRIS–AGORA station in Granada. In particular, a Halo Photonics StreamLine Doppler lidar system has worked continuously since April 2016. The system is able to detect the backscattered signal's Doppler shift caused by the movement of the atmospheric components along the line-of-sight of the instrument. However, due to the 1500 nm radiation used by the Halo Photonics StreamLine Doppler lidar, the exploitable signal is limited to the one backscattered by particles (e.g., aerosol particles and clouds), still in the Mie scattering regime. The instrument, integrated into ACTRIS Cloudnet (Illingworth et al., 2007), emits radiation at 15 kHz and with a heterodyne detector (Pentikäinen et al., 2020) is able to retrieve wind profiles ranging from 60 m above ground level (full-overlap height) with a vertical resolution of 30 m and a tunable temporal resolution down to 2 s. The vertical wind component is obtained with the Doppler lidar system vertical stare mode, while the horizontal wind components, as well as the wind direction, are obtained through the velocity–azimuth display approach (Browning and Wexler, 1968), a method through which the Doppler lidar system scans the atmosphere and forms a cone with the laser beam, in this case, every 10 min with an elevation of 75∘. A detailed description of the instrument is given by Pearson et al. (2009), while Ortiz-Amezcua et al. (2022a) give more details about this particular instrument and the processing of the signals to provide different wind and turbulence products. A wide range of topics can be addressed with Doppler lidar measurements, from atmospheric boundary layer (ABL) characterization (e.g., de Arruda Moreira et al., 2018) to wind pattern characterization (e.g., Ortiz-Amezcua et al., 2022a, b), generally limited to the lower troposphere.
In addition to Doppler lidar measurements, lightweight weather radiosondes (DFM-09, Graw) are occasionally launched at the station. These radiosondes provide vertically resolved measurements of horizontal wind speed and direction, relative humidity, pressure, and temperature with high accuracy and resolution using in situ measurements. The vertical resolution depends on the ascending speed, which is around 10 m for a vertical speed of around 5 m s−1. In particular, for the sensors used in these radiosondes, the wind speed measurements present a resolution and accuracy of 0.1 and 0.2 m s−1, respectively. However, for many purposes the use of radiosondes is constrained because of the low frequency of launches, the equipment costs and the horizontal drift they may suffer (Vaughan et al., 1988). Despite these inconveniences, radiosondes are widely used for ABL characterization (e.g., de Arruda Moreira et al., 2018; Granados-Muñoz et al., 2012), aerosol hygroscopic growth (e.g., Bedoya-Velásquez et al., 2018) and instrument validation (e.g., Navas-Guzmán et al., 2014; Bedoya-Velásquez et al., 2019), among others.
The location of AGORA and the available upward-probing instrumentation allow the station to contribute to the validation activities of Aeolus wind products with ground-based Doppler lidar systems and radiosondes. The satellite overpasses the station twice per week every Thursday. Prior to the orbit shift (ANX4.5), the overpasses took place at approximately 06:24 (descending orbit) and 18:04 UTC (ascending orbit) at around 24 km to the west (nominal predicted minimum distance between the satellite and the station). After the orbit shift (ANX2.0), the overpass times slightly changed to 06:17 and 17:57 UTC and the overpass distances significantly increased to around 70 km to the east, on the opposite side of Sierra Nevada. The two orbit settings fulfill ESA's requirements; i.e., Aeolus products within 100 km of a station should be considered in a comparison activity (Straume et al., 2019). However, this criterion will work smoothly in large-scale wind field comparisons and might be too coarse in situations with large wind variability (e.g., in the boundary layer).
3.1 Data
In this work, the Rayleigh-clear and Mie-cloudy configurations were analyzed. The Rayleigh-clear products provided most of the wind estimates, which extended from the surface up to 18 km above sea level (a.s.l.), approximately, while the Mie-cloudy products were limited to estimates within clouds (or high-backscatter conditions), generally between the surface and 12 km a.s.l. The variety of selected spatial collocation criteria and the accumulation lengths mentioned in Sect. 2.1 allowed for the consideration of several wind observations at the same bin height for a single overpass. This was observed to be more frequent for the Mie-cloudy observations due to the lower accumulation length. However, this could also happen for the Rayleigh-clear observations. Radiosonde vertical coverage depends on the balloon type and can change for each independent launch. In our case, all the balloons were able to fully cover the troposphere and the lower stratosphere (∼20 km a.s.l.). The ground-based Doppler lidar system is highly dependent on the ABL conditions, and it rarely provides wind information above 3 km a.s.l., except in the presence of advected aerosol layers or cloud conditions. The comparison in this study was performed using the largest possible vertical range in each case. Regarding the horizontal spatial collocation of the measurements, the coordinates of each Aeolus observation (incidence angle of the laser beam considered) were used in order to determine if the different spatial collocation criteria were fulfilled. Thus, the orbit ground track was not used to apply these criteria.
Aeolus observations with valid quality flags were used. Aeolus error estimates were also considered, and initial filtering of Aeolus observations was performed. Thus, Rayleigh and Mie observations with error estimates larger than 8 and 4 m s−1, respectively, were filtered out of the comparison (Witschas et al., 2020; Wu et al., 2022). Previous studies have applied this kind of filtering with similar thresholds for the Rayleigh and Mie channels, such as 7 and 5 m s−1 (Guo et al., 2021), 8 and 5 m s−1 (Belova et al., 2021; Iwai et al., 2021), and 6 and 4 m s−1 (Martin et al., 2021), respectively. Around 94.5 % of Rayleigh and 97 % of Mie observations were available for the comparison in the present work when the criteria presented by Witschas et al. (2020) were used. Furthermore, only Aeolus L2B products under B10 and later versioning (B11 and B12) were considered in this study, following the Cal/Val community recommendations. Regarding the switch from laser FM-A to FM-B, the dataset considered in the study covers a period with just laser FM-B operation. Additionally, the initial filtering of the error estimates will ensure quality data not affected by the laser output energy.
3.2 Comparison setting
Aeolus observations are compared to analogous measurements from upward-probing instrumentation, which are considered the ground truth for the comparison. The possible existing discrepancies could be due to (i) errors in Aeolus observations, (ii) errors associated with the representativity of Aeolus observations along the horizontal signal accumulation, (iii) errors associated with the representativity of Aeolus observations in the bin's thickness signal accumulation and (iv) the differences in the wind fields between Aeolus observations and the ground truth caused by the wind field horizontal variability. However, due to the temporal coverage considered (with different meteorological conditions) and the statistical methods used, issues (ii), (iii) and (iv) are expected to be minimal and the differences detected in Sect. 4 are mainly associated with Aeolus biases.
In the case of the comparison between Aeolus and the ground-based Doppler lidar system, the temporal coverage started on July 2019 with B10 and ended in the second half of June 2021 with B11, when the planned orbit shift occurred (the period from January to June 2020 was not reprocessed under B10 and was not used). A total of 144 overpasses were available for this period. However, 109 overpasses were coincident in space and time with ground-based Doppler lidar measurements. Additionally, a short comparison was made between Aeolus and ground-based Doppler lidar measurements after the orbit shift, with 85 overpasses (B12), in order to test if the comparison worsens or not. The decision to stop the comparison after the orbit shift was based mainly on the facts that (i) the orbit setting changed significantly; (ii) the average overpass minimum distance increased from around 24 to 70 km; and (iii) Aeolus overpasses would now take place on the opposite side of Sierra Nevada, with significantly different topography and wind regimes especially in the lower troposphere (the region that mainly measures the ground-based Doppler lidar system). Finally, a 30 min interval around the overpass time was taken to average ground-based Doppler lidar measurements in a single profile (Wu et al., 2022). Other studies have used a 1 h interval (e.g., Belova et al., 2021; Iwai et al., 2021) or a 2 h interval (e.g., Khaykin et al., 2020), and these criteria were also tested in multiple support analyses.
A special validation campaign of Aeolus using radiosondes was planned after the orbit shift, and only B12 Aeolus products could be used. Seven radiosondes were launched, spatiotemporally matching Aeolus overpasses between June 2021 and July 2022. In the case of the radiosondes, it took some time for the sensor to rise. In order to obtain a fairly acceptable spatial and temporal coincidence, the radiosondes were launched around 30 min before Aeolus overpassed the station, so that the radiosondes were at around 9 km (generally at around half the altitude of the radiosounding's vertical coverage) at that moment. This setting sought to maximize the spatiotemporal collocation of the measurements, which allowed us to properly detect the satellite bias unlike in previous Cal/Val campaigns in which radiosondes were launched well in advance or late (e.g., Chen et al., 2021). In order to test this criterion, five different radiosondes (not fulfilling the 30 min in advance launch) were considered in a comparison with Aeolus products. Additionally, radiosonde horizontal drift was also taken into account in order to consider if measurements were spatially collocated for each observation.
Furthermore, a distinction between ascending (the satellite moves northwards) and descending (southwards) overpasses was considered for the comparison between Aeolus and each upward-probing instrument.
3.3 Preparatory processing
The comparison was performed with Aeolus HLOS wind speed measurements, , which is the horizontal speed component in the line of sight of Aeolus' laser beam. Additionally, Aeolus provided the azimuth angle, φAeolus, which is the horizontal projection of the laser-beam-pointing vector measured clockwise from north and takes approximate values of 100 or 260∘ for descending or ascending orbits. Both the wind speed and the azimuth angle profiles presented the same variable vertical resolution as that mentioned in Sect. 2.1. On the other hand, the upward-probing instrumentation measured the horizontal wind velocity and its direction (i.e., zonal, u, and meridional, v, wind components). Thus, the HLOS wind was extracted from ground-based Doppler lidar and radiosonde measurements as
where , uUP and vUP are the HLOS, zonal and meridional components derived by the upward-probing instruments, respectively, and φAeolus is the Aeolus azimuth angle. Equivalently, the following expression could be used:
where VUP and φUP are the total horizontal speed and direction, respectively, derived by the upward-probing instruments. In order to extract this component, the vertical resolution of the upward-probing-instrument profiles had to be degraded in order to match the much coarser vertical resolution of the Aeolus profiles.
3.4 Statistical analysis
Two independent one-to-one comparisons were performed between Aeolus HLOS winds and each upward-probing instrument's HLOS winds, which were considered the ground truth. For each of these comparisons, the differences between each Aeolus channel and the upward-probing instruments were calculated as
Thus, Δ>0 (Δ<0) yielded an overestimation (underestimation) of HLOS wind speed by Aeolus. In order to get the vertical distribution of this parameter, the mean Δ between Aeolus and the upward-probing instruments derived from the comparison was averaged in fixed vertical intervals of 0.5 and 2 km for the ground-based Doppler lidar and radiosondes, respectively. These vertical intervals should not be confused with the original Aeolus bin height grid described in Sect. 2.1. Thus, the mean Δ between Aeolus and the instruments of each vertical interval was calculated as
where r is the vertical interval of 0.5 or 2 km, z is the bin's altitude (z lies within r), and N is the number of bins whose z lies within r. Additionally, the root-mean-square error was calculated as
Furthermore, a linear fitting of against was performed, and the slope, intercept and Pearson linear correlation coefficient R were obtained.
First, a general analysis of the Aeolus performance was developed with all the available overpasses from July 2019 until the orbit shift of June 2021. Then, two independent comparisons were performed: one between Aeolus and the ground-based Doppler lidar system and another one between Aeolus and the radiosondes. Additional analyses were performed in order to verify that the criteria chosen for the comparison were valid.
4.1 Evaluation of Aeolus' general performance
A total of 144 overpasses were available for the evaluation of Aeolus' general performance, from July 2019 until the orbit shift in June 2021. A total of 101 overpasses were B10 products and 43 were B11 products, of which half corresponded to ascending orbits and the other half to descending orbits. The distinction between the orbit phase was motivated by previous studies that found orbit-phase-dependent biases in Aeolus wind products (Rennie et al., 2021). B12 versioning was released with the orbit shift of June 2021, and no B12 overpasses are considered in this subsection. Considering Aeolus observations within a 100 km distance of the station, 6410 (1416) Rayleigh-clear (Mie-cloudy) observations were available. From these, 5.6 % (2.8 %) of the available Rayleigh-clear (Mie-cloudy) observations exceeded the error threshold of 8 m s−1 (4 m s−1) that was mentioned in Sect. 3.1. A total of 358 (40) observations were filtered out. The mean minimum distance (± standard deviation, SD) from the Aeolus ground track to the station was 19±10 (14±9) km, for the Rayleigh-clear (Mie-cloudy) observations. Meanwhile, the mean distance (± SD) from all Aeolus observations to the station was 54±17 (51±27) km.
For all observations, the mean HLOS wind speed value (± SD) was 1±17 (2±17) m s−1 for the Rayleigh-clear (Mie-cloudy) configuration, while the mean HLOS wind speed error estimate (± SD) was 4±1 (1.8±0.7) m s−1. If no filtering had been applied to the error estimates, the mean HLOS wind speed and mean HLOS wind speed error estimate would have been 2±18 (0±25) and 5±13 (1.9±0.9) m s−1, respectively, for the Rayleigh-clear (Mie-cloudy) configuration. Figure 1a and b present the histogram of the HLOS wind speeds and error estimates for the Rayleigh-clear and Mie-cloudy configurations. Figure 1c and d present the HLOS wind speed error estimates versus HLOS wind speeds for the 144 overpasses without filtering the error estimate values. It can be seen that the Rayleigh-clear configuration presented observations with large and improbable HLOS wind speed values (maximum value of around 244 m s−1) and equivalently improbable error estimates (maximum value of around 655 m s−1). In the case of the Mie-cloudy configuration, some observations presented improbable HLOS wind speed values (maximum value of around 106 m s−1) but not improbable error estimates (maximum value of around 7 m s−1). After applying the filtering, the maximum HLOS wind speed detected with the Rayleigh-clear (Mie-cloudy) configuration was around 77 (47) m s−1, which might correspond to outlier but feasible winds. Thus, the application of the chosen criteria (Witschas et al., 2020) is plausible in order to filter out invalid wind estimations. Moreover, it is worth mentioning that the number of filtered out observations increased when the altitude decreased, as the signal-to-noise ratio decreased. On the other hand, the mean error estimates of the Mie-cloudy configuration were significantly lower than those of the Rayleigh-clear configuration. This can be explained by the larger signal-to-noise ratio of the backscattered signal coming from the clouds, which results in lower error estimates (Rennie et al., 2021).
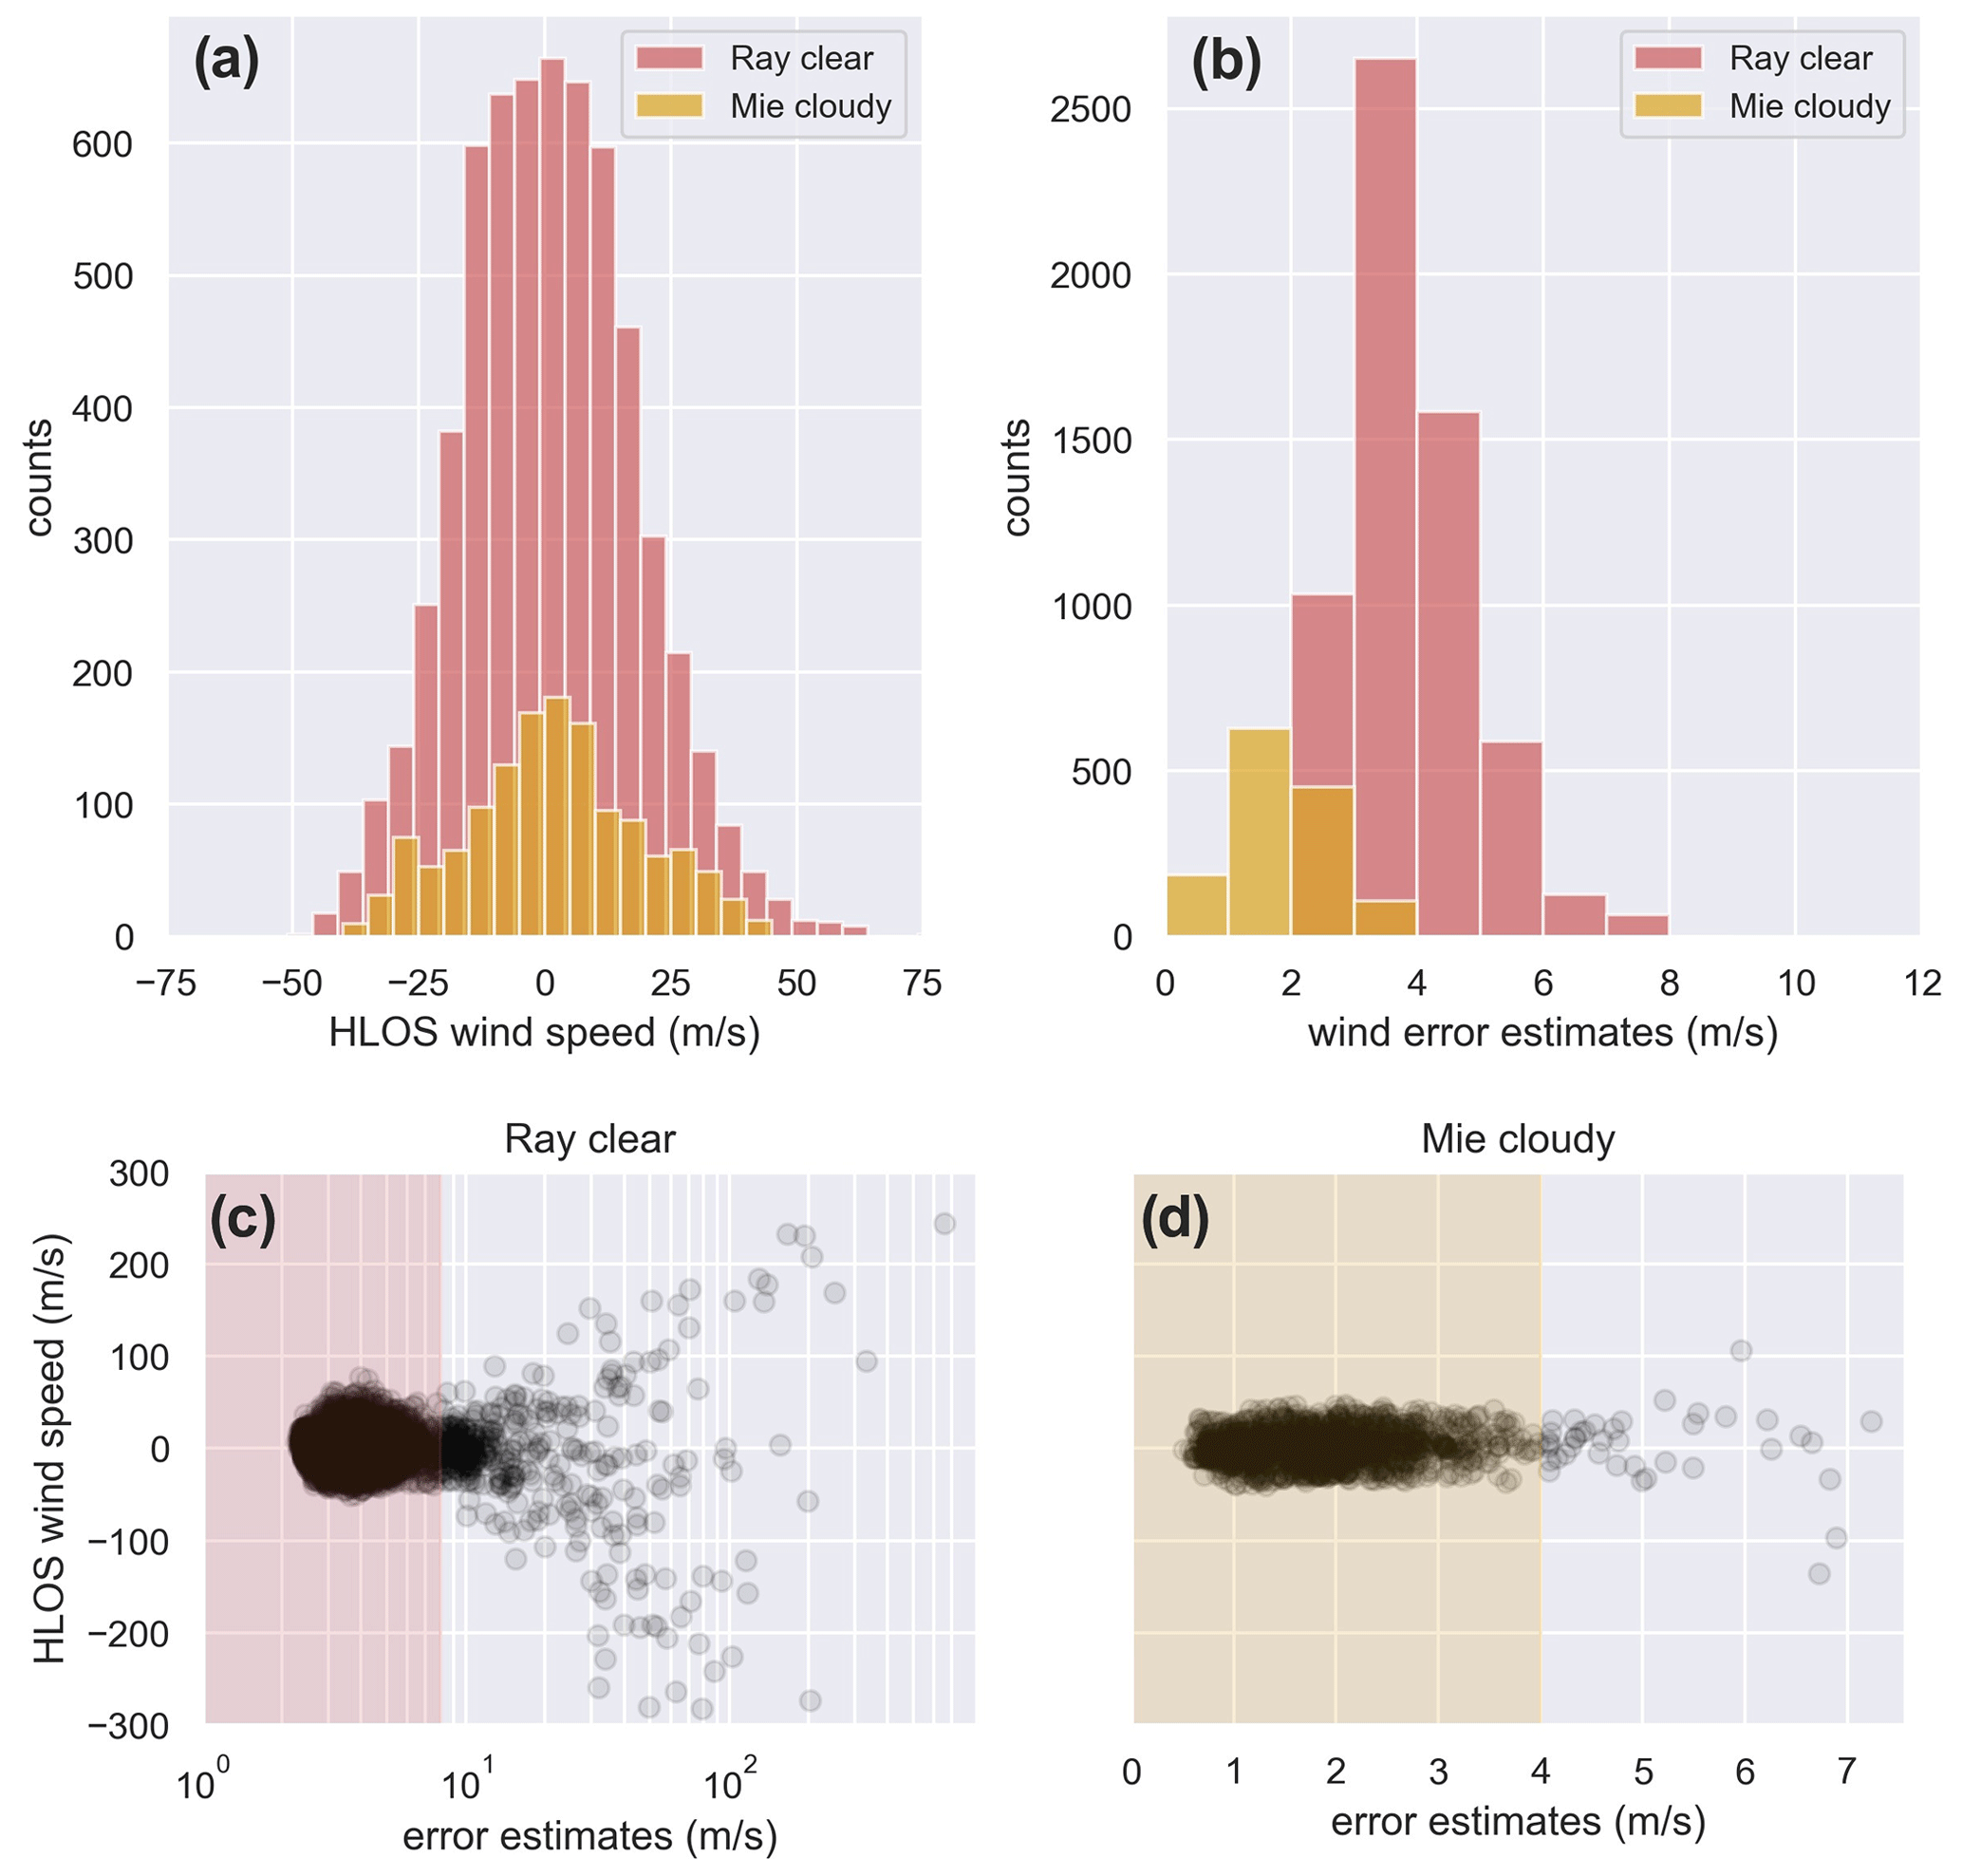
Figure 1Histograms of the 144 overpasses (considering the error estimate filtering) for Aeolus estimations for (a) HLOS wind speed and (b) HLOS wind error estimates. Scatterplot of error estimates versus HLOS wind speeds for the 144 overpasses without considering the error estimate filtering for (c) Rayleigh clear and (d) Mie cloudy. The red (yellow) area indicates the Rayleigh-clear (Mie-cloudy) observations that are valid according to the error estimate filtering (Witschas et al., 2020). Note the different scales on the x axes.
Additionally, the unused configurations Mie clear and Rayleigh cloudy provided 7 and 2350 observations, respectively. These numbers of points were reduced to 0 and 270 observations, respectively, after considering the error estimate filtering, so 100 % and 86 % of these observations were filtered out, corroborating the claim that these configurations are not useful for Cal/Val activities (Lux et al., 2020b).
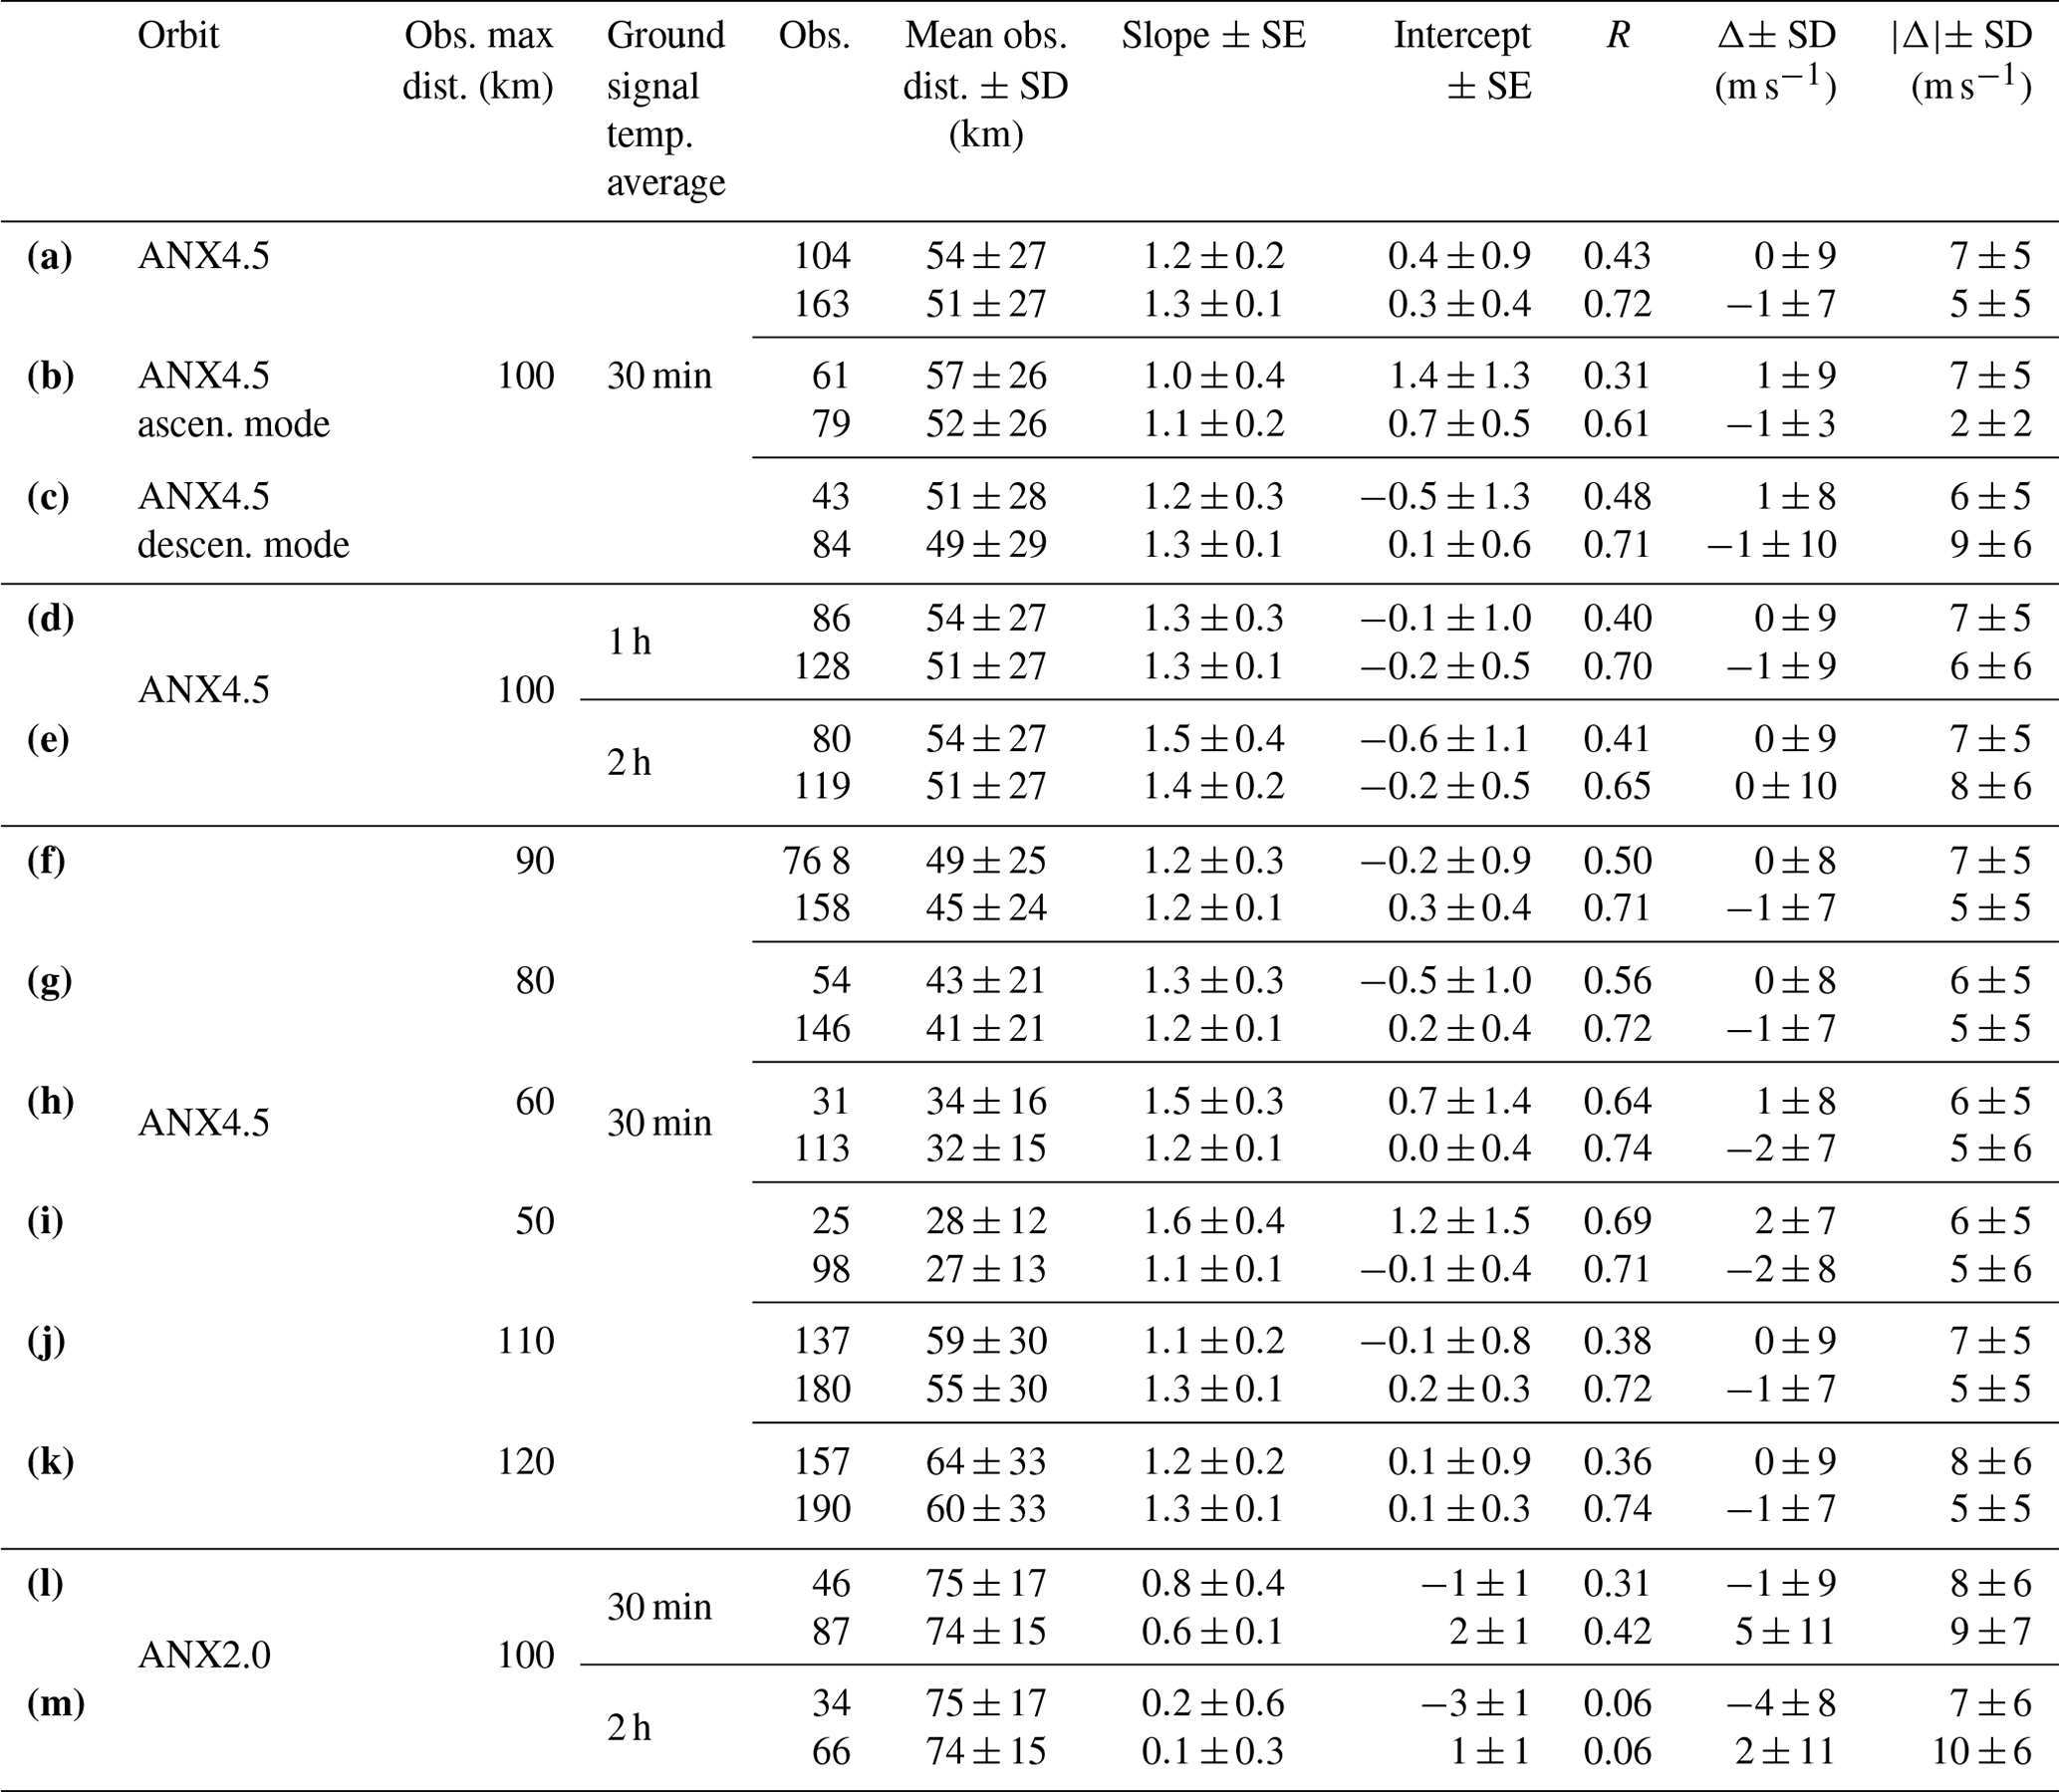
Table 1Statistical results of the comparison between Aeolus wind products and ground-based Doppler lidar measurements. For each cell, the upper result refers to the Rayleigh-clear configuration, while the lower result refers to the Mie-cloudy configuration. SD stands for standard deviation, and SE stands for standard error. Obs. stands for observed, dist. stands for distance, ascen. stands for ascending mode and descen. stands for descending mode.
4.2 Aeolus and the ground-based Doppler lidar comparison
The main statistical results of this section are gathered in Table 1. From the 109 Aeolus overpasses coincident with Doppler lidar measurements, half corresponded to ascending modes of Aeolus overpasses and half to descending overpasses. A total of 4585 (1169) Rayleigh-clear (Mie-cloudy) observations were available. For both configurations half of the observations corresponded to descending overpasses (∼06:24 UTC) and the other half to ascending overpasses (∼18:04 UTC), so both datasets present the same statistical representativeness. The mean minimum distances between the Aeolus ground track and the station, as well as the mean distances between Aeolus observations and the station, were the same as the ones obtained with the general performance analysis. However, only 104 (163) Rayleigh-clear (Mie-cloudy) observations were coincident with ground-based Doppler lidar measurements, 2.3 % (14 %) of the initially available observations. From the Rayleigh-clear (Mie-cloudy) observations coincident with ground-based measurements, 40 % (48 %) corresponded to descending overpasses. In the case of the Rayleigh-clear configuration, the lower number of coincident observations during descending overpasses was generally associated with the ABL dynamics, which were typically less developed in the early morning (∼06:24 UTC) than in the late evening (∼18:04 UTC), restricting the vertical coverage of the ground-based Doppler lidar measurements with a high enough SNR. It is important to note, as will be discussed later, that these results and the following ones are valid only for altitudes lower than 3.0 km a.s.l., as most of the available observations fell below this altitude.
A linear fitting was performed for the pairs of values. The results are presented in Fig. 2a and b. The slope, intercept (± standard error, SE) and Pearson correlation coefficient were 1.2±0.2 (1.3±0.1), 0.4±0.9 (0.3±0.4) m s−1 and 0.43 (0.72), respectively, for the Rayleigh-clear (Mie-cloudy) observations. The slopes were similar for both configurations, while the intercept was slightly higher (in absolute values) for the Rayleigh-clear configuration. However, the correlation coefficient was significantly higher for the Mie-cloudy configuration, along with lower coefficient uncertainties compared to the Rayleigh-clear configuration. Additionally, positive intercept values were obtained for both configurations. These values could be due to the effects of local geographical conditions or to existing biases in Aeolus measurements. The obtained slopes are significantly larger than those reported by Iwai et al. (2021) and Wu et al. (2022) of 0.98 (1.02) and 0.96 (0.92), respectively, for B10 and B11 Rayleigh-clear (Mie-cloudy) observations and ground-based Doppler lidars separated by less than 100 km. Meanwhile, the obtained intercepts are slightly higher, i.e., −0.88 (0.22) and −1.2 (−0.33) m s−1, respectively. It is worth noting that the aforementioned studies by Iwai et al. (2021) and Wu et al. (2022) were performed in different locations with particular geographical features. Moreover, the telescope temperature bias correction (Weiler et al., 2021b) is tuned to minimize the global biases, but local biases can still be present and detected in individual validations (Rennie et al., 2021).
Figure 2c presents the distribution of the observations' differences between Aeolus and the ground-based Doppler lidar system, considered the ground truth. The mean difference (± SD) of the distribution (which can be taken as Aeolus HLOS wind speed bias) was 0±9 () m s−1 for the Rayleigh-clear (Mie-cloudy) configuration, which yields the result that Aeolus overestimated (Δ>0) and underestimated (Δ<0) approximately equally the HLOS wind speed. These values agreed with the results reported by Iwai et al. (2021) and Wu et al. (2022), that is −0.81 (−0.16) and −1.15 (−0.25) m s−1, respectively, for the Rayleigh-clear (Mie-cloudy) configuration. On the other hand, the mean value (± SD) of the absolute difference () was 7±5 (5±5) m s−1 for the Rayleigh-clear (Mie-cloudy) configuration, which yields the mean disagreement between Aeolus and the ground-based Doppler lidar.
Figure 2d and e show Aeolus error estimates versus the obtained absolute difference between Aeolus and ground-based Doppler lidar measurements. In the case of the Rayleigh-clear configuration, significant absolute differences were more frequent for larger error estimates, but no linear or non-linear relation could be fit for this configuration or the Mie-cloudy configuration (or for the numerical difference). Additionally, it could be confirmed that the error estimate thresholds were efficient for the filtering of large absolute differences (associated with Aeolus SNR and not with instrumental biases), especially for the Rayleigh-clear configuration. The error limit threshold for the Mie-cloudy observations could be increased, e.g., to 5 m s−1. However, similar statistical results were obtained.
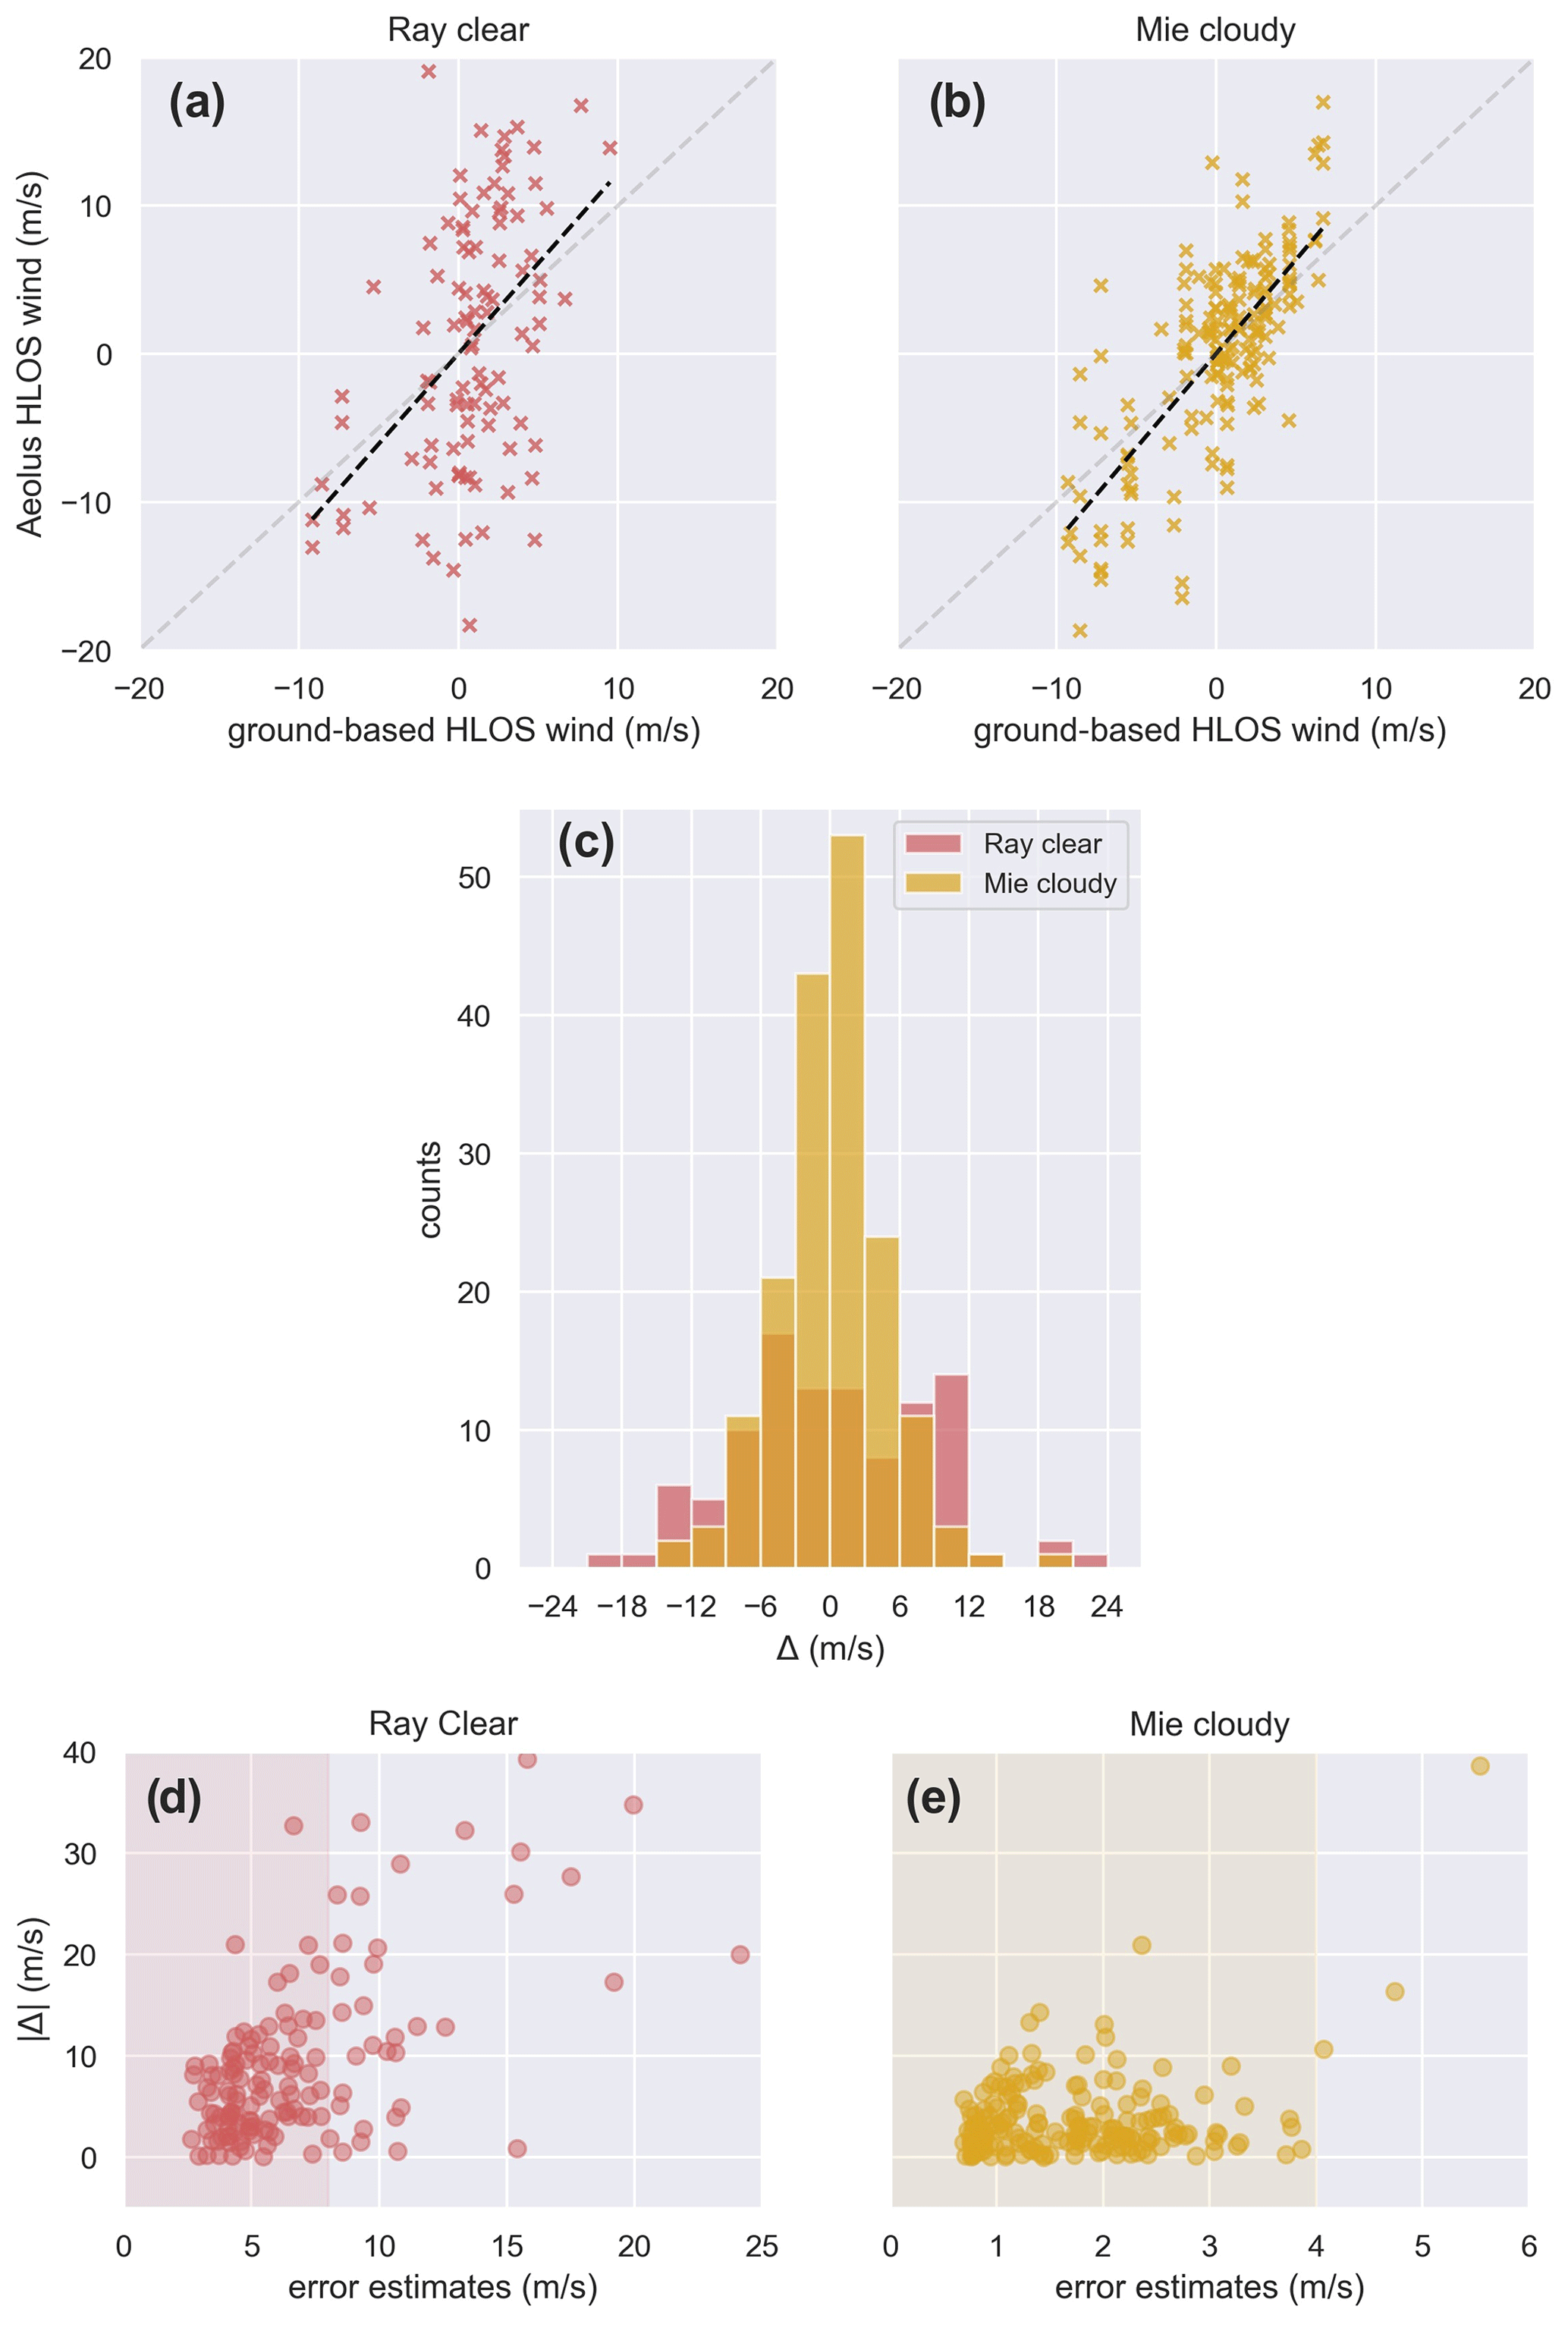
Figure 2Pairs of Aeolus and ground-based Doppler lidar system values for the (a) Rayleigh-clear and (b) Mie-cloudy configurations. The linear fitting is marked by the dashed black line, while the dashed light-gray line marks the 1:1 relation. (c) Histogram of the differences between Aeolus and the ground-based Doppler lidar measurement. Scatterplot of Aeolus error estimates versus the absolute difference between Aeolus and ground-based Doppler lidar measurements for the (d) Rayleigh-clear and (e) Mie-cloudy configurations. The red (yellow) area indicates the Rayleigh-clear (Mie-cloudy) observations that are valid according to the error estimate filtering (Witschas et al., 2020).
An analysis of the differences and RMSE per 0.5 km vertical step is presented in Fig. 3. Most of the available observations were constrained between approximately the station's altitude (∼0.68 km a.s.l.) and 3.0 km a.s.l. The Rayleigh-clear configuration (Fig. 3a) did not present any specific behavior between 0.5 and 3.0 km a.s.l. (values between −1 and 0.3 m s−1), except between 1.5 and 2.0 km a.s.l., where the satellite significantly overestimated the HLOS wind speed (∼3 m s−1). The RMSE (Fig. 3b) was significantly large for the lowermost observations (∼12 m s−1), while the rest of the vertical intervals presented a similar lower value (between 7 and 8 m s−1), except the interval between 2.5 and 3.0 km a.s.l., where the RMSE was lower (∼5 m s−1) and contrary to the statistical error. The Mie-cloudy configuration (Fig. 3c) seems to significantly overestimate the HLOS wind speed for the lowermost observations (∼4 m s−1), while it did not present any specific performance (values between −1.6 and 0.9 m s−1) for upper intervals. On the other hand, the RMSE (Fig. 3d) presented a higher value for the 2.0-to-2.5 km a.s.l. interval and the lowermost interval (∼6 m s−1) observations, while the middle ranges, along with the intervals higher than 2.5 km a.s.l. (values between 1.3 and 2 m s−1), present a similar lower value (∼4 m s−1). The significant discrepancies obtained for the lowermost vertical interval can be attributed to multiple effects such as (i) the lower number of observations considered, (ii) the horizontal averaging of the signals (especially for the Rayleigh observations), (iii) the large variability in the wind fields closer to the surface within the 100 km radius, (iv) the lower strength of the signal closer to the surface and (v) possible imperfect removal of the ground return contamination of the lowest observations. However, it is worth mentioning that it is not possible to conclude whether the observed differences in the wind speed between Aeolus observations and the ground-based Doppler lidar measurements are due to measurement errors only or also due to multiple representativeness errors. Nevertheless, due to the significant temporal coverage of the study and the statistical methods applied, the different induced errors were minimized and the differences could be attributed mainly to Aeolus biases.
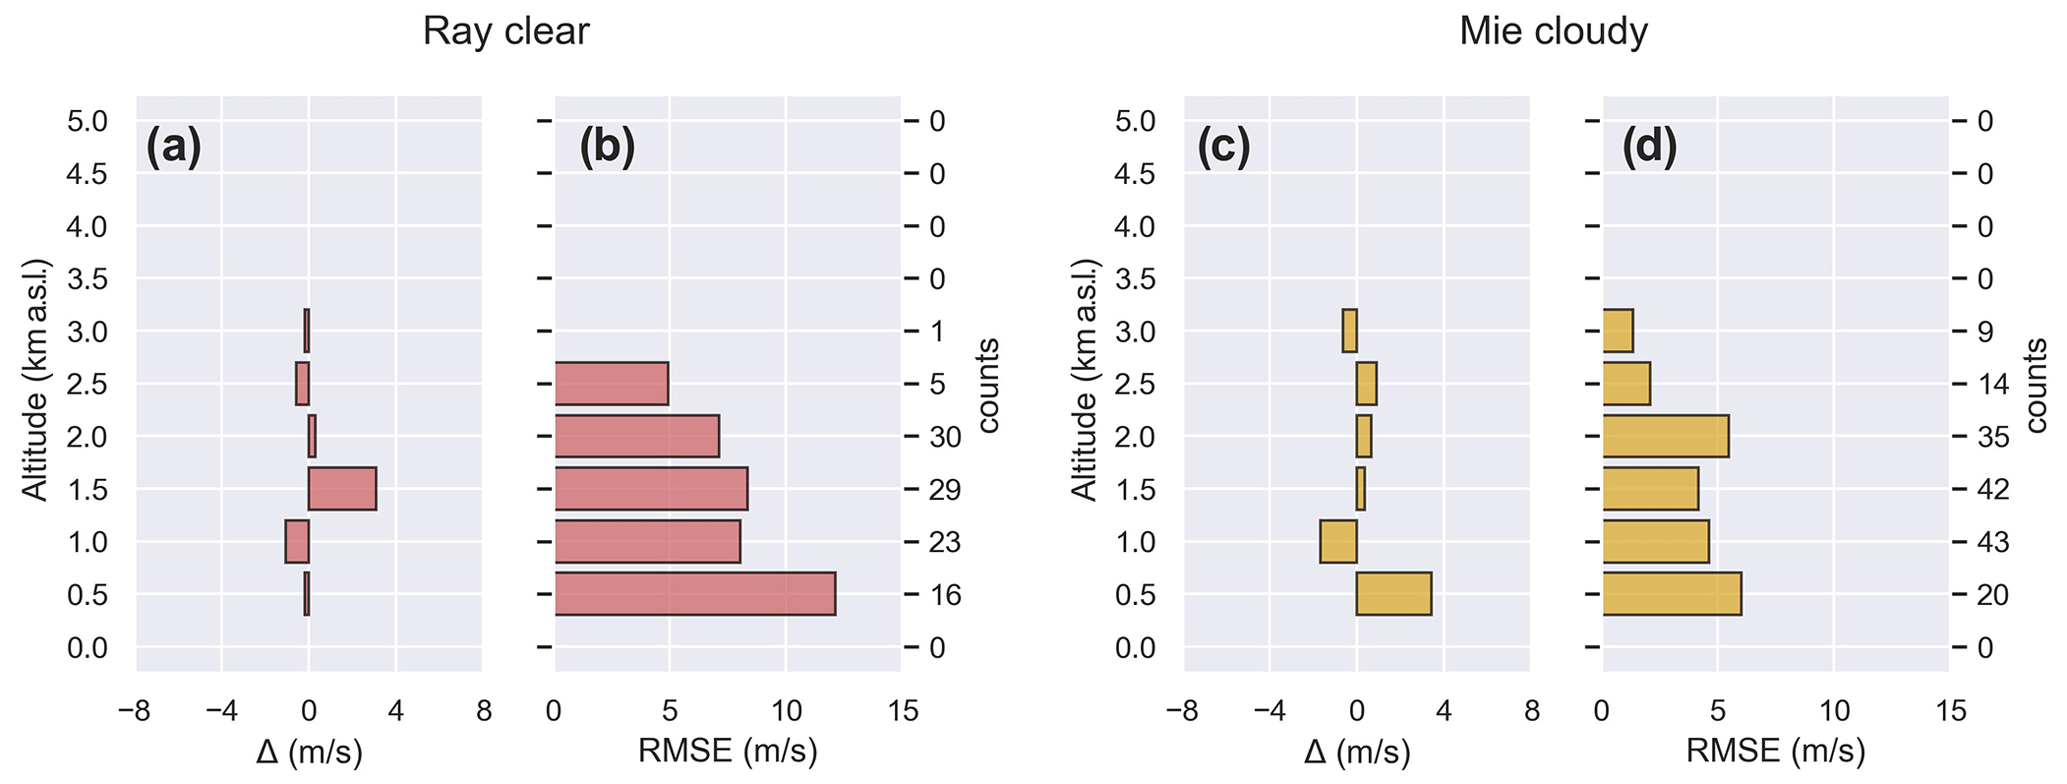
Figure 3Vertically resolved analysis of the (a) difference and (b) RMSE for the comparison between Aeolus Rayleigh-clear products and the ground-based Doppler lidar. Panels (c) and (d) are analogous to (a) and (b) for the Mie-cloudy products.
Table 1 shows the comparison results under different settings, with the first row (Table 1, row a) being the main setting (i.e., ANX4.5 Aeolus ascending plus descending overpasses, with maximum 100 km difference from the ground-based station and 30 min averaging of the ground-based measurements). When differentiating between ascending and descending orbits (Table 1, rows b and c), reasonably different results were obtained for each mode. The ascending mode presented slopes slightly closer to 1 than the descending mode, along with a significantly lower Pearson correlation coefficient. The slopes were notoriously different between each orbit mode. The mean difference and mean absolute difference were similar for the Rayleigh-clear configuration, while the Mie-cloudy configuration presented significantly lower uncertainties for both parameters and the mean absolute difference itself with the ascending-mode dataset. This could be due to the fact that the Mie winds are sampled at smaller horizontal and vertical scales and, consequently, with higher representativity.
An analogous analysis was performed taking 1 h (Table 1, row d) and 2 h (Table 1, row e) averages of the ground-based Doppler lidar measurements. The agreement between the instruments slightly worsened when the average interval increased, especially the slope of the linear fitting. The main analysis was also repeated while just decreasing the maximum distance between the considered observations and the station (fixed 30 min average) to 90, 80, 60 and 50 km (Table 1, rows f, g, h and i). In this case, the slope and intercept significantly increased (slightly decreased) when the maximum collocation distance decreased for the Rayleigh-clear (Mie-cloudy) configuration. Additionally, for both configurations the number of available observations was significantly reduced, affecting the statistical error, while Δ for the Rayleigh-clear configuration significantly increased, indicating larger discrepancies between the observations. Thus, a more restrictive spatial collocation of Mie-cloudy observations slightly improved the comparison results, as cloud spatial inhomogeneities were avoided. However, the comparison for the Rayleigh-clear configuration worsened, as the slope moved further from the ideal 1:1 relation, and the differences increased. A similar examination was performed increasing the maximum distance between the considered observations and the station to 110 and 120 km (Table 1, rows j and k). It was observed that when the maximum distance was increased, not only the slope and intercept but also the Pearson correlation coefficient slightly decreased for Rayleigh clear, while the results for Mie cloudy remained almost unaffected (only the intercept was slightly reduced). Therefore, based on the available dataset and the geographical features of the station region, working with observations within 100 km of the station, following ESA's requirements, is recommended.
Another additional analysis was performed with Aeolus overpasses after the orbit shift (Table 1, row l). A total of 85 overpasses matched ground-based Doppler lidar measurements from June 2021 to March 2022, half of which correspond to descending overpasses (∼06:17 UTC) and the other half to ascending ones (∼17:57 UTC). A total of 2424 (534) Rayleigh-clear (Mie-cloudy) observations were available, from which only 46 (87) observations were coincident with ground-based Doppler lidar measurements, a proportion of 1.8 % (16 %). The mean minimum distance (± SD) between the Aeolus ground track and the station for the Rayleigh-clear (Mie-cloudy) observations increased significantly with respect to the previous orbit setting to 64±15 (61±17) km for the Rayleigh-clear (Mie-cloudy) observations, which is approximately 3 (4) times further. The obtained slope, intercept (±SE) and Pearson correlation coefficient were 0.8±0.4 (0.6±0.1), (2±1) m s−1 and 0.31 (0.42) for the Rayleigh-clear (Mie-cloudy) configuration. On the other hand, the mean Δ (± SD) was (5±11) m s−1 and the mean (± SD) was 8±6 (9±7) m s−1, for the Rayleigh-clear (Mie-cloudy) configuration. The slope of the linear fitting reduced significantly after the orbit shift, while the intercept increased, but most importantly the Pearson correlation coefficient decreased significantly due to the larger distances between the observations. The differences between Aeolus and the ground-based Doppler lidar slightly increased. These differences could be due to the gradual and constant decrease in the Aeolus lidar performance caused by the laser decay, which may have affected Aeolus biases. However, these differences might not be associated with the new versioning B12 but with the fact that Aeolus overpasses a completely different region. Under orbit ANX2.0, Aeolus overpasses the opposite side of Sierra Nevada to the one where Granada is located, where the altitude and land inclination are significantly different and therefore wind patterns associated with surface insolation change considerably. When this analysis was repeated taking a 2 h average of the ground-based Doppler lidar measurements, the results of the comparison (Table 1, row m) worsened considerably as a consequence of the wind variability.
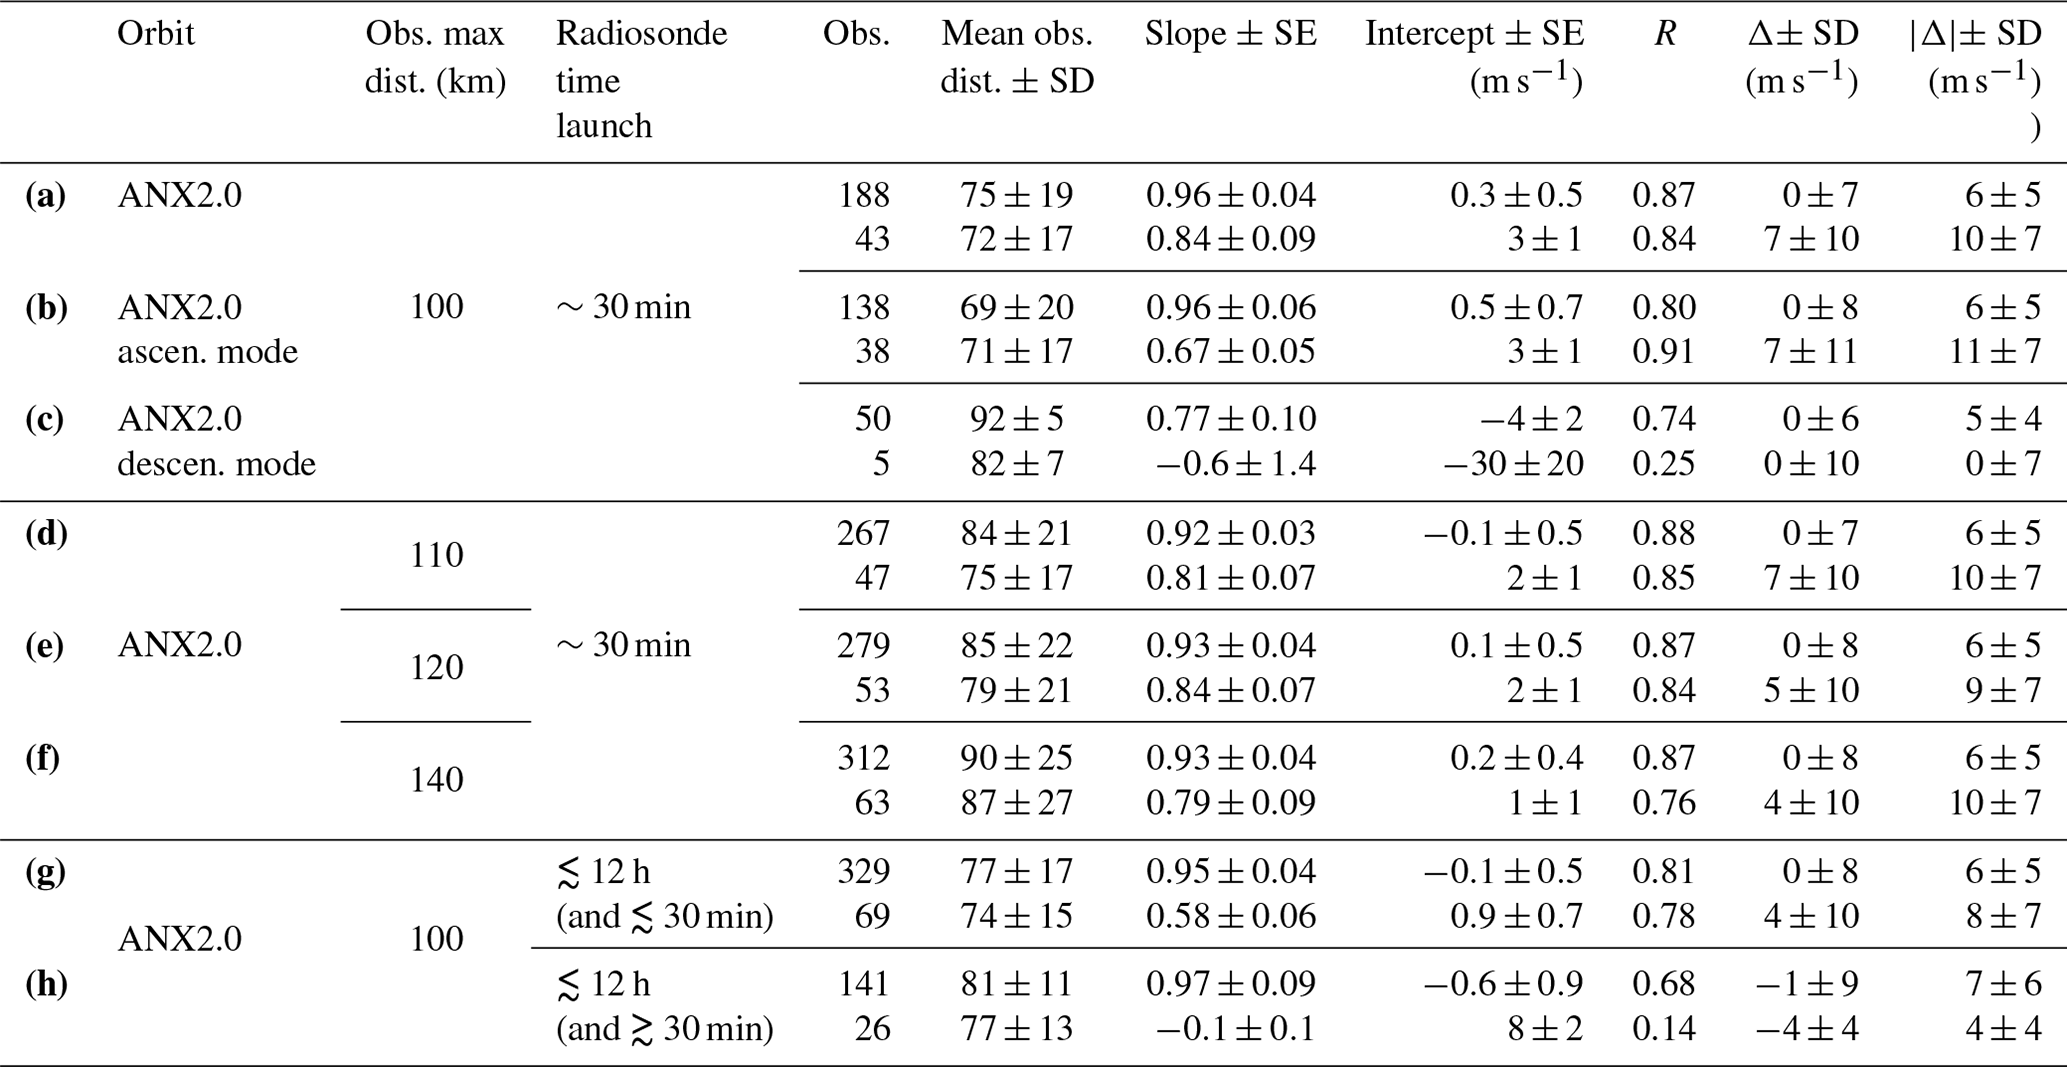
Table 2Statistical results of the comparison between Aeolus wind products and radiosonde measurements. For each cell, the upper result refers to the Rayleigh-clear configuration, while the lower result refers to the Mie-cloudy configuration. SD stands for standard deviation, while SE stands for standard error. Overpasses considered in (a) are not considered in (h), while overpasses considered in (a) and in (h) are jointly considered in (g). Obs. stands for observed, dist. stands for distance, ascen. stands for ascending mode and descen. stands for descending mode.
4.3 Aeolus and radiosonde comparison
The main statistical results of this section are gathered in Table 2. Seven radiosondes were launched during Aeolus overpasses under the defined criteria. From these cases, two of them correspond to descending modes of Aeolus overpasses and five to ascending overpasses. One radiosonde was launched during a clear-sky day of autumn, one on a densely cloudy day of winter, three on partly cloudy days of spring and two on clear-sky days of summer. A total of 191 (43) Rayleigh-clear (Mie-cloudy) observations were available for the comparison. Of the Rayleigh-clear (Mie-cloudy) observations, 26 % (11 %) correspond to descending overpasses (∼06:17 UTC). This inhomogeneity might be associated with the few descending overpasses available (29 % of overpasses) and also with the reduced dataset of overpasses. The mean minimum distance (± SD) between the Aeolus ground track and the station for the Rayleigh-clear (Mie-cloudy) observations was 64±14 (61±16) km, while the mean distance (± SD) between the observations and the station was 75±19 (72±17) km. Aeolus observations within 100 km were included in the comparison.
From the available dataset, 188 (43) Rayleigh-clear (Mie-cloudy) observations were coincident with radiosounding measurements, which comprise 98 % (100 %) of the initially available observations. Thus, in the case of the radiosondes, most of the available Aeolus observations were coincident with radiosounding measurements. This is due to the radiosonde's wide vertical coverage, providing wind information up to the lower stratosphere, unlike the ground-based Doppler lidar system which is mainly restricted to the boundary layer.
A linear fitting was performed for the pairs of observations. The results are presented in Fig. 4a and b. The slope, intercept (± SE) and Pearson correlation coefficient were 0.96±0.04 (0.84±0.09), 0.3±0.5 (3±1) m s−1 and 0.87 (0.84), respectively, for the Rayleigh-clear (Mie-cloudy) observations. The slope for the Rayleigh-clear configuration was very close to the 1:1 relation, while the Mie-cloudy slope deviated from unity. Moreover, the slopes and Pearson correlation coefficients of these results were much better than the ones obtained with the ground-based Doppler lidar measurements, which were limited to altitudes below 3 km a.s.l., where Aeolus encountered more difficulties in retrieving wind information compared to at higher altitudes due to the lower SNR and because the spatiotemporal variability in the wind may affect the comparison. The results obtained for the Rayleigh-clear configuration agreed with those reported by Chen et al. (2021) and Iwai et al. (2021) with radiosondes and B10 Aeolus products, that is slopes of 0.97 and 1.01 and intercepts of −0.05 and 0.38 m s−1, respectively. The slope obtained for the Rayleigh-clear configuration was similar to the one reported by Baars et al. (2020) for previous baseline Aeolus products and radiosondes over the Atlantic, while their obtained intercept was significantly larger, that is 0.97 and 1.57 m s−1, respectively. In the case of the Mie-cloudy results, the derived slope was lower and the intercept significantly larger than those obtained by Baars et al. (2020), Chen et al. (2021) and Iwai et al. (2021), that is 0.95, 0.95 and 0.92 and 1.13, −0.01 and −0.22 m s−1, respectively. However, it should be noted that the studies were performed in different locations with particular geographical features.
Figure 4c presents a histogram of the observations' differences between Aeolus and the radiosoundings, considered the ground truth. The obtained mean difference (± SD) was 0±7 (7±10) m s−1 for the Rayleigh-clear (Mie-cloudy) configuration. Thus, the Rayleigh-clear configuration did not present any significant over- or underestimation of the HLOS wind speed, while the Mie-cloudy configuration seemed to overestimate the HLOS wind speed. The value for the Rayleigh-clear configuration agreed with the one reported by Iwai et al. (2021) for B10 Aeolus products and radiosondes (0.45), while it was slightly lower than the one reported by Baars et al. (2020), Iwai et al. (2021) and Martin et al. (2021) for previous baseline Aeolus products and radiosondes (1.52, 1.00 and ∼2, respectively).
On the other hand, the mean value (± SD) of the absolute difference () was 6±5 (10±7) m s−1 for the Rayleigh-clear (Mie-cloudy) configuration, which resulted in the average discrepancy between Aeolus and the radiosondes. The mean for the Mie-cloudy configuration was significantly large, probably because of the larger distance between Aeolus observations and the radiosondes' measurements. The wind conditions measured within the cloud by Aeolus might be different to the ones measured by the radiosondes, so the horizontal wind captured by each instrument could be different.
Figure 4d and e show Aeolus error estimates versus the obtained absolute difference between Aeolus and the radiosondes. In the case of the Rayleigh-clear configuration, significant absolute differences related to large error estimates were observed. However, no significant relationship was identified between the error estimates and the absolute differences for either the Rayleigh-clear or the Mie-cloudy configurations. Additionally, Fig. 4d and e confirm that the error estimate thresholds were efficient for the filtering of large absolute differences, especially for the Rayleigh-clear configuration. A larger error estimate threshold could be set, e.g., 13 (6) m s−1, for the Rayleigh-clear (Mie-cloudy) configuration. However, the statistical results would not change significantly.
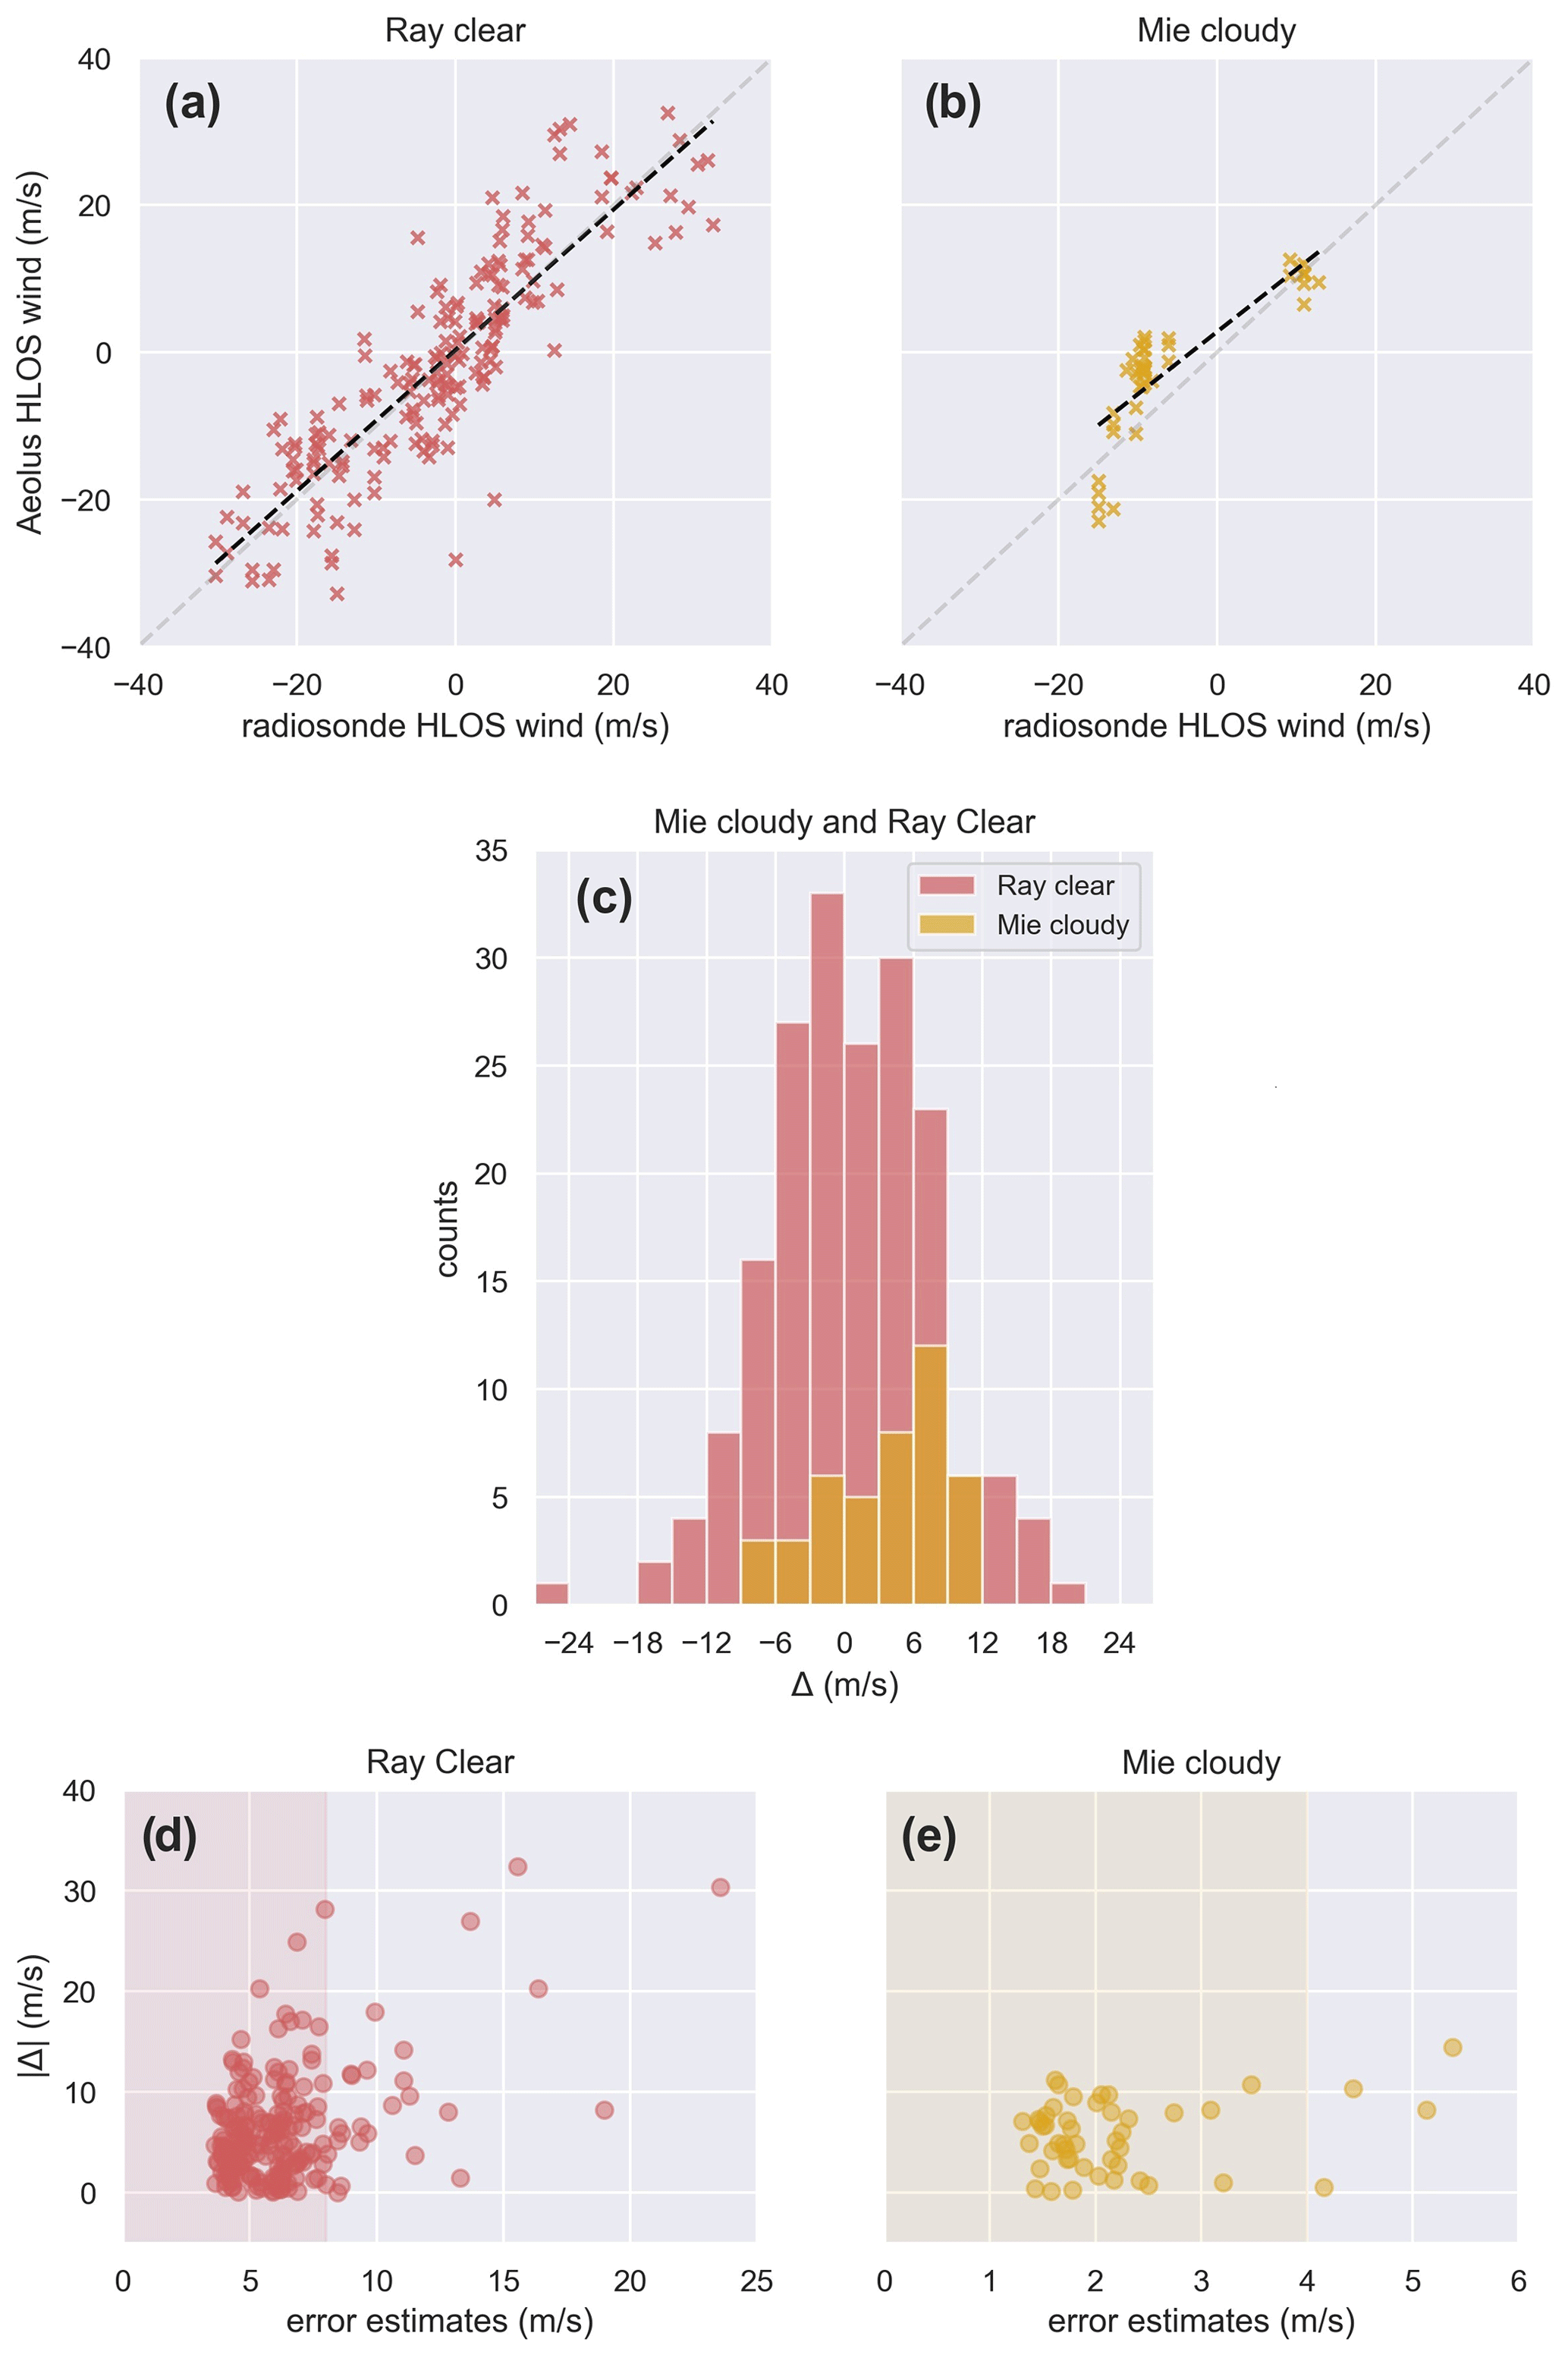
Figure 4Pairs of Aeolus and radiosonde values for the (a) Rayleigh-clear and (b) Mie-cloudy configurations. The linear fitting is marked by the dashed black line, while the dashed light-gray line marks the 1:1 relation. (c) Histogram of the differences between Aeolus and radiosonde measurement. Scatterplot of Aeolus error estimates versus absolute difference between Aeolus and radiosonde measurements for the (d) Rayleigh-clear and (e) Mie-cloudy configurations. The red (yellow) area indicates the Rayleigh-clear (Mie-cloudy) observations that are valid according to the error estimate filtering (Witschas et al., 2020).
An analysis of the differences and RMSE per 2 km vertical interval is presented in Fig. 5. The Rayleigh-clear configuration significantly underestimated the HLOS wind speed between the ground and 2 km a.s.l. (Δ of ca. −15 m s−1 and RMSE of ca. 14 m s−1). This could be related to the fact that Aeolus overpassed the east side of Sierra Nevada, while radiosondes were launched on the west side, so the lowermost observations (closer to the surface) presented the largest disagreement. However, this interval presented a low statistical significance. The Rayleigh-clear and radiosonde observations agreed well between 2 and 12 km a.s.l., with biases ranging around zero (Δ between −0.9 and 0.6 m s−1). Furthermore, the Rayleigh-clear configuration significantly overestimated the HLOS wind speed between 12 and 18 km a.s.l. (Δ between 2.7 and 2.9 m s−1). The RMSE values were similar between 4 and 18 km a.s.l. (between 7.6 and 5.7 m s−1). On the other hand, the Mie-cloudy configuration seemed to significantly overestimate the HLOS wind speed between 4 and 12 km a.s.l. (Δ between 2.6 and 7.0 m s−1), with the overestimation increasing with altitude. This overestimation of the Mie-cloudy configuration observed in Fig. 5c and d could be associated with cloud scenario inhomogeneities rather than with Aeolus biases. The discrepancies obtained for the Rayleigh-clear lowermost vertical intervals can be attributed to multiple effects such as (i) the lower number of observations considered, (ii) the horizontal averaging of the signals, (iii) the large variability in the wind fields closer to the surface within the 100 km radius and (iv) the lower strength of the signal closer to the surface.
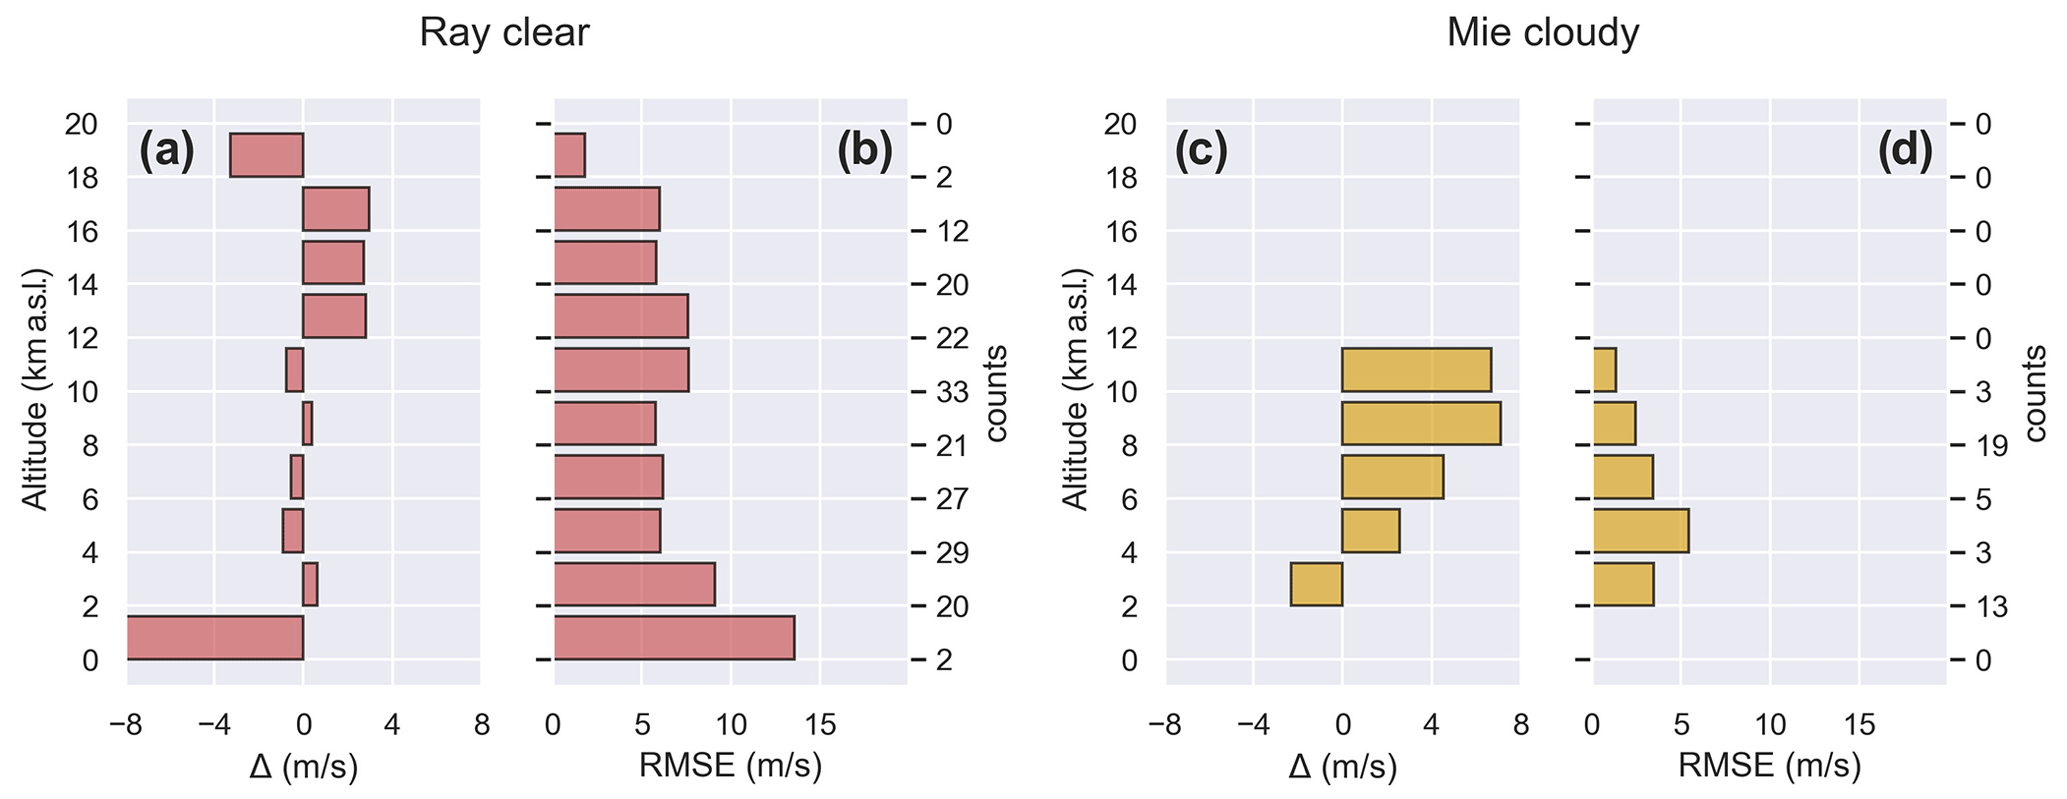
Figure 5Vertically resolved analysis of the (a) difference and (b) RMSE for the comparison between Aeolus Rayleigh-clear products and the radiosondes. Panels (c) and (d) are analogous to (a) and (b) for the Mie-cloudy products.
The results of the analysis differentiating between ascending and descending overpasses are presented in Table 2 (rows b and c). The results obtained for the Rayleigh-clear configuration with ascending-mode overpasses were similar to those obtained considering both settings together, while the Mie-cloudy configuration presented significantly worse agreement with radiosonde measurements with a higher Pearson correlation coefficient. Only two overpasses corresponded to the descending mode, and the results obtained for this setting were significantly worse than those obtained considering both settings together and were not statistically significant, especially for the Mie-cloudy configuration. Thus, the large differences obtained for the descending mode could not be associated with orbit mode biases but most probably with the limited dataset. Therefore, a more substantial database is required in order to thoroughly examine Aeolus performance in descending-mode orbits.
An analogous analysis was performed while increasing the maximum distance between the considered observations and the station to 110, 120 and 140 km (Table 2, rows d, e and f). It could be seen that when the maximum distance was increased the slope slightly increased, while the Pearson correlation coefficient decreased. Thus, a less restrictive spatial collocation slightly worsened the comparison results. Thus, working with observations within 100 km of the station, following ESA's requirements, is recommended.
An additional analysis was performed with both Aeolus overpasses from the same day as each radiosounding, even though the temporal collocation is not maximized (Table 2, row g). If a radiosonde was launched for the descending overpass, its profile was also compared with the ascending Aeolus products, and vice versa. Thus, the maximum time difference was around 12 h. A total of 12 overpasses matched radiosonde information with these criteria, including the 7 cases previously used and 5 new cases. From the 12 overpasses, half corresponded to descending overpasses and the other half to ascending ones. A total of 332 (69) Rayleigh-clear (Mie-cloudy) observations were available. The obtained slope, intercept (± SE) and Pearson correlation coefficient were 0.95±0.04 (0.58±0.06), (1.0±0.7) m s−1 and 0.81 (0.78) for the Rayleigh-clear (Mie-cloudy) configuration. On the other hand, the mean Δ (± SD) was 0±8 (4±10) m s−1 and the mean (± SD) was 6±5 (8±7) m s−1 for the Rayleigh-clear (Mie-cloudy) configuration. The results for the Rayleigh-clear configuration did not change much, and only the correlation coefficient was slightly reduced, while the results worsened significantly for the Mie-cloudy configuration, especially the slope. In the vertically resolved study, no significant improvement of the agreement was seen, and in fact the RMSE significantly increased in all of the vertical intervals. When considering only the five new overpasses (Table 2, row h), the results for the Rayleigh-clear configuration were similar to the ones obtained before, while the results for the Mie-cloudy configuration worsened considerably. It is worth mentioning that a time difference of 12 h could lead to a very different wind regime comparison, depending on the local geographical features and the meteorological-front scenario. This analysis yielded the conclusion that Aeolus and radiosonde data have to be properly spatiotemporally collocated for the Mie-cloudy configuration. However, spatiotemporal collocation for the Rayleigh-clear configuration was not as decisive.
In this work, Aeolus horizontal line-of-sight (HLOS) wind speed products from the Rayleigh-clear and Mie-cloudy configurations have been statistically validated with spatiotemporally collocated ground-based Doppler lidar measurements and radiosoundings at the ACTRIS–AGORA station of Granada, which are considered the ground truth throughout the analysis.
It was observed that error estimate filtering is needed, especially to avoid biases introduced by signal-to-noise ratio (SNR) issues and improve the comparison between the satellite and the instrumentation. The 8 (4) m s−1 limit for the Rayleigh-clear (Mie-cloudy) configuration was proven to be effective.
When comparing Aeolus products before the orbit shift (versioning B10 and B11) with the uninterrupted ground-based Doppler lidar measurements, Aeolus did not seem to systematically underestimate or overestimate the HLOS wind speed. The slopes, 1.2±0.2 and 1.3±0.1, and intercepts, 0.4±0.9 and 0.3±0.4 m s−1, showed minor disagreements between the instruments for the Rayleigh-clear and Mie-cloudy configurations respectively. The ground-based Doppler lidar system proved its effectiveness for validating Aeolus measurements because of its continuous retrieval of wind information, but the instrument is limited by its vertical coverage, from which the results of the comparison are limited to altitudes lower than 3.0 km a.s.l. The vertical-coverage limitation of the ground-based Doppler lidar system was observed to increase during nighttime or early-morning overpasses, when the atmospheric boundary layer (ABL) height is lower and the region with enough backscattered signal is thinner (lower SNR). The impact of this limitation is lowered under cloudy conditions, when the backscattered signal rises (higher SNR). Additionally, it was observed that a more restricted or less restricted spatial collocation of Aeolus products did not significantly improve the comparison. Thus, the 100 km collocation criterion proposed by the European Space Agency (ESA) was shown to be suitable for this study. Analogously, when a larger interval of ground-based Doppler lidar measurements was averaged, the agreement also worsened for both configurations. When comparing Aeolus products after the orbit shift (B12), the agreement significantly worsened, so cases before and after the orbit shift should not be analyzed together and should be addressed separately. Therefore, the Doppler lidar system could be used to successfully perform Cal/Val activities in regions such as Granada. However, it was proven that Aeolus and ground-based Doppler lidar measurements have to be well spatiotemporally collocated, as the comparison is limited to the ABL, where the wind conditions can vary significantly. When comparing Aeolus products after the orbit shift (B12) with radiosondes, the Rayleigh-clear configuration did not seem to systematically overestimate or underestimate the HLOS wind speed, while the Mie-cloudy configuration seemed to overestimate the HLOS wind speed. However, this positive difference might be associated with the larger distance between the Mie-cloudy observations and the radiosondes. The slope, intercept and Pearson correlation coefficient showed an almost perfect agreement for the Rayleigh-clear configuration, while the Mie-cloudy configuration presented significant disagreements. In this case, the radiosondes' vertical coverage was not a drawback, as the instruments reached up to 20 km a.s.l., providing full coverage of Aeolus products. However, it was proven that radiosondes' spatial and temporal collocation is very important for the Mie-cloudy configuration and not significantly so for the Rayleigh-clear configuration. Therefore, radiosondes could be used to successfully perform Cal/Val activities in regions such as Granada.
Both instruments were successful when validating Aeolus products. The ground-based Doppler lidar system measured uninterruptedly but presented a vertical-coverage limitation, while the radiosondes were scarcer but provided full vertical coverage of Aeolus profiles. A combination of both instruments could provide a full assessment of Aeolus wind product performance. Aeolus products were proven to provide reliable wind estimations. In the case of the Rayleigh-clear configuration, the vertical coverage was significantly larger, providing information from the surface (with a significantly low SNR) to 20 km. The Mie-cloudy configuration provided fewer wind measurements, which were restricted to the presence of, generally, clouds. However, by default the Mie channel presents a higher SNR and consequently lower error estimates, than the Rayleigh channel. Within this study, the Rayleigh-clear wind observations were successfully validated. The Mie-cloudy wind observations were also validated but because of the distance between the instruments and these observations, the observed differences may not be representative; i.e., they may be more related to wind field inhomogeneities caused by clouds than to real Aeolus systematic errors. Additionally, for both channels the statistical differences reported exceeded the systematic error limit set by the mission requirements (0.7 m s−1). From a vertically resolved approach of the comparison, Aeolus presented larger root-mean-square error (RMSE) for the lowermost measurements, especially for the Rayleigh-clear configuration (lower SNR), while the RMSE was slightly reduced with the altitude.
The code is not publicly accessible; however, readers may contact Jesús Abril-Gago (jabrilgago@ugr.es) and Juan Luis Guerrero-Rascado (rascado@ugr.es) for further information.
Aeolus data files are available from the ESA Aeolus Online Dissemination System (https://aeolus-ds.eo.esa.int, ESA, 2022). The accessibility of these files is limited based on the ESA criteria. The Doppler lidar and radiosonde measurements used in this study are available in the following Zenodo repository: https://doi.org/10.5281/zenodo.7626611 (Abril-Gago et al., 2023). However, readers may contact Jesús Abril-Gago (jabrilgago@ugr.es) and Juan Luis Guerrero-Rascado (rascado@ugr.es) before using the measurements.
JAG and JLGR conceptualized the study, developed the methodology, and carried out the investigation and validation. JAG, JLGR, POA, DBP, JAM, JABA, MJGM, FNG, LAA and IFM were responsible for data curation and undertook the formal analysis. JAG and JLGR wrote the original draft of the paper, and JAG, JLGR, POA, DBP, JAM, JABA, MJGM, FNG, LAA and IFM reviewed and edited the paper.
The contact author has declared that none of the authors has any competing interests.
Publisher's note: Copernicus Publications remains neutral with regard to jurisdictional claims in published maps and institutional affiliations.
This article is part of the special issue “Aeolus data and their application (AMT/ACP/WCD inter-journal SI)”. It is not associated with a conference.
The authors thank the Spanish Ministry of Science and Innovation for the project PID2020-120015RB-I00, funded by MCIN/AEI/10.13039/501100011033; the Regional Government of Andalusia for the projects ARNM-430-UGR20, P18-RT-3820 and P20-00136; and the Horizon 2020 framework program of the European Union, for the grant number 654109. The authors also acknowledge the University of Granada for the project PP2022.PP.34. Jesús Abril-Gago thanks the Spanish Ministry of Science and Innovation (Agencia Estatal de Investigación) for the grant PRE2021- 097060 (co-funded by the European Social Fund Plus) and the Spanish Ministry of Universities for the grant FPU 21/01436. Pablo Ortiz-Amezcua acknowledges the Fundación Ramón Areces for the grant “Ampliación de estudios en el extranjero en Ciencias de la Vida y de la Materia. XXXII Convocatoria” and the Polish National Science Centre (NCN) for project 2021/40/C/ST10/00023 of program SONATINA 5. Francisco Navas-Guzmán thanks the the Ramón y Cajal program (ref. RYC2019-027519-I) of the Spanish Ministry of Science and Innovation. The authors gratefully acknowledge the FEDER program for the instrumentation used in this study, which is part of the Laboratorio Singular de Tecnologías Avanzadas Observatorio Global de la Atmósfera (AGORA), supported by the University of Granada, and the COST Action PROBE (CA18235), supported by COST (European Cooperation in Science and Technology), for the exchange of expertise. Finally, the authors thank the two anonymous reviewers for their comments and suggestions that have allowed for a huge increase in the quality of this article.
This research has been supported by the Scientific Units of Excellence Program (grant no. UCE-PP2017-02) and the Spanish Ministry of Science and Innovation projects PID2020.117825GB.C21 and PID2020.117825GB.C22, funded by MCIN/AEI/10.13039/501100011033.
This paper was edited by Eduardo Landulfo and reviewed by two anonymous referees.
Abril-Gago, J., Guerrero-Rascado, J. L., Costa, M. J., Bravo-Aranda, J. A., Sicard, M., Bermejo-Pantaleón, D., Bortoli, D., Granados-Muñoz, M. J., Rodríguez-Gómez, A., Muñoz-Porcar, C., Comerón, A., Ortiz-Amezcua, P., Salgueiro, V., Jiménez-Martín, M. M., and Alados-Arboledas, L.: Statistical validation of Aeolus L2A particle backscatter coefficient retrievals over ACTRIS/EARLINET stations on the Iberian Peninsula, Atmos. Chem. Phys., 22, 1425–1451, https://doi.org/10.5194/acp-22-1425-2022, 2022.
Abril-Gago, J. Ortiz-Amezcua, P., Guerrero-Rascado, J. L., and Alados-Arboledas, L.: Ground-based Doppler lidar and radiosonde measurements for Aeolus wind products validation, Zenodo [data set], https://doi.org/10.5281/zenodo.7626611, 2023.
Andersson, E.: Statement of Guidance for Global Numerical Weather Prediction (NWP), World Meteorological Organisation, https://docplayer.net/194586713-Statement-of-guidance-for-global-numerical-weatherprediction-nwp.html (last access: 10 February 2023), 2018.
Baars, H., Herzog, A., Heese, B., Ohneiser, K., Hanbuch, K., Hofer, J., Yin, Z., Engelmann, R., and Wandinger, U.: Validation of Aeolus wind products above the Atlantic Ocean, Atmos. Meas. Tech., 13, 6007–6024, https://doi.org/10.5194/amt-13-6007-2020, 2020.
Baars, H., Radenz, M., Floutsi, A. A., Engelmann, R., Althausen, D., Heese, B., Ansmann, A., Flament, T., Dabas, A., Trapon, D., Reitebuch, O., Bley, S., and Wandinger, U.: Californian Wildfire Smoke Over Europe: A First Example of the Aerosol Observing Capabilities of Aeolus Compared to Ground-Based Lidar, Geophys. Res. Lett., 48, e2020GL092194, https://doi.org/10.1029/2020GL092194, 2021.
Bedka, K. M., Nehrir, A. R., Kavaya, M., Barton-Grimley, R., Beaubien, M., Carroll, B., Collins, J., Cooney, J., Emmitt, G. D., Greco, S., Kooi, S., Lee, T., Liu, Z., Rodier, S., and Skofronick-Jackson, G.: Airborne lidar observations of wind, water vapor, and aerosol profiles during the NASA Aeolus calibration and validation (Cal/Val) test flight campaign, Atmos. Meas. Tech., 14, 4305–4334, https://doi.org/10.5194/amt-14-4305-2021, 2021.
Bedoya-Velásquez, A. E., Navas-Guzmán, F., Granados-Muñoz, M. J., Titos, G., Román, R., Casquero-Vera, J. A., Ortiz-Amezcua, P., Benavent-Oltra, J. A., de Arruda Moreira, G., Montilla-Rosero, E., Hoyos, C. D., Artiñano, B., Coz, E., Olmo-Reyes, F. J., Alados-Arboledas, L., and Guerrero-Rascado, J. L.: Hygroscopic growth study in the framework of EARLINET during the SLOPE I campaign: synergy of remote sensing and in situ instrumentation, Atmos. Chem. Phys., 18, 7001–7017, https://doi.org/10.5194/acp-18-7001-2018, 2018.
Bedoya-Velásquez, A. E., Navas-Guzmán, F., de Arruda Moreira, G., Román, R., Cazorla, A., Ortiz-Amezcua, P., Benavent-Oltra, J. A., Alados-Arboledas, L., Olmo-Reyes, F. J., Foyo-Moreno, I., Montilla-Rosero, E., Hoyos, C. D., and Guerrero-Rascado, J. L.: Seasonal analysis of the atmosphere during five years by using microwave radiometry over a mid-latitude site, Atmos. Res., 218, 78–89, https://doi.org/10.1016/j.atmosres.2018.11.014, 2019a.
Belova, E., Kirkwood, S., Voelger, P., Chatterjee, S., Satheesan, K., Hagelin, S., Lindskog, M., and Körnich, H.: Validation of Aeolus winds using ground-based radars in Antarctica and in northern Sweden, Atmos. Meas. Tech., 14, 5415–5428, https://doi.org/10.5194/amt-14-5415-2021, 2021.
Bosque Maurel, J.: El clima de Granada, Estud. Geográficos, 20, 145–147, https://www.proquest.com/docview/1304223170?pq-origsite=gscholar&fromopenview=true&imgSeq=1 (last access: 10 February 2023), 1959.
Browning, K. A. and Wexler, R.: The determination of kinematic properties of a wind field using Doppler radar, J. Appl. Meteorol., 7, 105–113, https://doi.org/10.1175/1520-0450(1968)007<0105:TDOKPO>2.0.CO;2, 1968.
Chen, S., Cao, R., Xie, Y., Zhang, Y., Tan, W., Chen, H., Guo, P., and Zhao, P.: Study of the seasonal variation in Aeolus wind product performance over China using ERA5 and radiosonde data, Atmos. Chem. Phys., 21, 11489–11504, https://doi.org/10.5194/acp-21-11489-2021, 2021.
de Arruda Moreira, G., Guerrero-Rascado, J. L., Bravo-Aranda, J. A., Benavent-Oltra, J. A., Ortiz-Amezcua, P., Román, R., Bedoya-Velásquez, A. E., Landulfo, E., and Alados-Arboledas, L.: Study of the planetary boundary layer by microwave radiometer, elastic lidar and Doppler lidar estimations in Southern Iberian Peninsula, Atmos. Res., 213, 185–195, https://doi.org/10.1016/j.atmosres.2018.06.007, 2018.
Ehlers, F., Flament, T., Dabas, A., Trapon, D., Lacour, A., Baars, H., and Straume-Lindner, A. G.: Optimization of Aeolus' aerosol optical properties by maximum-likelihood estimation, Atmos. Meas. Tech., 15, 185–203, https://doi.org/10.5194/amt-15-185-2022, 2022.
ESA: Aeolus Online Dissemination System, https://aeolus-ds.eo.esa.int, last access: 20 July 2023.
European Space Agency (ESA): ADM-Aeolus Science Report, ESA SP-1311, 121 pp., https://esamultimedia.esa.int/multimedia/publications/SP-1311/SP-1311.pdf (last access: 10 February 2023), 2008.
Fehr, T.: The Joint Aeolus Tropical Atlantic Campaign 2021, Aeolus 3rd Anniversary Conference, Taormina, Italy, 28 March–1 April 2022, https://www.aeolus3years.org/detailed-agenda (last access: 10 February 2023), 2022.
Fehr, T., Piña, A., Amiridis, V., Baars, H., von Bismarck, J., Borne, M., Cazenave, Q., Chen, S., Flamant, C., Gaetani, M., Knipperz, P., Koopman, R., Lemmerz, C., Marinou, E., Mocnik, G., Parrinello, T., Reitebuch, O., Skofronick-Jackson, G., Straume, A. G., and Zenk, C.: The Joint Aeolus Tropical Atlantic Campaign – First Results for Aeolus Calibration/Validation and Science in the Tropics, ESA Atmospheric Science Conference (2021), online, 22–26 November 2021, https://atmos2021.esa.int/agenda/ (last access: 10 February 2023), 2021.
Feofilov, A. G., Chepfer, H., Noël, V., Guzman, R., Gindre, C., Ma, P.-L., and Chiriaco, M.: Comparison of scattering ratio profiles retrieved from ALADIN/Aeolus and CALIOP/CALIPSO observations and preliminary estimates of cloud fraction profiles, Atmos. Meas. Tech., 15, 1055–1074, https://doi.org/10.5194/amt-15-1055-2022, 2022.
Flamant, P. H., Lever, V., Martinet, P., Flament, T., Cuesta, J., Dabas, A., Olivier, M., and Huber, D.: ADM-Aeolus L2A Algorithm Theoretical Baseline Document Particle spin-off products, ESA, reference: AE-TN-IPSL-GS-001, https://earth.esa.int/eogateway/documents/20142/37627/Aeolus-L2A-Algorithm-Theoretical-Baseline-Document (last access: 10 February 2023), 2020.
Flament, T., Trapon, D., Lacour, A., Dabas, A., Ehlers, F., and Huber, D.: Aeolus L2A aerosol optical properties product: standard correct algorithm and Mie correct algorithm, Atmos. Meas. Tech., 14, 7851–7871, https://doi.org/10.5194/amt-14-7851-2021, 2021.
Gkikas, A., Gialitaki, A., Binietoglou, I., Marinou, E., Tsichla, M., Siomos, N., Paschou, P., Kampouri, A., Voudouri, K. A., Proestakis, E., Mylonaki, M., Papanikolaou, C.-A., Michailidis, K., Baars, H., Straume, A. G., Balis, D., Papayannis, A., Parrinello, T., and Amiridis, V.: First assessment of Aeolus Standard Correct Algorithm particle backscatter coefficient retrievals in the eastern Mediterranean, Atmos. Meas. Tech., 16, 1017–1042, https://doi.org/10.5194/amt-16-1017-2023, 2023.
Granados-Muñoz, M. J., Navas-Guzmán, F., Bravo-Aranda, J. A., Guerrero-Rascado, J. L., Lyamani, H., Fernández-Gálvez, J., and Alados-Arboledas, L.: Automatic determination of the planetary boundary layer height using lidar: One-year analysis over southeastern Spain, J. Geophys. Res., 117, D18208, https://doi.org/10.1029/2012JD017524, 2012.
Guo, J., Liu, B., Gong, W., Shi, L., Zhang, Y., Ma, Y., Zhang, J., Chen, T., Bai, K., Stoffelen, A., de Leeuw, G., and Xu, X.: Technical note: First comparison of wind observations from ESA's satellite mission Aeolus and ground-based radar wind profiler network of China, Atmos. Chem. Phys., 21, 2945–2958, https://doi.org/10.5194/acp-21-2945-2021, 2021.
Illingworth, A. J., Hogan, R. J., O'Connor, E. J., Bouniol, D., Brooks, M. E., Delanoé, J., Donovan, D. P., Eastment, J. D., Gaussiat, N., Goddard, J. W. F., Haeffelin, M., Baltink, H. K., Krasnov, O. A., Pelon, J., Piriou, J.-M., Protat, A., Russchenberg, H. W. J., Seifert, A., Tompkins, A. M., van Zadelhoff, G.-J., Vinit, F., Willén, U., Wilson, D. R., and Wrench, C. L.: Cloudnet, B. Am. Meteorol. Soc., 88, 883–898, https://doi.org/10.1175/BAMS-88-6-883, 2007.
Ingmann, P. and Straume, A. G.: ADM-Aeolus Mission Requirements Document, ESA, reference: AE-RP-ESA-SY-001 EOP-SM/2047, https://earth.esa.int/eogateway/documents/20142/1564626/Aeolus-Mission-Requirements.pdf (last access: 10 February 2023), 2016.
Iwai, H., Aoki, M., Oshiro, M., and Ishii, S.: Validation of Aeolus Level 2B wind products using wind profilers, ground-based Doppler wind lidars, and radiosondes in Japan, Atmos. Meas. Tech., 14, 7255–7275, https://doi.org/10.5194/amt-14-7255-2021, 2021.
Khaykin, S. M., Hauchecorne, A., Wing, R., Keckhut, P., Godin-Beekmann, S., Porteneuve, J., Mariscal, J.-F., and Schmitt, J.: Doppler lidar at Observatoire de Haute-Provence for wind profiling up to 75 km altitude: performance evaluation and observations, Atmos. Meas. Tech., 13, 1501–1516, https://doi.org/10.5194/amt-13-1501-2020, 2020.
Kottayil, A., Prajwal, K., Devika, M. V., Abhilash, S., Satheesan, K., Antony, R., John, V. O., and Mohanakumar, K.: Assessing the quality of Aeolus wind over a tropical location (10.04 N, 76.9 E) using 205 MHz wind profiler radar, Int. J. Remote Sens., 43, 3320–3335, https://doi.org/10.1080/01431161.2022.2090871, 2022.
Lux, O., Wernham, D., Bravetti, P., McGoldrick, P., Lecrenier, O., Riede, W., D'Ottavi, A., de Sanctis, V., Schillinger, M., Lochard,J., Marshall, J., Lemmerz, C., Weiler, F., Mondin, L., Ciapponi, A., Kanitz, T., Elfving, A., Parrinello, T., and Reitebuch, O.: High-power and frequency-stable ultraviolet laser performance in space for the wind lidar on Aeolus, Opt. Lett., 45, 1443–1446, https://doi.org/10.1364/OL.387728, 2020a.
Lux, O., Lemmerz, C., Weiler, F., Marksteiner, U., Witschas, B., Rahm, S., Geiß, A., and Reitebuch, O.: Intercomparison of wind observations from the European Space Agency's Aeolus satellite mission and the ALADIN Airborne Demonstrator, Atmos. Meas. Tech., 13, 2075–2097, https://doi.org/10.5194/amt-13-2075-2020, 2020b.
Lux, O., Lemmerz, C., Weiler, F., Marksteiner, U., Witschas, B., Rahm, S., Geiß, A., Schäfler, A., and Reitebuch, O.: Retrieval improvements for the ALADIN Airborne Demonstrator in support of the Aeolus wind product validation, Atmos. Meas. Tech., 15, 1303–1331, https://doi.org/10.5194/amt-15-1303-2022, 2022a.
Lux, O., Witschas, B., Geiß, A., Lemmerz, C., Weiler, F., Marksteiner, U., Rahm, S., Schäfler, A., and Reitebuch, O.: Quality control and error assessment of the Aeolus L2B wind results from the Joint Aeolus Tropical Atlantic Campaign, Atmos. Meas. Tech., 15, 6467–6488, https://doi.org/10.5194/amt-15-6467-2022, 2022b.
Martin, A., Weissmann, M., Reitebuch, O., Rennie, M., Geiß, A., and Cress, A.: Validation of Aeolus winds using radiosonde observations and numerical weather prediction model equivalents, Atmos. Meas. Tech., 14, 2167–2183, https://doi.org/10.5194/amt-14-2167-2021, 2021.
Montávez, J.P., Rodríguez, A., and Jiménez, J.I.: A study of the urban heat island of Granada, Int. J. Climatol, 20, 899–911, https://doi.org/10.1002/1097-0088(20000630)20:8<899::AID-JOC433>3.0.CO;2-I, 2000.
Navas-Guzmán, F., Fernández-Gálvez, J., Granados-Muñoz, M. J., Guerrero-Rascado, J. L., Bravo-Aranda, J. A., and Alados-Arboledas, L.: Tropospheric water vapour and relative humidity profiles from lidar and microwave radiometry, Atmos. Meas. Tech., 7, 1201–1211, https://doi.org/10.5194/amt-7-1201-2014, 2014.
Ortiz-Amezcua, P., Martínez-Herrera, A., Manninen, A. J., Pentikäinen, P. P., O'Connor, E. J., Guerrero-Rascado, J. L., and Alados-Arboledas, L.: Wind and Turbulence Statistics in the Urban Boundary Layer over a Mountain–Valley System in Granada, Spain, Remote Sensing, 14, 2321, https://doi.org/10.3390/rs14102321, 2022a.
Ortiz-Amezcua, P., Andújar-Maqueda, J., Manninen, A. J., Pentikäinen, P., O'Connor, E. J., Stachlewska, I. S., de Arruda Moreira, G., Benavent-Oltra, J. A., Casquero-Vera, J. A., Poczta, P., Wang, D., Harenda, K. M., Chojnicki, B. H., Szczepanik, D. M., Janicka, Ł., Schüttemeyer, D., Alados-Arboledas, L., and Guerrero-Rascado, J. L.: Dynamics of the Atmospheric Boundary Layer over two middle-latitude rural sites with Doppler lidar, Atmos. Res., 280, 106434, https://doi.org/10.1016/j.atmosres.2022.106434, 2022b.
Pearson, G., Davies, F., and Collier, C.: An analysis of the performance of the UFAM pulsed Doppler lidar for observing the boundary layer, J. Atmos. Ocean. Technol., 26, 240–250, https://doi.org/10.1175/2008JTECHA1128.1, 2009.
Pentikäinen, P., O'Connor, E. J., Manninen, A. J., and Ortiz-Amezcua, P.: Methodology for deriving the telescope focus function and its uncertainty for a heterodyne pulsed Doppler lidar, Atmos. Meas. Tech., 13, 2849–2863, https://doi.org/10.5194/amt-13-2849-2020, 2020.
Ratynski, M., Khaykin, S., Hauchecorne, A., Wing, R., Cammas, J.-P., Hello, Y., and Keckhut, P.: Validation of Aeolus wind profiles using ground-based lidar and radiosonde observations at Réunion island and the Observatoire de Haute-Provence, Atmos. Meas. Tech., 16, 997–1016, https://doi.org/10.5194/amt-16-997-2023, 2023.
Reitebuch, O.: The Spaceborne Wind Lidar Mission ADM-Aeolus, in: Atmospheric physics: Background, methods, trends, edited by: Schumann, U., Research Topics in Aerospace, Springer, Berlin, London, 815–827, 2012.
Reitebuch, O., Huber, D., and Nikolaus, I.: ADM-Aeolus Algorithm Theoretical Basis Document (ATBD) Level-1B Products, AE-RP-DLR-L1B-001, v. 4.4, 117 pp., https://earth.esa.int/eogateway/documents/20142/37627/Aeolus-L1B-Algorithm-ATBD.pdf (last access: 26 July 2023), 2018.
Rennie, M. and Isaksen, L.: The NWP impact of Aeolus Level2B winds at ECMWF, Technical Memorandum, ECMWF, https://doi.org/10.21957/alift7mhr, 2020.
Rennie, M., Tan, D., Andersson, E., Poli, P., Dabas, A., De Kloe, J., Marseille, G.-J., and Stoffelen, A.: Aeolus Level-2B Algorithm Theoretical Basis Document (Mathematical Description of the Aeolus L2B Processor), AED-SD-ECMWF-L2B-038, V. 3.4, 124 pp., ECMWF, https://earth.esa.int/eogateway/documents/20142/37627/Aeolus-L2B-Algorithm-ATBD.pdf (last access: 10 February 2023), 2020.
Rennie, M. P., Isaksen, L., Weiler, F., Kloe, J., Kanitz, T., and Reitebuch, O.: The impact of Aeolus wind retrievals in ECMWF global weather forecasts, Q. J. Roy. Meteor. Soc., 147, 3555–3586, https://doi.org/10.1002/qj.4142, 2021.
Šavli, M., de Kloe, J., Marseille, G.-J., Rennie, M., Žagar, N., and Nils, W.: The prospects for increasing the horizontal resolution of the Aeolus horizontal line-of-sight wind profiles, Q. J. Roy. Meteor. Soc., 145, 3499–3515, https://doi.org/10.1002/qj.3634, 2019.
Stoffelen, A., Benedetti, A., Borde, R., Dabas, A., Flamant, P., Forsythe, M., Hardesty, M., Isaksen, L., Källén, E., Körnich, H., Lee, T., Reitebuch, O., Rennie, M., Riishøjgaard, L.-P., Schyberg, H., Straume, A. G., and Vaughan, M.: Wind Profile Satellite Observation Requirements and Capabilities, B. Am. Meteorol. Soc., 101, E2005–E2021, https://doi.org/10.1175/BAMS-D-18-0202.1, 2020.
Straume, A. G., Schuettemeyer, D., Von Bismarck, J., Kanitz, T., and Fehr, T.: Aeolus Scientific Calibration and Validation Implementation Plan, https://earth.esa.int/eogateway/documents/20142/1564626/Aeolus-Scientific-CAL-VAL-Implementation-Plan.pdf (last access: 10 February 2023), 2019.
Tan, D. G. H., Rennie, M., Andersson, E., Poli, P., Dabas, A., de Kloe, J., Marseille, G.-J., and Stoffelen, A.: Aeolus Level2B Algorithm Theoretical Basis Document (Mathematical Description of the Aeolus Level-2B Processor), AE-TN-ECMWFL2BP-0023, v. 3.0, 109 pp., https://earth.esa.int/eogateway/documents/20142/37627/Aeolus-L2B-Algorithm-ATBD.pdf (last access: 26 July 2023), 2017.
Vaughan, G., Wareing, D., Thomas, L., and Mitev, V.: Humidity measurements in the free troposphere using Raman backscatter, Q. J. Roy. Meteor. Soc. 114, 1471–1484, 1988.
Viedma Muñoz, M.: Análisis de las direcciones de los vientos en Andalucía, Nimbus, 1, 153–168, http://repositorio.ual.es/bitstream/handle/10835/1493/199675[1].pdf?sequence=1 (last access: 10 February 2023), 1998.
Witschas, B., Lemmerz, C., Geiß, A., Lux, O., Marksteiner, U., Rahm, S., Reitebuch, O., and Weiler, F.: First validation of Aeolus wind observations by airborne Doppler wind lidar measurements, Atmos. Meas. Tech., 13, 2381–2396, https://doi.org/10.5194/amt-13-2381-2020, 2020.
Witschas, B., Lemmerz, C., Geiß, A., Lux, O., Marksteiner, U., Rahm, S., Reitebuch, O., Schäfler, A., and Weiler, F.: Validation of the Aeolus L2B wind product with airborne wind lidar measurements in the polar North Atlantic region and in the tropics, Atmos. Meas. Tech., 15, 7049–7070, https://doi.org/10.5194/amt-15-7049-2022, 2022.
Weiler, F., Kanitz, T., Wernham, D., Rennie, M., Huber, D., Schillinger, M., Saint-Pe, O., Bell, R., Parrinello, T., and Reitebuch, O.: Characterization of dark current signal measurements of the ACCDs used on board the Aeolus satellite, Atmos. Meas. Tech., 14, 5153–5177, https://doi.org/10.5194/amt-14-5153-2021, 2021a.
Weiler, F., Rennie, M., Kanitz, T., Isaksen, L., Checa, E., de Kloe, J., Okunde, N., and Reitebuch, O.: Correction of wind bias for the lidar on board Aeolus using telescope temperatures, Atmos. Meas. Tech., 14, 7167–7185, https://doi.org/10.5194/amt-14-7167-2021, 2021b.
World Meteorological Organization (WMO): Proceedings of the third WMO Workshop on the impact of various observing systems on numerical weather prediction, WMO, https://library.wmo.int/doc_num.php?explnum_id=5409 (last access: 10 February 2023), 2004.
Wu, S., Sun, K., Dai, G., Wang, X., Liu, X., Liu, B., Song, X., Reitebuch, O., Li, R., Yin, J., and Wang, X.: Inter-comparison of wind measurements in the atmospheric boundary layer and the lower troposphere with Aeolus and a ground-based coherent Doppler lidar network over China, Atmos. Meas. Tech., 15, 131–148, https://doi.org/10.5194/amt-15-131-2022, 2022.