the Creative Commons Attribution 4.0 License.
the Creative Commons Attribution 4.0 License.
 | 25 Jul 2023
Superimposed effects of typical local circulations driven by mountainous topography and aerosol–radiation interaction on heavy haze in the Beijing–Tianjin–Hebei central and southern plains in winter
Xiaoye Zhang
Zhaodong Liu
Wenjie Zhang
Siting Li
Chen Han
Huizheng Che
Although China's air quality has substantially improved in recent years due to the vigorous emissions reduction, the Beijing–Tianjin–Hebei (BTH) region, especially its central and southern plains at the eastern foot of the Taihang Mountains, has been the most polluted area in China, with persistent and severe haze in winter. Combining meteorology–chemistry coupled model simulations and multiple observations, this study explored the causes of several heavy haze events in this area in January 2017, focusing on local circulations related to mountain terrain. The study results showed that on the weather scale, the configuration of the upper, middle, and lower atmosphere provided favorable weather and water vapor transport conditions for the development of haze pollution. Under the weak weather-scale systems, local circulation played a dominant role in the regional distribution and extreme values of PM2.5. Influenced by the Taihang and Yanshan mountains, vertical circulations and wind convergence zone were formed between the plain and mountain slopes. The vertical distribution of pollutants strongly depended on the intensity and location of the circulation. The circulation with high intensity and low altitude was more unfavorable for the vertical and horizontal diffusion of near-surface pollutants. More importantly, we found that the aerosol–radiation interaction (ARI) significantly amplified the impacts of local vertical circulations on heavy haze by two mechanisms. First, the ARI strengthened the vertical circulations at the lower levels, with the zonal wind speeds increasing by 0.3–0.8 m s−1. Meanwhile, the ARI could cause a substantial downward shift in the vertical circulations (∼ 100 m). Second, the ARI weakened the horizontal diffusion of pollutants by reducing the westerly winds and enhancing wind convergence and southerly winds. Under these two mechanisms, pollutants could only recirculate in a limited space. This superposition of the typical local circulation and the ARI eventually contributed to the accumulation of pollutants and the consequent deterioration of haze pollution in the region.
- Article
(24163 KB) - Full-text XML
-
Supplement
(733 KB) - BibTeX
- EndNote


China's air quality has considerably improved in recent years because of the aggressive emission reduction measures (Q. Zhang et al., 2019; Zheng et al., 2018). However, the large urban agglomerations such as the Beijing–Tianjin–Hebei (BTH) region and the Yangtze River Delta (YRD) still frequently suffer from persistent heavy haze pollution and the deterioration of atmospheric visibility that it causes, especially in winter (Huang et al., 2020; Peng et al., 2020). Particulate matter with an aerodynamic diameter of less than 2.5 µm (PM2.5) is the primary aerosol component of haze and a significant factor affecting visibility. During heavy haze pollution, PM2.5 concentrations often exceeded 300 µg m−3, and sometimes even 500 µg m−3 in these areas (Peng et al., 2021; Wang et al., 2018; Zhang et al., 2020). Emissions and meteorological conditions are two key factors affecting pollutants. However, emissions in a region do not change much in the short term, when pollution levels may be dominated by regional or local meteorological conditions (Wang et al., 2018; Zheng et al., 2015; Zhong et al., 2017).
For regional or local air pollution, the link between the aerosol–radiation interaction (ARI), planetary boundary layer (PBL), and long-range transport has been investigated in recent years. Studies have illustrated that there is a positive feedback between aerosols and the PBL. During heavy haze pollution, high aerosol concentrations weaken the turbulence in the lower troposphere, mainly by scattering the solar radiation, thus inhibiting the development of the PBL (Miao et al., 2019; Peng et al., 2021; Quan et al., 2013; Wang et al., 2018; Zhong et al., 2018a), while absorbing aerosols, such as black carbon (BC), can heat the upper PBL and further enhance the stability of the atmospheric stratification (Ding et al., 2016; Huang et al., 2018). The decreased PBL then increases the near-surface relative humidity (RH) by weakening the vertical transport of water vapor; the increased RH in turn promotes the formation of secondary aerosols (Li et al., 2017; Liu et al., 2018). These direct and semi-direct effects of aerosols or the ARI will ultimately contribute to haze pollution. Aerosols can also act as cloud condensation nuclei or ice nuclei, modifying the cloud physical and radiative properties by participating in cloud microphysical processes; this aerosol–cloud interaction in turn affects the structure and development of the PBL (Zhang et al., 2015; Zhao et al., 2017). Moreover, the PBL feedback can interact with long-range transport through the ARI, and this interaction then amplifies the transboundary air pollution transport between northern and eastern China (Huang et al., 2020).
In addition to the interactions above, local circulations driven by unique topography also play an important role in the PBL structure and spatial and temporal distribution of pollutants (Chen et al., 2009; Liu et al., 2009; Miao et al., 2015; Zhang et al., 2018). The BTH region is located in the North China Plain (NCP), with the Yanshan Mountains to the north, Taihang Mountains to the west, and the Bohai Sea to the east (Fig. 1a). The elevation difference between these two mountains and the NCP can reach 1500–2000 m. Such a complex geographical environment makes the BTH region have unique local atmospheric circulation characteristics, and it is prone to the local accumulation or regional transport of pollutants. Chen et al. (2009) found that the elevation of the pollution layer in Beijing is associated with the mountain–plain breeze, which causes a rapid increase in the pollutants in the near-surface in this area. The intensity of local atmospheric circulation can strongly affect the removal and accumulation of local pollutants. In the absence of strong weather systems, the well-developed valley wind circulation and sea breeze circulation over the BTH region facilitates the long-distance transport of pollutants (Miao et al., 2015). On the contrary, weak local circulations make pollutants recirculate in a limited space and accumulate continuously (Lo et al., 2006; Sun et al., 2013). In addition, several topographic sensitivity experiments have been conducted to examine their effects on the low-level circulation and PBL structure in the BTH (Wang et al., 2019; Zhang et al., 2018), and the results highlight the significance of topography in the formation and accumulation of haze pollution. Despite the fact that there have been numerous previous studies on causes of haze pollution in the BTH, most of them concentrated on the effects of the ARI or topography alone, and few studies focused on the link between the ARI and topography-induced local circulation and the possible impact of this interaction on haze pollution.
The BTH suffered several heavy haze episodes between December 2016 and February 2017, with the persistent severe pollution in January 2017 being the most representative. Therefore, using the online coupled atmospheric chemistry model GRAPES_Meso5.1/CUACE, this study focused on January 2017 and comprehensively explored the link between the local circulation, ARI, and haze and especially on the impacts of the ARI on local circulation.
2.1 GRAPES_Meso5.1/CUACE
GRAPES_Meso5.1/CUACE is an online regional atmospheric chemistry model designed for both operational and research applications. There are two major parts of this model, namely a weather model (GRAPES_Meso5.1) and a chemistry model (CUACE). The former is a mesoscale weather prediction model that primarily consists of a fully compressible non-hydrostatical model core and a modularized physics package (Chen et al., 2008); the latter is an online chemistry model that is mainly composed of aerosol and gaseous chemistry modules with emission and dynamic processes (Gong and Zhang, 2008). Wang et al. (2022) established this updated model and provided a comprehensive description of the model. In this model, Peng et al. (2022) implemented the ARI mechanism for the two-way feedback between aerosols and weather processes by incorporating the real-time calculated aerosol optical parameters.
The model domain in this study is centered over the BTH region, covering an area of 33–45∘ N in latitude and 110–125∘ E in longitude (Fig. 1a). The model has a horizontal resolution of 10 km and 49 unevenly spaced vertical levels ranging from the near-surface to 33 km. The physical configuration options selected in this study include Thompson microphysics (Thompson et al., 2008), the Kain–Fritsch (KF) cumulus scheme (Kain, 2004), the rapid radiative transfer model (RRTM) longwave radiation scheme (Mlawer et al., 1997), and the Goddard shortwave radiation scheme (Chou et al., 1998), including the ARI mechanism, the medium-range forecast (MRF) boundary layer scheme (Hong and Pan, 1996), the MM5 surface layer scheme (Zhang and Anthes, 1982), and Noah land surface scheme (Ek et al., 2003). The chemical configuration options mainly include an emissions inventory treatment system, the second-generation Regional Acid Deposition Model (RADM2) gas-phase chemistry (Stockwell et al., 1990), and the CUACE aerosol model (Gong and Zhang, 2008; Wang et al., 2010, 2015a, b).
2.2 Data
Five categories of data were used in this study. These include the global Final analysis (FNL) data, with a horizontal resolution of 0.25∘ × 0.25∘ (https://rda.ucar.edu/datasets/ds083.3/, last access: 10 November 2021), provided by the National Centers for Environmental Prediction (NCEP), which was used for the meteorology initial and lateral boundary fields of the model and the analysis of large-scale circulation in upper and mid-levels; multi-year climate average of chemical tracers used for chemistry initialization of the model (Wang et al., 2022); monthly anthropogenic emissions derived from the Multi-resolution Emission Inventory for China (MEIC) of 2017 (Zheng et al., 2018); hourly near-surface PM2.5 mass concentration measured by 149 state-controlled stations provided by the China National Environmental Monitoring Center (http://www.cnemc.cn/, last access: 15 November 2021) and 210 stations provided by the Hebei meteorological service; vertical meteorology data for three sounding stations in the BTH, i.e., Beijing (BJ), Tangshan (TS), and Xingtai (XT), including air pressure, temperature, and wind at 08:00 and 20:00 Beijing time (BJT) each day, as measured by the L-band radiosonde system.
2.3 Experimental design and data analysis method
The model simulation was conducted from 29 December 2016 to 31 January 2017, with a looping time of 72 h. The first 72 h simulations were considered to be the spin-up period. To evaluate the impacts of the ARI on the PM2.5 concentration, two numerical scenarios were performed in this study. The first is the controlling simulation (CTL), with the above model configurations and the ARI; the second is the sensitive experiment (EXP), which is consistent with the CTL but without considering the ARI. The same analysis data and emission inventory were used for both numerical scenarios.
Multiple model performance evaluation metrics were used, including the Pearson correlation coefficient (R), the mean bias (MB), the root mean square error (RMSE), the mean fractional bias (MFB), and the mean fractional error (MFE). The equations of these metrics are available in Boylan and Russell (2006).
3.1 Model performance
Accurate reproduction of the aerosol concentration variations and the vertical structure of the atmosphere is a prerequisite for quantifying the ARI (Zhang et al., 2015) and local circulation. Figure 1 shows the distribution of the observed and simulated monthly mean PM2.5 concentrations in January 2017. The BTH region suffered from severe haze pollution in January 2017, with its regional monthly mean of the observed PM2.5 concentration reaching 130 µg m−3. Particularly at the eastern foot of the Taihang Mountains, the central and southern plains of the BTH, the PM2.5 values exceeded 200 and even 250 µg m−3. High anthropogenic emissions coupled with a stable atmosphere due to the mountainous topography lead to frequent and severe haze events in this area (Fu et al., 2014). The BTH is surrounded by the Yanshan and Taihang mountains from north to west, and this topography is not conducive to pollutant dispersion, since the mountains weaken the cold air from the north and west and block the transport of pollutants associated with easterly and southerly winds (Gao et al., 2017; Miao et al., 2015; Quan et al., 2020; Zhong et al., 2018b). A comparison of the observed and simulated PM2.5 results (Fig. 1c–d) shows that although both simulation scenarios reproduced the distribution of PM2.5 concentrations, the CTL results with the ARI were closer to the observations. Particularly in the most polluted central and southern BTH, the maximum PM2.5 concentration exceeded 225 µg m−3 in the CTL, while it was less than 200 µg m−3 in the EXP.
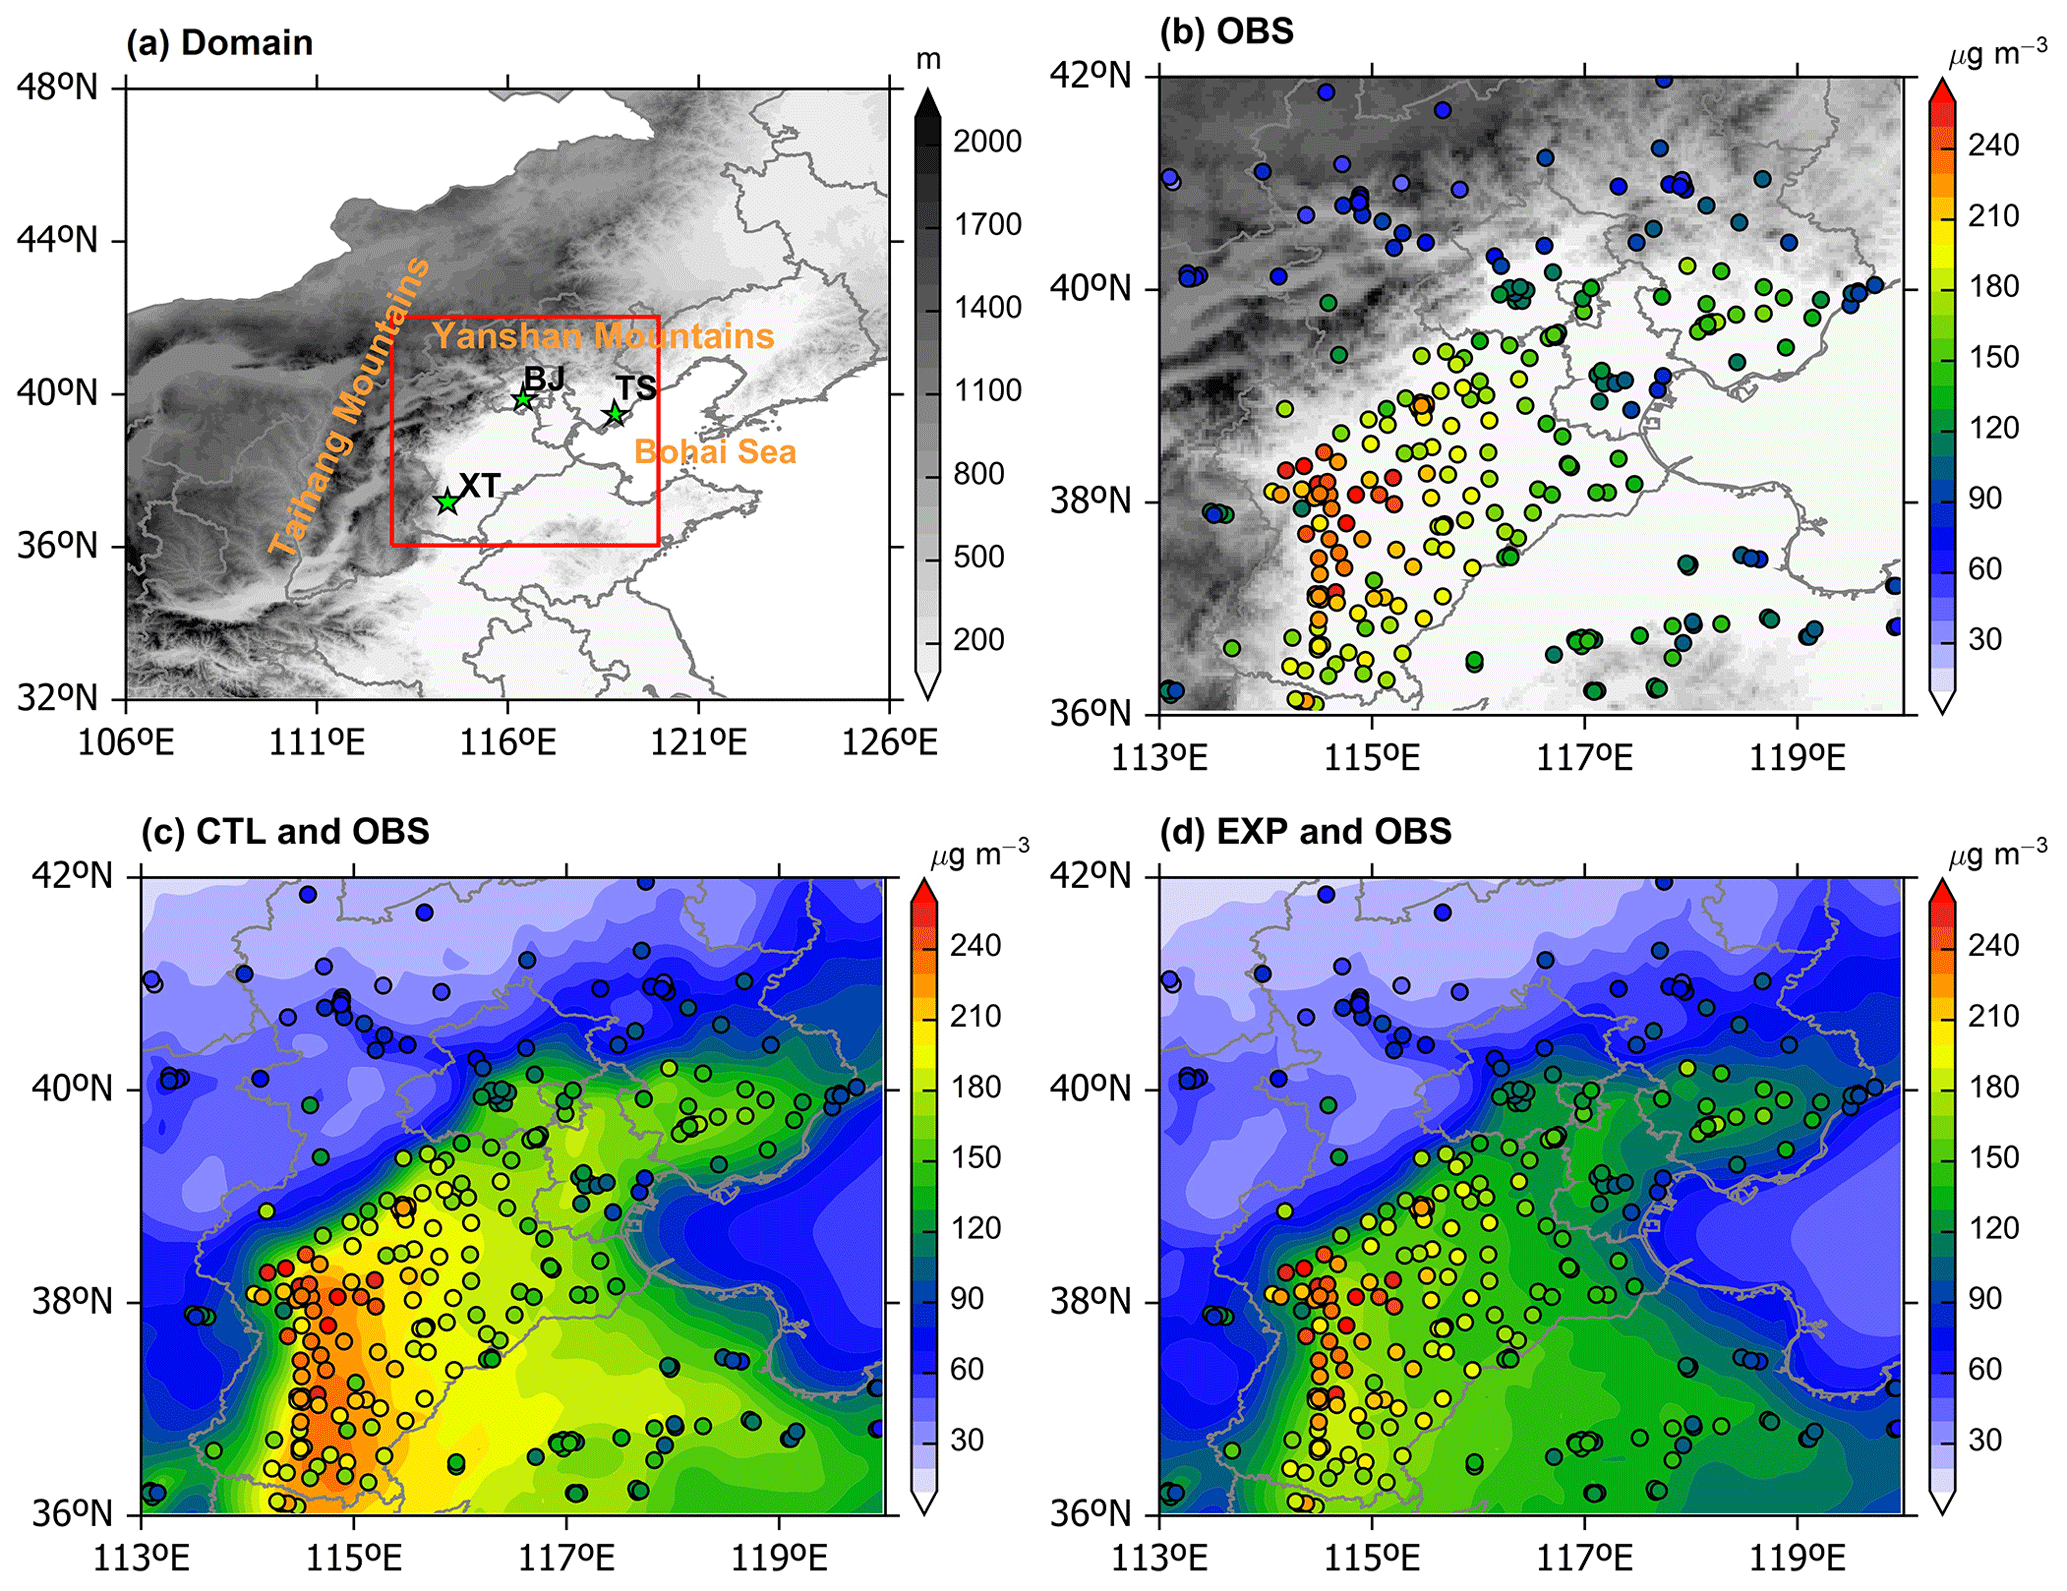
Figure 1(a) Model domain (shading denotes terrain height; red rectangle shows the general location of the BTH; green stars denote the weather sounding stations) and (b–d) spatial distributions of observed (OBS is indicated by circles) and simulated (CTL and EXP are indicated by the shading) PM2.5 concentrations in January 2017.
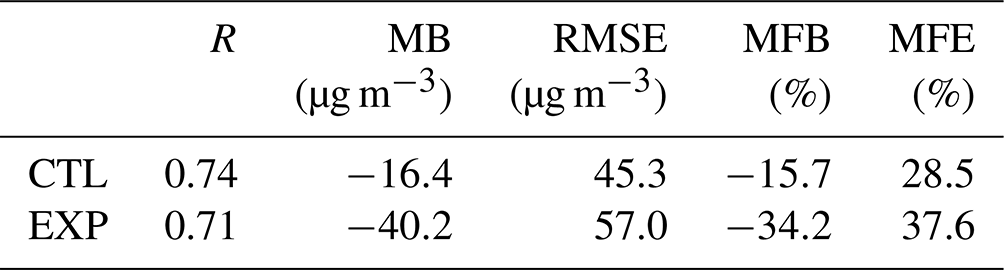
The hourly variation in the observed and simulated PM2.5 concentrations in the BTH was compared in Fig. 2. The model generally reproduced the temporal variation in the observed PM2.5. Compared to EXP, the model including the ARI (CTL) showed better agreements with observations, with higher R (from 0.71 to 0.74), smaller MB (from −40.2 to −16.4 µg m−3), and smaller RMSE (from 57.0 to 45.3 µg m−3; Table 1). Besides, both the MFB and MFE showed substantial reductions from −34.2 and 37.6 µg m−3 to −15.7 and 28.5 µg m−3, respectively (Table 1). According to the model performance goals for PM2.5 proposed by Morris et al. (2005), both the CTL and EXP simulation results achieved an average level (MFB ≤ ±60 % and MFE ≤ 75 %), with the CTL exceeding a good level (MFB ≤ ±30 % and MFE ≤ 50 %) and very close to an excellent level (MFB ≤ ±15 % and MFE ≤ 35 %). The results not only demonstrate the applicability of the model but also the necessity for considering the ARI for pollutant simulation. Moreover, the ARI effect strongly depends on the PM2.5 concentrations (Peng et al., 2021; Zhang et al., 2022). In this study, the ARI effect was significant when the PM2.5 concentration was larger than 100 µg m−3 (Fig. 2), implying that the ARI effect can significantly improve the model's underestimation of the PM2.5 peaks. Considering the essential influence of the ARI mechanism on PM2.5 extremes and the accuracy of the simulation results, three pollution periods were selected, namely 1–7, 16–18, and 23–26 January. Furthermore, since the short-term characteristics of the local circulation have a greater impact on the PM2.5 distribution than the long-term ones, it is necessary to select 1 d from each of the three periods to further investigate the link between the local circulation and ARI and how their interaction enhances heavy haze pollution. According to the criteria of the air pollution level (HJ633–2012) issued by the Ministry of Environmental Protection of China, heavy pollution is defined as the daily mean PM25 concentration larger than 150 µg m−3. Therefore, 6, 17, and 25 January, which reached the heavy pollution level and were in the rising stage, were finally selected as the representatives of heavy pollution days in three periods.
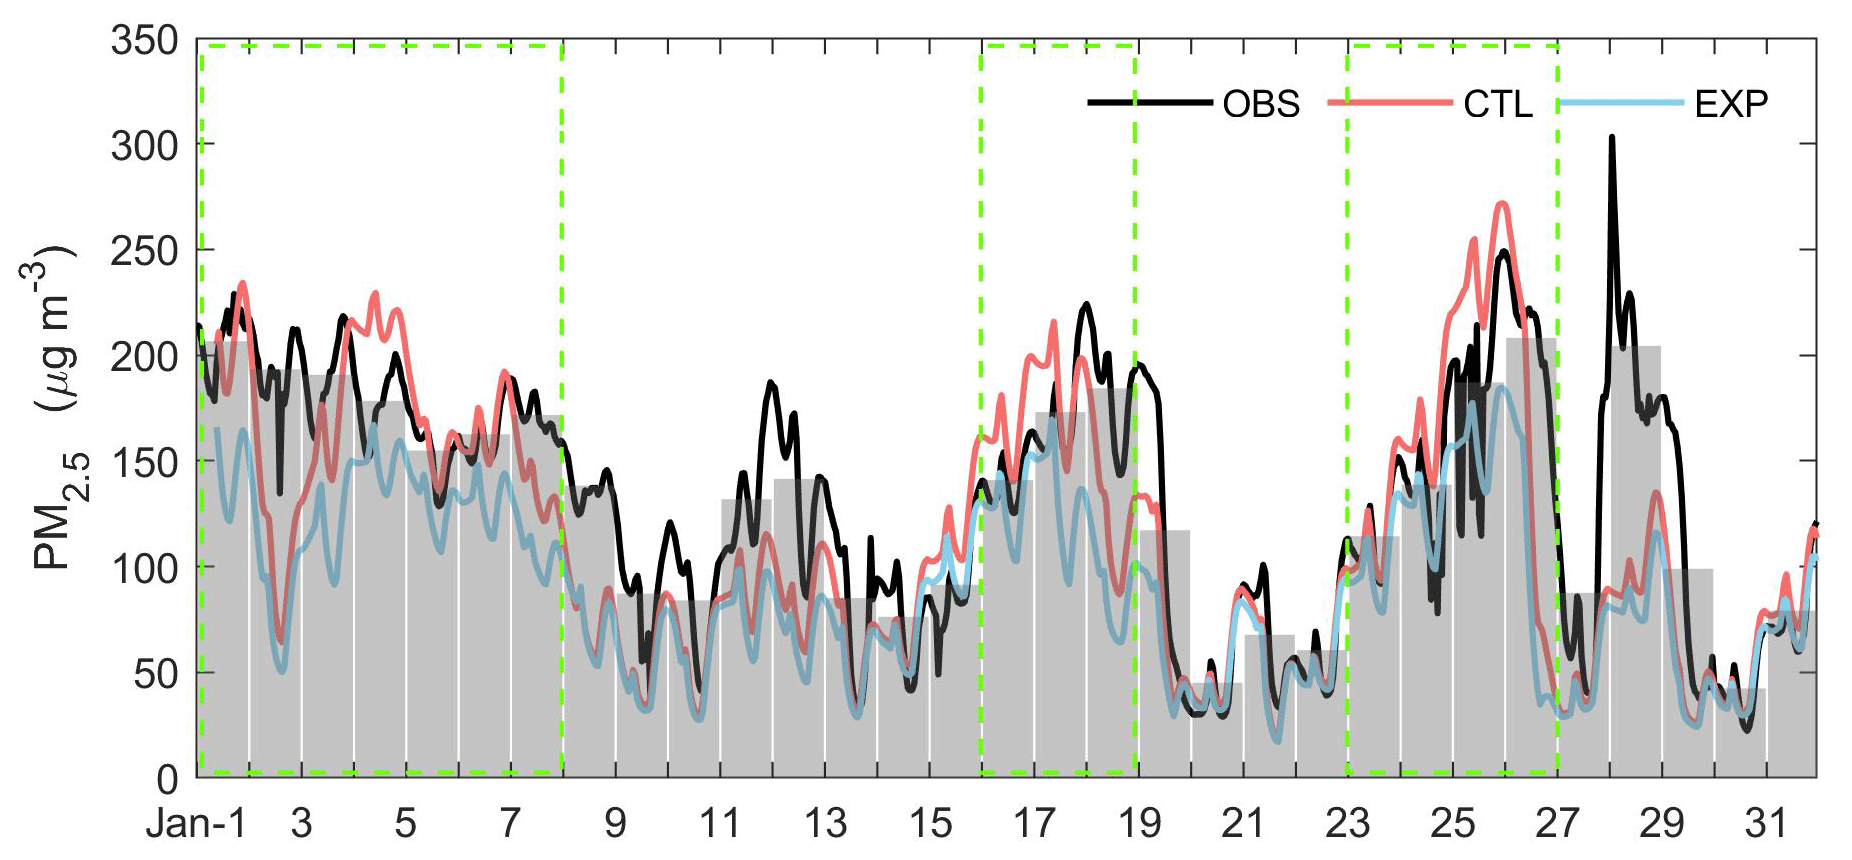
Figure 2Time series of observed (OBS) and simulated (CTL and EXP) PM2.5 concentrations in the BTH during January 2017. The gray bar shows the observed daily mean PM2.5 concentrations, and the green box shows the selected pollution period.
Table 1Model evaluation for PM2.5 in the BTH during January 2017.
Given the important influence of atmospheric vertical structure, especially the temperature stratification, on the formation of pollutants, we further evaluated the model performance (CTL) in simulating the vertical profile of the potential temperature (PT) at BJ, TS, and XT by comparing the sounding observations. As shown in Fig. 3, the model simulations reasonably reproduced the vertical distribution of temperature in BJ, TS, and XT, including a good simulation of atmospheric warming during the pollution period. For the three pollution periods (1–7, 16–18, and 23–26 January), the mean values of R for PT below 2500 m were 0.94, 0.97, and 0.97 in BJ, TS, and XT, respectively; for the heavy pollution days (6, 17, and 25 January), the R values were 0.83–0.99 in BJ, 0.96–0.99 in TS, and 0.90–0.99 in XT. The accurate representation of near-surface PM2.5 concentrations and vertical temperature structure in the model provides a solid basis for clarifying the physical mechanisms of heavy pollution.
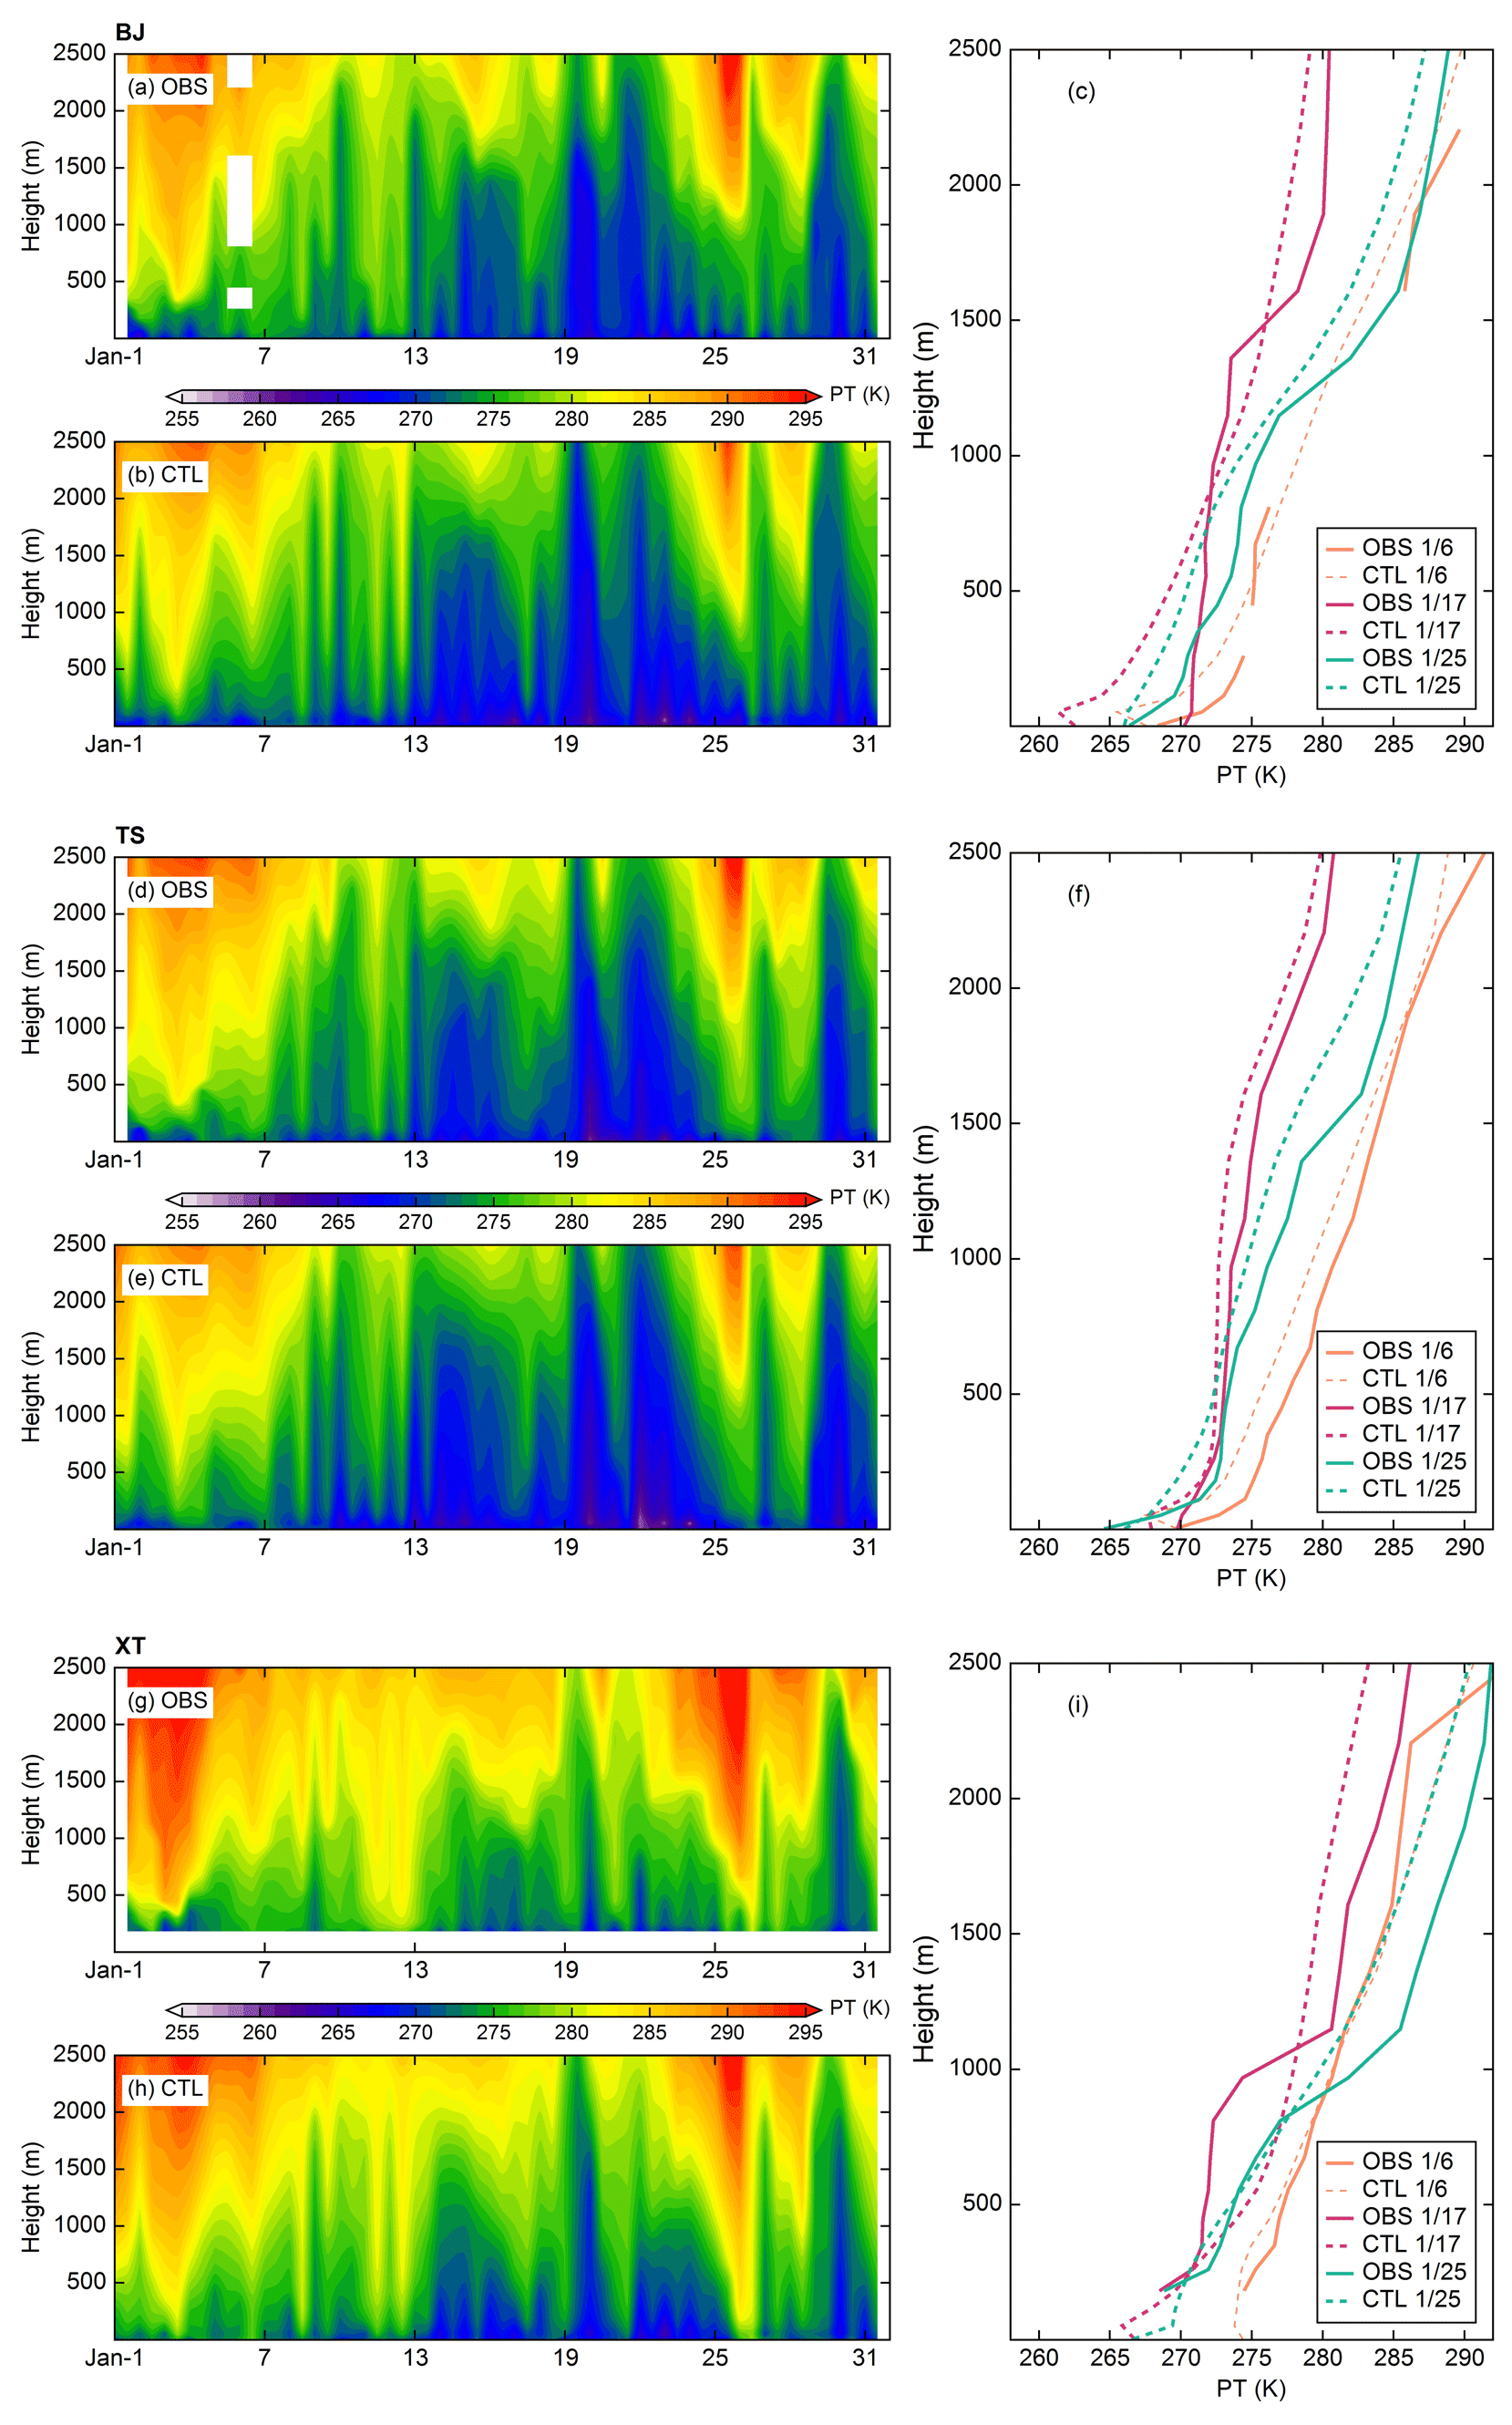
Figure 3Vertical profiles of observed (OBS) and simulated (CTL) PT for (a–b) BJ, (d–e) TS, and (g–h) XT at 08:00 and 20:00 BJT in January 2017. Panels (c), (f), and (i) denote the PT profiles for these three cities at 08:00 BJT on 6, 17, and 25 January.
3.2 Weather situation background under haze pollution
Previous studies have shown that persistent pollution is influenced not only by the PBL and surface meteorology but also by the configuration of the upper and lower-level circulation systems (Miao et al., 2015; Wu et al., 2017). Based on the distribution characteristics of pollutants in the BTH region and the good simulation performance of the model, the horizontal distribution of the upper, middle, and lower atmosphere and surface circulation field in the pollution days was examined in this section. Before the specific discussion of the 3 heavy haze days, we made a general analysis of the weather situation in the three pollution periods. Figure S1 (in the Supplement) shows the average distributions of geopotential height (GH), PT, and wind vectors at the 500 and 700 hPa levels from the FNL data. It can be seen that the BTH region was controlled by northwesterly airflow at upper and mid-levels during the pollution periods, and its PT increased with height. This is a typical atmospheric circulation that often accompanies pollution episodes. The distributions of simulated (CTL) GH and PT at 850 hPa were similar to those at 500 and 700 hPa (Fig. S2). The BTH region was dominated by a uniform pressure field in front of the high-pressure system. The weak pressure gradient resulted in weak westerly wind flows, which blocked dry and cold polar air into this region. Under such stable atmospheric circulation conditions, the PBL development over the BTH was suppressed, which led to a lower height of the PBL (PBLH) and near-surface wind speeds, contributing to the formation and maintenance of haze pollution (Fig. S3).
Based on the above results, we further compared the weather situation characteristics of the selected heavy pollution day in each period. The circulation patterns across the BTH differed considerably during these 3 d (Fig. 4). On 6 January, eastern China was in front of a weak north–south trough at 500 hPa, and the BTH region was controlled by southwesterly airflow and a slight temperature gradient. On 17 January, East Asia was dominated by a zonal circulation, and the BTH region was mainly controlled by westerly airflow. On 25 January, mainland China was dominated by a northeast–southwest high-pressure ridge, and the BTH region was controlled by westerly and northwesterly airflow over this ridge. Moreover, the circulation patterns at 700 hPa were consistent with that at 500 hPa. All of these synoptic conditions are generally considered to promote the deterioration of pollution since they impede the southward movement of cold air from the north and west and strengthen the downdrafts (Wu et al., 2017; X. Zhang et al., 2019).
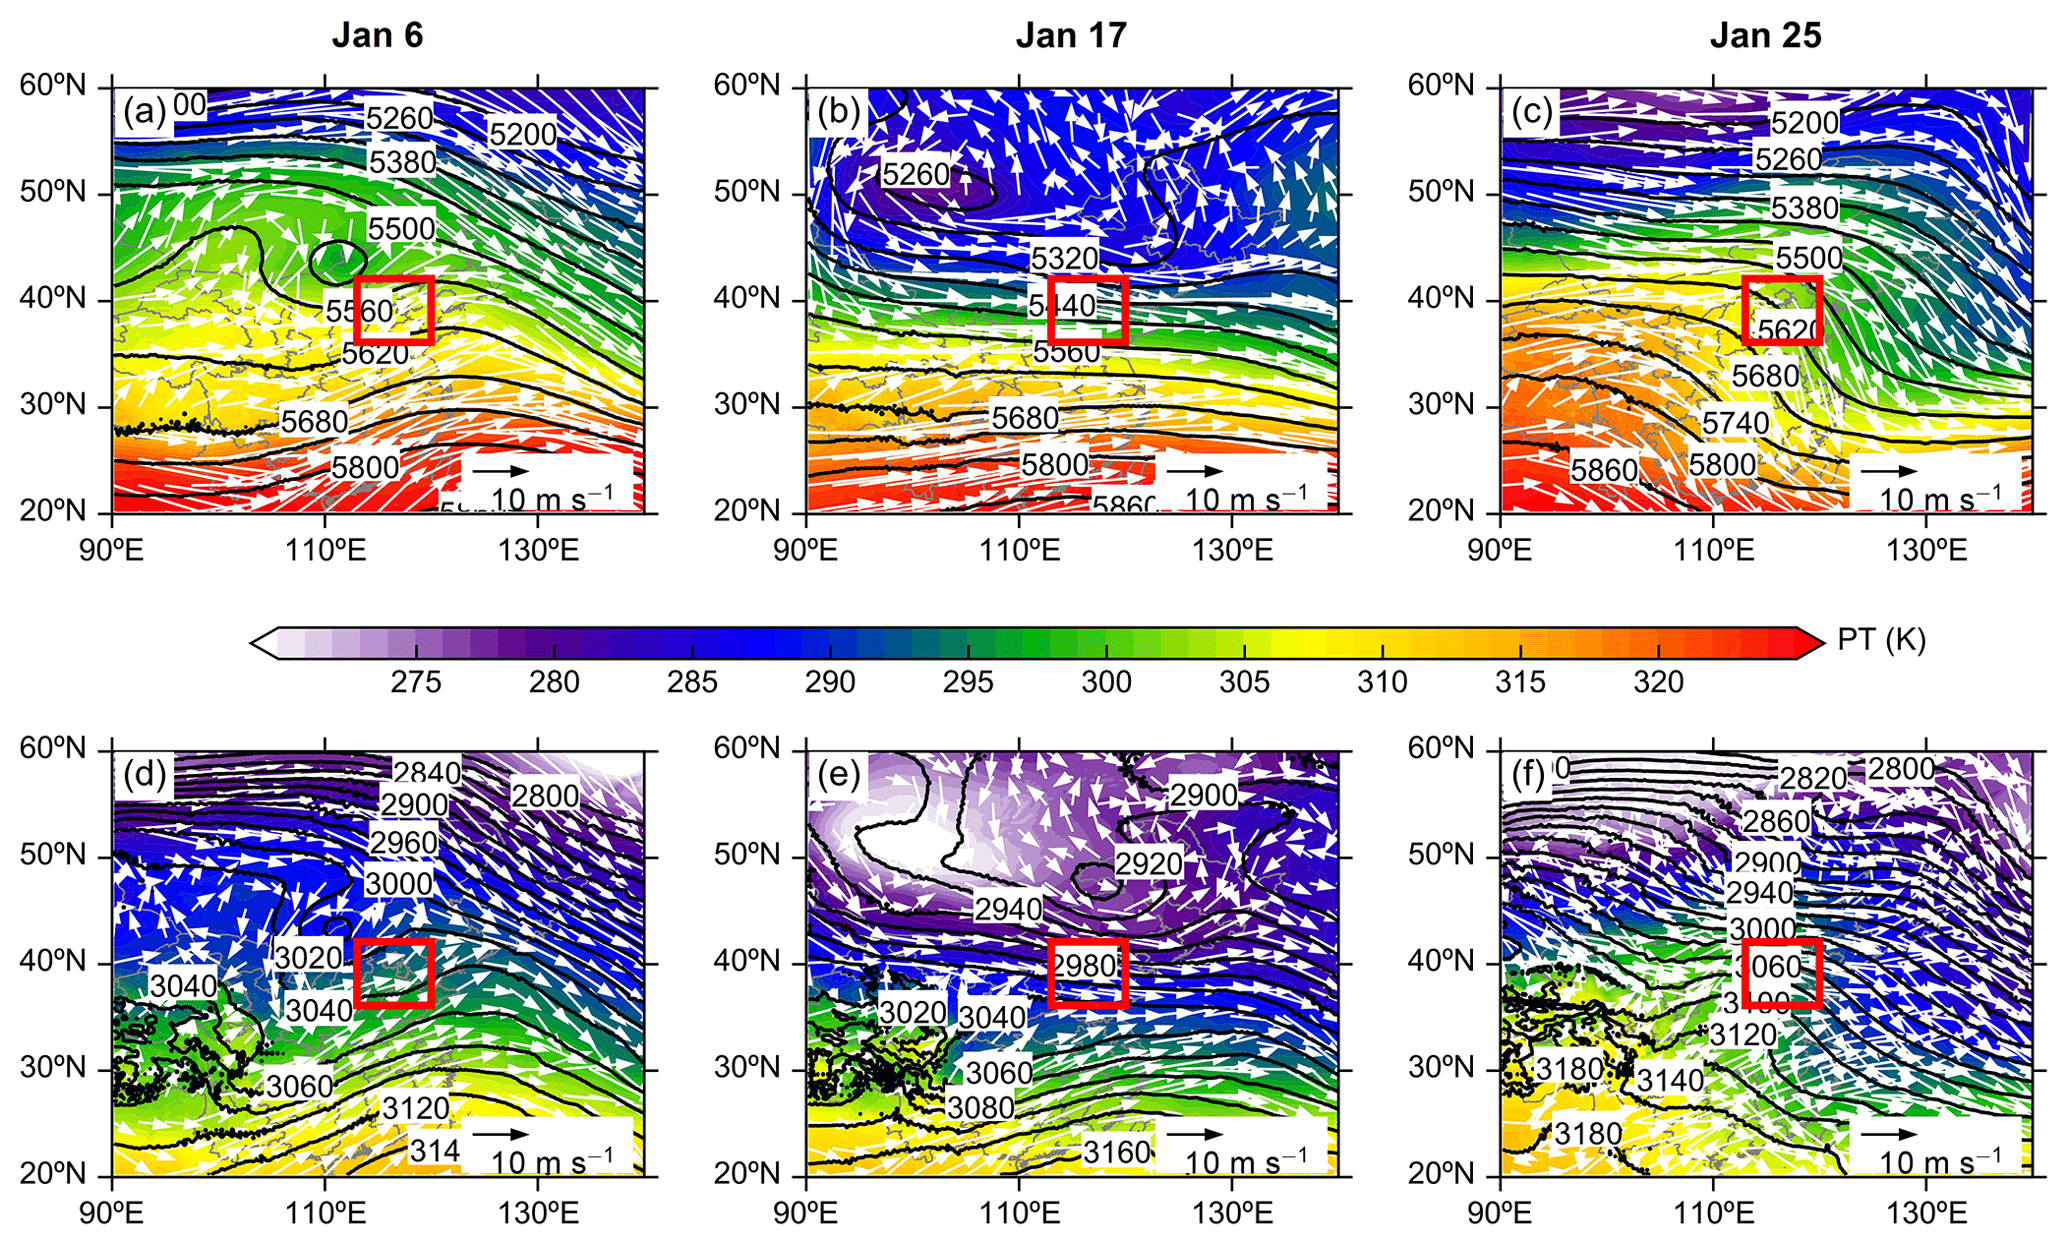
Figure 4Distribution of GH (black lines), PT (shadings), and wind vectors (white arrows) at (a–c) 500 hPa and (d–f) 700 hPa on 6, 17, and 25 January. Red rectangles indicate the BTH region.
Figure 5 displays the distribution of the simulated GH, PT, and wind vectors at 850 hPa level on the 3 d. On 6 January, most of the BTH region was between two weak high pressures. Influenced by the southwesterly and southeasterly winds, the warm and humid air masses from the south and the sea were brought to the central and southern BTH. The northern BTH was mainly controlled by low pressure to the northeast, and the northwesterly winds in the area were reduced due to the blockage of the Taihang and Yanshan mountains. On 17 January, the BTH region was between the low pressure in the northeast and the high pressure in the southwest, leaving most of the BTH under the control of northwesterly winds. On 25 January, eastern China was under the control of subtropical high pressure. The BTH region was located north of the subtropical high center, with southwesterly winds prevailing. Such a wind field is conducive to bringing warm and humid air masses from the south to the BTH.
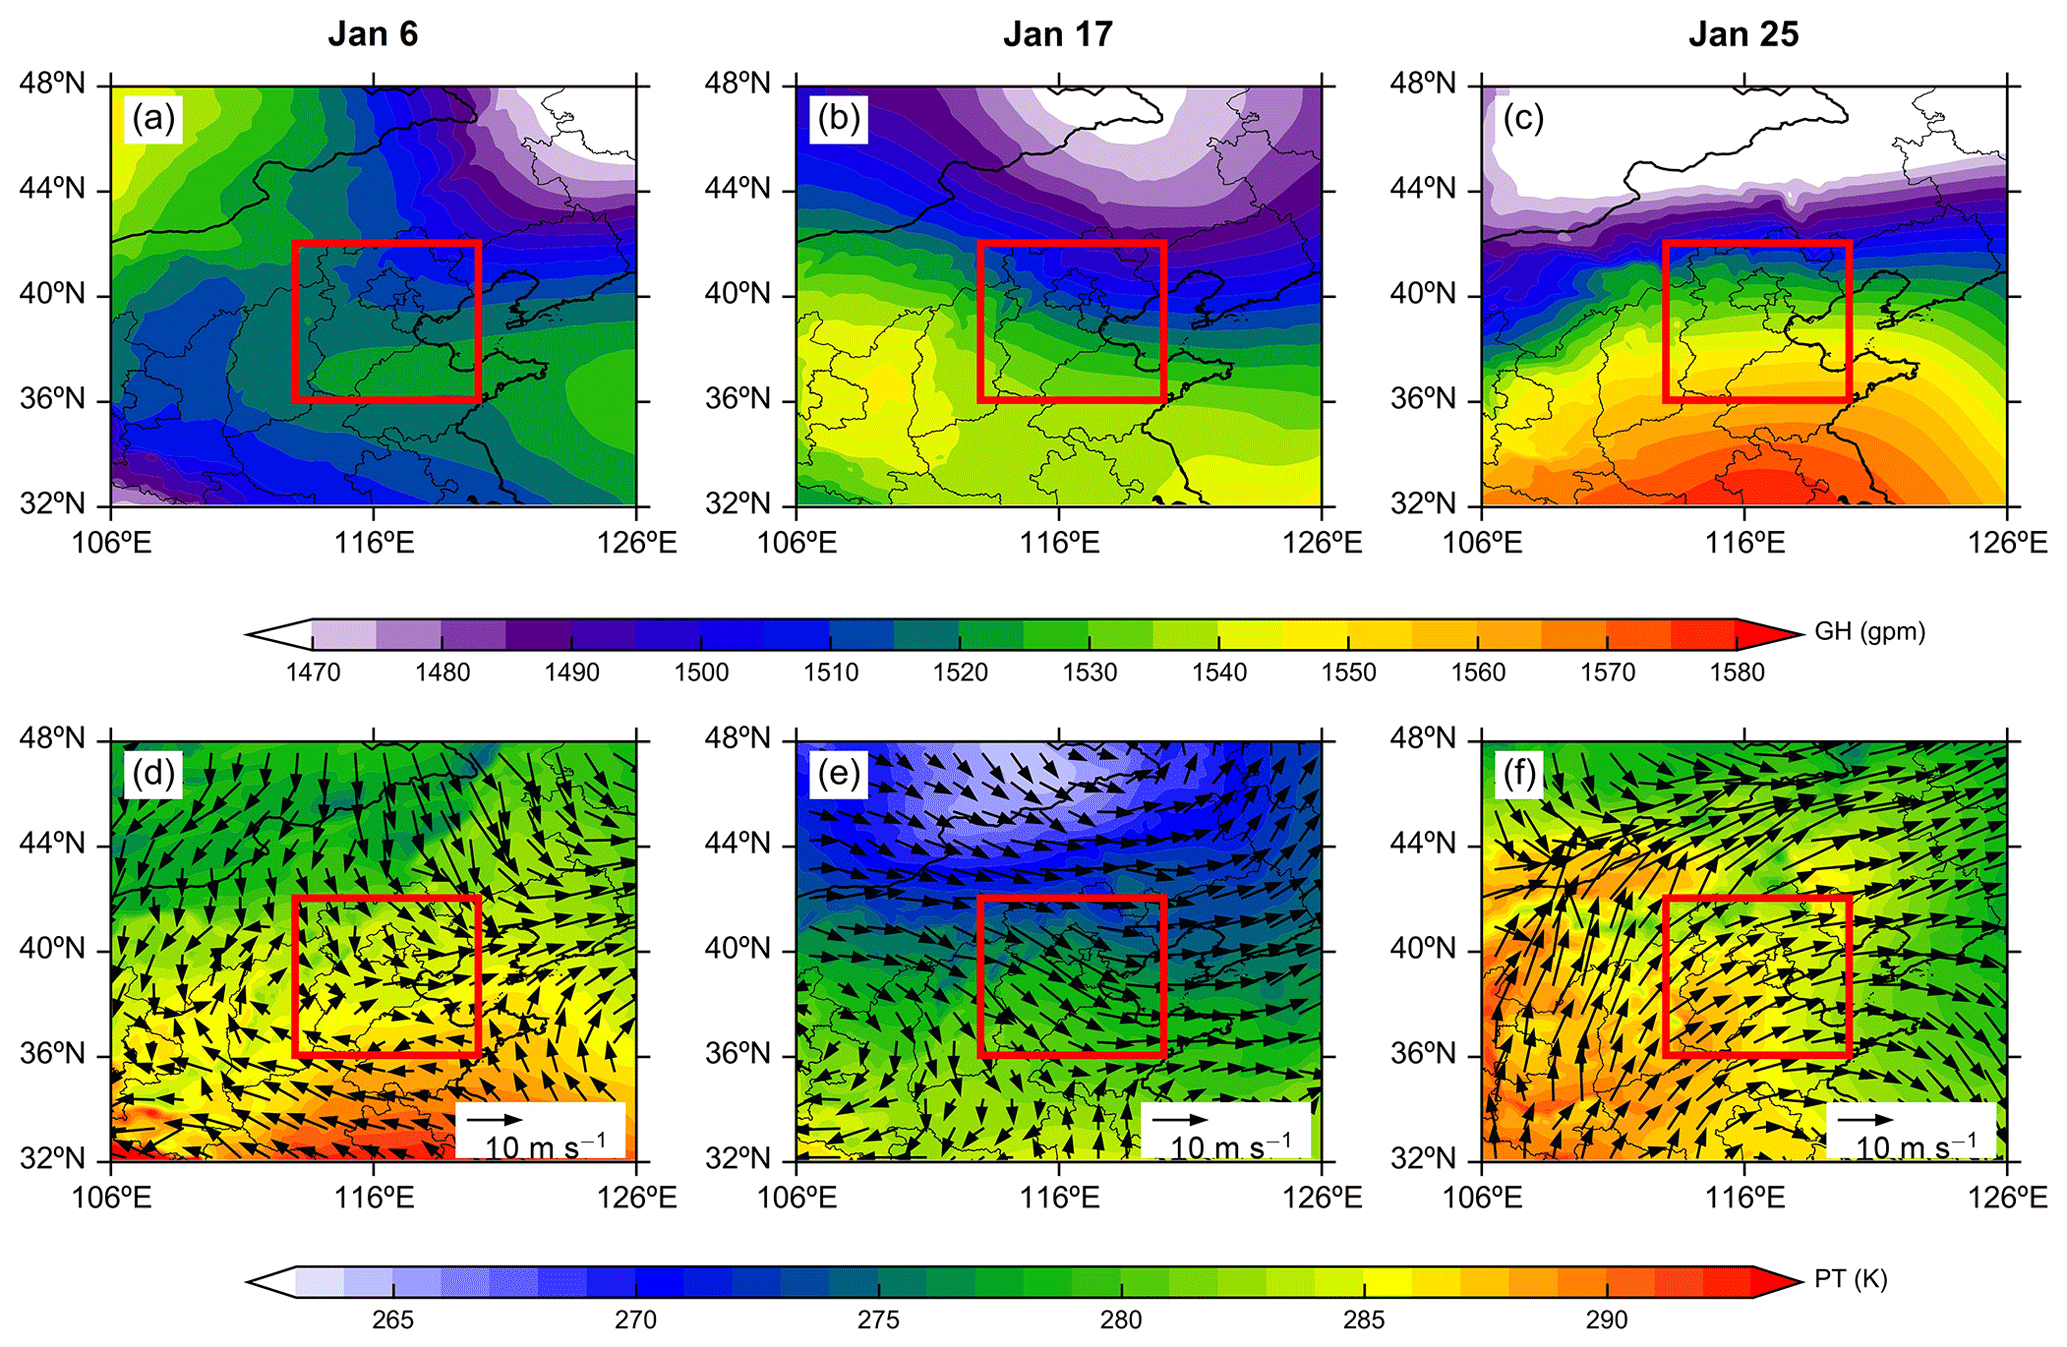
Figure 5Distribution of simulated (CTL) GH (a–c), PT (d–f; shading), and wind vectors (d–f; black arrows) at 850 hPa on 6, 17, and 25 January. Red rectangles indicate the BTH region.
The northerly or northwesterly airflow in the lower troposphere tends to form a sink motion on the leeward slope after being blocked by the Yanshan and Taihang mountains, which will lead to a decrease in PBLH and wind speed in the plains of the BTH region (Fig. 6). On the 3 d, the daily mean PBLH was generally below 300 m in the central and southern plains of BTH, and its low-value area corresponded well to the high-value area of near-surface PM2.5 concentrations. Moreover, due to the disturbance of the local circulation caused by the Yanshan and Taihang mountains, the near-surface wind field showed different distribution characteristics from the lower troposphere with wind speeds below 2 m s−1 in most areas. On 6 January, high PM2.5 concentrations were concentrated in eastern BTH, and a northeast–southwest transport channel was formed under the influence of northeasterly winds. This distribution of wind field was consistent with the average result during the three pollution periods (Fig. S3b). On 17 January, northwesterly winds prevailed in the northern Beijing area due to strong airflow in the lower troposphere. However, the blockage of the mountains weakened the airflow sharply in the plain area after it crossed the mountains, forming subsidence and a weak divergence, which led to a large accumulation of pollutants there. A similar transport channel was found on 25 January, although its wind field was completely different from that on 6 January. Most of the plains are controlled by southerly winds. The southerly winds formed a convergence zone with the northerly winds to the south of Beijing, which was not conducive to the outward dispersion of pollutants. Furthermore, the southerly winds brought warm and humid air masses from the south, which facilitated the formation of secondary pollution.
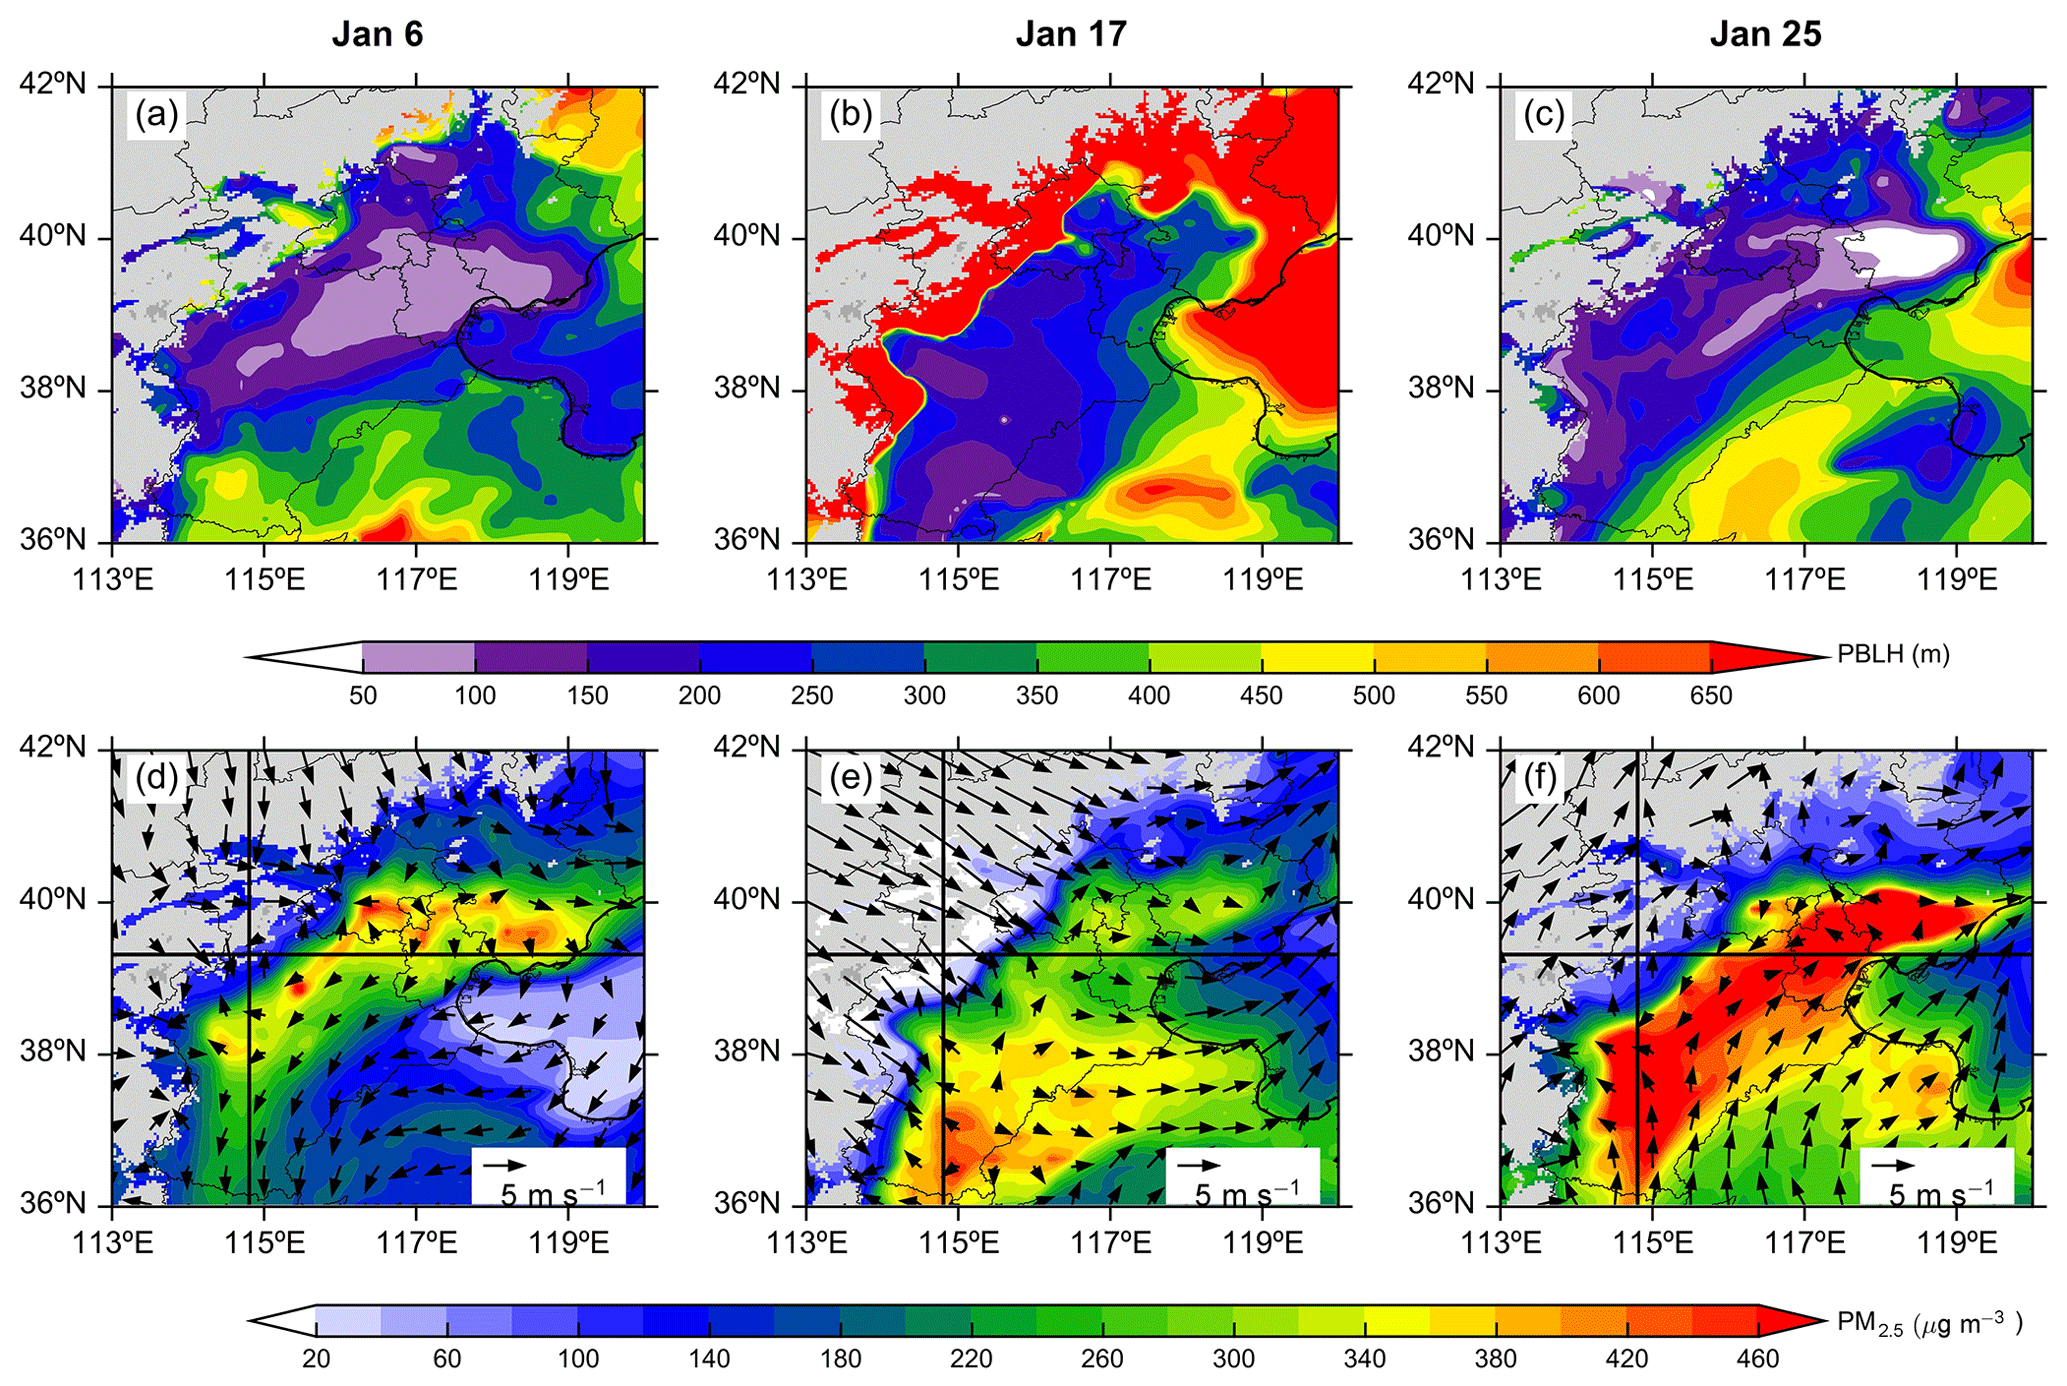
Figure 6Distribution of the simulated (CTL) daytime (09:00–16:00 BJT) PBLH (a–c), near-surface PM2.5 concentrations (d–f; shading), and wind vectors at 10 m (d–f; black arrows) on 6, 17, and 25 January. The gray shading denotes the terrain height over 1000 m. The black lines indicate the location of the vertical cross sections shown in Figs. 7 and 9–12.
3.3 Influence of local circulations on pollutant distribution
Under these weak weather-scale systems, the local circulation may dominate the distribution of pollutants and the development of haze. Figure 7 displays the daytime vertical circulation vectors and PM2.5 concentrations along the west–east cross section (to the east of the Taihang Mountains) and along the south–north cross section (to the south of the border between the Taihang and Yanshan mountains), respectively, on the 3 d. For the cross section along the west–east, a clockwise vertical circulation was formed in the lower level on 6 January. The westerly airflow sharply weakened after crossing the mountains, and the zonal wind speeds at lower levels (<500 m, where the pollution was most severe) were mostly below 2 m s−1; the differential heating between the mountain slopes and the plains caused the atmosphere on the slopes to rise with relative heating and the atmosphere on the plains to sink with relative cooling, resulting in a weak clockwise local circulation between the eastern Taihang Mountains and the BTH plain (119∘ E; Fig. 7a); pollutants then accumulated in the PBL through this recirculation. There was a similar vertical circulation on 25 January (Fig. 7c). However, this circulation was limited (between the eastern Taihang Mountains and 118∘ E) due to the control of lower and near-surface southwesterly winds. On 17 January, although a sinking motion occurred within the PBL, the zonal wind speeds were larger throughout the layer compared to the other 2 d, mostly ranging between 2 and 5 m s−1 (Fig. 7b). The stronger westerly winds made it relatively easy for pollutants to disperse eastward, thus the PM2.5 concentrations were lower than those on the other 2 d. For the cross section along the south–north, the PM2.5 concentrations on 6 January were significantly lower than those on 17 and 25 January. On 6 January, northeasterly winds prevailed near the surface of central and southern BTH, and the pollutants were transported from northeast to southwest via this channel (Fig. 6d). The airflow over the mountains formed a whole layer of subsidence near 38∘ N (Fig. 7d), which inhibited the upward transport of pollutants; at the same time, there was a vertical local circulation at 33–37∘ N, between 700 and 1500 m (Fig. 7d), which made pollutants recirculate in this region and not easily disperse to the outside. However, due to the high altitude of this circulation, its restrictions on pollutants were not as strong as the zonal circulations on 6 January (Fig. 7a) and 25 January (Fig. 7c). On 17 January, a wind convergence zone appeared in the lower level (<1000 m) near 37∘ N (Fig. 7e). The combined effect of southerly and northerly winds made the pollutants difficult to disperse outward, thus leading to their local accumulation. On 25 January, southerly winds prevailed throughout the layer below 1500 m (Fig. 7f), which is a typical meteorological condition leading to severe air pollution in this region (Huang et al., 2020; X. Zhang et al., 2019; Zhong et al., 2018b). The southerly winds facilitated the accumulation of local pollutants by weakening their horizontal diffusion and bringing in warm and humid air masses.
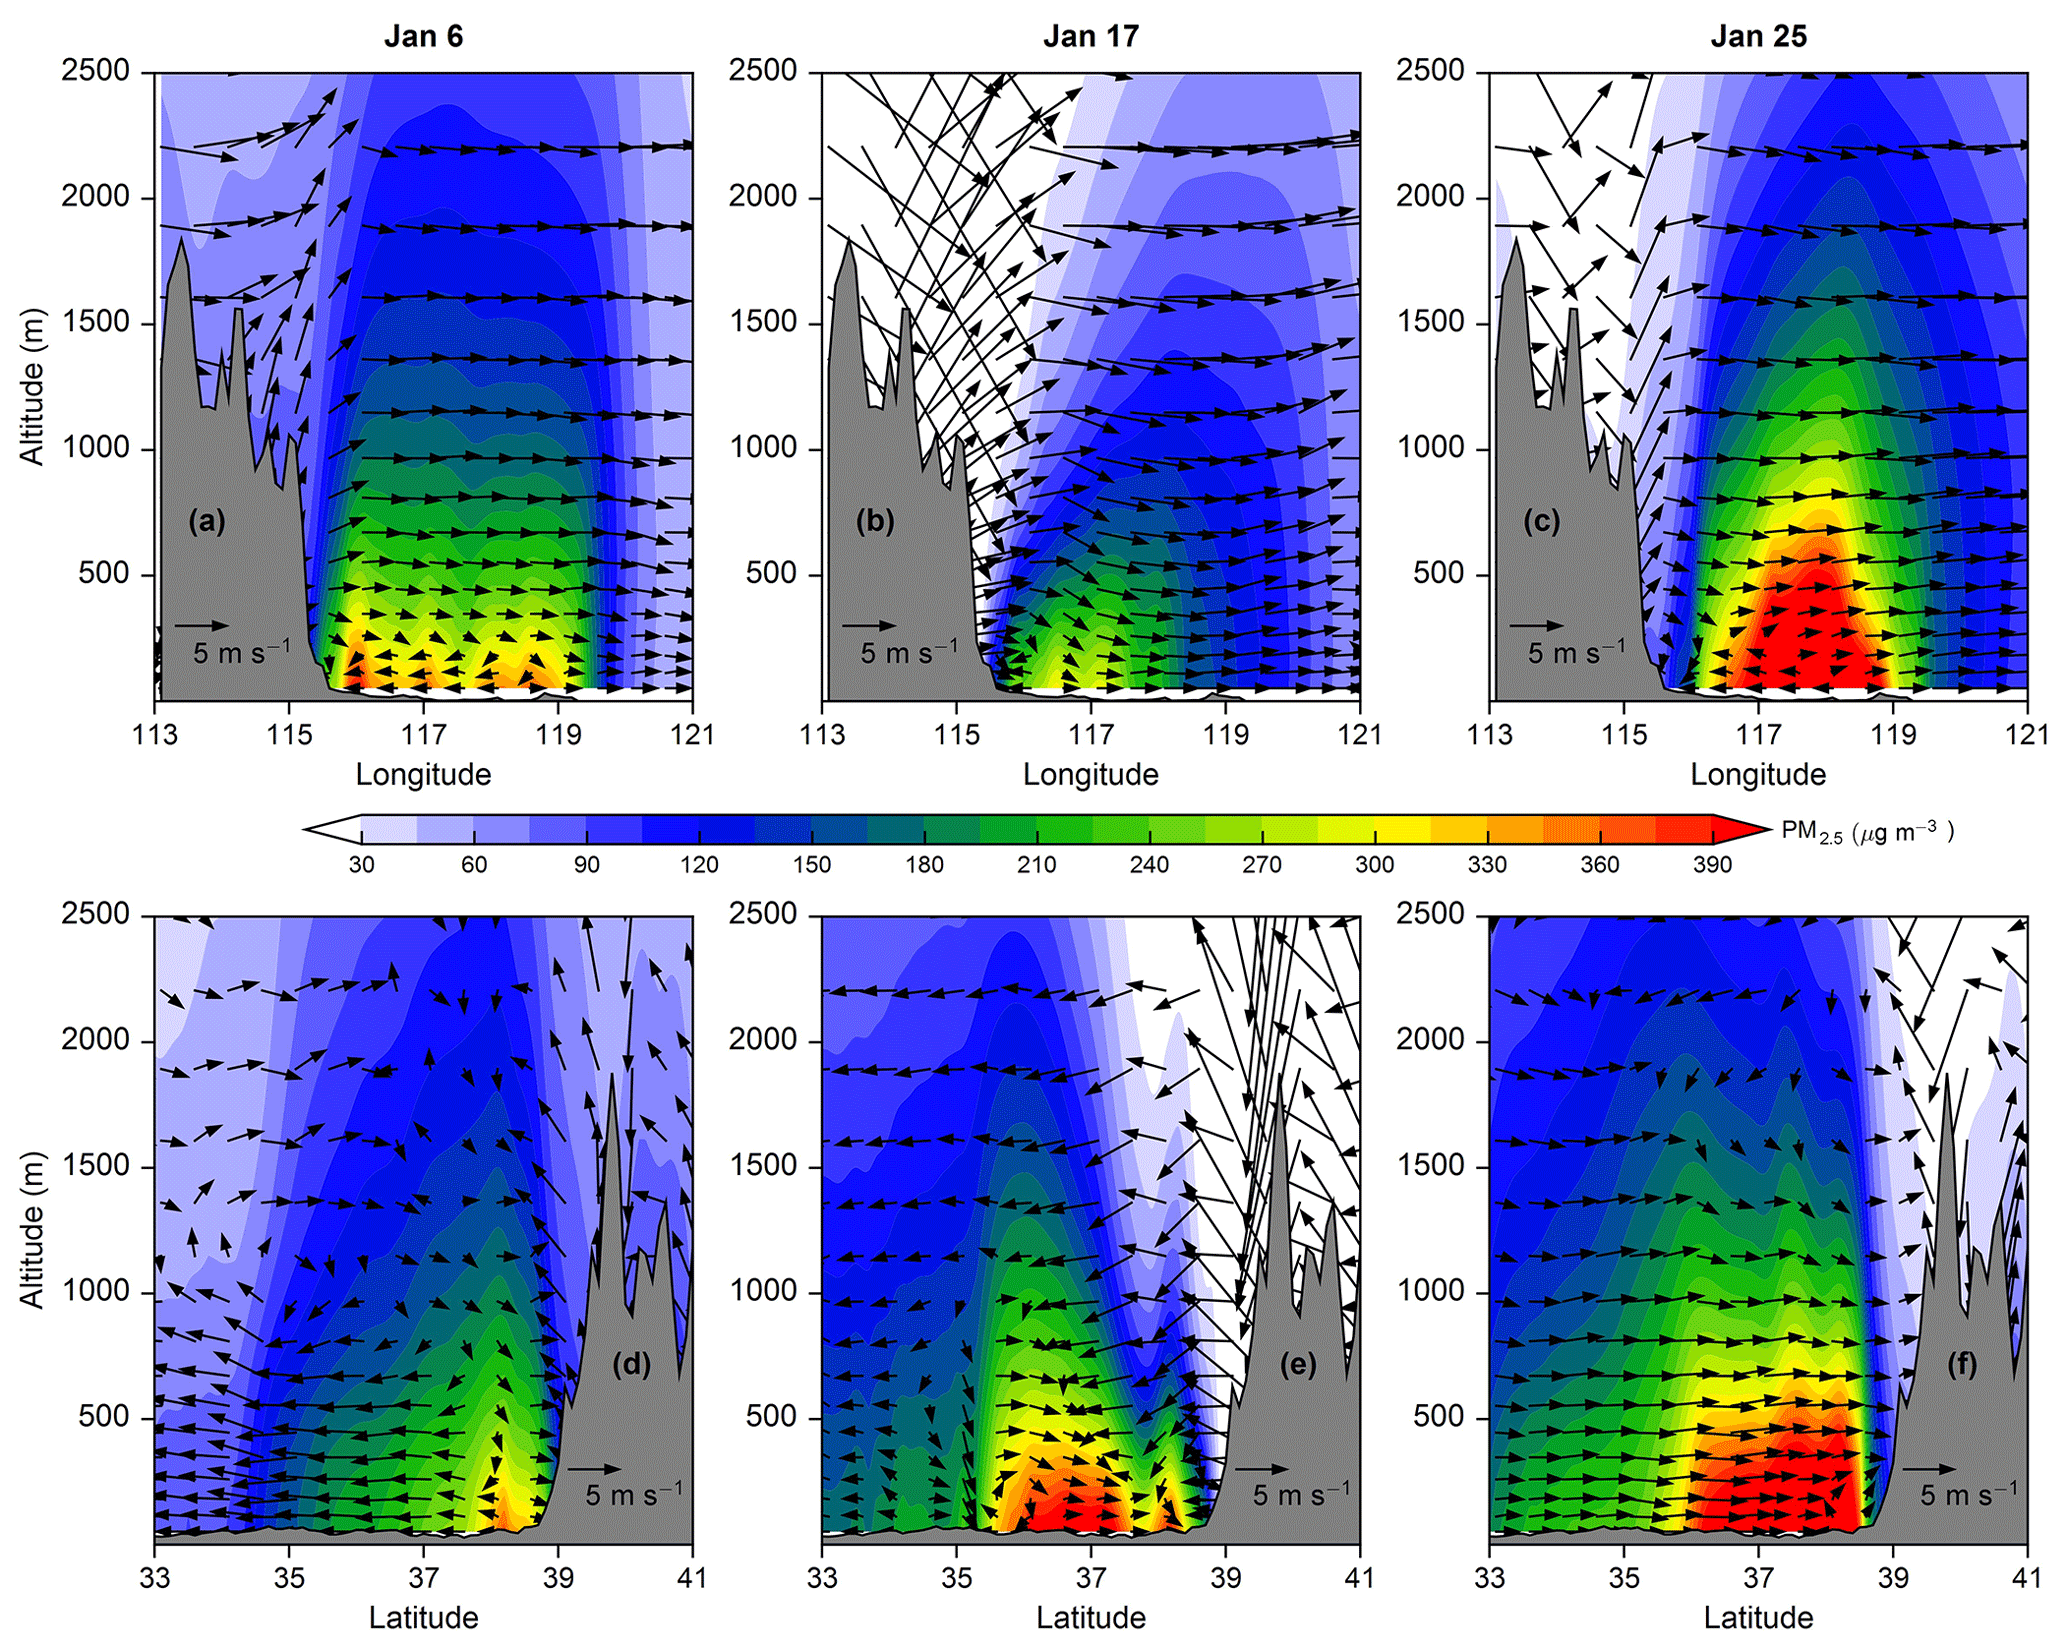
Figure 7Vertical cross section of simulated (CTL) wind field (a–c show zonal wind and 100 times the vertical velocity; d–f show meridional wind and 100 times the vertical velocity) and PM2.5 concentrations during the daytime (09:00–16:00 BJT) on 6, 17, and 25 January.
3.4 Amplification of the local circulation on heavy haze by ARI
Given the considerable impacts of the local circulation and ARI on the distribution of PM2.5 extremes, we further analyzed the potential link between them. According to the location of the cross sections shown in Figs. S3 and 8, the vertical distribution of the wind field and PM2.5 with and without the ARI mechanism and the difference in the horizontal wind speeds induced by the ARI can be seen. For the cross section along the west–east, the ARI strengthened the clockwise vertical circulation near 500 m by simultaneously enhancing the westerly winds in the upper level (500–1000 m) and the easterly winds in the lower level (<500 m; Fig. 8a–c). For the cross section along the south–north, the ARI strengthened the circulation at high altitudes between 33 and 35∘ N by enhancing the upper (900–1500 m) southerly winds and the lower (<500 m) northerly winds (Fig. 8d–f). Moreover, the southerly winds in the circulation formed a wind convergence zone with the northerly winds on its northern side (Fig. 8d–e), and the ARI strengthened this zone by increasing the wind on both sides (Fig. 8f).
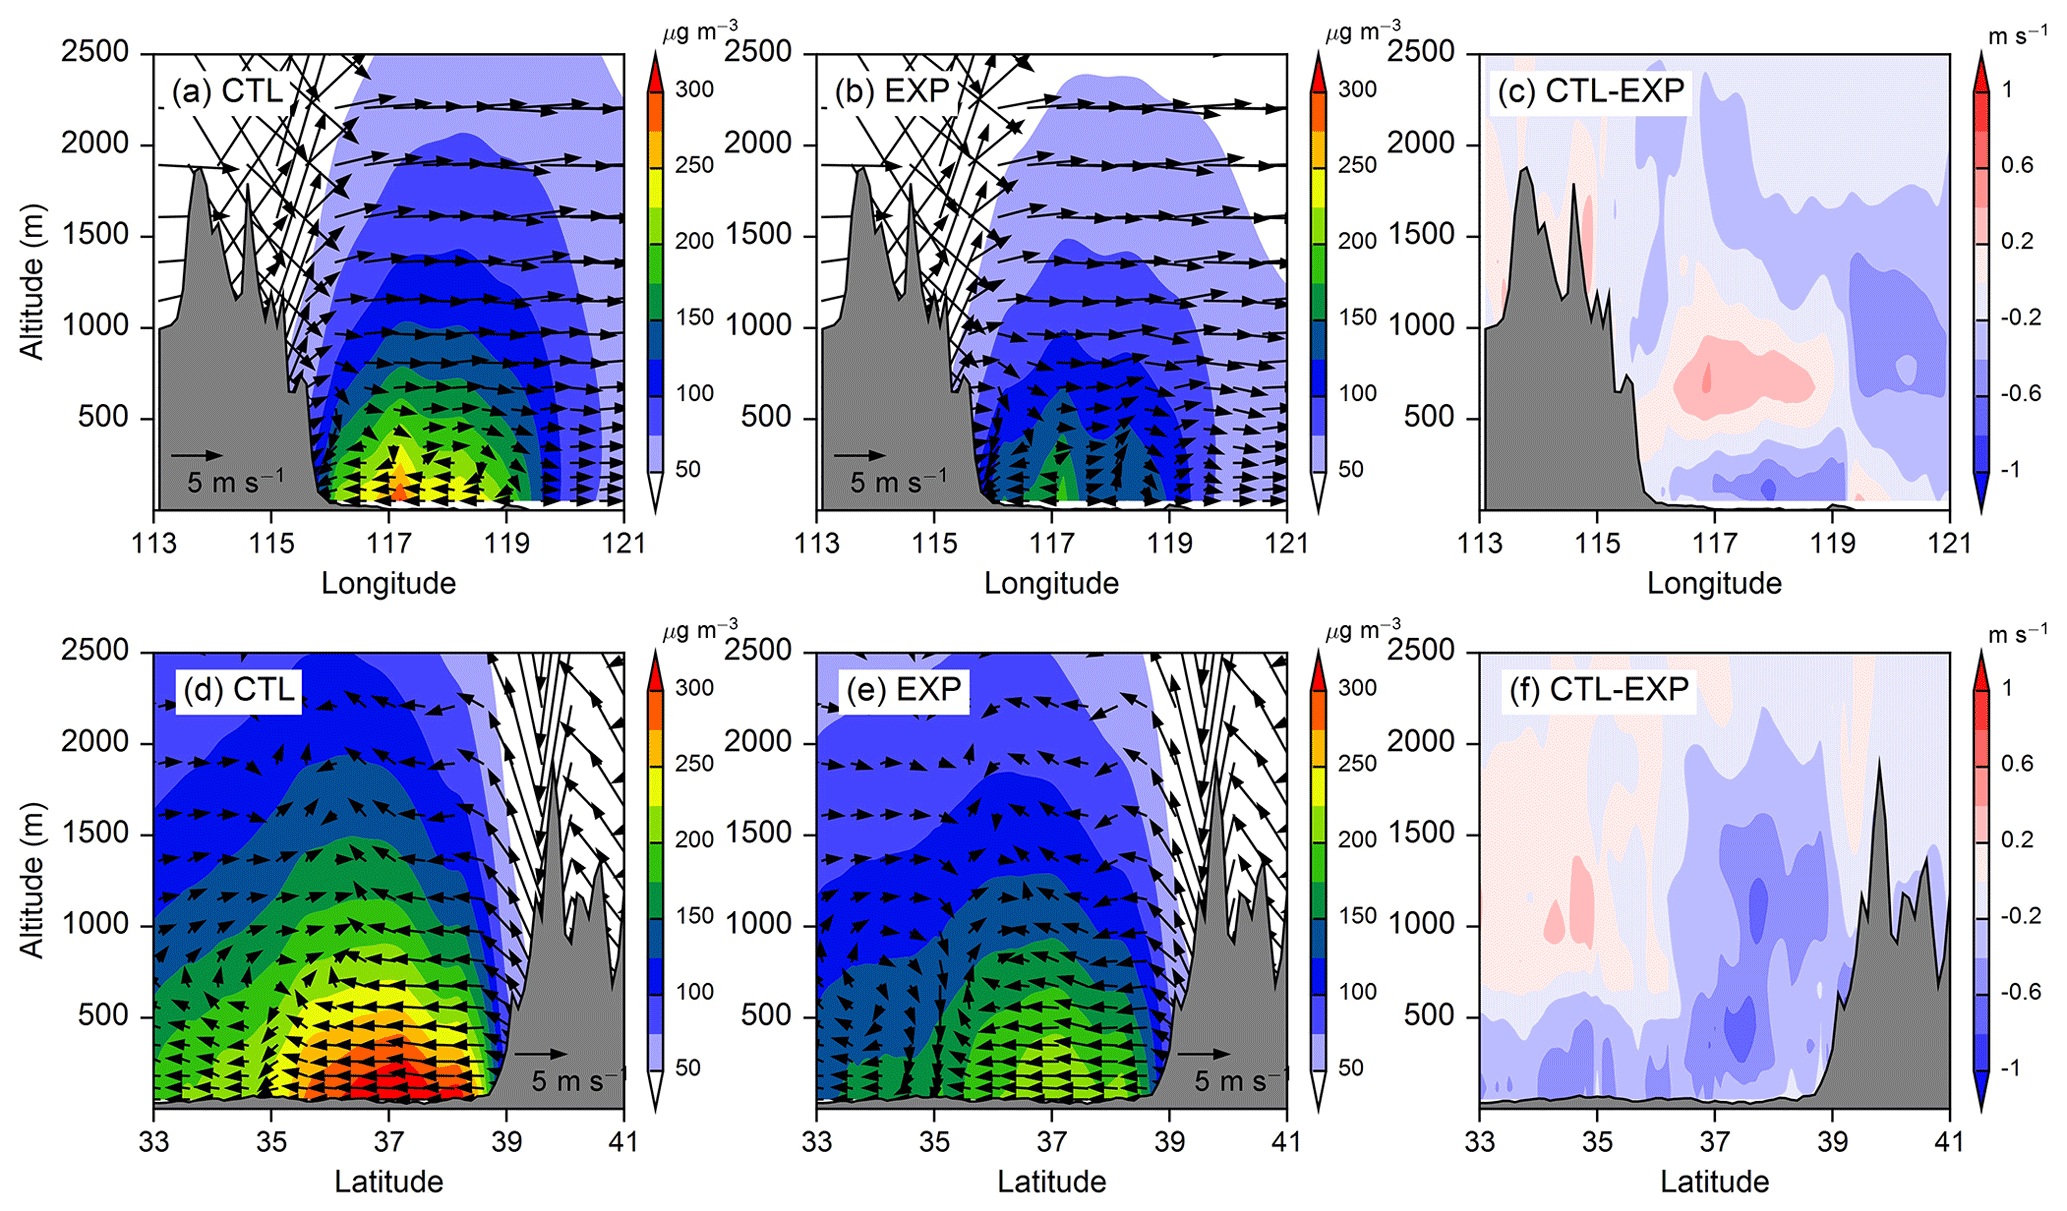
Figure 8Vertical cross section of the simulated (CTL and EXP) daytime (09:00–16:00 BJT) wind field (a–b show zonal wind and 100 times the vertical velocity; d–e show meridional wind and 100 times the vertical velocity) and PM2.5 concentrations, in addition to the differences (CTL − EXP) in the horizontal wind (c shows zonal wind; f shows meridional wind) induced by the ARI during the three pollution periods.
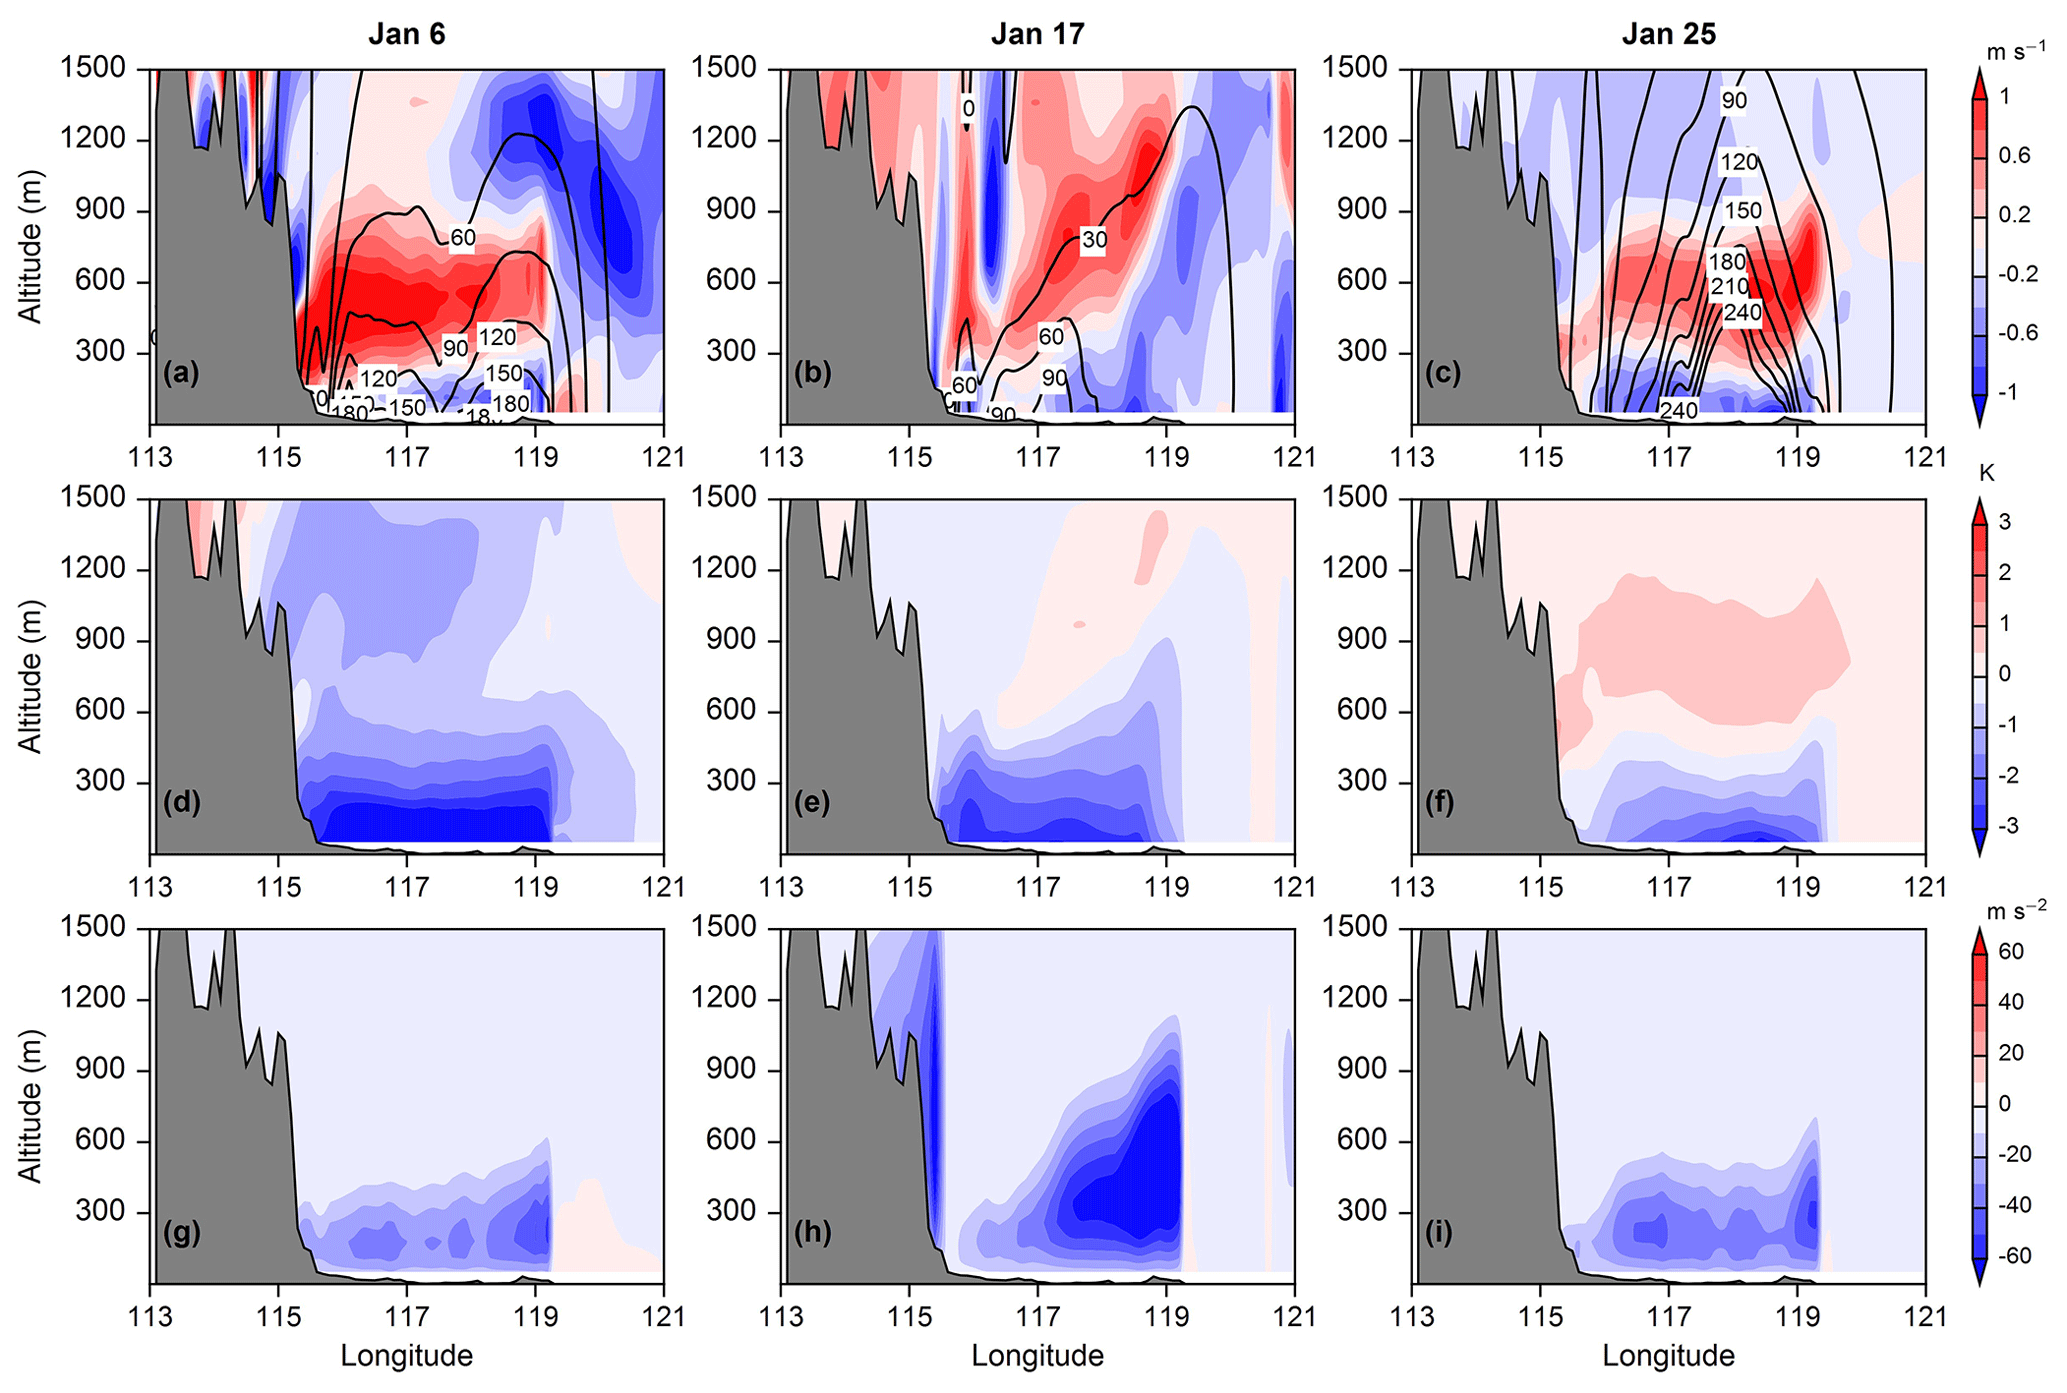
Figure 9Vertical cross section of simulated (a–c) zonal wind (shading) and PM2.5 concentration (contours in µg m−3), (d–f)) PT, and the (g–i) vertical turbulent diffusion coefficient differences (CTL − EXP) induced by the ARI during the daytime (09:00–16:00 BJT) on 6, 17, and 25 January.
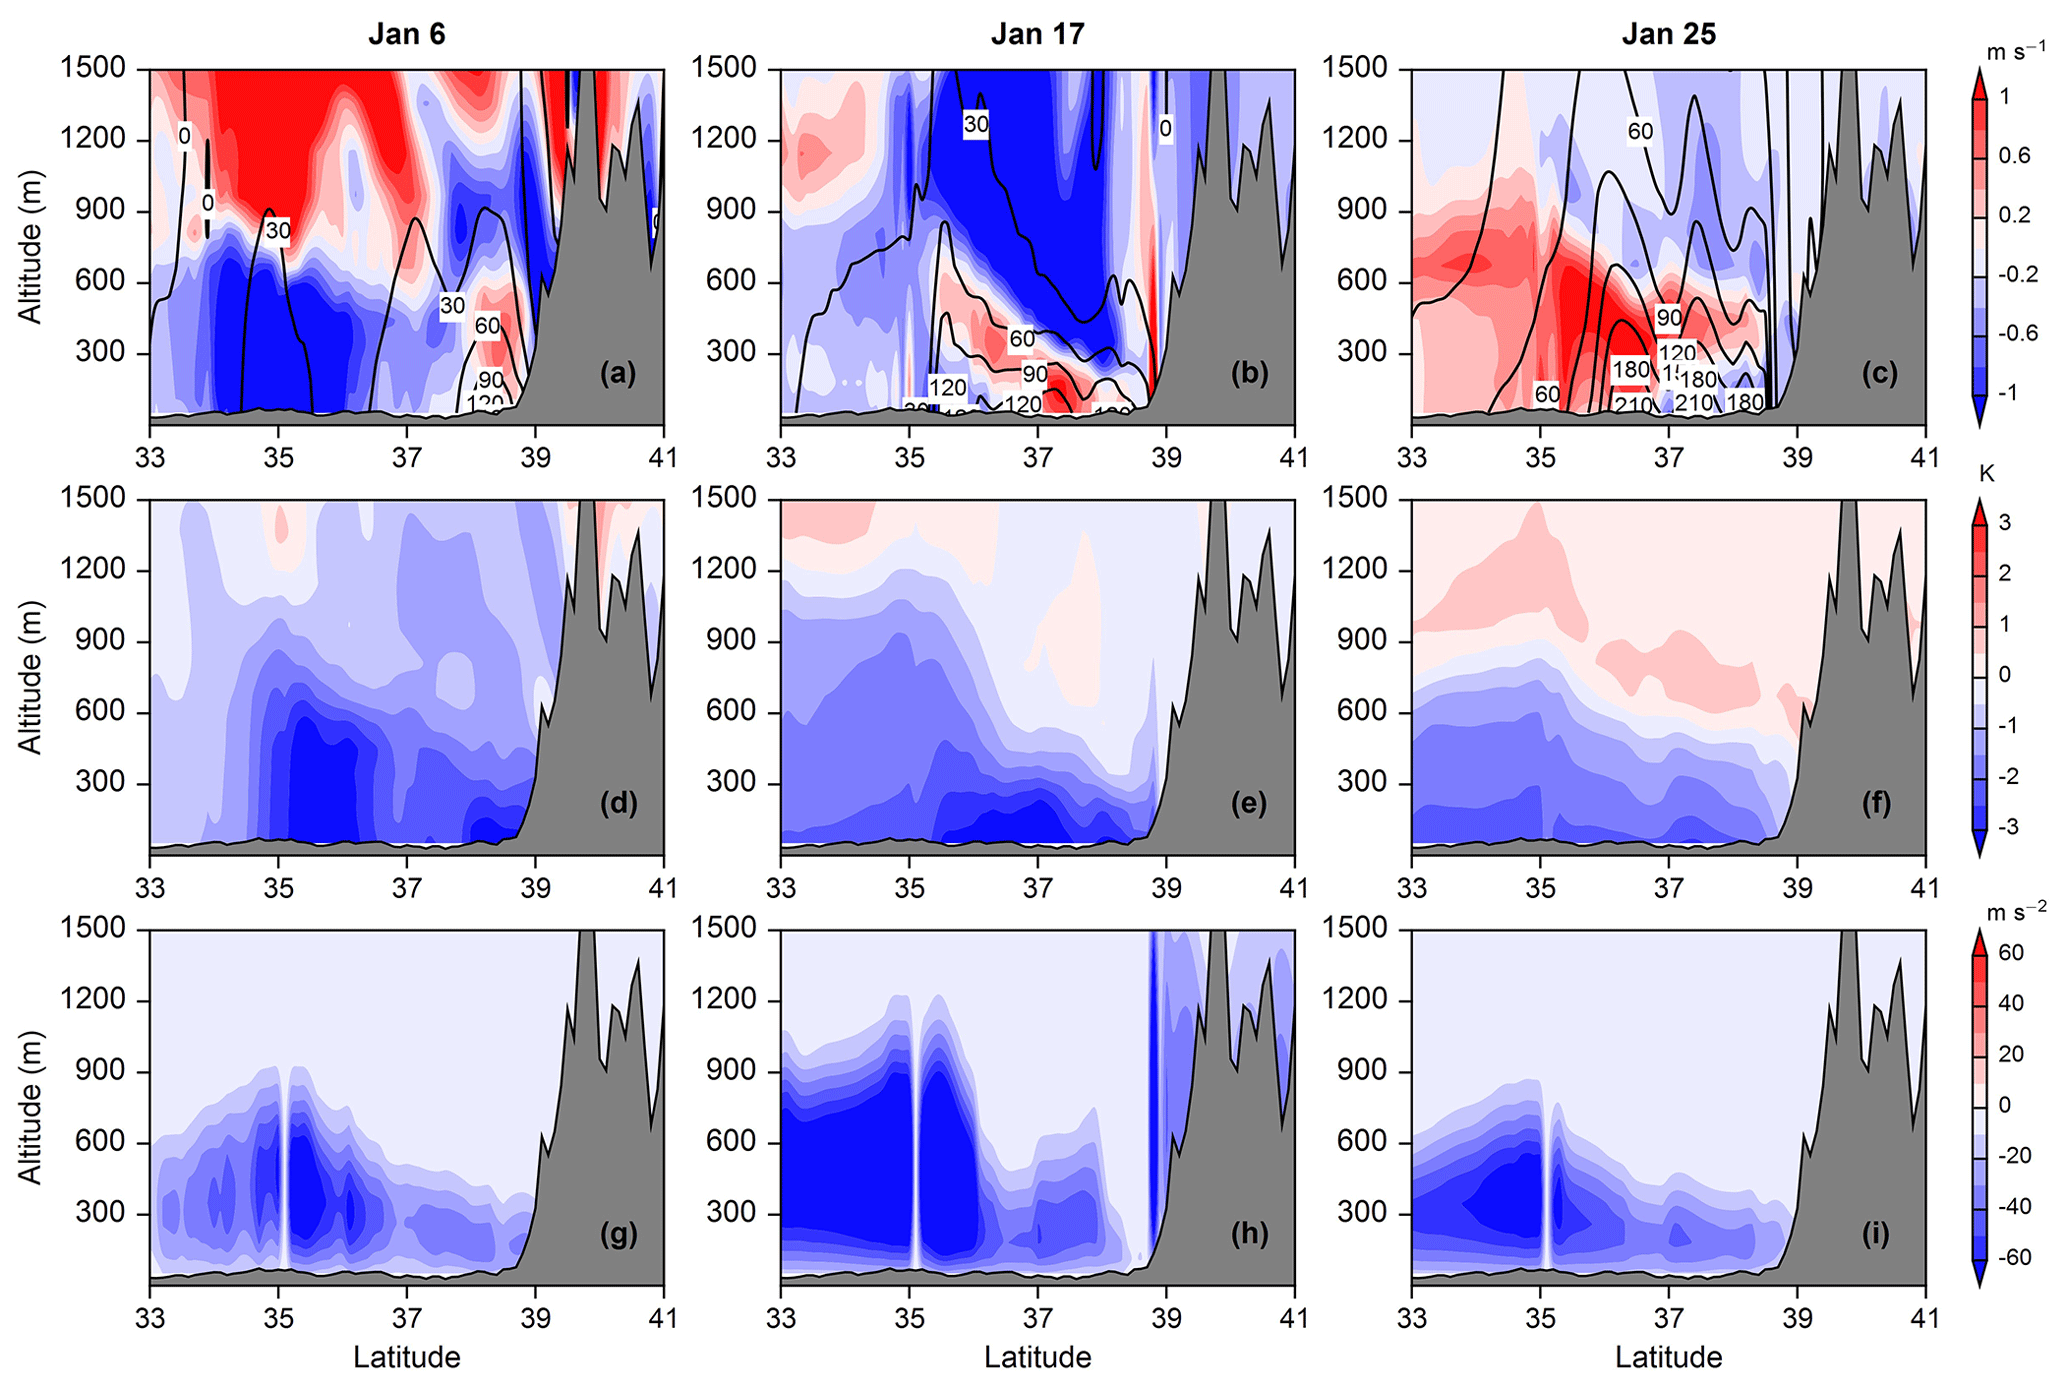
Figure 10Vertical cross section of simulated (a–c) meridional wind (shadings), PM2.5 concentration (contours in µg m−3), (d–f) PT, and the (g–i) vertical turbulent diffusion coefficient differences (CTL − EXP) induced by the ARI during the daytime (09:00–16:00 BJT) on 6, 17, and 25 January.
As the local circulation characteristics were different on the 3 heavy haze days (Fig. 7), it was necessary to investigate the impact of the ARI on each day. As shown in Figs. 9–12, the impacts of the ARI on circulations could be broadly classified into two types, namely strengthened local circulation and weakened horizontal diffusion. First, the ARI significantly strengthened the vertical zonal circulations on 6 and 25 January. The high aerosol concentrations concentrated on the BTH plain during the daytime substantially cooled the lower atmosphere by absorbing and scattering solar radiation, and the widening difference in the atmospheric heating between the mountain slopes and the BTH plain led to a simultaneous strengthening of the westerly winds in the upper level and easterly winds in the lower level. On 6 January, between the eastern Taihang Mountains and 119∘ E, the ARI increased the westerly winds (300–800 m) and the easterly winds (<300 m) by 0.8 and 0.3 m s−1, respectively, on average (Figs. 9a, 11a, d). On 25 January, the ARI increased the westerly winds by 0.6 m s−1 at the same location as on 6 January; meanwhile, the airflow below 300 m changed from weak westerly to easterly under the ARI effect, forming a closed circulation with the upper westerly winds (Figs. 9c, 11c, f). Moreover, the ARI could change the altitude of the circulation. On 6 January, the ARI shifted the vertical circulation downward by about 100 m, according to the wind speed minimum and the height of the wind shear (Fig. 11a, d). The stronger and lower vertical circulation caused a further accumulation of pollutants in the lower level, which then led to substantial cooling of the lower atmosphere (Fig. 9d, f) and weak vertical turbulent diffusion (Fig. 9g, i). The ARI also strengthened the meridional circulations on 6 January, although it did not cause the same downshift as the zonal circulations. Due to the ARI effect, the southerly winds in the upper level and the northerly winds in the lower level were strengthened simultaneously (Figs. 10a, 12a, d). The strengthened vertical circulation in this local area likewise traps the pollutants in the limited space, which further cooled the atmosphere (Fig. 10d) and weakened the turbulent diffusion (Fig. 10g) in the lower atmosphere.
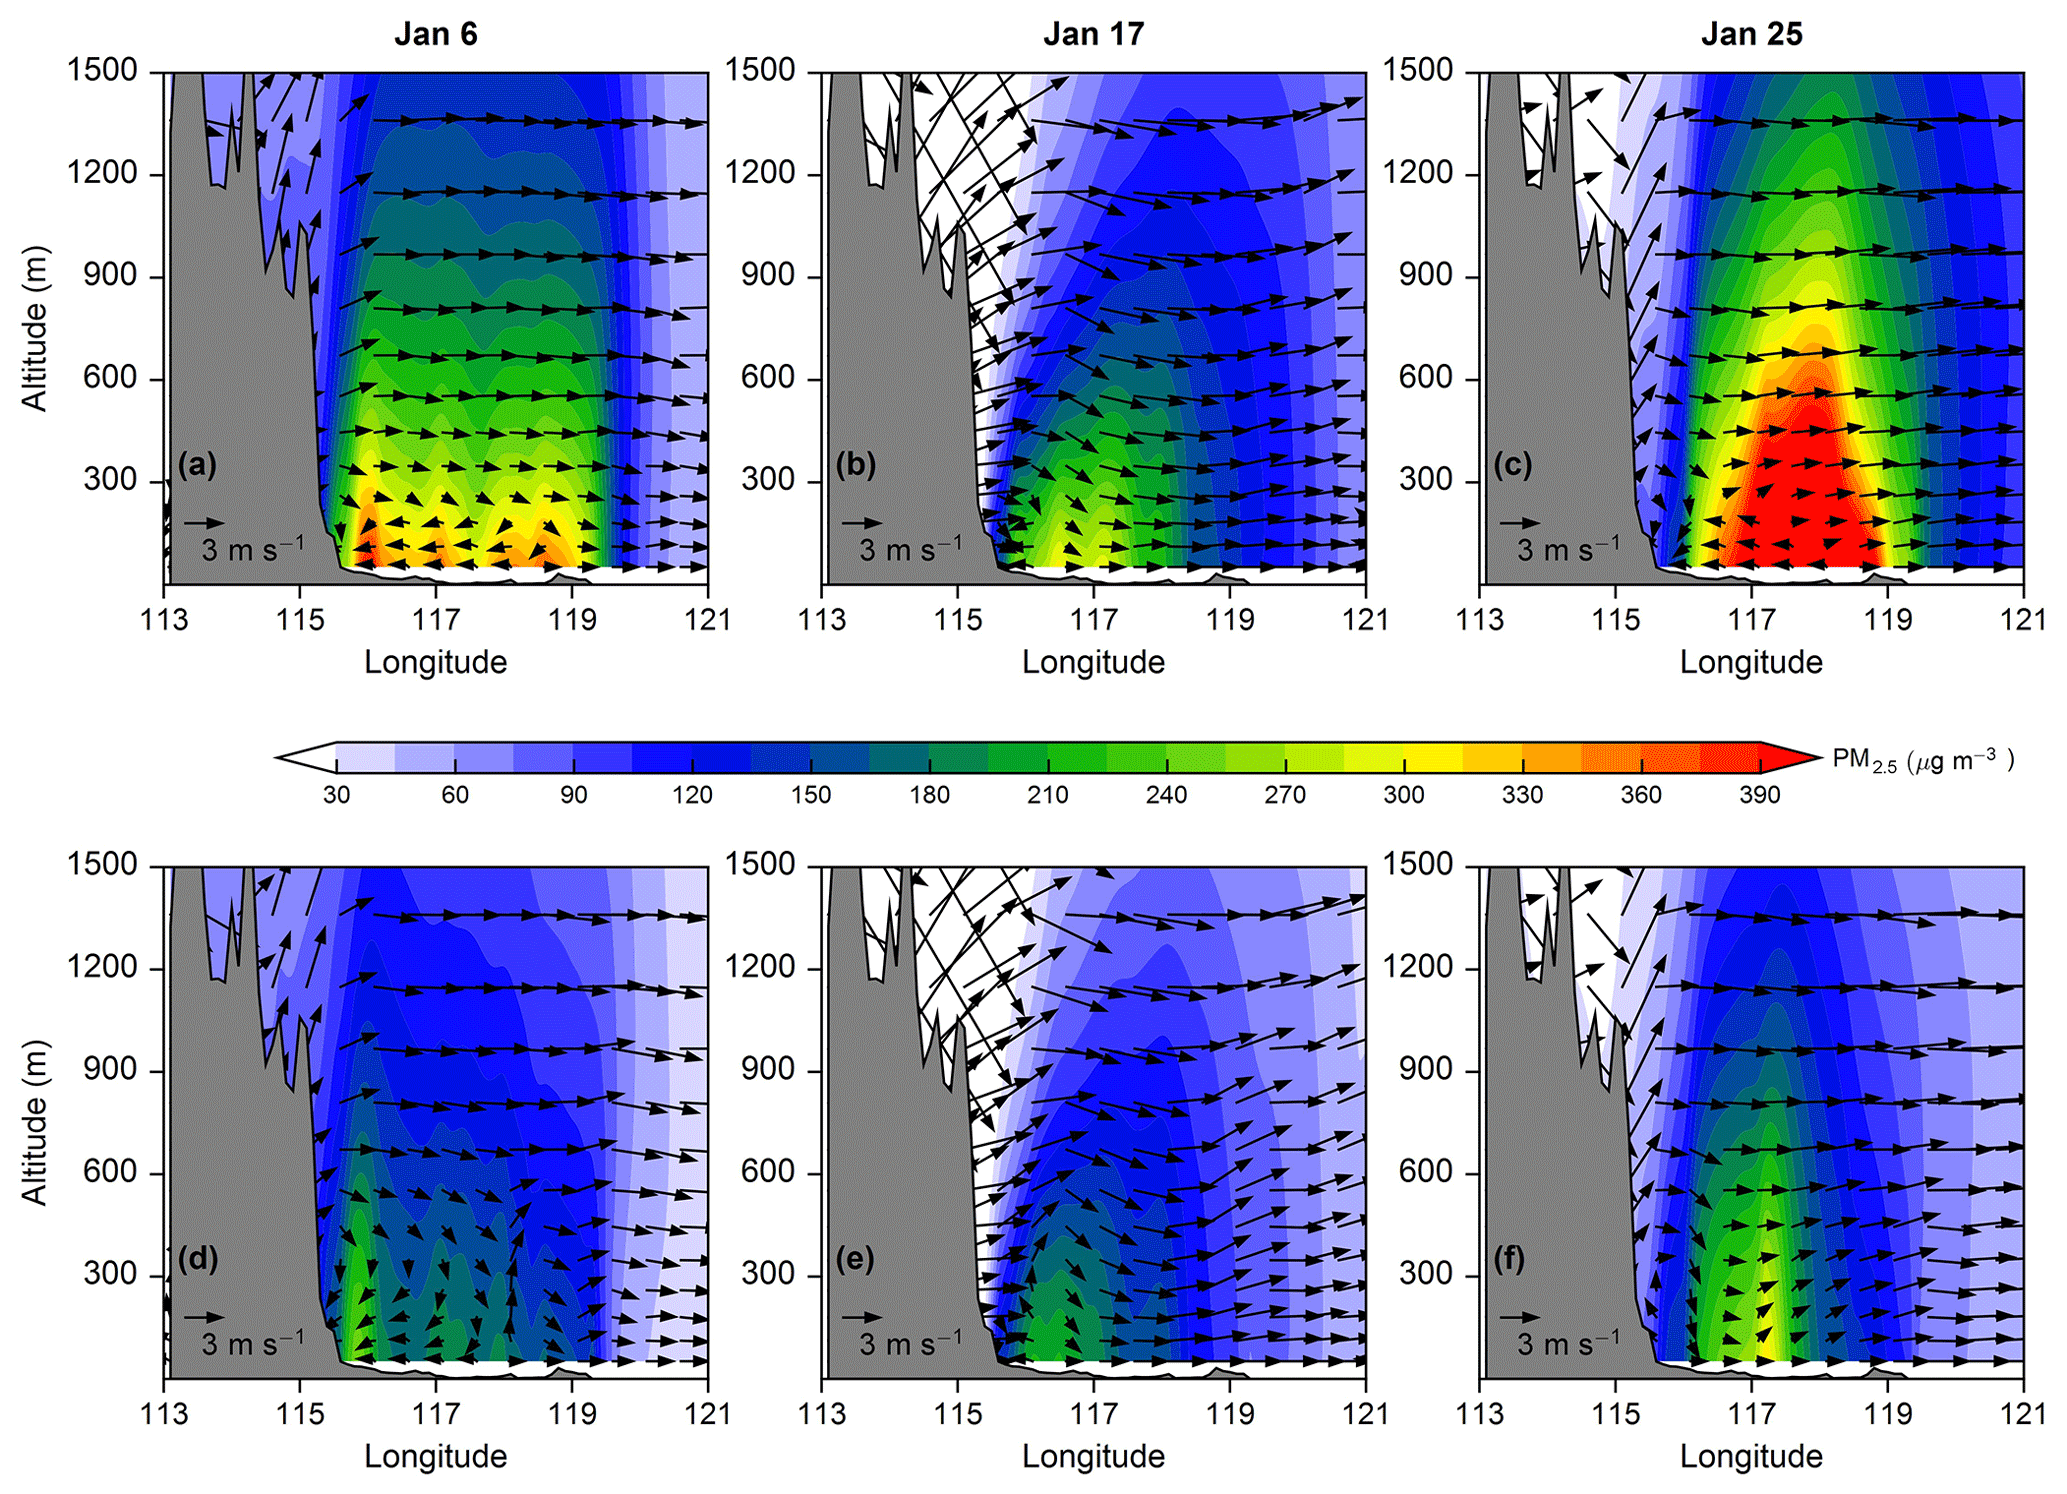
Figure 11Vertical cross section of the simulated wind field (zonal wind and 100 times the vertical velocity) and PM2.5 concentrations from (a–c) CTL and (d–f) EXP during the daytime (09:00–16:00 BJT) on 6, 17, and 25 January.
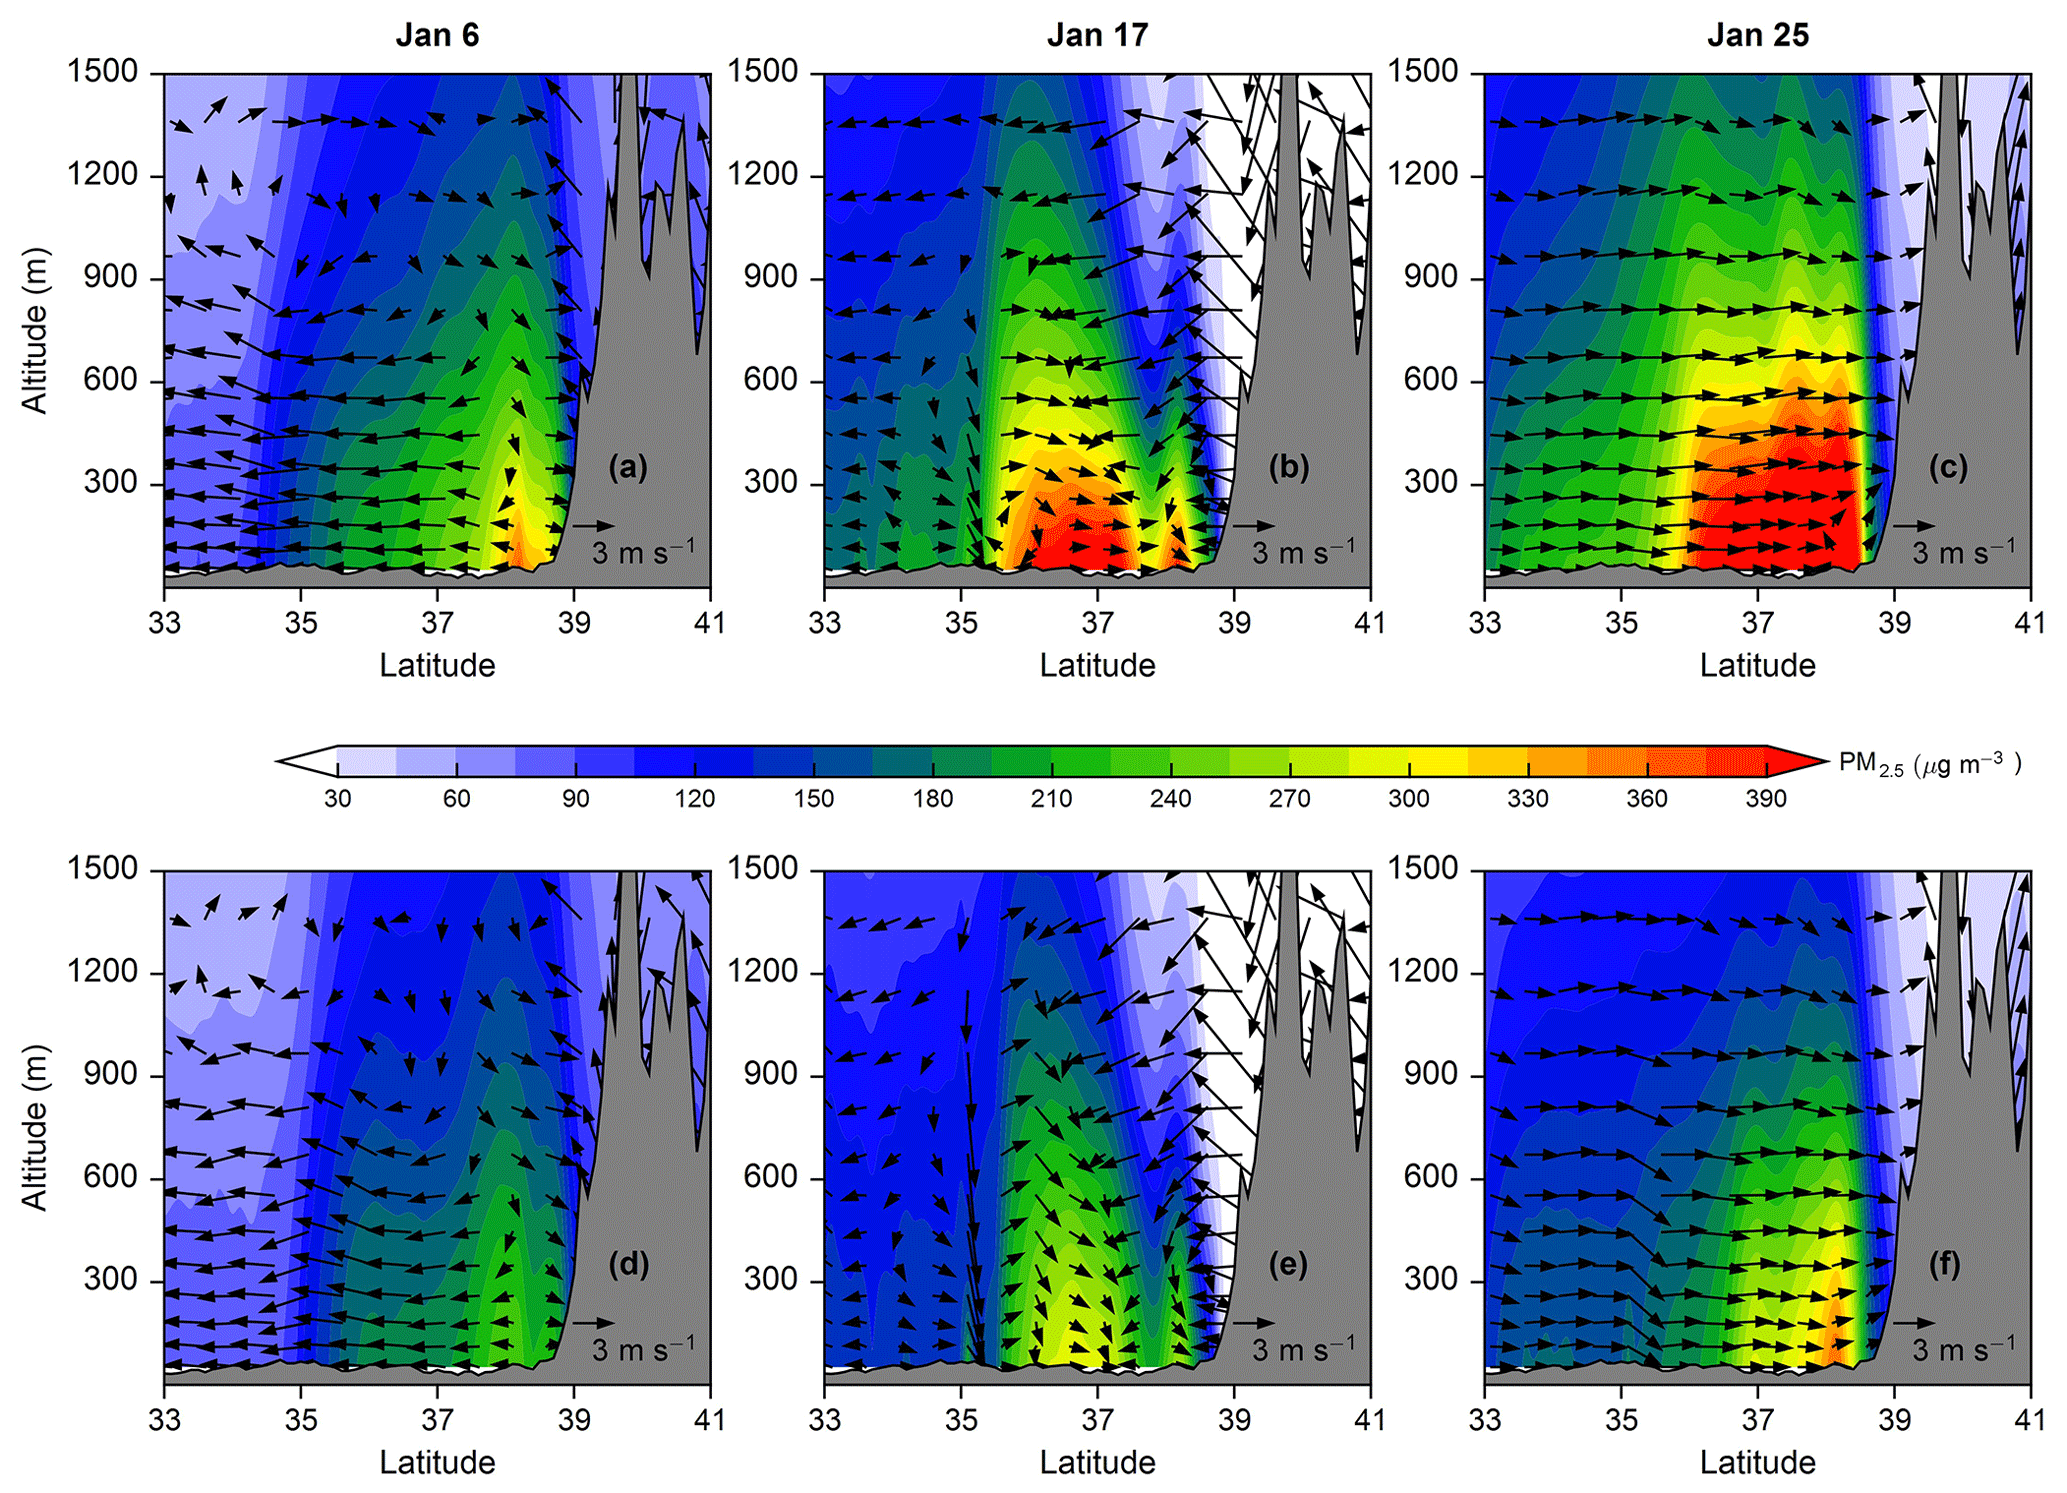
Figure 12Vertical cross section of the simulated wind field (meridional wind and 100 times the vertical velocity) and PM2.5 concentrations from (a–c) CTL and (d–f) EXP during the daytime (09:00–16:00 BJT) on 6, 17, and 25 January.
Second, the ARI weakened the horizontal diffusion of pollutants. For the relatively lightly polluted northern BTH on 17 January, the ARI weakened the westerly winds below 300 m and east of 117∘ E (Figs. 9b, 11b, e), with a maximum wind speed reduction of 1 m s−1. In addition, the ARI enhanced the sinking of airflow near 116∘ E (Fig. 11b, e), promoting the accumulation of aerosols in the lower layer. For the heavily polluted southern BTH on 17 January, the ARI enhanced the wind convergence zone near 37∘ N by simultaneously strengthening the southerly winds south of the convergence line and the northerly winds north of the convergence line (Figs. 10b, 12b, e). At the same time, the ARI pushed this convergence line northward, causing southerly winds to prevail below 200 m over the plain. In addition, the ARI enhanced the southerly winds below 600 m along the south–north on 25 January (Figs. 10c, 12c, f), with an average increase of 0.6 m s−1. Pollutants accumulated locally due to the blockage of the Yanshan Mountains, which then led to the cooling of the lower atmosphere (Fig. 10e–f) and the weakening of the vertical turbulent motion (Fig. 10h–i).
In this study, the link between aerosol, local vertical circulation, and heavy haze pollution in the BTH plain in winter was investigated, based on surface and sounding observations and simulation experiments by the atmospheric chemistry model GRAPES_Meso5.1/CUACE in January 2017.
From a synoptic perspective, the appropriate configurations of the upper, middle, and lower levels provided favorable conditions for the accumulation of pollutants. During the haze pollution, the BTH region was mainly controlled by the zonal westerly airflow or northwesterly airflow in the upper and middle troposphere, and the most polluted central and southern BTH was often dominated by the southwesterly winds in the lower troposphere. At the same time, the blockage of the Taihang and Yanshan mountains significantly weakened the airflow from the west and north, while hindering the northward and westward transport of pollutants.
Under these unfavorable synoptic conditions, the typical local circulation induced by the mountainous topography played a key role in the heavy haze pollution. During the daytime on haze days, a local closed vertical circulation or wind convergence zone was formed in the lower atmosphere between the mountain slopes and the BTH plain under the influence of the mountainous topography, which was not conducive to the vertical and horizontal diffusion of pollutants. Both the intensity and location of the vertical circulation played an important role in the pollutant distribution. The circulation with a high intensity and low altitude could constrain the near-surface pollutants to a more limited area. More importantly, the superposition of the ARI mechanism and local circulation could significantly aggravate the haze pollution. According to the simulation results of this study, the ARI mainly amplified the impacts of local vertical circulation on haze in two ways, namely by strengthening the local circulation and by weakening the horizontal diffusion. For the clockwise vertical circulation, the ARI not only strengthened both the upper westerly winds and the lower easterly winds but also pressed the circulation toward the lower atmosphere; for the wind convergence zone, the ARI strengthened the southerly and northerly winds on both sides of the convergence line and simultaneously pushed the convergence line more northward. The ARI amplified the inhibition of the local circulation on the vertical and horizontal diffusion of pollutants through these two pathways, leading to pollutants recirculating in a more limited space. With the superposition of the ARI and local circulation, aerosols accumulated rapidly in the lower atmosphere, which led to more stable atmospheric stratification and subsequent deterioration of haze pollution.
All raw data can be provided by the corresponding authors upon request.
The supplement related to this article is available online at: https://doi.org/10.5194/acp-23-8325-2023-supplement.
HW and XZ conceived the idea. YP and HW designed the experiment. YP ran the model and wrote the draft. ZL and WZ provided the observation data and helped perform the analysis, with constructive discussions. YP, SL, and CH analyzed the data. YP, HW, and HC reviewed and edited the paper.
The contact author has declared that none of the authors has any competing interests.
Publisher’s note: Copernicus Publications remains neutral with regard to jurisdictional claims in published maps and institutional affiliations.
This research has been supported by the Major Project (grant no. 42090030) from the National Natural Science Foundation of China, the National Key Research and Development Program of China (grant no. 2019YFC0214601), and the Distinguished Young Scholars (grant no. 41825011) from the National Natural Science Foundation of China.
This paper was edited by Nikos Hatzianastassiou and reviewed by I. Pérez and one anonymous referee.
Boylan, J. W. and Russell, A. G.: PM and light extinction model performance metrics, goals, and criteria for three-dimensional air quality models, Atmos. Environ., 40, 4946–4959, https://doi.org/10.1016/j.atmosenv.2005.09.087, 2006.
Chen, D. H., Xue, J. S., Yang, X. S., Zhang, H. L., Shen, X. S., Hu, J. L., Wang, Y., Ji, L. R., and Chen, J. B.: New generation of multi-scale NWP system (GRAPES): general scientific design, Chin. Sci. Bull., 53, 3433–3445, https://doi.org/10.1007/s11434-008-0494-z, 2008.
Chen, Y., Zhao, C., Zhang, Q., Deng, Z., Huang, M., and Ma, X.: Aircraft study of mountain chimney effect of Beijing, China, J. Geophys. Res., 114, D08306, https://doi.org/10.1029/2008JD010610, 2009.
Chou, M. D., Suarez, M. J., Ho, C. H., Yan, M. M. H., and Lee, K. T.: Parameterizations for cloud overlapping and shortwave single-scattering properties for use in general circulation and cloud ensemble models, J. Climate, 11, 202–214, 1998.
Ding, A. J., Huang, X., Nie, W., Sun, J. N., Kerminen, V. M., Petäjä, T., Su, H., Cheng, Y. F., Yang, X.-Q., Wang, M. H., Chi, X. G., Wang, J. P., Virkkula, A., Guo, W. D., Yuan, J., Wang, S. Y., Zhang, R. J., Wu, Y. F., Song, Y., Zhu, T., Zilitinkevich, S., Kulmala, M., and Fu, C. B.: Enhanced haze pollution by black carbon in megacities in China, Geophys. Res. Lett., 43, 2873–2879, https://doi.org/10.1002/2016GL067745, 2016.
Ek, M. B., Mitchell, K. E., Lin, Y., Rogers, E., Grunmann, P., Koren, V., Gayno, G., and Tarpley, J. D.: Implementation of Noah land surface model advances in the National Centres for Environmental Prediction operational mesoscale Eta model, J. Geophys. Res., 108, 8851, https://doi.org/10.1029/2002JD003296, 2003.
Fu, G. Q., Xu, W. Y., Yang, R. F., Li, J. B., and Zhao, C. S.: The distribution and trends of fog and haze in the North China Plain over the past 30 years, Atmos. Chem. Phys., 14, 11949–11958, https://doi.org/10.5194/acp-14-11949-2014, 2014.
Gao, M., Liu, Z., Wang, Y., Lu, X., Ji, D., and Wang, L.: Distinguishing the roles of meteorology, emission control measures, regional transport, and co-benefits of reduced aerosol feedback in “APEC” Blue, Atmos. Environ., 167, 476–486, https://doi.org/10.1016/j.atmosenv.2017.08.054, 2017.
Gong, S. L. and Zhang, X. Y.: CUACE/Dust – an integrated system of observation and modeling systems for operational dust forecasting in Asia, Atmos. Chem. Phys., 8, 2333–2340, https://doi.org/10.5194/acp-8-2333-2008, 2008.
Hong, S. Y. and Pan, H. L.: Nonlocal boundary layer vertical diffusion in a medium-range forecast model, Mon. Weather Rev., 124, 2322–2339, https://doi.org/10.1175/1520-0493(1996)124<2322:NBLVDI>2.0.CO;2, 1996.
Huang, X., Wang, Z., and Ding, A.: Impact of aerosol-PBL interaction on haze pollution: Multiyear observational evidences in North China, Geophys. Res. Lett., 45, 8596–8603, https://doi.org/10.1029/2018GL079239, 2018.
Huang, X., Ding, A., Wang, Z. Ding, K., Gao, J., Chai, F., and Fu, C.: Amplified transboundary transport of haze by aerosol–boundary layer interaction in China, Nat. Geosci., 13, 428–434, https://doi.org/10.1038/s41561-020-0583-4, 2020.
Kain, J. S.: The Kain-Fritsch convective parameterization: An update, J. Appl. Meteor., 43, 170–181, 2004.
Li, Z., Guo, J., Ding, A., Liao, H., Liu, J., Sun, Y., Wang, T., Xue, H., Zhang, H., and Zhu, B.: Aerosol and boundary-layer interactions and impact on air quality, Natl. Sci. Rev., 4, 810–833, https://doi.org/10.1093/nsr/nwx117, 2017.
Liu, Q., Jia, X., Quan, J., Li, J., Li, X., Wu, Y., Chen, D., Wang, Z., and Liu, Y.: New positive feedback mechanism between boundary layer meteorology and secondary aerosol formation during severe haze events, Sci. Rep., 8, 6095, https://doi.org/10.1038/s41598-018-24366-3, 2018.
Liu, S., Liu, Z., Li, J., Wang, Y., Ma, Y., Sheng, L., Liu, H., Liang, F., Xin, G., and Wang, J.: Numerical simulation for the coupling effect of local atmospheric circulations over the area of Beijing, Tianjin and Hebei Province, Sci. China Ser. D-Earth Sci, 52, 382–392, https://doi.org/10.1007/s11430-009-0030-2, 2009.
Lo, J. C. F., Lau, A. K. H., Fung, J. C. H., and Chen, F.: Investigation of enhanced cross-city transport and trapping of air pollutants by coastal and urban land-sea breeze circulations, J. Geophys. Res., 111, D14104, https://doi.org/10.1029/2005JD006837, 2006.
Mlawer, E. J., Taubman, S. J., Brown, P. D., Iacono, M. J., and Clough, S. A.: Radiative transfer for inhomogeneous atmosphere: RRTM, a validated correlated-k model for the longwave, J. Geophys. Res., 102, 16663–16682, https://doi.org/10.1029/97JD00237, 1997.
Miao, Y., Liu, S., Zheng, Y., Wang, S., Chen, B., Zheng, H., and Zhao, J.: Numerical study of the effects of local atmospheric circulations on a pollution event over Beijing–Tianjin–Hebei, China, J. Environ. Sci, 30, 9–20, https://doi.org/10.1016/j.jes.2014.08.025, 2015.
Miao, Y., Li, J., Miao, S., Che, H., Wang, Y., Zhang, X., Zhu, R., and Liu, S.: Interaction between planetary boundary layer and PM2.5 pollution in megacities in China: a Review, Curr. Pollut. Rep., 5, 261–271, https://doi.org/10.1007/s40726-019-00124-5, 2019.
Morris, R. E., McNally, D. E., Tesche, T. W., Tonnesen, G., Boylan, J. W., and Brewer, P.: Preliminary Evaluation of the Community Multiscale Air Quality Model for 2002 over the Southeastern United States, J. Air Waste Manage. Assoc., 55, 1694–1708, https://doi.org/10.1080/10473289.2005.10464765, 2005.
Peng, Y., Wang, H., Hou, M., Jiang, T., Zhang, M., Zhao, T., and Che, H.: Improved method of visibility parameterization focusing on high humidity and aerosol concentrations during fog–haze events: Application in the GRAPES_CAUCE model in Jing-Jin-Ji, China, Atmos. Environ., 222, 117139, https://doi.org/10.1016/j.atmosenv.2019.117139, 2020.
Peng, Y., Wang, H., Zhang, X., Zhao, T., Jiang, T., Che, H., Zhang, X., Zhang, W., and Liu, Z.: Impacts of PBL schemes on PM2.5 simulation and their responses to aerosol-radiation feedback in GRAPES_CUACE model during severe haze episodes in Jing-Jin-Ji, China, Atmos. Res., 248, 105268, https://doi.org/10.1016/j.atmosres.2020.105268, 2021.
Peng, Y., Wang, H., Zhang, X., Zheng, Y., Zhang, X., Zhang, W., Liu, Z., Gui, K., Liu, H., Wang, Y., and Che, H.: Aerosol-radiation interaction in the operational atmospheric chemistry model GRAPES_Meso5.1/CUACE and its impacts on mesoscale NWP in Beijing-Tianjin-Hebei, China, Atmos. Res., 280, 106402, https://doi.org/10.1016/j.atmosres.2022.106402, 2022.
Quan, J., Gao, Y., Zhang, Q., Tie, X., Cao, J., Han, S., Meng, J., Chen, P., and Zhao, D.: Evolution of planetary boundary layer under different weather conditions, and its impact on aerosol concentrations, Particuology, 11, 34–40, https://doi.org/10.1016/j.partic.2012.04.005, 2013.
Quan, J., Dou, Y., Zhao, X., Liu, Q., Sun, Z., Pan, Y., Jia, X., Cheng, Z., Ma, P., Su, J., Xin, J., and Liu, Y.: Regional atmospheric pollutant transport mechanisms over the North China Plain driven by topography and planetary boundary layer processes, Atmos. Environ., 221, 117098, https://doi.org/10.1016/j.atmosenv.2019.117098, 2020.
Stockwell, W. R., Middleton, P., Chang, J. S., and Tang, X.: The second generation regional acid deposition model chemical mechanism for regional air quality modeling, J. Geophys. Res., 95, 16343–16367, https://doi.org/10.1029/JD095iD10p16343, 1990.
Sun, Y., Song, T., Tang, G., and Wang, Y.: The vertical distribution of PM2.5 and boundary-layer structure during summer haze in Beijing, Atmos. Environ., 74, 413–421, https://doi.org/10.1016/j.atmosenv.2013.03.011, 2013.
Thompson, G., Field, P. R., Rasmussen, R. M., and Hall, W. D.: Explicit Forecasts of Winter Precipitation Using an Improved Bulk Microphysics Scheme. Part II: Implementation of a New Snow Parameterization, Mon. Weather Rev., 136, 5095–5115, https://doi.org/10.1175/2008MWR2387.1, 2008.
Wang, D., Jiang, B., Lin, W., and Gu, F.: Effects of aerosol-radiation feedback and topography during an air pollution event over the North China Plain during December 2017, Atmos. Pollut. Res., 10, 587–596, https://doi.org/10.1016/j.apr.2018.10.006, 2019.
Wang, H., Gong, S., Zhang, H., Chen, Y., Shen, X., Chen, D., Xue, J., Shen, Y., Wu, X., and Jin, Z.: A new-generation sand and dust storm forecasting system GRAPES_CUACE/Dust: Model development, verification and numerical simulation, Chin. Sci. Bull., 55, 635–649, https://doi.org/10.1007/s11434-009-0481-z, 2010.
Wang, H., Xue, M., Zhang, X. Y., Liu, H. L., Zhou, C. H., Tan, S. C., Che, H. Z., Chen, B., and Li, T.: Mesoscale modeling study of the interactions between aerosols and PBL meteorology during a haze episode in Jing–Jin–Ji (China) and its nearby surrounding region – Part 1: Aerosol distributions and meteorological features, Atmos. Chem. Phys., 15, 3257–3275, https://doi.org/10.5194/acp-15-3257-2015, 2015a.
Wang, H., Shi, G. Y., Zhang, X. Y., Gong, S. L., Tan, S. C., Chen, B., Che, H. Z., and Li, T.: Mesoscale modelling study of the interactions between aerosols and PBL meteorology during a haze episode in China Jing–Jin–Ji and its near surrounding region – Part 2: Aerosols' radiative feedback effects, Atmos. Chem. Phys., 15, 3277–3287, https://doi.org/10.5194/acp-15-3277-2015, 2015b.
Wang, H., Peng, Y., Zhang, X., Liu, H., Zhang, M., Che, H., Cheng, Y., and Zheng, Y.: Contributions to the explosive growth of PM2.5 mass due to aerosol–radiation feedback and decrease in turbulent diffusion during a red alert heavy haze in Beijing–Tianjin–Hebei, China, Atmos. Chem. Phys., 18, 17717–17733, https://doi.org/10.5194/acp-18-17717-2018, 2018.
Wang, H., Zhang, X. Y., Wang, P., Peng, Y., Zhang, W., Liu, Z., Han, C., Li, S., Wang, Y., Che, H., Huang, L., Liu, H., Zhang, L., Zhou, C., Ma, Z., Chen, F., Ma, X., Wu, X., Zhang, B., and Shen, X.: Chemistry-Weather Interacted Model System GRAPES_Meso5.1/CUACE CW V1.0: Development, Evaluation and Application in Better Haze-fog Prediction in China, J. Adv. Model. Earth Syst., 14, e2022MS003222, https://doi.org/10.1029/2022MS003222, 2022.
Wu, P., Ding, Y. H., and Liu, Y. J.: Atmospheric circulation and dynamic mechanism for persistent haze events in the Beijing–Tianjin–Hebei region, Adv. Atmos. Sci., 34, 429–440, https://doi.org/10.1007/s00376-016-6158-z, 2017.
Zhang, B., Wang, Y., and Hao, J.: Simulating aerosol–radiation–cloud feedbacks on meteorology and air quality over eastern China under severe haze conditionsin winter, Atmos. Chem. Phys., 15, 2387–2404, https://doi.org/10.5194/acp-15-2387-2015, 2015.
Zhang, D. and Anthes, R. A.: A high-resolution model of the planetary boundary layer–sensitivity tests and comparisons with SESAME-79 Data, J. Appl. Meteorol., 21, 1594–1609, https://doi.org/10.1175/1520-0450(1982)021<1594:AHRMOT>2.0.CO;2, 1982.
Zhang, Q., Zheng, Y., Tong, D., Shao, M., Wang, S., Zhang, Y., Xu, X., Wang, J., He, H., Liu, W., Ding, Y., Lei, Y., Li, J., Wang, Z., Zhang, X., Wang, Y., Cheng, J., Liu, Y., Shi, Q., and Hao, J.: Drivers of improved PM2.5 air quality in China from 2013 to 2017, P. Natl. Acad. Sci. USA, 116, 201907956, https://doi.org/10.1073/pnas.1907956116, 2019.
Zhang, W., Wang, H., Zhang, X., Peng, Y., Zhong, J., Wang, Y., and Zhao, Y.: Evaluating the contributions of changed meteorological conditions and emission to substantial reductions of PM2.5 concentration from winter 2016 to 2017 in Central and Eastern China, Sci. Total Environ., 716, 136892, https://doi.org/10.1016/j.scitotenv.2020.136892, 2020.
Zhang, W., Zhang, X., and Wang, H.: The role of aerosol-radiation interaction in the meteorology prediction at the weather scale in the numerical weather prediction model, Geophys. Res. Lett., 49, e2021GL097026, https://doi.org/10.1029/2021GL097026, 2022.
Zhang, X., Xu, X., Ding, Y., Liu, Y., Zhang, H., Wang, Y., and Zhong, J.: The impact of meteorological changes from 2013 to 2017 on PM2.5 mass reduction in key regions in China, Sci. China Earth Sci., 62, 1885–1902, https://doi.org/10.1007/s11430-019-9343-3, 2019.
Zhang, Z., Xu, X., Qiao, L., Gong, D., Kim, S-J., Wang, Y., and Mao, R.: Numerical simulations of the effects of regional topography on haze pollution in Beijing, Sci. Rep., 8, 5504, https://doi.org/10.1038/s41598-018-23880-8, 2018.
Zhao, B., Liou, K.-N., Gu, Y., Li, Q., Jiang, J. H., Su, H., He, C. L., Tseng, H. L., Wang, S. X., Liu, R., Qi, L., Lee, W. L., and Hao, J. M.: Enhanced PM2.5 pollution in China due to aerosol-cloud interactions, Sci. Rep., 7, 4453, https://doi.org/10.1038/s41598-017-04096-8, 2017.
Zheng, B., Tong, D., Li, M., Liu, F., Hong, C., Geng, G., Li, H., Li, X., Peng, L., Qi, J., Yan, L., Zhang, Y., Zhao, H., Zheng, Y., He, K., and Zhang, Q.: Trends in China's anthropogenic emissions since 2010 as the consequence of clean air actions, Atmos. Chem. Phys., 18, 14095–14111, https://doi.org/10.5194/acp-18-14095-2018, 2018.
Zheng, G. J., Duan, F. K., Su, H., Ma, Y. L., Cheng, Y., Zheng, B., Zhang, Q., Huang, T., Kimoto, T., Chang, D., Pöschl, U., Cheng, Y. F., and He, K. B.: Exploring the severe winter haze in Beijing: the impact of synoptic weather, regional transport and heterogeneous reactions, Atmos. Chem. Phys., 15, 2969–2983, https://doi.org/10.5194/acp-15-2969-2015, 2015.
Zhong, J., Zhang, X., Wang, Y., Sun, J., Zhang, Y., Wang, J., Tan, K., Shen, X., Che, H., Zhang, L., Zhang, Z., Qi, X., Zhao, H., Ren, S., and Li, Y.: Relative contributions of boundary-layer meteorological factors to the explosive growth of PM2.5 during the red-alert heavy pollution episodes in Beijing in December 2016, J. Meteorol. Res., 31, 809–819, https://doi.org/10.1007/s13351-017-7088-0, 2017.
Zhong, J., Zhang, X., Wang, Y., Liu, C., and Dong, Y.: Heavy aerosol pollution episodes in winter Beijing enhanced by radiative cooling effects of aerosols, Atmos. Res., 209, 59–64, https://doi.org/10.1016/j.atmosres.2018.03.011, 2018a.
Zhong, J., Zhang, X., Dong, Y., Wang, Y., Liu, C., Wang, J., Zhang, Y., and Che, H.: Feedback effects of boundary-layer meteorological factors on cumulative explosive growth of PM2.5 during winter heavy pollution episodes in Beijing from 2013 to 2016, Atmos. Chem. Phys., 18, 247–258, https://doi.org/10.5194/acp-18-247-2018, 2018b.