the Creative Commons Attribution 4.0 License.
the Creative Commons Attribution 4.0 License.
 | 25 Jul 2023
Thermal infrared dust optical depth and coarse-mode effective diameter over oceans retrieved from collocated MODIS and CALIOP observations
Jianyu Zheng
Hongbin Yu
Anne Garnier
Qianqian Song
Chenxi Wang
Claudia Di Biagio
Jasper F. Kok
Yevgeny Derimian
Claire Ryder
In this study, we developed a novel algorithm based on the collocated Moderate Resolution Imaging Spectroradiometer (MODIS) thermal infrared (TIR) observations and dust vertical profiles from the Cloud–Aerosol Lidar with Orthogonal Polarization (CALIOP) to simultaneously retrieve dust aerosol optical depth at 10 µm (DAOD10 µm) and the coarse-mode dust effective diameter (Deff) over global oceans. The accuracy of the Deff retrieval is assessed by comparing the dust lognormal volume particle size distribution (PSD) corresponding to retrieved Deff with the in situ-measured dust PSDs from the AERosol Properties – Dust (AER-D), Saharan Mineral Dust Experiment (SAMUM-2), and Saharan Aerosol Long-Range Transport and Aerosol–Cloud-Interaction Experiment (SALTRACE) field campaigns through case studies. The new DAOD10 µm retrievals were evaluated first through comparisons with the collocated DAOD10.6 µm retrieved from the combined Imaging Infrared Radiometer (IIR) and CALIOP observations from our previous study (Zheng et al., 2022). The pixel-to-pixel comparison of the two DAOD retrievals indicates a good agreement (R∼0.7) and a significant reduction in (∼50 %) retrieval uncertainties largely thanks to the better constraint on dust size. In a climatological comparison, the seasonal and regional () mean DAOD10 µm retrievals based on our combined MODIS and CALIOP method are in good agreement with the two independent Infrared Atmospheric Sounding Interferometer (IASI) products over three dust transport regions (i.e., North Atlantic (NA; R=0.9), Indian Ocean (IO; R=0.8) and North Pacific (NP; R=0.7)).
Using the new retrievals from 2013 to 2017, we performed a climatological analysis of coarse-mode dust Deff over global oceans. We found that dust Deff over IO and NP is up to 20 % smaller than that over NA. Over NA in summer, we found a ∼50 % reduction in the number of retrievals with Deff>5 µm from 15 to 35∘ W and a stable trend of Deff average at 4.4 µm from 35∘ W throughout the Caribbean Sea (90∘ W). Over NP in spring, only ∼5 % of retrieved pixels with Deff>5 µm are found from 150 to 180∘ E, while the mean Deff remains stable at 4.0 µm throughout eastern NP. To the best of our knowledge, this study is the first to retrieve both DAOD and coarse-mode dust particle size over global oceans for multiple years. This retrieval dataset provides insightful information for evaluating dust longwave radiative effects and coarse-mode dust particle size in models.
- Article
(16257 KB) - Full-text XML
-
Supplement
(4384 KB) - BibTeX
- EndNote


Mineral dust (referred to as dust) lifted by strong surface winds in arid and semi-arid regions (Ginoux et al., 2012) is the most abundant type of atmospheric aerosol in terms of dry mass (Kinne et al., 2006; Goudie, 1983). Once aloft, dust particles with a broad size range (from 0.001 to 100 µm) can be transported from local scales to intercontinental and further hemispherical scales, exerting far-reaching impacts on the climate system (Shao et al., 2011; Choobari et al., 2014; Yu et al., 2013; Tegen and Fung, 1994; Uno et al., 2009). For example, dust significantly influences the earth system's radiative budget by interacting with both shortwave (SW) solar and longwave (LW) terrestrial radiations, known as the direct radiative effects (DREs). Previous studies have found that on a global mean basis, the dust DRE at the top of the atmosphere (TOA) is generally negative in SW (i.e., a cooling effect) but positive (i.e., a warming effect) in LW, although dust SW DREs can be positive over bright surfaces (Kok et al., 2017; Li et al., 2021; Di Biagio et al., 2021; Song et al., 2018, 2022). Despite this qualitative understanding, the quantification of dust net DRE (i.e., SW DRE + LW DRE) remains highly uncertain, in part due to the great spatiotemporal heterogeneity of dust properties such as dust loading, optically represented by dust aerosol optical depth (DAOD) (Huneeus et al., 2011), particle size distribution (PSD) (Kok et al., 2017; Adebiyi and Kok, 2020), particle shape and refractive indices (RIs) (Li et al., 2021).
Satellite remote sensing is uniquely capable of measuring the spatiotemporal variation in dust properties on regional to global scales and over years and decades. Many methods have been developed to retrieve the column-integrated AOD in the visible spectrum (AODVIS) (e.g., 550 nm) from passive satellite observations in the visible (VIS) and near-infrared (NIR) spectrum, such as the Moderate Resolution Imaging Spectroradiometer (MODIS) (Levy et al., 2013; Hsu et al., 2013) and the Multi-angle Imaging Spectroradiometer (MISR) (Kahn et al., 2010). It should be noted that these retrievals obtain the total AOD contributed by not only dust but also other types of aerosols. As a result, the fraction of dust AOD (DAOD) in VIS (DAODVIS) needs to be further separated from the total AODVIS for dust-focused studies. Some methods rely on model simulations of DAODVIS AODVIS (Gkikas et al., 2021) or non-dust AODVIS (Ridley et al., 2016). Others are based on the contrasting properties of dust in comparison with other aerosols, such as its larger size manifested as a smaller Ångström exponent and a smaller fine-mode fraction (Kaufman et al., 2005; Yu et al., 2009, 2021) and significant spectral gradient in the absorption from Deep Blue to the VIS (Ginoux et al., 2010; Pu and Ginoux, 2018). In addition, the active spaceborne lidars with VIS–NIR channels, such as the Cloud–Aerosol Lidar with Orthogonal Polarization (CALIOP) on board the Cloud–Aerosol Lidar and Infrared Pathfinder Satellite Observations (CALIPSO) mission and the Cloud–Aerosol Transport System (CATS), can be used to estimate the vertical distribution of DAODVIS based on the observed particulate depolarization ratios (Yu et al., 2015; Proestakis et al., 2018). By utilizing these retrieval methods, several studies have further developed decade-long satellite data records of DAODVIS (Gkikas et al., 2022; Song et al., 2021), which are frequently used for dust studies such as estimations of dust DRE, interannual variability and trends of dust, and global dust cycles (Song et al., 2022; Logothetis et al., 2021; Kok et al., 2021b).
The VIS–NIR dust observations are useful, but they do not provide direct measurements of DAOD at LW, and they have weak sensitivity to coarse particles (particle diameter (Dp)>1 µm) (Ryder et al., 2019). Extending observed DAOD from the VIS–NIR to TIR spectra depends strongly on dust PSD and RI assumptions (Song et al., 2018). Therefore, TIR observations are an indispensable complement with several unique advantages. Dust dominated by coarse-mode particles is arguably the only predominant particle that can cause strong radiative signatures in the TIR spectrum (Desouza-Machado et al., 2006). Therefore, using TIR observation has an inherent advantage of directly retrieving DAOD without contributions from other aerosols. Zheng et al. (2022) showed that direct TIR observations could significantly reduce uncertainties in DAODTIR and LW DRE associated with dust PSD and RI assumptions. Moreover, previous studies have revealed that super-coarse dust particles (Dp>20 µm) are ubiquitously detected from numerous in situ measurements in both source regions and transport regions (Weinzierl et al., 2017; Denjean et al., 2016; Ryder et al., 2013b, 2018), which is however excluded or underestimated in most dust transport models (Checa-Garcia et al., 2021; Wu et al., 2020; Zhao et al., 2022). How many super-coarse dust particles can be carried in long-range transport, and how frequently can super-coarse dust particles be carried in long-range transport? The lack of observational data with finer spatiotemporal coverage prevents us from further revealing their transport patterns. TIR satellite observations with great sensitivity to super-coarse particles can potentially fill this knowledge gap.
Notwithstanding the advantages, retrieving dust properties in TIR, particularly the dust particle size, usually represented by effective radius or diameter, is challenging. In the past, TIR dust retrieval algorithms were primarily based on observations from spaceborne hyperspectral atmospheric sounders, such as the Advanced Infrared Radiation Sounder (AIRS) and the Infrared Atmospheric Sounding Interferometer (IASI). The important advantages of hyperspectral observations for dust retrieval are that they can provide multiple atmospheric window channels most sensitive to dust aerosols with little gas absorption (Peyridieu et al., 2010; Capelle et al., 2018, 2014; Peyridieu et al., 2013). On the other hand, these algorithms have two major limitations. First, the altitude of a dust layer and, therefore, its temperature profile affect the outgoing TIR radiance at TOA with a similar magnitude as DAOD (Pierangelo et al., 2004). As a result, dust altitude must be part of the state vector to be retrieved together with DAOD in a stand-alone hyperspectral TIR dust retrieval algorithm, which makes retrieving dust particle size from limited information content highly challenging (Pierangelo et al., 2005). Second, the relatively large footprint of hyperspectral sounders (∼15 km) makes cloud masking and clearing a daunting task. As a result, the retrieval results are prone to cloud contamination (Song et al., 2018; Zheng et al., 2022).
A recent study by Zheng et al. (2022) (hereafter referred to as Z22) has opened a new avenue for TIR-based dust retrievals by retrieving 10 years of TIR DAOD at 5 km resolution over the global oceans based on combined CALIOP and Infrared Imaging Radiometer (IIR; a collocated higher-spatial-resolution TIR imager) observations. Both CALIOP and IIR are on board the CALIPSO satellite. The smaller (compared to AIRS and IASI) footprint size of IIR and the collocated CALIOP lidar make cloud masking much easier and more reliable than stand-alone hyperspectral algorithms. Moreover, the highly detailed and accurate dust vertical distribution provided by CALIOP not only makes the TIR DAOD retrieval more straightforward and accurate, but also allows for additional retrievals on dust particle size. Lastly, the collocated CALIOP lidar also provides estimated DAODVIS, which opens potential applications for the observational synergistic VIS and TIR DAOD. Furthermore, unlike the passive VIS–NIR observations that are available in the daytime only, the combined VIS lidar and TIR observations are also accessible at night, which allows further applications for investigating the diurnal variability in dust properties (Yu et al., 2021; Chédin et al., 2020). However, Z22 found that an accurate radiative closure between the simulated TIR radiance and observed TIR radiance for clear-sky backgrounds is only possible for nighttime observations, as there is an unresolved bias during daytime. In addition, because it used a single-band (i.e., the 10.6 µm IIR band) retrieval method, the algorithm allows for retrieving DAOD only.
To overcome the limitations in Z22 and further advance the TIR dust retrievals for coarse-mode dust size, in this study, instead of IIR, we use three MODIS TIR window bands (centered at 8.55, 11.02 and 12.03 µm) for dust retrievals for the following reasons. The detector noise of MODIS in warm scenes (e.g., dust-laden sky) is 0.02–0.03 K, which is lower than that of IIR at 0.1–0.15 K (Madhavan et al., 2016). As a result, we can achieve a better radiative closure between the radiative transfer simulation and MODIS observations in the clear sky, a premise for TIR-based dust retrieval, at all three TIR channels in both daytime and nighttime (details in Sect. 2.3 and Appendix A). It first allows us to adopt the split-window technique (Zhang et al., 2006; Paepe and Dewitte, 2009) to reduce retrieval uncertainties compared with Z22 (detailed in Sect. 5.1). Moreover, by leveraging the information content from all three bands, we can retrieve not only the DAOD at 11 µm, further scaled to 10 µm (referred to as DAOD10 µm), but also the dust particle size represented by effective diameter (referred to as Deff). Lastly, the daytime retrievals enable comparisons with VIS–NIR-based retrievals, such as MODIS, CALIOP and the Aerosol Robotic NETwork (AERONET).
In the rest of the article, we introduce the collocated MODIS and CALIOP observation and the radiative transfer model in Sect. 2. The implementation of the retrieval algorithm is detailed in Sect. 3. Section 4 demonstrates the DAOD10 µm and Deff retrievals of three dust cases observed at Cape Verde and in the Caribbean Sea and compares them with ground-based and in situ airborne measurements. Section 5 presents the climatological analysis of 5-year retrievals of DAOD10 µm compared with Z22 IIR-based and IASI-based retrievals and Deff in terms of the seasonal and regional variation from 2013 to 2017. The discussions and conclusions are summarized in Sect. 6.
2.1 MODIS and CALIOP observations
In this study, dust properties, namely DAOD10 µm and Deff, are retrieved from collocated Aqua MODIS and CALIOP observations. MODIS on board the Aqua satellite, as a member of the A-train constellation, provides observations from 36 spectral bands ranging from VIS to TIR with near-daily global coverage and relatively high spatial resolution (i.e., 250 m to 1 km at nadir). MODIS is equipped with onboard calibrators that enable stable calibration uncertainties within ±0.03 K for TIR bands (Xiong et al., 2009). This study primarily uses the MODIS level-1B calibrated upwelling radiances at TOA at three TIR spectral bands centered at 8.55, 11.02 and 12.03 µm, respectively. The TIR window bands mostly avoid contaminations from atmospheric gas absorptions and are sensitive to dust optical properties in different orders (Z22). For better interpretation, the calibrated radiances are further converted to equivalent brightness temperature (BT) computed based on Planck's law and the corresponding spectral response functions at the three selected TIR bands (see Fig. 4b (dashed black lines) in Sect. 3.2).
CALIPSO, launched in 2006, was also a member of the A-train constellation that shares a similar and tightly controlled sun-synchronous polar orbit with Aqua MODIS until August 2018. CALIOP aboard CALIPSO is a two-wavelength (532 and 1064 nm) polarization-sensitive lidar with three receiver channels (one measuring the 1064 nm backscatter intensity and two measuring orthogonally polarized components of the 532 nm backscatter). Unlike Aqua MODIS, CALIOP has a much smaller spatial coverage due to its narrow cross-track footprint of around 70 m in diameter. However, the 333 m along-track footprint with 30 to 60 m vertical resolution allows CALIOP to provide detailed vertical structures of aerosols and clouds (Winker et al., 2009).
In this study, the dust contribution to a vertical column of attenuated backscatter is needed as we focus on retrieving dust. Although the CALIOP operational aerosol product (i.e., the Vertical Feature Mask (VFM) product) determines the aerosol subtype for each aerosol layer (Kim et al., 2018), it does not provide the quantitative dust backscatter profile for dust and non-dust aerosols mixed in the column. Therefore, we apply the estimated particulate depolarization ratio (DPR) profile along with the total attenuated backscatter profile from the version 4 level-2 CALIOP aerosol profile product (LID_L2_05kmAPro-Standard-V4 (Liu et al., 2019)) to derive the dust aerosol's vertical distribution for DAOD10 µm and Deff retrieval. The VFM product is further used for filtering out the non-dust aerosol profiles (see Appendix B for details).
2.2 AMSR-E and MERRA-2 auxiliary data
The surface characteristics (i.e., surface emissivity and temperature) and the atmospheric profiles (i.e., layer height H, temperature T, pressure P, water vapor Qv and ozone O3) are crucial for obtaining an accurate radiative transfer simulation in TIR at TOA (Scott and Chedin, 1981). Unlike the hyperspectral observations with the capability to retrieve the instantaneous atmospheric states, our retrieval requires inputs of these auxiliary data from third-party sources.
The atmospheric profiles T, H, P, Qv and O3 are obtained from version 2 Modern-Era Retrospective analysis for Research and Applications (MERRA-2)-assimilated products (Gelaro et al., 2017). Specifically, the MERRA-2 inst3_3d_asm_Nv product provides 3-hourly instantaneous atmospheric profiles at 72 pressure levels with a gridded horizontal resolution of 0.5∘ latitude by 0.625∘ longitude. Detailed information can be found in Gelaro et al. (2017). To assign the gridded MERRA-2 data to the simulations for the collocated MODIS and CALIOP (referred to as MODIS–CALIOP) observations, we first obtain the geolocation and time of all grid cells of MERRA-2 data. Then, we find the spatially and temporally closest grid cell with each MODIS–CALIOP pixel.
As the retrieval is implemented over oceans only, which is explained in Sect. 2.3, we obtain the level-2 sea surface temperature (SST) retrieved based on the Advanced Microwave Scanning Radiometer – Earth Observing System Sensor (AMSR-E) on board Aqua (ceased operation in December 2011) and its successor (launched in May 2012), the Advanced Microwave Scanning Radiometer 2 (AMSR2), on board Global Change Observation Mission – Water (GCOM-W1) that follows Aqua's orbit. The 6.9 GHz and 10.7 GHz channels from AMSR-E and AMSR2 are used for SST retrieval (Wentz and Meissner, 2000). Previous studies have demonstrated that the SST retrievals over heavy dust-loading regions using TIR observations are underestimated due to the radiative impact of dust (Luo et al., 2019). However, microwave radiation has mostly no interaction with dust and, therefore, can avoid dust impacts and achieve better SST retrieval accuracy over dusty regions (O'Carroll et al., 2019). In this study, the SST at 56 km resolution from AMSR-E and AMSR-2 is collocated with MODIS–CALIOP. Specifically, the SSTs from AMSR-E and AMSR2 are used for retrievals before August 2011 and after June 2012, respectively, while there will be no retrievals during the observational gap between AMSR-E and AMSR2. For the surface emissivity, we use the emissivity models (listed in Table 1) provided in version 2 of the Community Radiative Transfer Model (CRTM) (Van Delst, 2011), which is described in Sect. 2.3.
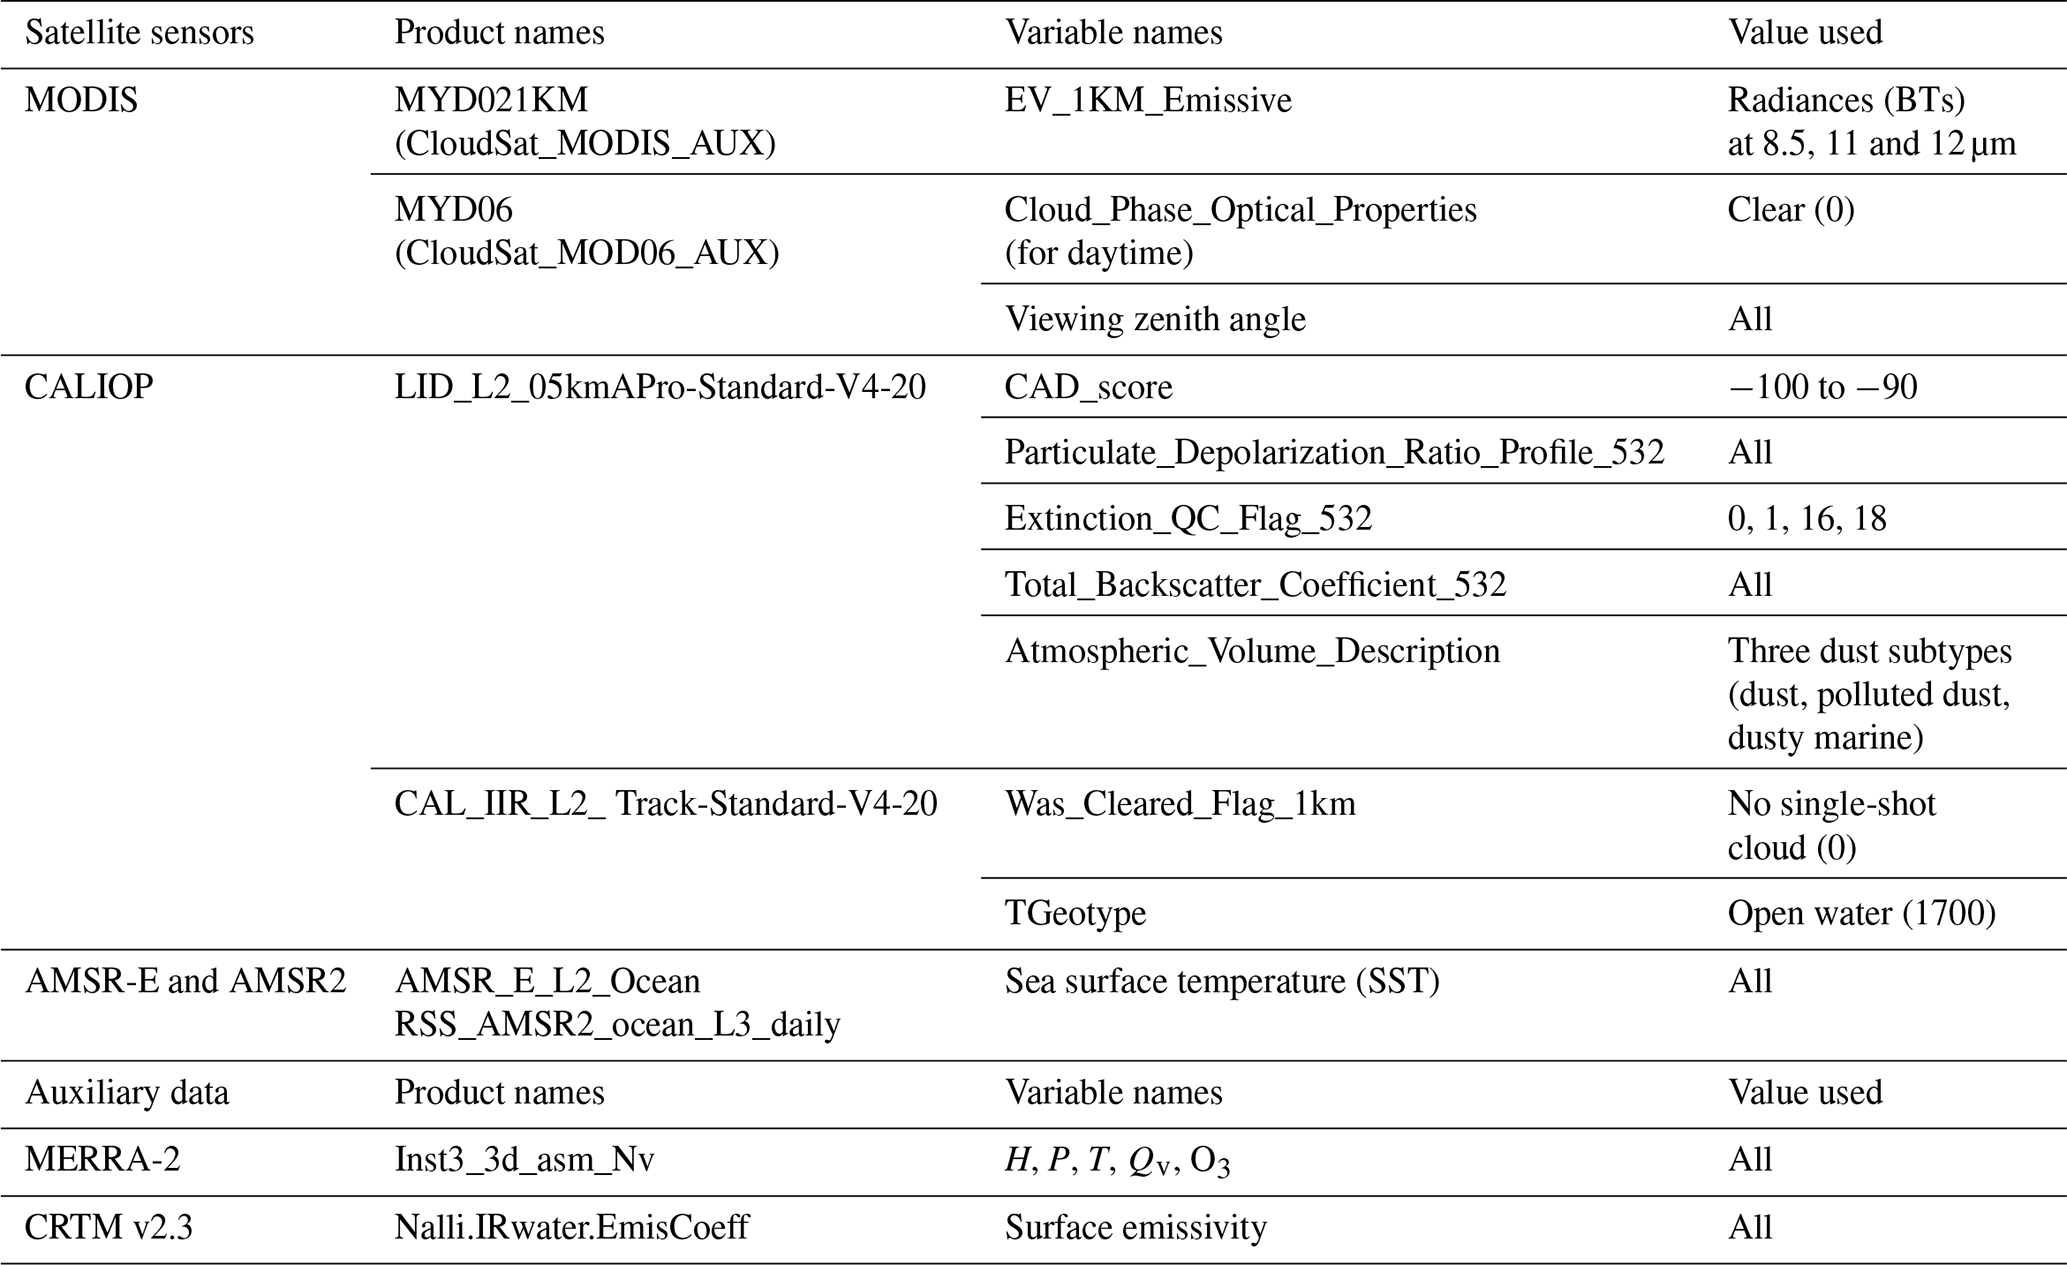
Finally, for each MODIS–CALIOP observation, the collocated MERRA-2 atmospheric profiles, AMSR-E/AMSR2 SST and the internal surface emissivity model are used as the input for the radiative transfer simulation. All the satellite products, variables and auxiliary data are listed in Table 1.
Table 1Values of variables from multi-source satellite sensors and auxiliary datasets that are used in this study.
2.3 The radiative transfer models
The foundation of a look-up table (LUT)-based retrieval method is an accurate radiative transfer model. For the radiative transfer simulation of terrestrial TIR radiation under clear atmospheric conditions, atmospheric gaseous absorption is critical. In this study, we use the version 2 CRTM developed by the US Joint Center for Satellite Data Assimilation (JCSDA) as the foothold for our retrieval (Chen et al., 2012; Han, 2006). The transmittance coefficients in CRTM are first trained by applying regression algorithms to the line-by-line integrated transmittances for numerous atmospheric profiles (McMillin et al., 2006). Afterward, the gaseous absorption component can achieve an accuracy as high as the line-by-line transmittance but consumes far less computational time (Ding et al., 2011). As CRTM also supports MODIS's sensor coefficients, it is an optimal tool for simulating the atmospheric gaseous absorptions at the three selected MODIS TIR bands for our retrieval (Liang et al., 2016; Wang et al., 2016).
Although it is straightforward to use CRTM to handle the gas absorptions in the TIR, we found it difficult to use it to handle the scattering and absorption of dust due to the configuration and structure of the code. In this study, we use the Discrete Ordinate Radiative Transfer (DISORT) code to handle the dust aerosol scattering and absorption calculation (Stamnes et al., 1988). To combine CRTM and DISORT, we first use CRTM to simulate atmospheric gaseous absorptions (output as the atmospheric optical depth) with input MERRA-2 atmospheric profiles. Afterward, the CRTM-simulated atmospheric optical depths with and without the vertical distribution of dust optical properties served as inputs for DISORT to simulate cloud-free dust-laden BTs and cloud-free clean (i.e., cloud-free and aerosol-free) BTs at the three MODIS TIR bands at TOA, respectively.
Prior to implementing the retrieval, the uncertainties contributed by the auxiliary data, the radiative transfer simulation and the observational errors must be evaluated. Thus, we conduct the radiative closure benchmark between the CRTM–DISORT calculated and the MODIS-observed BTs under cloud-free and clean (without dust) conditions, which is presented in detail in Appendix A. Given that the error of the radiative closure benchmark over land and polar regions can reach up to 10 K due to the uncertainties from the assumed surface emissivity and temperatures (Z22), this study focuses on retrievals over oceans within 60∘ S and 60∘ N only.
In this section, we describe in detail the retrieval algorithm that is summarized in Fig. 1, covering the collocation of MODIS and CALIOP observations, the process of cloud masking and dust detection, the a priori dust properties, and the design of the LUT method and uncertainty estimation.
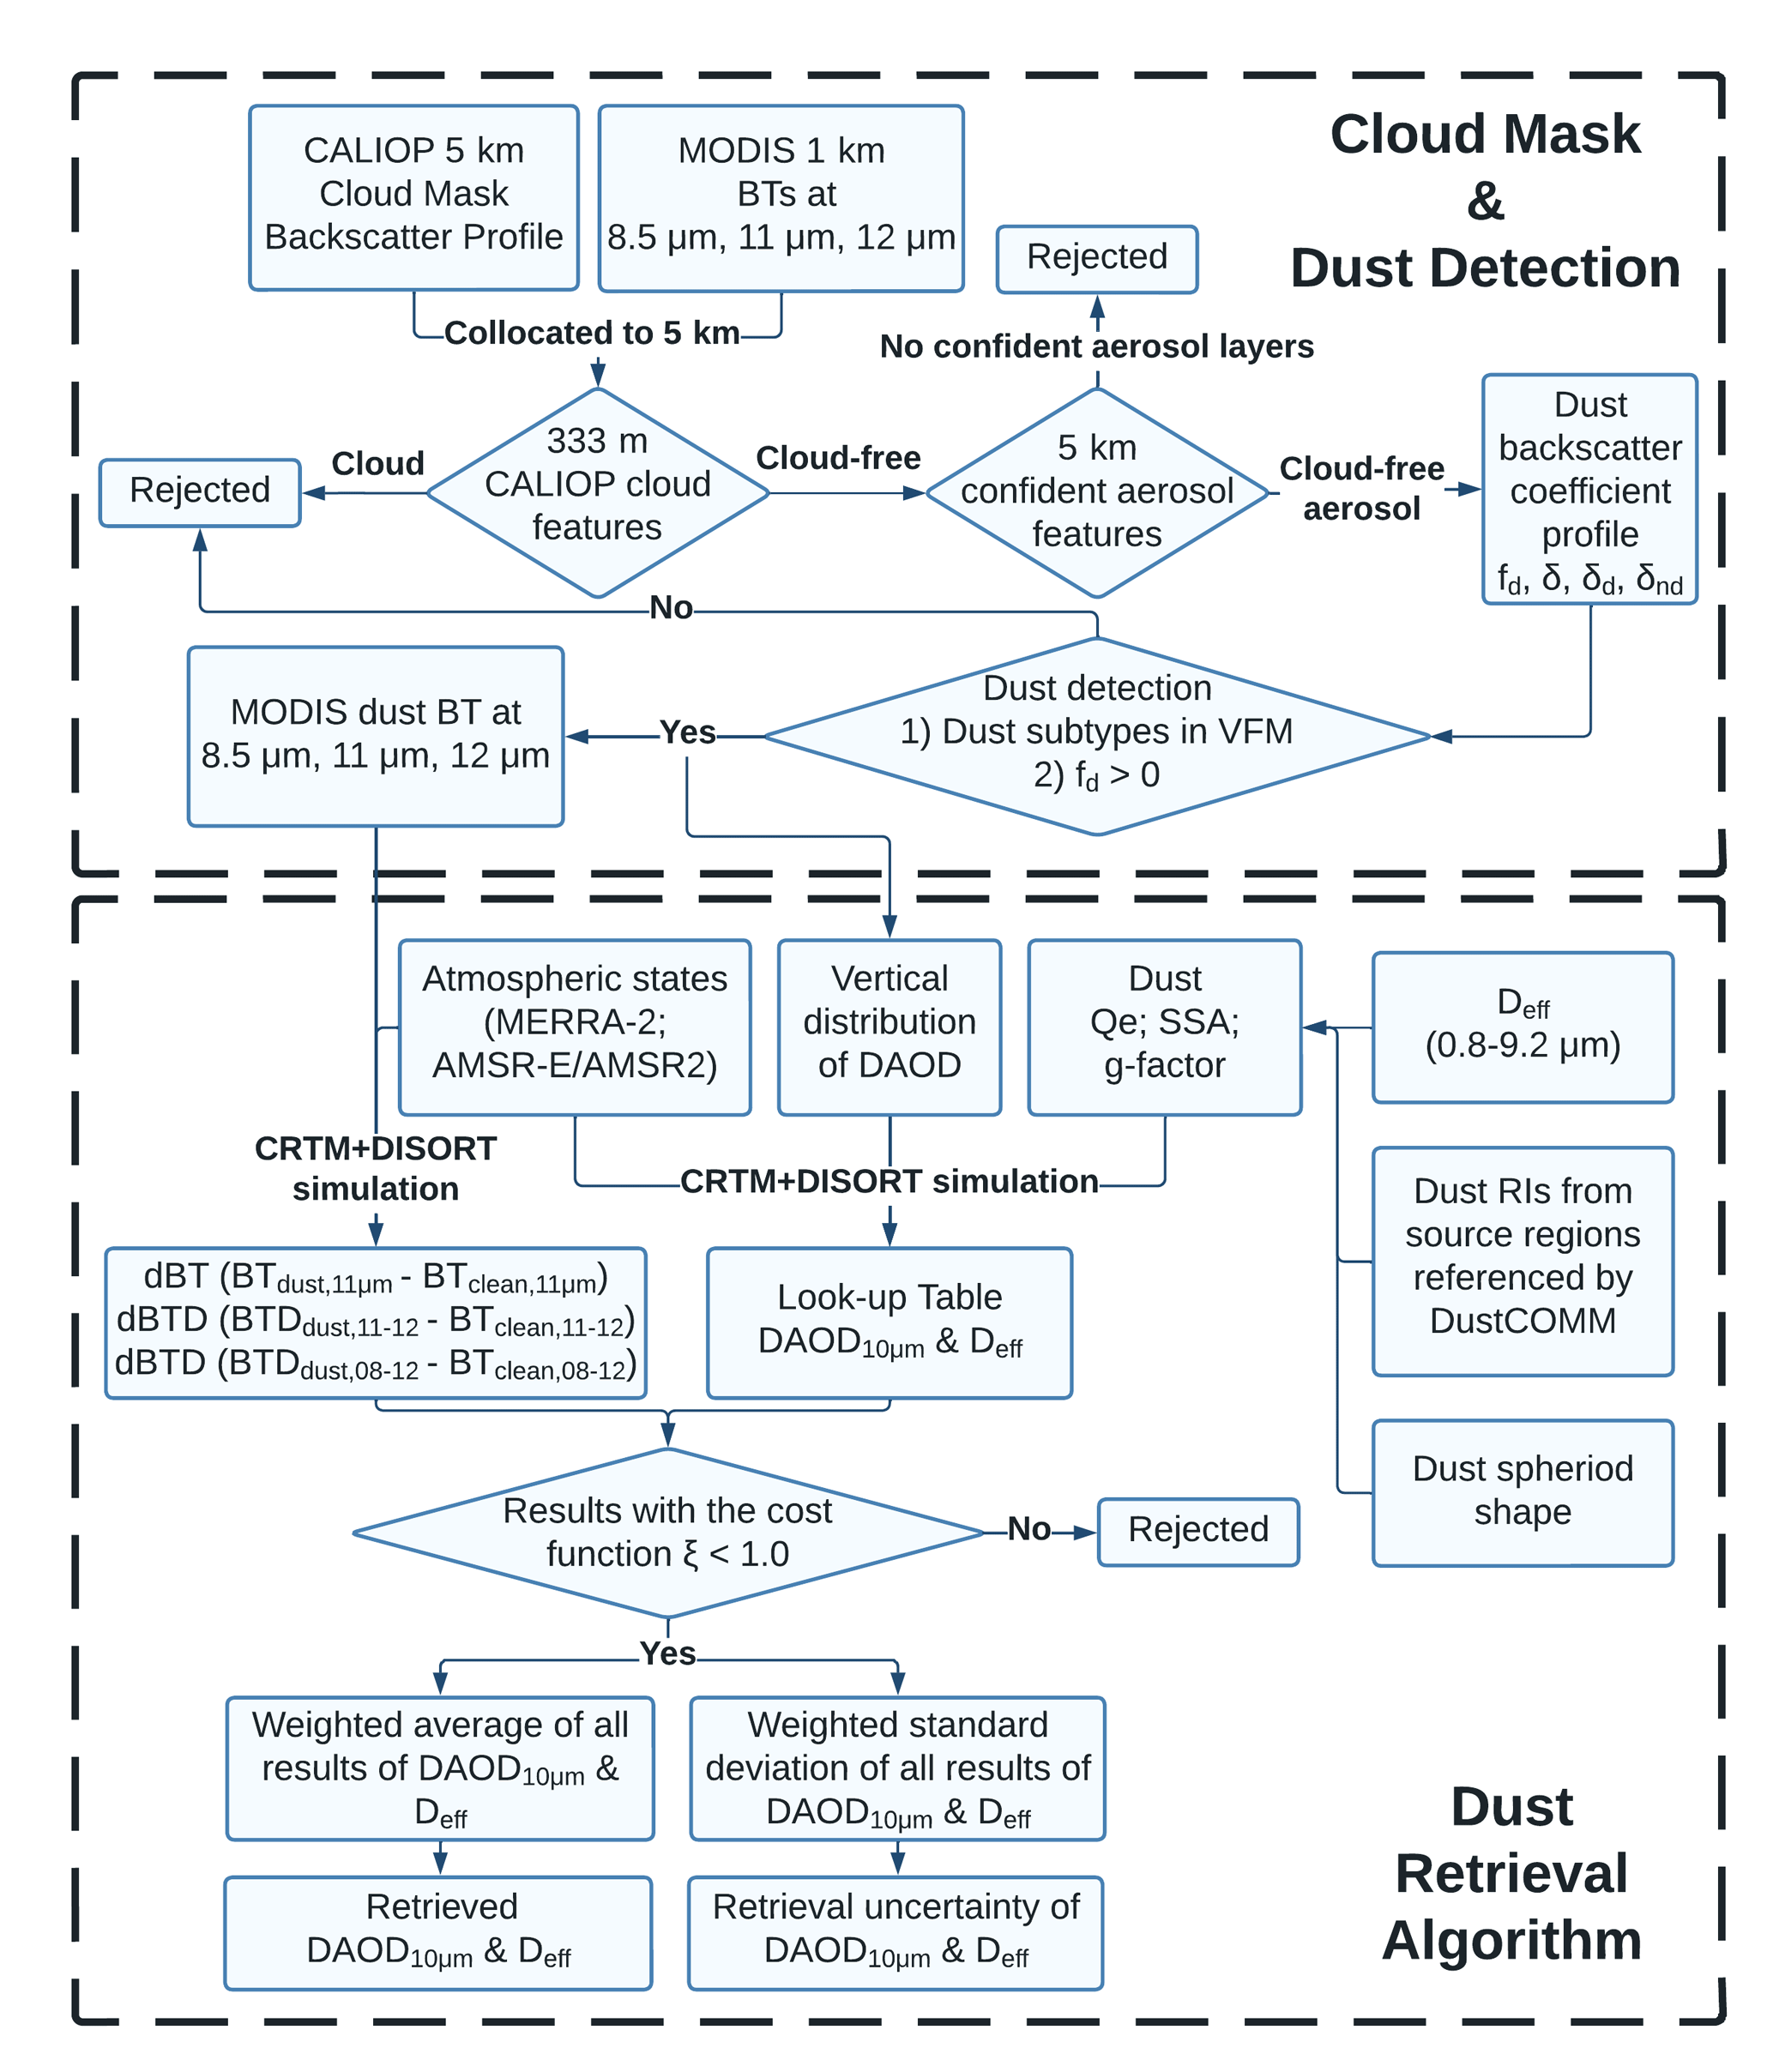
Figure 1A flowchart of the retrieval process of DAOD10 µm and Deff using collocated MODIS–CALIOP observations.
The first step of the retrieval is to identify high-quality cloud-free dust-laden observations. Due to the different spatial coverages of MODIS and CALIOP, the retrieval requires collocated data from both sensors. The collocation process and the following cloud-masking, dust detection and vertical distribution processing are similar to Z22 and are presented in detail in Appendix B. It should be noted that CALIOP has relatively smaller signal-to-noise ratios during daytime than nighttime, owing to the influence of solar contamination on the lidar signal (McGill et al., 2007). Nevertheless, by applying identical selection criteria for high-quality cloud-free dust vertical profiles in both daytime and nighttime, we can ensure that the data quality of the selected CALIOP cloud-free dust profiles remains consistent across both periods.
3.1 A priori dust properties
In addition to the vertical distribution, the retrieval needs to assume dust bulk optical properties. In this section, we introduce the dust PSDs, dust shapes, and dust RIs that are used to calculate the bulk optical properties (i.e., the extinction efficiency (Qext), single-scattering albedo (SSA) and asymmetry factor (g factor)).
3.1.1 Monomodal dust coarse-mode particle size distribution
Dust PSD is commonly presented by a two-mode (i.e., fine mode (Dp<1.0 µm) and coarse mode (Dp>1.0 µm)) lognormal size distribution (Dubovik et al., 2002). As the fine-mode dust has a negligible effect on TIR observation, we assume a normalized (i.e., total volume concentration equals unity) monomodal lognormal volume size distribution to represent the coarse-mode dust PSD, which is defined as
where D is the volume-equivalent sphere geometric diameter for spheroidal dust particle assumption (see Sect. 3.1.2), Dm is the geometric volume median diameter, is the volume PSD, and σ is the standard deviation. Note that the sensitivity of σ to the TIR radiative signature at TOA is negligible compared with that of AOD and Dm (Pierangelo et al., 2005) (see Fig. S5). Therefore, to simplify the retrieval, we first set σ=0.7 (i.e., ln (2.0)), as it is a good representation of the coarse-mode dust PSDs in both in situ measurements and satellite retrievals (Capelle et al., 2018; Ryder et al., 2018). We further use the effective diameter defined by Hansen and Travis (1974) to represent the monomodal PSDs with dependence on Dm as
where n(D) is the dust number concentration converted by the volume distribution with σ=0.7 and varied Dm.
Note that in situ measurements of dust PSD show that the coarsest record of dust particles over the transport regions (i.e., over oceans) was measured during the Fennec campaign in June 2011 (Ryder et al., 2013a), with an estimated Dm at around 10.0 µm. Therefore, for the retrieval, we define the minimum and maximum dust coarse-mode PSDs with their representations of Dm from 1 to 12 µm and Deff from 0.8 to 9.2 µm (see Fig. S1 in the Supplement). Dust PSDs within this range are used for calculating the dust bulk optical properties as inputs for building the LUT of DAOD10 µm and Deff.
3.1.2 Dust refractive indices and dust shape
The RI of dust, determined by dust mineral compositions, has a profound impact on dust scattering properties and therefore the retrieval results (Sokolik and Toon, 1999). Ideally, the dust RI should be retrieved simultaneously with other properties of dust. However, given the highly limited information content from the three MODIS TIR bands, a retrieval of dust RI is not possible, at least in this study. It should be noted that most previous studies have also used pre-assumed dust RI, often one or two simple global constants, in their retrievals, including widely used operational aerosol retrieval products (Capelle et al., 2018; Zhou et al., 2020).
Nevertheless, in this study, we try to incorporate the spatial variability in dust RI in our retrieval by using two newly developed datasets. One is a state-of-the-art dust RI database developed by Di Biagio et al. (2017) (referred to as the Di Biagio RI), which provides dust RIs retrieved based on surface soil samples collected in 19 arid and semi-arid sites from worldwide dust source regions. The Di Biagio RI database provides the observational basis for accounting for the regional dependence of dust RI. The other is the fractional contribution over oceans supplied by various dust source regions from the DustCOMM-2021 dataset developed by Kok et al. (2021a), which is used to assign dust RIs from different source regions to the observed dust aerosol over oceans. Details of the dust RI assignments are presented in Appendix C.
Dust particles have irregular and non-spherical shapes, which vary greatly from case to case and from location to location (Scheuvens and Kandler, 2014). Using spherical assumptions for non-spherical dust in remote sensing would cause significant uncertainty (Huang et al., 2020; Dubovik et al., 2002; Nousiainen and Kandler, 2015). It is essential to adopt a quantified non-sphericity to represent dust optical properties better. However, characterizing the complex morphology of dust particles remains challenging. Previous studies have used different assumptions of dust particle shape to evaluate the sensitivity of dust optical properties to the morphology, such as spheroid (Dubovik et al., 2006), ellipsoid (Meng et al., 2010) and polyhedral (Liu et al., 2013).
The non-sphericity of the aspherical shape is often represented by the aspect ratio, defined as the ratio of the longest particle dimension to the intermediate particle dimension. The higher the aspect ratio, the greater the non-sphericity. The spheroid shape assumption is a first-order approximation of dust non-sphericity (Mishchenko et al., 1997; Dubovik et al., 2002) and is widely used for non-spherical aerosol retrievals (Levy et al., 2013; Kahn et al., 2010). To seek a broader application of this study to others, we stick to the spheroid assumption with the size-independent aspect ratio distribution from Dubovik et al. (2006) for the retrieval. Nonetheless, the retrieval based on a more advanced non-spherical dust optical property database, such as the hexahedral shape (Saito et al., 2021), will be evaluated in future studies.
By assuming dust particles with spheroidal shapes, we calculate the dust single-particle optical properties for each a priori dust RI using the T-matrix method (Mishchenko et al., 1996). Afterward, the bulk optical properties are integrated according to the pre-assumed dust PSDs and the spheroidal dust aspect ratio distributions.
3.2 The look-up table and the uncertainty estimation
The DAOD10 µm and Deff are retrieved from three MODIS TIR bands using a LUT method. To illustrate the LUT, we use CRTM–DISORT to simulate the cloud-free clean BT at 11 µm (referred to as BT11), the spectral BT differences (BTDs) between 11 and 12 µm (referred to as BTD11−12), and that between 8.5 and 12 µm (referred to as BTD8−12) by giving a typical tropical atmospheric profile with a dust layer distributed at the mid-level troposphere (i.e., 2–6 km; see Fig. S6). Afterward, with the a priori dust Deff, dust RI and dust spheroidal aspect ratios, the calculated dust bulk optical properties based on the T-matrix method can be used as inputs in CRTM–DISORT to simulate cloud-free dust BT11, BTD11−12 and BTD8−12. With the input DAOD at 11 µm (DAOD11 µm) ranging from 0.0 to 1.0 and Deff ranging from 0.8 to 9.2 µm (see Fig. S1 for corresponding dust PSDs), we build a LUT consisting of BT11, BTD8−12 and BTD11−12 as shown in Fig. 2a. The assumed dust RI for the LUT is from Algeria in northeast Africa. Example LUTs corresponding to other dust RIs are shown in Figs. S7 and S8.
Considering the higher dust extinction signal expected at 10 compared to 11 µm (see Fig. 2b and Pierangelo et al., 2004), we scale DAOD11 µm to DAOD10 µm based on the Qe spectral behavior following . As a result, our final retrieval products contain DAOD10 µm and Deff.
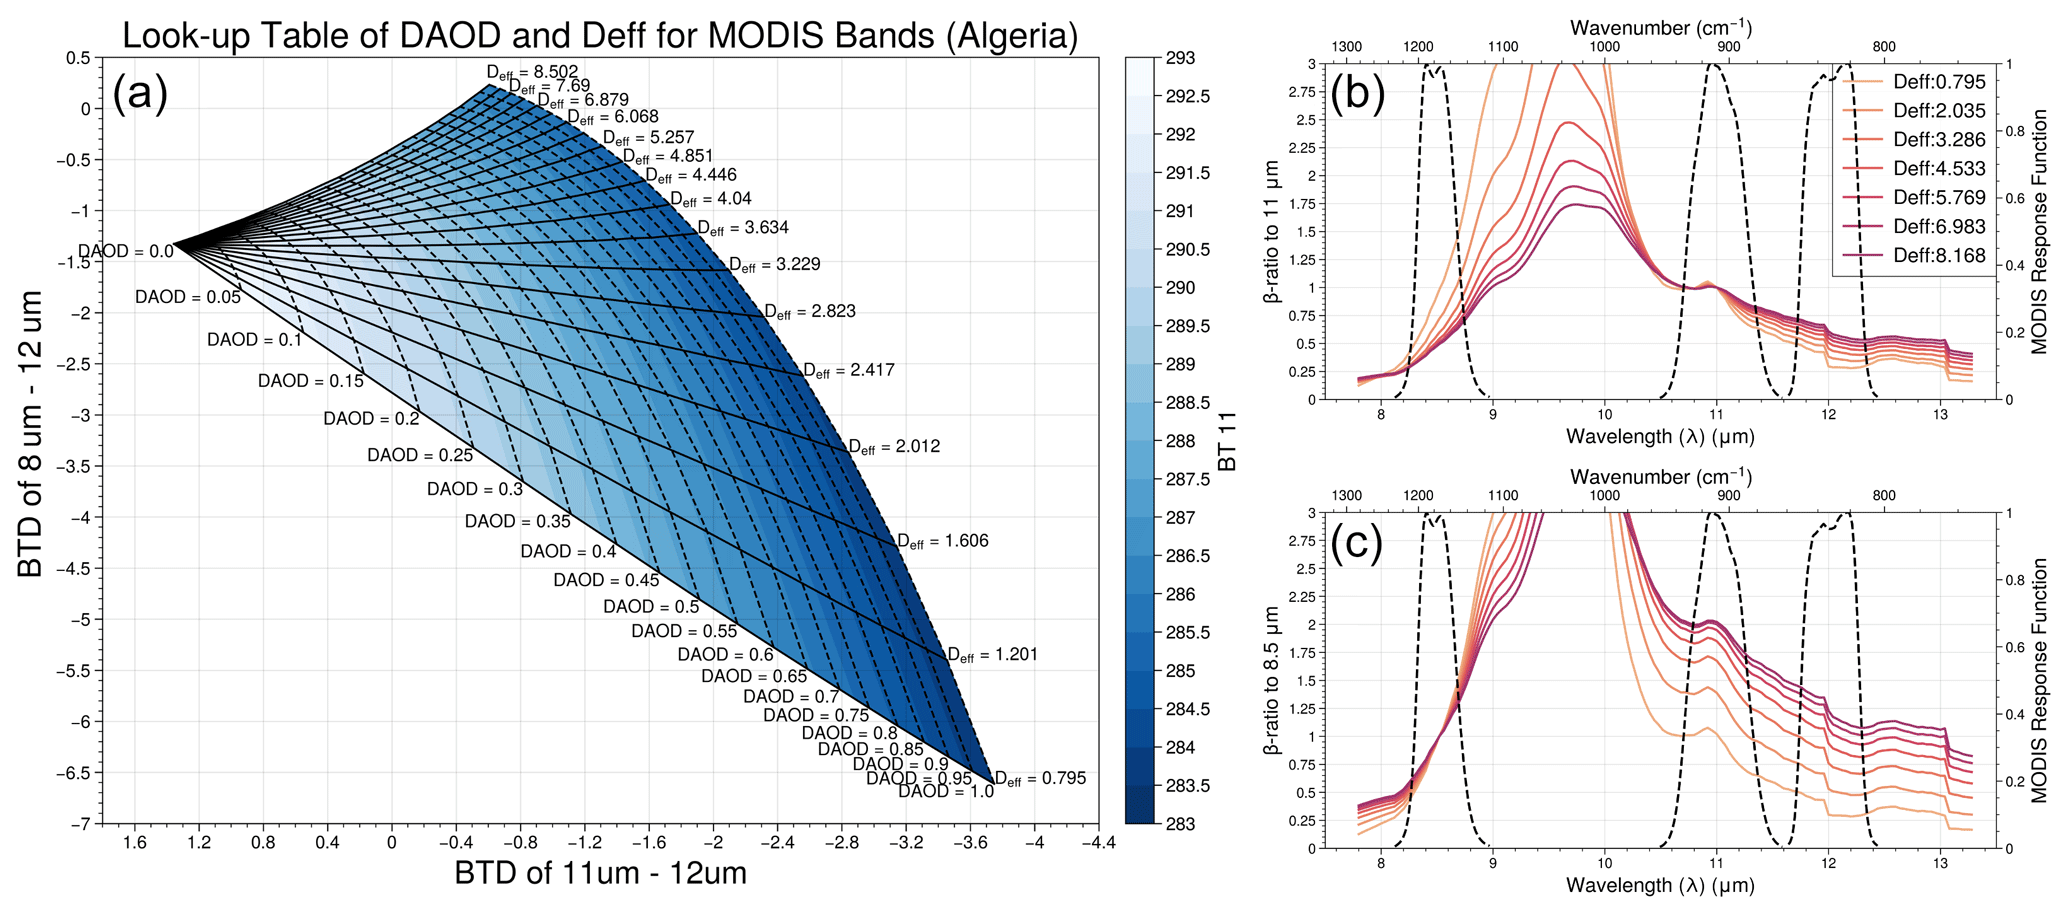
Figure 2(a) An example of the LUTs of BTD8−12 (y axis), BTD11−12 (x axis) and BT11 (color-filled contours) corresponding to DAOD11 µm ranging from 0.0 to 1.0 (dashed lines) and Deff ranging from 0.8 to 8.2 µm (solid lines) and the Algerian dust RI from the Di Biagio database. At the point of DAOD = 0.0, the BTD8−12 and BTD11−12 correspond to the cloud-free clean scenario. (b) The β ratio to 11 µm calculated based on Deff ranging from 0.8 to 8.2 µm and the Algerian dust RI within the TIR spectrum between 7.5 and 13.5 µm. (c) The same as (a) but the β ratio to 8.5 µm.
The variation in BTDs and BT11 with DAOD11 µm and Deff is determined by the dust Qe , SSA and g factor at the three TIR bands. To better understand the variations in BTDs in the LUT, we introduce the so-called β ratio, defined as follows:
where Qe is the extinction efficiency, ω is the SSA, and g is the asymmetry factor. The β ratio has often been used to represent the spectral difference in dust effective absorption (i.e., absorption and backward scattering) in the TIR spectrum in many studies on dust, volcanic ash and ice cloud retrieval (Pavolonis et al., 2013, 2015; Garnier et al., 2013). Because the variation in BT11 in Fig. 2a serves as the single-band dust radiative signature, we present the β ratio with respect to 11 µm (i.e., λ2=11 µm) in Eq. (3) for varied Deff, as shown in Fig. 2b. The β ratios for wavelength ranging from 12 to 11 µm over the whole range of the input Deff are lower than 1. It means that the dust effective absorption at 11 µm is always more significant than that at 12 µm, regardless of the size variation. In contrast, the cloud-free clean BT at 11 µm is higher than that at 12 µm due to the less atmospheric absorptions at 11 µm as described in Appendix A. Consequently, in Fig. 2a, the BTD11−12 decreases with increasing DAOD11 µm regardless of how Deff changes.
On the other hand, the BTD8−12 is more sensitive to Deff than to DAOD. First, the cloud-free and clean BT at 8.5 µm is similar to that at 12 µm due to similar gas absorption. However, the dust effective absorption at 8.5 µm is larger than that at 12 µm when Deff is relatively small (e.g., Deff<3.2 µm) in Fig. 2c; there are negative trends of BTD8−12 with increasing DAOD in Fig. 2a. In contrast, in Fig. 2c, the dust effective absorption at 8.5 µm is weaker than that at 12 µm when Deff is relatively large (e.g., Deff>4.5 µm), leading to positive trends of BTD8−12 with increasing DAOD in Fig. 2a. In between, the sensitivity of BTD8−12 to DAOD can be nearly 0 when dust Deff is moderate (e.g., Deff=3.6 µm in Fig. 2a). As such, the radiative signature of DAOD and Deff can be separated using BTD8−12 and BTD11−12, allowing the simultaneous retrieval of both parameters based on the three MODIS TIR bands.
Besides the dust particle size (e.g., Deff), dust effective absorption at the three TIR bands also depends on the LW dust RI, especially the β ratio from 12 to 8.5 µm (see Fig. S7). The dust RI directly changes the spectral behavior of the dust effective absorption and reshapes the LUT of BTD8−12 and BTD11−12 (see Figs. S8 and S9). Due to the limited observational signature, the retrieval of dust RI is unachievable in this study. The retrieval uncertainty associated with the assumption of dust RI thus needs to be assessed. In addition, the errors resulting from radiance observation itself and radiative transfer modeling (Fig. A1 in Appendix A) also need to be factored in.
We implement the retrieval algorithm in three steps to find an optimal retrieval with the assessed uncertainties. Firstly, we define a cost function ξ of the normalized distance between the simulated BT and BTDs in the LUT and the observed BT and BTDs as
The subscripts of 11, 11–12 and 8–12 represent the BT at the 11 µm band, BTD11−12 and BTD8−12, respectively. The superscripts of sim and obs represent the BT or BTD obtained by simulations and observations, respectively. σ represents the standard deviation of the uncertainty assessed through the clear-sky radiative closure (see Fig. A1), which represents the summation of errors from the observation and simulation using a priori atmosphere states. The first term on the right-hand side of Eq. (4) represents the normalized distance between the observed and simulated BT at the 11 µm band. The second and last terms represent the summation of the normalized distance between the observed and the simulated BTD11−12 and BTD8−12, respectively.
Secondly, by using Eq. (4), we acquire a solution when the normalized distance is within the range of the evaluated uncertainty (ξ<1). In addition, as mentioned in Appendix C, each observation would possibly assume more than one dust RI for retrieval. Therefore, we build multiple LUTs corresponding to multiple RIs and implement the retrieval with all of them. All the solutions that satisfy ξ<1 in these LUTs are collected.
Finally, the optimal retrieval results of DAOD and Deff are defined as the average of the collected solutions corresponding to multiple a priori dust RIs weighted by their corresponding cost function ξ as . The weighted standard deviation thus represents the estimated retrieval uncertainty as
where xi is the ith solution of DAOD or Deff, wi is the weight of ξ for the ith solution, N is the number of non-zero weights, and is the weighted mean of the collected solutions (Heckert and Filliben, 2003; Hao and Mendel, 2013). In this step, the uncertainties associated with the assumptions of a priori dust RI and the clear-sky radiative closure are taken into account by the weighted average and the weighted standard deviation.
After the retrieval, the quality assurance (QA) flag is assigned as 0 for successfully retrieved results. The retrieval with fewer than two solutions satisfying ξ<1 is rejected and is assigned with QA flag as 1. By implementing the retrieval for the 5-year MODIS–CALIOP observations from 2013 to 2017, which will be analyzed in detail in Sect. 5, we present the seasonal distribution of cloud-free dust samples (Ndust); successfully retrieved dust samples (Nretrieval; QA flag = 0); and the retrieval success rate (, which reaches up to 90 %–100 % over dust transport regions, as shown in Fig. S10.
In summary (Fig. 1), we obtain the cloud-free dust aerosol vertical profiles using the CALIOP cloud mask, dust detection and vertical-scaling method introduced in Appendix B. Afterward, the a priori dust properties presented in Sect. 3.1 serve as inputs for CRTM–DISORT to build the LUT of DAOD and Deff. Lastly, we retrieve DAOD11 µm further scaled to DAOD10 µm and Deff by averaging the solutions that satisfy ξ<1 weighted by ξ and estimate the corresponding retrieval uncertainty based on the corresponding ξ-weighted standard deviation. Both the column-integrated DAOD10 µm and the vertically resolved extinction coefficients at 10 µm inferred by the CALIOP dust vertical distribution are provided in our retrieval.
In this section, we evaluate the retrieval, especially Deff, by comparing it with the in situ-measured dust PSDs through case studies. In recent decades, most dust–aerosol-focused field campaigns have taken place in north Africa and the North Atlantic, while there are limited in situ measurements of dust PSD over the Indian Ocean and North Pacific (Li et al., 2000; Quinn et al., 2002; Clarke et al., 2004), which all took place before the launch of CALIOP in June 2006. Additionally, due to the narrow spatial coverage of CALIOP orbit tracks (i.e., 70 m cross-track footprint (Winker et al., 2010)), it is difficult to find cases that our retrievals can be well collocated with regarding the North Pacific in situ measurements in space and time. Consequently, in this study, we compare the dust PSDs corresponding to the retrieved Deff with the in situ-measured dust PSDs over the North Atlantic.
4.1 A case study for transported Saharan dusts over Cape Verde in summer
First of all, we implemented the retrieval on a dust plume originating from north Africa and being transported over the North Atlantic on 16 August 2015. We use this case to evaluate the retrieved DAOD10 µm and Deff through comparisons with the in situ-measured dust particle size and the collocated Aerosol Robotic NETwork (AERONET) version 3 measurements (Holben et al., 1998; Dubovik et al., 2000, 2006; Giles et al., 2019).
4.1.1 Evaluation of retrieved DAOD10 µm
Figure 3a shows the total attenuated backscatter at 532 nm from CALIOP for the dust case observed on 16 August, as shown from left (south) to right (north), with the geolocation highlighted in the upper left sub-panel. The CALIOP orbit passed nearby Cape Verde (16.733∘ N, 22.935∘ W) around 03:34 UTC with nighttime observations for the dust plume. Figure 3b shows the corresponding spatial variation in total AOD532 nm (blue dots) and DAOD532 nm (red dots) estimated with a lidar ratio of 44 sr and uncertainty of ±10 sr as described in Appendix B. The mean DAOD532 nm (1.1) is ∼83 % to the mean total AOD532 nm (1.33), indicating that “pure” dust aerosols dominate this offshore dust plume. Therefore, as a “golden standard”, the measured AERONET AOD at Cape Verde for this dust plume can be approximated as DAOD to assess the CALIOP DAOD and the corresponding retrieved DAOD10 µm. Unfortunately, although AERONET at Cape Verde observed a maximum AOD event at 18:10 UTC on 15 August as shown in Fig. 3d, it does not provide any nighttime measurement for this case.
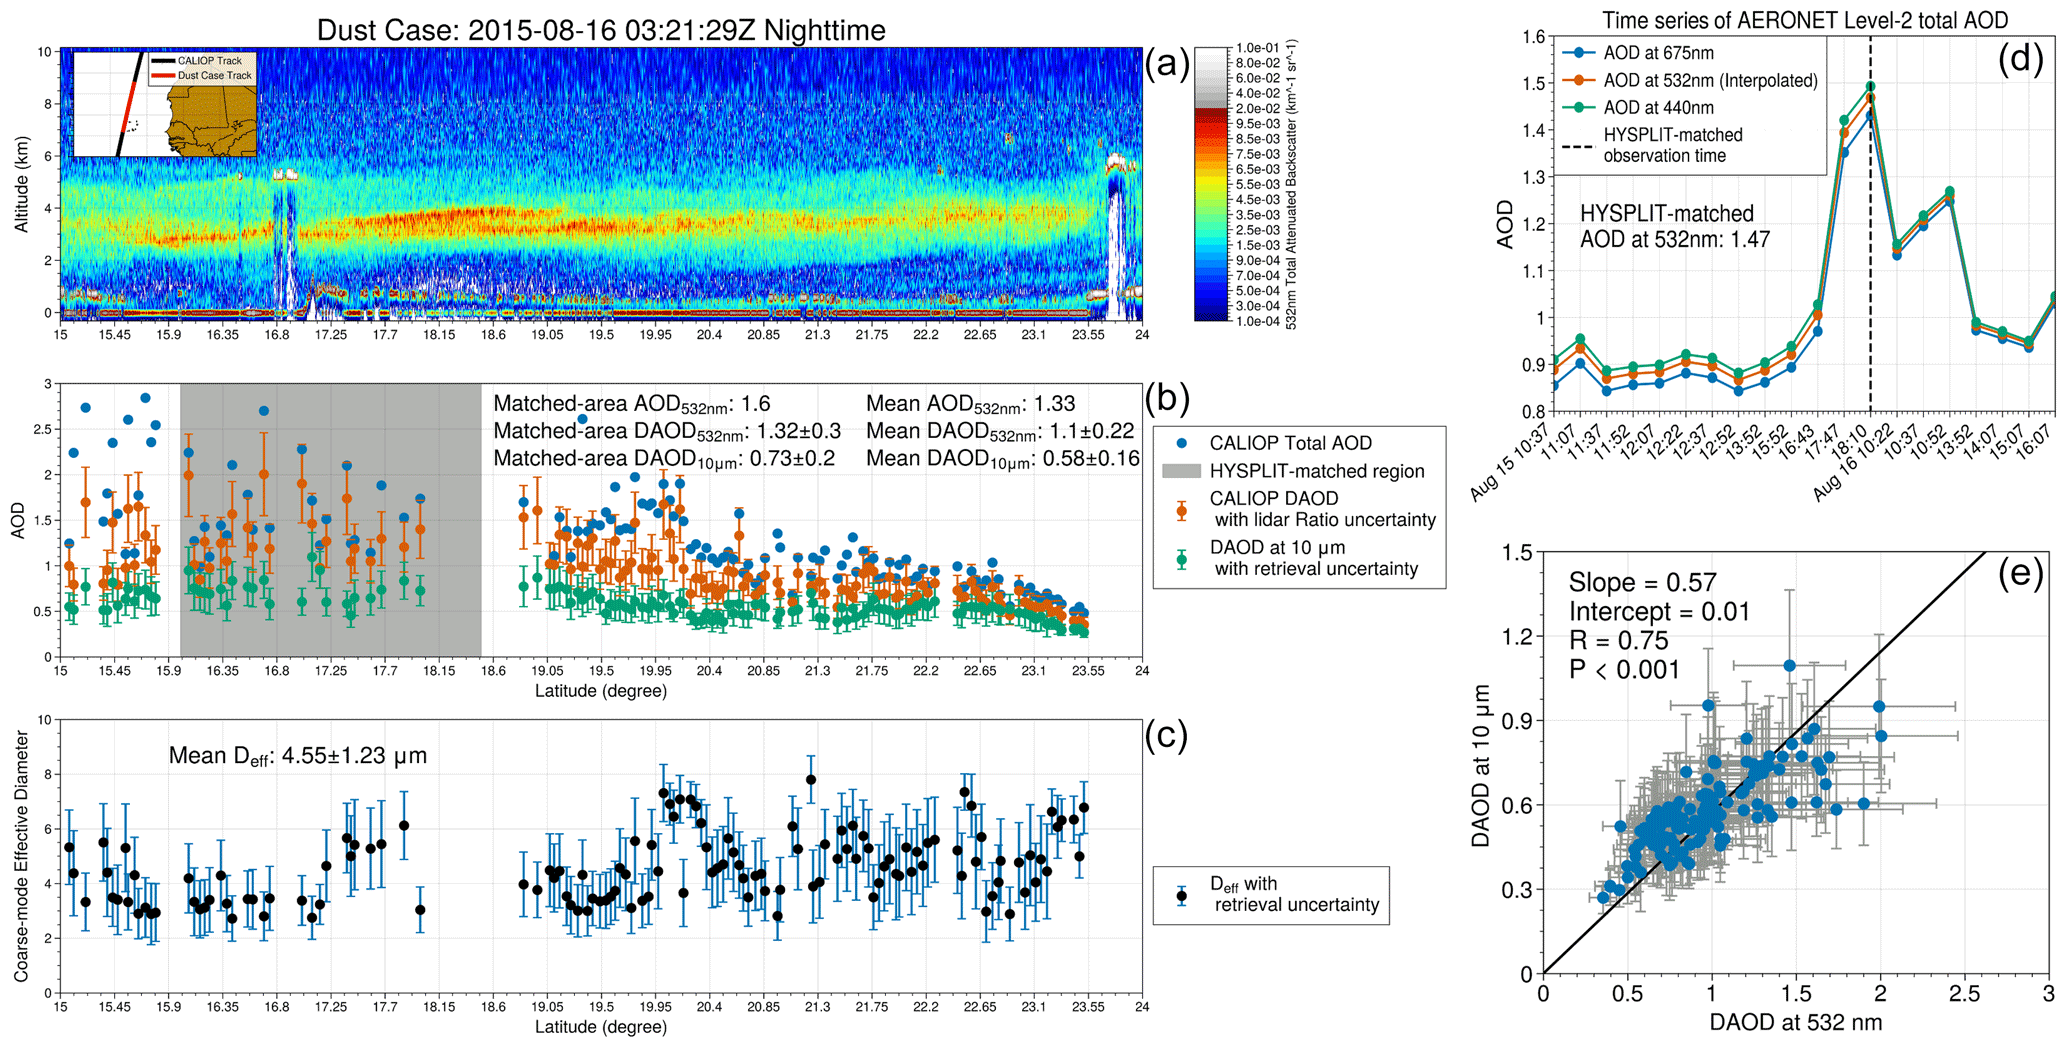
Figure 3The nighttime case on 16 August 2015. (a) The CALIOP total attenuated backscatter at 532 nm on 16 August 2015, over the downwind region of the Sahara (the orbit at upper left). (b) The CALIOP total AOD (blue dots), CALIOP DAOD (red dots) and the retrieved DAOD10 µm (green dots) of the cloud-free dust-laden profiles. The gray shadow area represents the part of the dust plume (16–18∘ N) observed by CALIOP that is matched with the AERONET measurement based on the HYSPLIT back trajectories as shown in Fig. 4. (c) The retrieved Deff (black dots) of the cloud-free dust-laden profiles with the estimated uncertainty (cyan error bars). (d) The time series of the AERONET level-2 AOD at 675 nm (dotted blue line), 440 nm (dotted green line) and 532 nm (dotted orange line, interpolated) at AERONET Cape Verde from 15–16 August 2015. The dashed black lines indicate the time that AERONET measured the same dust plume observed by CALIOP later, proven by the HYSPLIT back trajectories as shown in Fig. 4. (e) The scatterplot of DAOD10 µm versus DAOD532 nm for the whole dust case. The gray error bars represent the uncertainties in DAOD10 µm (vertical) and DAOD532 nm (horizontal). The black line represents the robust linear regression with correlation coefficient (R), slope, intercepts and p value (P).
Due to the different observation times and locations between CALIOP and AERONET, to compare their AODs, we present the ensemble back trajectories simulated by the Hybrid Single-Particle Lagrangian Integrated Trajectory (HYSPLIT) model (Stein et al., 2015) from the passing-by times of the MODIS–CALIOP orbits and AERONET Cape Verde as shown in Fig. 4. Note that the vertical distribution of the dust plume is concentrated around 2 to 4 km (see Fig. 3a). Therefore, the HYSPLIT back trajectories are initiated at 2.5 and 3 km. In Fig. 4a, the HYSPLIT back trajectories of CALIOP between 16 to 18∘ N show that the dust plume was seen by AERONET Cape Verde at 18:10 UTC on 15 August (see Fig. 4b). Bearing in mind that the AOD of the dust plume may change after the 10 h transport from AERONET Cape Verde to the CALIOP orbit track, we found that the CALIOP DAOD532 nm (1.32±0.3 averaged from 16 to 18∘ N, Fig. 3b) is consistent with the AERONET AOD532 nm (interpolated, Fig. 3d) at 1.47 within its uncertainty.
In addition, both back trajectories from CALIOP (including trajectories >18∘ N) and AERONET show similar transport patterns from east to west with initial emission (i.e., back trajectories' height reaches 0 km in Fig. 4b) from the source regions (dashed black regions in Fig. 4a) in Algeria and Mali in both horizontal and vertical view. Thus, we can assign the Di Biagio RIs from Algeria and Mali as the a priori dust RI for retrieval. The retrieved DAOD10 µm (green dots in Fig. 3b) shows a reasonable correlation with DAOD532 nm (R=0.75 in Fig. 3e). Because of the spectral difference between TIR and VIS, the HYSPLIT-matched mean DAOD10 µm (0.73) is ∼55 % of the value of DAOD532 nm (1.32). For the entire case, DAOD10 µm is ∼57 % (k=0.57 in Fig. 3e) of DAOD532 nm. Note that both ratios are within the empirical range of the TIR to VIS DAOD ratio from 28 % to 65 % (Peyridieu et al., 2013), depending on the assumptions of dust PSD, dust RI and dust non-spherical shape.
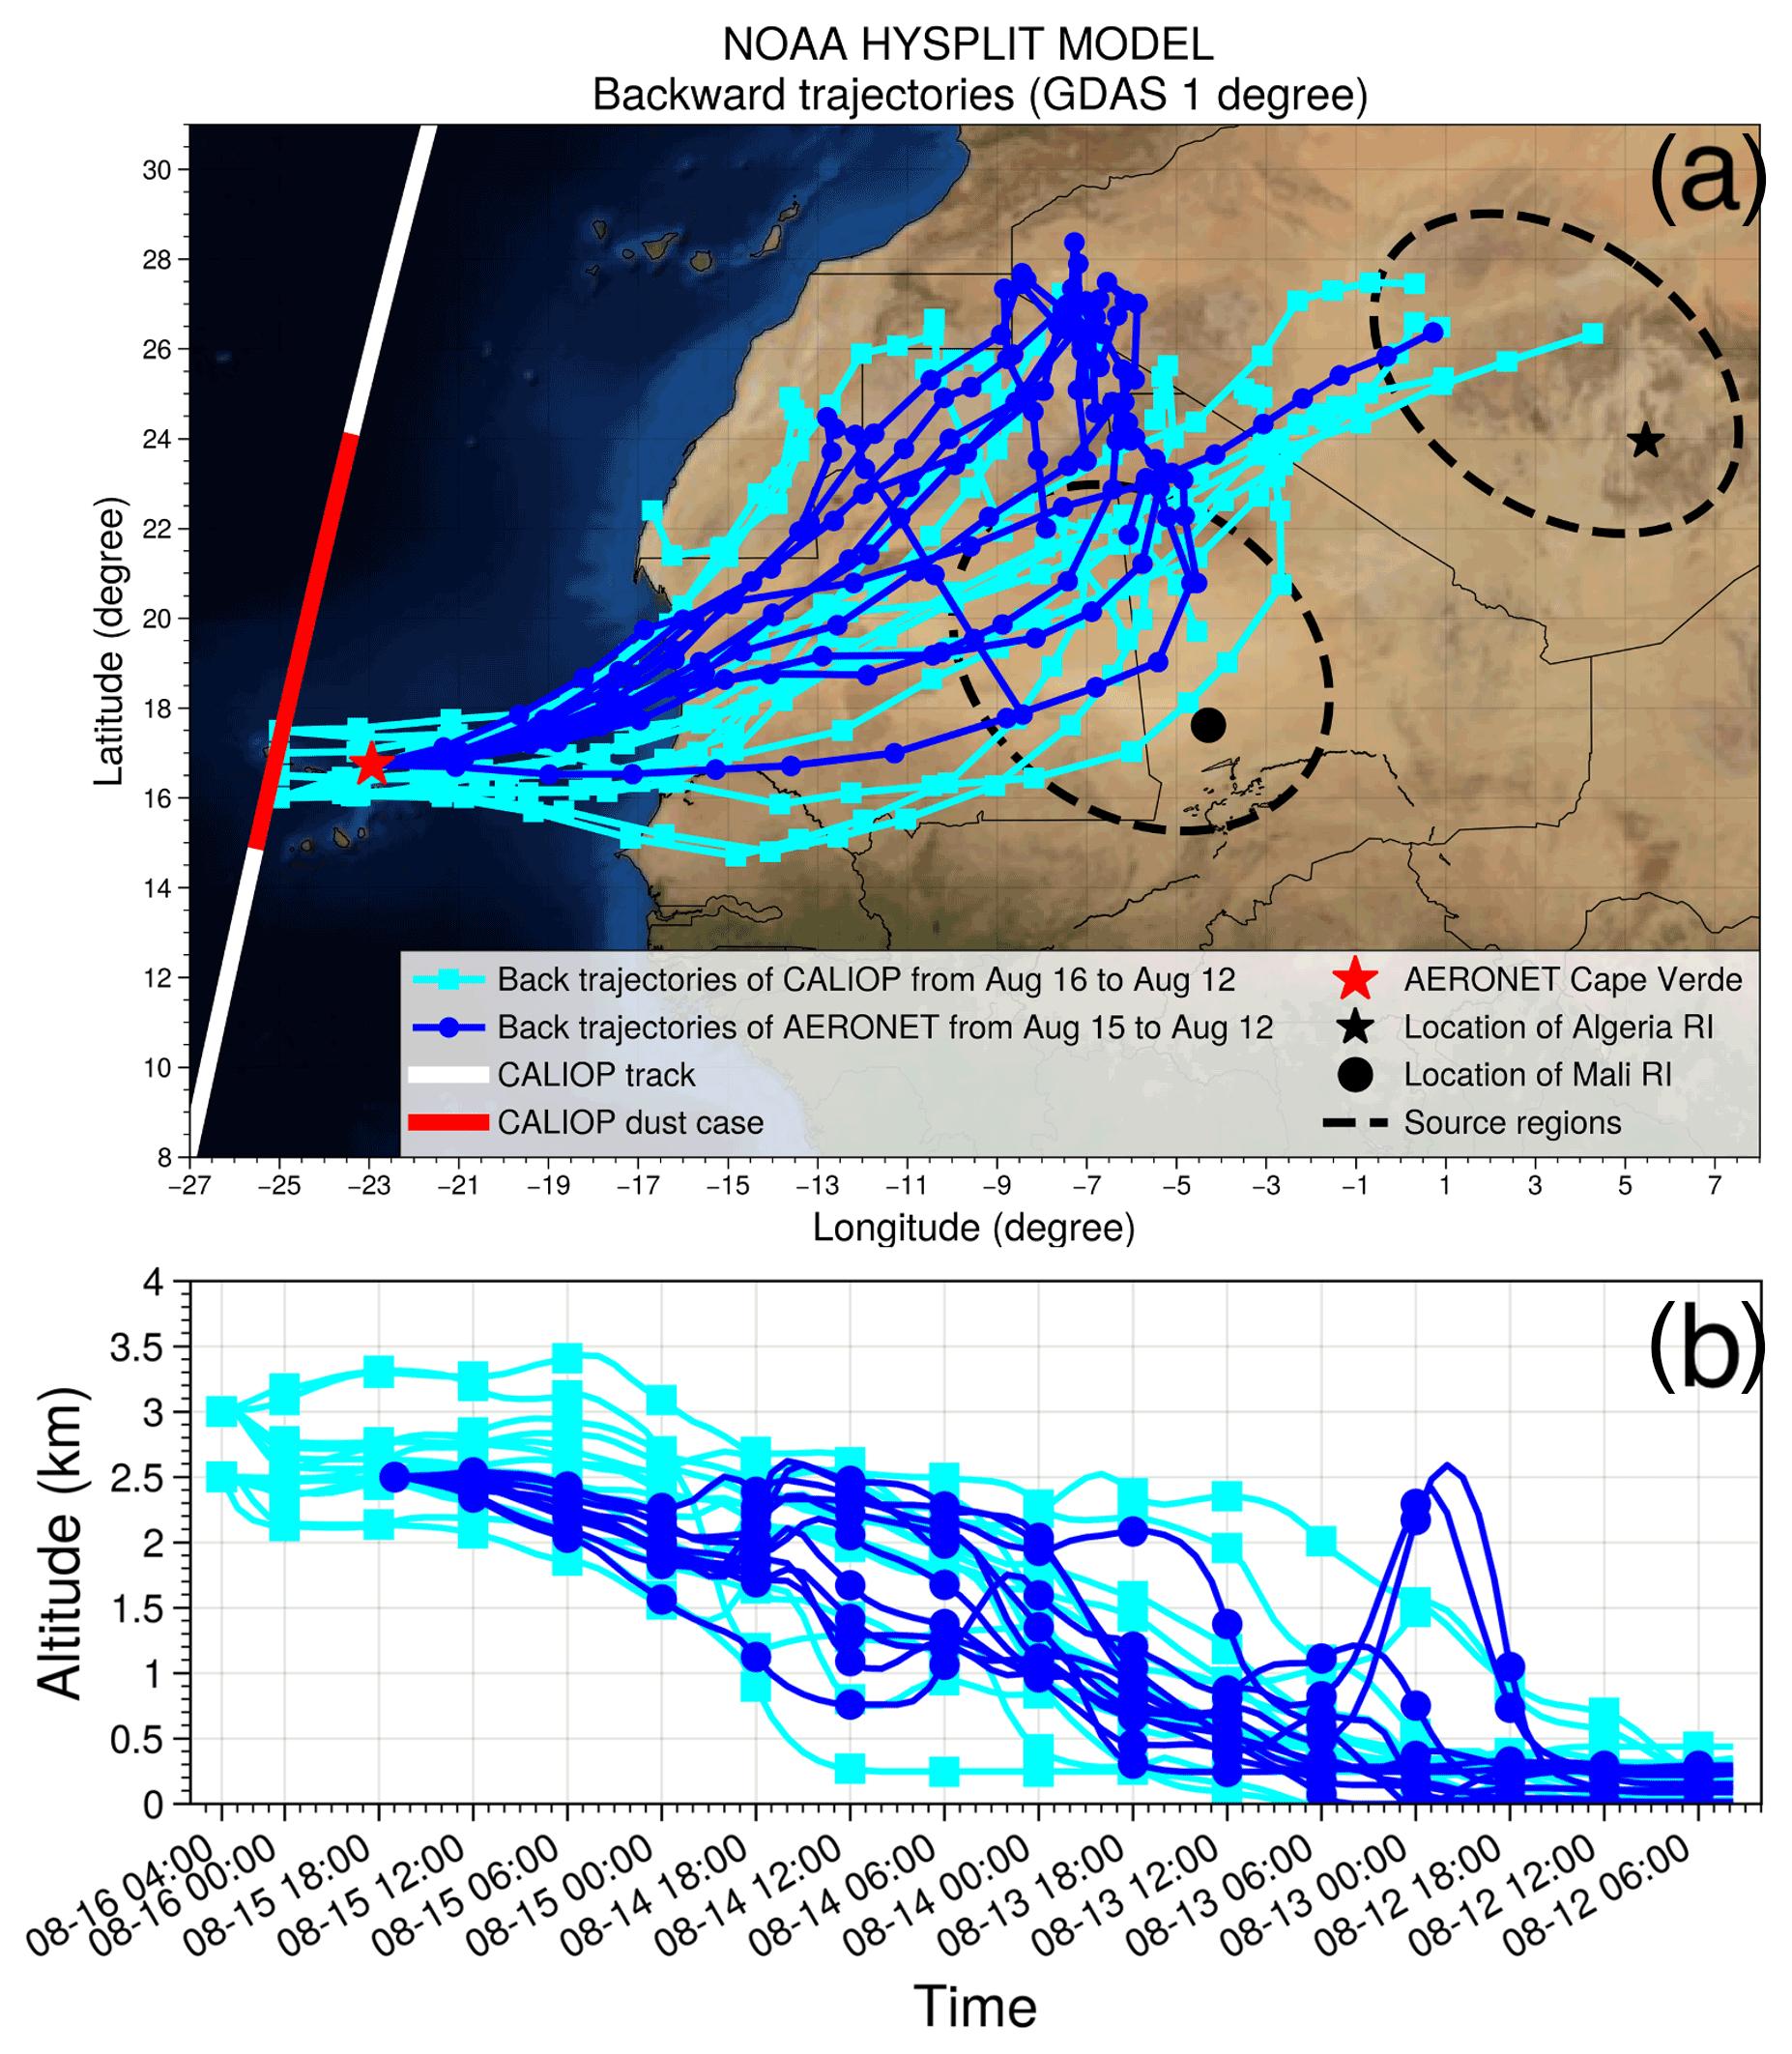
Figure 4The distribution of the spatial (a) and the vertical (b) ensemble HYSPLIT back trajectories on the CALIOP dust case on 16 August 2015 (cyan rectangles with solid lines) and the AERONET Cape Verde observation for the dust case on 15 August 2015 (blue dots with solid lines). The black star and circle represent the geolocation of Di Biagio RIs collected over Algeria and Mali, respectively. The red star denotes the geolocation of the AERONET Cape Verde site.
4.1.2 Comparison of Deff with AER-D in situ measurements
In this section, we evaluate the Deff retrieval by comparing the Deff-corresponding monomodal PSD with those deduced from the lognormal-fitted dust PSD measured during the AERosol Properties – Dust (AER-D) campaign from 7–25 August 2015 over the outflow region of north Africa around Cape Verde (Ryder et al., 2018). We also compared the Deff-corresponding monomodal PSD with the AERONET version 3 level-2 two-mode PSD (referred to as AERONET PSD) on 16 August at Cape Verde (Dubovik et al., 2006) (see Fig. 5b). The AER-D campaign provides measured dust PSD and the corresponding uncertainty in dust within the Saharan air layer (SAL) (see Fig. 5a) and in the marine boundary layer from various airborne instruments (Ryder et al., 2018). In this case, as the CALIOP-observed dust plume is well confined within 2–5 km (Fig. 3a), we choose the AER-D SAL campaign mean log-fit size distribution (referred to as AER-D PSD), which is measured within 1.2–4.8 km (Ryder et al., 2018) in our comparison.
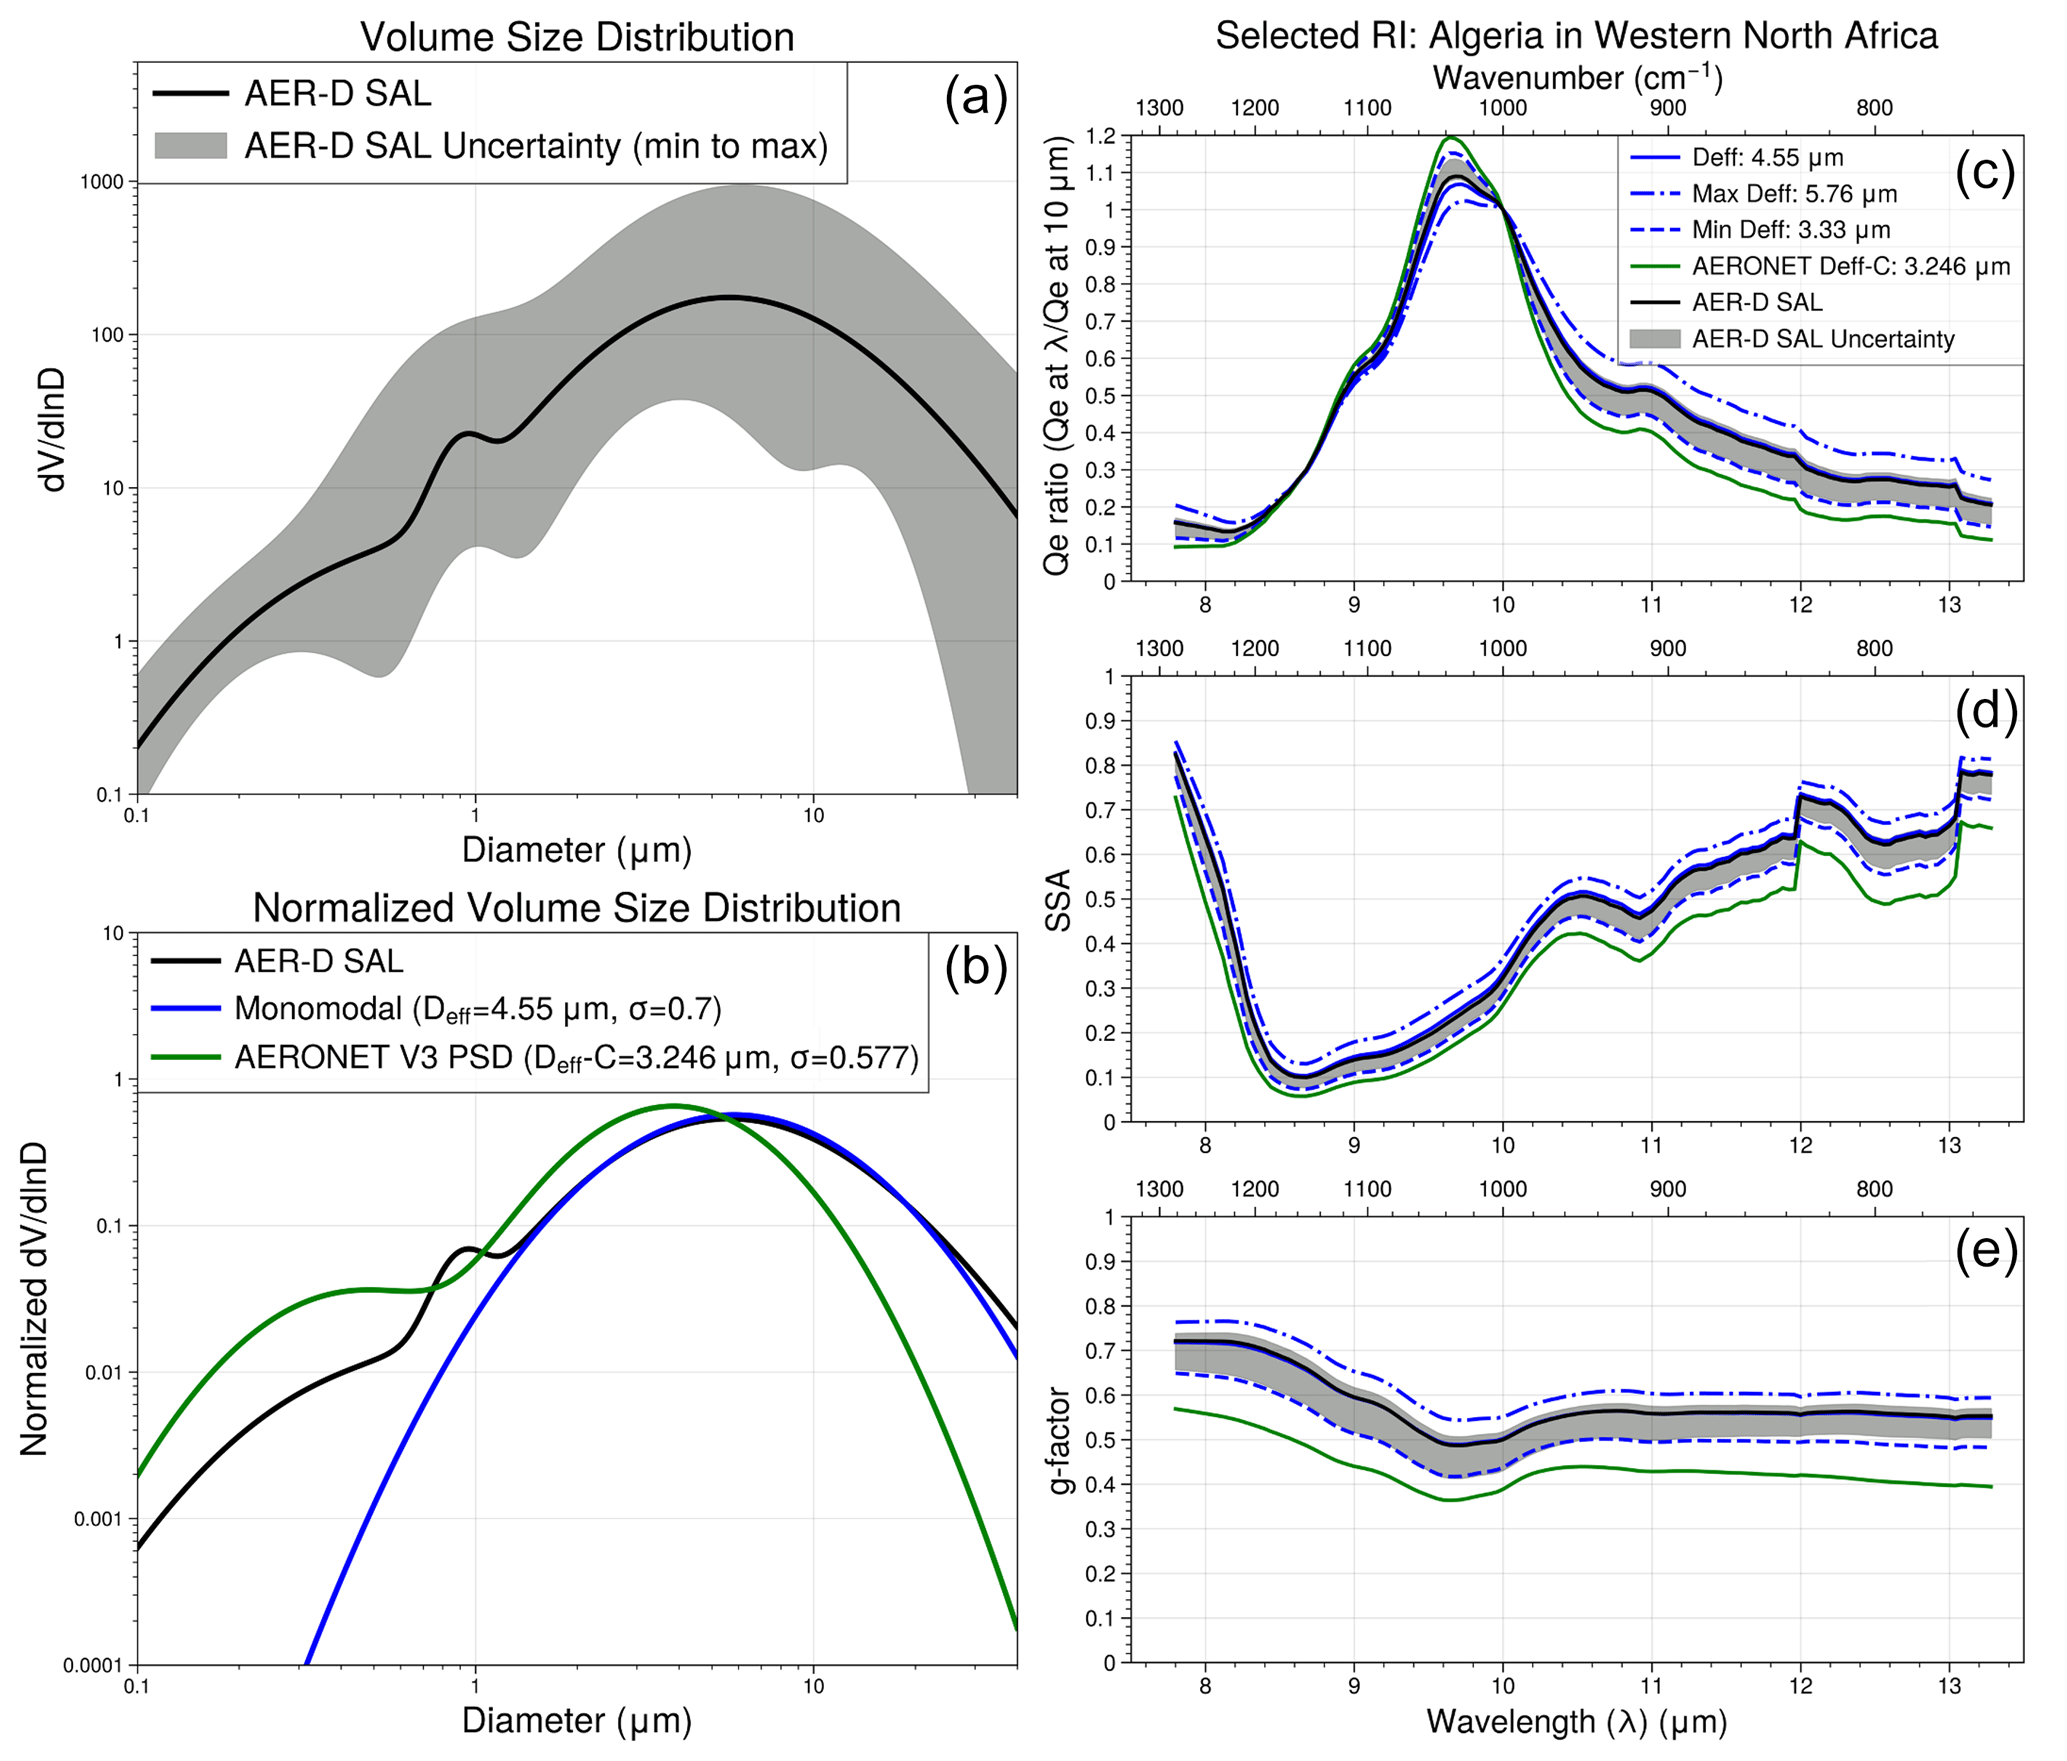
Figure 5(a) The volume lognormal (dV / dlnD) AER-D PSD (black) with the gray shadow area indicating the min-to-max range of the measurement uncertainty obtained from Ryder et al. (2018). (b) The normalized dV / dlnD of AER-D (black), the retrieved coarse-mode PSD corresponding to Deff=4.55 µm (blue) and the AERONET PSD (green). (c–e) The Qe to 10 µm ratio (c), SSA (d), g factor (e) calculated based on the AER-D PSD (black) with min-to-max uncertainty (gray shadow), retrieved coarse-mode PSD (blue) with the retrieval uncertainty (dashed blue curve for the lower bound; dashed–dotted blue curve for the upper bound) and AERONET PSD (green).
Figure 3c shows the retrieved Deff for the dust case. We found that the spatial variation in Deff is generally positively correlated with that of DAOD10 µm and with a mean value of 4.55 µm with the uncertainty ranging from 3.33 to 5.76 µm. Therefore, we obtain the monomodal PSD corresponding to Deff=4.55 µm to compare it with the normalized AER-D PSD and the AERONET PSD. In Fig. 5b, the AERONET-retrieved coarse-mode PSD is systematically smaller than that of AER-D, while the monomodal PSD with Deff=4.55 µm agrees well with the AER-D coarse-mode PSD, although the fine mode of AER-D PSD is not compared because it is not relevant for LW.
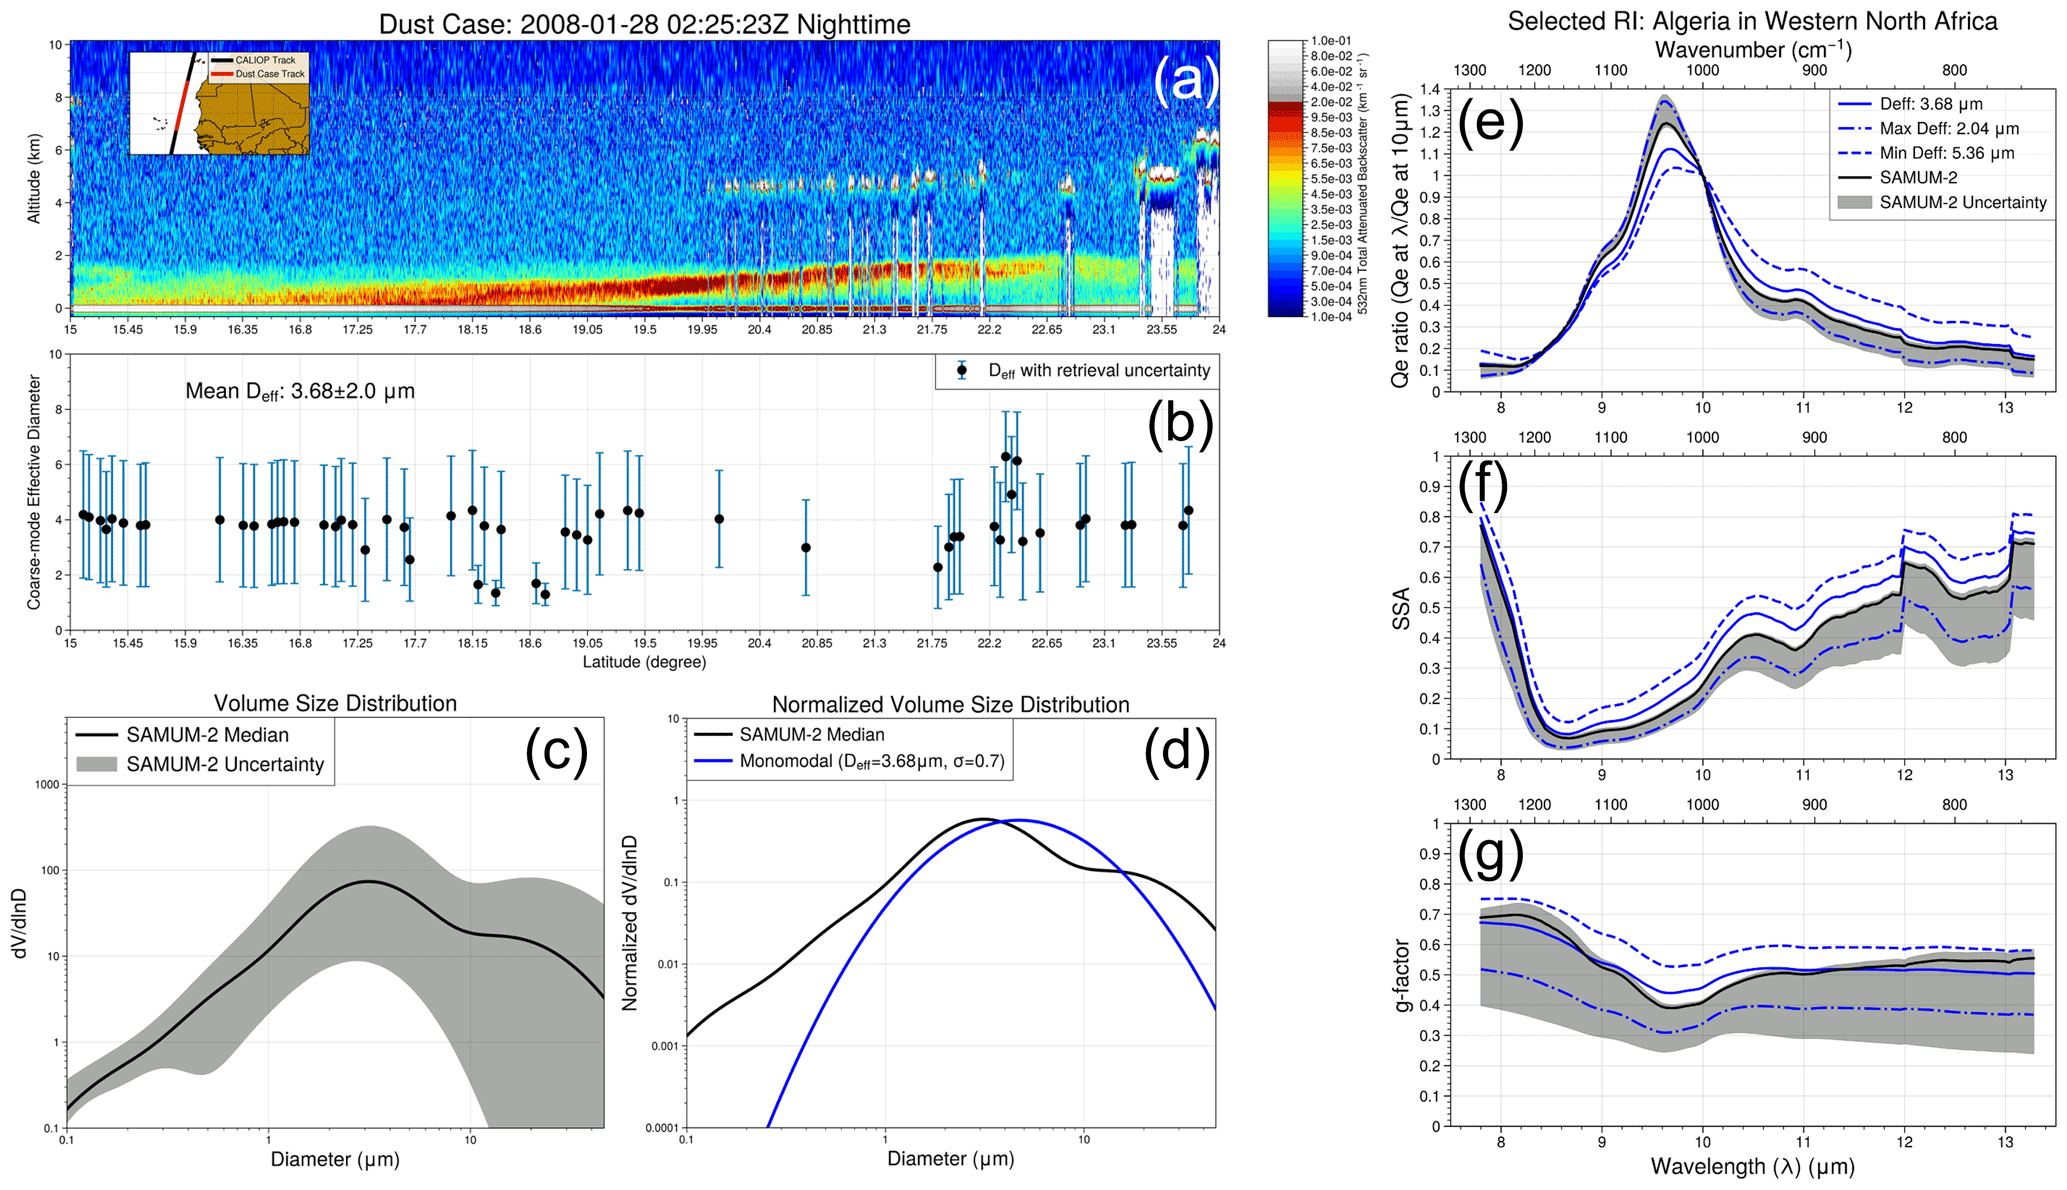
Figure 6(a) The CALIOP total attenuated backscatter at 532 nm on 28 January 2008 over the downwind region of the Sahara (the orbit at upper left). (b) The retrieved Deff (black dots) of the cloud-free dust-laden profiles with the retrieval uncertainty (cyan error bars). (c) The volume lognormal (dV / dlnD) SAMUM-2 PSD (black) with the gray shadow area indicating the range of the measurement value from the 3rd to 97th percentile obtained from Weinzierl et al. (2011). (d) The normalized dV / dlnD of SAMUM-2 (black) and the retrieved coarse-mode PSD corresponding to Deff=3.68 µm (blue). (e–g) The Qe to 10 µm ratio (e), SSA (f), g factor (g) calculated based on the SAMUM-2 PSD (black) with its uncertainty (gray area) and the retrieved coarse-mode PSD (blue) with the retrieval uncertainty (dashed blue curve for the lower bound; dashed–dotted blue curve for upper bound).
For a perhaps more relevant comparison of the three PSDs in coarse mode, we compare their corresponding optical properties, namely the dust Qe ratio at 10 µm, SSA and g factor in the TIR spectrum ranging from 8 to 13 µm (see Fig. 5c to e). The reason for using the dust Qe ratio at 10 µm is that the retrieved DAOD10 µm provides a constraint of dust extinction at 10 µm, while the dust PSD further determines the spectral Qe ratio of other TIR wavelengths to 10 µm. We found that the spectral Qe ratio, SSA and g factor calculated based on the monomodal PSD used in our retrievals are consistent with those calculated based on AER-D PSD. It demonstrates that, although our monomodal PSD lacks fine-mode dust, the retrieved Deff can still provide almost identical dust optical properties in TIR as the AER-D PSD has based on the constraint from the retrieved DAOD10 µm. In other words, the combination of DAOD10 µm and Deff with comparable accuracy as in situ measurements but better spatiotemporal coverage is a valuable tool for reducing the global mean LW dust DRE uncertainties due to DAOD and dust particle size.
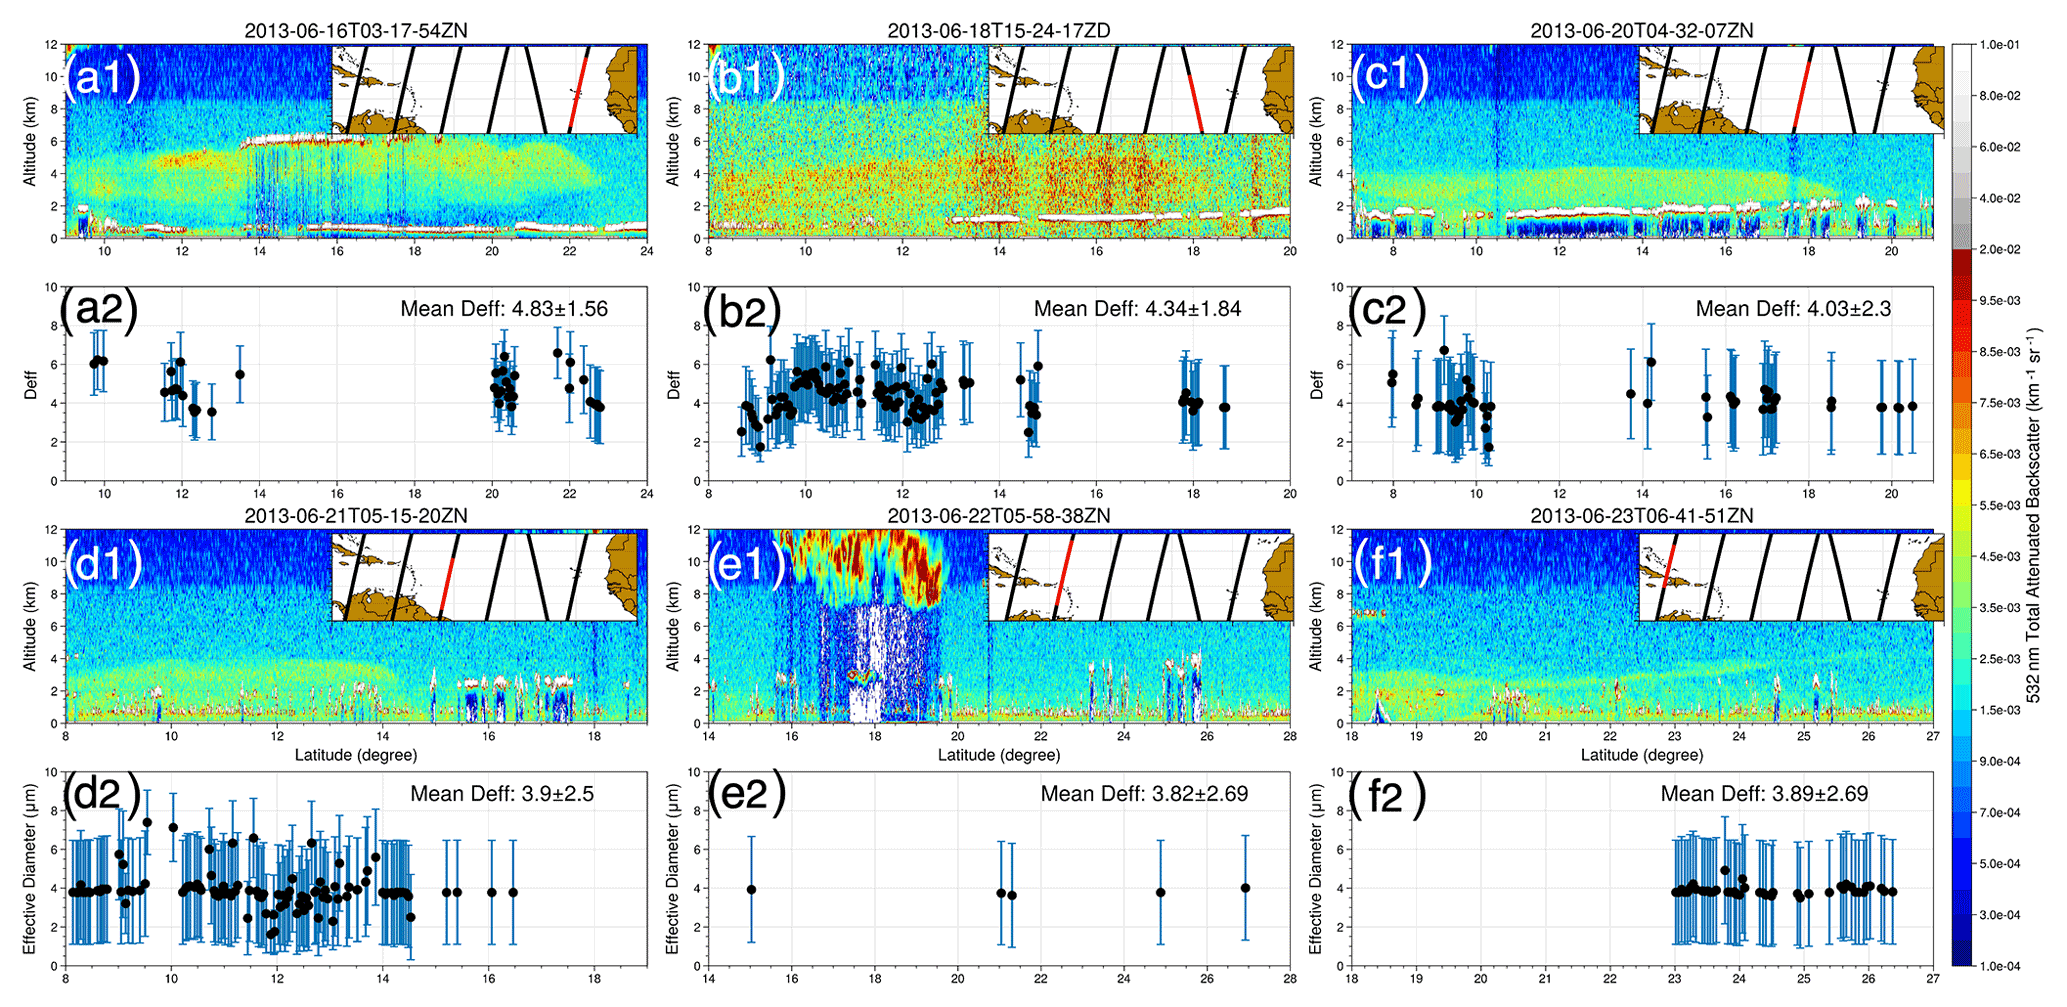
Figure 7(a1–f1) The CALIOP total attenuated backscatter at 532 nm on 16 June (a1), 18 June (b1), 20 June (c1), 21 June (d1), 22 June (e1) and 23 June (f1) 2013 (the orbit at upper left). (a2–f2) The retrieved Deff (black dots) of the cloud-free dust-laden profiles with the retrieval uncertainty (cyan error bars) corresponding to a1 to f1.
On the other side, all three optical properties calculated based on the AERONET PSD are bias low compared with those based on AER-D and the retrieved PSD. As the fine-mode PSD has a negligible impact on dust optical properties in TIR, the result suggests that the AERONET coarse-mode PSD is highly likely to be underestimated in terms of size, which has been pointed out in several studies comparing AERONET PSD with other in situ measurements (Müller et al., 2010, 2012; McConnell et al., 2008; Adebiyi et al., 2023). Due to the difficulties of comparing the PSD from the column-integrated retrieval to that from the lofted-layer measurement (Toledano et al., 2019), the possible reasons are as yet not well explained, which require detailed investigations in the future.
4.2 Evaluation of Deff with SAMUM-2 and SALTRACE in situ measurements
Noting that limiting the validation of Deff with one case may be biased. To better demonstrate the reliability of the Deff retrieval, we compare the retrieved Deff with in situ-measured dust PSDs from two additional field campaigns. One is from the second field experiment of the Saharan Mineral Dust Experiment (SAMUM-2) project in the Cape Verde area during January to February 2008 (Weinzierl et al., 2011). The other is the Saharan Aerosol Long-Range Transport and Aerosol–Cloud-Interaction Experiment (SALTRACE) that takes place over north Africa, the Atlantic Ocean and the Caribbean from June to July 2013 (Weinzierl et al., 2016).
4.2.1 Comparison of Deff with SAMUM-2 – a case over Cape Verde in winter
To compare the Deff retrieval with the SAMUM-2 campaign, we perform the retrieval for a nighttime dust case observed eastward of Cape Verde on 28 January 2008, as shown in Fig. 6. Figure 6a shows the dust case is a low-altitude-level case up to ∼2 km, consistent with the dust sampling of the experimental flights on 28 January in SAMUM-2 (see Table 2 and Fig. 9 in Weinzierl et al. (2011)). As shown in Fig. 6b, the mean retrieved Deff is 3.68 µm, which is further used to construct the corresponding PSD for the comparison with SAMUM-2 dust PSD (see Fig. 6c). In this case, we implement the retrieval using the RI assignments introduced in Sect. 3.1.2 and Appendix C instead of performing HYSPLIT back trajectories to identify dust source regions. In addition, this wintertime dust case has lower dust loading (not shown) than the summertime case in Sect. 4.1, leading to lower information content for retrieving Deff (see Fig. 2a). Therefore, there is a mean retrieval uncertainty of 2.0 µm larger than the summertime case.
In Fig. 6d, we found that the monomodal PSD corresponding to the mean retrieved Deff agrees with the SAMUM-2 PSD by having the peak between the third and fourth modes of the SAMUM-2 PSD. Due to the limitation of the fixed assumption of the lognormal volume distribution's standard deviation, the monomodal PSD overestimates dust with Dp from 4 to 13 µm but underestimates dust with Dp>13 µm. Because of that, the Qe ratio, SSA and g factor corresponding to the monomodal PSD have slight differences from that of the SAMUM-2 PSD in the TIR spectral region. However, the dust TIR optical properties of the two PSDs are generally consistent after considering their uncertainties. It shows the Deff retrieval's capability to capture the seasonal differences in dust size in the Cape Verde area revealed by the AER-D and SAMUM-2 field campaigns.
4.2.2 Comparison of Deff with SALTRACE – a dust case transport throughout the North Atlantic from 12–23 June 2013
In order to evaluate the Deff retrieval at long-range transport regions and demonstrate the variation in Deff during the transport, we compare our results with the dust Deff measured during the SALTRACE field experiment that studied a Lagrangian dust plume over both Cape Verde (SALTRACE-E) and Barbados (SALTRACE-W) on 17–22 June 2013.
First of all, we perform the retrieval on a series of MODIS–CALIOP observations from 16 June within the Cape Verde area to 23 June over the Caribbean Sea, as shown in Fig. 7. In Fig. 7a, the dust plume was vertically distributed between 2 to 6 km, with the mean retrieved Deff at 4.8 µm (Fig. 7a2) on 16 June. From 18 to 20 June, the dust plume was transported to the mid-Atlantic (∼43∘ W) and decreased the layer height from 2–5 to 2–4 km (Figs. 7b1 and 9c1). Meanwhile, the mean retrieved Deff reduced from 4.3 to 4.0 µm (Fig. 7b2 and 7c2). Figure 7d1 to 7f1 show that the dust plume traveled toward the Caribbean Sea from 21 to 23 June, maintaining the layer height between 1.5 and 3.5 km and the retrieved Deff at ∼3.9 µm (Fig. 7d2 to 7f2). During the transport, the dust loading is also decreasing (see Fig. 7a1 to 7f1), leading to lower information content for retrieving Deff (see Fig. 2a) and, therefore, relatively higher retrieval uncertainty (error bars in Fig. 7a2 to 7f2).
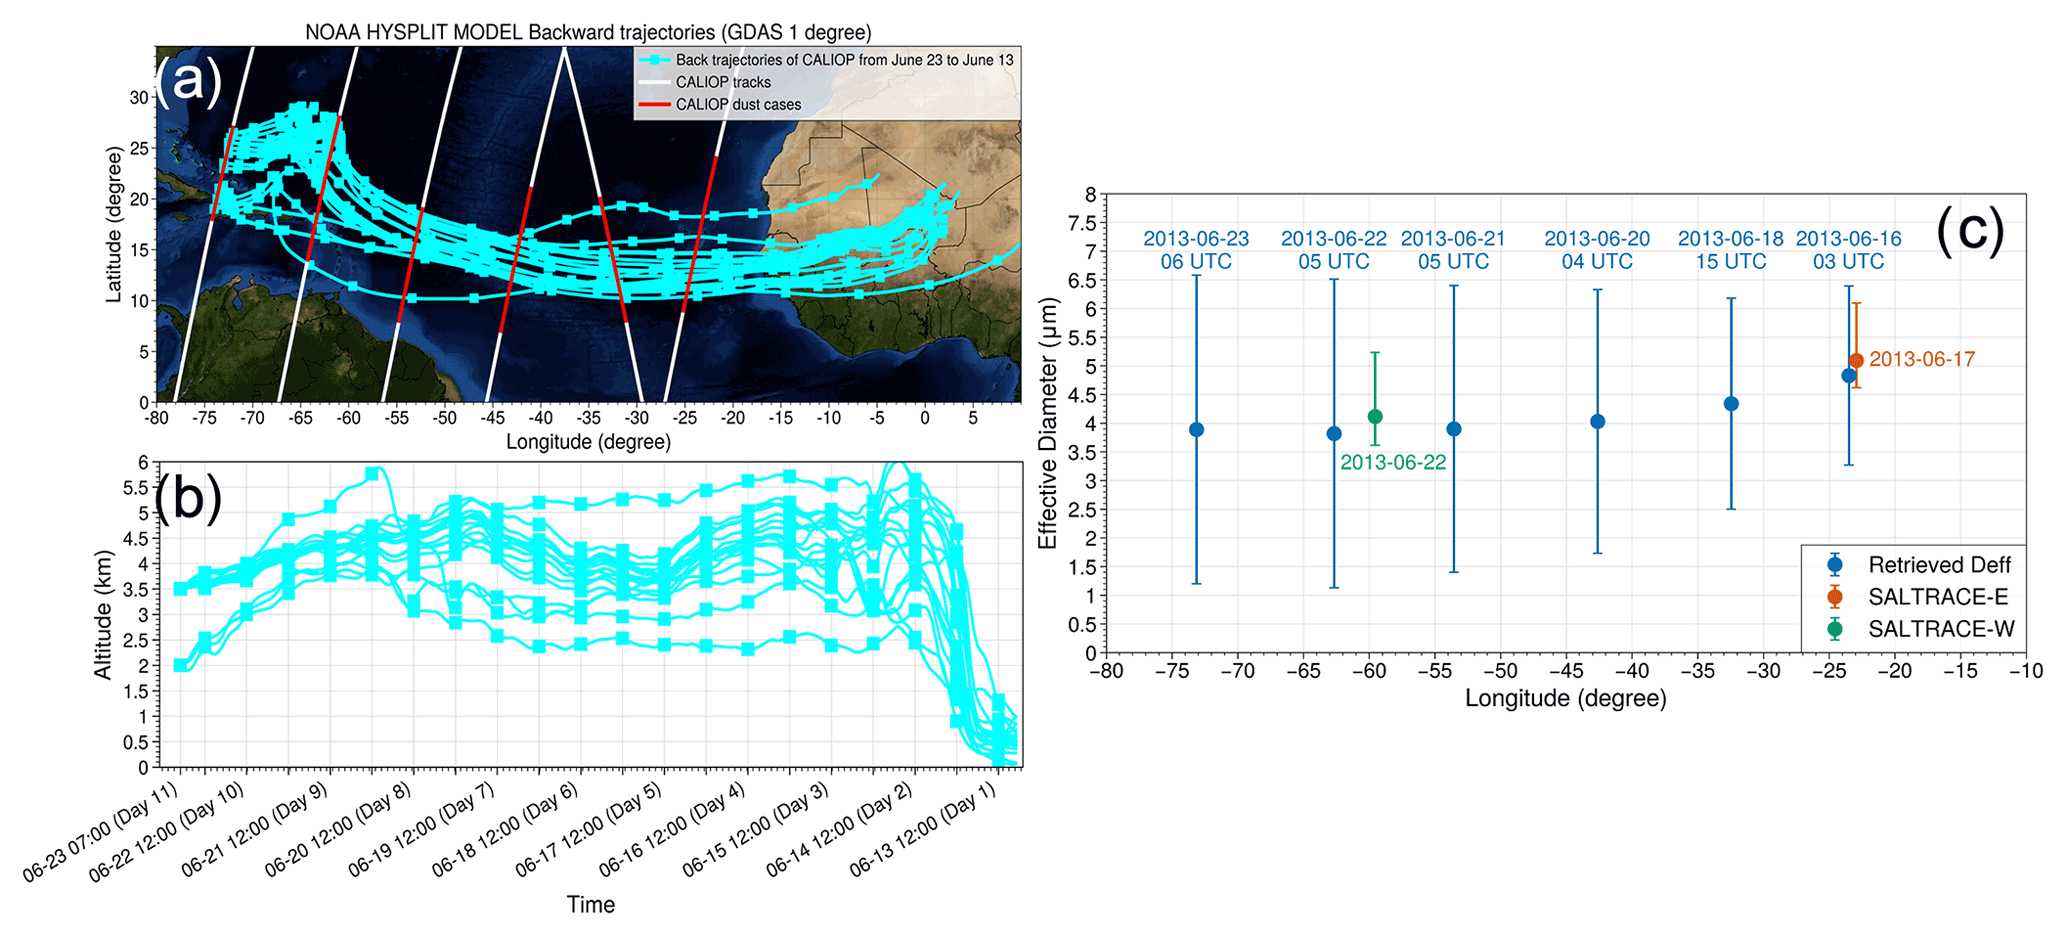
Figure 8The distribution of the spatial (a) and the vertical (b) ensemble HYSPLIT back trajectories on the CALIOP dust case from 23 June 2013 back to 12 June 2013 (cyan rectangle with solid lines). The solid white curves represent the MODIS–CALIOP orbit tracks that observed the dust cases presented in Fig. 7, which are highlighted with red curves. (c) The Deff versus the longitudes of the MODIS–CALIOP retrievals in Fig. 7 (blue dots), the SALTRACE-E at Cape Verde (red dot) and the SALTRACE-W at Barbados (green dot). The corresponding error bars represent their retrieval uncertainties and in situ-measured uncertainties.
To prove that the MODIS–CALIOP observations snapshotted the transport processes of the same dust case that SALTRACE observes, we present the HYSPLIT back trajectories started from the MODIS–CALIOP observation on 23 June over the Caribbean Sea, as shown in Fig. 8. We set the dust layer heights at 2 and 3.5 km at the starting point (see Fig. 8b) to serve as the vertical boundaries of the observed dust plume on 23 June (Fig. 7f1). Figure 8a shows that the dust event originated from the north African source regions identified during SALTRACE (see Fig. 5 in Weinzierl et al., 2016) before 13 June. In addition, the dust case has transport trajectories overlapping with the MODIS–CALIOP-observed dust plumes presented in Fig. 7. Comparing Fig. 8b with Fig. 7a1 to 7f1, we found that the vertical height of the dust plume varies between 2 and 6 km during transport, which agrees with the vertical dust distribution observed by MODIS–CALIOP. Therefore, we conclude that the MODIS–CALIOP dust cases observe the same dust case as SALTRACE. However, we notice that the MODIS–CALIOP observational times are not perfectly consistent with the back trajectory times, implying that the retrievals presented in Fig. 7 may not be the properties of the same air mass in the dust event as observed by SALTRACE. Thus, we do not expect a perfect agreement between our retrieved Deff and the SALTRACE measurements.
Figure 8c shows the retrieved mean Deff of the MODIS–CALIOP-observed dust plumes in Fig. 7 and the Deff of SALTRACE-E at Cape Verde and SALTRACE-W at Barbados. The retrieved Deff on 16 June over Cape Verde (4.8 µm) is close to that of SALTRACE-E (5.1 µm). During the transport from Cape Verde (23∘ W) to the mid-Atlantic (43∘ W), the Deff decreases from 4.8 to 4.0 µm. Approaching Barbados and further the Caribbean Sea, the Deff remains at 3.9 µm, which is also close to that of SALTRACE-W (4.1 µm). It validates the Deff retrieval in both the short-range and long-range transport regions and demonstrates the retrieval's capability of revealing the transport process of dust coarse-mode particle size in a better spatiotemporal resolution than in situ measurements.
5.1 Comparison of DAOD10 µm with IIR-based DAOD10.6 µm and IASI-based DAOD10 µm
In addition to the presented case studies, the statistical evaluation of satellite-based retrieval of DAOD usually assumes the AERONET AOD in VIS as the benchmark. However, the comparison between DAOD10 µm and AERONET AOD necessitates the conversion of DAOD from TIR to VIS, which introduces additional uncertainties stemming from the assumed thermal to visible DAOD ratios. Moreover, in our case, a pixel-by-pixel comparison with AERONET poses challenges as CALIOP has limited spatial coverage, thus providing inadequate AERONET-collocated samples.
Therefore, in this section, we statistically evaluate the MODIS–CALIOP DAOD10 µm by comparing it with the three independent TIR-based satellite-retrieved DAODTIR datasets that are rigorously assessed through comparisons with AERONET COD500 nm. The first one is the nighttime-only IIR-based DAOD10.6 µm from Z22. Note that the IIR-based retrieval has two DAOD10.6 µm datasets based on two different dust PSD assumptions. We use the one based on the Fennec SAL PSD from Ryder et al. (2013a) (referred to as Fennec SAL DAOD10.6 µm) recommended by Z22. The second one is the IASI-based dataset, as mentioned in Sect. 1. It retrieves DAOD10 µm and mean dust-layer altitude based on a two-step LUT method developed by the research group at the Laboratoire de Météorologie Dynamique (LMD) (referred to as IASI-LMD). The third one retrieves DAOD10 µm using IASI based on an artificial neural network (NN) method developed by the research group at the Université libre de Bruxelles (ULB) (referred to as IASI-ULB) (Clarisse et al., 2019).
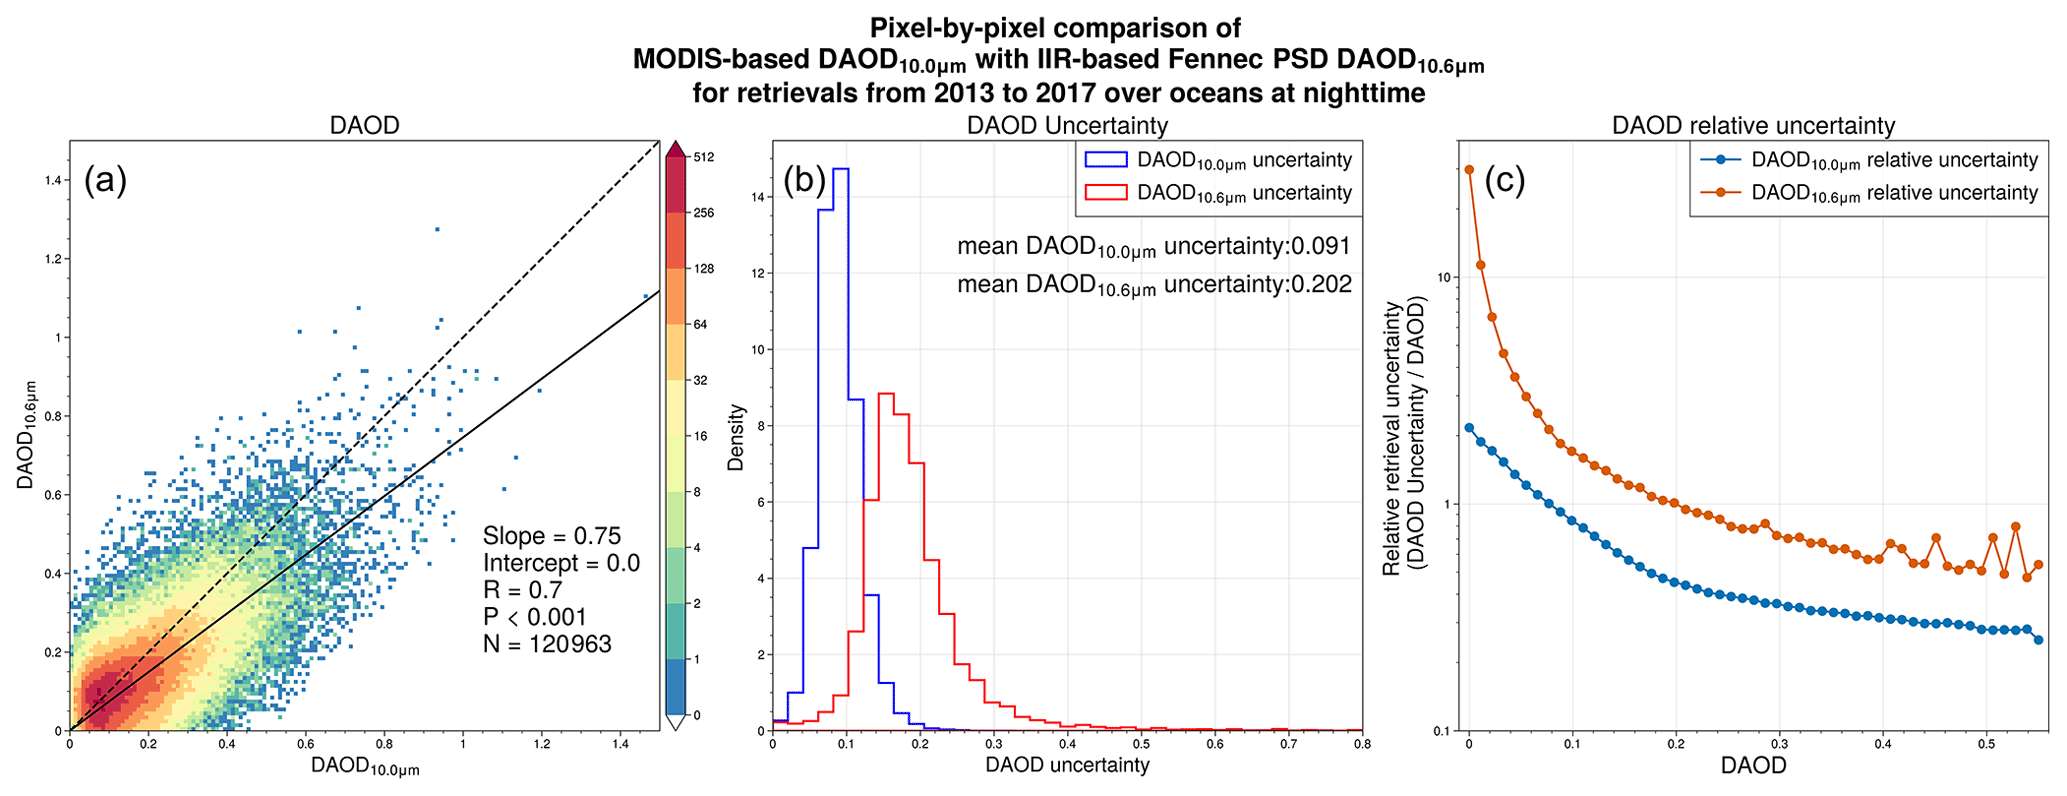
Figure 9The pixel-by-pixel comparison of MODIS–CALIOP DAOD10 µm with the IIR-based Fennec SAL DAOD10.6 µm from Z22 for retrievals from 2013 to 2017 over oceans during nighttime. (a) The joint histogram of DAOD10 µm and DAOD10.6 µm. The solid black line is the linear regression of the two datasets. The R, P and N at the lower right represent the Pearson correlation coefficient, p value and the number of pixels of the linear regression. (b) The probability density function (PDF) of DAOD10 µm uncertainty (blue) and DAOD10.6 µm uncertainty (red). (c) The mean relative retrieval uncertainty (i.e., DAOD uncertainty/DAOD) in DAOD10 µm (blue) and DAOD10.6 µm (red). The y axis is on a logarithmic scale.
As the IIR Fennec SAL DAOD10.6 µm can be easily collocated with the MODIS–CALIOP DAOD10 µm, we perform a pixel-by-pixel comparison between the two datasets using the 5-year retrievals from 2013 to 2017 during nighttime based on a two-step collocation method. As mentioned in Z22, the IIR-based retrieval is implemented on samples with the estimated DAOD532 nm>0.05, while the MODIS–CALIOP retrieval does not carry this limitation. Consequently, we first choose the MODIS–CALIOP DAOD10 µm with the corresponding estimated DAOD532 nm>0.05 in both products. Note that the MODIS–CALIOP DAOD10 µm is retrieved simultaneously with Deff, while the IIR Fennec SAL DAOD10.6 µm was retrieved with a fixed Deff ∼6.7 µm. Therefore, to control the dust PSD impact on the retrieved DAOD, we further select the MODIS–CALIOP DAOD10 µm with Deff ranging from 4 to 8 µm to collocate with the Fennec DAOD10.6 µm.
As shown in Fig. 9a, the DAOD10 µm correlates with DAOD10.6 µm with R=0.7 and with DAOD10.6 µm being systematically lower than DAOD10 µm by 25 % (slope = 0.75). The difference may be attributed to the spectral difference between 10.0 µm and 10.6 µm (see Fig. 5c), which ranges from 0.5 to 0.8 for Deff ranging from 4 to 8 µm. In addition to spectral differences, several factors may have caused the variability in the collocated pixels between the two datasets. Firstly, although the collocated DAOD10 µm is pre-selected based on Deff, the impact of dust PSD on the retrieved DAOD still exists, as it is challenging to find enough pixels with the same Deff as the Fennec SAL observation. Secondly, the treatments of RI in the two studies are also different. In Z22 a relatively simple method is used to assign the Di Biagio RI to different regions, while we utilize the DustCOMM-2021 to help assign the Di Biagio RI in this study (see Appendix C). Furthermore, the MODIS–CALIOP retrieval has evolved from the IIR-based retrieval from Z22 with three improvements, namely the lower detector noise from MODIS, the improved retrieval methods and the enhanced dust RI assumptions. These differences may also have directly affected the pixel-by-pixel comparison.
Thanks to the abovementioned improvements, in Fig. 9b, the histogram of the absolute DAOD uncertainty in DAOD10 µm is reduced by ∼55 % from 0.2 to 0.09 in terms of the mean value compared with that in DAOD10.6 µm. In Fig. 9c, the relative uncertainty in DAOD10 µm is substantially reduced compared with that in DAOD10.6 µm, especially for retrievals with small DAOD values (e.g., DAOD10 µm<0.1). Consequently, we conclude that the MODIS–CALIOP DAOD10 µm is generally consistent with the IIR-based DAOD10.6 µm from Z22 with a substantial improvement regarding the retrieval uncertainty.
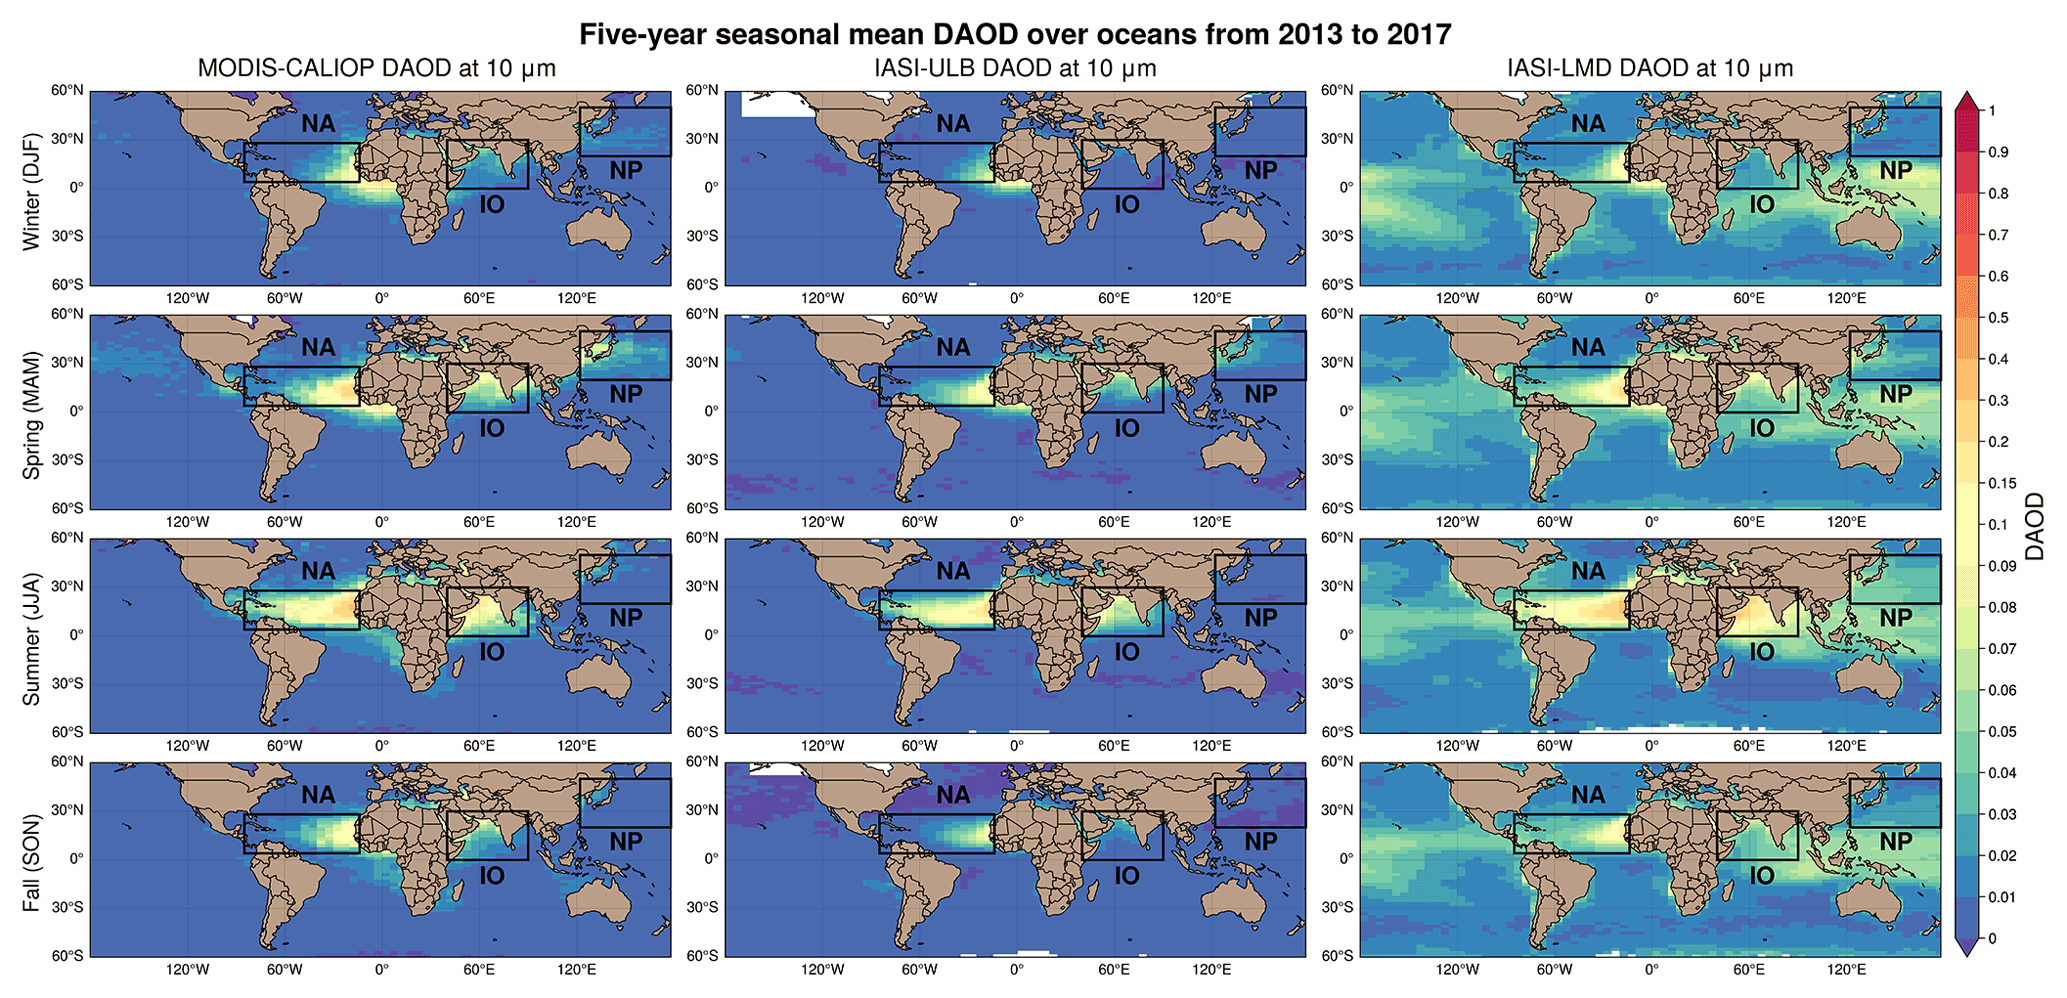
Figure 10The 5-year seasonal mean DAOD10 µm comparison between the retrieval of MODIS–CALIOP (left column), the IASI-ULB and the IASI-LMD. From the top row to the bottom row seasons from winter to fall are presented. The black boxes indicate the three defined dust transport regions: North Atlantic (NA; 4–30∘ N, 90–14∘ W), Indian Ocean (IO; 0–30∘ N, 40–90∘ E) and North Pacific (NP; 20–50∘ N, 120–180∘ E).
Unlike the comparison with the IIR-based retrieval, the orbit difference between the MODIS–CALIOP and IASI observations and the cloud-free dust sampling difference between the corresponding retrievals prevent the pixel-by-pixel comparison with the level-2 data (Zheng et al., 2022). Therefore, we alternatively perform the climatological comparison among the aggregated 2∘ latitude by 5∘ longitude level-3 seasonal mean MODIS–CALIOP, IASI-LMD and IASI-ULB DAOD10 µm based on 5-year data from 2013 to 2017 in both daytime and nighttime. The 2∘ by 5∘ seasonal mean IASI-LMD and IASI-ULB DAOD10 µm is aggregated from the corresponding 1∘ by 1∘ monthly mean level-3 products. Note that both seasonal mean IASI DAODs are divided by the total number of AOD samples. To be consistent, in our retrieval, the seasonal mean DAOD10 µm is averaged by the total number of cloud-free aerosol samples (Naerosol in Fig. S10).
Figure 10 shows the seasonal mean DAOD10 µm over oceans in both daytime and nighttime averaged by 5-year retrievals of MODIS–CALIOP (left column), IASI-ULB (middle column) and IASI-LMD (right column) from 2013 to 2017. Similarly to Z22, we highlight three dust transport regions, the North Atlantic (NA), Indian Ocean (IO) and North Pacific (NP), and define the rest of the areas as non-dust-dominated regions.
In terms of seasonal variation, the MODIS–CALIOP retrieval captures the seasonal patterns of DAOD over the three dust transport regions well compared with IASI-ULB and IASI-LMD. Over non-dust-dominated regions, the MODIS–CALIOP DAOD10 µm agrees more with IASI-ULB, while IASI-LMD DAOD10 µm is bias high (∼0.05). In boreal winter, DAOD10 µm over the tropical and southern Atlantic reaches the peak, indicating that dust emitted from north Africa is transported southwestward and reaches South America due to the south-shifted northeasterly Harmattan wind (Marticorena et al., 2010). Dust transport westward over NP originates from east Asian source regions, such as the Gobi Desert and Taklimakan Desert, with peak emission in the spring (Yu et al., 2010). Therefore, DAOD10 µm over NP is found at its peak in spring, mainly driven by mid-latitude westerly jets with relatively high altitudes (>5 km). Because of the higher altitude of Asian dust compared with north African dust, it also has a longer transport distance to reach NP and even North America (Huang et al., 2022) but with relatively lower DAOD10 µm (0.05–0.1) compared with that over NA (∼0.2). From spring to summer, dust from north Africa outbreaks in both NA and the Mediterranean Sea and peaks in summer. With the peak emission in north Africa in summer, dust transport to NA has the highest DAOD10 µm (>0.3) and reaches North America with relatively high DAOD10 µm (∼0.1) compared with other seasons. In addition, DAOD10 µm over IO peaks in summer (∼0.2), mainly due to the summer Shamal wind bringing dust from the Arabian Peninsula and traveling southwestward to IO. DAOD10 µm over both NA and IO decreases from summer to fall due to the reduced emission from both source regions.
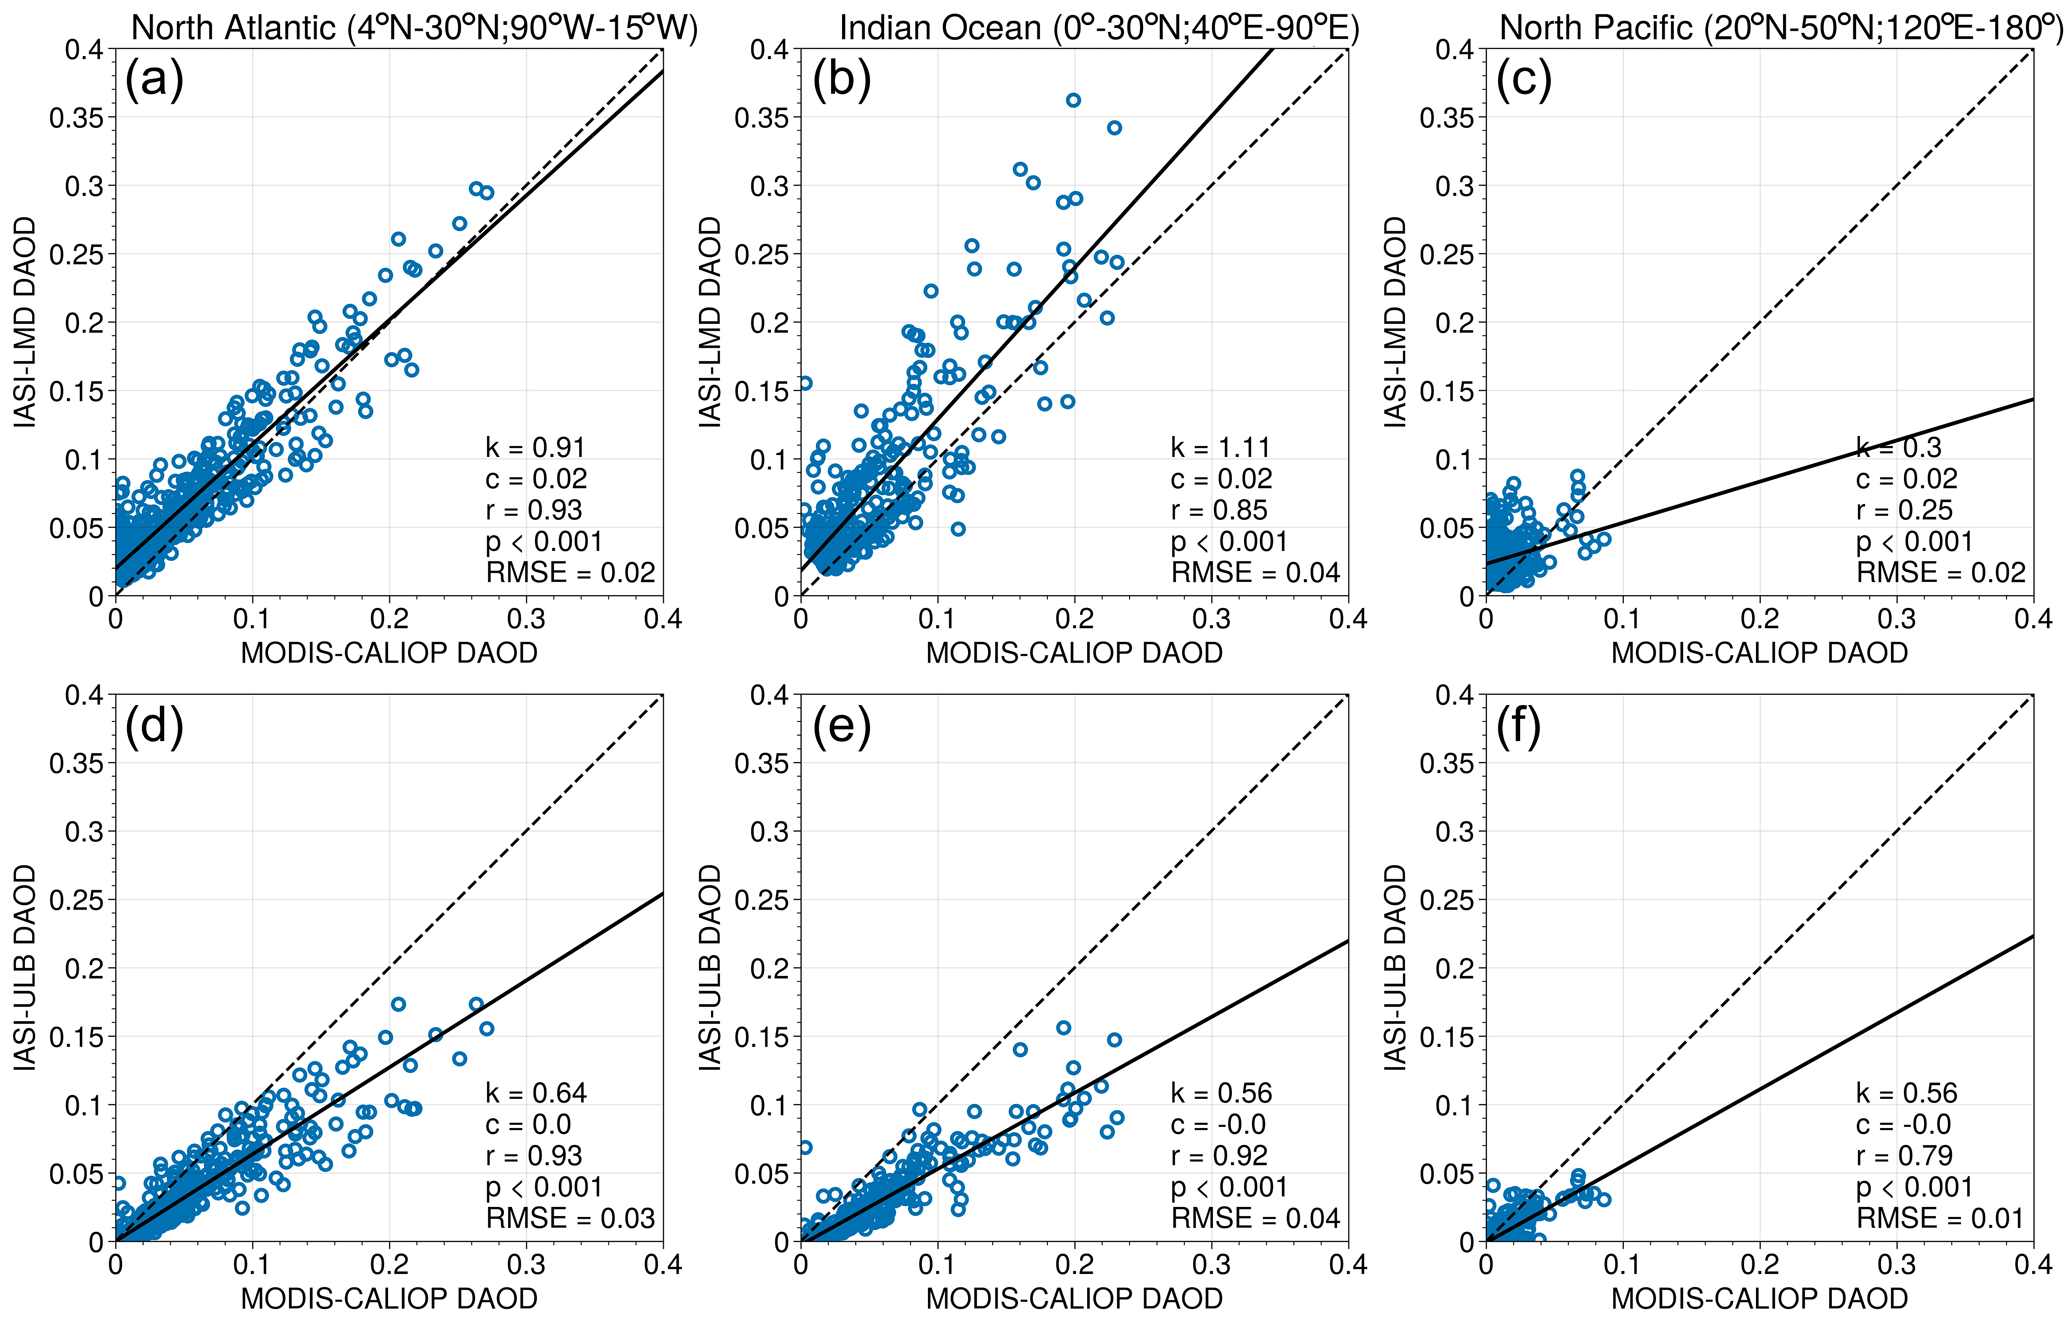
Figure 11The comparisons of the seasonal mean MODIS–CALIOP DAOD10 µm versus IASI-LMD (a, b, c) and IASI-ULB (d, e, f) DAOD10 µm over NA (a, d), IO (b, e) and NP (c, f) from 2013 to 2017. Each point in the scatterplots represents a seasonal mean DAOD10 µm in one of the 2∘ by 5∘ grids for a specific year from 2013 to 2017. The solid black lines are the linear regressions of each comparison, while the dashed black lines are the reference one-to-one lines. The k, c, r, p and RMSE at the upper right of each panel represent each linear regression's slope, intercept, correlation coefficient, p value and root mean square error.
For a more quantitative comparison, Fig. 11 shows the 2-D histogram of all the 2∘ by 5∘ gridded seasonal mean samples in each year from 2013 to 2017 of MODIS–CALIOP DAOD10 µm with the two IASI DAOD10 µm values over the three dust transport regions. MODIS–CALIOP DAOD10 µm over NA and IO is highly correlated and consistent with IASI-LMD DAOD10 µm with R=0.9, 0.8 and k=0.9, 1.1, respectively, as shown in Fig. 11a and b. However, for optically thin dust (e.g., DAOD <0.1), IASI-LMD DAOD10 µm is systematically ∼0.02 greater than MODIS–CALIOP DAOD10 µm, as shown from the intercepts of the linear regression in Fig. 11a and b. In addition, the two datasets have a poor agreement over NP (R=0.2). In contrast, MODIS–CALIOP DAOD10 µm achieves a better correlation over the dust transport regions with IASI-ULB (including NP) than the comparison with IASI-LMD DAOD10 µm (see Fig. 11d–f). It is mainly because both retrievals mostly avoid contamination from sub-pixel clouds and background aerosols, which should be the reason for the high bias of the IASI-LMD optically thin dust (DAOD10 µm<0.1) DAOD10 µm. However, IASI-ULB DAOD10 µm is 40 %–60 % lower than that of MODIS–CALIOP and IASI-LMD DAOD10 µm over the three dust transport regions (k=0.6, 0.5, 0.4 in Fig. 11d–f).
Although the discrepancy between the two IASI-based DAOD10 µm values is non-negligible, the two datasets achieve good agreements with AERONET because the different assumptions of TIR to VIS DAOD ratios offset the DAOD10 µm difference. As they assumed similar dust RIs (e.g., OPAC RIs) and spherical dust, the disagreement of the DAOD10 µm could be due to the different a priori dust PSDs. IASI-ULB assumes a monomodal dust PSD with a geometric mean radius at 0.5 µm (i.e., mean diameter at 1.0 µm). It is much smaller than the IASI-LMD-assumed coarse-mode dust PSD with an effective radius at 2.3 µm (i.e., effective diameter = 4.6 µm), possibly leading to the systematically lower DAOD10 µm compared with MODIS–CALIOP and IASI-LMD DAOD10 µm. Because MODIS–CALIOP Deff has a climatological value ranging from 4.0 to 5.0 (see Fig. 12, detail in Sect. 5.2), which is closer to 4.6 µm, MODIS–CALIOP DAOD10 µm shows better consistency with IASI-LMD DAOD10 µm. This non-negligible dependency of the retrieved DAOD10 µm on dust PSD is also presented in Z22. It highlights the importance of the spatiotemporal variation in dust PSD and the advantage of the observational constraint on both DAOD10 µm and dust coarse-mode PSD from the MODIS–CALIOP retrieval.
5.2 Spatiotemporal variation in dust Deff
One of the main objectives of this study is to provide a climatological view of dust coarse-mode size variation during transport with a global coverage from satellite observations, which has not yet been available in the literature, as far as we know, due to the difficulties mentioned in Sect. 1. In this section, we present the spatiotemporal variation in Deff in terms of seasonal variation, the regional difference among dust transport regions and longitudinal mean variation within dust transport regions based on the 5-year retrieval data from 2013 to 2017.
Different from seasonal mean DAOD10 µm, the denominator of the seasonal mean Deff is the number of samples with successful retrievals only. Noting that the retrieval uncertainty is large for optically thin dust (i.e., DAOD10 µm<0.1; see Fig. 9c), we consider that the seasonal mean DAOD10 µm<0.005 is mainly contributed by optically thin dust and therefore masks the seasonal mean Deff with seasonal mean DAOD10 µm<0.005 to focus on more confident Deff retrievals. We found that the seasonal variation in Deff is highly correlated with that in DAOD10 µm. For example, the largest Deff over NA and IO occurs in summer, while the peak of Deff over NP happens in spring. As dust extinction in TIR is more sensitive to coarse-mode dust (Ryder et al., 2019), it is reasonable to find that the greater the DAOD10 µm, the coarser dust is in the atmosphere.
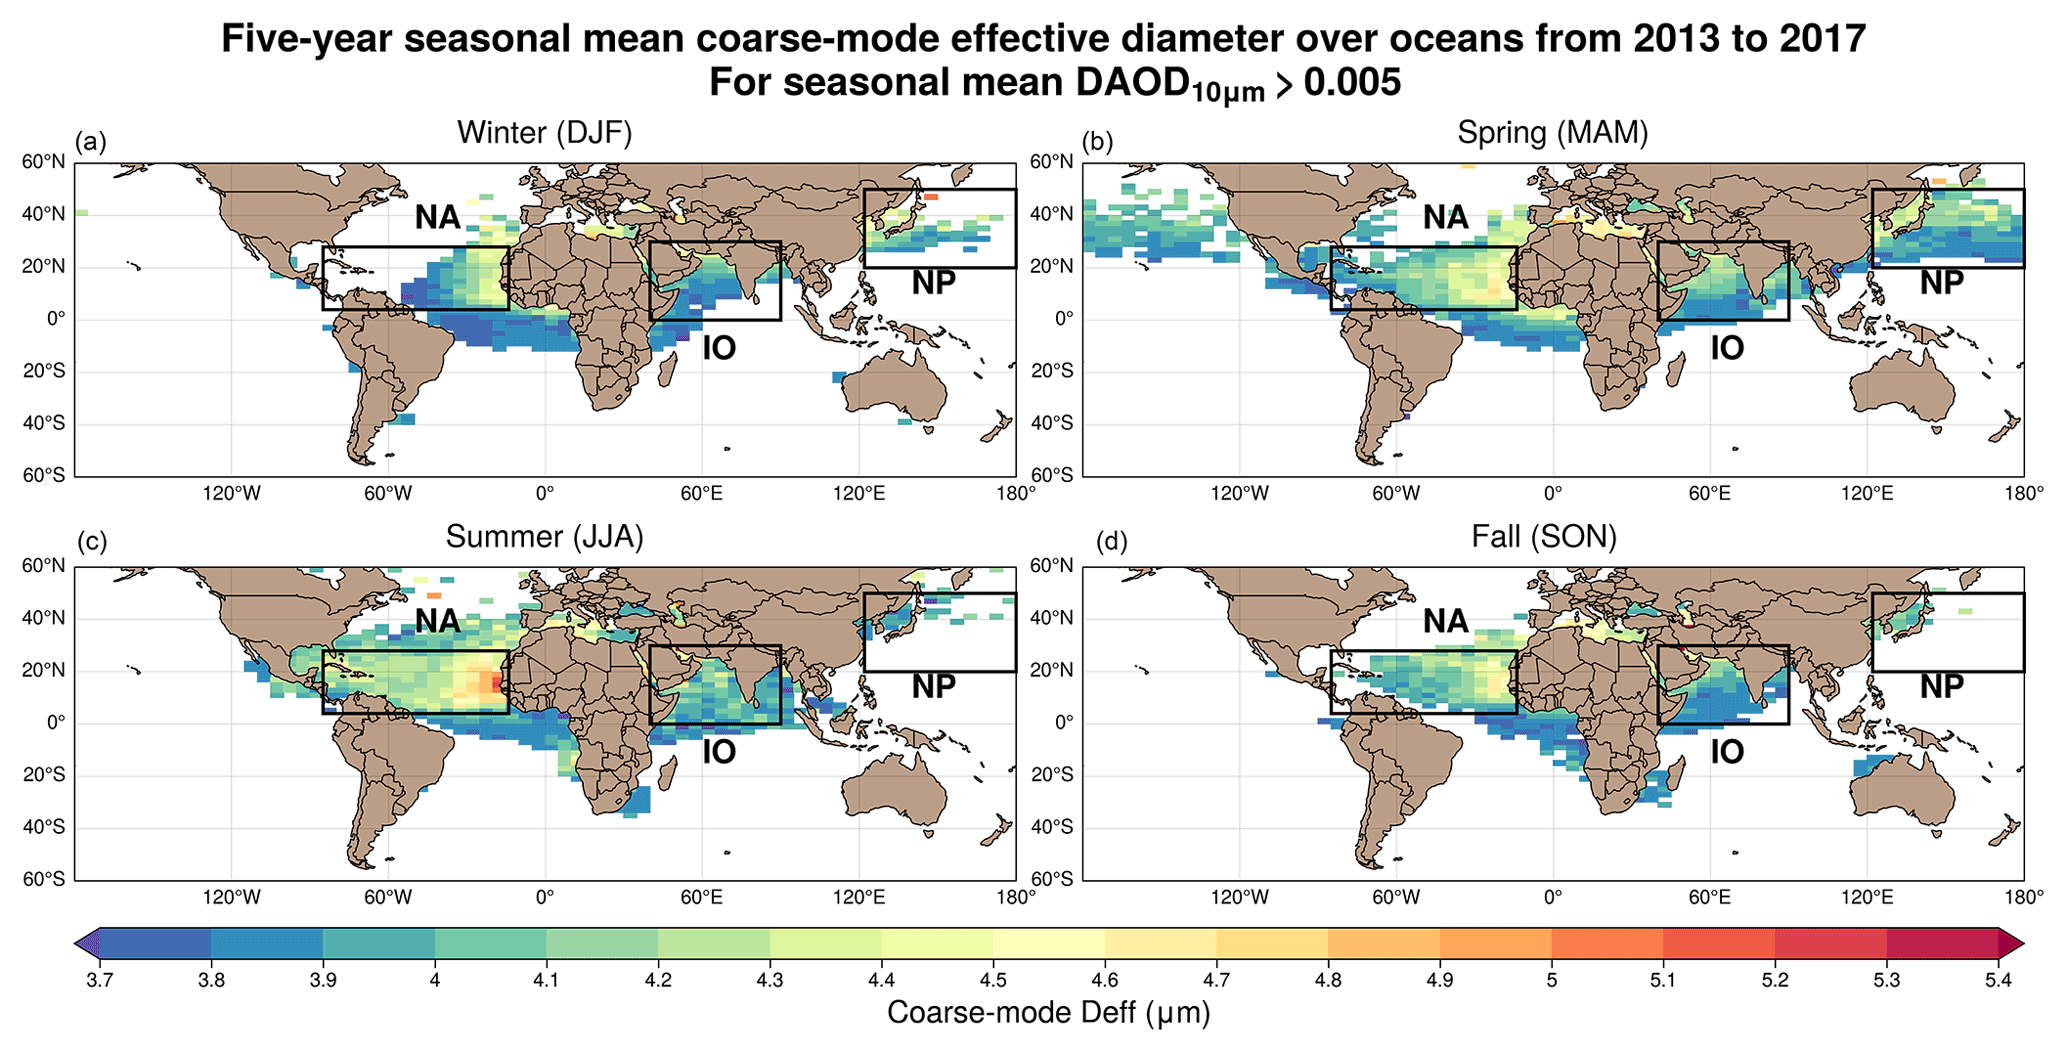
Figure 12The 2013–2017 5-year-averaged seasonal mean Deff masked by the 5-year seasonal mean DAOD10 µm>0.005 in winter (a), spring (b), summer (c) and fall (d). The black boxes indicate the three defined dust transport regions as shown in Fig. 10.
In terms of regional differences, we found that the maximal seasonal Deff over IO (∼4.2 µm in summer, Fig. 12c) and NP (∼4.2 µm in spring, Fig. 12b) is ∼22 % lower than that over NA (∼5.4 µm in summer, Fig. 12c). It suggests that the coarse-mode dust is frequently found over NA but not over IO and NP. It is expected over NP because the transport distance from source regions located in east Asia to NP is much longer than that from north Africa to NA (Alizadeh-Choobari et al., 2014). In addition, the emitted and transported dust PSD from Asia is possible to be finer than that from north Africa and Arabia due to the radiative feedback on dust emission (Woodage and Woodward, 2014). As a result, there is less chance of coarse dust particles surviving until over NP. In contrast, although dust from the Middle East to IO has a similar transport distance as that over NA, less coarse dust particles are found over IO. As the retrieval samples are distributed similarly over the three transport regions for all seasons as shown in Fig. S10, it is less likely to have sampling bias between regions. One potential explanation for the lower presence of coarse dust over IO is that the long-range transport dust from the Middle East is not within elevated mixed layers, such as SAL over NA (Carlson, 2016). These layers trigger static instability and strong vertical turbulence to sustain coarse dust particles for a longer lifetime (Gutleben and Groß, 2021; Gasteiger et al., 2017). However, due to insufficient in situ measurements on dust PSD in the Middle East (Adebiyi et al., 2020), what causes the regional differences in dust particle size after long-range transport remains open and needs further investigation in the future.
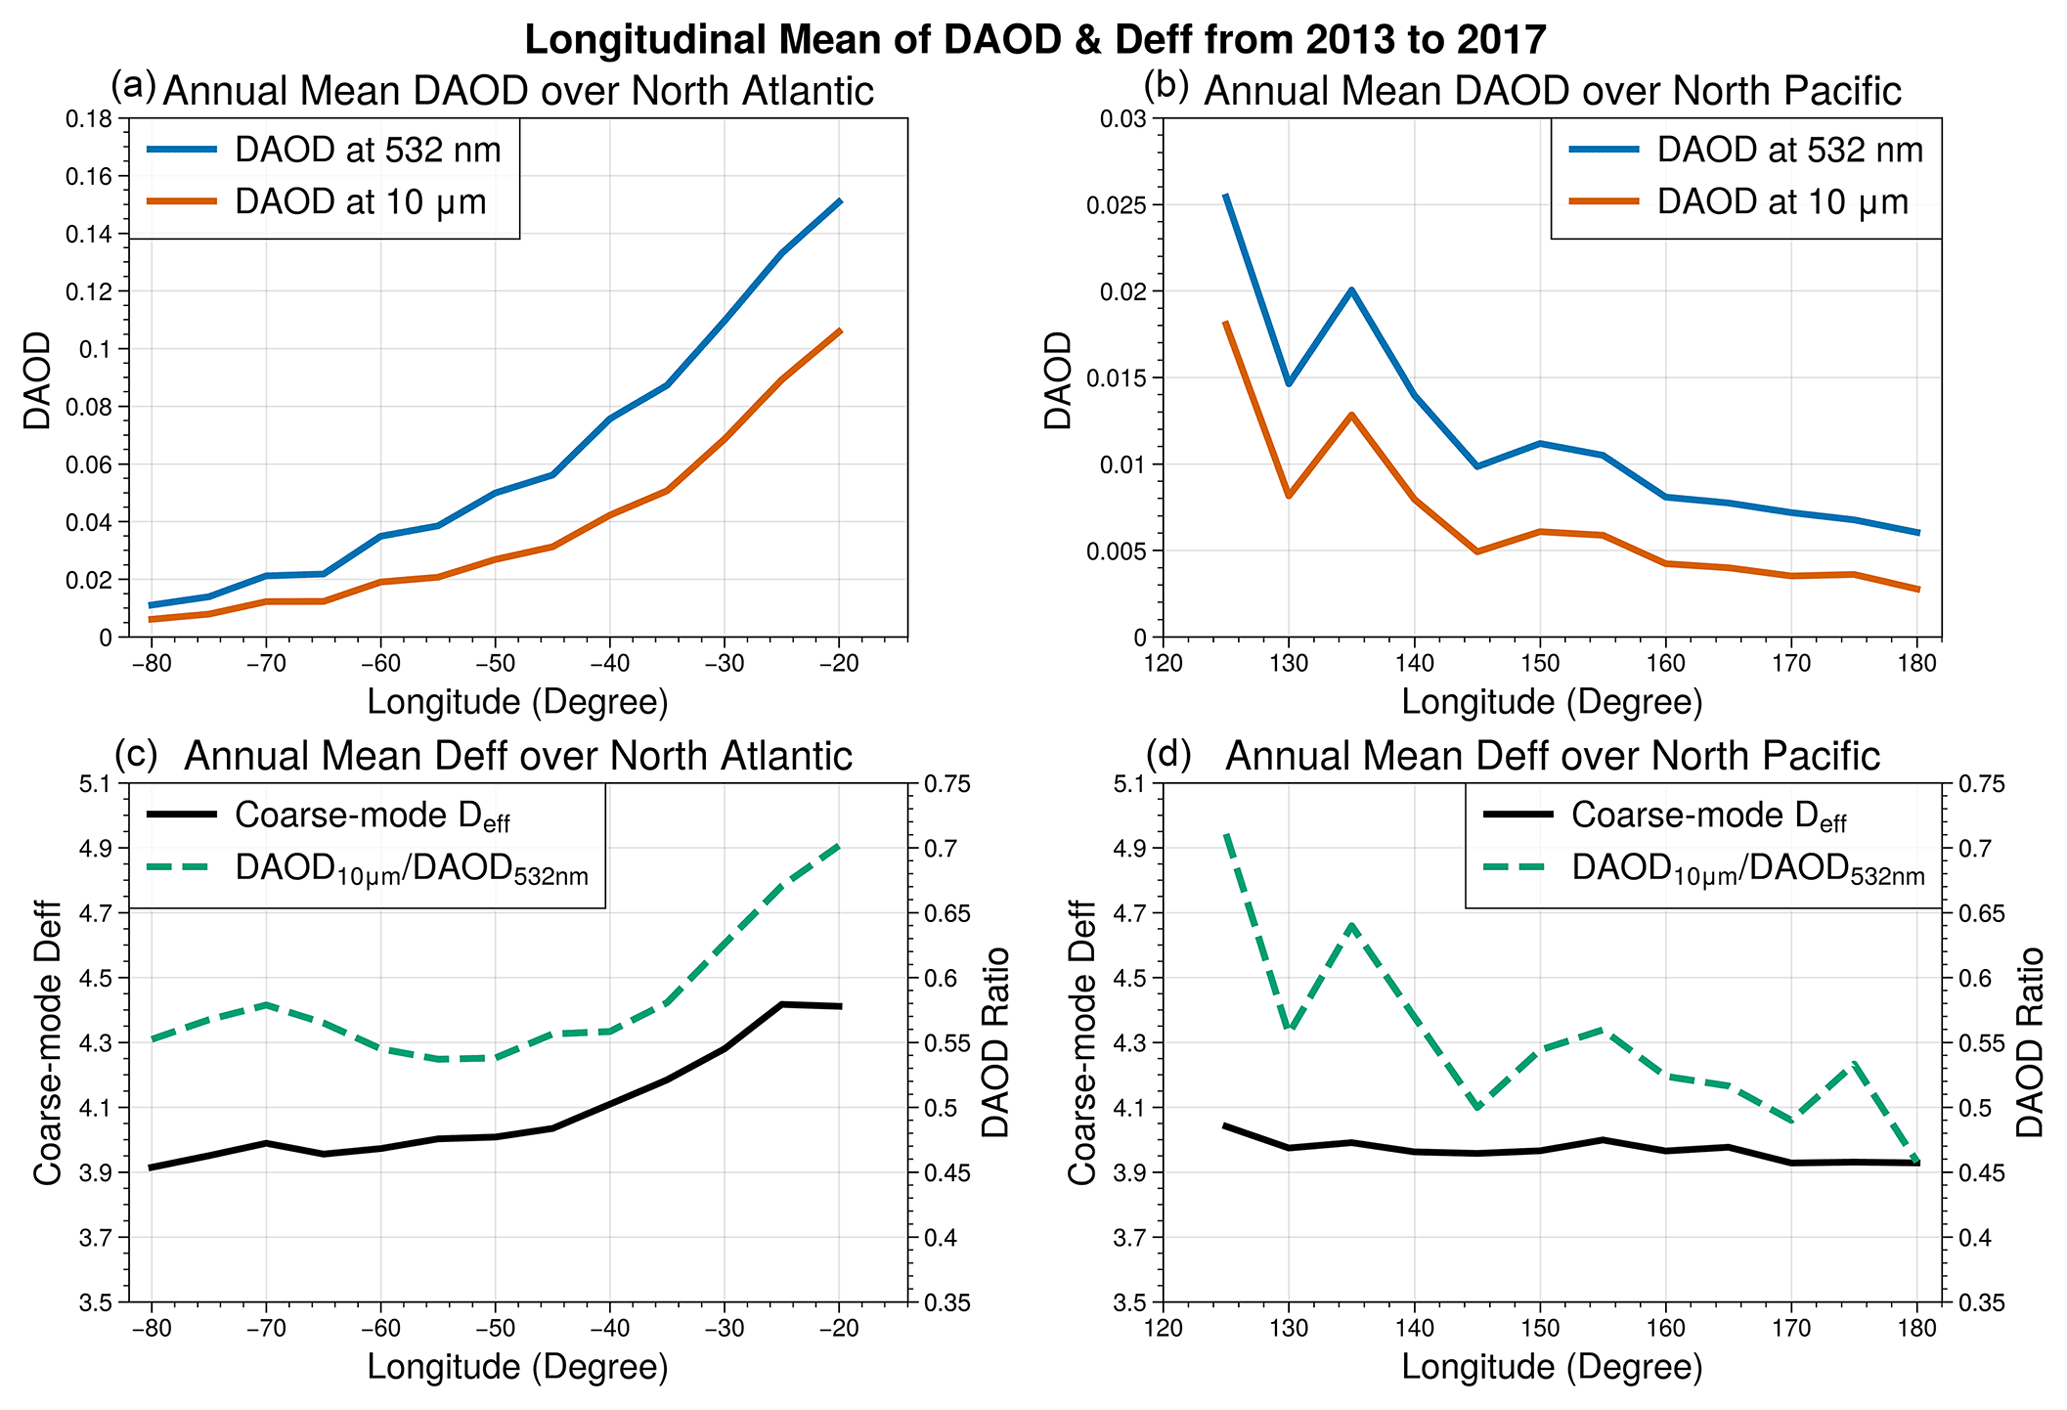
Figure 13The annual longitudinal mean DAOD10 µm (blue curves), DAOD532 nm (red curves), DAOD ratio of DAOD10 µm to DAOD532 nm (dashed green curves), and Deff (black curves) over the North Atlantic (a, c) and the North Pacific (b, d).
As mentioned in Sect. 5.1, the assumed dust PSD impacts heavily on both the retrieved DAOD10 µm and the theoretical TIR to VIS DAOD ratio. Because our retrieval provides simultaneous DAOD10 µm and Deff and the synergetic CALIOP estimated DAOD532 nm, we further investigate the relationship between Deff and the observational-based TIR to VIS DAOD ratio (defined as DAOD10 µm DAOD532 nm). From the view of longitudinal transport for Saharan dust and Asian dust, we demonstrate the annual longitudinal mean DAOD532 nm and DAOD10 µm over NA and NP (Fig. 13a and b). They both show a consistent variation between DAOD532 nm and DAOD10 µm with a decreasing trend westward over NA and eastward over NP, confirming the reliability of the DAOD10 µm retrievals described in Sect. 5.1. Figure 13c shows that the corresponding DAOD ratio over NA decreases by 23 % westward from 18 to 40∘ W and 8 % from 40 to 80∘ W. As coarse-mode particles dominate the dust extinction in TIR, the reduction in the DAOD ratio reflects the faster decrease in DAOD10 µm and, thus, implies a loss of coarse-mode dust loading in the column, which can also be inferred by the decreasing in Deff. In Fig. 13c, we found that the decreasing trends in the Deff and DAOD ratio are highly correlated. It demonstrates a ∼20 % reduction in the DAOD ratio and a ∼7 % decrease in mean Deff during the transport to the mid-Atlantic, while there are less than 10 % and 2 % decreases in the DAOD ratio and mean Deff during the rest of the NA transport. The transport pattern over NA is also similar to the dust case observed by SALTRACE presented in Sect. 4.2.2. However, in Fig. 13d, we found a rapid fluctuation in the DAOD ratio due to the fewer retrieval samples (Fig. S10) and higher retrieval uncertainty from 120 to 140∘ E, which is against Deff's relatively stable decreasing rate. Despite that, we found a less than 10 % reduction in Deff throughout the eastward transport to 180∘, suggesting a stable trend of dust coarse-mode size during the NP transport.
Note that dust particle size varies in the day-to-day transports, which is not visible in the long-term-averaged longitudinal transport. To provide details on the variation in Deff in different size ranges during transport over NA and NP in their peak season, we present the population distribution of Deff longitudinally in summer over NA and spring over NP. We first slice the NA region from 4 to 30∘ N into seven sub-regions at 10∘ longitude intervals, as shown in Fig. 14h. Within each sub-region box, we present the histogram and the cumulative distribution function (CDF) of Deff of all the optically thick dust (i.e., DAOD10 µm>0.1) in the summer from 2013 to 2017. To better visualize the variation in Deff during the transport, within each sub-region box, the histogram and CDF (blue curves in Fig. 14a to g) are compared with those from the previous (i.e., eastward) box (red curves in Fig. 14b to g).
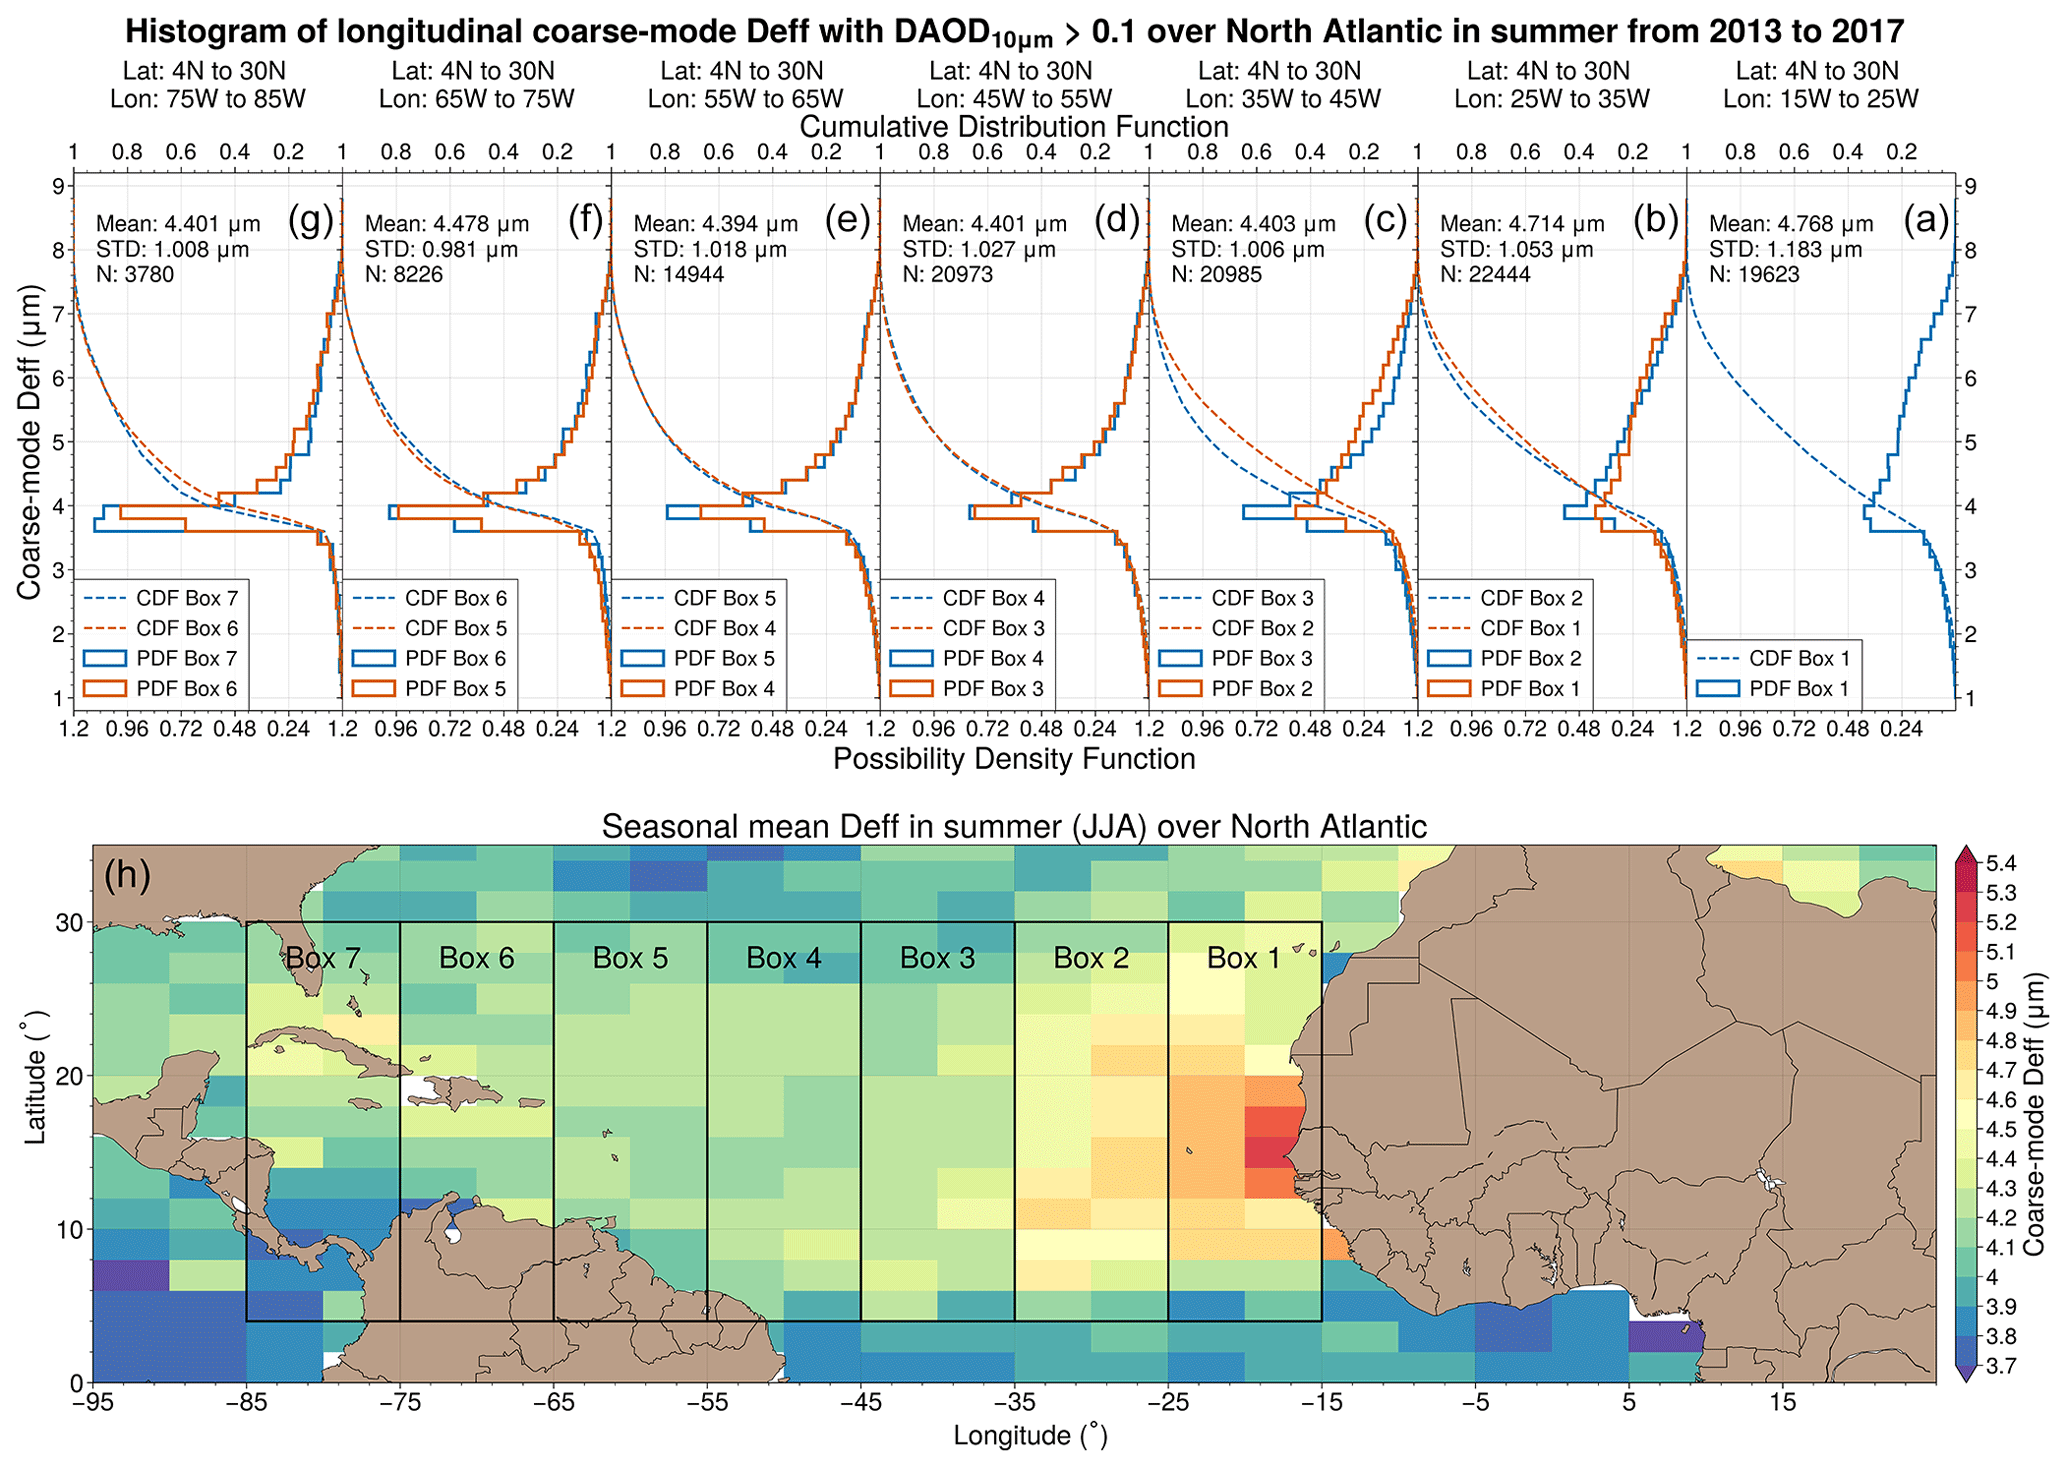
Figure 14The histogram (solid curves with the bottom x axis) and the cumulative distribution function (dashed curves with the top x axis) of Deff with DAOD10 µm>0.1 within each longitudinal box from east to west ranging from 1 (a) to 7 (g) over NA in the summer from 2013 to 2017. Blue curves represent Deff samples within the current box. Orange curves represent Deff samples within the previous box eastward. (h) The geolocation boundaries of each longitudinal box on top of the seasonal mean Deff over NA in the summer from 2013 to 2017.
Figure 14a to b show a slight decrease in the population of Deff greater than 5.5 µm. From Fig. 14b to c, according to the CDFs, the contribution of Deff>5 µm to the total number reduced from 40 % to 20 %. In PDFs, there is a ∼50 % reduction in the population of Deff>5 µm, while ∼20 % more dust with Deff∼4 µm is found, leading to the reduced mean Deff from 4.7 to 4.4 µm. Meanwhile, the peak of the PDFs in Fig. 14a to g remains stable at 4.0 µm, while the number of samples decreases gradually, as shown in the PDFs in Fig. 14d to g, indicating that less coarse-mode dust can be transported to boxes 5 to 7 (55 to 85∘ W).
The result suggests that ∼50 % of relatively coarser dust (Deff>5 µm) tends to drop out when transported to the mid-Atlantic (25 to 35∘ W), which is ∼2000 km away from source regions over north Africa. Afterward, from the mid-Atlantic to the Caribbean Sea, the mean Deff remains almost unchanged, agreeing with the arguments from previous studies suggesting the stabilization of coarse-mode dust PSD during the long-range transport (Weinzierl et al., 2017; Denjean et al., 2016; Ryder et al., 2019). Additionally, dust samples with Deff>5 µm can still be found even at 65 and 75∘ W (see Fig. 14f and g) but with a relatively lower frequency (∼20 %). In other words, super-coarse dust particles, although rare, can possibly still be carried on a long-distance journey during the transport over NA (Van der Does et al., 2018), which act against the gravitational settling theory by Stoke's law (Ginoux, 2003; Bagnold, 1974).
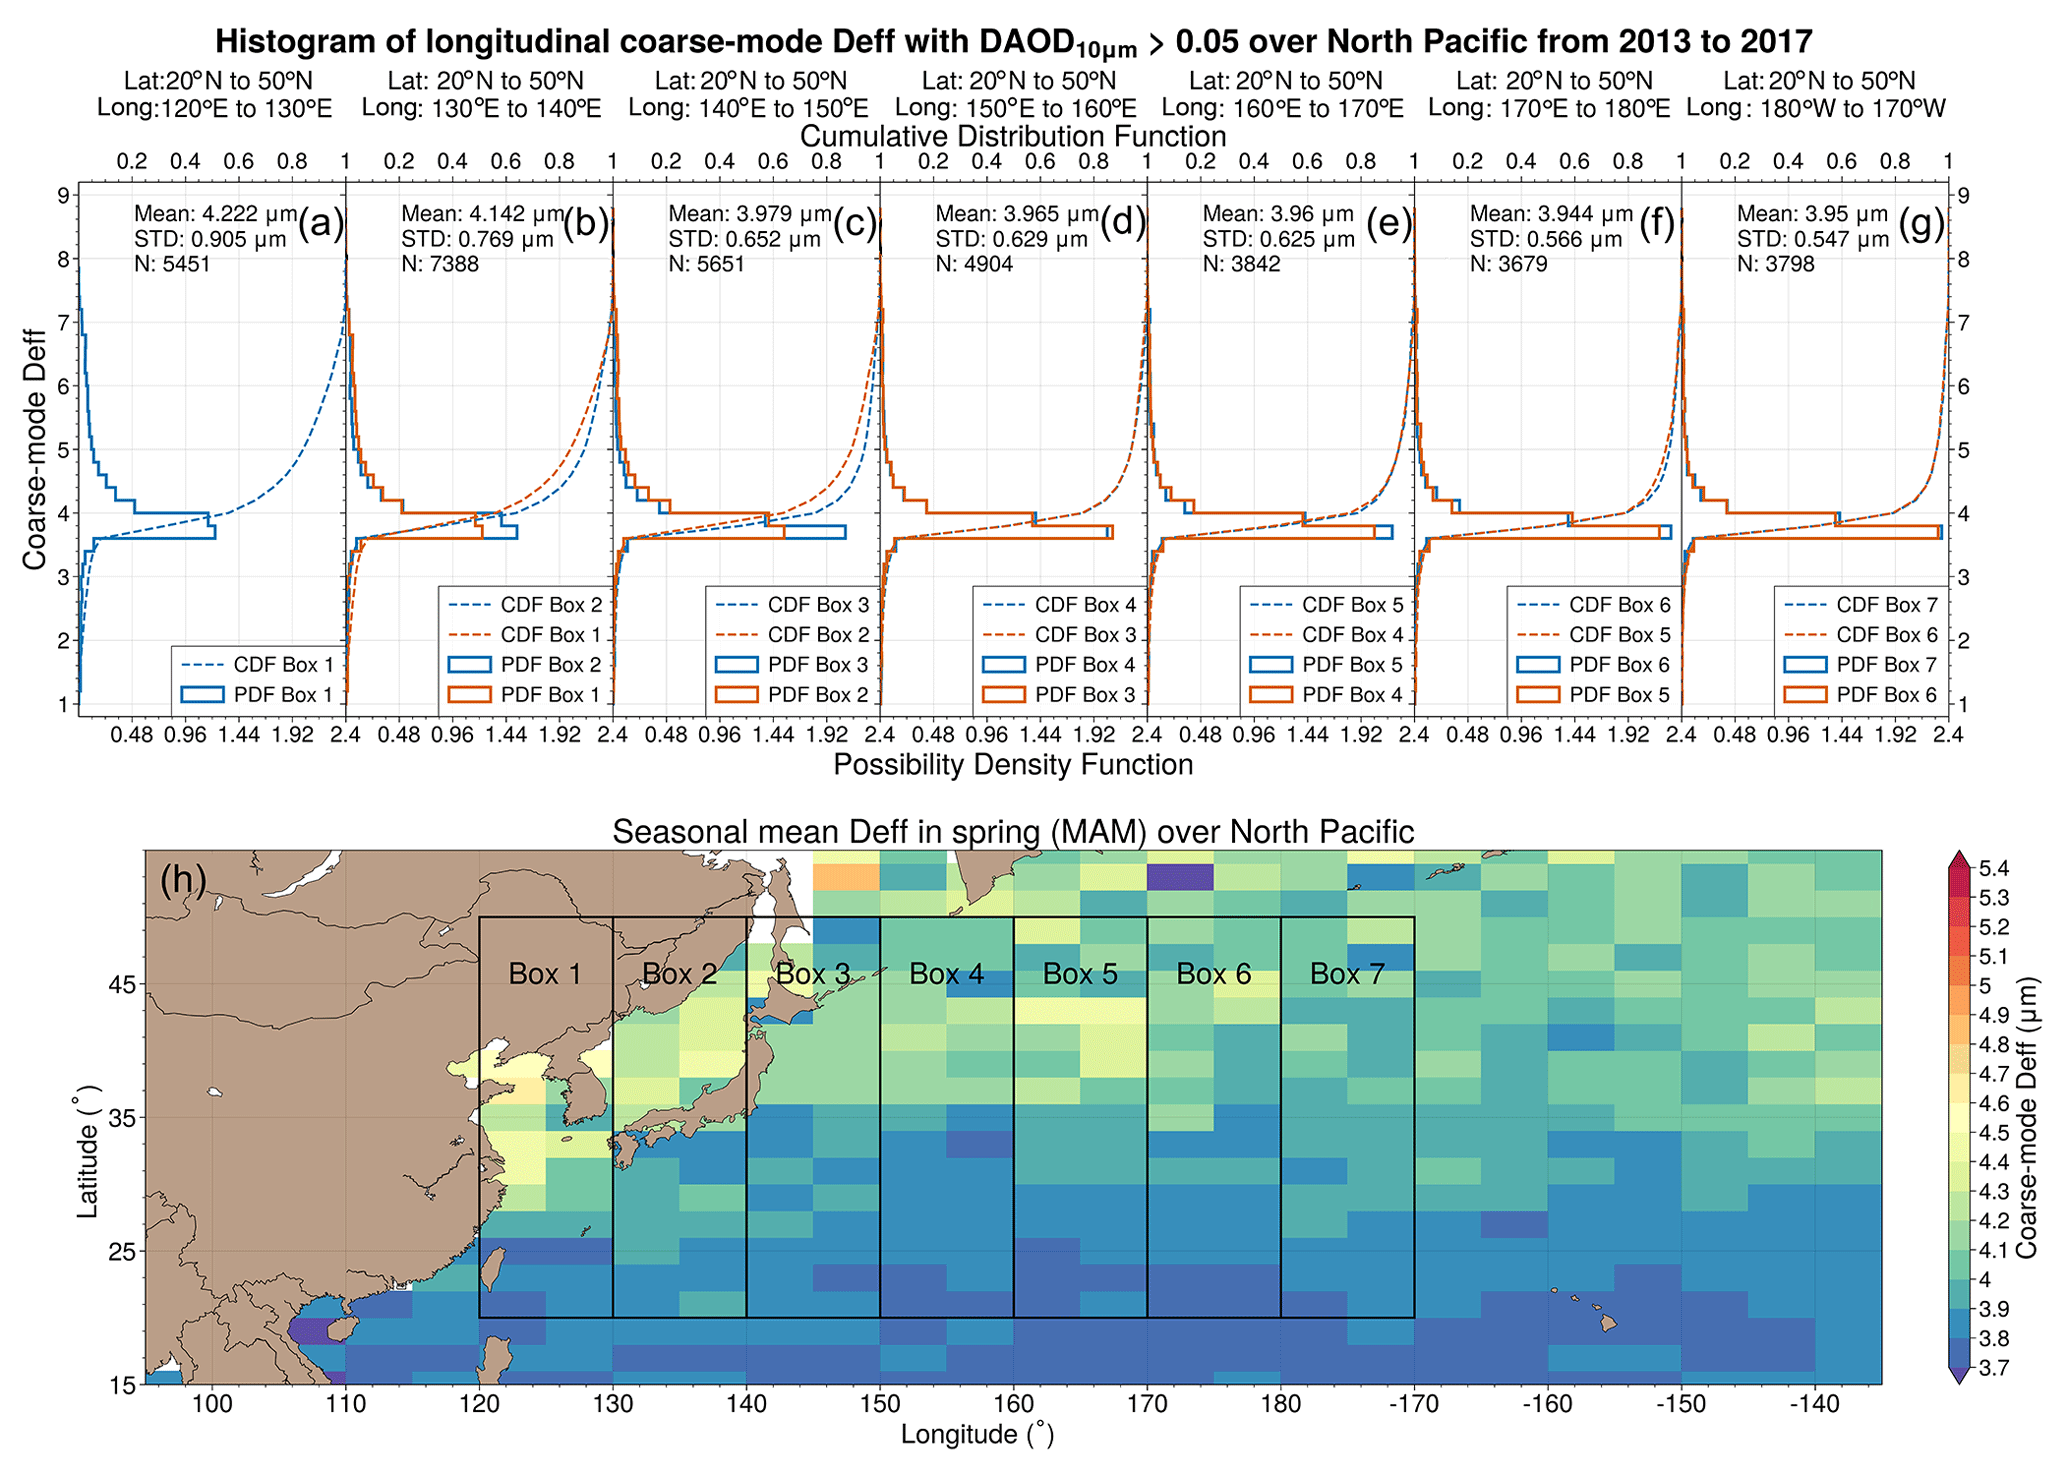
Figure 15The same as Fig. 14 but for Deff with DAOD10 µm>0.05 within each longitudinal box from west to east ranging from 1 (a) to 7 (g) over the NP in the spring from 2013 to 2017.
Unlike the transatlantic dust, Asian dust transport over NP experiences longer travel distances from the east Asian source regions and therefore has systematically smaller particle sizes. With the same method as Fig. 14, we present the histograms of Deff with DAOD10 µm>0.05 (according to the lower seasonal mean DAOD10 µm over NP) within seven longitudinal boxes, as shown in Fig. 15. During the transport, the mostly unchanged PDFs with Deff>4 µm from Box 1 (130∘ E) to Box 2 (140∘ E) only reduced ∼10 % from Box 2 to Box 3 (150∘ E). The CDFs are stable throughout the transport from Box 3 to Box 7 regardless of the total number of dust samples decrease. Compared with dust over NA, only ∼5 % of dust with Deff>5 µm can be found after transporting to Box 3. The relatively homogenous and stable distribution of Deff ∼4 µm suggests that the coarse-mode dust particles over NP may also have longer lifetimes than expected by the stand-alone gravitational settling theory. However, as DAOD10 µm and the number of successful retrievals over NP are lower than that over NA and IO, the relatively higher retrieval uncertainty prevents us from drawing a clear conclusion. Future studies are recommended to validate the satellite-retrieved Deff by in situ-measured Asian dust PSDs.
This study developed a novel retrieval algorithm for DAOD10 µm and the coarse-mode dust PSD represented by Deff using the collocated CALIOP and MODIS observations. The Deff retrieval is validated in detail through three case studies in August 2015, January 2008 and June 2013, respectively.
We validate the DAOD532 nm matching with the AERONET total AOD at Cape Verde in the 2015 case study. Despite the spectral difference preventing the “apple-to-apple” comparison of DAOD10 µm with AERONET, the relatively good correlation between DAOD10 µm and the AERONET-validated DAOD532 nm demonstrates the DAOD10 µm retrieval's reliability. Afterward, we present the consistency of the monomodal PSDs corresponding to the retrieved Deff with the AER-D PSD and SAMUM-2 PSD as well as their TIR optical properties in the 2015 and 2008 cases. The 2013 case validates the Deff retrieval in both the short-range (Cape Verde) and the long-range (the Caribbean Sea) transport regions by comparing the Deff-corresponding PSD with SALTRACE dust PSD and demonstrates the retrieval's capability to reveal the transport process of dust coarse-mode particle size in a better spatiotemporal resolution than in situ measurements. The results convince us that the DAOD10 µm and Deff retrieval dataset can provide a better constraint on regional and global LW DRE uncertainties due to DAOD and dust PSD. However, an assumption of dust RI is still needed.
We apply the retrieval to 5-year MODIS–CALIOP data from 2013 to 2017 and compare the DAOD retrieval with IIR-based and IASI-based retrieval. As an improved version compared with the IIR-based retrieval, the MODIS–CALIOP retrieval reduces ∼50 % of DAOD uncertainty and achieves good consistency (R=0.7 in Fig. 9). In the climatological comparison with the seasonal mean IASI-based DAOD10 µm, MODIS–CALIOP DAOD10 µm reaches a better agreement with IASI-LMD DAOD10 µm over NA (R=0.9) and IO (R=0.8) than that over NP (R=0.2). Meanwhile, the IASI-ULB DAOD10 µm values over the three regions are highly correlated with MODIS–CALIOP DAOD10 µm, while they are systematically underestimated possibly due to the fact that the Deff of the pre-assumed dust PSD is significantly lower than that of IASI-LMD DAOD10 µm and the climatological Deff. The discrepancy between the two AERONET-evaluated IASI DAOD10 µm datasets reveals that the dependency of TIR to VIS DAOD ratios and the retrieved DAOD10 µm on dust PSD is non-negligible, which is also proved in Z22. It highlights the importance of considering the spatiotemporal variation in dust Deff in TIR retrievals.
A global and climatological analysis of the 5-year Deff retrievals from −60 to 60∘ N over oceans is presented. Comparing Deff among the three transport regions, we found that seasonal mean Deff over IO (3.9–4.2 µm) is up to ∼22 % lower than that over NA (4.1–5.4 µm) depending on different seasons, implying a shorter lifetime of coarse-mode dust particles transported from the Middle East to IO than that from north Africa to NA. For Deff variation during transport over NA, we found a ∼50 % reduction in retrievals with Deff>5 µm from 15 to 40∘ W and a relatively stable Deff at ∼4 µm throughout the Caribbean Sea. The Deff result from 15 to 40∘ W differs from the IASI-retrieved effective radius distribution over NA in Peyridieu et al. (2013), which presented an almost constant value at 2 µm during summer throughout the transport. In addition, the prevailing dust with Deff at ∼4 µm and a small portion of dust with Deff>5 µm (5 %–20 %) found after long-term transport in both NA and NP can hardly be explained by the stand-alone gravity settling theory. The results provide observation-based transport patterns of the coarse-mode dust size over oceans, which can be used to evaluate the simulated dust coarse-mode PSD in dust transport models.
However, there are serval limitations of our retrieval. First of all, the case-study validation of Deff is limited to three field campaigns. Extended comparisons with other upcoming in situ measurements, especially over the Mediterranean, IO and NP, should be realized further to validate the applicability and significance of the proposed approach. Secondly, our retrieval is still not applicable to observations over land due to the uncertainties from land surface temperature and emissivity. Nonetheless, with more reliable databases of land surface characteristics, this portable retrieval algorithm can be easily extended to cover the dust source regions. Thirdly, the vertical distribution of dust PSD in columns is assumed to be homogeneous, which might be improved by inferring the layer attenuated backscatter total color ratio (i.e., the ratio of the layer total attenuated backscatter at 1064 nm to that at 532 nm) observed by spaceborne lidars. Lastly, the limited spatial coverage of CALIOP restrains the application of our data to regional studies. Extending the retrieval to off-CALIOP-track MODIS pixels is recommended for future studies.
In this study, the uncertainties contributed by the auxiliary data, the radiative transfer simulation and the observational errors are evaluated through the radiative closure benchmark between the CRTM–DISORT-calculated and the MODIS-observed BTs under cloud-free and clean (without dust) conditions based on the collocated MODIS and CALIOP data from 2007 to 2010.
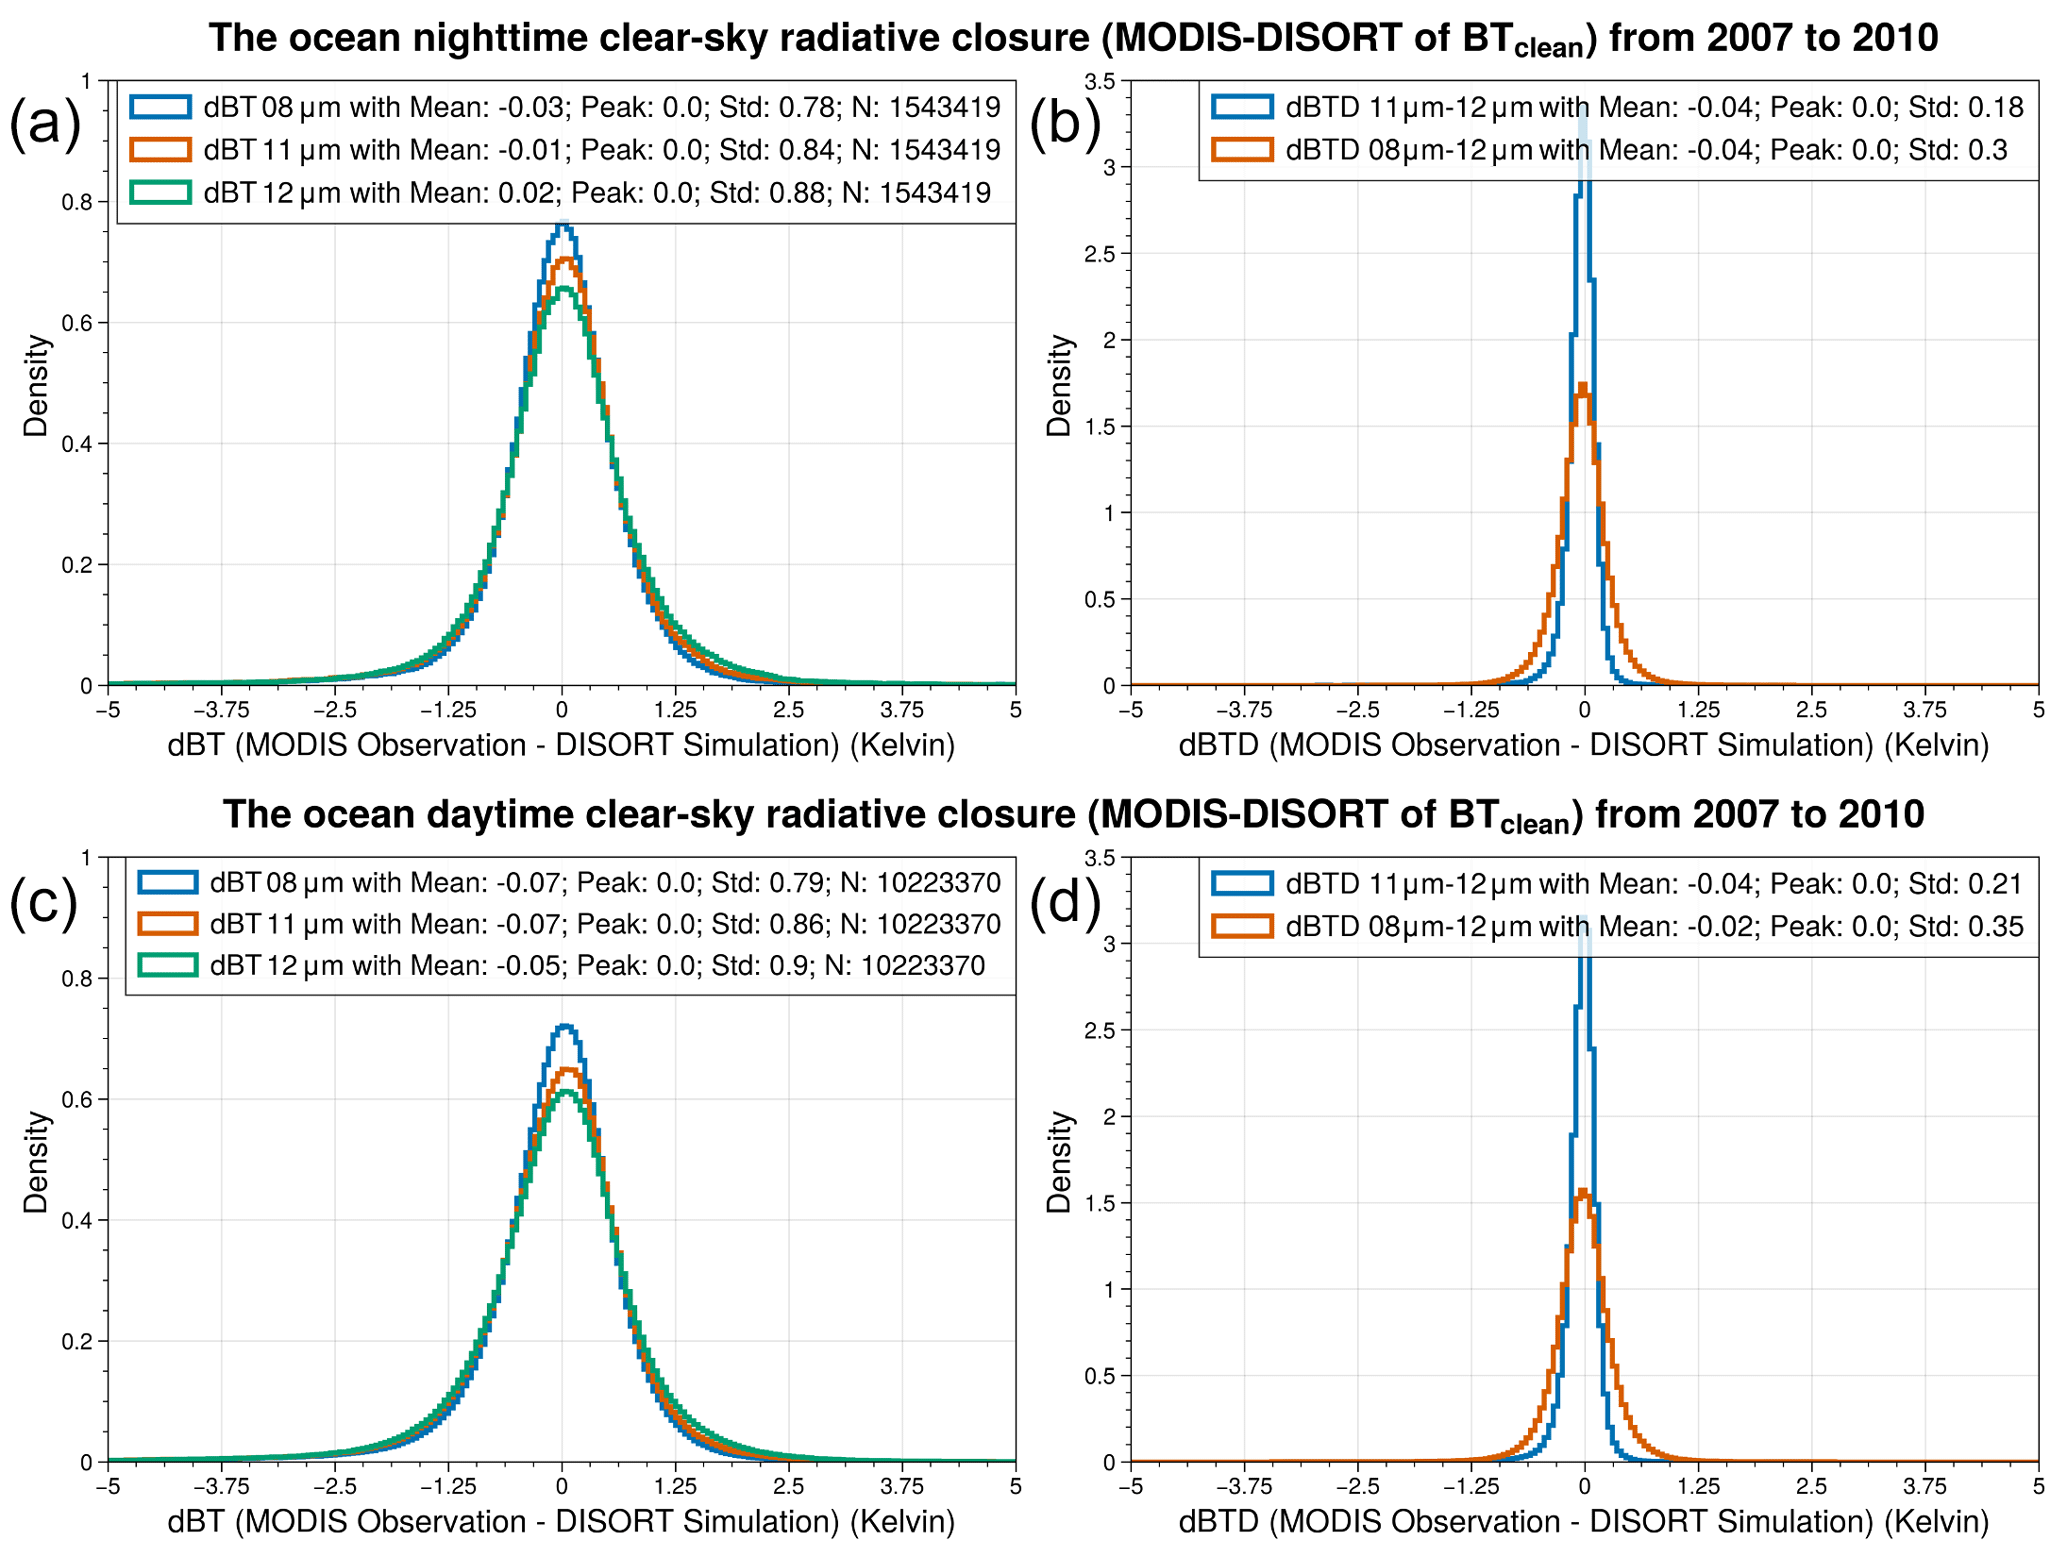
Figure A1The nighttime (a) and daytime (c) cloud-free and clean-sky dBTs at the MODIS 8.5 µm (blue), 11 µm (orange) and 12 µm (green) bands. The nighttime (b) and daytime (d) cloud-free clean-sky dBTD8−12 (orange) and dBTD11−12 (blue).
Figure A1a and c show the BT discrepancies (referred to as dBTs) between the simulations and the observations for daytime and nighttime cloud-free and clean cases over oceans at three MODIS TIR bands. Figure A1b and d show the corresponding discrepancies of the cloud-free spectral BT differences (BTDs) between 11 and 12 µm (blue curve, referred to as dBTD11−12) and that between 8.5 and 12 µm (red curve, referred to as dBTD8−12). Both dBTs and dBTDs are unbiased (i.e., with a peak and a mean value centered at 0) in both daytime and nighttime, demonstrating a remarkable consistency between the CRTM–DISORT simulation and the MODIS observation. For the three single TIR BTs, because the 8.5 and 11 µm bands are cleaner (i.e., less water vapor absorption) than the 12 µm band that is the most water-vapor-absorptive, the standard deviations of dBT at 8.5 and 11 µm are lower (0.78–0.86 K) than that at 12 µm (0.88–0.9 K). Interestingly, the errors of the two dBTDs are substantially reduced to the range of 0.2 to 0.4 K as the errors from the assumed atmospheric states at each band are canceled out, especially the dBTD11−12 (0.18 K during nighttime and 0.21 K during daytime), which is sensitive to DAOD as explained in Sect. 3.2. The smaller uncertainties in dBTDs are probably due to error cancelations. For example, if AMSR-E underestimates the SST, the simulated BT would be colder than the observation because of the overestimated surface-emitted radiance. However, the underestimation happens in all three TIR bands, and the errors cancel each other to some extent, leading to smaller uncertainty in dBTDs.
Overall, 1 standard deviation of dBTs and dBTDs represents the retrieval uncertainty due to the atmospheric auxiliary data, the radiative transfer simulation and the observational errors, which is revisited in Sect. 3.2.
The first step of the retrieval is to identify high-quality cloud-free dust-laden observations. Due to the different spatial coverage of MODIS and CALIOP, the retrieval requires collocated data from both sensors, which is done in the following steps. First, we refer to the MODIS–AUX product (Partain, 2007) developed for CloudSat to find along-CloudSat-track MODIS pixels for two reasons. First, each along-CloudSat-track profile has 15 collocated MODIS pixels in the MODIS–AUX product. Each MODIS pixel contains the MODIS level-1B radiances and level-2 geometries. Using the 15 collocated MODIS pixels saves computational time compared with accessing the original terabyte-scale level-1B products (Zheng et al., 2021). Second, the along-track orbits of CALIPSO and CloudSat are highly synchronized. It allows each along-CALIPSO-track profile to quickly match the nearest pixel among the 15 collocated along-CloudSat-track MODIS pixels. However, we note that the MODIS viewing zenith angle of the collocated pixels is not exactly as nadir as CALIOP's viewing zenith angle, which is also considered in our retrieval (see Table 1).
The CALIOP LID_L2_05kmAPro-Standard-V4 product has a 5 km along-track resolution, while the MODIS–AUX product is 1 km. To address this spatial difference, we reference the 1 km along-CALIOP-track geolocation records from the IIR_L2_Track-Standard-V4 product, which provides five records with 1 km resolution in each 5 km CALIOP profile. Each of the five 1 km geolocation records is then used to find the nearest along-CloudSat-track MODIS pixels. The corresponding MODIS level-1B 1 km TIR BTs, BT uncertainties and the MODIS sensor's geometries (i.e., viewing/solar zenith/azimuth angles) are then assigned to each geolocation record.
Similar to the cloud-masking process in Z22, we use the collocated 1 km Was_Cleared_Flag_1km originated from the IIR_L2_Track-Standard-V4 product to screen out MODIS pixels containing sub-pixel clouds that are detected by the single-laser shot in the 333 m along-track footprint. Finally, the remaining cloud-free 1 km MODIS pixels within each 5 km CALIOP profile are averaged, forming the 5 km collocated MODIS–CALIOP cloud-free product.
After cloud masking, dust detection also follows the procedures described in Z22. Firstly, we identify the high-quality CALIOP backscatter profiles by applying the extinction control flag (Extinction_QC_ Flag_ 532 = 0, 1, 16, 18 (Winker et al., 2013; Yu et al., 2015)) to the 5 km MODIS–CALIOP cloud-free product. Next, we apply the cloud–aerosol discrimination (CAD) score to select the profiles containing all detected features with CAD between −100 to −90 to ensure the quality of the detected aerosol layers (Yu et al., 2019). Finally, the selected CALIOP backscatter profiles are further used to distinguish dust from non-dust aerosols. The separation is based on the contrast of the DPR between dust and non-dust aerosols. The higher the non-sphericity and particle size, such as dust, the lower the DPR. Therefore, the DPR of dust aerosols (δd) is usually higher than that of other non-dust aerosols (δnd). Accordingly, a vertically resolved fraction fd(z) of dust backscatter (βd(z)) to the observed backscatter (β(z)) (i.e., is estimated by the observed particulate DPR δ(z), δd and δnd as
Following Yu et al. (2015) and Z22, the lower and upper limits of δnd are set to 0.02 and 0.07 and δd to 0.20 and 0.30, respectively. The final fd(z) is set to the mean value of the upper bounds (δd=0.3 and δnd=0.07) and lower bounds (δd=0.2 and δnd=0.02). Due to the observed particulate DPR uncertainty, the values of fd(z) can exceed 1 or be below 0, which are set to be 1 and 0, respectively. Finally, we obtain the backscatter profile of dust aerosol as
which serves as the dust vertical distribution to scale the input DAOD in the CRTM–DISORT simulation. Note that the extinction coefficient profile can be obtained by multiplying βd(z) by an a priori dust extinction to backscatter ratio (i.e., lidar ratios, LRs) for dust aerosol. According to previous studies for the dust LR (Haarig et al., 2022; Liu et al., 2002, 2008; Kim et al., 2020), we further calculate the column-integrated DAOD at 532 nm (referred to as DAOD532 nm) by assuming a dust LR at 44 sr with ±10 sr uncertainty. However, the DAOD532 nm uncertainty contributed by LR is beyond this study and will not be discussed. Readers are referred to Kim et al. (2020) for details.
However, the DPR-based method is likely to include the contribution of sea salt over open oceans and generate non-zero DAOD532 nm even without dust, especially in daytime when CALIOP is of lower quality due to the solar contamination. The possible reason is that sea salt would have DPR close to dust when its relative humidity is low (e.g., <50 %) (Haarig et al., 2017). Therefore, after deriving DAOD532 nm, we further use the CALIOP VFM (i.e., the Atmospheric_Volume_Description in the LID_L2_05kmAPro-Standard-V4 product; see Sect. 2.1 and Table 1) to filter the profiles that have no dust, polluted dust or marine dust layers. Finally, the rest of the profiles are considered to be cloud-free dust profiles for retrievals.
Note that assigning dust RIs from different source regions to the observed dust aerosol over the ocean should follow the global dust transport patterns. Accordingly, we applied the fractional contribution over oceans supplied by various dust source regions from the DustCOMM-2021 dataset developed by Kok et al. (2021a). This dataset provides the seasonally resolved global distribution of the fractional contribution of DAOD from nine defined dust source regions (see Fig. C1) by integrating observational constraints on dust properties and abundance into an ensemble of Global Climate Model (GCM) simulations, gridded with a resolution of 1.9∘ latitude by 2.5∘ longitude. In other words, for each grid cell in each season, there are nine fractions representing the contributions from nine source regions, indicating the probability of where the DAOD that occurs in a grid cell in a particular season originated. We use this dataset to choose the appropriate a priori dust RIs from different source regions for our retrieval over oceans.
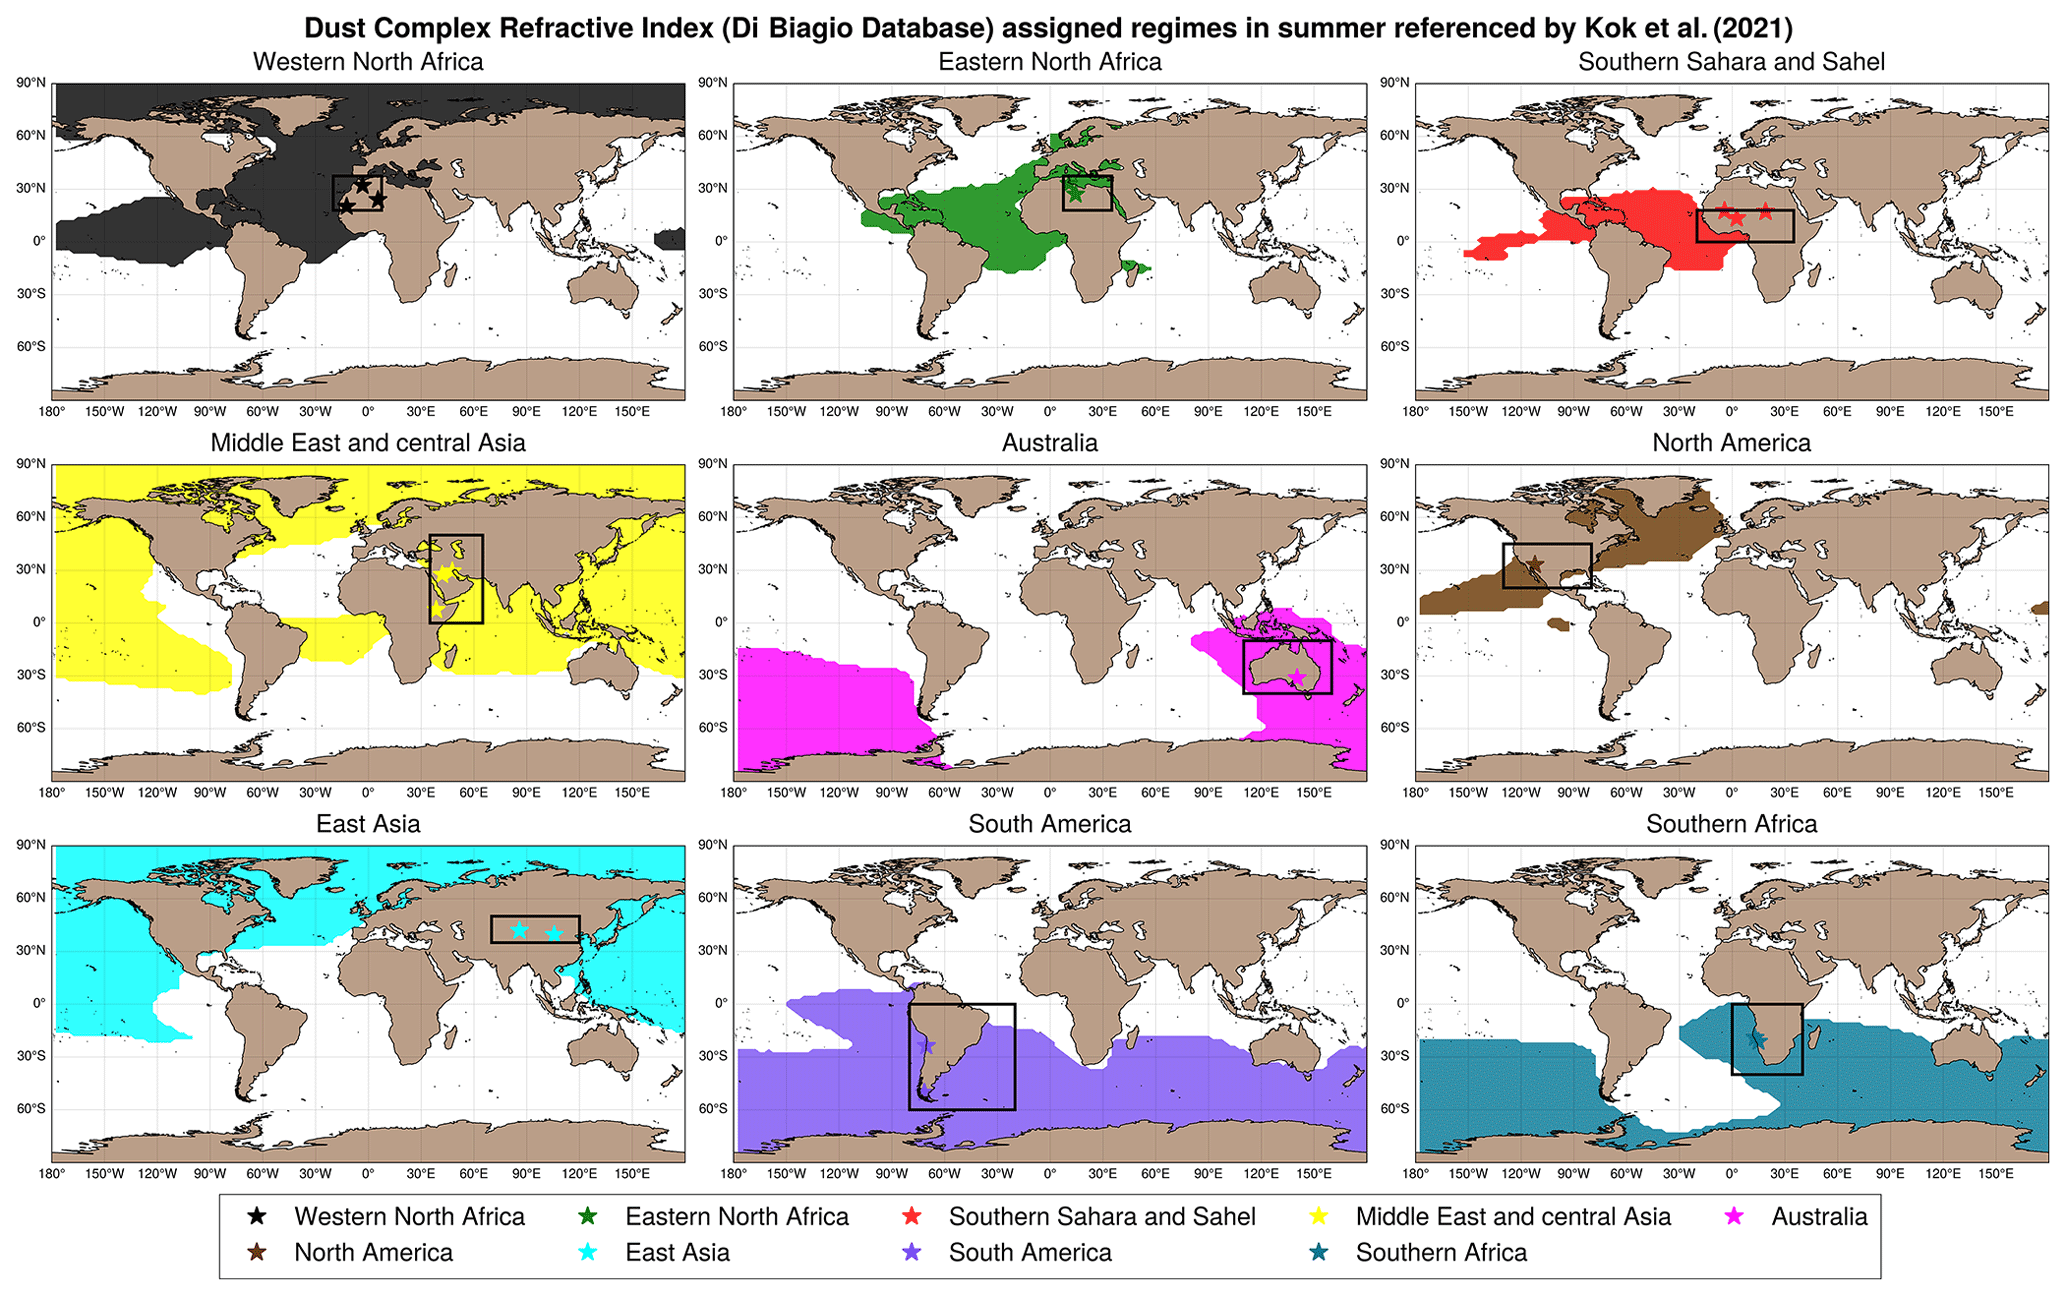
Figure C1The assignment of the source-region-resolved dust refractive indices from Di Biagio et al. (2017) is based on which of the nine main source regions provided a fractional contribution to SW DAOD that exceeds 0.1, which is shown here for summer based on the DustCOMM-2021 dataset.
It should be noted that the DustCOMM-2021 is a climatological dataset. As such the uncertainties included in this dataset cannot be propagated into instantaneous observational retrievals. Hence, in this study, instead of scaling the Di Biagio RIs' fractional contribution to form a new dust RI, we select the source region if its DAOD fractional contribution exceeds 0.1 and assign the corresponding Di Biagio RIs within the selected source region for our retrieval. Figure C1 shows the nine regimes over oceans with fractional contributions greater than 0.1 for the nine defined dust source regions in summer (see Figs. S2 to S4 for other seasons). The Di Biagio RIs are assigned to the nine source regions based on their geolocations. For observations in each season within each regime, the retrieval will assume the dust originated from the identified dust source regions and choose the corresponding Di Biagio RIs. Note that the nine regimes can overlap, meaning that the observation over a particular grid cell covered by multiple regimes will assume multiple RIs from these regimes. The uncertainty due to the variation in multiple RIs is evaluated in Sect. 3.2.
The MODIS–CALIOP DAOD10 µm and coarse-mode Deff data (level 2 and monthly level 3) from July 2006 to August 2018 are available at https://doi.org/10.5281/zenodo.7857131 (Zheng et al., 2023).
The supplement related to this article is available online at: https://doi.org/10.5194/acp-23-8271-2023-supplement.
Conceptualization: JZ and ZZ; methodology: JZ, ZZ and YH; software: JZ, ZZ, QS and CW; validation: JZ and ZZ; formal analysis: JZ; investigation: JZ and ZZ; data curation: JZ, ZZ, JFK, CDB and CR; writing (original draft preparation): JZ; writing (review and editing): JZ, ZZ, YH, AG, QS, CW, JFK, CDB, CR and YD; visualization: JZ; supervision: ZZ, YH and AG; project administration: ZZ; funding acquisition: ZZ. All authors have read and agreed to the published version of the paper.
The contact author has declared that none of the authors has any competing interests.
Publisher’s note: Copernicus Publications remains neutral with regard to jurisdictional claims in published maps and institutional affiliations.
Jianyu Zheng, Zhibo Zhang and Anne Arnier are supported by a NASA grant (no. 80NSSC20K0130) from the CALIPSO and CloudSat program managed by David Considine. Zhibo Zhang also acknowledges funding support from the NSF (AGS-2232138). Hongbin Yu was supported by the CloudSat/CALIPSO program. Claire Ryder acknowledges funding from the NERC grant NE/M018288/1. Jasper F. Kok was supported by NSF grants 1856389 and 2151093 and the Army Research Office (cooperative agreement number W911NF-20-2-0150). Claudia Di Biagio was supported by the Centre National d'Études Spatiales (CNES) and the CNRS via the Labex L–IPSL, which is funded by the ANR (grant no. ANR–10–LABX–0018). The computations in this study were performed at the UMBC High Performance Computing Facility (HPCF). The facility is supported by the US National Science Foundation through the MRI program (grant nos. CNS-0821258 and CNS-1228778) and the SCREMS program (grant no. DMS-0821311), with substantial support from UMBC. We acknowledge the AERIS data infrastructure for providing access to the IASI-LMD data in this study and CNRS-LMD for the development of the retrieval algorithms. We thank the ICARE Data and Services Center for providing access to the IASI-ULB data in this study at http://www.icare.univ-lille1.fr/, last access: 8 July 2023. We thank NASA for providing the MODIS and CALIPSO data, which are available at https://ladsweb.modaps.eosdis.nasa.gov/, last access: 8 July 2023 and https://asdc.larc.nasa.gov/data/CALIPSO/, last access: 8 July 2023. We thank the CloudSat Data Processing Center for providing the MODIS–AUX data at https://www.cloudsat.cira.colostate.edu/data-products/modis-aux/, last access: 8 July 2023. We also thank the AERONET project at NASA/GSFC for providing the ground-based aerosol data. The laboratory experiments to retrieve the dust refractive indices in Di Biagio et al. (2017) that feed this work received funding from the European Union's Horizon 2020 research and innovation program through the EUROCHAMP-2020 Infrastructure Activity under grant agreement no. 730997. They were supported by the French national program LEFE/INSU (Les Enveloppes Fluides et l'Environnement/Institut National des Sciences de l'Univers) and the OSU–EFLUVE (Observatoire des Sciences de l'Univers–Enveloppes Fluides de la Ville à l'Exobiologie) through dedicated research funding to the RED-DUST project. The authors acknowledge the CNRS–INSU for supporting the CESAM chamber as national facility as part of the French ACTRIS research infrastructure as well as the AERIS data center (https://en.aeris-data.fr/, last access: 8 July 2023) for distributing and curating the data produced by the CESAM chamber through the hosting of the EUROCHAMP Data Center (https://data.eurochamp.org, last access: 8 July 2023). The SALTRACE research flights were funded by the Helmholtz Association under grant VH-NG-606 (Helmholtz-Hochschul-Nachwuchsforschergruppe AerCARE) and by the DLR. The views and conclusions contained in this paper are those of the authors and should not be interpreted as representing the official policies, either expressed or implied, of the Army Research Laboratory or the US Government.
This research has been supported by the National Aeronautics and Space Administration (grant no. 80NSSC20K0130) and the National Science Foundation (grant no. AGS-2232138).
This paper was edited by Yves Balkanski and reviewed by two anonymous referees.
Adebiyi, A. A. and Kok, J. F.: Climate models miss most of the coarse dust in the atmosphere, Sci. Adv., 6, eaaz9507, https://doi.org/10.1126/sciadv.aaz9507, 2020.
Adebiyi, A. A., Kok, J. F., Wang, Y., Ito, A., Ridley, D. A., Nabat, P., and Zhao, C.: Dust Constraints from joint Observational-Modelling-experiMental analysis (DustCOMM): comparison with measurements and model simulations, Atmos. Chem. Phys., 20, 829–863, https://doi.org/10.5194/acp-20-829-2020, 2020.
Adebiyi, A., Kok, J. F., Murray, B. J., Ryder, C. L., Stuut, J.-B. W., Kahn, R. A., Knippertz, P., Formenti, P., Mahowald, N. M., Pérez García-Pando, C., Klose, M., Ansmann, A., Samset, B. H., Ito, A., Balkanski, Y., Di Biagio, C., Romanias, M. N., Huang, Y., and Meng, J.: A review of coarse mineral dust in the Earth system, Aeolian Res., 60, 100849, https://doi.org/10.1016/j.aeolia.2022.100849, 2023.
Alizadeh-Choobari, O., Sturman, A., and Zawar-Reza, P.: A global satellite view of the seasonal distribution of mineral dust and its correlation with atmospheric circulation, Dynam. Atmos. Ocean., 68, 20–34, https://doi.org/10.1016/j.dynatmoce.2014.07.002, 2014.
Bagnold, R. A.: Threshold Speed and Grain Size, in: The Physics of Blown Sand and Desert Dunes, Springer Netherlands, Dordrecht, 85–95, https://doi.org/10.1007/978-94-009-5682-7_7, 1974.
Capelle, V., Chédin, A., Siméon, M., Tsamalis, C., Pierangelo, C., Pondrom, M., Crevoisier, C., Crepeau, L., and Scott, N. A.: Evaluation of IASI-derived dust aerosol characteristics over the tropical belt, Atmos. Chem. Phys., 14, 9343–9362, https://doi.org/10.5194/acp-14-9343-2014, 2014.
Capelle, V., Chédin, A., Pondrom, M., Crevoisier, C., Armante, R., Crepeau, L., and Scott, N. A.: Infrared dust aerosol optical depth retrieved daily from IASI and comparison with AERONET over the period 2007–2016, Remote Sens. Environ, 206, 15–32, https://doi.org/10.1016/j.rse.2017.12.008, 2018.
Carlson, T. N.: The Saharan elevated mixed layer and its aerosol optical depth, The Open Atmospheric Science Journal, 10, 22–38, https://doi.org/10.2174/1874282301610010026, 2016.
Chédin, A., Capelle, V., Scott, N. A., and Todd, M. C.: Contribution of IASI to the Observation of Dust Aerosol Emissions (Morning and Nighttime) Over the Sahara Desert, J. Geophys. Res.-Atmos., 125, e2019JD032014, https://doi.org/10.1029/2019JD032014, 2020.
Chen, Y., Han, Y., and Weng, F.: Comparison of two transmittance algorithms in the community radiative transfer model: Application to AVHRR, J. Geophys. Res.-Atmos., 117, D06206, https://doi.org/10.1029/2011jd016656, 2012.
Choobari, O. A., Zawar-Reza, P., and Sturman, A.: The global distribution of mineral dust and its impacts on the climate system: A review, Atmos. Res., 138, 152–165, https://doi.org/10.1016/j.atmosres.2013.11.007, 2014.
Clarisse, L., Clerbaux, C., Franco, B., Hadji-Lazaro, J., Whitburn, S., Kopp, A. K., Hurtmans, D., and Coheur, P.-F.: A Decadal Data Set of Global Atmospheric Dust Retrieved From IASI Satellite Measurements, J. Geophys. Res.-Atmos., 124, 1618–1647, https://doi.org/10.1029/2018JD029701, 2019.
Clarke, A. D., Shinozuka, Y., Kapustin, V. N., Howell, S., Huebert, B., Doherty, S., Anderson, T., Covert, D., Anderson, J., Hua, X., Moore II, K. G., McNaughton, C., Carmichael, G., and Weber, R.: Size distributions and mixtures of dust and black carbon aerosol in Asian outflow: Physiochemistry and optical properties, J. Geophys. Res.-Atmos., 109, D15S09, https://doi.org/10.1029/2003JD004378, 2004.
Denjean, C., Cassola, F., Mazzino, A., Triquet, S., Chevaillier, S., Grand, N., Bourrianne, T., Momboisse, G., Sellegri, K., Schwarzenbock, A., Freney, E., Mallet, M., and Formenti, P.: Size distribution and optical properties of mineral dust aerosols transported in the western Mediterranean, Atmos. Chem. Phys., 16, 1081–1104, https://doi.org/10.5194/acp-16-1081-2016, 2016.
DeSouza-Machado, S. G., Strow, L. L., Hannon, S. E., and Motteler, H. E.: Infrared dust spectral signatures from AIRS, Geophys. Res. Lett., 33, L03801, https://doi.org/10.1029/2005gl024364, 2006.
Di Biagio, C., Formenti, P., Balkanski, Y., Caponi, L., Cazaunau, M., Pangui, E., Journet, E., Nowak, S., Caquineau, S., Andreae, M. O., Kandler, K., Saeed, T., Piketh, S., Seibert, D., Williams, E., and Doussin, J.-F.: Global scale variability of the mineral dust long-wave refractive index: a new dataset of in situ measurements for climate modeling and remote sensing, Atmos. Chem. Phys., 17, 1901–1929, https://doi.org/10.5194/acp-17-1901-2017, 2017.
Di Biagio, C., Banks, J. R., and Gaetani, M.: Dust Atmospheric Transport Over Long Distances, in: Reference Module in Earth Systems and Environmental Sciences, Elsevier, https://doi.org/10.1016/B978-0-12-818234-5.00033-X, 2021.
Ding, S., Yang, P., Weng, F., Liu, Q., Han, Y., van Delst, P., Li, J., and Baum, B.: Validation of the community radiative transfer model, J. Quant. Spectrosc. Ra., 112, 1050–1064, https://doi.org/10.1016/j.jqsrt.2010.11.009, 2011.
Dubovik, O., Smirnov, A., Holben, B., King, M., Kaufman, Y., Eck, T., and Slutsker, I.: Accuracy assessments of aerosol optical properties retrieved from Aerosol Robotic Network (AERONET) Sun and sky radiance measurements, J. Geophys. Res.-Atmos., 105, 9791–9806, 2000.
Dubovik, O., Holben, B., Lapyonok, T., Sinyuk, A., Mishchenko, M., Yang, P., and Slutsker, I.: Non-spherical aerosol retrieval method employing light scattering by spheroids, Geophys. Res. Lett., 29, 51–54, 2002.
Dubovik, O., Sinyuk, A., Lapyonok, T., Holben, B. N., Mishchenko, M., Yang, P., Eck, T. F., Volten, H., Munoz, O., and Veihelmann, B.: Application of spheroid models to account for aerosol particle nonsphericity in remote sensing of desert dust, J. Geophys. Res.-Atmos., 111, D11208, https://doi.org/10.1029/2005JD006619, 2006.
Garnier, A., Pelon, J., Dubuisson, P., Yang, P., Faivre, M., Chomette, O., Pascal, N., Lucker, P., and Murray, T.: Retrieval of cloud properties using CALIPSO Imaging Infrared Radiometer: Part II: effective diameter and ice water path, J. Appl. Meteor. Climatol., 52, 2582–2599, https://doi.org/10.1175/JAMC-D-12- 0328.1, 2013.
Gasteiger, J., Groß, S., Sauer, D., Haarig, M., Ansmann, A., and Weinzierl, B.: Particle settling and vertical mixing in the Saharan Air Layer as seen from an integrated model, lidar, and in situ perspective, Atmos. Chem. Phys., 17, 297–311, https://doi.org/10.5194/acp-17-297-2017, 2017.
Gelaro, R., McCarty, W., Suárez, M. J., Todling, R., Molod, A., Takacs, L., Randles, C. A., Darmenov, A., Bosilovich, M. G., Reichle, R., Wargan, K., Coy, L., Cullather, R., Draper, C., Akella, S., Buchard, V., Conaty, A., da Silva, A. M., Gu, W., Kim, G.-K., Koster, R., Lucchesi, R., Merkova, D., Nielsen, J. E., Partyka, G., Pawson, S., Putman, W., Rienecker, M., Schubert, S. D., Sienkiewicz, M., and Zhao, B.: The Modern-Era Retrospective Analysis for Research and Applications, Version 2 (MERRA-2), J. Climate, 30, 5419–5454, https://doi.org/10.1175/jcli-d-16-0758.1, 2017.
Giles, D. M., Sinyuk, A., Sorokin, M. G., Schafer, J. S., Smirnov, A., Slutsker, I., Eck, T. F., Holben, B. N., Lewis, J. R., Campbell, J. R., Welton, E. J., Korkin, S. V., and Lyapustin, A. I.: Advancements in the Aerosol Robotic Network (AERONET) Version 3 database – automated near-real-time quality control algorithm with improved cloud screening for Sun photometer aerosol optical depth (AOD) measurements, Atmos. Meas. Tech., 12, 169–209, https://doi.org/10.5194/amt-12-169-2019, 2019.
Ginoux, P.: Effects of nonsphericity on mineral dust modeling, J. Geophys. Res.-Atmos., 108, 4052, https://doi.org/10.1029/2002JD002516, 2003.
Ginoux, P., Garbuzov, D., and Hsu, N. C.: Identification of anthropogenic and natural dust sources using Moderate Resolution Imaging Spectroradiometer (MODIS) Deep Blue level 2 data, J. Geophys. Res.-Atmos., 115, D05204, https://doi.org/10.1029/2009jd012398, 2010.
Ginoux, P., Prospero, J. M., Gill, T. E., Hsu, N. C., and Zhao, M.: Global-scale attribution of anthropogenic and natural dust sources and their emission rates based on MODIS Deep Blue aerosol products, Rev. Geophys., 50, RG3005, https://doi.org/10.1029/2012RG000388, 2012.
Gkikas, A., Proestakis, E., Amiridis, V., Kazadzis, S., Di Tomaso, E., Tsekeri, A., Marinou, E., Hatzianastassiou, N., and Pérez García-Pando, C.: ModIs Dust AeroSol (MIDAS): a global fine-resolution dust optical depth data set, Atmos. Meas. Tech., 14, 309–334, https://doi.org/10.5194/amt-14-309-2021, 2021.
Gkikas, A., Proestakis, E., Amiridis, V., Kazadzis, S., Di Tomaso, E., Marinou, E., Hatzianastassiou, N., Kok, J. F., and García-Pando, C. P.: Quantification of the dust optical depth across spatiotemporal scales with the MIDAS global dataset (2003–2017), Atmos. Chem. Phys., 22, 3553–3578, https://doi.org/10.5194/acp-22-3553-2022, 2022.
Goudie, A.: Dust storms in space and time, Prog. Phys. Geogr., 7, 502–530, 1983.
Grogan, D. F. P., Nathan, T. R., and Chen, S.-H.: Effects of Saharan Dust on the Linear Dynamics of African Easterly Waves, J. Atmos. Sci., 73, 891–911, https://doi.org/10.1175/jas-d-15-0143.1, 2016.
Gutleben, M. and Groß, S.: Turbulence Analysis in Long-Range-Transported Saharan Dust Layers With Airborne Lidar, Geophys. Res. Lett., 48, e2021GL094418, https://doi.org/10.1029/2021GL094418, 2021.
Haarig, M., Ansmann, A., Gasteiger, J., Kandler, K., Althausen, D., Baars, H., Radenz, M., and Farrell, D. A.: Dry versus wet marine particle optical properties: RH dependence of depolarization ratio, backscatter, and extinction from multiwavelength lidar measurements during SALTRACE, Atmos. Chem. Phys., 17, 14199–14217, https://doi.org/10.5194/acp-17-14199-2017, 2017.
Haarig, M., Ansmann, A., Engelmann, R., Baars, H., Toledano, C., Torres, B., Althausen, D., Radenz, M., and Wandinger, U.: First triple-wavelength lidar observations of depolarization and extinction-to-backscatter ratios of Saharan dust, Atmos. Chem. Phys., 22, 355–369, https://doi.org/10.5194/acp-22-355-2022, 2022.
Han, Y.: JCSDA community radiative transfer model (CRTM): Version 1, https://repository.library.noaa.gov/view/noaa/1157/noaa_1157_DS1.pdf (last access: 8 July 2023), 2006.
Hansen, J. E. and Travis, L. D.: Light scattering in planetary atmospheres, Space Sci. Rev., 16, 527–610, https://doi.org/10.1007/BF00168069, 1974.
Hansen, J., Sato, M., and Ruedy, R.: Radiative forcing and climate response, J. Geophys. Res.-Atmos., 102, 6831–6864, 1997.
Hao, M. and Mendel, J. M.: Linguistic Weighted Standard Deviation, Joint IFSA World Congress and NAFIPS Annual Meeting (IFSA/NAFIPS), 24–28 June 2013, 108–113, https://doi.org/10.1109/IFSA-NAFIPS.2013.6608384, 2013.
Heckert, N. and Filliben, J.: Dataplot Reference Manual, Volume 2: Let Subcommands and Library Functions, Technical Report 148, National Institute of Standards and Technology, https://www.itl.nist.gov/div898/software/dataplot/refman2/homepage.html (last access: 8 July 2023), 2003.
Helmert, J., Heinold, B., Tegen, I., Hellmuth, O., and Wendisch, M.: On the direct and semidirect effects of Saharan dust over Europe: A modeling study, J. Geophys. Res.-Atmos., 112, D13208, https://doi.org/10.1029/2006JD007444, 2007.
Holben, B. N., Eck, T. F., Slutsker, I., Tanré, D., Buis, J. P., Setzer, A., Vermote, E., Reagan, J. A., Kaufman, Y. J., Nakajima, T., Lavenu, F., Jankowiak, I., and Smirnov, A.: AERONET – A Federated Instrument Network and Data Archive for Aerosol Characterization, Remote Sens. Environ., 66, 1–16, https://doi.org/10.1016/S0034-4257(98)00031-5, 1998.
Hsu, N. C., Jeong, M.-J., Bettenhausen, C., Sayer, A. M., Hansell, R., Seftor, C. S., Huang, J., and Tsay, S.-C.: Enhanced Deep Blue aerosol retrieval algorithm: The second generation, J. Geophys. Res.-Atmos., 118, 9296–9315, https://doi.org/10.1002/jgrd.50712, 2013.
Huang, H., Qian, Y., Liu, Y., He, C., Zheng, J., Zhang, Z., and Gkikas, A.: Where does the dust deposited over the Sierra Nevada snow come from?, EGUsphere [preprint], https://doi.org/10.5194/egusphere-2022-588, 2022.
Huang, Y., Kok, J. F., Kandler, K., Lindqvist, H., Nousiainen, T., Sakai, T., Adebiyi, A., and Jokinen, O.: Climate Models and Remote Sensing Retrievals Neglect Substantial Desert Dust Asphericity, Geophys. Res. Lett., 47, e2019GL086592, https://doi.org/10.1029/2019GL086592, 2020.
Huneeus, N., Schulz, M., Balkanski, Y., Griesfeller, J., Prospero, J., Kinne, S., Bauer, S., Boucher, O., Chin, M., Dentener, F., Diehl, T., Easter, R., Fillmore, D., Ghan, S., Ginoux, P., Grini, A., Horowitz, L., Koch, D., Krol, M. C., Landing, W., Liu, X., Mahowald, N., Miller, R., Morcrette, J.-J., Myhre, G., Penner, J., Perlwitz, J., Stier, P., Takemura, T., and Zender, C. S.: Global dust model intercomparison in AeroCom phase I, Atmos. Chem. Phys., 11, 7781–7816, https://doi.org/10.5194/acp-11-7781-2011, 2011.
Journet, E., Balkanski, Y., and Harrison, S. P.: A new data set of soil mineralogy for dust-cycle modeling, Atmos. Chem. Phys., 14, 3801–3816, https://doi.org/10.5194/acp-14-3801-2014, 2014.
Kahn, R. A., Gaitley, B. J., Garay, M. J., Diner, D. J., Eck, T. F., Smirnov, A., and Holben, B. N.: Multiangle Imaging SpectroRadiometer global aerosol product assessment by comparison with the Aerosol Robotic Network, J. Geophys. Res.-Atmos., 115, D23209, https://doi.org/10.1029/2010JD014601, 2010.
Kaufman, Y. J., Koren, I., Remer, L. A., Tanre, D., Ginoux, P., and Fan, S.: Dust transport and deposition observed from the Terra-Moderate Resolution Imaging Spectroradiometer ( MODIS) spacecraft over the Atlantic ocean, J. Geophys. Res.-Atmos., 110, D10S12, https://doi.org/10.1029/2003jd004436, 2005.
Kim, M.-H., Kim, S.-W., and Omar, A. H.: Dust Lidar Ratios Retrieved from the CALIOP Measurements Using the MODIS AOD as a Constraint, Remote Sens-basel, 12, 251, https://doi.org/10.3390/rs12020251, 2020.
Kim, M.-H., Omar, A. H., Tackett, J. L., Vaughan, M. A., Winker, D. M., Trepte, C. R., Hu, Y., Liu, Z., Poole, L. R., Pitts, M. C., Kar, J., and Magill, B. E.: The CALIPSO version 4 automated aerosol classification and lidar ratio selection algorithm, Atmos. Meas. Tech., 11, 6107–6135, https://doi.org/10.5194/amt-11-6107-2018, 2018.
Kinne, S., Schulz, M., Textor, C., Guibert, S., Balkanski, Y., Bauer, S. E., Berntsen, T., Berglen, T. F., Boucher, O., Chin, M., Collins, W., Dentener, F., Diehl, T., Easter, R., Feichter, J., Fillmore, D., Ghan, S., Ginoux, P., Gong, S., Grini, A., Hendricks, J., Herzog, M., Horowitz, L., Isaksen, I., Iversen, T., Kirkevåg, A., Kloster, S., Koch, D., Kristjansson, J. E., Krol, M., Lauer, A., Lamarque, J. F., Lesins, G., Liu, X., Lohmann, U., Montanaro, V., Myhre, G., Penner, J., Pitari, G., Reddy, S., Seland, O., Stier, P., Takemura, T., and Tie, X.: An AeroCom initial assessment – optical properties in aerosol component modules of global models, Atmos. Chem. Phys., 6, 1815–1834, https://doi.org/10.5194/acp-6-1815-2006, 2006.
Kok, J. F., Adebiyi, A. A., Albani, S., Balkanski, Y., Checa-Garcia, R., Chin, M., Colarco, P. R., Hamilton, D. S., Huang, Y., Ito, A., Klose, M., Li, L., Mahowald, N. M., Miller, R. L., Obiso, V., Pérez García-Pando, C., Rocha-Lima, A., and Wan, J. S.: Contribution of the world's main dust source regions to the global cycle of desert dust, Atmos. Chem. Phys., 21, 8169–8193, https://doi.org/10.5194/acp-21-8169-2021, 2021a.
Kok, J. F., Adebiyi, A. A., Albani, S., Balkanski, Y., Checa-Garcia, R., Chin, M., Colarco, P. R., Hamilton, D. S., Huang, Y., Ito, A., Klose, M., Leung, D. M., Li, L., Mahowald, N. M., Miller, R. L., Obiso, V., Pérez García-Pando, C., Rocha-Lima, A., Wan, J. S., and Whicker, C. A.: Improved representation of the global dust cycle using observational constraints on dust properties and abundance, Atmos. Chem. Phys., 21, 8127–8167, https://doi.org/10.5194/acp-21-8127-2021, 2021b.
Levy, R. C., Mattoo, S., Munchak, L. A., Remer, L. A., Sayer, A. M., Patadia, F., and Hsu, N. C.: The Collection 6 MODIS aerosol products over land and ocean, Atmos. Meas. Tech., 6, 2989–3034, https://doi.org/10.5194/amt-6-2989-2013, 2013.
Li, L., Mahowald, N. M., Miller, R. L., Pérez García-Pando, C., Klose, M., Hamilton, D. S., Gonçalves Ageitos, M., Ginoux, P., Balkanski, Y., Green, R. O., Kalashnikova, O., Kok, J. F., Obiso, V., Paynter, D., and Thompson, D. R.: Quantifying the range of the dust direct radiative effect due to source mineralogy uncertainty, Atmos. Chem. Phys., 21, 3973–4005, https://doi.org/10.5194/acp-21-3973-2021, 2021.
Li, S.-M., Tang, J., Xue, H., and Toom-Sauntry, D.: Size distribution and estimated optical properties of carbonate, water soluble organic carbon, and sulfate in aerosols at a remote high altitude site in western China, Geophys. Res. Lett., 27, 1107–1110, https://doi.org/10.1029/1999GL010929, 2000.
Liang, X., Ignatov, A., Kramar, M., and Yu, F.: Preliminary Inter-Comparison between AHI, VIIRS and MODIS Clear-Sky Ocean Radiances for Accurate SST Retrievals, Remote Sens-Basel, 8, 203, https://doi.org/10.3390/rs8030203, 2016.
Liu, C., Panetta, R. L., Yang, P., Macke, A., and Baran, A. J.: Modeling the scattering properties of mineral aerosols using concave fractal polyhedra, Appl. Opt., 52, 640–652, 2013.
Liu, Z., Sugimoto, N., and Murayama, T.: Extinction-to-backscatter ratio of Asian dust observed with high-spectral-resolution lidar and Raman lidar, Appl. Opt., 41, 2760–2767, 2002.
Liu, Z., Kar, J., Zeng, S., Tackett, J., Vaughan, M., Avery, M., Pelon, J., Getzewich, B., Lee, K. P., Magill, B., Omar, A., Lucker, P., Trepte, C., and Winker, D.: Discriminating between clouds and aerosols in the CALIOP version 4.1 data products, Atmos. Meas. Tech., 12, 703–734, https://doi.org/10.5194/amt-12-703-2019, 2019.
Liu, Z., Omar, A., Vaughan, M., Hair, J., Kittaka, C., Hu, Y., Powell, K., Trepte, C., Winker, D., Hostetler, C., Ferrare, R., and Pierce, R.: CALIPSO lidar observations of the optical properties of Saharan dust: A case study of long-range transport, J. Geophys. Res.-Atmos., 113, D07207, https://doi.org/10.1029/2007JD008878, 2008.
Logothetis, S.-A., Salamalikis, V., Gkikas, A., Kazadzis, S., Amiridis, V., and Kazantzidis, A.: 15-year variability of desert dust optical depth on global and regional scales, Atmos. Chem. Phys., 21, 16499–16529, https://doi.org/10.5194/acp-21-16499-2021, 2021.
Luo, B., Minnett, P. J., Gentemann, C., and Szczodrak, G.: Improving satellite retrieved night-time infrared sea surface temperatures in aerosol contaminated regions, Remote Sens. Environ., 223, 8–20, https://doi.org/10.1016/j.rse.2019.01.009, 2019.
Madhavan, S., Xiong, X., Wu, A., Wenny, B. N., Chiang, K., Chen, N., Wang, Z., and Li, Y.: Noise Characterization and Performance of MODIS Thermal Emissive Bands, IEEE T. Geosci. Remote., 54, 3221–3234, https://doi.org/10.1109/TGRS.2015.2514061, 2016.
Mahowald, N., Albani, S., Kok, J. F., Engelstaeder, S., Scanza, R., Ward, D. S., and Flanner, M. G.: The size distribution of desert dust aerosols and its impact on the Earth system, Aeolian. Res., 15, 53–71, https://doi.org/10.1016/j.aeolia.2013.09.002, 2014.
Marticorena, B., Chatenet, B., Rajot, J. L., Traoré, S., Coulibaly, M., Diallo, A., Koné, I., Maman, A., NDiaye, T., and Zakou, A.: Temporal variability of mineral dust concentrations over West Africa: analyses of a pluriannual monitoring from the AMMA Sahelian Dust Transect, Atmos. Chem. Phys., 10, 8899–8915, https://doi.org/10.5194/acp-10-8899-2010, 2010.
McConnell, C. L., Highwood, E. J., Coe, H., Formenti, P., Anderson, B., Osborne, S., Nava, S., Desboeufs, K., Chen, G., and Harrison, M. A. J.: Seasonal variations of the physical and optical characteristics of Saharan dust: Results from the Dust Outflow and Deposition to the Ocean (DODO) experiment, J. Geophys. Res.-Atmos., 113, D14S05, https://doi.org/10.1029/2007JD009606, 2008.
McGill, M. J., Vaughan, M. A., Trepte, C. R., Hart, W. D., Hlavka, D. L., Winker, D. M., and Kuehn, R.: Airborne validation of spatial properties measured by the CALIPSO lidar, J. Geophys. Res.-Atmos., 112, D20201, https://doi.org/10.1029/2007JD008768, 2007.
McMillin, L. M., Xiong, X., Han, Y., Kleespies, T. J., and Van Delst, P.: Atmospheric transmittance of an absorbing gas. 7, Further improvements to the OPTRAN 6 approach, Appl. Opt., 45, 2028–2034, https://doi.org/10.1364/AO.45.002028, 2006.
Meng, Z., Yang, P., Kattawar, G. W., Bi, L., Liou, K., and Laszlo, I.: Single-scattering properties of tri-axial ellipsoidal mineral dust aerosols: A database for application to radiative transfer calculations, J. Aerosol Sci., 41, 501–512, 2010.
Miller, R. L. and Tegen, I.: Climate Response to Soil Dust Aerosols, J. Climate, 11, 3247–3267, https://doi.org/10.1175/1520-0442(1998)011<3247:Crtsda>2.0.Co;2, 1998.
Mishchenko, M. I., Travis, L. D., and Mackowski, D. W.: T-matrix computations of light scattering by nonspherical particles: A review, J. Quant. Spectrosc. Ra., 55, 535–575, https://doi.org/10.1016/0022-4073(96)00002-7, 1996.
Mishchenko, M. I., Travis, L. D., Kahn, R. A., and West, R. A.: Modeling phase functions for dustlike tropospheric aerosols using a shape mixture of randomly oriented polydisperse spheroids, J. Geophys. Res.-Atmos., 102, 16831–16847, 1997.
Müller, D., Lee, K.-H., Gasteiger, J., Tesche, M., Weinzierl, B., Kandler, K., Müller, T., Toledano, C., Otto, S., Althausen, D., and Ansmann, A.: Comparison of optical and microphysical properties of pure Saharan mineral dust observed with AERONET Sun photometer, Raman lidar, and in situ instruments during SAMUM 2006, J. Geophys. Res.-Atmos., 117, D07211, https://doi.org/10.1029/2011JD016825, 2012.
Müller, D., Weinzierl, B., Petzold, A., Kandler, K., Ansmann, A., Müller, T., Tesche, M., Freudenthaler, V., Esselborn, M., Heese, B., Althausen, D., Schladitz, A., Otto, S., and Knippertz, P.: Mineral dust observed with AERONET Sun photometer, Raman lidar, and in situ instruments during SAMUM 2006: Shape-independent particle properties, J. Geophys. Res.-Atmos., 115, D07202, https://doi.org/10.1029/2009JD012520, 2010.
Nousiainen, T. and Kandler, K.: Light scattering by atmospheric mineral dust particles, in: Light Scattering Reviews 9: Light Scattering and Radiative Transfer, edited by: Kokhanovsky, A. A., Springer Berlin Heidelberg, Berlin, Heidelberg, 3–52, https://doi.org/10.1007/978-3-642-37985-7_1, 2015.
O'Carroll, A. G., Armstrong, E. M., Beggs, H. M., Bouali, M., Casey, K. S., Corlett, G. K., Dash, P., Donlon, C. J., Gentemann, C. L., Høyer, J. L., Ignatov, A., Kabobah, K., Kachi, M., Kurihara, Y., Karagali, I., Maturi, E., Merchant, C. J., Marullo, S., Minnett, P. J., Pennybacker, M., Ramakrishnan, B., Ramsankaran, R., Santoleri, R., Sunder, S., Picart, S. S., Vázquez-Cuervo, J., and Wimmer, W.: Observational Needs of Sea Surface Temperature, Front. Mar. Sci., 6, 420, https://doi.org/10.3389/fmars.2019.00420, 2019.
Paepe, B. D. and Dewitte, S.: Dust Aerosol Optical Depth Retrieval over a Desert Surface Using the SEVIRI Window Channels, J. Atmos. Ocean. Tech., 26, 704–718, https://doi.org/10.1175/2008jtecha1109.1, 2009.
Pavolonis, M. J., Heidinger, A. K., and Sieglaff, J.: Automated retrievals of volcanic ash and dust cloud properties from upwelling infrared measurements, J. Geophys. Res.-Atmos., 118, 1436–1458, https://doi.org/10.1002/jgrd.50173, 2013.
Pavolonis, M. J., Sieglaff, J., and Cintineo, J.: Spectrally Enhanced Cloud Objects – A generalized framework for automated detection of volcanic ash and dust clouds using passive satellite measurements: 1. Multispectral analysis, J. Geophys. Res.-Atmos., 120, 7813–7841, https://doi.org/10.1002/2014JD022968, 2015.
Peyridieu, S., Chédin, A., Tanré, D., Capelle, V., Pierangelo, C., Lamquin, N., and Armante, R.: Saharan dust infrared optical depth and altitude retrieved from AIRS: a focus over North Atlantic – comparison to MODIS and CALIPSO, Atmos. Chem. Phys., 10, 1953–1967, https://doi.org/10.5194/acp-10-1953-2010, 2010.
Peyridieu, S., Chédin, A., Capelle, V., Tsamalis, C., Pierangelo, C., Armante, R., Crevoisier, C., Crépeau, L., Siméon, M., Ducos, F., and Scott, N. A.: Characterisation of dust aerosols in the infrared from IASI and comparison with PARASOL, MODIS, MISR, CALIOP, and AERONET observations, Atmos. Chem. Phys., 13, 6065–6082, https://doi.org/10.5194/acp-13-6065-2013, 2013.
Pierangelo, C., Mishchenko, M., Balkanski, Y., and Chédin, A.: Retrieving the effective radius of Saharan dust coarse mode from AIRS, Geophys. Res. Lett., 32, L20813, https://doi.org/10.1029/2005gl023425, 2005.
Pierangelo, C., Chédin, A., Heilliette, S., Jacquinet-Husson, N., and Armante, R.: Dust altitude and infrared optical depth from AIRS, Atmos. Chem. Phys., 4, 1813–1822, https://doi.org/10.5194/acp-4-1813-2004, 2004.
Proestakis, E., Amiridis, V., Marinou, E., Georgoulias, A. K., Solomos, S., Kazadzis, S., Chimot, J., Che, H., Alexandri, G., Binietoglou, I., Daskalopoulou, V., Kourtidis, K. A., de Leeuw, G., and van der A, R. J.: Nine-year spatial and temporal evolution of desert dust aerosols over South and East Asia as revealed by CALIOP, Atmos. Chem. Phys., 18, 1337–1362, https://doi.org/10.5194/acp-18-1337-2018, 2018.
Pu, B. and Ginoux, P.: How reliable are CMIP5 models in simulating dust optical depth?, Atmos. Chem. Phys., 18, 12491–12510, https://doi.org/10.5194/acp-18-12491-2018, 2018.
Quinn, P. K., Coffman, D. J., Bates, T. S., Miller, T. L., Johnson, J. E., Welton, E. J., Neusüss, C., Miller, M., and Sheridan, P. J.: Aerosol optical properties during INDOEX 1999: Means, variability, and controlling factors, J. Geophys. Res.-Atmos., 107, 19–25, https://doi.org/10.1029/2000JD000037, 2002.
Ridley, D. A., Heald, C. L., Kok, J. F., and Zhao, C.: An observationally constrained estimate of global dust aerosol optical depth, Atmos. Chem. Phys., 16, 15097–15117, https://doi.org/10.5194/acp-16-15097-2016, 2016.
Ryder, C. L., Highwood, E. J., Lai, T. M., Sodemann, H., and Marsham, J. H.: Impact of atmospheric transport on the evolution of microphysical and optical properties of Saharan dust, Geophys. Res. Lett., 40, 2433–2438, https://doi.org/10.1002/grl.50482, 2013a.
Ryder, C. L., Highwood, E. J., Rosenberg, P. D., Trembath, J., Brooke, J. K., Bart, M., Dean, A., Crosier, J., Dorsey, J., Brindley, H., Banks, J., Marsham, J. H., McQuaid, J. B., Sodemann, H., and Washington, R.: Optical properties of Saharan dust aerosol and contribution from the coarse mode as measured during the Fennec 2011 aircraft campaign, Atmos. Chem. Phys., 13, 303–325, https://doi.org/10.5194/acp-13-303-2013, 2013b.
Ryder, C. L., Marenco, F., Brooke, J. K., Estelles, V., Cotton, R., Formenti, P., McQuaid, J. B., Price, H. C., Liu, D., Ausset, P., Rosenberg, P. D., Taylor, J. W., Choularton, T., Bower, K., Coe, H., Gallagher, M., Crosier, J., Lloyd, G., Highwood, E. J., and Murray, B. J.: Coarse-mode mineral dust size distributions, composition and optical properties from AER-D aircraft measurements over the tropical eastern Atlantic, Atmos. Chem. Phys., 18, 17225–17257, https://doi.org/10.5194/acp-18-17225-2018, 2018.
Ryder, C. L., Highwood, E. J., Walser, A., Seibert, P., Philipp, A., and Weinzierl, B.: Coarse and giant particles are ubiquitous in Saharan dust export regions and are radiatively significant over the Sahara, Atmos. Chem. Phys., 19, 15353–15376, https://doi.org/10.5194/acp-19-15353-2019, 2019.
Saito, M., Yang, P., Ding, J., and Liu, X.: A Comprehensive Database of the Optical Properties of Irregular Aerosol Particles for Radiative Transfer Simulations, J. Atmos. Sci., 78, 2089–2111, https://doi.org/10.1175/jas-d-20-0338.1, 2021.
Scheuvens, D. and Kandler, K.: On composition, morphology, and size distribution of airborne mineral dust, Mineral Dust., 15–49, 2014. Scott, N. A. and Chedin, A.: A Fast Line-by-Line Method for Atmospheric Absorption Computations: The Automatized Atmospheric Absorption Atlas, J. Appl. Meteorol., 20, 802–812, https://doi.org/10.1175/1520-0450(1981)020<0802:aflblm>2.0.co;2, 1981.
Shao, Y., Wyrwoll, K.-H., Chappell, A., Huang, J., Lin, Z., McTainsh, G. H., Mikami, M., Tanaka, T. Y., Wang, X., and Yoon, S.: Dust cycle: An emerging core theme in Earth system science, Aeolian Res., 2, 181–204, 2011.
Sokolik, I. N. and Toon, O. B.: Incorporation of mineralogical composition into models of the radiative properties of mineral aerosol from UV to IR wavelengths, J. Geophys. Res.-Atmos., 104, 9423–9444, 1999.
Song, Q., Zhang, Z., Yu, H., Kato, S., Yang, P., Colarco, P., Remer, L. A., and Ryder, C. L.: Net radiative effects of dust in the tropical North Atlantic based on integrated satellite observations and in situ measurements, Atmos. Chem. Phys., 18, 11303–11322, https://doi.org/10.5194/acp-18-11303-2018, 2018.
Song, Q., Zhang, Z., Yu, H., Kok, J. F., Di Biagio, C., Albani, S., Zheng, J., and Ding, J.: Size-resolved dust direct radiative effect efficiency derived from satellite observations, Atmos. Chem. Phys., 22, 13115–13135, https://doi.org/10.5194/acp-22-13115-2022, 2022.
Song, Q., Zhang, Z., Yu, H., Ginoux, P., and Shen, J.: Global dust optical depth climatology derived from CALIOP and MODIS aerosol retrievals on decadal timescales: regional and interannual variability, Atmos. Chem. Phys., 21, 13369–13395, https://doi.org/10.5194/acp-21-13369-2021, 2021.
Stamnes, K., Tsay, S. C., Wiscombe, W., and Jayaweera, K.: Numerically stable algorithm for discrete-ordinate-method radiative transfer in multiple scattering and emitting layered media, Appl. Opt., 27, 2502–2509, https://doi.org/10.1364/ao.27.002502, 1988.
Stein, A., Draxler, R. R., Rolph, G. D., Stunder, B. J., Cohen, M., and Ngan, F.: NOAA's HYSPLIT atmospheric transport and dispersion modeling system, B. Am. Meteorol. Soc., 96, 2059–2077, 2015.
Tegen, I. and Fung, I.: Modeling of mineral dust in the atmosphere: Sources, transport, and optical thickness, J. Geophys. Res.-Atmos., 99, 22897–22914, https://doi.org/10.1029/94jd01928, 1994.
Toledano, C., Torres, B., Velasco-Merino, C., Althausen, D., Groß, S., Wiegner, M., Weinzierl, B., Gasteiger, J., Ansmann, A., González, R., Mateos, D., Farrel, D., Müller, T., Haarig, M., and Cachorro, V. E.: Sun photometer retrievals of Saharan dust properties over Barbados during SALTRACE, Atmos. Chem. Phys., 19, 14571–14583, https://doi.org/10.5194/acp-19-14571-2019, 2019.
Uno, I., Eguchi, K., Yumimoto, K., Takemura, T., Shimizu, A., Uematsu, M., Liu, Z., Wang, Z., Hara, Y., and Sugimoto, N.: Asian dust transported one full circuit around the globe, Nat. Geosci., 2, 557–560, https://doi.org/10.1038/ngeo583, 2009.
van der Does, M., Knippertz, P., Zschenderlein, P., Giles Harrison, R., and Stuut, J.-B. W.: The mysterious long-range transport of giant mineral dust particles, Sci. Adv., 4, eaau2768, doi:https://doi.org/10.1126/sciadv.aau2768, 2018.
Wang, C., Platnick, S., Zhang, Z., Meyer, K., and Yang, P.: Retrieval of ice cloud properties using an optimal estimation algorithm and MODIS infrared observations: 1. Forward model, error analysis, and information content, J. Geophys. Res.-Atmos., 121, 5809–5826, 2016.
Weinzierl, B., Sauer, D., Esselborn, M., Petzold, A., Veira, A., Rose, M., Mund, S., Wirth, M., Ansmann, A., Tesche, M., Gross, S., and Freudenthaler, V.: Microphysical and optical properties of dust and tropical biomass burning aerosol layers in the Cape Verde region—an overview of the airborne in situ and lidar measurements during SAMUM-2, Tellus B, 63, 589–618, https://doi.org/10.1111/j.1600-0889.2011.00566.x, 2011.
Weinzierl, B., Ansmann, A., Prospero, J. M., Althausen, D., Benker, N., Chouza, F., Dollner, M., Farrell, D., Fomba, W. K., Freudenthaler, V., Gasteiger, J., Groß, S., Haarig, M., Heinold, B., Kandler, K., Kristensen, T. B., Mayol-Bracero, O. L., Müller, T., Reitebuch, O., Sauer, D., Schäfler, A., Schepanski, K., Spanu, A., Tegen, I., Toledano, C., and Walser, A.: The Saharan Aerosol Long-Range Transport and Aerosol–Cloud-Interaction Experiment: Overview and Selected Highlights, B. Am. Meteorol. Soc., 98, 1427–1451, https://doi.org/10.1175/bams-d-15-00142.1, 2017.
Wentz, F. and Meissner, T.: AMSR ocean algorithm theoretical basis document, version 2, report, Remote Sens, Syst., Santa Rosa, Calif, https://eospso.gsfc.nasa.gov/sites/default/files/atbd/atbd-amsr-ocean.pdf (last access: 8 July 2023), 2000.
Winker, D. M., Pelon, J., Coakley, J. A., Ackerman, S. A., Charlson, R. J., Colarco, P. R., Flamant, P., Fu, Q., Hoff, R. M., Kittaka, C., Kubar, T. L., Le Treut, H., Mccormick, M. P., Mégie, G., Poole, L., Powell, K., Trepte, C., Vaughan, M. A., and Wielicki, B. A.: The CALIPSO Mission: A Global 3D View of Aerosols and Clouds, B. Am. Meteorol. Soc., 91, 1211–1230, https://doi.org/10.1175/2010BAMS3009.1, 2010.
Winker, D. M., Tackett, J. L., Getzewich, B. J., Liu, Z., Vaughan, M. A., and Rogers, R. R.: The global 3-D distribution of tropospheric aerosols as characterized by CALIOP, Atmos. Chem. Phys., 13, 3345–3361, https://doi.org/10.5194/acp-13-3345-2013, 2013.
Winker, D. M., Vaughan, M. A., Omar, A., Hu, Y., Powell, K. A., Liu, Z., Hunt, W. H., and Young, S. A.: Overview of the CALIPSO Mission and CALIOP Data Processing Algorithms, J. Atmos. Ocean. Tech., 26, 2310–2323, https://doi.org/10.1175/2009jtecha1281.1, 2009.
Woodage, M. J. and Woodward, S.: U.K. HiGEM: Impacts of Desert Dust Radiative Forcing in a High-Resolution Atmospheric GCM, J. Climate, 27, 5907–5928, https://doi.org/10.1175/jcli-d-13-00556.1, 2014.
Woodward, S.: Modeling the atmospheric life cycle and radiative impact of mineral dust in the Hadley Centre climate model, J. Geophys. Res.-Atmos., 106, 18155–18166, https://doi.org/10.1029/2000JD900795, 2001.
Xia, W., Wang, Y., and Wang, B.: Decreasing Dust Over the Middle East Partly Caused by Irrigation Expansion, Earth's Future, 10, e2021EF002252, https://doi.org/10.1029/2021EF002252, 2022.
Xiong, X., Wenny, B. N., Wu, A., Barnes, W. L., and Salomonson, V. V.: Aqua MODIS Thermal Emissive Band On-Orbit Calibration, Characterization, and Performance, IEEE T. Geosci. Remote., 47, 803–814, https://doi.org/10.1109/TGRS.2008.2005109, 2009.
Yang, Z., Wang, J., Ichoku, C., Hyer, E., and Zeng, J.: Mesoscale modeling and satellite observation of transport and mixing of smoke and dust particles over northern sub-Saharan African region, J. Geophys. Res.-Atmos., 118, 12139–112157, https://doi.org/10.1002/2013JD020644, 2013.
Yu, H., Chin, M., Remer, L. A., Kleidman, R. G., Bellouin, N., Bian, H., and Diehl, T.: Variability of marine aerosol fine-mode fraction and estimates of anthropogenic aerosol component over cloud-free oceans from the Moderate Resolution Imaging Spectroradiometer (MODIS), J. Geophys. Res.-Atmos., 114, D10206, https://doi.org/10.1029/2008JD010648, 2009.
Yu, H., Chin, M., Winker, D. M., Omar, A. H., Liu, Z., Kittaka, C., and Diehl, T.: Global view of aerosol vertical distributions from CALIPSO lidar measurements and GOCART simulations: Regional and seasonal variations, J. Geophys. Res.-Atmos., 115, D00H30, https://doi.org/10.1029/2009JD013364, 2010.
Yu, H., Remer, L. A., Kahn, R. A., Chin, M., and Zhang, Y.: Satellite perspective of aerosol intercontinental transport: From qualitative tracking to quantitative characterization, Atmos. Res., 124, 73–100, https://doi.org/10.1016/j.atmosres.2012.12.013, 2013.
Yu, H., Chin, M., Bian, H., Yuan, T., Prospero, J. M., Omar, A. H., Remer, L. A., Winker, D. M., Yang, Y., and Zhang, Y.: Quantification of trans-Atlantic dust transport from seven-year (2007–2013) record of CALIPSO lidar measurements, Remote Sens. Environ., 159, 232–249, https://doi.org/10.1016/j.rse.2014.12.010, 2015.
Yu, H., Tan, Q., Chin, M., Remer, L. A., Kahn, R. A., Bian, H., Kim, D., Zhang, Z., Yuan, T., Omar, A. H., Winker, D. M., Levy, R. C., Kalashnikova, O., Crepeau, L., Capelle, V., and Chédin, A.: Estimates of African Dust Deposition Along the Trans-Atlantic Transit Using the Decadelong Record of Aerosol Measurements from CALIOP, MODIS, MISR, and IASI, J. Geophys. Res.-Atmos., 124, 7975–7996, https://doi.org/10.1029/2019JD030574, 2019.
Yu, Y., Kalashnikova, O. V., Garay, M. J., Lee, H., Choi, M., Okin, G. S., Yorks, J. E., Campbell, J. R., and Marquis, J.: A global analysis of diurnal variability in dust and dust mixture using CATS observations, Atmos. Chem. Phys., 21, 1427–1447, https://doi.org/10.5194/acp-21-1427-2021, 2021.
Zhang, H., McFarquhar, G. M., Saleeby, S. M., and Cotton, W. R.: Impacts of Saharan dust as CCN on the evolution of an idealized tropical cyclone, Geophys. Res. Lett., 34, L14812, https://doi.org/10.1029/2007GL029876, 2007.
Zhang, P., Lu, N.-M., Hu, X.-Q., and Dong, C.-H.: Identification and physical retrieval of dust storm using three MODIS thermal IR channels, Glob. Planet Change, 52, 197–206, https://doi.org/10.1016/j.gloplacha.2006.02.014, 2006.
Zheng, J., Huang, X., Sangondimath, S., Wang, J., and Zhang, Z.: Efficient and Flexible Aggregation and Distribution of MODIS Atmospheric Products Based on Climate Analytics as a Service Framework, Remote Sens., 13, 3541, https://doi.org/10.3390/rs13173541, 2021.
Zheng, J., Zhang, Z., Garnier, A., Yu, H., Song, Q., Wang, C., Dubuisson, P., and Di Biagio, C.: The thermal infrared optical depth of mineral dust retrieved from integrated CALIOP and IIR observations, Remote Sens. Environ., 270, 112841, https://doi.org/10.1016/j.rse.2021.112841, 2022.
Zheng, J., Zhang, Z., Yu, H., Garnier, A., Song, Q., Wang, C., Di Biagio, C., Kok, J. F., and Derimian, Y. R. C.: Dataset for manuscript “Thermal infrared dust optical depth and coarse-mode effective diameter over oceans retrieved from collocated MODIS and CALIOP observations”, Zenodo [data set], https://doi.org/10.5281/zenodo.7857131, 2023.
Zhou, Y., Levy, R. C., Remer, L. A., Mattoo, S., and Espinosa, W. R.: Dust Aerosol Retrieval Over the Oceans With the MODIS/VIIRS Dark Target Algorithm: 2. Nonspherical Dust Model, Earth Space Sci., 7, e2020EA001222, https://doi.org/10.1029/2020EA001222, 2020.
- Abstract
- Introduction
- Data and model
- Description of the retrieval algorithm
- Evaluation of CALIOP–MODIS retrievals with in situ measurements – case studies
- Climatological analyses
- Discussions and conclusions
- Appendix A: the cloud-free clean radiative closure benchmark between the CRTM–DISORT-calculated and the MODIS-observed BTs
- Appendix B: pre-processing of the cloud-free dust detection from the collocated MODIS and CALIOP observation
- Appendix C: assignments of dust longwave refractive index
- Data availability
- Author contributions
- Competing interests
- Disclaimer
- Acknowledgements
- Financial support
- Review statement
- References
- Supplement