the Creative Commons Attribution 4.0 License.
the Creative Commons Attribution 4.0 License.
 | 25 Jul 2023
Characterization of dust-related new particle formation events based on long-term measurement in the North China Plain
Xiaojing Shen
Junying Sun
Huizheng Che
Yangmei Zhang
Chunhong Zhou
Wanyun Xu
Junting Zhong
Can Xia
Xinyao Hu
Sinan Zhang
Jialing Wang
Shuo Liu
Jiayuan Lu
Aoyuan Yu
Xiaoye Zhang
Mineral dust is a major natural atmospheric aerosol that impacts the Earth's radiation balance. The significant scavenging process of fine particles by the strong wind during the dust episodes provided a relatively clean environment that was favourable for new particle formation (NPF) occurrence. In this study, the NPF occurred following the dust episodes (dust-related NPF), and other cases under clean and polluted conditions were classified based on the long-term particle number size distribution (PNSD) in urban Beijing in spring from 2017 to 2021. It was found that the observed formation (Jobs) and growth rate (GR) of dust-related NPF events were approximately 50 % and 30 % lower than the values of other NPF days, respectively. A typical severe dust storm that originated from Mongolia and swept over northern China on 15–16 March 2021 was analysed, to illustrate how the dust storm influences the NPF event. The maximum hourly mean PM10 mass concentration reached 8000 µg m−3 during this dust storm. The occurrence of an NPF event after a dust storm was facilitated due to the low condensation sink (∼ 0.005 s−1) caused by the strong dilution process of pre-existing particles. However, a downward trend of particle hygroscopicity was found during dust storm and NPF event as compared with the polluted episode, resulting in an increasing trend of the critical diameter at different supersaturations (ss), where aerosols are activated as cloud condensation nuclei (CCN), although the NPF event occurred when dust faded. The critical diameter was elevated by approximately 6 %–10 % (ss = 0.2 % and 0.7 %) during the dust storm, resulting in a lower CCN activation ratio, especially at low supersaturation. Modifications of the nucleation and growth process, as well as the particle-size distribution and hygroscopicity of the dust particles, provide valuable information that reveals the underlying climate and air quality effects of Asian mineral dust.
- Article
(2162 KB) - Full-text XML
-
Supplement
(1468 KB) - BibTeX
- EndNote


New particle formation (NPF) events have been identified as a major particle source and can produce approximately 50 % of the cloud condensation nuclei (CCN), which leads to significant but poorly quantified radiative forcing (Gordon et al., 2017; Yu and Luo, 2009). Several studies have reported that NPF events can occur globally, including in pristine, urban, rural, forest, mountaintop, and coastal environments (Bianchi et al., 2016; Dada et al., 2017; Jokinen et al., 2018; Kulmala et al., 2004; Shen et al., 2011). Unlike relatively clean regions, the nucleation and subsequent growth processes are complex in polluted urban environments due to the incomplete understanding of the dynamics of nanoparticles and clusters under highly polluted conditions (Cai and Jiang, 2017; Kulmala et al., 2017). It also remains challenging to quantify the contribution of NPF events to haze formation in China because it is difficult to separate aerosols from primary sources and gas-to-particle formation (Kulmala et al., 2022).
Mineral dust particles are another important aerosol type in the atmosphere that primarily originate from arid and semiarid regions. They can significantly affect the radiative balance of the Earth's system by scattering and absorbing solar radiation, as well as the formation and properties of clouds by acting as CCN and ice nuclei (DeMott et al., 2010; Liao and Seinfeld, 1998; Seinfeld and Pandis, 1998; Twohy et al., 2009). Model simulations were performed with and without dust influence, and the results predicted that total particle concentration and CCN were reduced by approximately 20 % and 10 %, respectively, as influenced by the dust pollution plume in East Asia (Manktelow et al., 2010). Dust particles can also lead to radiative feedback in the planetary boundary layer and lift dust particles to higher altitudes (Liu et al., 2016). The heterogeneous reactions of mineral dust with trace gases in the atmosphere can alter the chemical and physical properties of aerosols, including particle hygroscopicity (Ge et al., 2015; Tang et al., 2017). Heterogeneous oxidation of SO2 onto particles has been observed, and is an important mechanism for converting SO2 into sulfate (Li et al., 2011). Several laboratory and field studies have focused on the formation of secondary aerosols on dust particles (Liu et al., 2013; Xu et al., 2020). Dust particles enhance the reactive surface areas, absorb trace gases (Ma et al., 2017), and can further modify the chemical composition of the particles. Previous studies have also shown that the secondary formation of inorganics on the dust surface can enhance solubility and hygroscopicity (Mori, 2003; Perry et al., 2004).
In the economically developed and densely populated North China Plain (NCP) region, aerosols are dominated by anthropogenic emissions and can cause serious air pollution (Y. Zhang et al., 2019). However, based on the optical parameters, including particle linear depolarization ratio, volume linear depolarization ratio, and lidar ratio derived from a Raman lidar, there were approximately 45 % of aerosols below 1.8 km above the ground contributed by polluted dust (the mixture of anthropogenic aerosols and dust particles) in northern China (Wang et al., 2021). It has also been reported that the coarse mode (diameter ≥ 1 µm) serves as a medium and promotes rapid secondary aerosol formation, driving severe haze formation in the NCP region of China (Xu et al., 2020). However, the impact of dust bursts on nucleation and growth processes based on long-term measurement has not been discussed in urban areas in China based on open literature.
In this work, we analysed NPF events based on long-term measurement of particle number size distribution (PNSD) to characterize NPF events influenced by dusty days. NPF events occur under the clean atmosphere with extremely low condensation sink (CS) when the dust episodes' fade is analysed, which helps to evaluate how the dust particles modify the atmospheric conditions and facilitate the nucleation and growth processes. Specifically, a case study of a typical NPF event occurring after a severe dust storm is discussed in detail. A severe sand and dust storm (SDS) hit Northeast Asia from 15 to 16 March 2021, sweeping from Mongolia, through most parts of North China, and to the Korean Peninsula, causing widespread damage, severe air pollution, and low visibility. This dust storm has been reported to be the most intensive event over the last 2 decades based on satellite and ground-based observations (Gui et al., 2022). For this specific case, the influence of dust on the NPF event, including the number/volume size distribution, chemical composition, and hygroscopicity of submicron particles, as well as CCN-sized particles, was analysed to reveal the underlying climate and air quality effects of a typical severe Asian mineral dust storm.
2.1 Sampling site
The physical and chemical properties of the particles were measured on the roof of the Chinese Academy of Meteorological Sciences (CAMS) building on the Chinese Meteorological Administration campus. The site is located approximately 53 m above ground level in the western Beijing urban area between the second- and third-ring roads. A major road with heavy traffic to the west of the site indicates that the sampled air could be influenced by traffic emissions. More information on the site can be found in the following studies (Shen et al., 2019; X. Wang et al., 2018).
2.2 Instrumentation
Ambient aerosols were sampled through a PM10 impactor with a total flow rate of 16.7 L min−1. Different aerosol instruments were applied, including a tandem scanning mobility particle sizer (TSMPS, TROPOS, Germany). The TSMPS system consisting of two differential mobility analysers (DMAs, TROPOS, Germany) and two condensation particle counters (CPCs, models 3772 and 3776, TSI Inc., St Paul, USA) was used to measure PNSDs of 3–850 nm in mobility diameter at the CAMS site from 2017 to 2021. In this study, as we focused on dust events concentrated in spring, the data from March, April, and May from 2017 to 2021 were analysed. Due to the malfunction of CPC 3776, which measured the PNSDs below 40 nm, the data in spring 2020 were excluded, as the formation and growth rate of NPF days could not be precisely identified. More details about PNSD measurement setup can refer to Shen et al. (2021).
During the extensive campaign in the spring of 2021, in addition to TSMPS, other instruments including an aerodynamic particle sizer (APS, model 3321, TSI Inc., USA), a hygroscopicity tandem differential mobility analyser (H-TDMA, TROPOS, Germany), and an aerodyne high-resolution time-of-flight aerosol mass spectrometer (HR-ToF-AMS, Aerodyne Research, Inc., USA) shared a common inlet, and the relative humidity (RH) of the sample air was controlled below 30 % with an automatic regenerating absorption aerosol dryer system.
Particles with an aerodynamic diameter in the size range of 0.5–10 µm were derived using APS. Combined with TSMPS data, the PNSD can be used to calculate the surface and volume concentrations, assuming a spherical particle shape. However, owing to the non-sphericity of the dust particles, the surface area cannot be directly converted. Previous studies have also revealed that APS can undersize particles with irregular shapes (Cheng et al., 1990) and oversize dense particles (Barron, 1996), and may result in approximately 10 %–30 % under-sizing of dust particles (Cheng et al., 1990). The particle number concentration in the overlap size range of 500–850 nm derived from TSMPS and APS was compared, and the bias was smaller depending on the increasing particle size. For the particles of ∼ 850 nm, the ratio of number concentration from TSMPS to that from APS was about 1.5. The mean and standard deviation of PNSD and volume size distribution derived from TSMPS and APS is given in the Supplement (Fig. S1).
The H-TDMA system is comprised of two DMAs, a CPC (Model 3772, TSI Inc., USA), and a humidifier system between the two DMAs. The first DMA selects the quasi-monodisperse particles at a diameter (, 100 nm) under the dry state with 30 % RH (Maßling et al., 2003). Then, the size-selected particles pass through a humidity conditioner, which can be adjusted to the RH setting of 90 %. The probability distribution function (PDF) of hygroscopic growth factor (HGF), HGF-PDF, is inverted by the TDMAinv method developed by Gysel et al. (2009).
The chemical composition of non-refractory PM1, including organic components, sulfate, nitrate, ammonium, and chloride, was derived using HR-ToF-AMS with a 5 min resolution (Drewnick et al., 2005). The calibrations of ionization efficiency (IE) were performed, using size-selected (300 nm) ammonium nitrate particles before and after the experiment. Default relative IE values were used for organics (1.4), nitrate (1.1), sulfate (1.2), ammonium (4.0), and chloride (1.3), respectively. The HR-ToF-AMS collection efficiency (CE) accounts for the incomplete detection of aerosol species owing to particle bounce at the vaporizer, and/or the partial transmission of particles by the lens (Canagaratna et al., 2007). In this study, a composition-dependent CE correction was used, following the methodology described by Middlebrook et al. (2012). Positive matrix factorization (PMF) (Ulbrich et al., 2009) and a multilinear engine (ME-2) (Canonaco et al., 2013) modelling of high time resolution organic mass spectrometric data from HR-ToF-AMS have also been used to resolve organics into primary organic aerosols (POA) and oxygenated organic aerosols (OOAs), which correspond to different sources and processes (Zhang et al., 2022).
The mass concentrations of PM2.5 and PM10 with hourly time resolution at the selected air quality monitoring sites were derived from the China National Environment Monitoring Centre (CNEMC, http://www.cnemc.cn, last access: 25 October 2022). Trace gases at the CAMS site were measured simultaneously using a set of online analysers from the Thermo Electron Corporation (USA), including SO2 (43 CTL, C-series trace level), O3 (49 C), and NO2 (42 CTL). The lower detection limit (with a precision) of TE49C, 42 CTL, and 43 CTL was 1 ppb (1 ppb), 50 ppt (0.4 ppb), and 0.1 ppb (1 ppb), respectively (Lin et al., 2009). Measurement signals of trace gases were recorded as 1 min averages (Lin et al., 2011); however, the hourly average data were used for discussion, in order to match with the PM mass concentration data. The visibility data are from the national surface meteorological observation stations of the China Meteorological Administration (CMA).
2.3 Calculations
2.3.1 NPF classification, formation, and growth rate
The classification of NPF events was based on the principles and methods presented by Dal Maso et al. (2005), in which a distinct new mode of particles (3–25 nm) had to appear in the size distribution of the nucleation mode and grow into larger diameters in the following hours after nucleation started. The parameters characterizing NPF events include observed formation rate at 3 nm (Jobs), growth rate (GR), and CS, which can be determined by the PNSD measurement, as suggested by Kulmala et al. (2012).
where CoagS is the coagulation sink, and GR3−25 is the growth rate from 3 to 25 nm. Further, GR is defined as the diameter rate of change with time: GR (nm h−1), where Dp,1 and Dp,2 are the geometric mean diameters (Dp,g) when the nucleated particles start and stop growing, respectively. Dp,g can be derived by using lognormal fitting algorithms (Hussein et al., 2005).
2.3.2 Oxidation ratio of secondary inorganics
The sulfur oxidation ratio (SOR) and nitrogen oxidation ratio (NOR) are often used to estimate secondary sulfate and nitrate formation via the reactions of SO2 and NO2 (Wu et al., 2020). SOR and NOR are defined as the molar ratios of sulfate and nitrate to total oxidized sulfur and nitrogen, respectively, and are calculated as follows:
where n represents the molar concentration.
2.3.3 Correction of the dust particle diameter
The TSMPS system gives the PNSD as a function of mobility diameter (Dp), which can represent the volume equivalent diameter (Dp,ve) for the spherical particles. The aerodynamic diameter (Dp,a) given by APS can be converted to the mobility diameter by applying the particle density (ρ) and shape factor (χ), which can be used to derive the entire particle size range (3–10 µm) (Hinds, 1999; Reid, 2003):
where Cc is the Cunningham slip correction factor, and Cc(Dp,a) nearly equals to Cc(Dp,ve) due to the particles derived by APS being in the continuum region. For bulk dust aerosols, a density of 2.5 g cm−3 and a mean shape factor of 1.8, which ranged from 1.6 to 2.6, were applied in this study (Reid et al., 2008).
2.3.4 Hygroscopicity parameter
The hygroscopic parameter (κ) can be calculated using the approximate expression suggested by (Petters and Kreidenweis, 2007):
where Dp,dry (100 nm) and HGF are the initial dry particle diameter and hygroscopic growth factor at RH (90 %) measured by H-TDMA, ρw is the density of water (1.0 g cm−3), Mw is the molecular weight of water, is the surface tension of the water solution (0.0728 N m−2), R is the universal gas constant, T is the temperature, and Dp,crit is the critical value at which 50 % of the particles are activated at supersaturation (Sc).
3.1 The overall dust-related NPF events from 2017 to 2021
The dusty days were classified into three types based on visibility (National Weather Bureau of China, 1979; Wang et al., 2005), including dust storms with sand being lifted by strong winds and visibility (vis) < 1.0 km; blowing dust formed by strong wind carrying a lot of dust and sand, with visibility of 1.010 km; and floating dust with fine dust suspended in the lower troposphere with vis ≤ 10 km. The daily weather phenomena and visibility are issued by the CMA (http://www.asdf-bj.net/publish/observation/5.html, last access: 23 March 2023), which can also help to identify the dust episode. The potential source contribution function (PSCF) analysis showed (Fig. S2 in the Supplement) that high PM2.5 mass concentration at CAMS was dominated by two sources, the northwesterly and westerly air masses containing dust particles and the southerly air mass with high mass loading of anthropogenic aerosols. For a high level of PM10 mass concentration, the air masses mainly passed through Inner Mongolia, carrying high mass loading of dust particles.
From 2017 to 2021, dust storms (DSs), blowing dust (BD), and floating dust (FD) episodes occurred once on 15 March 2021, 13, and 25 d, respectively. Following approximately 80 % of the dust days, the NPF event subsequently occurred, as shown in Fig. 1. Considering the total NPF days in each spring (March, April, May) from 2017 to 2021, there were 44 d in 2017, 29 d in 2018, 30 d in 2019, and 31 d in 2021. NPF events were classified into different types, which occurred under clean conditions (103 clean NPF cases) and polluted conditions (10 polluted NPF cases) and events influenced by BD (9 cases), FD (11 cases), and DS (1 case) episodes, respectively. The clean and polluted NPF events were identified according to the CS criterion value of 0.027 s−1, which was the median value during the measurement. The non-dust related NPF events with CS above this value were regarded as the polluted case, otherwise, the cases were clean NPF types. The abrupt outbreak of the coronavirus disease 2019 (COVID-19) in early 2020 and the preventive restrictions of human activity resulted in the reduction of anthropogenic emissions (Le et al., 2020). Besides the instrument malfunction as mentioned above, in order to exclude the influence of the COVID-19, NPF events in the spring of 2020 were not discussed in this study. However, we elucidated that the elevated atmospheric oxidizing capacity during the lockdown period favoured nucleation and growth processes in urban Beijing (Shen et al., 2021).
It was found that the NPF events could be interrupted or prohibited by the prevailing of dust episodes or the mixture with anthropogenic emissions, which could explain the other 20 % of the dusty days without NPF events afterwards. NPF events usually occurred around 08:00–12:00 LT when solar radiation increased, so if the dust particles prevailed during this period, it could prevent NPF occurrence. For some cases of blowing and floating dust days overlaid by the anthropogenic aerosols, for example, 18 March, 5 April, and 15 May 2019, the CS remained high during the dust episodes (above 0.027 s−1), which was unfavourable for NPF occurrence. For some cases (6–8 May 2021, Fig. S3 in the Supplement), the whole dust episode was composed of blowing and floating dust depending on the strength of air masses containing dust particles influencing Beijing. The NPF event cannot be observed until the whole dust episode is finished. On 7 and 8 May, NPF events were observed with extremely low CS values of approximately 0.0025–0.003 s−1, indicating that the concentration level of precursors participating nucleation and growth were comparable for these two cases. Although there was no direct H2SO4 measurement available in this work, the proxy sulfuric acid concentration was estimated as recommended by Lu et al. (2019), and the details were given in the Supplement. The proxy H2SO4, as well as SO2 and NO2, concentrations were similar on May 7 and 8 (Figs. S4, S5 in the Supplement). Under specific conditions, for example, the nucleation process was observed on 28 March 2021; however, the growth process was interrupted by the elevated background aerosol concentration, indicated by the increasing CS (Fig. S6 in the Supplement). In addition, the mixture of dust and anthropogenic aerosols from southerly air mass could result in high CS and thus the NPF event was prohibited (Figs. S7, S8 in the Supplement).
Table 1The date of different dust types observed in Beijing from 2017 to 2021.
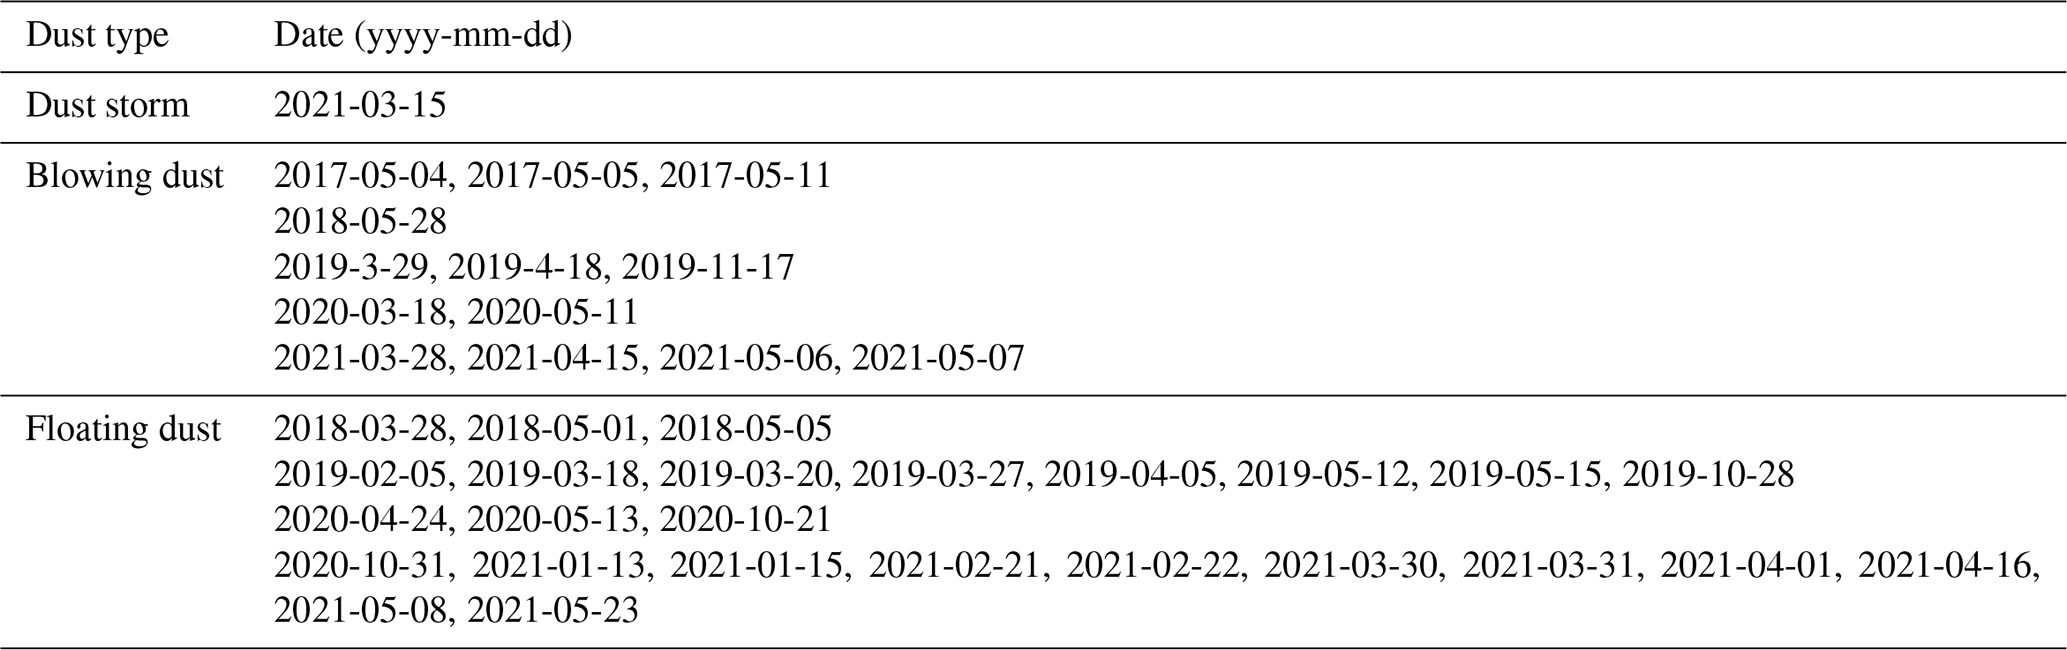
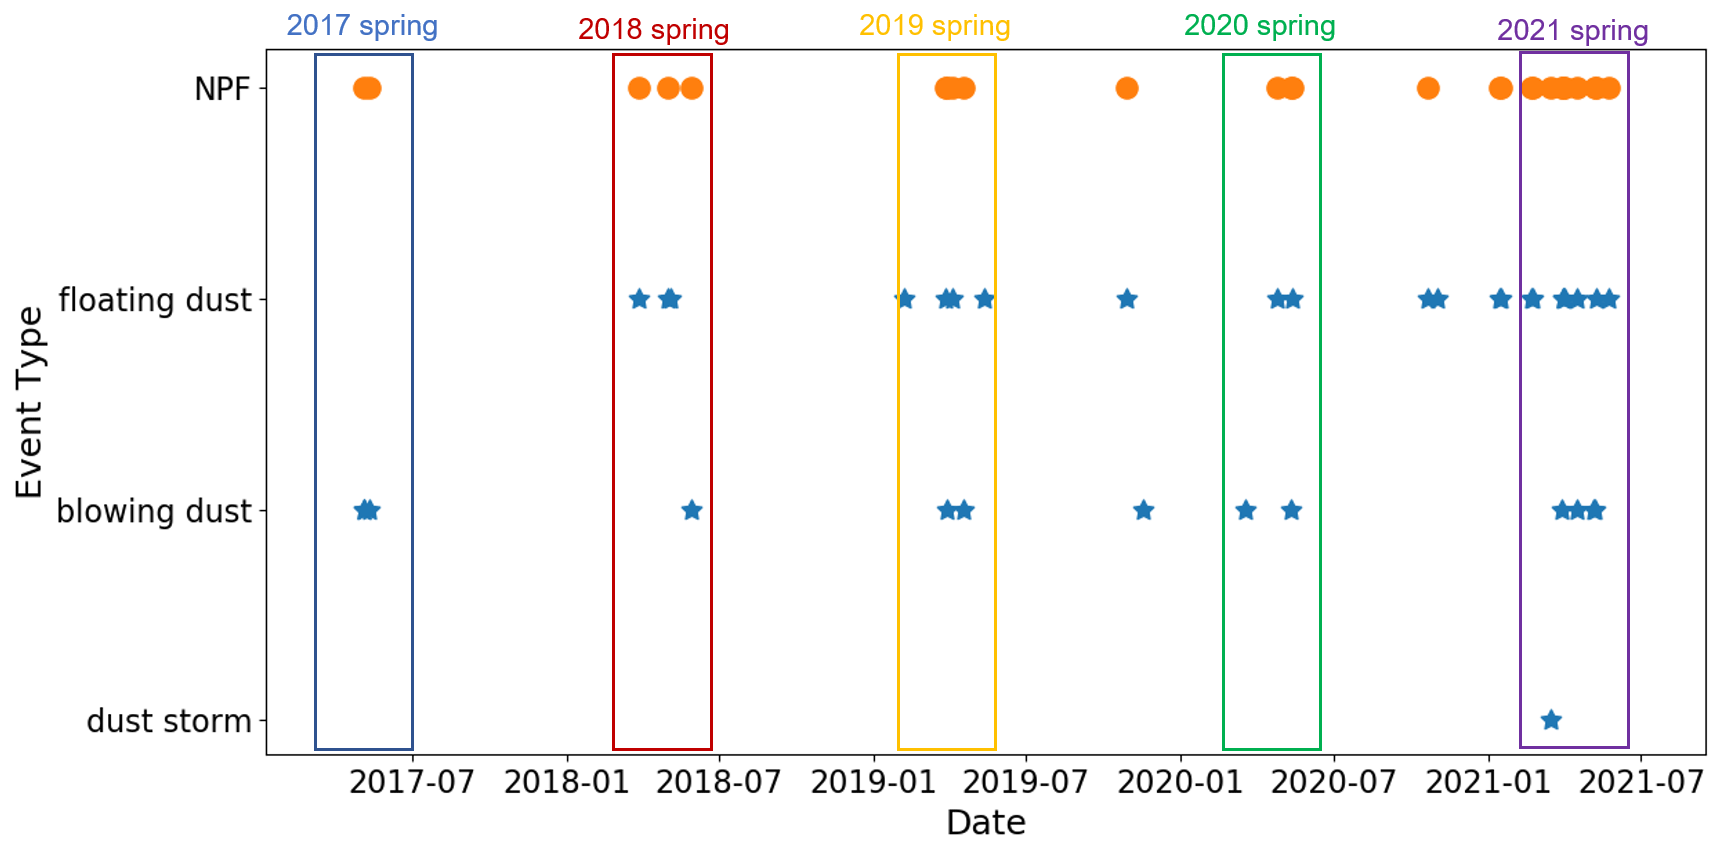
Figure 1The occurrence of dusty days, including dust storms, blowing dust, and floating dust episodes from 2017 to 2021, and the NPF events observed after each dust event. The stars and dots represent the dust and NPF events, respectively.
The anomaly plots were obtained by means of the PNSD of NPF occurring on non-dust days, subtracting the mean PNSD of dust-related NPF in each spring from 2017 to 2021, and was shown in Fig. 2. The positive anomaly indicated how much the particle number concentration in each corresponding size bin on non-dust NPF days was higher than that on dust-related NPF days, whereas the negative anomaly indicated that the number concentration was lower on non-dust NPF days. Positive PNSD anomalies (Fig. 2a, c, e, g) in nucleation and Aitken mode showed stronger nucleation and growth processes. Table 2 lists the statistical values of dust-related NPF events and other NPF events. The observed formation rate on dust-related NPF days (Jobs,dust_NPF) accounted for approximately 43 %–58 % of the value on other NPF days (Jobs,other_NPF) from 2017 to 2021, with a mean value of approximately 51 %. GR of dust related-NPF (GRdust_NPF) ranged from 2.0 to 3.1 nm h−1, whereas the value of other NPF days (GRother_NPF) was 3.6 to 4.4 nm h−1. The ratio of GRdust_NPF to GRother_NPF ranged from 0.50 to 0.86, with a mean value of approximately 0.67. However, the growth process is usually undergone over several hours, with considerable anthropogenic emissions contributing to the particle growth.
Table 2The statistical values of NPF in spring from 2017–2021, including the number (N) of dust-related NPF events and other NPF events and the observed formation rate (Jobs) and growth rate (GR) of these two types of NPF events.
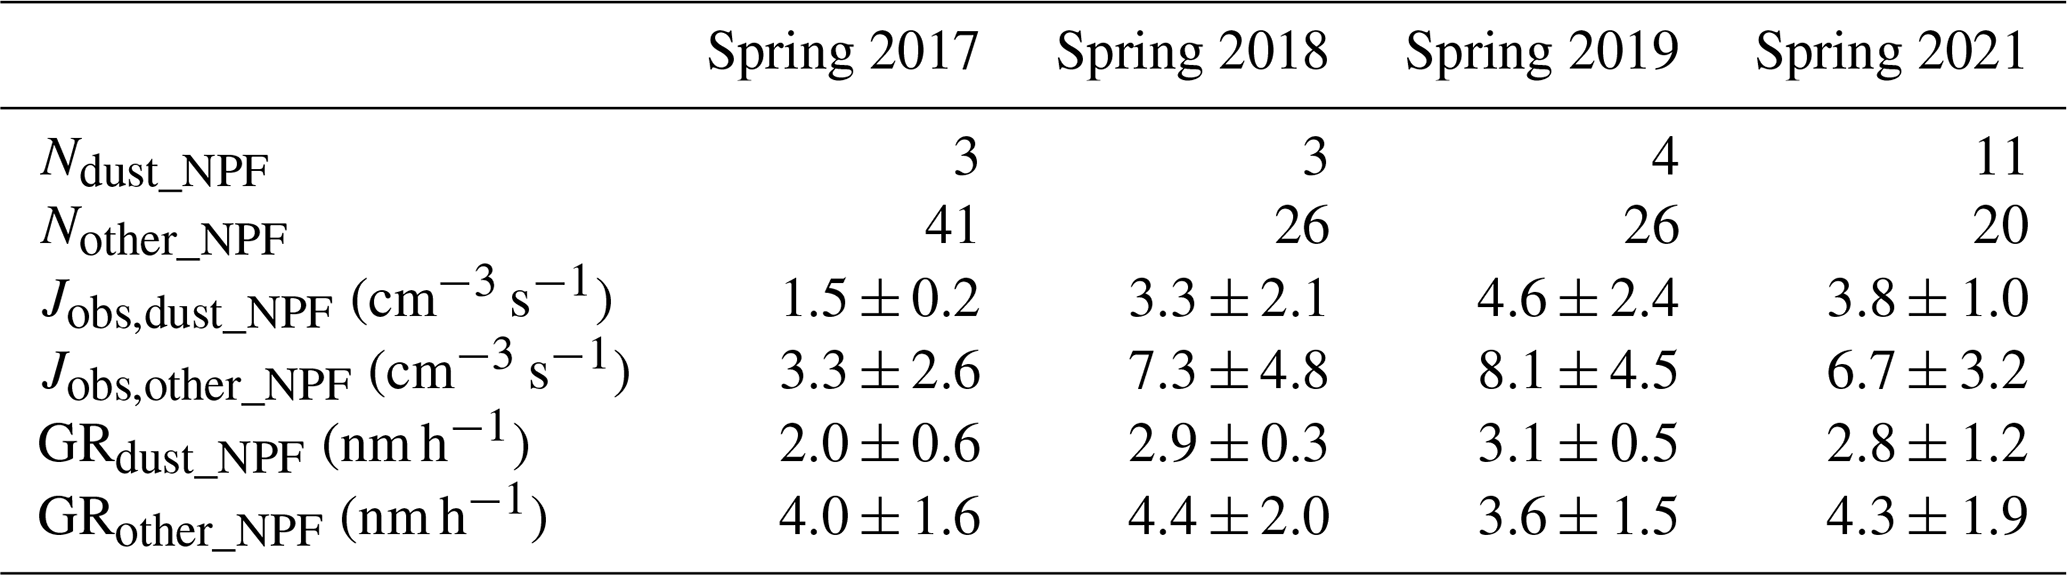
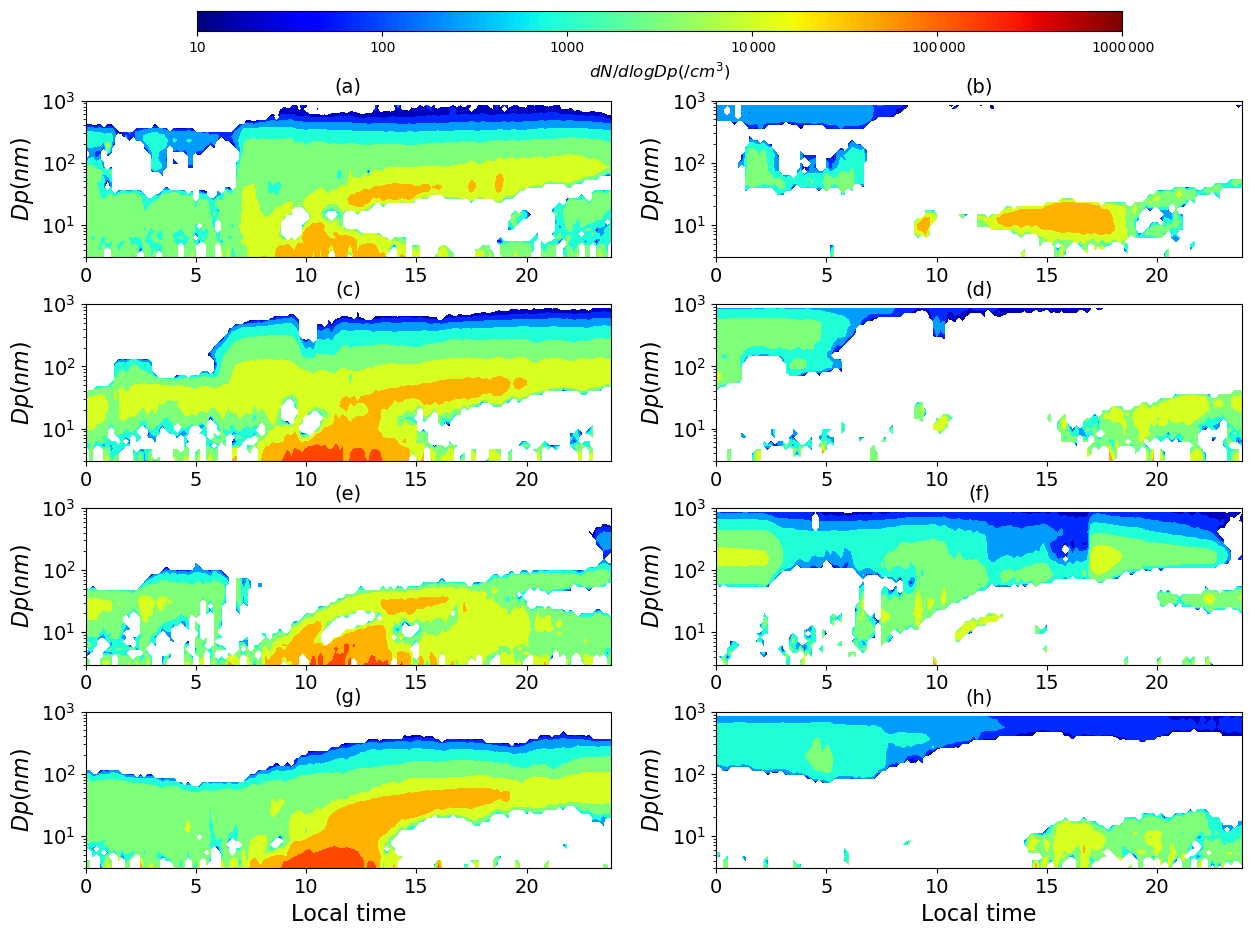
Figure 2The positive (a, c, e, g) and negative (b, d, f, h) anomalies of PNSD derived by the mean PNSDs of NPF events on non-dust days in spring (March, April, and May), subtracting the means of dust-related NPF days in 2017 (a, b), 2018 (c, d), 2019 (e, f), and 2021 (g, h).
The scatterplot of Jobs, GR, and CS categorized by different NPF event types is given in Fig. 3. It seems the relationship between Jobs and GR is not clear. Jobs ranged from 0.3 to 23.6 cm−3 s−1, with the mean value of 6.1 cm−3 s−1. GR ranged from 1.1 to 8.9 nm h−1, with the mean value of 4.2 nm h−1. The mean Jobs of NPF events under clean, polluted, BD, and FD conditions was 5.7, 8.7, 6.6, and 6.8 cm−3 s−1, respectively. The corresponding mean GR value was 4.2, 4.3, 4.1, and 3.7 nm h−1, respectively, and mean CS was 0.006, 0.020, 0.005, and 0.005 s−1. Jobs under polluted conditions was significantly higher than those of other NPF types, suggesting that there were abundant condensing vapours participating in nucleation and overcoming the competition with the pre-existing particles (as indicated by high CS values).
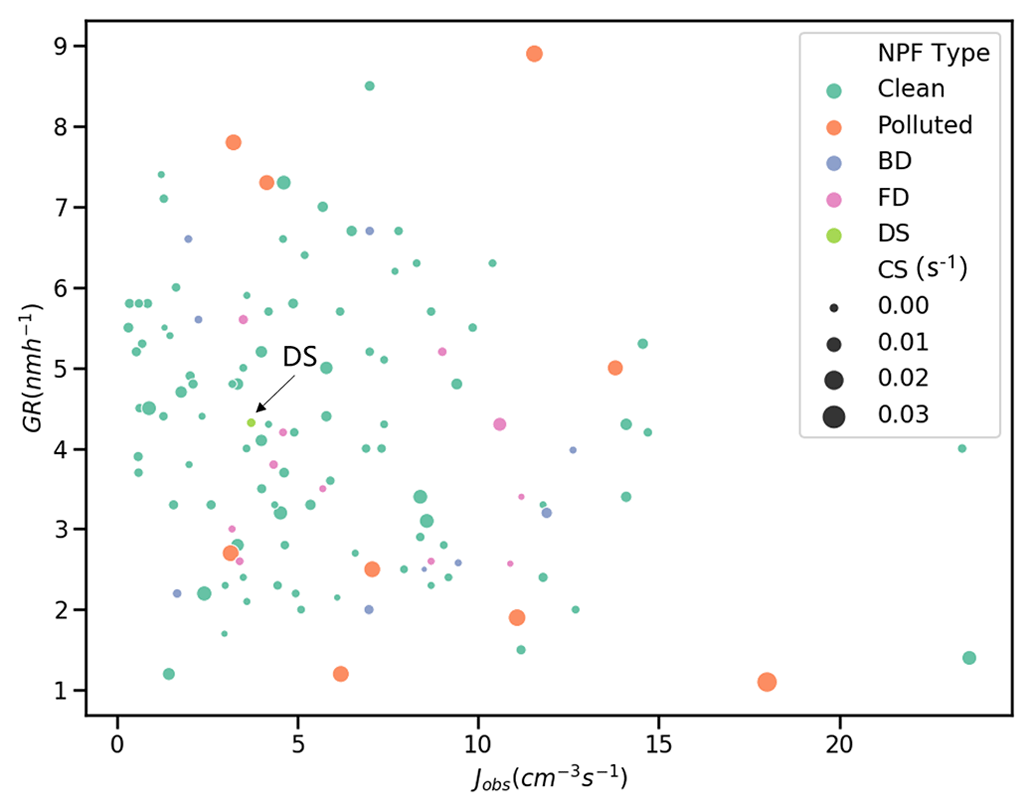
Figure 3Scatter plot of formation rate (Jobs), growth rate (GR), and condensation sink (CS) as categorized by different NPF event types, including the cases occurring under clean and polluted conditions and influenced by blowing dust (BD), floating dust (FD), and dust storm (DS) days.
The statistical results of Jobs, GR, and CS of different NPF types were given in Fig. 4. Due to the limited samples of each dust-related NPF event, the statistical analysis was conducted for all dust-related NPF events. The NPF event studies have been conducted extensively since 1990 worldwide and 2000 over China (e.g. Kerminen et al., 2018; Chu et al., 2019). Based on the 1-year study of NPF events at Peking University (PKU) site in Beijing in 2004, it had been reported that Jobs at 3 nm ranged from 3.3 to 81.4 cm−3 s−1, and GR ranged from 0.1 to 11.2 nm h−1, respectively (Wu et al., 2007). Wang et al. (2013) also reported that Jobs at PKU site ranged from 2.2 to 34.5 cm−3 s−1, and GR ranged from 2.5 to 15.3 nm h−1 from March to November in 2008. PKU site is located 5 km to the north of CAMS site, which is a representative urban site in Beijing with a long-term study of NPF events. Based on the long-term study at PKU site (2013–2019), it was reported that the annual average of Jobs decreased from 12 cm−3 s−1 in 2013 to 3 cm−3 s−1 in 2017, whereas it increased to 5.0 cm−3 s−1 in 2019, and GR values kept stable around 2.0–4.0 nm h−1 during these years (Shang et al., 2022). The mean values of Jobs and GR in this study were 6.1 cm−3 s−1 and 4.2 nm h−1, which were comparable with the values reported by Shang et al. (2022). However, due to the limited cases of BD-, FD-, and DS-influenced NPF events in this work, a confident comparison result among different dust related NPF events could not be derived.
The median CS of dust-related, clean, and polluted NPF events was 0.005, 0.006, and 0.020 s−1 (Fig. 4c), respectively. It should be noted that the CS calculation did not consider coarse-mode particles, as dust particles had faded when the NPF started. Furthermore, the influence of the dust particles on CS is minor based on the calculation in the following discussion. Although the precursors from anthropogenic emissions have been proved to participate the particle nucleation and growth processes, it is difficult to quantify its contribution, especially in megacities such as Beijing (Kulmala et al., 2022). The complex primary emissions, for example, traffic emissions with plentiful nanoparticles, can mix with the freshly nucleated particles, making it difficult to resolve the particles from primary emissions and secondary formation. However, based on some long-term studies of NPF events, it has been reported that the decrease of the precursors due to the emission control strategies in China has caused formation rate reduction from 2013 to 2017 both in Beijing (Shang et al., 2022) and rural sites in Yangtze River Delta region (Shen et al., 2022).
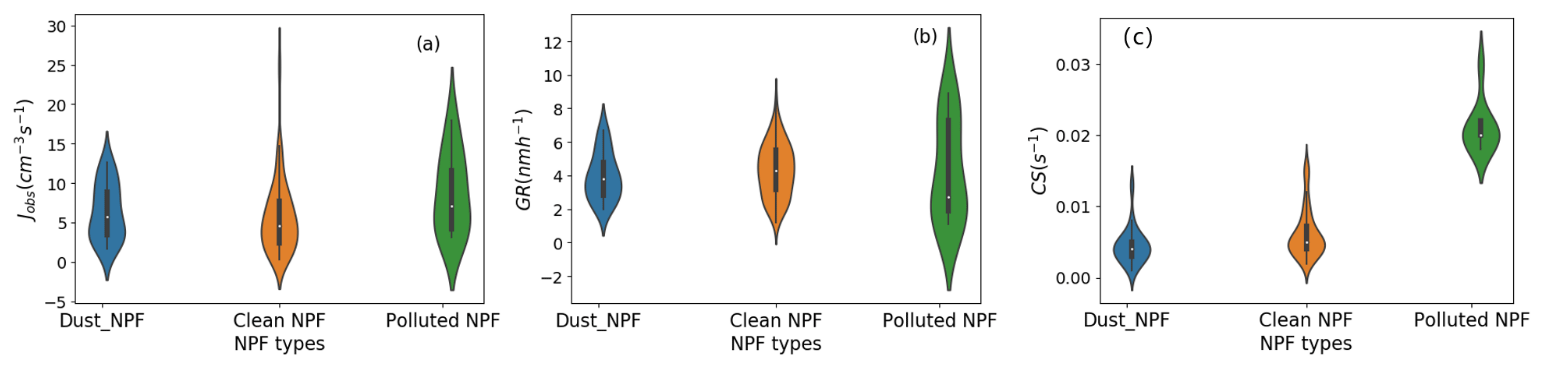
Figure 4The violin plot of formation rate (Jobs) (a), growth rate (GR) (b), and condensation sink (CS) of dust-related NPF (Dust_NPF) and other NPF events under clean (Clean NPF) and polluted conditions (Polluted NPF). The marker represents the median value, the box indicates the interquartile range, and the shaded area represents the distribution probability.
The mean diurnal concentration of particles in the size range of 3–25 nm (N3−25) and Dp,g on NPF events occurred under clean and polluted conditions and dust-related NPF events as influenced by BD, FD, and DS (16 March 2021) episodes, respectively, was given in Fig. 5. N3−25 showed a similar diurnal pattern, which peaked around noon time governed by an NPF event. The lower N3−25 was found on DS-related NPF events, also with smaller Dp,g at the initial growth stage below 20 nm, indicating less precursors participating in nucleation and growth processes. It should also be addressed that only one DS-related NPF event occurred (16 March 2021) in this study, which could not represent the general characteristics of NPF events influenced by dust storms. Dp,g on the dust-related NPF events (including BD, FD, and DS types) in Fig. 5b was generally lower than that on the clean and polluted NPF events with nucleated particles below 20 nm. A quick growth of nucleated particles at around 19:00–20:00 LT was probably associated with the wind direction change as given in the SM (Fig. S9). The previous studies in Beijing have revealed that the southerly air masses containing plentiful anthropogenic precursors facilitated the nucleation and growth processes of NPF events (Wang et al., 2013; Shen et al., 2018). It was also found that polluted NPF events usually started later, at around 10:00 LT, with N3−25 quickly peaking at around 12:00 LT, indicating a shorter nucleation process with a larger formation rate as shown above.
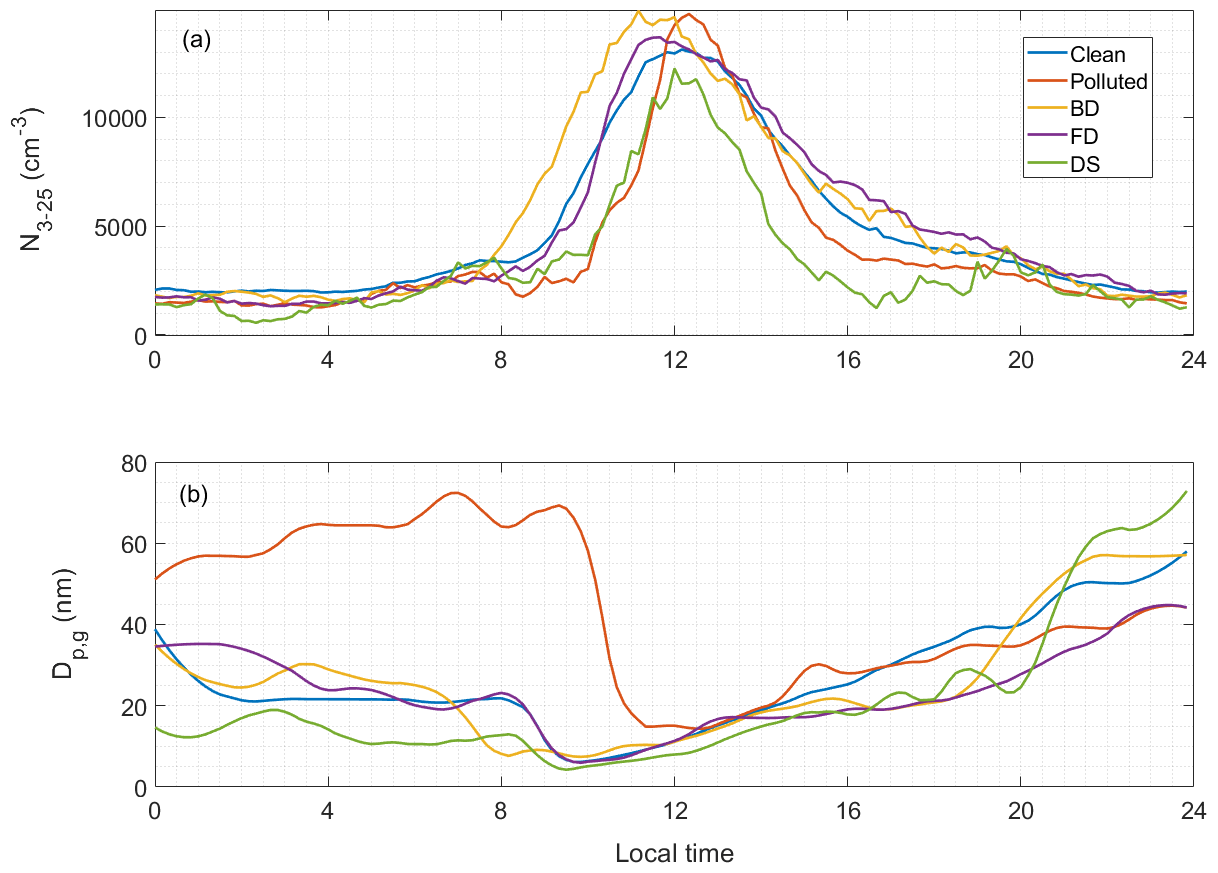
Figure 5Mean diurnal variation of the number concentration of particles in the size range of 3–25 nm (N3−25) (a) and geometric mean diameter (Dp,g) (b) of NPF events that occurred under clean and polluted conditions and were influenced by blowing dust (BD), floating dust (FD), and dust storms (DSs), respectively.
3.2 Case study of a dust-related NPF event
3.2.1 A severe dust storm case
A severe dust storm that originated from Mongolia and swept through northern China on 15 March 2021 resulted in an extremely high particle mass concentration and low visibility. Four typical air quality monitoring sites, including Guanyuan (GY), Wanshou Temple (WST), Dongsi (DS), and Chaoyang (CY), in urban Beijing were selected to help understand the evolution of PM2.5 and PM10 mass concentrations during the dust storm (Fig. 6). The maximum of hourly mean PM2.5 and PM10 mass concentrations exceeded 600 and 8000 µg m−3, respectively, at these selected sites, which demonstrated the magnitude of this dust storm. The reported PM10 mass concentration was the highest among the recent 20-year data in Beijing released by the CNEMC, as well as in northern China. The PM10 mass concentration was a magnitude higher than the value of PM2.5, during the dust-dominated period of 08:00–18:00 local time (LT), indicating the major contribution of dust particles with a size of above 2.5 µm. From the PNSD plot in Fig. 7, it was found that particles above 400 nm started to increase on 15 March at 08:00 LT, indicating the arrival of dust particles. In the following 2 h, the volume size distribution showed that concentration peaked in the size range of 8–10 µm. Based on the lognormal fitted parameters of the volume distribution, volume median mobility diameter (Dp,vol) was 8–10 µm during the initial stage (10:00–12:00 LT) of the dust storm and decreased to approximately 4–6 µm from 12:00 to 24:00 LT on 15 March. It was comparable with previously reported values for other dust storms across the globe, ranging from 3.0 to 6.5 µm (Reid et al., 2008; Maring, 2003; Peters, 2006).
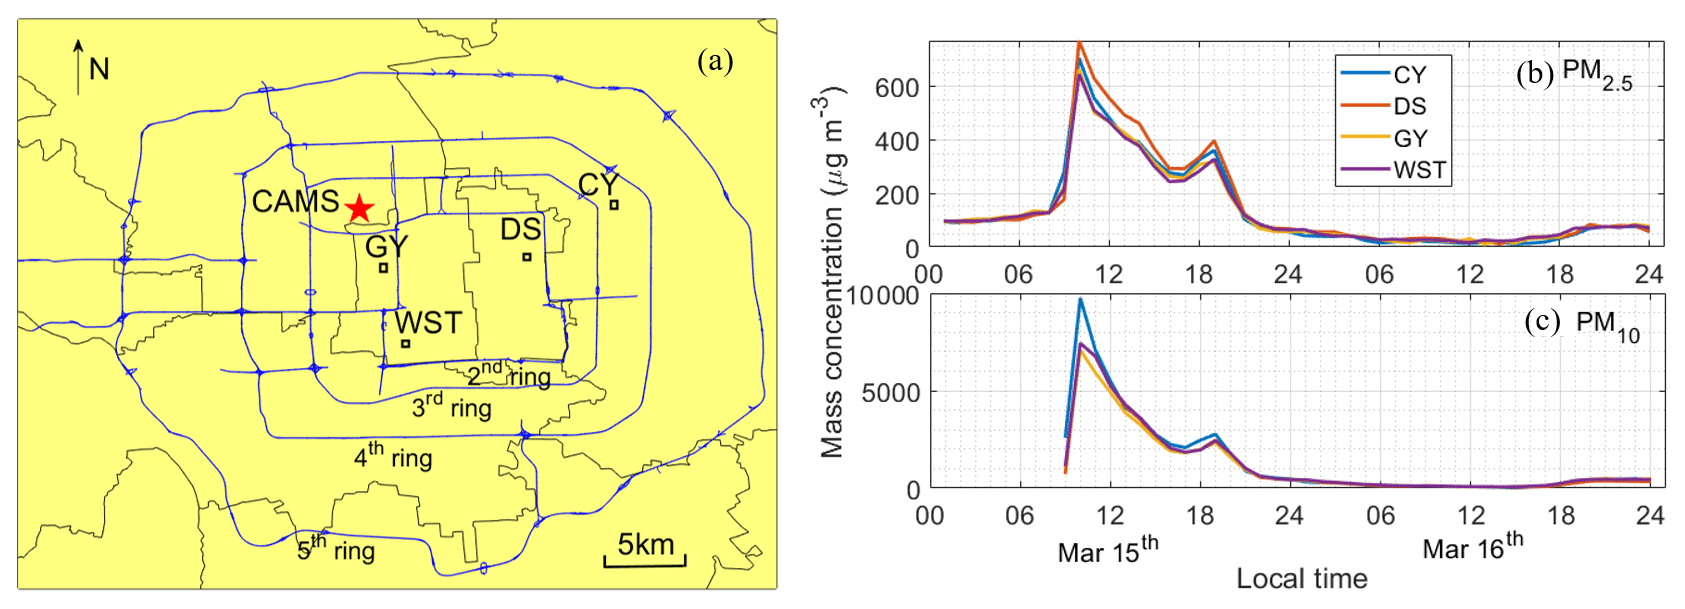
Figure 6The location map of the CAMS site and four air quality monitoring sites, including Guanyuan (GY), Wanshou Temple (WST), Dongsi (DS), and Chaoyang (CY), in urban Beijing (a), as well as the PM2.5 and PM10 mass concentration at each location (b).
The dust storm weakened in the late afternoon of 15 March, and NPF event occurred on the morning of 16 March. During the polluted conditions before the dust storm (14 March), fine particles (diameter <1 µm) dominated the particle number and mass concentration. However, coarse-mode particles contributed the most to the particle mass, volume, and surface concentration. In contrast to the NPF events occurring during the dust storm at Mt. Heng in South China (Nie et al., 2014), the NPF event on 16 March in this study occurred when dust particles vanished and there was a reduced CS. However, the NPF event was interrupted in the afternoon (∼ 16:00 LT), which was influenced by the backflow of dust, as indicated by the elevated volume concentration as shown in Fig. 7b. The concentrations of SO2 and O3 increased in the morning of 16 March, as shown in Fig. 8, indicating enhanced precursors and atmospheric oxidation capacity that favoured NPF.
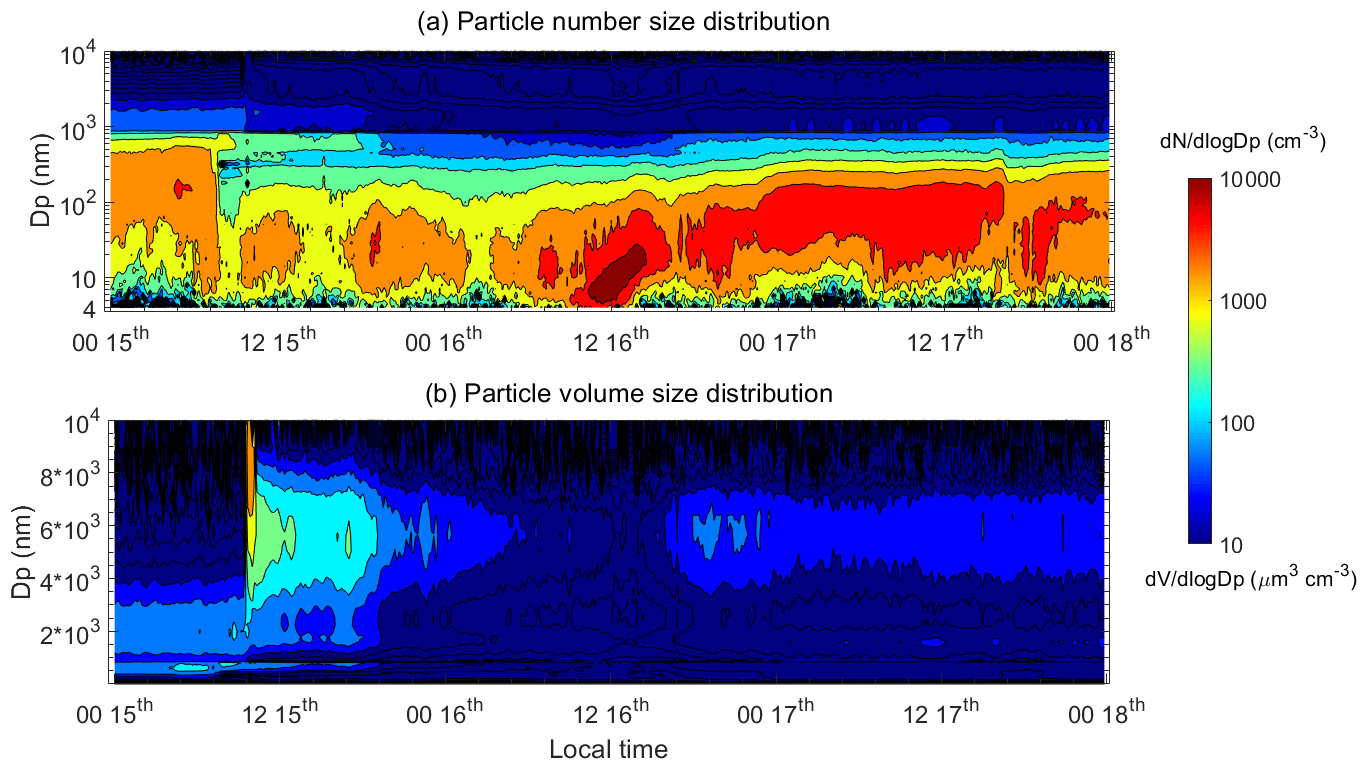
Figure 7Particle number (a) and volume (b) distributions on 14–17 March 2021 at the CAMS station.
3.2.2 Secondary aerosol formation during dust storms
The variation of NO2 sharply increased in the early morning (05:00–06:00 LT) on 15 March, which could be attributed to the downward mixing of NO2-rich air in the residual layer where NO2 was trapped during the pollution episode on 14 March (Fig. 8). The wind field distribution depending on the air pressure level based on the reanalysis meteorological data was analysed and given in Fig. S10 in the Supplement (https://cds.climate.copernicus.eu/, last access: 1 June 2023). It showed that the wind changed at 03:00 LT on 15 March, with the wind direction switching from upward to downward, which could bring the pollutants to the ground, resulting in the elevated NO2 and CS as given in Fig. 8. The concentration of SO2 remained stable before 06:00 LT, probably because its distribution was uniform in the boundary layer. When the dust particles arrived in Beijing at 08:00 LT on 15 March, the volume mixing ratio of NO2 and SO2 decreased immediately due to the strong dilution by wind. The volume mixing ratio of NO2 decreased, while that of O3 increased, indicating that the removal of NO2 was helpful for the elevated O3 concentration, as NOx titration photochemistry processes could influence the production and loss of O3 (Lu et al., 2010). It has been also reported that in the Beijing–Tianjin–Hebei region the decrease in NOx increased ozone and enhanced the atmospheric oxidizing capacity (Huang et al., 2021).
As shown in Fig. 8, the PM1 mass concentration derived from the AMS data showed high mass loading during the pollution episode (00:00–06:00 LT on 15 March), with a mean value of 83.2 µg m−3. Secondary inorganic aerosols were dominant, with nitrate being the major contributor, accounting for approximately 46 % of the total particles. During the dust storm and post-dust episode, PM1 sharply decreased to approximately 5.0 µg m−3, indicating a strong fine particle scavenging process by mineral dust. In contrast to the pollution episode, organics accounted for over 50 %, with a larger mass fraction of POA, approximately 40 %–60 % of the organics during dust and post-dust storm episodes. Under extremely clean conditions, secondary sulfate, nitrate, and ammonium (SNA) accounted for approximately 20 %, 10 %, and 15 %, respectively. The chemical composition of fine particles changed from the dominant role of nitrate during the pollution episode to the largest contributor of organics during the dust storm. However, the sulfate mass fraction during dust and post-dust episodes was higher than that during the pollution episode, indicating a higher formation process of secondary sulfate. In the previous studies in Beijing, it has been reported that the NR-PM1 derived from AMS could reach ∼ 200 µg m−3 during polluted episodes and decrease to several µg m−3 under clean conditions (Zhang et al., 2018). In this work, the PM1 mass concentration ranged from approximately 5.0 µg m−3 during dust and post-dust episodes to 83.2 µg m−3 during moderate polluted conditions before dust episodes. During the dust and post-dust episodes, organics was the dominant contributor to the chemical composition, which was consistent with the previous studies that organics could contribute 40 %–60 % to PM1 in Beijing (Y. Zhang et al., 2018, 2019). However, the mass fraction of nitrate and ammonium was larger during polluted conditions, which was consistent with a recent study in Beijing in January–February 2021 (Y. Zhang et al., 2023). From 05:00 LT on 15 March to 12:00 LT on 16 March, the northwesterly air mass and local wind direction did not change (Figs. S9 and S11 in the Supplement). The SO2 volume mixing ratio increased quickly when the dust storm faded (22:00 LT on 15 March), which was probably due to the weakened dilution process, as the wind speed decreased from 5.8 m s−1 during dust episode to below 3.0 m s−1 at 20:00 LT on 15 March. Another possibility was that dust particles could be a major SO2 sink (Usher et al., 2003). NO2 also decreased when the dust storm started; however, it did not increase significantly when the dust storm ended, which differed from the variation in SO2. However, heterogeneous reactions of mineral dust with SO2 and NO2 cannot be discussed further due to the lack of direct measurements of chemical information of coarse-mode particles.
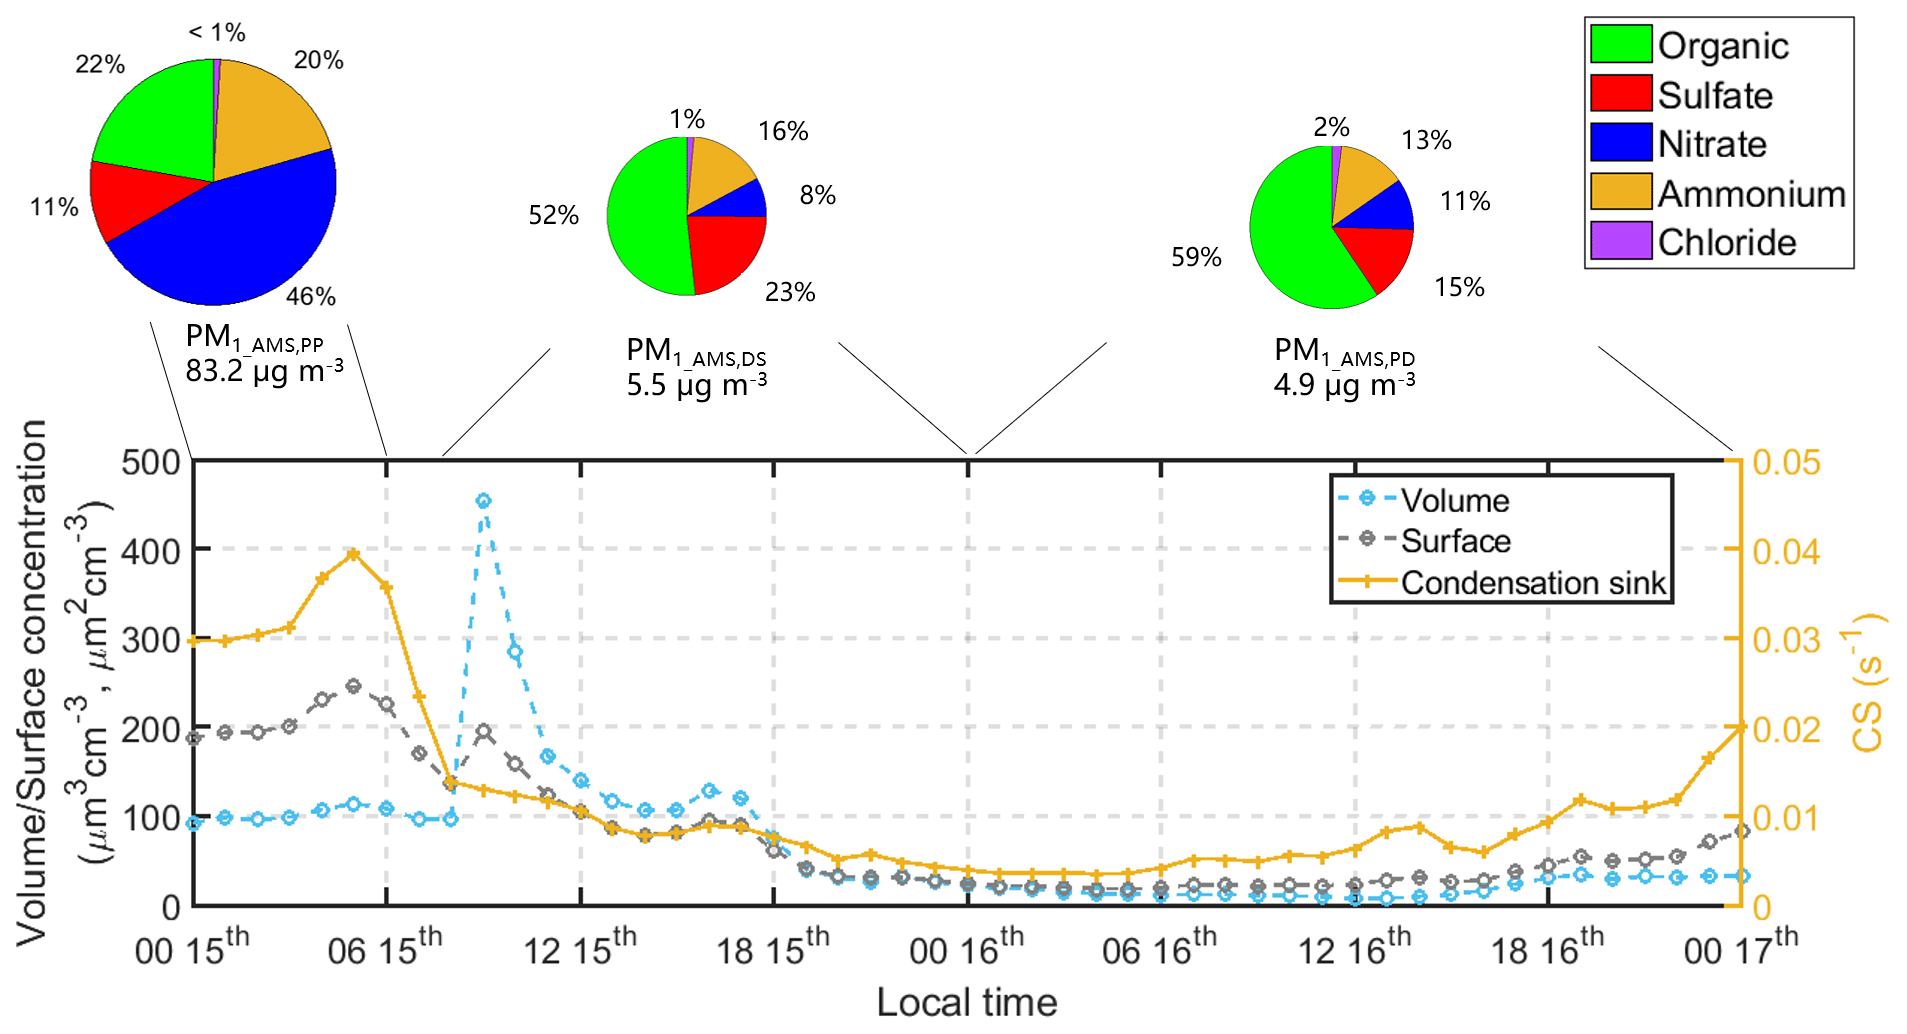
Figure 8Time series of PM10 volume, surface, and condensation sink from 15–17 March. Pollution period (PP), dust storm (DS), and post-dust (PD) are marked in the plot, and the PM1 mass concentration as well as each chemical composition (organic, sulfate, nitrate, ammonium, and chloride) mass fraction is also given for each period (a), and hourly time series of NO2, O3 and SO2 (b).
The oxidation ratios of SO2 (SOR) and NO2 (NOR) are shown in Fig. 9. It had been reported that the SOR was 0.18 in clean air conditions, whereas it was 0.27 under polluted conditions in Beijing in the 2016 wintertime, indicating that SO2 secondary transformation was a major pathway of sulfate production with a higher conversion efficiency under the polluted episode, whereas NOR was approximately 0.08 under both clean and polluted conditions (Wu et al., 2019). The SOR and NOR of PM1 showed a clear positive relationship with the sulfate and nitrate mass concentrations, respectively, during the heavy dust episode, as indicated by the volume mean diameter (Dp,vol) (Fig. 9). Although SOR and NOR were calculated based on the submicron particles and Dp,vol represented the dust particles, their correlations could reflect how the heterogeneous reactions were modified by the dust (Usher et al., 2003). SOR ranged from 0.2 to 0.9 during the dust storm, which was even higher than the value during the polluted episode: approximately 0.3. NOR showed a stronger positive relationship with nitrate mass concentration. However, the NOR was relatively low, with a value of 0.01–0.1, which was much lower than the value under polluted conditions, ranging from 0.3–0.5. This indicated that the dust particles promoted the secondary inorganic formation of submicron particles, particularly sulfate formation. Although the uptake and oxidation of NO2 and SO2 by mineral dust can be considerable, secondary aerosol formation in the submicron range is also important. As discussed above, it has been shown that O3 increases during a dust storm (Fig. 8), which indicates that the enhanced oxidation capability during the dust storm favours secondary inorganic aerosol formation by ozone oxidation. O3 can also promote the heterogeneous oxidation of other trace gases on mineral dust surfaces (Li et al., 2006; Wu et al., 2011). Although the secondary formation of sulfate and nitrate was enhanced during the dust event, the PM1 mass concentration, as well as each chemical component, decreased sharply owing to dilution by the strong wind during the dust storm.
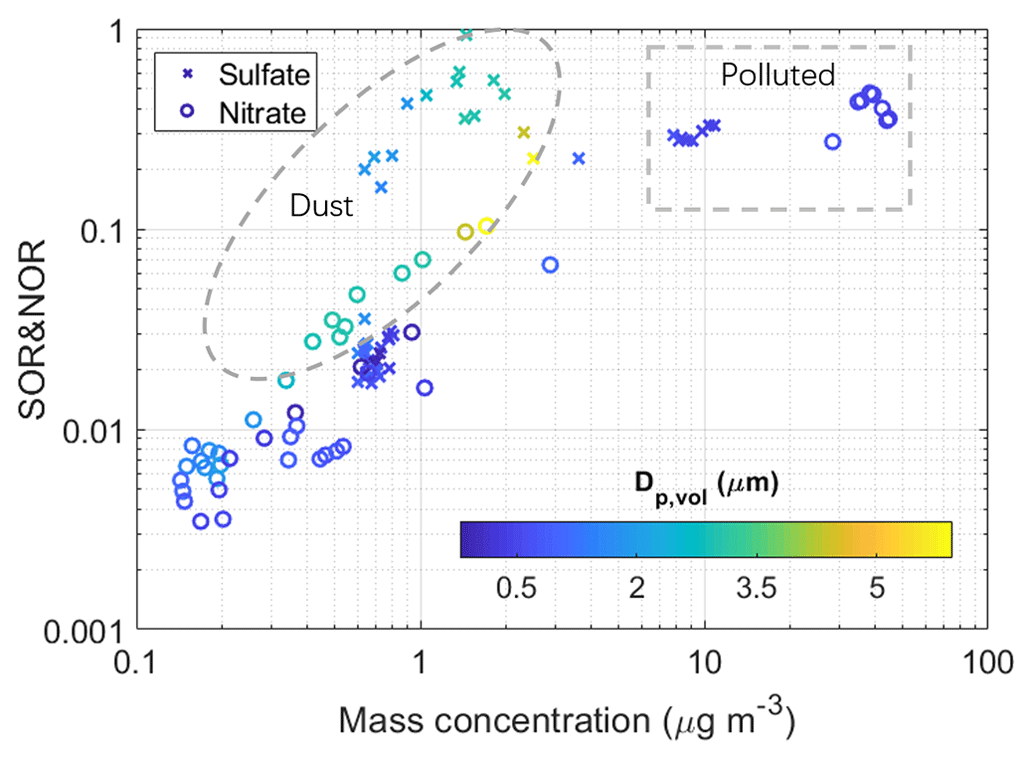
Figure 9Scatter plot of sulfate (cross) and nitrate (circle) mass concentrations on the x axis versus sulfur oxidation ratio (SOR) and nitrogen oxidation ratio (NOR) on the y axis, with different volume-weighted diameters (Dp,vol) indicated by the colour bar. Dust, post-dust, and polluted periods are marked by dashed lines, respectively.
3.2.3 Variations of particle hygroscopicity
Because RH was quite low during the dust storm, ranging from 10 %–20 %, the hygroscopic growth process of the particles in the ambient environment could be ignored. However, as discussed above, the chemical composition of PM1 derived from AMS changed significantly during the dust storm compared to the pollution episode. The calculated hygroscopic parameter, κ values, of 50 and 100 nm particles were significantly higher during the pollution episode than during the dust and post-dust storm (including NPF event) episodes (Fig. 10). κ of 50 nm ranged from 0.05 to 0.17, and 0.15 to 0.30 for 100 nm particles, which was consistent with the long-term study in Beijing as reported by S. Zhang et al. (2023) and Y. Wang et al. (2018). Although the chemical composition of ultrafine particles below 100 nm cannot be derived in this work, based on a recent study in Beijing, it has been revealed that organics dominate the mass concentration of particles below 100 nm, whereas the mass fraction of nitrate increases depending on the size (Li et al., 2023). For submicron particles in this study, the mass fraction of organic aerosols (OAs) with weak hygroscopicity accounted for approximately 20 % to PM1 during the polluted episode, whereas it increased to more than 50 % during the dust storm and post-dust storm episodes (Fig. 10c). Meanwhile, the fraction of hydrophobic POA increased during the dust storm and post-dust storm episodes (Fig. 10d), as strong wind diluted the pre-existing particles, and the anthropogenic emission contribution was less important during the severe dust storm. Although sulfate formation was enhanced during the dust storm, as discussed above, with the larger mass fraction during the dust and post-dust storm episodes, the smaller fraction of nitrate and higher fraction of OA resulted in weaker particle hygroscopicity during the dust and post-dust storm episodes. This indicates that dust storms can modify the chemical composition of submicron particles, which influences their hygroscopic behaviour and ability to be activated as CCN. During a post-dust episode, an NPF event occurred on 16 March, which produced a large quantity of nanoparticles as the potential CCN. The particle number concentration increased and the particle hygroscopicity decreased as compared with the polluted episode, and the variation of CCN concentration is evaluated further in the following discussion.
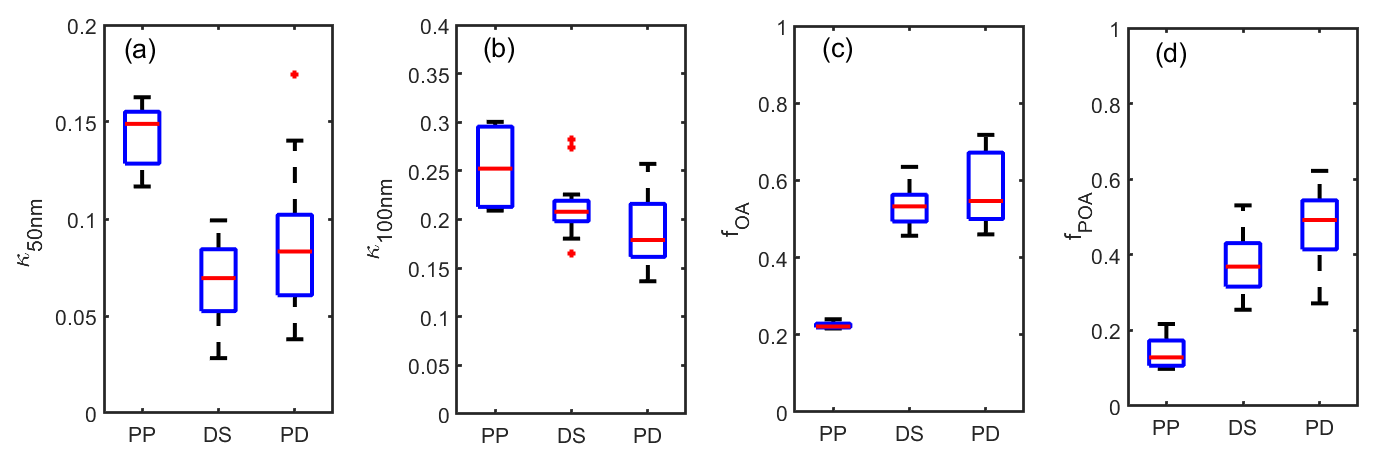
Figure 10Statistical boxplot of the hygroscopic parameter (κ) of 50 (a) and 100 nm (b) and the mass fraction of organic aerosol (OA), fOA (c) accounting for PM1, and mass fraction of primary OA accounting for the organics, fPOA (d) during the pollution (PP), dust (DS) and post-dust (PD) periods. The upper and lower boundaries of the box plots indicate the 75th and 25th percentiles, respectively; the line within the box marks the median; and the whiskers above and below the box indicate the 90th and 10th percentiles, respectively. Data points beyond the whiskers are displayed using a red cross.
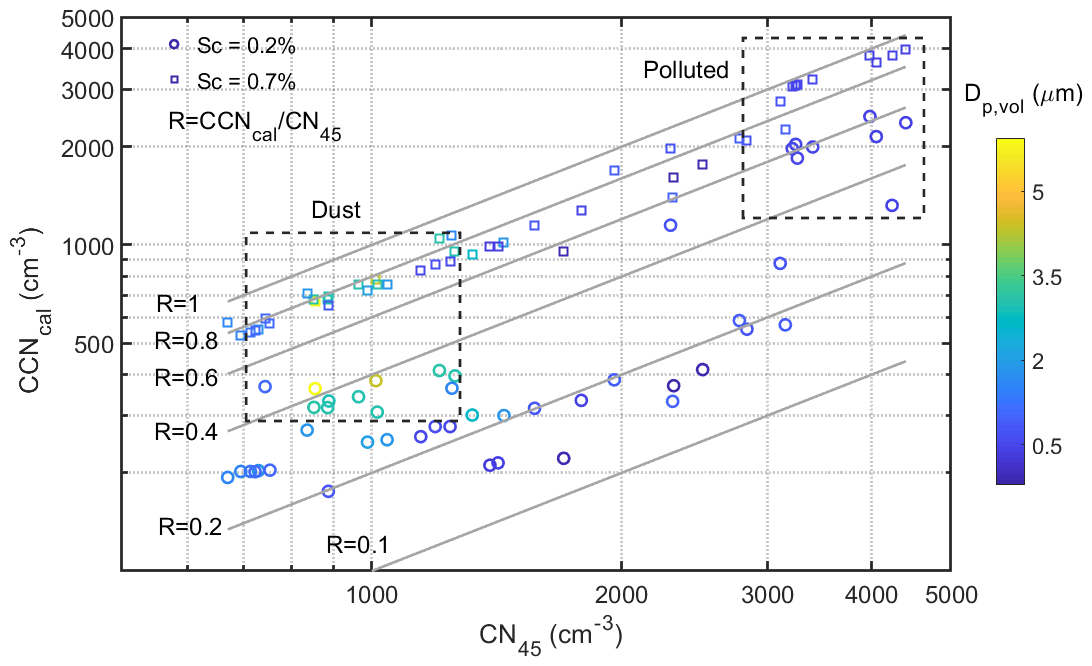
Figure 11Scatter plot of calculated cloud condensation nuclei (CCNcal) under different supersaturations (Sc = 0.2 % and 0.7 %) and number concentrations of diameter above 45 nm (CN45), with different volume weighted diameters (Dp,vol) indicated by the colours. The solid lines represent the different ratio values between CCNcal and CN45.
3.2.4 Impact on the cloud condensation nuclei by the dust storm
Assuming that κhtdma=κccn, Dp,crit can be calculated based on Eqs. (6) and (7) on 15 and 16 March, with a κ value of 100 nm dry particles at a low or moderate cloud supersaturation (Sc) of 0.2 % and a high Sc of 0.7 %. The Dp,crit ranged from 45 to 60 nm at Sc=0.7 %, with a mean value of 49 ± 2.5, 52 ± 2.0, and 53 ± 2.6 nm, during the polluted, dust, and post-dust storm episodes, respectively, which were 112 ± 5.5, 119 ± 6.5, and 123 ± 7.2 nm during the corresponding periods at Sc=0.2 %. Dp,crit increased during the dust storm and post-dust storm periods by approximately 6 % and 10 %, respectively, compared with the pollution episodes. As Dp,crit was larger than 45 nm, the number of particles larger than 45 nm (CN45) was calculated and referred to as the potential CCN. The concentration of particles with diameters larger than Dp,crit was calculated as the potential condensation nuclei (CCNcal). The scatter plot of CN45 and CCNcal under different conditions, indicated by the Dp,vol, as well as the activation ratio values (R) calculated by CCNcal dividing CN45, are shown in Fig. 11. It shows R values ranging from approximately 0.1 to 0.8 with Sc=0.2 %, with higher values during polluted episodes (∼ 0.8), lower values during the dust storm (0.2–0.4), and even values reaching 0.1–0.2 during the post-dust period. However, at high Sc=0.7 %, R values ranged from 0.6–1.0, and were close to 1.0, during the polluted episode and concentrated around 0.8 during the dust episode. Results showed that the CCN activation capability was significantly influenced by the dust storm at a low Sc, whereas the influence was minor at a high Sc, depending on Dp,crit. Although an NPF event occurred during the post-dust period on 16 March, CCN cal did not increase because of the elevated critical diameter. Although the backflow of floating dust particles did not result in the clear increase of PM2.5 and PM10 mass concentration given in Fig. 6b, c, they induced a higher CS (Fig. 8a), which was not favourable for the further growth of the nucleated particles.
Dusty days, including dust storms, blowing dust, and floating dust, have occurred frequently in the spring in recent years. We found that there were approximately 80 % of dusty days followed by an NPF event based on the PNSD measurement in Beijing in spring from 2017 to 2021. Owing to the scavenging effect of strong winds on pre-existing aerosols, the condensation sink remained at quite a low value of ∼ 0.005 s−1, which favoured the occurrence of NPF events after dust episodes. The NPF events were classified into cases following dust (dust-related NPF) and other NPF events occurring under clean and polluted conditions. Based on the PNSD derived on NPF days, it was found that the observed formation and growth rates were approximately 50 % of and 30 % lower than those of other NPF events, respectively.
The most severe mineral dust storm over the past 2 decades in China originated in Mongolia and swept through northern China on 15–16 March 2021, with the highest hourly mean PM10 reaching 8 mg m−3, as observed in urban Beijing. The processes of mineral dust and their impact were evaluated based on field measurements of aerosols and reactive gases in urban Beijing. During dust storms, the volume-weighted particle size peaks at approximately 4–6 µm or 8–10 µm. In particular, secondary sulfate aerosol formation was found to have a higher rate than that of the polluted condition before a dust episode. The hygroscopicity of ultrafine particles was weakened during the dust and post-dust storm episodes, as compared with the polluted condition, due to the elevated mass fraction of organics, especially the primary organic aerosols. Based on the κ–Köhler theory, the critical diameter of the particles activated as CCN was calculated for different supersaturations. They were approximately 49 nm and 112 nm in the polluted episode at Sc of 0.7 % and 0.2 %, respectively, which increased to 52 and 119 nm, respectively, during the dust storm, increasing by approximately 6 %. A new particle formation event occurred on 16 March, when the dust episode vanished; however, the contribution to the CCN concentration was minor. As a consequence of the uptake of precursor gases on mineral dust, the physical and chemical properties of submicron particles changed, thereby influencing their ability to act as CCN, especially at low supersaturation. The impact of this severe dust event observed in Beijing provided valuable information for evaluating the influence of dust, particularly the underlying impact of submicron particles and their ability to be activated as CCN. However, more work is needed to quantify the contribution of anthropogenic emissions to an NPF based on field experiments and modelling work in the future.
All data used in the study are available from the corresponding author upon request (shenxj@cma.gov.cn).
The supplement related to this article is available online at: https://doi.org/10.5194/acp-23-8241-2023-supplement.
XS planned the study, conducted the measurements, analysed the data, and wrote the original draft. YZ, QL, CZ, KG, JZ, SZ, WX, XH, JL, SL, JW, AY, and CX contributed to the measurements, instrument maintenance, data analysis, and results discussions. JS, HC, and XZ reviewed and finalized the article. XS and JS contributed to fund acquisition.
The contact author has declared that none of the authors has any competing interests.
Publisher's note: Copernicus Publications remains neutral with regard to jurisdictional claims in published maps and institutional affiliations.
This research was supported by the Innovation Team for Haze-fog Observation and Forecasts of MOST and CMA. The authors also acknowledge the editor and anonymous reviewers.
This research has been supported by the National Natural Science Foundation of China (grant nos. 42075082, 41825011, 42090031), the Basic Research Fund of CAMS (grant no. 2023Z012), and the S&T Development Fund of CAMS (grant no. 2020KJ001).
This paper was edited by Ari Laaksonen and reviewed by two anonymous referees.
Barron, P. A.: Calibration and use of the aerodynamic particle sizer (APS 3300), Aerosol Sci. Tech., 5, 55–67, 1996.
Bianchi, F., Trostl, J., Junninen, H., Frege, C., Henne, S., Hoyle, C. R., Molteni, U., Herrmann, E., Adamov, A., Bukowiecki, N., Chen, X., Duplissy, J., Gysel, M., Hutterli, M., Kangasluoma, J., Kontkanen, J., Kurten, A., Manninen, H. E., Munch, S., Perakyla, O., Petaja, T., Rondo, L., Williamson, C., Weingartner, E., Curtius, J., Worsnop, D. R., Kulmala, M., Dommen, J., and Baltensperger, U.: New particle formation in the free troposphere: A question of chemistry and timing, Science, 352, 1109–1112, https://doi.org/10.1126/science.aad5456, 2016.
Cai, R. and Jiang, J.: A new balance formula to estimate new particle formation rate: reevaluating the effect of coagulation scavenging, Atmos. Chem. Phys., 17, 12659–12675, https://doi.org/10.5194/acp-17-12659-2017, 2017.
Canagaratna, M. R., Jayne, J. T., Jimenez, J. L., Allan, J. D., Alfarra, M. R., Zhang, Q., Onasch, T. B., Drewnick, F., Coe, H., Middlebrook, A., Delia, A., Williams, L. R., Trimborn, A. M., Northway, M. J., DeCarlo, P. F., Kolb, C. E., Davidovits, P., and Worsnop, D. R.: Chemical and microphysical characterization of ambient aerosols with the aerodyne aerosol mass spectrometer, Mass Spectrom. Rev., 26, 185–222, https://doi.org/10.1002/mas.20115, 2007.
Canonaco, F., Crippa, M., Slowik, J. G., Baltensperger, U., and Prévôt, A. S. H.: SoFi, an IGOR-based interface for the efficient use of the generalized multilinear engine (ME-2) for the source apportionment: ME-2 application to aerosol mass spectrometer data, Atmos. Meas. Tech., 6, 3649–3661, https://doi.org/10.5194/amt-6-3649-2013, 2013.
Cheng, Y. S., Chen, B. T., and Yeh, H. C.: Behavior of isometric nonspherical aerosol-particles in the aerodynamic particle sizer, J. Aerosol Sci., 21: 701–710, 1990.
Chu, B., Kerminen, V.-M., Bianchi, F., Yan, C., Petäjä, T., and Kulmala, M.: Atmospheric new particle formation in China, Atmos. Chem. Phys., 19, 115–138, https://doi.org/10.5194/acp-19-115-2019, 2019.
Dada, L., Paasonen, P., Nieminen, T., Buenrostro Mazon, S., Kontkanen, J., Peräkylä, O., Lehtipalo, K., Hussein, T., Petäjä, T., Kerminen, V.-M., Bäck, J., and Kulmala, M.: Long-term analysis of clear-sky new particle formation events and nonevents in Hyytiälä, Atmos. Chem. Phys., 17, 6227–6241, https://doi.org/10.5194/acp-17-6227-2017, 2017.
Dal Maso, M., Kulmala, M., Riipinen, I., Wagner, R., Hussein, T., Aalto, P. P., and Lehtinen, K. E. J.: Formation and growth of fresh atmospheric aerosols: Eight years of aerosol size distribution data from SMEAR II, Hyytiälä, Finland, Boreal Envrion. Res., 10, 323–336, 2005.
DeMott, P. J., Prenni, A. J., Liu, X., Kreidenweis, S. M., Petters, M. D., Twohy, C. H., Richardson, M. S., Eidhammer, T., and Rogers, D. C.: Predicting global atmospheric ice nuclei distributions and their impacts on climate, P. Natl. Acad. Sci. USA, 107, 11217–11222, https://doi.org/10.1073/pnas.0910818107, 2010.
Drewnick, F., Hings, S. S., Decarlo, P., Jayne, J. T., Gonin, M., Fuhrer, K., Weimer, S., Jimenez, J. L., Demerjian, K. L., and Borrmann, S.: A New Time-of-Flight Aerosol Mass Spectrometer (TOF-AMS) – Instrument Description and First Field Deployment, Aerosol Sci. Tech., 39, 637–658, 2005.
Ge, M. F., Wu, L. Y., Tong, S. R., Liu, Q. F., and Wang, W. G.: Heterogeneous chemistry of trace atmospheric gases on atmospheric aerosols: An overview, Science Foundation in China, 23, 62–80, 2015.
Gordon, H., Kirkby, J., Baltensperger, U., Bianchi, F., Breitenlechner, M., Curtius, J., Dias, A., Dommen, J., Donahue, N. M., Dunne, E. M., Duplissy, J., Ehrhart, S., Flagan, R. C., Frege, C., Fuchs, C., Hansel, A., Hoyle, C. R., Kulmala, M., Kürten, A., Lehtipalo, K., Makhmutov, V., Molteni, U., Rissanen, M. P., Stozkhov, Y., Tröstl, J., Tsagkogeorgas, G., Wagner, R., Williamson, C., Wimmer, D., Winkler, P. M., Yan, C., and Carslaw, K. S.: Causes and importance of new particle formation in the present-day and preindustrial atmospheres, J. Geophys. Res.-Atmos., 122, 8739–8760, https://doi.org/10.1002/2017jd026844, 2017.
Gui, K., Yao, W., Che, H., An, L., Zheng, Y., Li, L., Zhao, H., Zhang, L., Zhong, J., Wang, Y., and Zhang, X.: Record-breaking dust loading during two mega dust storm events over northern China in March 2021: aerosol optical and radiative properties and meteorological drivers, Atmos. Chem. Phys., 22, 7905–7932, https://doi.org/10.5194/acp-22-7905-2022, 2022.
Gysel, M., McFiggans, G. B., and Coe, H.: Inversion of tandem differential mobility analyser (TDMA) measurements, J. Aerosol. Sci., 40, 134–151, 2009.
Hinds, W. C.: Aerosol technology: Properties, behavior, and measurement of airborne particles, 2nd Edn., John Wiley & Sons, Inc., 1999.
Huang, X., Ding, A., Gao, J., Zheng, B., Zhou, D., Qi, X., Tang, R., Wang, J., Ren, C., Nie, W., Chi, X., Xu, Z., Chen, L., Li, Y., Che, F., Pang, N., Wang, H., Tong, D., Qin, W., Cheng, W., Liu, W., Fu, Q., Liu, B., Chai, F., Davis, S. J., Zhang, Q., and He, K.: Enhanced secondary pollution offset reduction of primary emissions during COVID-19 lockdown in China, National Sci. Rev., 8, nwaa137, https://doi.org/10.1093/nsr/nwaa137, 2021.
Hussein, T., Hameri, K., Aalto, P., Paatero, P., and Kulmala, M.: Modal structure and spatial temporal variations of urban and suburban aerosols in Helsinki Finland, Atmos. Environ., 39, 1655–1668, https://doi.org/10.1016/j.atmosenv.2004.11.031, 2005.
Jokinen, T., Sipilä, M., Kontkanen, J., Vakkari, V., Tisler, P., Duplissy, E.-M., Junninen, H., Kangasluoma, J., Manninen, H. E., Petäjä, T., Kulmala, M., Worsnop, D. R., Kirkby, J., Virkkula, A., and Kerminen, V.-M.: Ion-induced sulfuric acid–ammonia nucleation drives particle formation in coastal Antarctica, Sci. Adv., 4, 11, https://doi.org/10.1126/sciadv.aat9744, 2018.
Kerminen, V.-M., Chen, X., Vakkari, V., Petäjä, T., Kulmala, M., and Bianchi, F.: Atmospheric new particle formation and growth: review of field observations, Environ. Res.Lett., 13, 103003, https://doi.org/10.1088/1748-9326/aadf3c, 2018.
Kulmala, M., Vehkamäki, H., Petäjä, T., Dal Maso, M., Lauri, A., Kerminen, V. M., Birmili, W., and McMurry, P. H.: Formation and growth rates of ultrafine atmospheric particles: a review of observations, J. Aerosol Sci., 35, 143–176, https://doi.org/10.1016/j.jaerosci.2003.10.003, 2004.
Kulmala, M., Petäjä, T., Nieminen, T., Sipilä, M., Manninen, H. E., Lehtipalo, K., Dal Maso, M., Aalto, P. P., Junninen, H., Paasonen, P., Riipinen, I., Lehtinen, K. E. J., Laaksonen, A., and Kerminen, V.-M.: Measurement of the nucleation of atmospheric aerosol particles, Nature Protocols, 7, 1651–1667, https://doi.org/10.1038/nprot.2012.091, 2012.
Kulmala, M., Kerminen, V. M., Petaja, T., Ding, A. J., and Wang, L.: Atmospheric gas-to-particle conversion: why NPF events are observed in megacities?, Faraday Discuss., 200, 271–288, https://doi.org/10.1039/c6fd00257a, 2017.
Kulmala, M., Cai, R., Stolzenburgb, D., Zhoua, Y., Dada, L., Guo, Y., Yan, C., Petäjä, T., Jiang, J., and Kerminen, V.-M.: The contribution of new particle formation and subsequent growth to haze formation, Environ. Sci. Atmos., 2, 352–361,https://doi.org/10.1039/D1EA00096A, 2022.
Le, T., Wang, Y., Liu, L., Yang, J., Yung, Y. L., Li, G. and Seinfeld, J. H.: Unexpected air pollution with marked emission reductions during the COVID-19 outbreak in China, Science, 369, 702–706, https://doi.org/10.1126/science.abb7431, 2020.
Li, J., Shang, J., and Zhu, T.: Heterogeneous reactions of SO2 on ZnO particle surfaces, Sci. China Chem., 54, 161–166, https://doi.org/10.1007/s11426-010-4167-9, 2011.
Li, L., Chen, Z. M., Zhang, Y. H., Zhu, T., Li, J. L., and Ding, J.: Kinetics and mechanism of heterogeneous oxidation of sulfur dioxide by ozone on surface of calcium carbonate, Atmos. Chem. Phys., 6, 2453–2464, https://doi.org/10.5194/acp-6-2453-2006, 2006.
Li, X., Chen, Y., Li, Y., Cai, R., Li, Y., Deng, C., Yan, C., Cheng, H., Liu, Y., Kulmala, M., Hao, J., Smith, J. N., and Jiang, J.: Seasonal variations in composition and sources of atmospheric ultrafine particles in urban Beijing based on near-continuous measurements, EGUsphere [preprint], https://doi.org/10.5194/egusphere-2023-809, 2023.
Liao, H. and Seinfeld, J. H.: Radiative forcing by mineral dust aerosols: Sensitivity to key variables, J. Geophys. Res.-Atmos., 103, 31637–31645, https://doi.org/10.1029/1998jd200036, 1998.
Lin, W., Xu, X., Ge, B., and Zhang, X.: Characteristics of gaseous pollutants at Gucheng, a rural site southwest of Beijing, J. Geophy. Res., 114, D00G14, https://doi.org/10.1029/2008jd010339, 2009.
Lin, W., Xu, X., Ge, B., and Liu, X.: Gaseous pollutants in Beijing urban area during the heating period 2007–2008: variability, sources, meteorological, and chemical impacts, Atmos. Chem. Phys., 11, 8157–8170, https://doi.org/10.5194/acp-11-8157-2011, 2011.
Liu, C., Chu, B. W., Liu, Y. C., Ma, Q. X., Ma, J. Z., He, H., Li, J. H., and Hao, J. M.: Effect of mineral dust on secondary organic aerosol yield and aerosol size in α-pinene/NOx photo-oxidation, Atmos. Environ., 77, 781–789, https://doi.org/10.1016/j.atmosenv.2013.05.064, 2013.
Liu, L., Huang, X., Ding, A., and Fu, C.: Dust-induced radiative feedbacks in north China: A dust storm episode modeling study using WRF-Chem, Atmos. Environ., 129, 43–54, https://doi.org/10.1016/j.atmosenv.2016.01.019, 2016.
Lu, K., Zhang, Y., Su, H., Brauers, T., Chou, C. C., Hofzumahaus, A., Liu, S. C., Kita, K., Kondo, Y., Shao, M., Wahner, A., Wang, J., Wang, X., and Zhu, T.: Oxidant (O3 + NO2) production processes and formation regimes in Beijing, J. Geophys. Res., 115, D07303, https://doi.org/10.1029/2009JD012714, 2010.
Lu, Y., Yan, C., Fu, Y., Chen, Y., Liu, Y., Yang, G., Wang, Y., Bianchi, F., Chu, B., Zhou, Y., Yin, R., Baalbaki, R., Garmash, O., Deng, C., Wang, W., Liu, Y., Petäjä, T., Kerminen, V.-M., Jiang, J., Kulmala, M., and Wang, L.: A proxy for atmospheric daytime gaseous sulfuric acid concentration in urban Beijing, Atmos. Chem. Phys., 19, 1971–1983, https://doi.org/10.5194/acp-19-1971-2019, 2019.
Ma, Q., Wang, T., Liu, C., He, H., Wang, Z., Wang, W., and Liang, Y.: SO2 Initiates the Efficient Conversion of NO2 to HONO on MgO Surface, Environ. Sci. Technol., 51, 3767–3775, https://doi.org/10.1021/acs.est.6b05724, 2017.
Manktelow, P. T., Carslaw, K. S., Mann, G. W., and Spracklen, D. V.: The impact of dust on sulfate aerosol, CN and CCN during an East Asian dust storm, Atmos. Chem. Phys., 10, 365–382, https://doi.org/10.5194/acp-10-365-2010, 2010.
Maring, H., Savoie, D. L., Izaguirre, M. A., Custals, L., and Reid, J. S.: Mineral dust aerosol size distribution change during atmospheric transport, J. Geophys. Res., 108, 8592, https://doi.org/10.1029/2002JD002536, 2003.
Maßling, A., Wiedensohler, A., Busch, B., Neusüß, C., Quinn, P., Bates, T., and Covert, D.: Hygroscopic properties of different aerosol types over the Atlantic and Indian Oceans, Atmos. Chem. Phys., 3, 1377–1397, https://doi.org/10.5194/acp-3-1377-2003, 2003.
Middlebrook, A. M., Bahreini, R., Jimenez, J. L., and Canagaratna, M. R.: Evaluation of Composition-Dependent Collection Efficiencies for the Aerodyne Aerosol Mass Spectrometer using Field Data, Aerosol Sci. Tech., 46, 258–271, https://doi.org/10.1080/02786826.2011.620041, 2012.
Mori, I.: Change in size distribution and chemical composition of kosa (Asian dust) aerosol during long-range transport, Atmos. Environ., 37, 4253–4263, https://doi.org/10.1016/s1352-2310(03)00535-1, 2003.
National Weather Bureau of China: Criterion of Surface Meteorological Observation, Beijing, Meteorological Press, 1979.
Nie, W., Ding, A., Wang, T., Kerminen, V. M., George, C., Xue, L., Wang, W., Zhang, Q., Petaja, T., Qi, X., Gao, X., Wang, X., Yang, X., Fu, C., and Kulmala, M.: Polluted dust promotes new particle formation and growth, Sci. Rep., 4, 6634, https://doi.org/10.1038/srep06634, 2014.
Perry, K. D., Cliff, S. S., and Jimenez-Cruz, M. P.: Evidence for hygroscopic mineral dust particles from the Intercontinental Transport and Chemical Transformation Experiment, J. Geophys. Res.-Atmos., 109, D23S28, https://doi.org/10.1029/2004jd004979, 2004.
Petters, M. D. and Kreidenweis, S. M.: A single parameter representation of hygroscopic growth and cloud condensation nucleus activity, Atmos. Chem. Phys., 7, 1961–1971, https://doi.org/10.5194/acp-7-1961-2007, 2007.
Reid, J. S.: Comparison of size and morphological measurements of coarse mode dust particles from Africa, J. Geophys. Res., 108, 8593, https://doi.org/10.1029/2002jd002485, 2003.
Reid, J. S., Reid, E. A., Walker, A., Piketh, S., Cliff, S., Al Mandoos, A., Tsay, S.-C., and Eck, T. F.: Dynamics of southwest Asian dust particle size characteristics with implications for global dust research, J. Geophys. Res., 113, D14212, https://doi.org/10.1029/2007jd009752, 2008.
Shang, D., Tang, L., Fang, X., Wang, L., Yang, S., Wu, Z., Chen, S., Li, X., Zeng, L., Guo, S., and Hu, M.: Variations in source contributions of particle number concentration under long-term emission control in winter of urban Beijing, Environ. Pollut., 304, 119072, https://doi.org/10.1016/j.envpol.2022.119072, 2022.
Seinfeld, J. and Pandis, S.: Atmospheric Chemistry and Physics: From Air Pollution to Climate Change, Hoboken, New Jersey, John Wiley & Son, Inc, ISBN 9780471720188, 1998.
Shen, X., Sun, J., Kivekäs, N., Kristensson, A., Zhang, X., Zhang, Y., Zhang, L., Fan, R., Qi, X., Ma, Q., and Zhou, H.: Spatial distribution and occurrence probability of regional new particle formation events in eastern China, Atmos. Chem. Phys., 18, 587–599, https://doi.org/10.5194/acp-18-587-2018, 2018.
Shen, X., Sun, J., Yu, F., Wang, Y., Zhong, J., Zhang, Y., Hu, X., Xia, C., Zhang, S., and Zhang, X.: Enhancement of nanoparticle formation and growth during the COVID-19 lockdown period in urban Beijing, Atmos. Chem. Phys., 21, 7039–7052, https://doi.org/10.5194/acp-21-7039-2021, 2021.
Shen, X., Sun, J., Ma, Q., Zhang, Y., Zhong, J., Yue, Y., Xia, C., Hu, X., Zhang, S., and Zhang, X.: Long-term trend of new particle formation events in the Yangtze River Delta, China and its influencing factors: 7-year dataset analysis, Sci. Total Environ., 807, 150783, https://doi.org/10.1016/j.scitotenv.2021.150783, 2022.
Shen, X. J., Sun, J. Y., Zhang, Y. M., Wehner, B., Nowak, A., Tuch, T., Zhang, X. C., Wang, T. T., Zhou, H. G., Zhang, X. L., Dong, F., Birmili, W., and Wiedensohler, A.: First long-term study of particle number size distributions and new particle formation events of regional aerosol in the North China Plain, Atmos. Chem. Phys., 11, 1565–1580, https://doi.org/10.5194/acp-11-1565-2011, 2011.
Shen, X. J., Sun, J. Y., Zhang, X. Y., Zhang, Y. M., Zhong, J. T., Wang, X., Wang, Y. Q., and Xia, C.: Variations in submicron aerosol liquid water content and the contribution of chemical components during heavy aerosol pollution episodes in winter in Beijing, Sci. Total Environ., 693, 133521, https://doi.org/10.1016/j.scitotenv.2019.07.327, 2019.
Tang, M., Huang, X., Lu, K., Ge, M., Li, Y., Cheng, P., Zhu, T., Ding, A., Zhang, Y., Gligorovski, S., Song, W., Ding, X., Bi, X., and Wang, X.: Heterogeneous reactions of mineral dust aerosol: implications for tropospheric oxidation capacity, Atmos. Chem. Phys., 17, 11727–11777, https://doi.org/10.5194/acp-17-11727-2017, 2017.
Twohy, C. H., Kreidenweis, S. M., Eidhammer, T., Browell, E. V., Heymsfield, A. J., Bansemer, A. R., Anderson, B. E., Chen, G., Ismail, S., DeMott, P. J., and Van Den Heever, S. C.: Saharan dust particles nucleate droplets in eastern Atlantic clouds, Geophys. Res. Lett., 36, L01807, https://doi.org/10.1029/2008gl035846, 2009.
Ulbrich, I. M., Canagaratna, M. R., Zhang, Q., Worsnop, D. R., and Jimenez, J. L.: Interpretation of organic components from Positive Matrix Factorization of aerosol mass spectrometric data, Atmos. Chem. Phys., 9, 2891–2918, https://doi.org/10.5194/acp-9-2891-2009, 2009.
Usher, C. R., Michel, A. E., and Grassian, V. H.: Reactions on Mineral Dust, Chem. Rev., 103, 4883–4939, 2003.
Wang, S., Wang, J., Zhou, Z., and Shang, K.: Regional characteristics of three kinds of dust storm events in China, Atmos, Environ,, 3, 509–520, https://doi.org/10.1016/j.atmosenv.2004.09.033, 2005.
Wang, X., Shen, X. J., Sun, J. Y., Zhang, X. Y., Wang, Y. Q., Zhang, Y. M., Wang, P., Xia, C., Qi, X. F., and Zhong, J. T.: Size-resolved hygroscopic behavior of atmospheric aerosols during heavy aerosol pollution episodes in Beijing in December 2016, Atmos. Environ., 194, 188–197, https://doi.org/10.1016/j.atmosenv.2018.09.041, 2018.
Wang, Y., Wu, Z., Ma, N., Wu, Y., Zeng, L., Zhao, C. and Wiedensohler, A.: Statistical analysis and parameterization of the hygroscopic growth of the sub-micrometer urban background aerosol in Beijing, Atmos. Environ., 175, 184–191, https://doi.org/10.1016/j.atmosenv.2017.12.003, 2018.
Wang, Z., Liu, C., Hu, Q., Dong, Y., Liu, H., Xing, C., and Tan, W.: Quantify the Contribution of Dust and Anthropogenic Sources to Aerosols in North China by Lidar and Validated with CALIPSO, Remote Sens., 13, 1811, https://doi.org/10.3390/rs13091811, 2021.
Wang, Z. B., Hu, M., Sun, J. Y., Wu, Z. J., Yue, D. L., Shen, X. J., Zhang, Y. M., Pei, X. Y., Cheng, Y. F., and Wiedensohler, A.: Characteristics of regional new particle formation in urban and regional background environments in the North China Plain, Atmos. Chem. Phys., 13, 12495–12506, https://doi.org/10.5194/acp-13-12495-2013, 2013.
Wu, L., Sun, J., Zhang, X., Zhang, Y., Wang, Y., Zhong, J., and Yang, Y.: Aqueous-phase reactions occurred in the PM2.5 cumulative explosive growth during the heavy pollution episode (HPE) in 2016 Beijing wintertime, Tellus B, 71, 1620079, https://doi.org/10.1080/16000889.2019.1620079, 2019.
Wu, L., Wang, Y., Li, L., and Zhang, G.: Acidity and inorganic ion formation in PM2.5 based on continuous online observations in a South China megacity, Atmos. Pollut. Res., 11, 1339–1350, https://doi.org/10.1016/j.apr.2020.05.003, 2020.
Wu, L. Y., Tong, S. R., Wang, W. G., and Ge, M. F.: Effects of temperature on the heterogeneous oxidation of sulfur dioxide by ozone on calcium carbonate, Atmos. Chem. Phys., 11, 6593–6605, https://doi.org/10.5194/acp-11-6593-2011, 2011.
Wu, Z., Hu, M., Liu, S., Wehner, B., Bauer, S., Ma ßling, A., Wiedensohler, A., Petäjä, T., Dal Maso, M., and Kulmala, M.: New particle formation in Beijing, China: Statistical analysis of a 1-year data set, J. Geophys. Res., 112, D09209, https://doi.org/10.1029/2006jd007406, 2007.
Xu, W., Kuang, Y., Liang, L., He, Y., Cheng, H., Bian, Y., Tao, J., Zhang, G., Zhao, P., Ma, N., Zhao, H., Zhou, G., Su, H., Cheng, Y., Xu, X., Shao, M., and Sun, Y.: Dust-Dominated Coarse Particles as a Medium for Rapid Secondary Organic and Inorganic Aerosol Formation in Highly Polluted Air, Environ. Sci. Technol., 54, 15710–15721, https://doi.org/10.1021/acs.est.0c07243, 2020.
Yu, F. and Luo, G.: Simulation of particle size distribution with a global aerosol model: contribution of nucleation to aerosol and CCN number concentrations, Atmos. Chem. Phys., 9, 7691–7710, https://doi.org/10.5194/acp-9-7691-2009, 2009.
Zhang, Q., Zheng, Y., Tong, D., Shao, M., Wang, S., Zhang, Y., Xu, X., Wang, J., He, H., Liu, W., Ding, Y., Lei, Y., Li, J., Wang, Z., Zhang, X., Wang, Y., Cheng, J., Liu, Y., Shi, Q., Yan, L., Geng, G., Hong, C., Li, M., Liu, F., Zheng, B., Cao, J., Ding, A., Gao, J., Fu, Q., Huo, J., Liu, B., Liu, Z., Yang, F., He, K., and Hao, J.: Drivers of improved PM2.5 air quality in China from 2013 to 2017, P. Natl. Acad. Sci. USA, 116, 24463–24469, https://doi.org/10.1073/pnas.1907956116, 2019.
Zhang, S., Shen, X., Sun, J., Che, H., Zhang, Y., Liu, Q., Xia, C., Hu, X., Zhong, J., Wang, J., Liu, S., Lu, J., Yu, A., and Zhang, X.: Seasonal variation of particle hygroscopicity and its impact on cloud-condensation nucleus activation in the Beijing urban area, Atmos. Environ., 302, 119728, https://doi.org/10.1016/j.atmosenv.2023.119728, 2023.
Zhang, Y., Wang, Y., Zhang, X., Shen, X., Sun, J., Wu, L., Zhang, Z., and Che, H.: Chemical Components, Variation, and Source Identification of PM1 during the Heavy Air Pollution Episodes in Beijing in December 2016, J. Meteorol. Res., 32, 1–13, https://doi.org/10.1007/s13351-018-7051-8, 2018.
Zhang, Y., Vu, T. V., Sun, J., He, J., Shen, X., Lin, W., Zhang, X., Zhong, J., Gao, W., Wang, Y., Fu, T. M., Ma, Y., Li, W., and Shi, Z.: Significant Changes in Chemistry of Fine Particles in Wintertime Beijing from 2007 to 2017: Impact of Clean Air Actions, Environ. Sci. Technol., 54, 1344–1352, https://doi.org/10.1021/acs.est.9b04678, 2019.
Zhang, Y., Zhang, X., Zhong, J., Sun, J., Shen, X., Zhang, Z., Xu, W., Wang, Y., Liang, L., Liu, Y., Hu, X., He, M., Pang, Y., Zhao, H., Ren, S., and Shi, Z.: On the fossil and non-fossil fuel sources of carbonaceous aerosol with radiocarbon and AMS-PMF methods during winter hazy days in a rural area of North China plain, Environ. Res., 208, 112672, https://doi.org/10.1016/j.envres.2021.112672, 2022.
Zhang, Y., Tian, J., Wang, Q., Qi, L., Manousakas, M. I., Han, Y., Ran, W., Sun, Y., Liu, H., Zhang, R., Wu, Y., Cui, T., Daellenbach, K. R., Slowik, J. G., Prévôt, A. S. H., and Cao, J.: High-time-resolution chemical composition and source apportionment of PM2.5 in northern Chinese cities: implications for policy, EGUsphere [preprint], https://doi.org/10.5194/egusphere-2023-457, 2023.