the Creative Commons Attribution 4.0 License.
the Creative Commons Attribution 4.0 License.
 | 24 Jul 2023
A comprehensive reappraisal of long-term aerosol characteristics, trends, and variability in Asia
Shikuan Jin
Yingying Ma
Zhongwei Huang
Jianping Huang
Wei Gong
Boming Liu
Weiyan Wang
Ruonan Fan
Hui Li
Changes in aerosol loadings and properties are important for the understanding of atmospheric environment and climate change. This study investigates the characteristics and long-term trends of aerosols of different sizes and types in Asia from 2000 to 2020 by considering multi-source aerosol data and novel analysis methods and perspectives, all of which provides the groundwork for promoting the acquisition of new discoveries that are different from the past. The geometric mean aggregation method is applied, and serial autocorrelation is considered to avoid the overestimation of trend significance. Among regions in Asia, high values of aerosol optical depth (AOD) are mainly concentrated in East Asia (EA) and South Asia (SA) and are closely related to the population density. The AOD in EA showed the most significant negative trend, with a value of per year, mainly owing to decreases in organic carbon (OC), black carbon (BC), and dust aerosols. It is also worth noting that this observed large-scale decrease in OC and BC is a unique and significant phenomenon to region of EA and mainly around China. In contrast, the aerosol concentrations in SA generally show a positive trend, with an increased value of AOD of 1.25 × 10⁻³ per year. This increase is mainly due to large emissions of fine-mode aerosols, such as OC and sulfate aerosol. Additionally, the high aerosol loading in northern SA has a lower AOD variability when compared with that of East China Plain, revealing a relatively more persistent air pollution situation. Over the whole region of Asia, the characteristics of the percentage changes in different types of AOD are seen in the increases in BC (6.23 %) and OC (17.09 %) AOD, together with a decrease in dust (−5.51 %), sulfate (−3.07 %), and sea salt (−9.80 %) AOD. Except for anthropogenic emissions, the large increase in the percentage of OC is also due to wildfires found in northern Asia in the summer, whereas the differently sized AOD only shows slight changes in Asia in that small-sized AOD decreases (−3.34 %) and that the total AOD did not show a significant change. This suggests that, from a trend perspective, decreases in aerosol in recent years have mostly been offsetting earlier increases in the anthropogenic emissions over Asia. To summarize, the above findings analyse the comprehensive characteristics of aerosol distributions and reappraise the long-term trends of different aerosol parameters, which will greatly enhance the understanding of regional and global aerosol environment and climatology, in addition to filling the gaps and breaking through the limitations of past knowledge.
- Article
(17111 KB) - Full-text XML
-
Supplement
(821 KB) - BibTeX
- EndNote


Aerosols are small solid and liquid particles suspended in the atmosphere, originating both from anthropogenic and natural activities. As one of the critical components of the atmosphere, the increase in anthropogenic aerosol emissions can pose a threat to the ecological environment and public health (Tie et al., 2009; Lelieveld et al., 2015). Furthermore, they also influence the Earth's energy balance, not only by scattering and absorbing extraterrestrial solar radiation but also by changing cloud microphysical characteristics, such as the number and radius of cloud droplets in the form of cloud condensation nuclei (Nakajima et al., 2007; Eck et al., 2010; Rosenfeld et al., 2019). Because of the complex properties and uneven distributions caused by physical and chemical processes in the atmosphere, aerosol particles can vary over time. Therefore, it is necessary to understand the aerosol spatial distribution and temporal evolution and thus supply effective approaches and data for comprehending the atmospheric environment and global climate change (Kaufman et al., 2005; Solomon, 2007; Mallet et al., 2013; Liu et al., 2023).
Asia is the focus of many aerosol studies because it is a large continent with more than half of the world's population (Fig. 1). In the context of rapid economic development in this area, increases in anthropogenic aerosol emissions caused by human activities have had a severe impact on the ecological environment. For example, organic aerosol originating from crop burning and coal combustion was reported to have a large component in total aerosol and poses a threat to human health in northern India and the Southeast Asian Archipelago (Singh et al., 2017; Reddington et al., 2014). The increases in aerosol particles and unfavourable weather conditions were summarized as being the reasons for the continued regional haze in the North China Plain in China (Liu et al., 2013; Che et al., 2014; Huang et al., 2020). Except for the impact on air quality, the increase in aerosols has also been proven to impact regional climate, delay precipitation, and possibly further induce extreme natural disasters, including floods and droughts (Rosenfeld et al., 2008; Guo et al., 2016; Huang et al., 2014a). In addition to the overall space–time changes caused by human activities, the existence of some aerosol pollution emergencies cannot be ignored. These include natural sources of aerosol, such as smoke, ash plumes, and sand storms that are caused, respectively, by wildfires and volcanic eruptions, and desert sands in arid regions may also undergo physical and chemical reactions in the atmosphere or be transported to more distant areas of human activity (Zhang et al., 2017; Eck et al., 2005; Ma and Gong, 2012). These particles are believed to aggravate regional air pollution and complicate the regional aerosol environment (Horwell and Baxter, 2006). These events can also be reflected by the short-term variances in aerosols. On the whole, the change in aerosol is an important research topic that deserves long-term attention in Asia.
The developers of satellite technology have greatly promoted the study of the spatiotemporal evolution and properties of aerosols in the last few decades. Satellite observations are an irreplaceable approach because they can collect aerosol distribution information from space near-globally and greatly make up for the limitations of the spatial cover of ground-based observations. Sensors such as the Moderate Resolution Imaging Spectroradiometer (MODIS) and Multi-angle Imaging SpectroRadiometer (MISR) have provided a wealth of aerosol distribution data for more than 20 years (Masuoka et al., 1998; Diner et al., 1998). Benefitting from the hardware load and channel settings, different sensors have their unique aerosol products; MODIS products can retrieve aerosol optical depth (AOD) spatial distribution with high accuracy, and MISR can further obtain particle size information owing to multi-angle imaging (Sayer et al., 2014). These satellite remote sensing aerosol products described aerosols in the atmosphere from different perspectives and have provided useful aerosol information for related research, including quantifying the global transport of particulates, constraining climate models, improving air quality, and evaluating long-term aerosol changes (Lenoble et al., 2013). Although satellite observation has many advantages, verification and calibration satellite aerosol products cannot be neglected. The Aerosol Robotic Network (AERONET) is the main federated ground-based observation network and public data archive that has continuously measured and stored more than 25 years of aerosol characteristic datasets (Holben et al., 1998; Eck et al., 1999; Dubovik and King, 2000). The instruments used in this network are sun photometers, and the stations of the network are in major ecosystems and human activity areas around the world to provide information on the concentration and optical, microphysical, and radiative properties for aerosol-related research (Holben et al., 2001). Their observation data have been successfully used as a ground validation reference for multiple satellites (Remer et al., 2005; Levy et al., 2010; Chen et al., 2020).
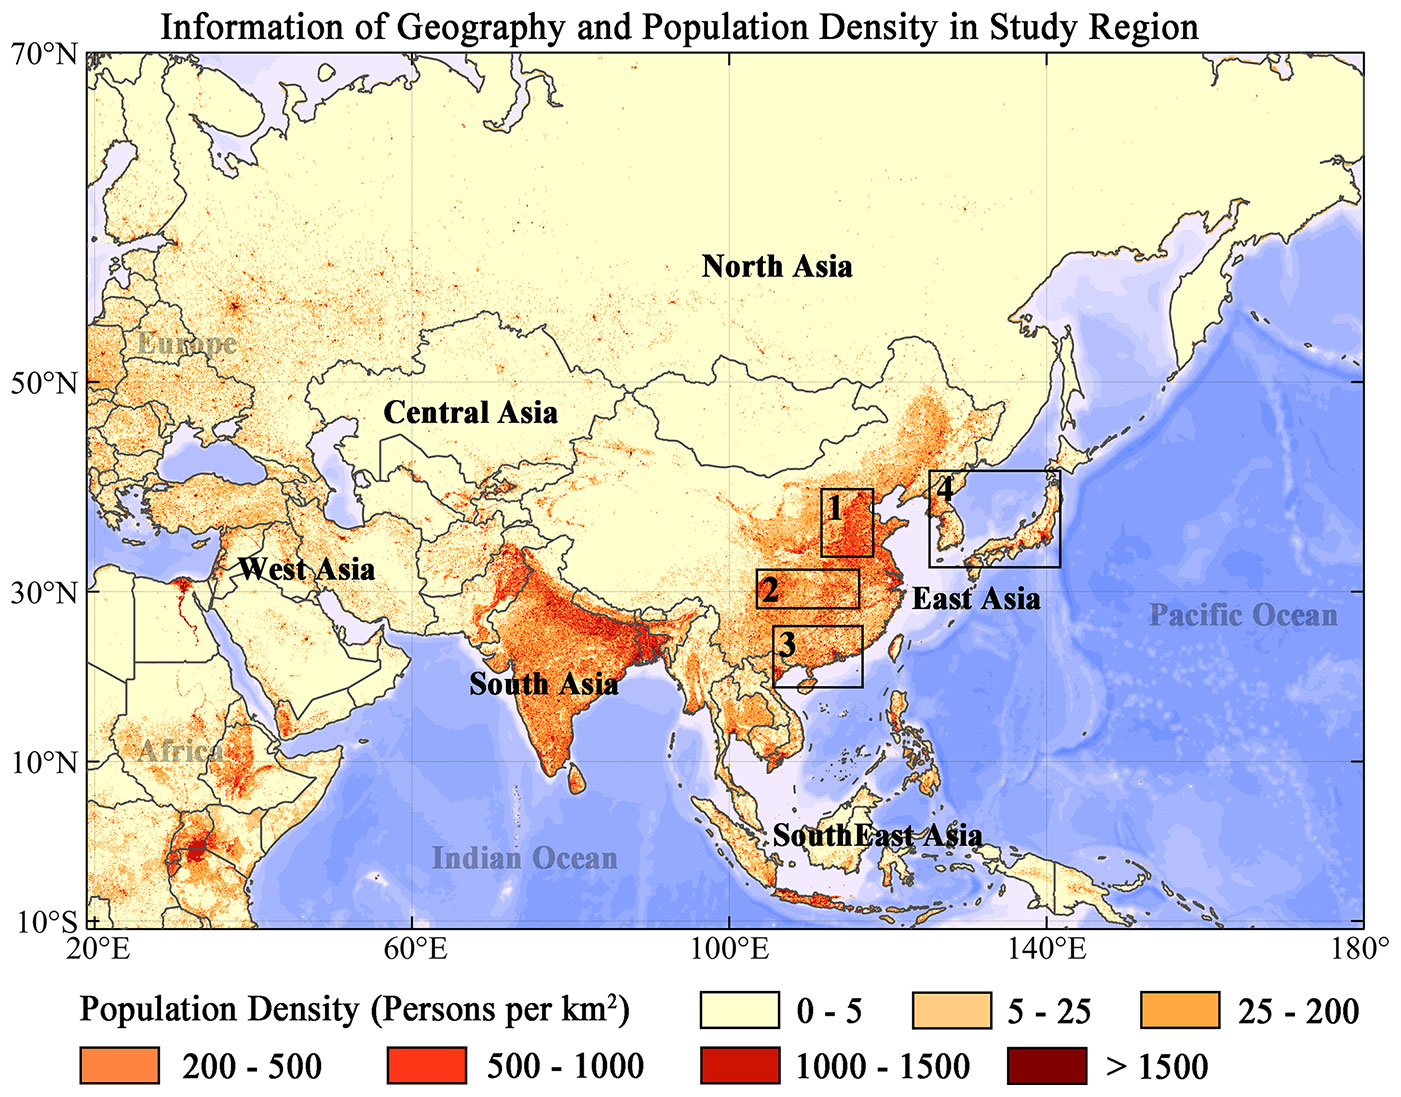
Figure 1National geographic and distribution of population density in Asia. The blue regions represent main ocean systems. East Asia is divided into four different regions shown as the four black boxes in the figure. All regions are divided according to national or provincial boundaries, and the details are shown in Fig. S1.
Current research on the spatial and seasonal changes in aerosol generally use a certain kind of observational data, such as ground-based sun photometer, lidar, and satellite sensor data (Kumar et al., 2018; Vernier et al., 2011; Bi et al., 2014). Among them, satellite-based studies are mostly focused on changes in total AOD, while less attention was paid to the trends of aerosols with different sizes and types in time and space scales. This was mainly due to the limitations of the aerosol sensor and retrieval algorithms in the past. Meanwhile, the ground-based stations are limited by their number, which is mostly confined to several locations. Given that the good performance of the latest MISR aerosol products (Garay et al., 2020) and the aerosol type analysis ability of the Modern-Era Retrospective analysis for Research and Applications, Version 2 (MERRA-2), is well known in Asia (Xu et al., 2020; Ou et al., 2022; Ali et al., 2022), combinations of multi-source data (ground-based stations, satellites, and numerical analysis) were expected to make up the limitation of only using satellite AOD products or the ground-based stations in the investigation of the long-term seasonal variability and trends of the different properties of aerosols.
In addition, with respect to an in-depth and objective analysis of aerosol, Sayer and Knobelspiesse (2019) recommended using the geometric mean to aggregate satellite AOD data instead of the arithmetic mean because the aerosol distribution is much closer to the log-normal distribution than the conventional normal distribution in large and long-term scales. Collaud Coen et al. (2020) pointed out that the variance-corrected Sen's slope and a combined trend-free pre-whitening (TFPW) Mann–Kendall (MK) test are better for calculating the AOD trends and significance. The most important advantage of this is that it can avoid the overestimation brought by the interference of the temporal autocorrelation in the aerosol series and result in an unbiased trend (Yue et al., 2002; Wang et al., 2015). And the spatial autocorrelation is also a critical problem (Wilks, 2016), especially in trend mapping based on a grid point. Because every single grid point is not completely independent in the significance test. Some of these will be clustered and look realistic as opposed to noise, which is due to the potential spatiotemporal autocorrelation in aerosol data. In this case, the evaluation of the collective significance of a finite set of individual significance tests is recommended (Livezey and Chen, 1983), which has usually been ignored in previous studies. Therefore, the continual discussion of the aerosol data and the improvement of analysis methods allows us to rethink the long-term trends of aerosol from a novel perspective. Following the trend analysis method, another novel perspective which considers the small-scale variability in the aerosol in a short time or space is presented in this study; for example, when, during long-term regional haze, the aerosol loading is high (Zhao et al., 2013) but the aerosol variability may be relatively low (because AOD has been maintained at a high level). In contrast, high aerosol variability may indicate sudden pollution incidents or temporary emission sources.
Therefore, in order to understand the aerosol environment and its evolution over Asia in more detail, a comprehensive investigation (2000–2020) of the spatiotemporal distributions, trends, and small-scale variabilities in the different sizes and types of aerosols was executed in this study, based on multi-source observation data, including ground-based stations, satellites, and reanalysis data. MODIS is used to obtain the total AOD, and MISR and MERRA-2 are used to acquire aerosol size and chemical composition information, respectively. The modified TFPW-MK test and Pettitt's test were used to estimate trends, change points, and the significance of aerosol parameters, avoiding the interference of serial autocorrelations. In addition, we also evaluated the differences between the main satellite products and ground-based AERONET observations to clarify the possible biases in this study.
2.1 Study region
Influenced by a variety of anthropogenic and natural emission sources and monsoons, the Asian aerosol environment is extremely complex, with obvious distributions and trends. Two populous countries, China and India, are greatly concerned, and they are also the main anthropogenic emission sources in East and South Asia, respectively. Different from most studies, North Asia (NA), where aerosol natural sources are dominant, is also considered to enrich the understanding of the whole Asian region. Therefore, we divide Asia into six major portions (shown in Fig. 1), namely East Asia (EA), South Asia (SA), Southeast Asia (SEA), Central Asia (CA), West Asia (WA), and North Asia (NA), in accordance with the geography and the boundary lines of the countries. In addition, the EA is further subdivided into North China (NC), South China (SC), Central and Western China (CWC), and the Korean Peninsula and Japan (KJ). The details of division are shown in Fig. S1 in the Supplement. The purpose is to refine the evaluation in regions of EA with high-speed economic development. Finally, for the seasonal statistics, the seasons were defined by month as follows: spring (March, April, and May or MAM), summer (June, July, and August or JJA), autumn (September, October, and November or SON), and winter (December, January, and February or DJF).
2.2 Ground-based observation sites
The standard aerosol property product (Level-2.0; version 3) was obtained from ground-based sun–sky photometer (Cimel Electronique) observations at all available AERONET sites (Holben et al., 1998) in Asia. Version 3 AERONET aerosol products have a lot of improvements compared to version 2, such as applying a new polarized radiative transfer code, updating the datasets of spectral solar flux and surface albedo parameters, modifying the temperature and gas absorption corrections, and using stricter quality control rules (Giles et al., 2019; Sinyuk et al., 2020). The uncertainty in the AOD calculation is reported as ∼ 0.01. The uncertainty in the single scattering albedo (SSA) is estimated as ∼ 0.03 when the AOD at 440 nm is larger than 0.4. In addition, an extra site established at Wuhan University was also applied in this study (Jin et al., 2021) to supplement the aerosol optical properties in the Central China (CC) area. This site is equipped with the same sun–sky photometer as AERONET and is calibrated annually using the China Meteorological Administration Aerosol Remote Sensing Network (CARSNET; Che et al., 2009) to ensure the data quality. The AOD from the Wuhan site was calculated from the direct sun measurements, and other complex properties were retrieved from the sky irradiance under cloudless conditions (Smirnov et al., 2000), using the method of Dubovik and King (2000).
2.3 Satellite aerosol measurements
2.3.1 MODIS C6.1 aerosol products
The MODIS sensors on board the Terra and Aqua satellites were launched in 2000 and 2002, respectively, and have been providing continuous Earth observations (King et al., 1992). The scanning width of the sensors is ∼ 2300 km, with a full coverage of the world every 1–2 d. Two operational aerosol retrieval algorithms, namely Dark Target (DT) and Deep Blue (DB), have been applied to produce high-accuracy C6.1 Level-2 aerosol products, with spatial resolutions of 3 and 10 km (Hsu et al., 2019; Levy et al., 2013). Among them, the DT algorithm covers areas of the ocean and dense vegetation, while the DB algorithm is only applied over land, including both dark and bright surfaces. The current C6.1 version has corrected the overestimations of AOD over urban surface types by using an improved surface reflectance estimate strategy (Gupta et al., 2016). The MODIS aerosol products are used to obtain AOD parameter in the study, and these products can be acquired from the NASA's Level-1 and Atmosphere Archive (LAADS) Distribution System Distributed Active Archive Centers (DAAC).
2.3.2 MISR V003 aerosol products
The MISR on board the Terra satellite is a multi-angle sensor with nine directions between ± 70.5∘ and four channels from 443 to 865 nm (Diner et al., 1998). Due to the fore/aft viewing strategy, MISR has a narrower swath with relatively high spatial resolutions (0.275–1.1 km), enabling it to observe the whole world once in ∼ 9 d. In addition to the retrieval of total columnar aerosol (Kahn et al., 2005), the multi-angle technology allows MISR to infer size-segregated AOD from the total observations, including small-sized AOD (< 0.7 µm; SAOD), medium-sized AOD (0.7–1.4 µm; MAOD), and large-sized AOD (> 1.4 µm; LAOD). Compared with the previous version, the latest MISR Level 2 Aerosol parameters, version 3 (V23), product applies two separate algorithms on the land surface and dark water, respectively, to improve the accuracy and resolution (4.4 km; Garay et al., 2020). The MISR aerosol products are used to obtain size-segregated AOD. The corresponding data can be acquired from MISR access data (https://www.nasa.gov/, last access: 3 November 2022).
2.4 Reanalysis data
MERRA-2 is the latest satellite era (from 1980 onward) retrospective analysis dataset which was developed by NASA with the Goddard Earth Observing System, version 5, Earth system model (Gelaro et al., 2017). In addition to meteorological observations, MERRA-2 provides several improvements, including AOD assimilation from various ground-based and satellite remote sensing instruments (Randles et al., 2017). It has shown a great performance in absorbing aerosol optical depth (AAOD) and surface fine-mode particles by comparing available satellite, aircraft, and ground-based observations (Buchard et al., 2017). The aerosol species data used in this study were obtained from MERRA-2 v5.12.4 products (M2TMNXAER), which defined the mass concentrate and optical depth of several aerosol components, including black carbon (BC), dust, sea salt (SS), sulfate, and organic carbon (OC). This product has a spatial resolution of 0.5∘ × 0.625∘ and is released once a month.
2.5 Auxiliary data
In addition to the main data mentioned above, we also used some auxiliary data to enrich the research content. The global gridded digital elevation data were from the General Bathymetric Chart of the Oceans (GEBCO), the population density data were from LandScan (Rose et al., 2019), and the active fire count data (confidence > 60 %) were from the MODIS Terra/Aqua Collection 6 fire products (MCD14DL; Giglio et al., 2016).
3.1 Validation of satellite aerosol products against with AERONET
The accuracy of satellite products is evaluated to avoid the possible misunderstanding of trends in climatological research due to retrieval deviations. To match satellite and AERONET observations, a common method in the aerosol community is applied, which calculates data within a limitation of 30 min and a circle with 0.25∘ (∼ 25 km) radius centred on the selected site (Sayer et al., 2013). Measurements of AERONET at 550 nm were calculated by 440 and 670 nm, following the wavelength-dependent relationship proposed by Ångström (1964). Several indicators were used to evaluate the performances of MODIS and MISR AOD products, including the root mean square error (RMSE), mean absolute error (MAE), and relative mean bias (RMB), as shown in Eqs. (1)–(3). In addition, the percentage (%GCOS) falling into the goal uncertainty presented by the Global Climate Observing System (Popp et al., 2016) is also considered to better compare the different AOD data in a long-term and large-scale analysis. For AOD data from satellites, the goal uncertainty is defined as 0.04 (assuming an uncertainty in any AERONET measurement of 0.01) or 10 %, depending on which one is larger (Eq. 4). Finally, Spearman's rank correlation coefficients (ρ) and Pearson's correlation coefficients (R) were also used to assess the relationship between AERONET and satellite measurements, with a significance (p) test to confirm whether the satellite retrieval result was available.
It is worth noting that because MISR and AERONET have different standards for particle size division, a direct comparison cannot be performed. A compromise is that the SAOD plus MAOD of MISR corresponds to the fine-mode AOD of AERONET and the LAOD of MISR corresponds to the coarse-mode AOD of AERONET, which is useful for a performance evaluation (Tao et al., 2020). The deviation of the satellite aerosol products will first be clarified by comparing the AERONET observations.
3.2 Climatology and long-term trend assessment
The long-term trend assessment of aerosol loadings and different aerosol types is meaningful to improve our understanding of the local aerosol environment, aerosol emission sources, environmental policy-making, health impacts related to air quality, and the aerosol climate effect. According to different applications, satellite aerosol products require the aggregation of the directly observed measurements over different temporal scales, including daily, monthly, seasonal, and annual averages. As Sayer and Knobelspiesse (2019) reported, aerosols become increasingly more consistent with log-normal than with normal distributions for longer timescales such as months and years. Therefore, we used a geometric mean method to recalculate the monthly data from the Level-2 MODIS C6.1 and MISR V003 aerosol products, in accordance with the reported log-normal distribution. Specifically, the AOD data from MODIS and MISR will first be remapped from their native spatial resolution to 0.1∘, using the nearest-neighbour method. Here, the Terra and Aqua MODIS products are treated as one dataset. Then, the AOD data in each pixel are directly aggregated into monthly data by timescale with the geometric mean method, and all the trend analyses presented below are done based on these monthly datasets. It can be expected that this method will restrain the contributions from haze events with extremely high AOD and generate lower average values.
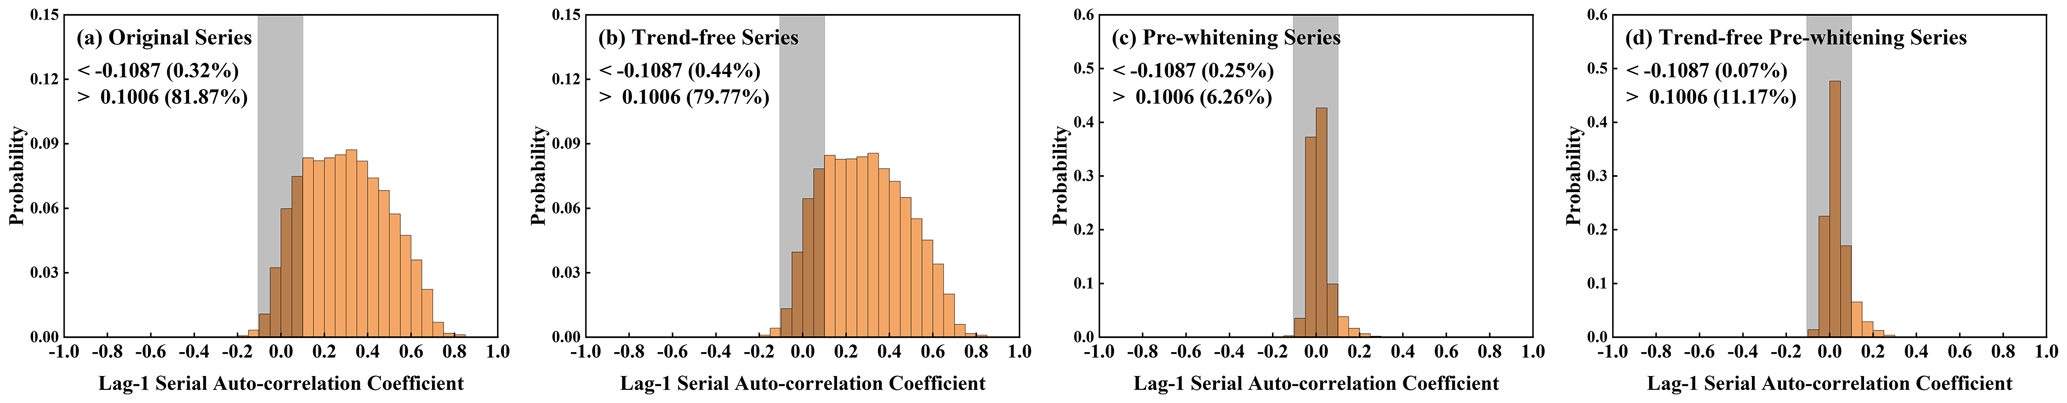
Figure 2Histograms of the estimated Lag-1 serial autocorrelation coefficient from the monthly AOD (geometric mean) of MODIS C6.1 DT and DB datasets in the study region. The black shaded area is the approximately estimated two-tailed range ([−0.1087, 0.1006]) of the significance test (p<0.05).
3.2.1 Theil–Sen approach
The Theil–Sen estimator is a robust estimation of the magnitude of a trend proposed by Theil (1950) and Sen (1968). It has been widely used for identifying the trend of linear change in time series data, including studies on hydrology, the atmosphere, and land (Gui et al., 2021; Hall et al., 2014; Sulis et al., 2011), and is given by the following relation in Eq. (5).
where β is the slope calculated by Theil–Sen approach. xt and xj represent any data in the time series that meet the conditions (t>j) in a time series.
3.2.2 Modified trend-free pre-whitening Mann–Kendall test
The original MK test is a rank-based, non-parametric test for assessing the significance of a trend series data (Mann, 1945; Kendall, 1975). It is based on an independent and randomly ranked time series, does not require that the trend is stable, and the its results are also not impacted by the presences of outliers or missing values. However, the spatiotemporal autocorrelation is usually widespread in observed AOD series (namely, the data are not strictly independent and random). This means that the original MK test usually results in occurrences of type I errors (rejecting true null hypothesis) in statistics and thus generates a large number of false significances (Von Storch, 1999). For the time series of aerosol data, Collaud Coen et al. (2020) presented a combined evaluation method to reduce the negative effects of autocorrelation and improve the accuracy of the trend based on different types of time granularity and segmentation. Specifically, the trend of aerosol is determined by the variance-corrected Sen's slope (Wang et al., 2015), and the trend is only considered to be statistically significant when both the pre-whitening (Kulkarni and Von Storch, 1995) and TFPW (Yue et al., 2002) series can pass the MK tests. However, a disadvantage of pre-whitening is that it removes a part of the trend, while removing the autocorrelation and resulted in a lower sensitivity. This will cause part of the aerosol trend to be lost during processing. Taking the monthly MODIS AOD as an example, Fig. 2 shows the serial autocorrelation using different data processing methods. It can be found that, when compared with original AOD series, the lag-1 serial coefficient of both the pre-whitening and TFPW series show a similarly pronounced decrease. This means that the autocorrelation has been well suppressed in the TFPW series for the current dataset. Therefore, in order to preserve more details of aerosol changes and avoid the overestimation of significances in this study, the trend and significance test was determined by the variance-corrected Sen's slope and TFPW-MK method, respectively. The specific steps are as follows:
-
Step 1. For an original AOD series (Xt,T), calculate the lag-1 serial coefficient to determine whether this series has a significant serial autocorrelation, as in Eq. (6).
where the is the lag-1 serial coefficient for the original AOD series Xt,T, and the E(Xt,T) is the mathematical expectation. If the do not fall into the significant intervals when using the two-tailed test (Anderson, 1942), then the series Xt,T is considered to be serially uncorrelated and can use the MK test directly. The term t represents the time position of data in the series, and T is the length of the data (namely, there is t=1, 2, 3, … , T). Therefore, we can use this lag-1 serial coefficient to evaluate the autocorrelation of a time sequence of aerosols.
-
Step 2. If the fall into the significant intervals (p<0.05), then the Xt,T is considered to be serially autocorrelated. Then, before estimating the significance using the MK test, it is necessary to calculate the Sen's slope (β), remove the serial trend, and create the blended series (namely, the processing of TFPW), as in Eqs. (7)–(9).
where is the detrended series, is the residual series (detrended; lag-1 autocorrelation is removed), and Yt,T is the blended series (mixing residuals and trends). The term is the lag-1 serial coefficient of and calculated following Eq. (6). This process can be understood as simply removing the autocorrelation part from the time series data. Then, the significance of trends and abrupt change points are assessed from the blended series. It should be noted that the influence of the tied rank groups was ignored here in the calculation of variance in the MK test because the values of AOD observed from satellite were usually different.
-
Step 3. Finally, the variance-corrected trends (β′) can be approximately estimated by β, as in Eq. (10).
In this study, β′ is used to present the AOD trends with different aerosol sizes and types. This method can be considered to keep a good balance between maintaining a low type I error and a relatively strong power of trend detection, which also provides a robust choice in studies of trend analysis (Wang et al., 2015).
3.2.3 False discovery rate test
Generally, in a multiple hypothesis testing, noise (true null hypothesis is erroneously rejected) will be unavoidable, and the amount of noise depends on the selected different thresholds of the significance level. Especially in geophysical studies, because the spatial autocorrelation between the geophysical data is common (Wilks, 2006), the noise will tend to cluster somewhere to make it seem real and probably lead to a false conclusion. The false discovery rate (FDR) test (Benjamini and Hochberg, 1995) can provide a good solution to this problem. It allows the use of a dynamic threshold for a statistical significance test, with the goal of minimizing the type I error, as in Eq. (11).
where N is the total number of multiple hypothesis tests. i is the position in the local p value rank (from small to large). αFDR is the false discovery rate (αFDR<0.05 in this study), and pi is the threshold of the significance test for each local hypothesis. As the equation shows, when the p value of a local hypothesis is not small enough to satisfy its position in the whole, it will be removed. Moreover, this FDR test has been proven to be effective and robust when processing the spatial autocorrelation geophysical data, which is also recommended (Wilks, 2016). In this way, we can reduce the uncertainty, avoid over-interpreting, and ensure that apparent significant trends are real.
3.2.4 Change point test of AOD series
An analysis of the change point is a technology in accordance with homogeneity testing in a time series (Alexandersson and Moberg, 1997). The technology determines the time point at which the interruption or change point occurred, and thus, in study of long-term aerosol parameter observations, it can help to reveal different patterns of aerosol changes closely related to human activity. Similar to the MK test, the Pettitt test (Pettitt, 1979) is also a non-parametric test that is based on the ranks of series data. The advantages of Pettitt test are that it is sensitive to breakpoints in the middle of a time series and robust against outliers and data with skewed probability distributions (Wijngaard et al., 2003). Moreover, compared with the MK change point test, the Pettitt change point test only reflects the most important change and avoids finding multiple unstable patterns when trends or breakpoints are not significant in the time series data. Here, the calculation of the Pettitt change point is as follows:
where the Ut,T is a rank statistic series in the Pettitt test, and Vt is referring to the rank at the position of t. For t>2, there is
The yt and yj are specific values in the blended series Yt,T, and sgn is a symbolic calculation consistent with the definition in the MK test. When t=1, there is (. Then, the Pettitt change point (KT) is found at the position with a maximum absolute value of Ut,T, as follows:
The significance probabilities (p) associated with the Pettitt change point (KT) can be approximately estimated by
3.2.5 Percent change calculation
Since the magnitude of different aerosol parameters can be very different, we also calculated the percentage of change during the whole study period to make the trend comparable between these parameters. In accordance with the study of Yue and Hashino (2003), the percentage of change is calculated from the trend and time span, following Eq. (16).
β′ is the variance-corrected Sen's slope as the obtained trend, and the mean represents regional geometry average values of different aerosol parameters. Here, we evaluated aerosol trends from the long-term data of different observation systems at two different levels, namely the pixel level and the regional level.
3.3 Estimation of spatial and temporal small-scale AOD variability
The small-scale variability in the AOD in the study refers to the degree of aerosol oscillation on a small temporal and spatial scale and can be used to clarify the stability of aerosol loading at a certain place. For example, a region with a high AOD variability means that aerosol can change drastically at certain moments, probably due to the influence of abrupt emission events, such as long-distance transported dust, air pollutant migration, and wildfire. A low AOD variability, in contrast, generally reveals a relatively stable source for the aerosol emissions or in the aerosol environment at the local scale. In addition, several advanced aerosol retrieval algorithms also start to introduce the spatiotemporal change information of aerosols through multi-pixel synergetic retrieval or filtering from constraints or additional observations. Therefore, the small-scale AOD variability can supplement the characteristics of aerosol from another perspective and is meaningful for aerosol research. In previous studies, the standard deviation is a useful and common index to indicate the degree of dispersion of the data. In climate-related research, it can be used to partially characterize the temperature distributions, extreme precipitation probabilities, or model accuracy (Boer, 2009; Unkaševiæ et al., 2004; Gu et al., 2019). In this study, the small-scale variability in the AOD is also defined as the standard deviation of AOD over a small period or over a small area of space. Thus, it can easily be calculated from different satellite products. Sliding windows were used to calculate the standard deviation, with 3×3 pixels for spatial scales and 7 d for temporal scales, respectively.
where N is the number of samples (nine for spatial scales and seven for temporal scales), and is the numerical average value of AOD in a small scale. Missing data will be removed. Like the other aerosol parameters, the small-scale variability in the AOD was also used to estimate the distribution as an additional statistical aerosol parameter. Through the geometric mean method and the small-scale variability, it can be expected to explore the aerosol distribution and variation characteristics from more perspectives.
4.1 Performance of MODIS and MISR aerosol products
Before the long-term analyses, we first assessed the performance of satellite aerosol products used in this study to clarify the potential misunderstanding of trends caused by retrieval deviations, especially in Asia, where the aerosol loading can vary greatly. Table 1 shows the quantitative indexes of the retrieval performance of AOD products from MODIS and AOD, SAOD, MAOD, LAOD, and AAOD products from MISR. In addition to Pearson's correlation coefficient (R), the Spearman's rank correlation coefficient (ρ) was also calculated and displayed because it is based on the sorting position and is more consistent with the rank-based analysis. It was found that the percent falling into the goal uncertainty (%GCOS) was higher than 40 %, and the R and ρ were higher than 0.87 and 0.80 for all MODIS AOD products. The MAE was within 0.10, and the RMSE was floating around 0.14, showing a good performance. Considering that MODIS DT and DB had their own advantages, their combination could increase the coverage area while maintaining performance. For the AOD parameter, DT and DB were selected for the trend analysis of the AOD to balance the spatial coverage and accuracy.
Table 1Validations of key aerosol parameters from MODIS and MISR compared with AERONET observations.
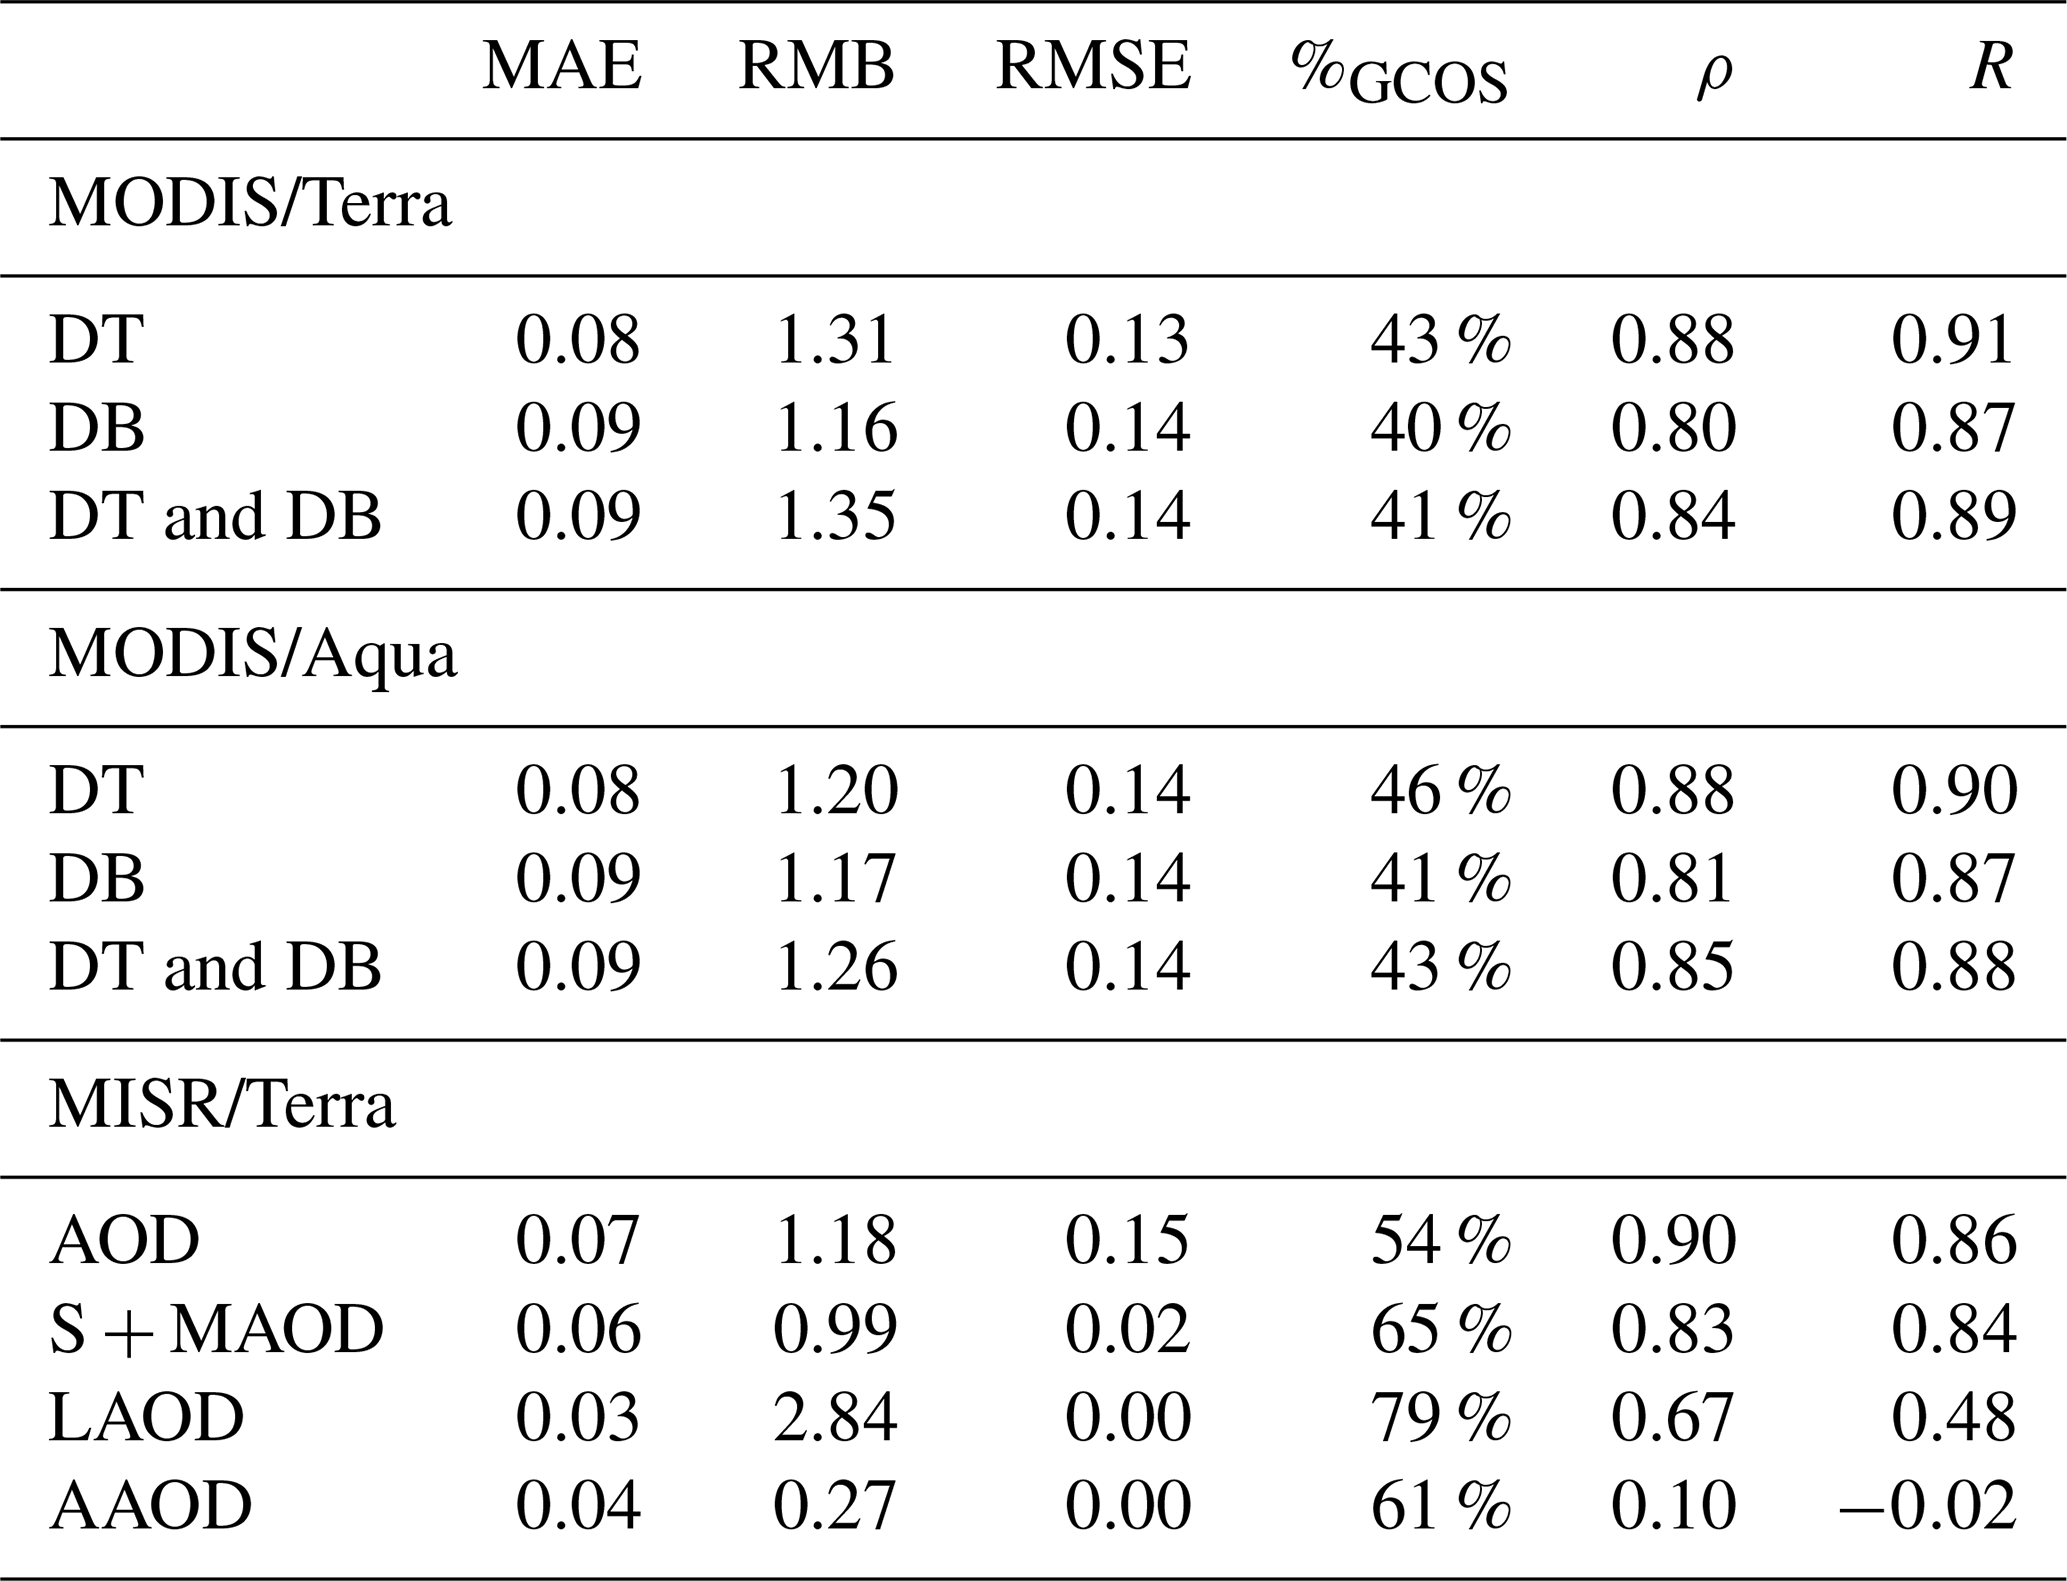
Note that DT means that the AOD is retrieved from the Dark Target algorithm, DB means that the AOD is retrieved from the Deep Blue algorithm, and DT and DB represent the combined AOD from Dark Target and Deep Blue algorithms. S + MAOD is the sum of the SAOD and MAOD. The test of AAOD does not pass the significance test with p values of 0.13 (for Spearman's rank correlation coefficient) and 0.74 (for Pearson's correlation coefficient). This suggests that the AAOD cannot participate in the trend assessment. All other parameters passed the significance test (p<0.05).
Compared with MODIS AOD products, MISR AOD showed higher values of %GCOS (54 %) and ρ (0.90) but a lower R (0.86). The high %GCOS and ρ can be attributed to the multi-angle information, making for more stable retrievals and fewer outliers. However, due to the decreasing spectral contrast, the high aerosol loading conditions will reduce the sensitivity of the MISR retrieval method to separate surface reflections from multi-angle information (Limbacher et al., 2022) and result in a possible underestimation of the AOD values under high aerosol loading conditions (Fan et al., 2023). For size-segregated AOD, the R (0.84) and ρ (0.83) of the S + MAOD from MISR also showed high correlations, meaning that it can be used for the information about the changes in fine-mode aerosol. However, since they inherited the AOD values, the underestimation under high aerosol loading conditions probably still exists, which might lead to the estimated trend being less than the actual change. In addition, for LAOD, the RMB was larger than 2, and the R was relatively low (0.48), revealing that the LAOD had a large positive deviation in the low value area. Nevertheless, the LAOD passed the significance test, and its ρ was good (0.67); thus, we also used the LAOD data in the trend analysis. In contrast, the AAOD had the lowest correlation coefficients ( and ρ=0.10), and these values also cannot pass the significance test. Therefore, the AAOD was removed from this study. It should be clarified that this does not mean that AAOD cannot correctly reveal the spatial variation in the absorbing aerosols because the uncertainty can also partially come from the retrievals of AERONET. But to err on the side caution, the removal of the AAOD data in this study is to avoid introducing an uncertainty beyond the expected level and to make the results more interpretable in trend analysis.
Probability density functions were also calculated at three AOD intervals, as shown in Fig. 3. When the values of AOD were less than 0.25, AOD products from the MISR and MODIS DT and DB datasets showed slight overestimations (median bias of ∼ 0.02). Then, with the AOD increasing, the slight overestimations were maintained for Terra AOD products, whereas an underestimation (∼ −0.03) appeared in the Aqua AOD products under the condition of AOD > 0.75. By using the average values of the two, this opposite bias can be expected to be partially offset in the overall distribution. However, for MISR, the median biases were ∼ −0.04 and ∼ −0.30 when AOD was between 0.25 and 0.75 and larger than 0.75, respectively. This underestimation, discussed above, which increased with the increase in AOD, also appears in the size-segregated AOD products of MISR and must be clarified and noted.
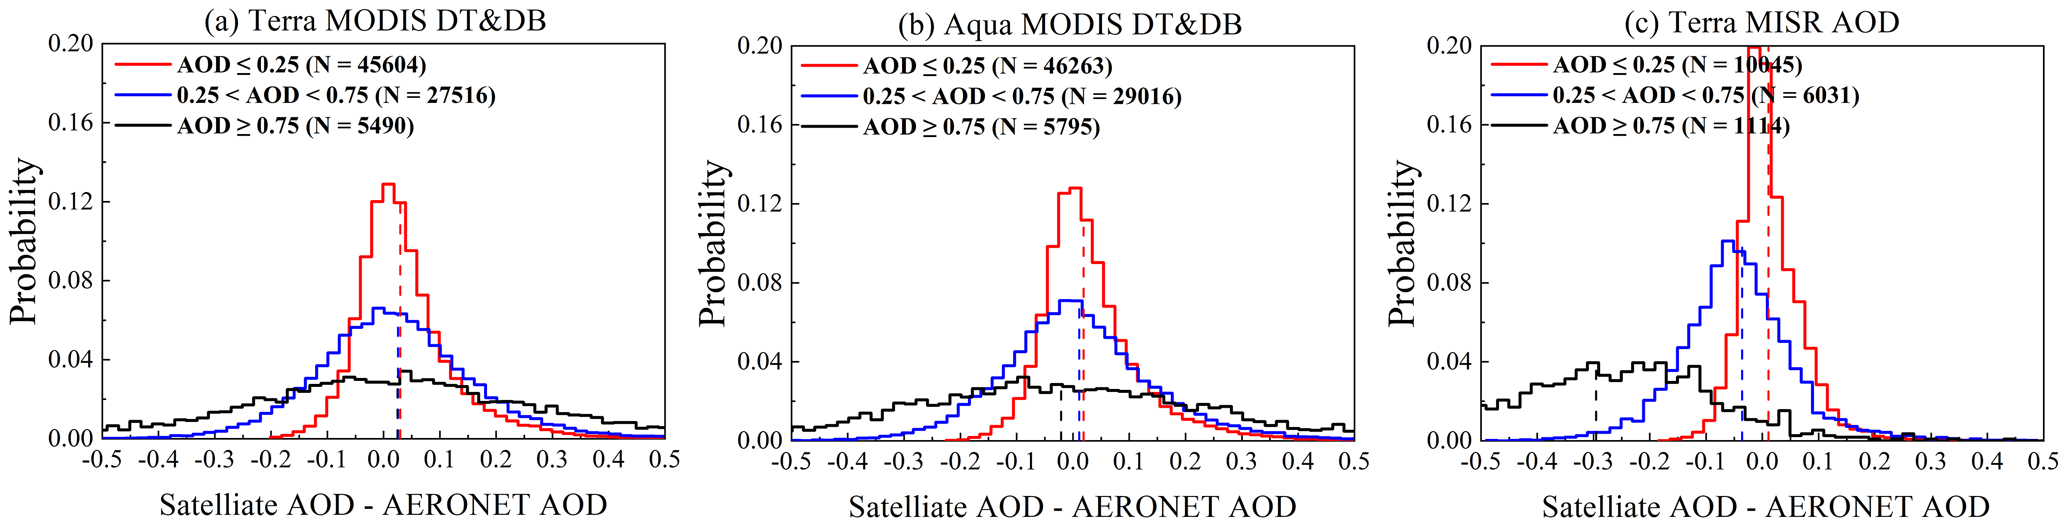
Figure 3Probability distributions of the difference between (a) Terra MODIS, (b) Aqua MODIS, and (c) MISR and the AERONET AOD products. The vertical dashed lines show the median position of each sample group.
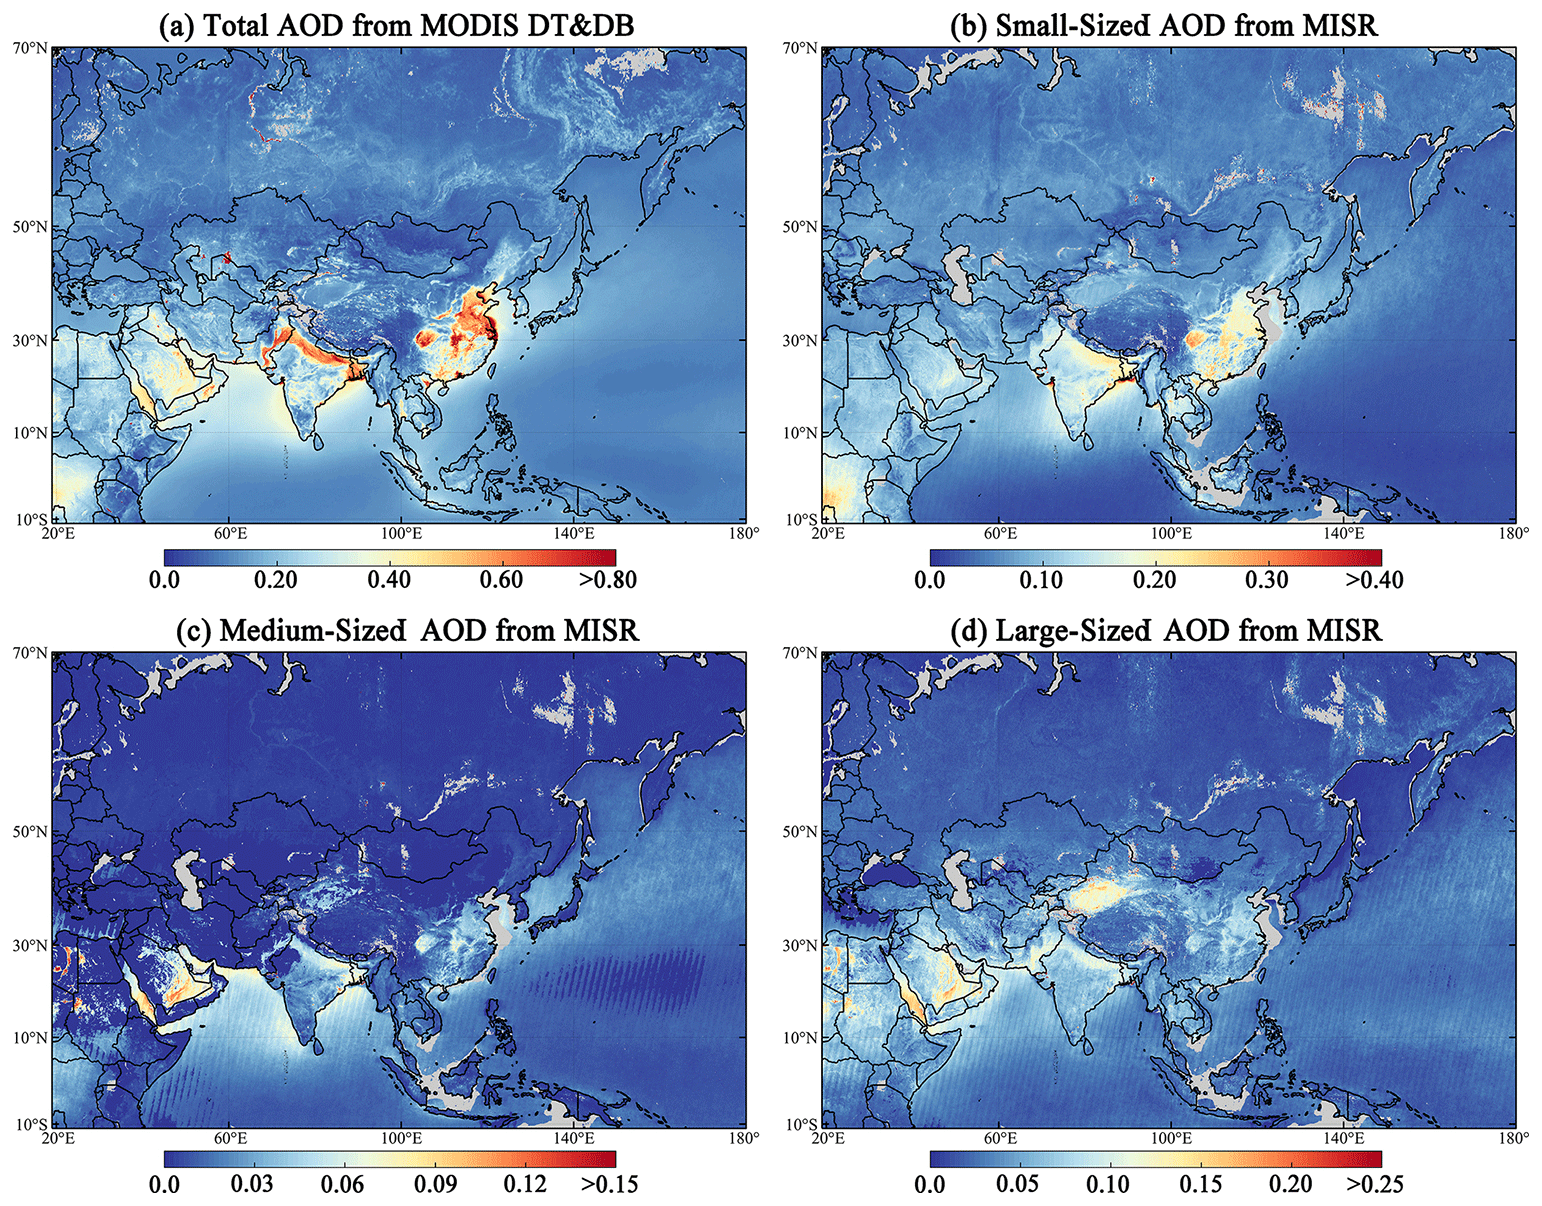
Figure 4Spatial distributions of the annual averages of (a) AOD, (b) SAOD, (c) MAOD, and (d) LAOD in Asia from 2000 to 2020. The total AOD was from the MODIS C6.1 DT and DB datasets, and the size-segregated AOD was from MISR V23 aerosol products.
4.2 Distribution characteristics of different aerosol sizes and types in Asia
In this section, we studied the spatial distributions of aerosols with different sizes and types. The spatial distribution of AOD was closely related to the population density, and most of the land was dominated by small particles (SAOD). As shown in Fig. 4, the spatial distribution characteristics of the multi-year mean size-segregated AOD were investigated. In Asian average terms, the values of AOD, SAOD, MAOD, and LAOD were 0.153, 0.074, 0.007, and 0.033, respectively. The AOD was highest in SA (0.291), followed by WA (0.234), SEA (0.178), EA (0.144), and CA (0.128), and it was the lowest in NA (0.110). Although the mean AOD in EA is not high, heavy aerosol loadings were concentrated in the regions of China with AOD values of 0.419, 0.214, and 0.368 in NC, CWC, and SC, respectively. The spatial distribution of SAOD has a high consistency with AOD, which is because aerosols on land are mainly composed of small particles (∼ 60 %). The highest SAOD value was in SA (0.135), whereas, due to the low population density, emissions of fine particles caused by human activities were also the lowest in NA, with SAOD value of 0.052. In contrast, the value of MAOD was the lowest in all size-segregated AOD, which showed the weakest contribution to extinction, owing to their narrow particle size range. On the one hand, the distribution of MAOD was mainly in regions of the sea and coast, indicating that this type of aerosol was possibly from SS particles. On the other hand, LAOD was mainly distributed in the arid regions of western China, northern SA, CA, and the Arabian Peninsula, indicating a dust aerosol type. The remaining SAOD mainly come from small particles, such as sulfate, OC, and BC particles, which is in accordance with MERRA-2 data.
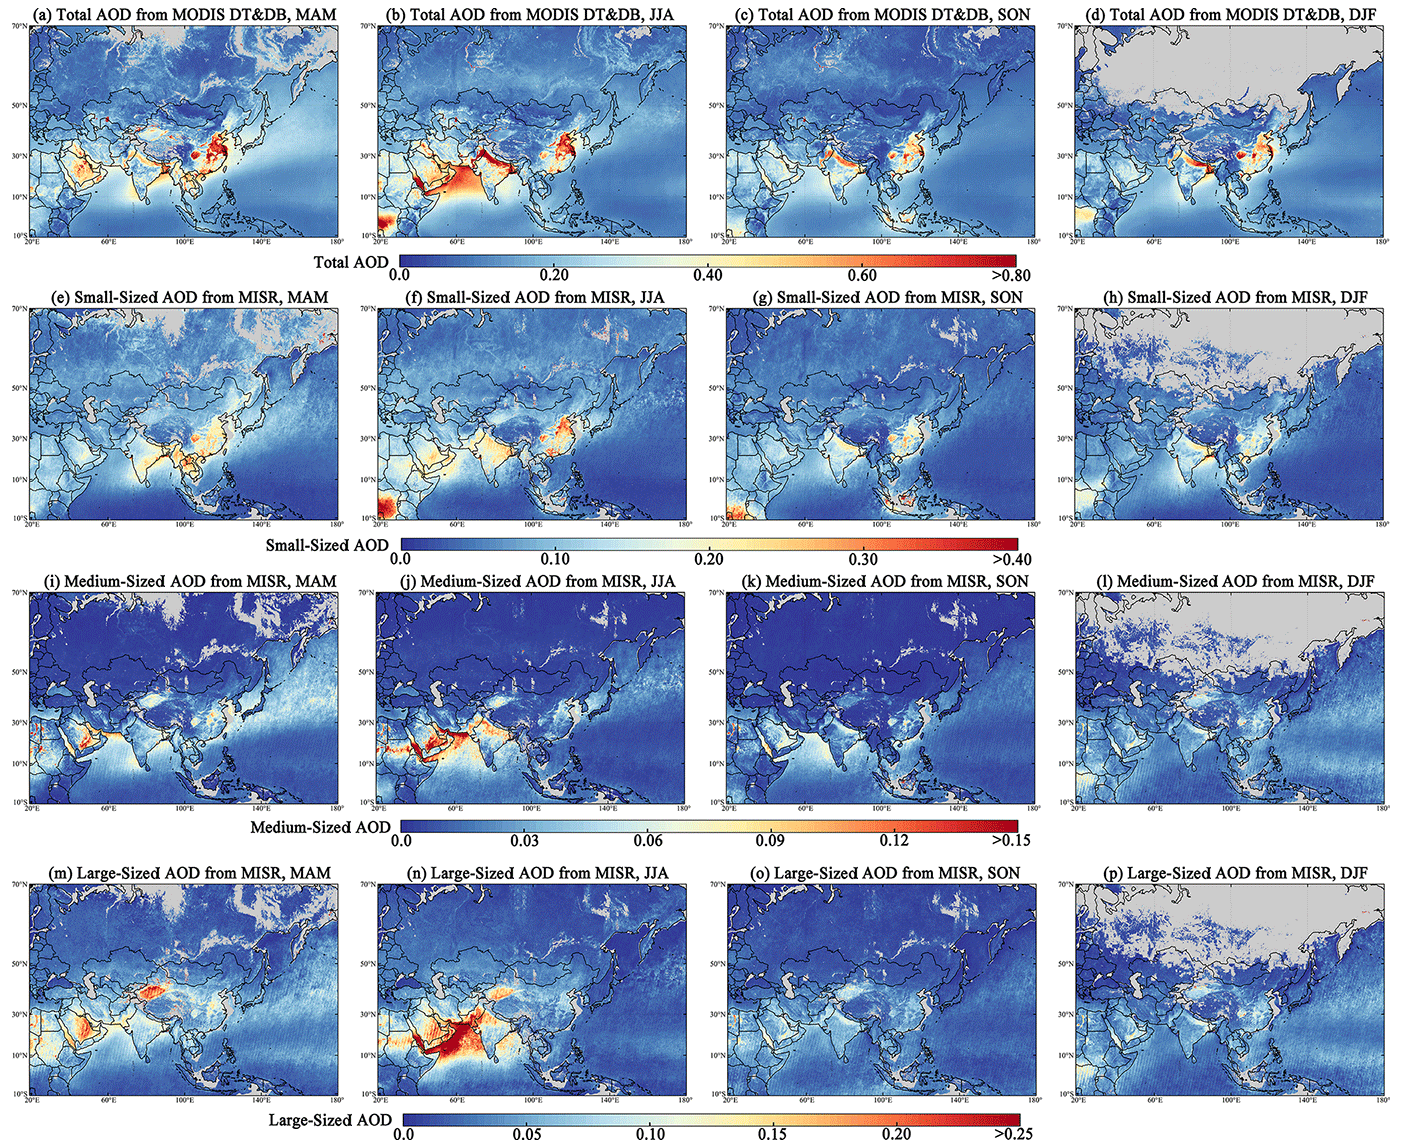
Figure 5Spatial distributions of seasonal AOD, SAOD, MAOD, and LAOD obtained from MODIS and MISR aerosol products in Asia from 2000 to 2020. The AOD was from the MODIS C6.1 DT and DB datasets, and the size-segregated AOD was from the MISR V23 aerosol products.
The seasonal characteristics of size-segregated AOD are shown in Fig. 5. From the whole land region of Asia, the highest AOD was found in spring (0.190), followed by winter (0.159), summer (0.152), and autumn (0.117). Here, it is noted that, due to snow cover, there was a large number of missing retrievals in winter for NA, which would lead to an overestimated mean AOD for the whole of Asia. Therefore, the specific details of the seasonal variations in aerosol should be obtained from the distribution maps of the AOD. Moreover, since the rank-based trend analysis method allows for missing data, the missing values caused by cloud cover and snow cover do not have a significant impact on the calculations of trends. The various changes in the aerosol distributions across different seasons are mainly caused by atmospheric circulations, local meteorological conditions, and the intensity of the regional anthropogenic and natural emissions. Due to the large proportion of small-sized particles in the aerosol, the SAOD and total AOD have a high consistency. The highest value of SAOD was in spring (0.094), followed by summer (0.076), and the lowest value is in autumn (0.059). Among these, the changes in the SAOD in SEA and NA were characteristic. High values of SAOD were concentrated in the Southeast Asian peninsula in the spring and in Indonesia in autumn. This distinct difference in the seasonal distribution suggests a significant impact of human activities on aerosols in SEA. And a high SAOD in NA was found in spring and summer, implying that there were wildfire events, especially when considering the sparse human population there. In contrast, changes in the MAOD and LAOD were generally related to dust events originating from arid and semi-arid regions, including the Arabian Peninsula, northwestern SA, and northwestern China. The dust particles can be widely transmitted with the atmospheric circulation (Ma et al., 2015; Zhu et al., 2007), and they can reach other land and sea surfaces and be deposited or participate in cloud formation, thus further affecting the regional climate and air quality (Wang et al., 2021; Husar et al., 2001). The most typical particle transport phenomenon in Asia was found in spring of the northern Pacific Ocean. The migration of these particles resulted in significant increases in AOD at different scales in that region, which is in sharp contrast to the clean ocean surface. The most obvious was the increase in MAOD, suggesting the presence of medium-sized dust particles. Meanwhile, an obvious incident of large particle pollution was found in the northern Indian Ocean in summer, with the percent of MAOD plus LAOD being over 50 %. This phenomenon may be caused by the surge in dust transport and SS aerosols under favourable weather conditions, such as an increase in ocean wind speed. To summarize, the seasonal cycle of particles with different sizes was of great significance for understanding the characteristics of and changes in the aerosols.
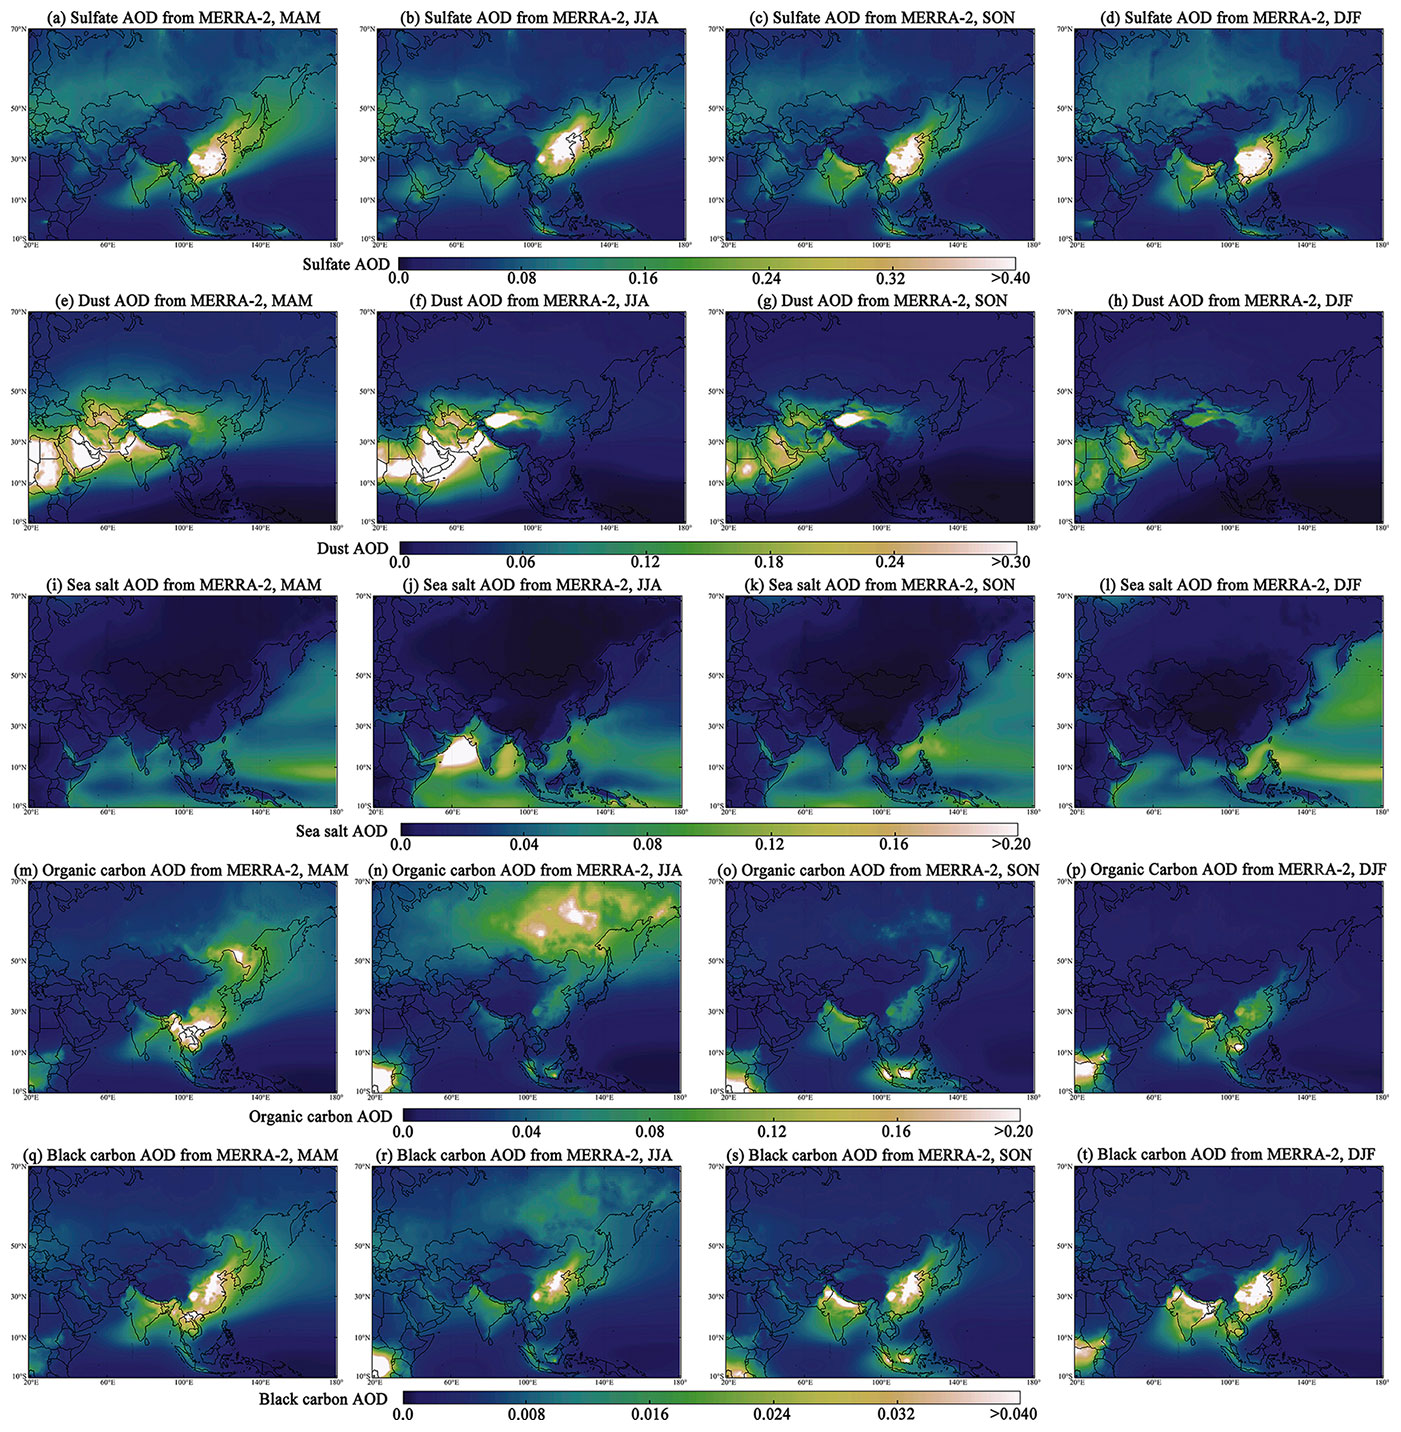
Figure 6Spatial distributions of seasonal sulfate, dust, SS, OC, and BC AOD obtained from MERRA-2 reanalysis data in Asia from 2000 to 2020.
The types of aerosol particles can largely reflect their chemical composition and source. Here, to further study aerosol properties in Asia, we calculated the average distributions of sulfate, dust, SS, OC, and BC AOD from MERRA-2 reanalysis data, as shown in Fig. 6. The differences in the distribution of the type-segregated AOD provide support for the reasons for the distribution and change in the size-segregated AOD. Generally, the impact of dust aerosols on Asia showed an apparent dependence of the seasons, which was consistent with LAOD observed from MISR. The values of dust AOD were highest in spring (0.059), followed by summer (0.036), autumn (0.023), and winter (0.022). WA was the most severely affected area by dust type aerosols, with a mean value of dust AOD of ∼ 0.142, and showed a clear seasonal cycle, with the dust AOD in spring (0.199) and summer (0.180) being almost double that in autumn (0.107) and winter (0.081) in this area. In contrast, NA was rarely affected by dust aerosol because the values of LAOD (0.013) and dust AOD (0.020) were low, and 76.4 % of the AOD is contributed by SAOD. Sulfate AOD did not change significantly in a seasonal cycle in Asia. The highest value was found in SA (0.113) and followed by EA (0.086). This is closely related to intensive human activity because a large number of aerosol particles originate from the gas-to-particle conversion that occurs during the rapid progresses of industrial activity (Mallet et al., 2003). Similarly, the seasonal distribution of SS aerosols was also relatively stable, with SS AOD values of ∼ 0.003 in a whole study area, whereas an abnormally high value of SS AOD (> 0.15) was found in the northern Indian Ocean in summer, suggesting a change in aerosol types. This means that, in addition to the dust aerosol, the SS aerosol is also an important natural source causing large values of MAOD and LAOD in this region. Moreover, previous studies show that this phenomenon is influenced by the monsoon season, and higher concentrations of SS aerosol can also promote the formation of sulfate aerosol (Satheesh and Srinivasan, 2002; Alexander et al., 2005).
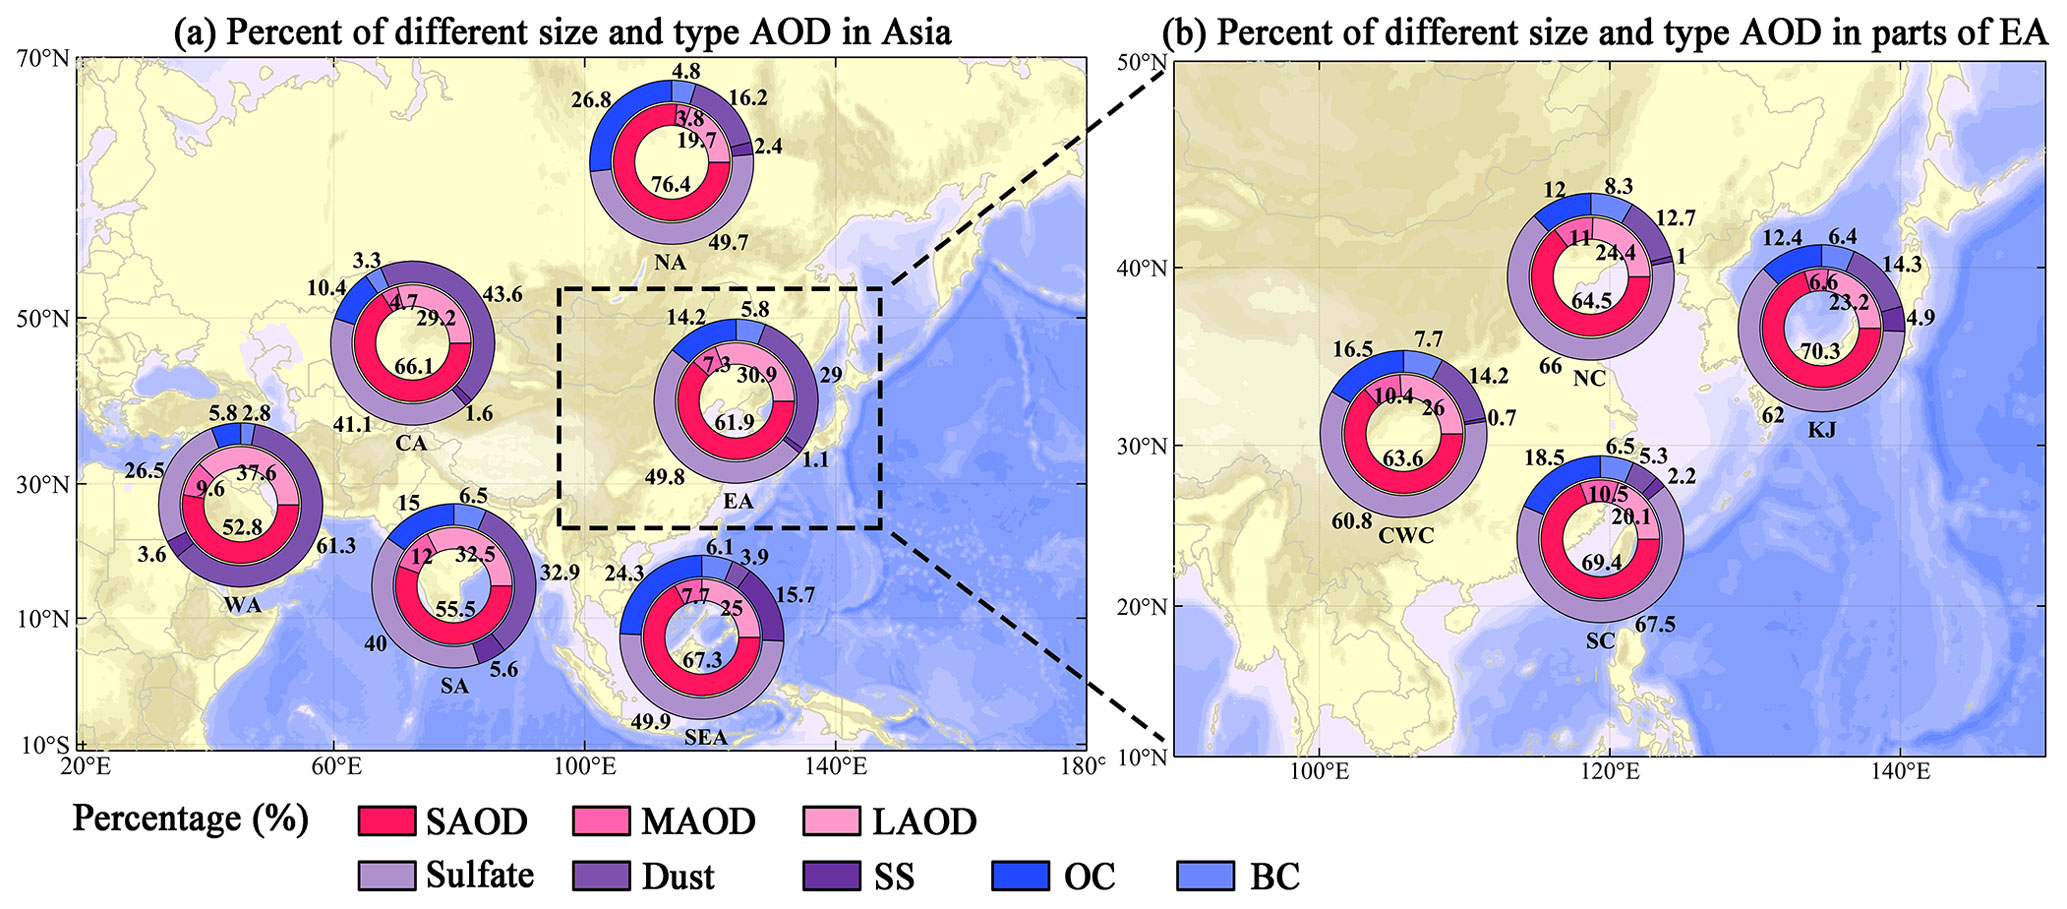
Figure 7Percentage of size-segregated AOD (SAOD, MAOD, and LAOD) and type-segregated AOD (sulfate, dust, SS, OC, and BC AOD) in the total AOD over (a) Asia and (b) parts of EA.
Carbonaceous aerosol is a general term for a series of carbon-containing aerosols. Although its concentration is relatively low in the atmosphere, it has profound effects on the entire climate system (Ramanathan and Carmichael, 2008). The main source of the carbonaceous aerosol is biomass and fossil fuel combustion and automobile exhaust emissions and can also be produced in the processes of the secondary organic aerosol enrichment and conversion (Huang et al., 2014b). In Asia, the OC AOD showed obvious temporal and spatial distribution differences in that the regional average values were 0.029 in spring, 0.036 in summer, 0.019 in autumn, and 0.014 in winter, respectively. And the contents of BC were lower than that of OC, with 0.006 in spring, 0.008 in summer, 0.009 in autumn, and 0.007 in winter, respectively. From the view of spatial distribution, high values of OC and BC AOD were mainly found in regions with dense populations, such as SEA, SA, and EA. This phenomenon is related to the biomass burning of the crop residues, which releases carbonaceous aerosols that spread to the surrounding areas with turbulence and has profound effects on the regional climate (Jethva et al., 2019; Ding et al., 2021). Especially in SEA, biomass burning resulted in two distinct patterns of distribution for OC and BC AOD; that is, the BC and OC aerosols concentrated around the Southeast Asian Peninsula in winter and spring and around Indonesia in summer and autumn. In addition to this, natural wildfires are major emission sources of carbonaceous aerosols in NA, resulting in higher average values of OC (0.072) and BC (0.009) AOD in summer. This distinctive characteristic is well reflected and confirmed in the fire count data from MODIS observations, as shown in Fig. S2.
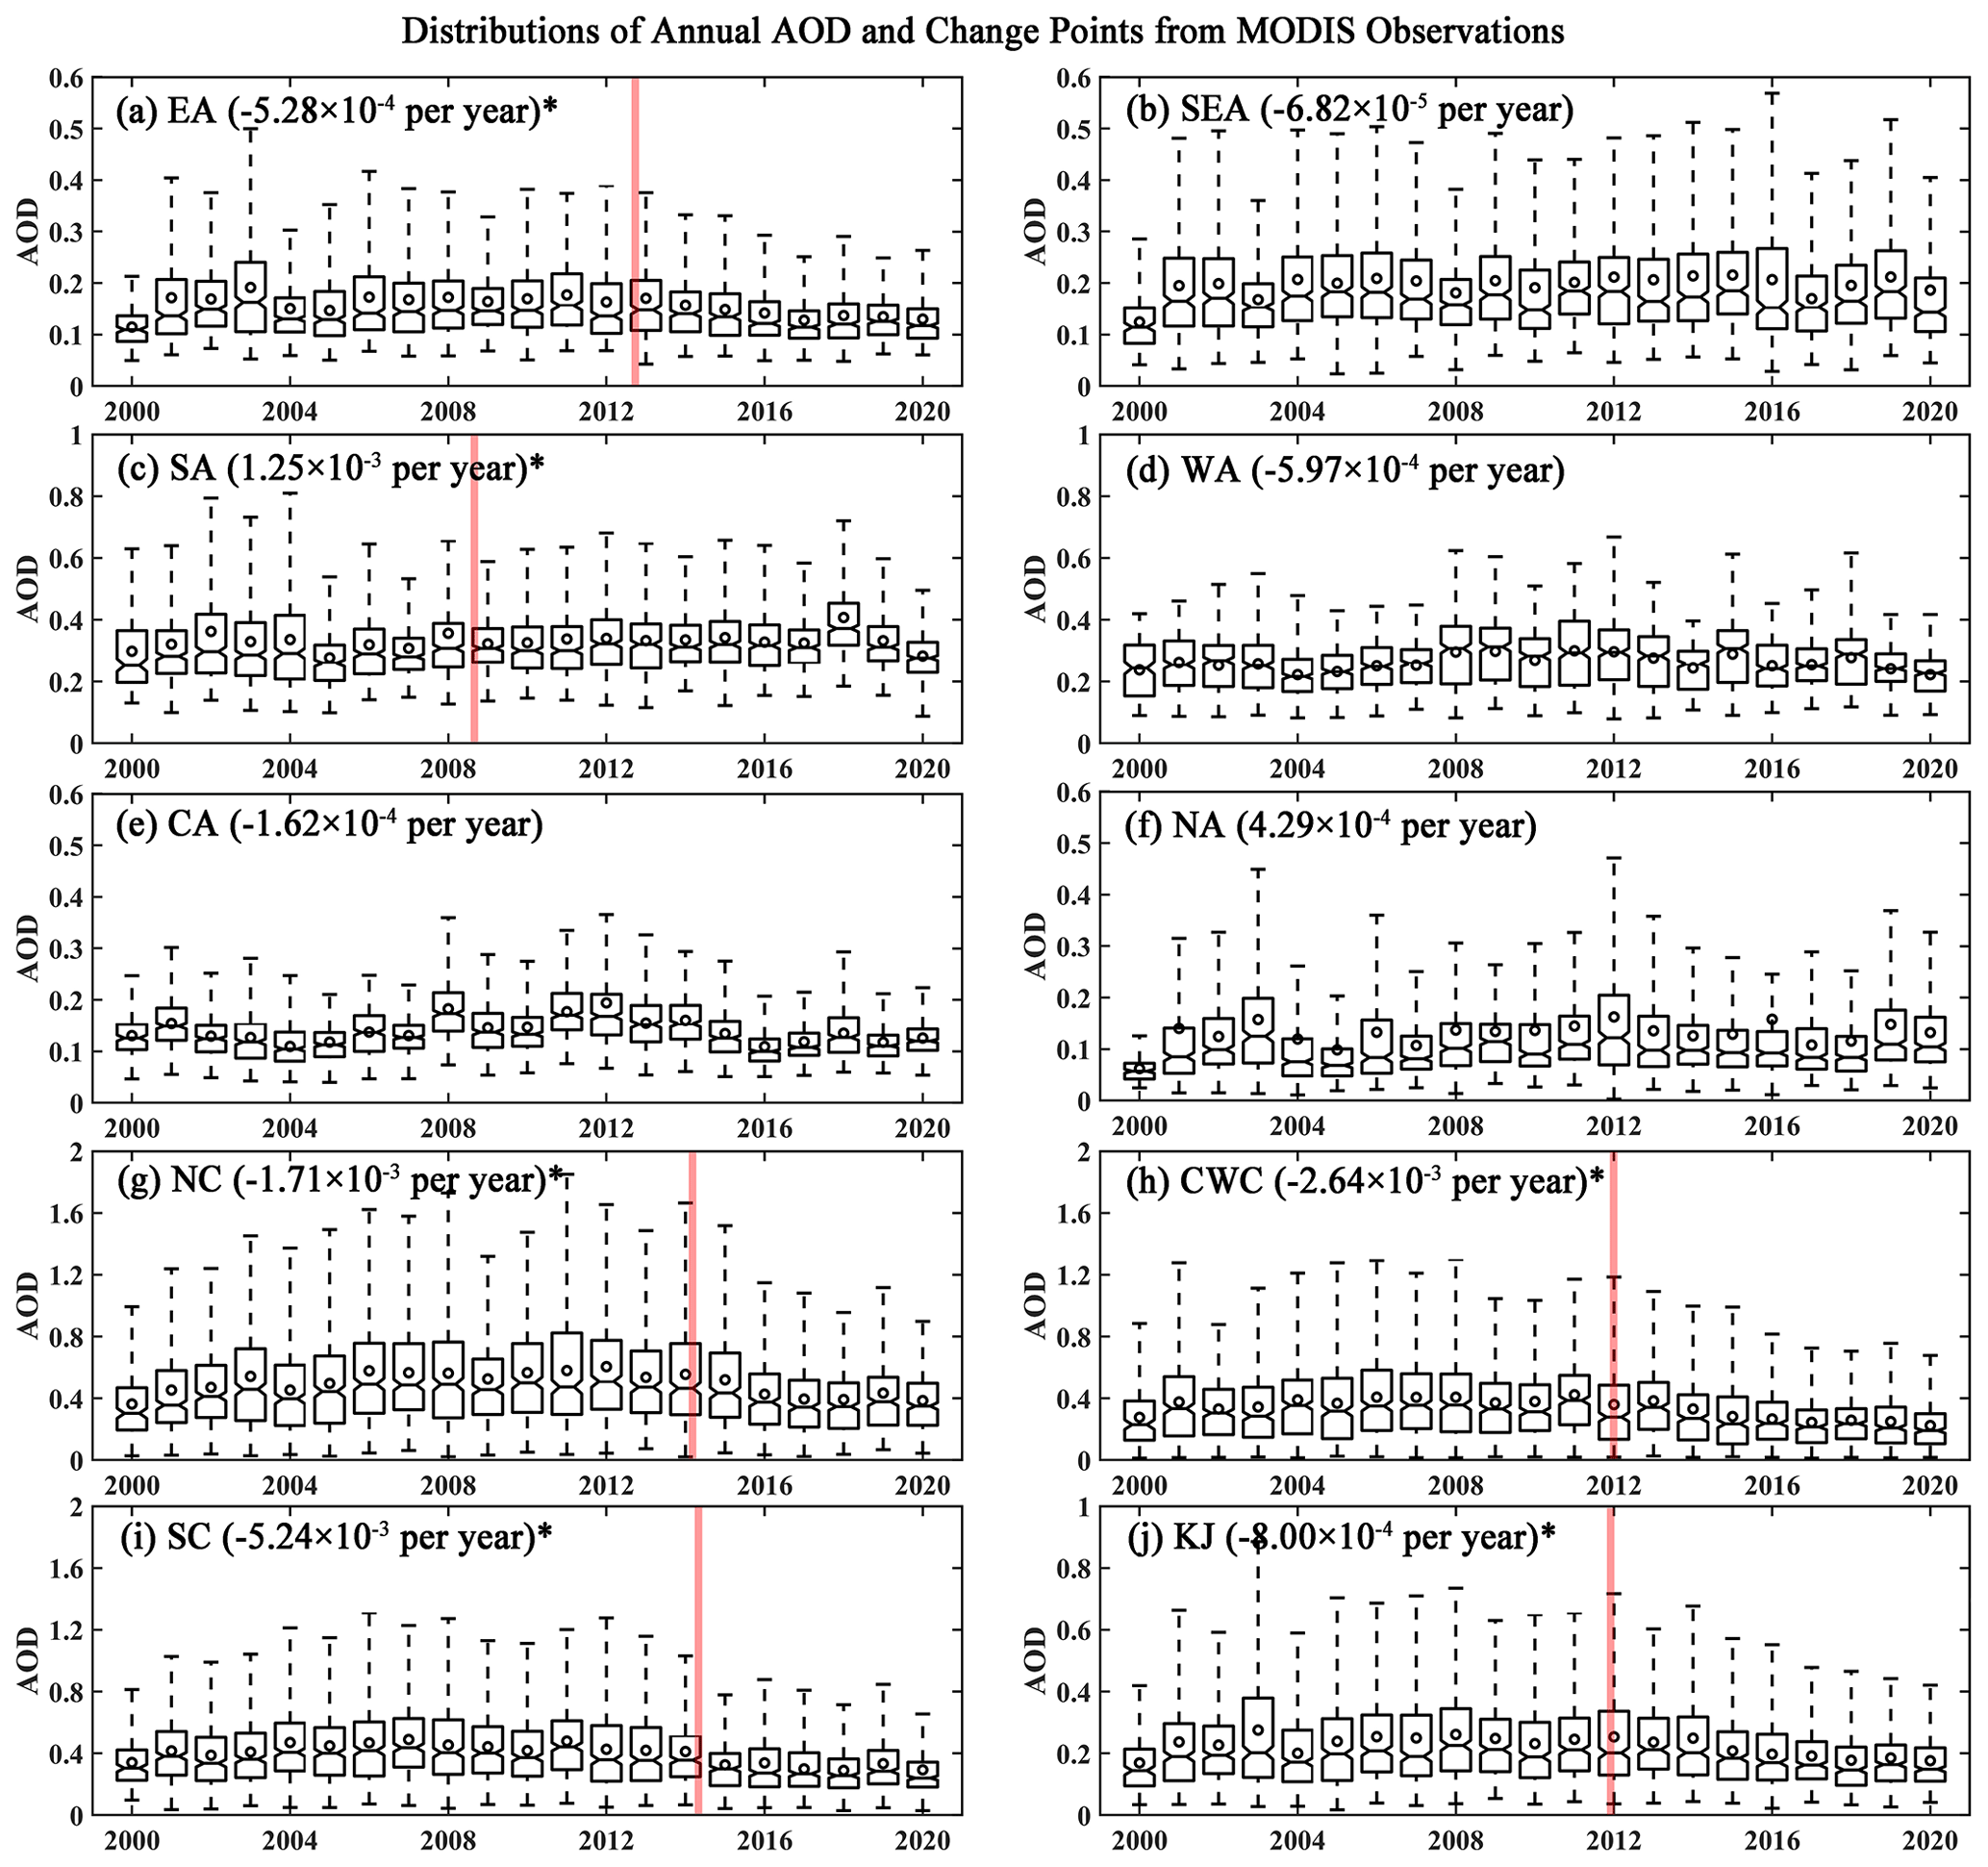
Figure 8Box plots of annual AOD variations and the change points calculated by TFPW-MK and Pettitt's method, based on MODIS DT and DB products. Trends (corrected Sen's slope) in different regions are shown in the top-left corner of the subplots, and their significances are indicated by asterisks∗ (p<0.05). Vertical red bars represent the years of change points which are detected by the Pettitt's method and pass the significance test.
To further estimate the composition of aerosols in different regions, the percentages of size-segregated and type-segregated AOD in the total AOD were calculated and are shown in Fig. 7. The percentages of SAOD, MAOD, and LAOD were calculated from the MISR observations, while the percentages of sulfate, dust, SS, OC, and BC AOD were calculated from the MERRA-2 reanalysis data, respectively. The size-segregated AOD fractions showed a consistent pattern in the study area in that the SAOD (52.8 %–76.4 %) contributed highly to the total AOD and comparatively to the MAOD (3.8 %–12.0 %) and LAOD (19.7 %–37.6 %). The average percentage of the SAOD fraction was the highest in NA (76.4 %), followed by SEA (67.3 %), and it was lower in SA (55.5 %) and WA (52.8 %). Given that the NA area has very low population density, the high SAOD fraction there is due to the atmospheric background aerosol and biomass emissions, without there being sources of large particles such as dust aerosol in the desert. In contrast, the highest percentage of MAOD (12.0 %) was found in SA, and the highest percentage of LAOD (37.6 %) was found in WA, showing the influence of dust and SS aerosol. In the meantime, the relative frequency of the SAOD and LAOD fractions also showed larger overlaps in SA and WA, suggesting that the origin of the two sizes of the aerosol particles probably had large seasonal variations. From the distributions of the percentages, this phenomenon can be due to the fact that monsoons can cause massive concentrations of large particles in the Persian Gulf coast and thus change the particle percentages in the surrounding areas in the summer (Mhawish et al., 2021).
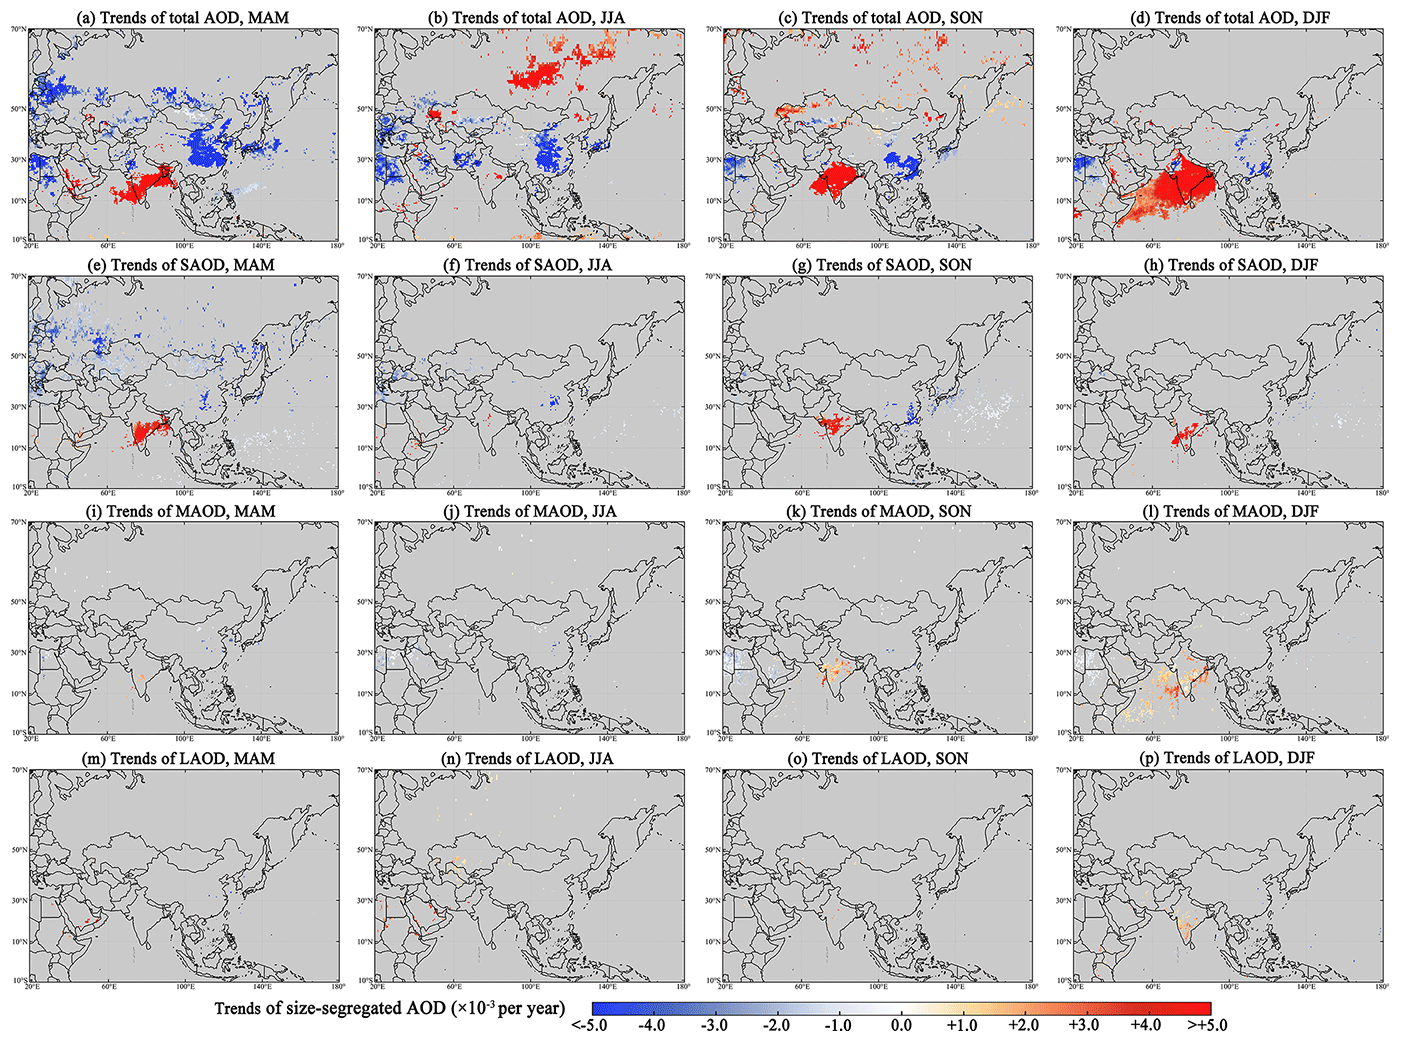
Figure 9Long-term trends of seasonal AOD, SAOD, MAOD, and LAOD in Asia from 2000 to 2020. The total AOD is from MODIS C6.1 DT and DB datasets, and the size-segregated AOD is from MISR V23 aerosol products. All the points shown in the figure have passed the FDR test (αFDR < 0.05). The grey colour indicates that the trend is not significant.
The complex aerosol characteristic in Asia is derived from multiple different emission sources and unique monsoon behaviour (Li et al., 2016). To further illustrate the differences in the aerosols, the type-segregated AOD percentages were also calculated. It was found that, for the whole of Asia, sulfate (50.0 %) aerosol is predominant, followed by the dust (24.8 %), OC (17.4 %), and BC (5.2 %), while the SS (2.6 %) aerosol showed the lowest percentage. Among them, and influenced by sources of dust in arid and semi-arid areas, the dust AOD in WA and CA is higher than other type-segregated AOD, with percentages of 61.3 % and 43.6 %, respectively. It needs to be pointed out that MERRA-2 reanalysis data will overestimate in dust sources in EA and underestimate in anthropogenic dust sources and remote regions (Han et al., 2022). Therefore, satellite data still show that these two regions are dominated by SAOD. A similarly high dust AOD was also found in SA (32.9 %). However, although it is greatly affected by dust aerosol, the SA area is still dominated by fine-mode particles due to intense anthropogenic emissions, such as sulfate, OC, and BC (Paliwal et al., 2016). For OC aerosol, the highest percentage appeared in NA (26.8 %), followed by SEA (24.3 %). This is in accordance with the extensive biomass burning events mentioned above. In contrast, the BC aerosol is more likely to be produced in fossil fuel combustion, and thus, in addition to biomass burning, BC is also high in areas with a high population density, such as SA (6.5 %) and EA (5.8 %). The sulfate aerosols are mainly derived from sulfides emitted during industrial production, and both SEA, EA, and NA have a similarly high sulfate percentage, with values ranging from 49.7 % to 49.9 %. Changes in the aerosol type can be reflected in the changes in ability of particles to absorb and scatter, as shown in Fig. S3, which displays the AAOD and SSA observed by AERONET sun–sky photometers. Aerosols from WA have the highest scattering ability (SSA > 0.96), corresponding to clean desert dust (Costa et al., 2006). In contrast, the high AAOD appeared in SA, SEA, and central China, with values from ∼ 0.03 to ∼ 0.06.
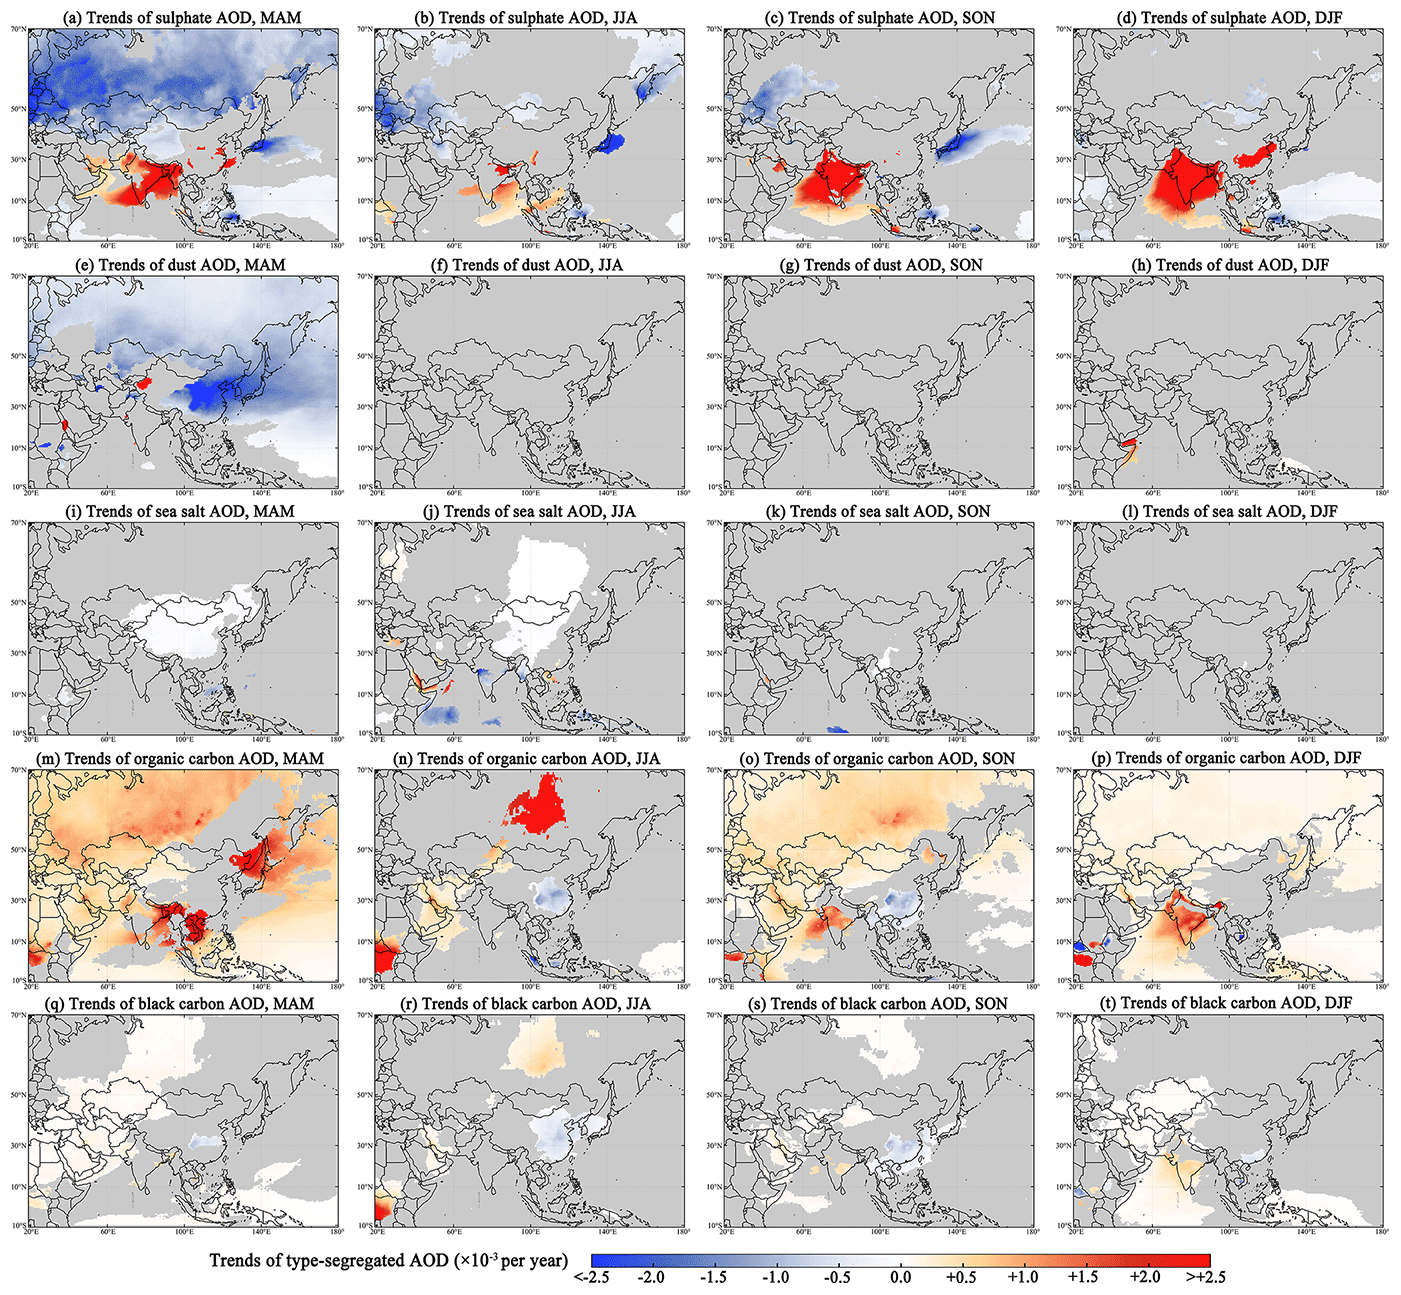
Figure 10Long-term trends of seasonal sulfate, dust, SS, OC, and BC AOD in Asia from 2000 to 2020. These type-segregated AODs are obtained from MERRA-2 reanalysis data. All the points have passed the FDR test (αFDR<0.05). The grey colour indicates that the trend is not significant.
4.3 Long-term trends of different aerosol sizes and types
To further study the evolution of aerosol in Asia, the trends and changes in the size-segregated and type-segregated aerosol were described on a spatial scale by using the TFPW-MK method and Pettitt change point test. The rate of change was calculated based on the variance-corrected Sen's slope, with units from each year. Figure 8 shows the trends and change points of AOD in different areas of Asia from the observations of MODIS. Among them, a significant increase in the trends in AOD were found in SA and NA, while a significant decrease in the trend was found only in EA. The largest increase in the AOD (1.25 × 10⁻³ per year) was in SA, which indicates the impact of the increase in human activity and anthropogenic emissions in densely populated areas. Here, it must be clarified that the AOD trend reported in Fig. 8 seems to be obviously less than reported in other recent studies (Mhawish et al., 2021; Gupta et al., 2022; Huang et al., 2021). On the one hand, this is because the methods of the geometric mean and variance-corrected Sen's slope completely remove the residual autocorrelation component of the trend while reducing the weight of the high AOD value in the air pollution event. On the other hand, trends within different pixels over a large range may be opposite and will cancel out statistically. For example, in SA, the AOD showed highly increasing trends in central and southern India, but it had decreasing trends around Pakistan. In contrast, the increasing trend of AOD found in NA (4.29 × 10⁻⁴ per year) was most probably due to biomass emissions, since wildfires are a major local source of aerosols. The AOD change in EA was notable, as this was the only area where a decrease (−5.28 × 10⁻⁴ per year) in AOD was observed in Asia. In particular, the significant decreases in AOD were observed in each subregion of EA (Fig. 8g–j). The fastest decrease was found in SC (−5.24 × 10⁻³ per year), followed by CWC (−2.64 × 10⁻³ per year) and NC (−1.71 × 10⁻³ per year), and the slowest was in KJ (−8.00 × 10⁻⁴ per year). This meant that the decrease in aerosol loadings in EA and even in Asia is mainly contributed by China. This phenomenon of the rapid decrease in AOD over China has been widely reported (Shi et al., 2020; Zhang et al., 2018; Xie et al., 2019), and it is mostly attributed to a series of effective emission reduction measures, such as dust removal in industrial production, coal-fired power plant denitrification, and restrictions on straw burning (Mao et al., 2014). The change point showed that the responses of AOD to the policy-based emission reductions appeared in 2014, 2012, and 2014 in NC, CWC, and SC, respectively, whereas before that, due to rapid economic development, China's aerosols showed an upward trend from 2000 to 2010 (Luo et al., 2014). The trends before and after the change points can be found in Table S1, with references.
To further investigate the changes in the aerosol in Asia, spatial distributions of the long-term trends of AOD, SAOD, MAOD, and LAOD were calculated in different seasons and are shown in Fig. 9. The AOD, SAOD, MAOD, and LAOD exhibited obviously positive trends over most regions of SA during spring, autumn, and winter. The increased summer trend of AOD was the weakest in SA, and the main source of the contributions was SAOD. This can be attributed to the action of the southwestern monsoon in summer (Li et al., 2016), which brings dust and SS aerosols and takes away the increasing number of fine particles emitted by humans in the meantime. The obviously positive trend of AOD in summer was widely found in NA, which was in accordance with the wildfire events. In addition, some regions in WA and CA also showed significantly positive trends of AOD. This is mainly caused by the increase in the larger aerosol particles. As mentioned before, the reduction in the aerosols in EA is a phenomenon that is worthy of attention. The largest decrease in AOD of EA was in the spring (−2.98 × 10⁻³ per year), followed by summer (−1.29 × 10⁻³ per year), while no significant decrease in AOD was found in autumn and winter. Furthermore, compared with other seasons, the decrease in AOD was also accompanied by decreases in the SAOD, MOD, and LAOD in the spring of EA, revealing that the fine particles were reduced, while the transport of dust was well controlled. More specifically, the pronounced reduction in SAOD was in CWC (−1.12 × 10⁻³ per year) and SC (−2.53 × 10⁻³ per year). And the regions with obvious reductions in the large particle size were the NC and SC, with LAOD trends of −3.70 × 10⁻⁴ per year and −3.87 × 10⁻⁴ per year, respectively. This means that the eastward transportation of spring dust has been greatly suppressed in China in recent years. In contrast, the decrease in AOD for EA was mainly only due to the small-sized particles (SAOD) in summer, which contributed to ∼ 90 % of the total AOD decrease. In addition, the trend estimated from MISR is generally smaller than the real value, which is due to the underestimation of AOD by the MISR operational aerosol products under heavy loading aerosol conditions.
The long-term trends of different aerosol types can greatly explain and enhance the understanding of the regional aerosol source changes. As shown in Fig. 10, the trends of five types (sulfate, dust, SS, OC, and BC) of AOD were estimated by using MERRA-2 reanalysis data from 2000 to 2020. Compared with satellite aerosol products, the trends calculated by the MERRA-2 product are more consistent. It was found that the largely positive trend of AOD in SA was mainly from increasing sulfate (1.09 × 10⁻³ per year), OC (2.68 × 10⁻⁴ per year), and BC (5.38 × 10⁻⁵ per year). And the positive trend of AOD in NA was mainly owing to OC (2.71 × 10⁻⁴ per year) and BC (1.92 × 10⁻⁵ per year). These findings confirmed the previous speculation on the increases in AOD, which are derived from industrial development and anthropogenic emissions in SA and from widespread wildfires in NA, respectively. In contrast, the negative trend of AOD in EA was observed with decreasing dust, SS, and BC aerosols. More specifically, a similar pattern was found in NC, CWC, and SC, indicating that sulfate AOD increased and other (dust, SS, OC, and BC) AOD decreased, whereas in KJ, the sulfate AOD was also found to decrease, while the change in OC was not significant. In general, from the perspective of the statistics in Asia, the sulfate (−1.04 × 10⁻⁴ per year), dust (−9.22 × 10⁻⁵ per year), and SS (−1.69 × 10⁻⁵ per year) AOD decreased, while OC (2.00 × 10⁻⁴ per year) and BC (2.20 × 10⁻⁵ per year) AOD increased. The growth of carbonaceous aerosols such as OC and BC becomes a feature of the Asian region. However, it is particularly important to note that, in the context of the growth of carbonaceous aerosols such as OC and BC, only the region of China has decreased in OC and BC.
Figure 11 shows the percentage of change in different AOD sizes and types from 2000 to 2020, which was used to study the extent of the changes in the aerosol environment in various regions of Asia. Compared with the value of the trends, the percentage can more intuitively show the change result of aerosol. For the Asian region, the percentage of SAOD (−3.34 %), sulfate AOD (−3.07 %), dust AOD (−5.51 %), and SS AOD (−9.80 %) decreased, whereas the percentage of OC AOD (17.09 %), and BC AOD (6.23 %) increased. The increases in OC and BC were notable in Asia, and this phenomenon was mainly and specifically due to the increases in OC and BC in SA (13.25 % and 6.19 %), WA (37.45 % and 11.40 %), CA (35.64 % and 13.30 %), and NA (13.47 % and 6.62 %), respectively. SA was the region with the most consistent change in aerosols, with almost all types of aerosols showing increasing trends, whereas SEA was the region with the least change in aerosols, with only a decrease in the SS AOD (−4.78 %). However, the different aerosols in EA were almost all showing downward trends. Although increases in sulfate AOD were also observed in NC (7.06 %), CWC (8.18 %), and SC (6.84 %), due to the offset from other types of aerosols, the total AOD was still on a downward trend in general. Among them, the percentage of OC AOD decreased the most in CWC (−6.39 %), while the percentage of BC AOD decreased the most in SC (−9.11 %). The above analyses reveal the long-term changes in size-segregated and type-segregated AOD from different perspectives and in particular expose a strong contrast; that is, OC and BC AOD decrease in EA but increase widely in other regions of Asia from 2000 to 2020. The percent changes in the size-segregated and type-segregated AOD are shown in Table 2 in detail.
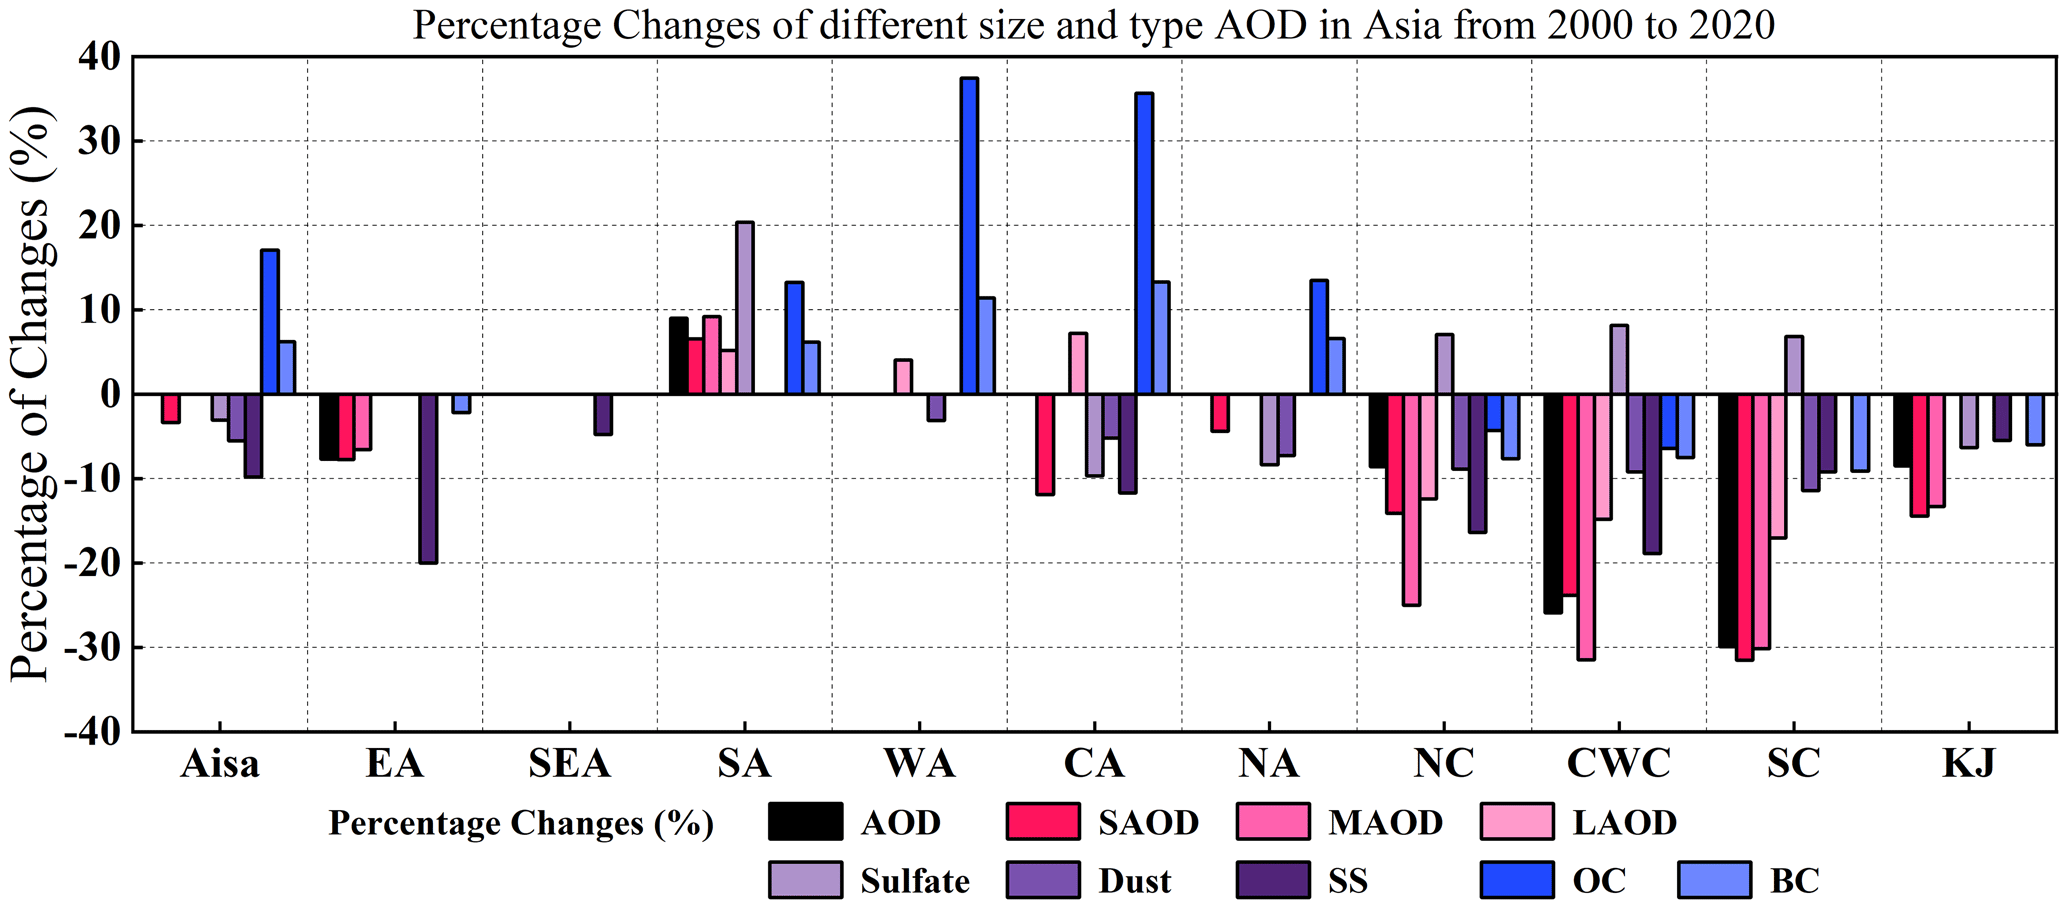
Figure 11Total percent changes in different AOD sizes and types from 2000 to 2020. Only trends that pass the significance test (p<0.05) are displayed in this figure.
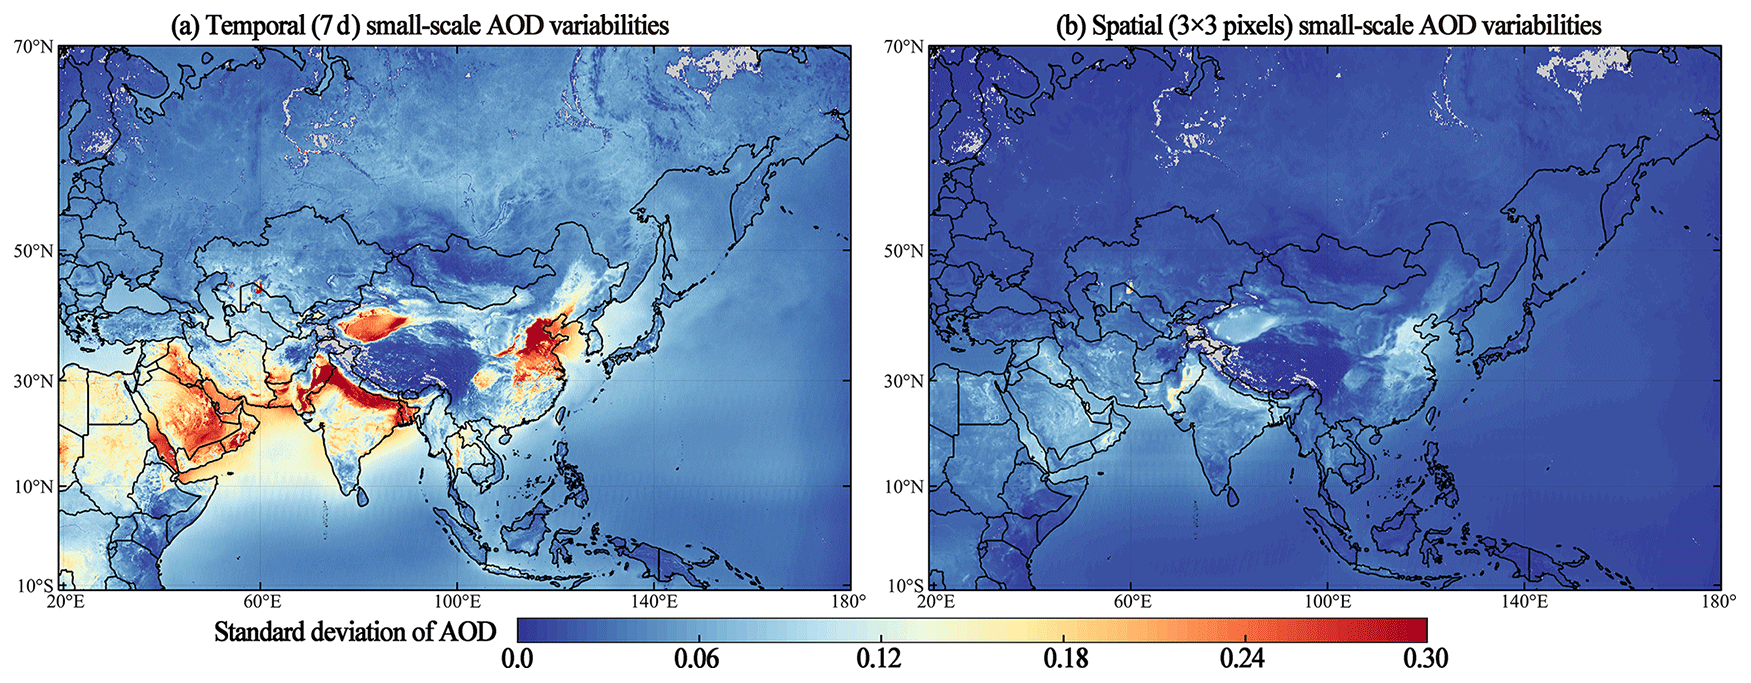
Figure 12Temporal and spatial small-scale variabilities in the AOD. The temporal standard deviation of AOD was calculated in a range of 7 d, while the spatial standard deviation of AOD was calculated by a 3 × 3 pixel sliding window.
Table 2Change percentages (%) of AOD with different sizes and types in various regions of Asia from 2000 to 2020.
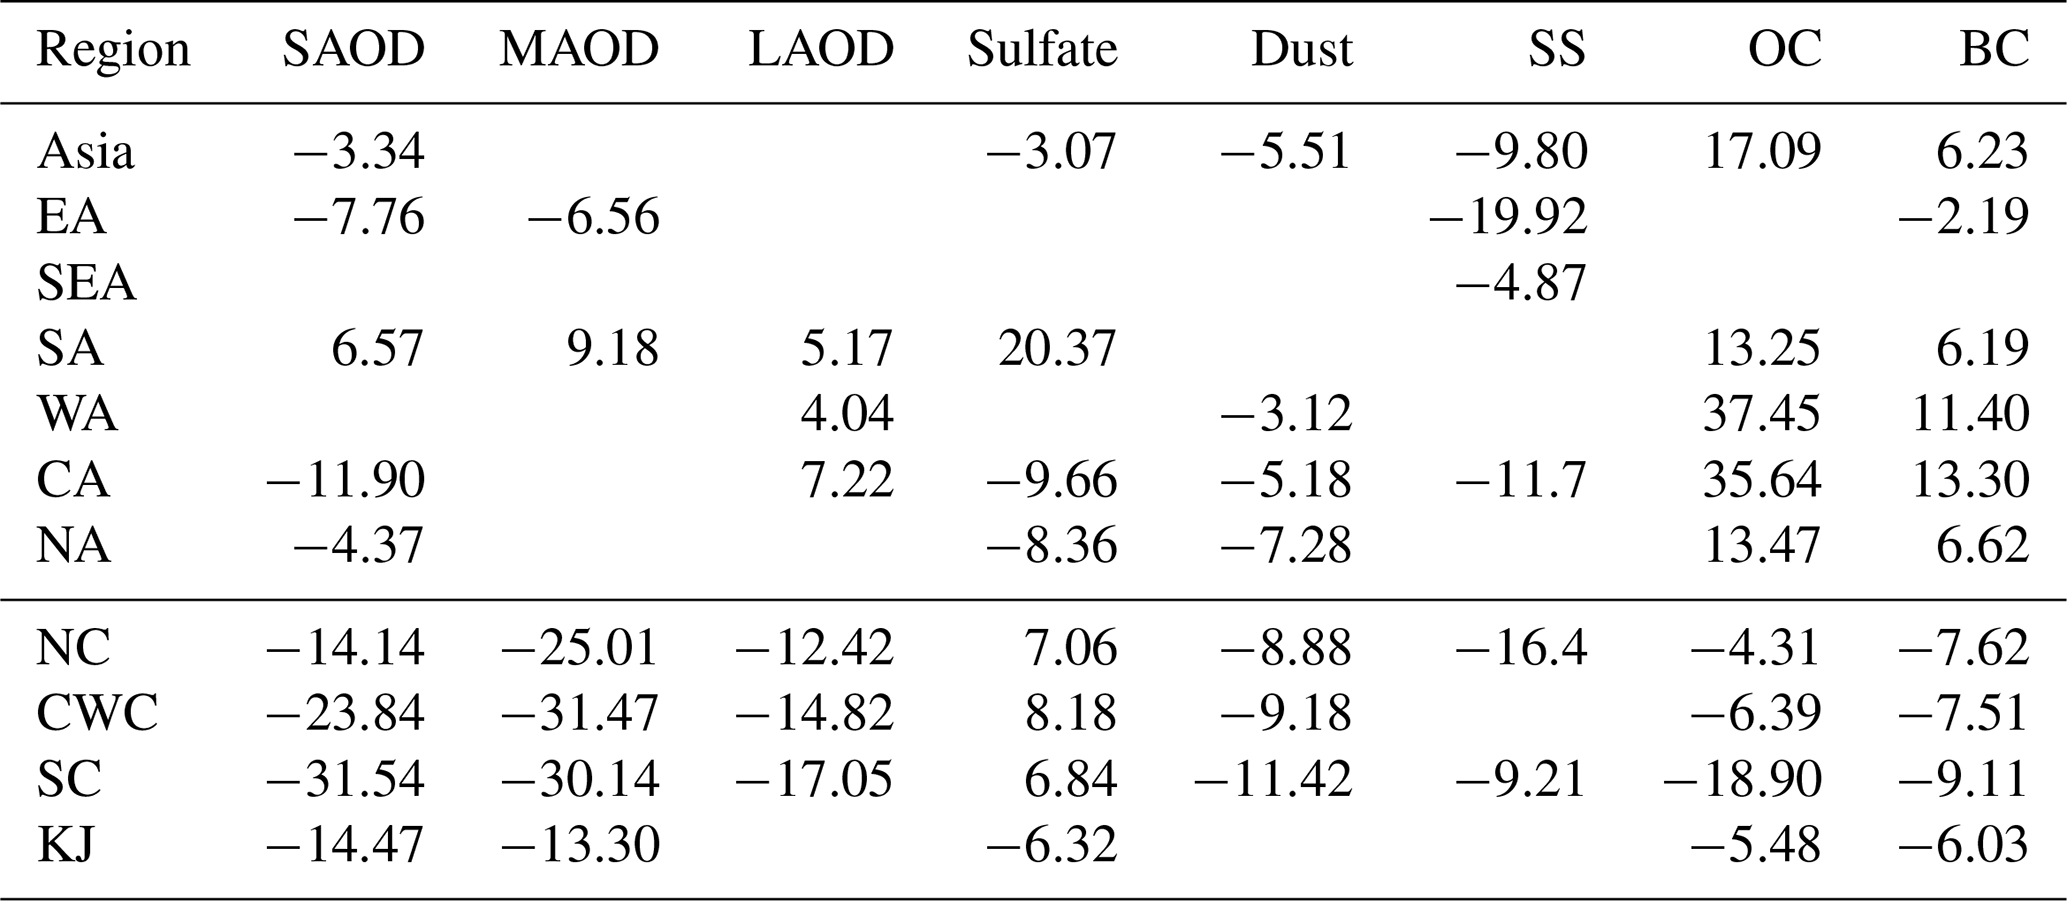
Note that only the trends that pass the significance test (p<0.05) are shown.
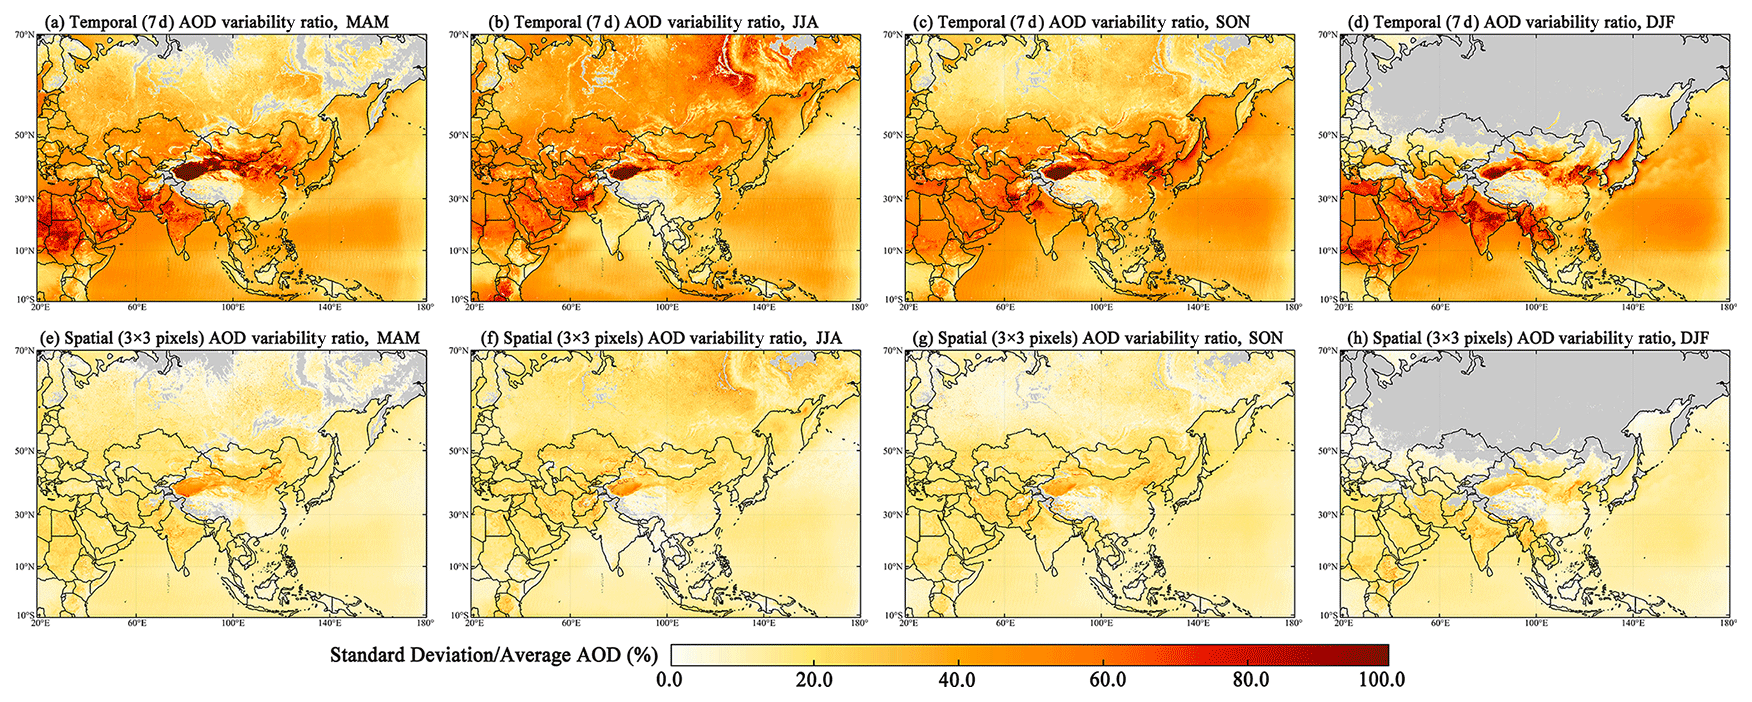
Figure 13Temporal and spatial small-scale relative variabilities in the AOD (standard deviation/average AOD). The temporal standard deviation of AOD was calculated in a range of 7 d, while the spatial standard deviation of AOD was calculated by a 3 × 3 pixel sliding window.
4.4 Variabilities in AOD in small temporal and spatial scales
The long-term analysis reveals the spatial distributions and the time series changes in the different aerosol sizes and types, which can help us to understand the aerosol evolution over these 2 decades. The small-scale variability shows the changes in the aerosols in a short period of time or space, which can reflect the stability of local aerosol emissions and identify sudden pollution events and compensate for the suppression of heavy pollution events by the geometric mean method. From the perspective of aerosol retrieval, the variability in the aerosol can also act as a constraint on the multi-pixel inversion algorithm, which was not widely considered and discussed. Figure 12 shows the temporal and spatial small-scale variabilities in the AOD (standard deviations). It must be pointed out that the study of small-scale variability in the AOD is based more on the significance of the statistic than physics. It was found that the calculated temporal variability was much greater than the spatial variability, since the aerosols are usually more uniform in the spatial distribution. But the distributions calculated by the two methods were similar, namely that s high variability occurred in densely populated areas with high AOD (EA and SA) and in arid areas affected by dust aerosols (Taklimakan Desert, CA, and WA). Additionally, the temporal variability also captured the seasonal increase in AOD in SEA (mainly due to combustion), whereas this was almost not reflected in the spatial variability.
Figure 13 shows the temporal and spatial relative AOD variabilities (standard deviation/average AOD) in different seasons to further study the small-scale changes in aerosol. When compared with the AOD standard deviation, the relative variabilities in the AOD can better show the degree of dispersion of the data and be compared in regions with different AOD values. The high values of relative AOD variabilities generally appeared in areas affected by dust aerosol, such as WA, CA, SA, and northwestern China. Among them, the highest AOD relative variability occurred in northwestern China in the spring, and a long strip can be observed from the Taklimakan Desert in eastern China, suggesting the presence of a dust transport event under the action of the prevailing westerlies (Han et al., 2022). This phenomenon was also captured in the spatial relative AOD variability. During summer, an abnormally high value of relative AOD variability was found in NA, while the AOD value obtained from MODIS (such as in Fig. 5) did not increase significantly when compared with other seasons in this region. The reason for this phenomenon is that the summer wildfires in NA (contribution of ∼ 17.33 % in total Asia) are sporadic natural emission events which hardly cause changes in long-term average seasonal AOD. However, the temporary AOD changes caused by wildfires in NA were correctly captured by the relative AOD variabilities, which was also consistent with the higher OC and BC in the MERRA-2 data. In contrast, biomass burning in spring and autumn in SEA did not lead to dramatic changes in the relative AOD variability. This means that the aerosols in this region are dominated by long-term and stable burning events. The above finding shows that the abnormal increase in relative AOD variability has the potential to help find some natural emission events. It also implies that when smoothing or constraining the inversion of satellite aerosol parameters, then regions which have different AOD deviations should be given the appropriate weighting to reduce possible new errors while retaining features.
When we turn our attention to areas with high AOD values, especially in China, it can be found that when the percentage of different AOD sizes and types is close, then the relative AOD variability can be observed to vary. From Fig. 12, in all seasons, the relative AOD variability in NC centred on Beijing was always significantly higher than that in CWC and SC. Moreover, two patches of high AOD values in the Sichuan Basin and Jianghan Plain could be clearly seen in the AOD distribution map, but these were not captured on the relative AOD variability distribution map. This is consistent with our previous finding (Zhang et al., 2021) that the air pollution events in Beijing are affected by significant external sources, such as northern dust transportation or the migration of pollutants from the south under abnormal climate conditions. In contrast, cities in central China are in the centre of the pollution circle, and aerosols are less affected by circulation with a more stable distribution. Interestingly, a similar phenomenon was observed in the plains of northern SA, where the value of AOD was high, but the relative AOD variability was lower than that of southern SA and EA, revealing a relatively stable aerosol environment. The relative AOD variability provides another perspective with which to analyse the aerosol variation and improves our understanding of regional aerosol characteristics.
Distributions, long-term trends, and small-scale variabilities in the aerosol particles with different sizes and types can reveal the aerosol environmental characteristics in a region, which is also meaningful to help improve the understanding of the impact of aerosols on climate change, ecology, and public health. However, the attention given to hot spots like Asia is not enough, and the perspective and depth of analysis can be further explored. In this study, multi-source aerosol products, including the ground-based observations (AERONET), satellites (MODIS and MISR), and reanalysis datasets (MERRA-2) were used for comprehensive aerosol properties. The geometric mean method (Sayer and Knobelspiesse, 2019), modified TFPW-MK test (Collaud Coen et al., 2020), and Pettitt change point test were applied to reappraise the long-term trends and patterns of aerosols from a wide variety of angles. Additionally, we proposed a novel indicator for describing the small-scale variability in the aerosols by calculating the standard deviation of AOD within a short period of time or space. This indicator can compensate for the suppression of extreme event weights by the geometric mean and complement the aerosol stability features that are often ignored in long time series analysis. In the meantime, the small-scale variability in the aerosols can also act as an important prior constraint in advanced multi-pixel aerosol retrieval algorithms, which is usually ignored and not discussed in previous research. The main conclusions of this study are as follows:
-
The MISR aerosol products perform best under clear-air conditions (AOD < 0.25) but show increasing underestimation as AOD increases, especially in heavily polluted areas. This may be due to inappropriate aerosol models and an erroneous estimation of the surface reflectance that is impacted by the reduced surface reflectance contrast at different angles and spectra at high AOD loading conditions. This means that the quantitative assessments of distributions and trends of SAOD, MAOD, LAOD are also likely to be underestimated.
-
Aerosols over land are dominated by fine particles in Asia. Specifically, the SAOD over land reaches its maximum in spring (0.094), followed by summer (0.076), and is lowest in winter (0.069) and autumn (0.059). The MAOD mostly distributes over the sea, with very few cases over land, with a mean value of ∼ 0.008 and a small variation (± 0.004) in a year. The annual mean value of LAOD is 0.033, showing a large variation that depends on the source area of dust in Asia and the transmission during the monsoon season. The largest value of LAOD is found in SA (0.075), and the highest percentage of LAOD is in WA (37.6 %).
-
Different types of aerosols are highly dependent on the regional environment and emissions. The highest average value of sulfate AOD is found in SA (0.113), followed by EA (0.086), thus showing its association with a dense human population, whereas the peak value of the sulfate AOD is of EA in eastern China (> 0.4), where China's economy is growing rapidly. The dust aerosol mainly appears in dust source regions such as WA, CA, and northwestern China. The most SS aerosol is distributed over the sea, but one exception is that SS and dust aerosols will accumulate in the Arabian Sea with the summer monsoon and invade the coastal areas around SA and WA. The OC and BC aerosols are usually produced by combustion and concentrated over EA, SA, and SEA. In addition, due to the influence of wildfire events, high values of OC and BC AOD are also found in NA in summer, and this results in a ∼ 10 % increase in the average OC AOD in the Asian summer.
-
EA and SA emphasize two distinct contrasts in the analysis of the long-term trends of aerosols over Asia. One is that the fastest growth of AOD appears in SA (1.25 × 10⁻³ per year), whereas the highest decrease in AOD is found in EA (−5.28 × 10⁻⁴ per year), though both regions are densely populated. Among these regions, the AOD growth in SA is mainly before 2009, while the AOD decrease in EA is around after 2013. Another is that an increase in carbonaceous aerosol is widely observed in Asia, with trends in the OC and BC AOD of 2.00 × 10⁻⁴ units per year (17.09 %) and 2.20 × 10⁻⁵ units per year (6.23 %), respectively. EA is an exception because OC and BC AOD have decreasing trends, especially in central and eastern China.
-
In the last 2 decades, from the perspective of trend, decreases in aerosol have been offsetting earlier increases in anthropogenic emissions over Asia. From 2000 to 2020, the percentage of SAOD decreases by −3.34 % and the percentage of LAOD increases equivalently in Asia. From the perspective of the type-segregated AOD, the percentage of sulfate, dust, and SS AOD decrease by −3.07 %, −5.51 %, and −9.80 %, respectively. And the decreases in sulfate and dust aerosols are mainly from NA and the northern part of China, respectively. In contrast, the OC and BC increase by 17.09 % and 6.23 %, respectively. The highest increase in OC was mainly from SEA in spring, NA in summer, and SA in winter, respectively, and the wildfire events in NA contribute ∼ 17.33 % to the total increase in the OC AOD in summer.
-
The small-scale variabilities in the AOD at a temporal scale (7 d) are much higher than that at a spatial scale (3 × 3 pixels), and the high values are mainly found in regions with high AOD, such as EA and SA, and dust source regions, such as WA and the Taklimakan Desert. The increases in the relative AOD variabilities can imply the presence of natural aerosol emissions, such as dust transport events under the action of the prevailing westerlies in northern China and anomalous wildfire events in NA, which are difficult to observe only from the seasonal distributions of AOD. In addition, in the same AOD high-value areas, the relative AOD variability in NC is also significantly higher than that of CWC, SC, and northern SA. This means that the AOD in NC fluctuates strongly; in contrast, the aerosol changes in CWC, SC, and northern SA are more stable, showing persistent air pollution.
This study provides comprehensive insight into the distribution and trends of different sizes and types of aerosol loadings in regions of Asia by combining data from ground-based stations, satellite observations, and reanalysis data. A novel perspective of the small-scale variabilities in the AOD is proposed to study the changes in the aerosol in a short period of time or space, which will reflect the degree of aerosol oscillation, imply natural aerosol emission events and is expected to be used as a useful prior constraint for advanced multi-pixel retrieval algorithms. Therefore, the above findings greatly improve and complete our understanding of the aerosol environment and climatology in Asia.
The global gridded digital elevation data were from https://doi.org/10.5285/f98b053b-0cbc-6c23-e053-6c86abc0af7b (GEBCO Bathymetric Compilation Group 2023, 2023). The population density data were from https://doi.org/10.48690/1524213 (Rose et al., 2019). The active fire counts data were from https://firms.modaps.eosdis.nasa.gov/ (NASA, 2023b).
The MODIS (https://doi.org/10.5067/MODIS/MOD04_L2.061, Levy, R., Hsu, C., et al., 2015) and MISR (https://doi.org/10.5067/TERRA/MISR/MIL2ASAE_L2.003-23; NASA/LARC/SD/ASDC, 1999) aerosol products were obtained from https://search.earthdata.nasa.gov/ (EarthData, 2023; Levy et al., 2013; Garay et al., 2020). The MERRA-2 aerosol products were obtained from https://doi.org/10.5067/FH9A0MLJPC7N (GMAO, 2015). The AERONET measurements were from https://aeronet.gsfc.nasa.gov/new_web/download_all_v3_aod.html (NASA, 2023a). Data on the Wuhan site can be provided by the corresponding authors upon request.
The supplement related to this article is available online at: https://doi.org/10.5194/acp-23-8187-2023-supplement.
SKJ and YYM designed the study, performed the analysis, and prepared the draft. BML, HL, WWY, and RNF collected the experimental data. ZWH and JPH reviewed the paper and gave advice. WG and YYM supplied the site data and funding.
At least one of the (co-)authors is a member of the editorial board of Atmospheric Chemistry and Physics. The peer-review process was guided by an independent editor, and the authors also have no other competing interests to declare.
Publisher’s note: Copernicus Publications remains neutral with regard to jurisdictional claims in published maps and institutional affiliations.
We are very grateful to the MISR, MODIS, MERRA-2 team, and AERONET principal investigators and site managers for kindly providing the valuable data. We would like to thank all those involved in the maintenance of the site at Wuhan University, and finally, we also appreciate the two anonymous reviewers for their constructive and meaningful comments.
This study has been supported by the National Key Research and Development Program of China (grant no. 2018YFB0504500), the National Natural Science Foundation of China (grant nos. 41875038, 42071348, and 42001291), the Key research and development projects in Hubei province (grant no. 2021BCA220), and LIESMARS Special Research Funding.
This paper was edited by Philip Stier and reviewed by two anonymous referees.
Alexander, B., Park, R. J., Jacob, D. J., Li, Q. B., Yantosca, R. M., Savarino, J., Lee, C. C. W., and Thiemens, M. H.: Sulfate formation in sea-salt aerosols: Constraints from oxygen isotopes, J. Geophys. Res.-Atmos., 110, D10307, https://doi.org/10.1029/2004JD005659, 2005.
Alexandersson, H. and Moberg, A.: Homogenization of Swedish Temperature Data. Part i: Homogeneity Test for Linear Trends, Int. J. Climatol., 17, 25–34, https://doi.org/10.1002/(SICI)1097-0088(199701)17:1<25::AID-JOC103>3.0.CO;2-J, 1997.
Ali, M. A., Bilal, M., Wang, Y., Qiu, Z., Nichol, J., Mhawish, A., de Leeuw, G., Zhang, Y., Shahid, S., Almazroui, M., Islam, M., Rahman, M., Mondal, S., Tiwari, P., and Khedher, K.: Spatiotemporal changes in aerosols over Bangladesh using 18 years of MODIS and reanalysis data, J. Environ. Manage., 315, 115097, https://doi.org/10.1016/j.jenvman.2022.115097, 2022.
Anderson, R. L.: Distribution of the Serial Correlation Coefficient, The Ann. Mathem. Stat., 13, 1–13, https://doi.org/10.1214/aoms/1177731638, 1942.
Ångström, A.: The Parameter of Atmospheric Turbidity, Tellus, 16, 64–75, https://doi.org/10.3402/tellusa.v16i1.8885, 1964.
Benjamini, Y. and Hochberg, Y.: Controlling the False Discovery Rate: A Practical and Powerful Approach to Multiple Testing, J. Roy. Stat. Soc. B, 57, 289–300, https://doi.org/10.1111/j.2517-6161.1995.tb02031.x, 1995.
Bi, J. R., Huang, J. P., Hu, Z. Y., Holben, B. N., and Guo, Z. Q.: Investigating the aerosol optical and radiative characteristics of heavy haze episodes in Beijing during January of 2013, J. Geophys. Res.-Atmos., 119, 9884–9900, https://doi.org/10.1002/2014jd021757, 2014.
Boer, G. J.: Changes in Interannual Variability and Decadal Potential Predictability under Global Warming, J. Climate, 22, 3098–3109, https://doi.org/10.1175/2008jcli2835.1, 2009.
Buchard, V., Randles, C. A., da Silva, A. M., Darmenov, A., Colarco, P. R., Govindaraju, R., Ferrare, R., Hair, J., Beyersdorf, A. J., Ziemba, L. D., and Yu, H.: The MERRA-2 Aerosol Reanalysis, 1980 Onward. Part II: Evaluation and Case Studies, J. Climate, 30, 6851–6872, https://doi.org/10.1175/jcli-d-16-0613.1, 2017.
Che, H., Xia, X., Zhu, J., Li, Z., Dubovik, O., Holben, B., Goloub, P., Chen, H., Estelles, V., Cuevas-Agulló, E., Blarel, L., Wang, H., Zhao, H., Zhang, X., Wang, Y., Sun, J., Tao, R., Zhang, X., and Shi, G.: Column aerosol optical properties and aerosol radiative forcing during a serious haze-fog month over North China Plain in 2013 based on ground-based sunphotometer measurements, Atmos. Chem. Phys., 14, 2125–2138, https://doi.org/10.5194/acp-14-2125-2014, 2014.
Che, H. Z., Zhang, X. Y., Chen, H. B., Damiri, B., Goloub, P., Li, Z. Q., Zhang, X. C., Wei, Y., Zhou, H. G., Dong, F., Li, D. P., and Zhou, T. M.: Instrument calibration and aerosol optical depth validation of the China Aerosol Remote Sensing Network, J. Geophys. Res.-Atmos., 114, 12, https://doi.org/10.1029/2008jd011030, 2009.
Chen, C., Dubovik, O., Fuertes, D., Litvinov, P., Lapyonok, T., Lopatin, A., Ducos, F., Derimian, Y., Herman, M., Tanré, D., Remer, L. A., Lyapustin, A., Sayer, A. M., Levy, R. C., Hsu, N. C., Descloitres, J., Li, L., Torres, B., Karol, Y., Herrera, M., Herreras, M., Aspetsberger, M., Wanzenboeck, M., Bindreiter, L., Marth, D., Hangler, A., and Federspiel, C.: Validation of GRASP algorithm product from POLDER/PARASOL data and assessment of multi-angular polarimetry potential for aerosol monitoring, Earth Syst. Sci. Data, 12, 3573–3620, https://doi.org/10.5194/essd-12-3573-2020, 2020.
Collaud Coen, M., Andrews, E., Bigi, A., Martucci, G., Romanens, G., Vogt, F. P. A., and Vuilleumier, L.: Effects of the prewhitening method, the time granularity, and the time segmentation on the Mann–Kendall trend detection and the associated Sen's slope, Atmos. Meas. Tech., 13, 6945–6964, https://doi.org/10.5194/amt-13-6945-2020, 2020.
Costa, M. J., Sohn, B. J., Levizzani, V., and Silva, A. M.: Radiative forcing of Asian dust determined from the synergized GOME and GMS Satellite data – A case study, J. Meteorol. Soc. JPN, 84, 85–95, https://doi.org/10.2151/jmsj.84.85, 2006.
Diner, D. J., Beckert, J. C., Reilly, T. H., Bruegge, C. J., Conel, J. E., Kahn, R. A., Martonchik, J. V., Ackerman, T. P., Davies, R., Gerstl, S. A. W., Gordon, H. R., Muller, J. P., Myneni, R. B., Sellers, P. J., Pinty, B., and Verstraete, M. M.: Multi-angle Imaging SpectroRadiometer (MISR) – Instrument description and experiment overview, IEEE T. Geosci. Remote, 36, 1072–1087, https://doi.org/10.1109/36.700992, 1998.
Ding, K., Huang, X., Ding, A., Wang, M., Su, H., Kerminen, V. M., Petaja, T., Tan, Z., Wang, Z., Zhou, D., Sun, J., Liao, H., Wang, H., Carslaw, K., Wood, R., Zuidema, P., Rosenfeld, D., Kulmala, M., Fu, C., Poschl, U., Cheng, Y., and Andreae, M. O.: Aerosol-boundary-layer-monsoon interactions amplify semi-direct effect of biomass smoke on low cloud formation in Southeast Asia, Nat. Commun., 12, 6416, https://doi.org/10.1038/s41467-021-26728-4, 2021.
Dubovik, O. and King, M. D.: A flexible inversion algorithm for retrieval of aerosol optical properties from Sun and sky radiance measurements, J. Geophys. Res.-Atmos., 105, 20673–20696, https://doi.org/10.1029/2000JD900282, 2000.
EarthData: Earth Data Search, NASA [data set], https://search.earthdata.nasa.gov/ (last access: 3 November 2022), 2023.
Eck, T. F., Holben, B. N., Reid, J. S., Dubovik, O., Smirnov, A., O'Neill, N. T., Slutsker, I., and Kinne, S.: Wavelength dependence of the optical depth of biomass burning, urban, and desert dust aerosols, J. Geophys. Res.-Atmos., 104, 31333–31349, https://doi.org/10.1029/1999jd900923, 1999.
Eck, T. F., Holben, B. N., Dubovik, O., Smirnov, A., Goloub, P., Chen, H. B., Chatenet, B., Gomes, L., Zhang, X. Y., Tsay, S. C., Ji, Q., Giles, D., and Slutsker, I.: Columnar aerosol optical properties at AERONET sites in central eastern Asia and aerosol transport to the tropical mid-Pacific, J. Geophys. Res.-Atmos., 110, 18, https://doi.org/10.1029/2004jd005274, 2005.
Eck, T. F., Holben, B. N., Sinyuk, A., Pinker, R. T., Goloub, P., Chen, H., Chatenet, B., Li, Z., Singh, R. P., Tripathi, S. N., Reid, J. S., Giles, D. M., Dubovik, O., O'Neill, N. T., Smirnov, A., Wang, P., and Xia, X.: Climatological aspects of the optical properties of fine/coarse mode aerosol mixtures, J. Geophys. Res.-Atmos., 115, D19205, https://doi.org/10.1029/2010jd014002, 2010.
Fan, R., Ma, Y., Jin, S., Gong, W., Liu, B., Wang, W., Li, H., and Zhang, Y.: Validation, analysis, and comparison of MISR V23 aerosol optical depth products with MODIS and AERONET observations, Sci. Total Environ., 856, 159117, https://doi.org/10.1016/j.scitotenv.2022.159117, 2023.
Garay, M. J., Witek, M. L., Kahn, R. A., Seidel, F. C., Limbacher, J. A., Bull, M. A., Diner, D. J., Hansen, E. G., Kalashnikova, O. V., Lee, H., Nastan, A. M., and Yu, Y.: Introducing the 4.4 km spatial resolution Multi-Angle Imaging SpectroRadiometer (MISR) aerosol product, Atmos. Meas. Tech., 13, 593–628, https://doi.org/10.5194/amt-13-593-2020, 2020.
GEBCO Bathymetric Compilation Group 2023: Published Data Library, GEBCO_2023 Grid [data set], https://doi.org/10.5285/f98b053b-0cbc-6c23-e053-6c86abc0af7b, 2023.
Gelaro, R., McCarty, W., Suarez, M. J., Todling, R., Molod, A., Takacs, L., Randles, C. A., Darmenov, A., Bosilovich, M. G., Reichle, R., Wargan, K., Coy, L., Cullather, R., Draper, C., Akella, S., Buchard, V., Conaty, A., da Silva, A. M., Gu, W., Kim, G. K., Koster, R., Lucchesi, R., Merkova, D., Nielsen, J. E., Partyka, G., Pawson, S., Putman, W., Rienecker, M., Schubert, S. D., Sienkiewicz, M., and Zhao, B.: The Modern-Era Retrospective Analysis for Research and Applications, Version 2 (MERRA-2), J. Climate, 30, 5419–5454, https://doi.org/10.1175/jcli-d-16-0758.1, 2017.
Giglio, L., Schroeder, W., and Justice, C. O.: The collection 6 MODIS active fire detection algorithm and fire products, Remote Sens. Environ., 178, 31–41, https://doi.org/10.1016/j.rse.2016.02.054, 2016.
Giles, D. M., Sinyuk, A., Sorokin, M. G., Schafer, J. S., Smirnov, A., Slutsker, I., Eck, T. F., Holben, B. N., Lewis, J. R., Campbell, J. R., Welton, E. J., Korkin, S. V., and Lyapustin, A. I.: Advancements in the Aerosol Robotic Network (AERONET) Version 3 database – automated near-real-time quality control algorithm with improved cloud screening for Sun photometer aerosol optical depth (AOD) measurements, Atmos. Meas. Tech., 12, 169–209, https://doi.org/10.5194/amt-12-169-2019, 2019.
GMAO (Global Modeling and Assimilation Office): MERRA-2 tavgM_2d_aer_Nx: 2d, Monthly mean, Time-averaged, Single-Level, Assimilation, Aerosol Diagnostics V5.12.4, Greenbelt, MD, USA, Goddard Earth Sciences Data and Information Services Center (GES DISC) [data set], https://doi.org/10.5067/FH9A0MLJPC7N, 2015.
Gu, L., Chen, J., Xu, C. Y., Kim, J. S., Chen, H., Xia, J., and Zhang, L.: The contribution of internal climate variability to climate change impacts on droughts, Sci. Total Environ., 684, 229–246, https://doi.org/10.1016/j.scitotenv.2019.05.345, 2019.
Gui, K., Che, H., Zheng, Y., Wang, Y., Zhang, L., Zhao, H., Li, L., Zhong, J., Yao, W., and Zhang, X.: Seasonal variability and trends in global type-segregated aerosol optical depth as revealed by MISR satellite observations, Sci. Total Environ., 787, 147543, https://doi.org/10.1016/j.scitotenv.2021.147543, 2021.
Guo, J., Deng, M., Lee, S. S., Wang, F., Li, Z., Zhai, P., Liu, H., Lv, W., Yao, W., and Li, X.: Delaying precipitation and lightning by air pollution over the Pearl River Delta. Part I: Observational analyses, J. Geophys. Res.-Atmos., 121, 6472–6488, https://doi.org/10.1002/2015jd023257, 2016.
Gupta, G., Venkat Ratnam, M., Madhavan, B. L., and Narayanamurthy, C. S.: Long-term trends in Aerosol Optical Depth obtained across the globe using multi-satellite measurements, Atmos. Environ., 273, 118953, https://doi.org/10.1016/j.atmosenv.2022.118953, 2022.
Gupta, P., Levy, R. C., Mattoo, S., Remer, L. A., and Munchak, L. A.: A surface reflectance scheme for retrieving aerosol optical depth over urban surfaces in MODIS Dark Target retrieval algorithm, Atmos. Meas. Tech., 9, 3293–3308, https://doi.org/10.5194/amt-9-3293-2016, 2016.
Hall, J., Arheimer, B., Borga, M., Brázdil, R., Claps, P., Kiss, A., Kjeldsen, T. R., Kriaučiūnienė, J., Kundzewicz, Z. W., Lang, M., Llasat, M. C., Macdonald, N., McIntyre, N., Mediero, L., Merz, B., Merz, R., Molnar, P., Montanari, A., Neuhold, C., Parajka, J., Perdigão, R. A. P., Plavcová, L., Rogger, M., Salinas, J. L., Sauquet, E., Schär, C., Szolgay, J., Viglione, A., and Blöschl, G.: Understanding flood regime changes in Europe: a state-of-the-art assessment, Hydrol. Earth Syst. Sci., 18, 2735–2772, https://doi.org/10.5194/hess-18-2735-2014, 2014.
Han, Y., Wang, T., Tang, J., Wang, C., Jian, B., Huang, Z., and Huang, J.: New insights into the Asian dust cycle derived from CALIPSO lidar measurements, Remote Sens. Environ., 272, 112906, https://doi.org/10.1016/j.rse.2022.112906, 2022.
Holben, B. N., Eck, T. F., Slutsker, I., Tanre, D., Buis, J. P., Setzer, A., Vermote, E., Reagan, J. A., Kaufman, Y. J., Nakajima, T., Lavenu, F., Jankowiak, I., and Smirnov, A.: AERONET – A federated instrument network and data archive for aerosol characterization, Remote Sens. Environ., 66, 1–16, https://doi.org/10.1016/s0034-4257(98)00031-5, 1998.
Holben, B. N., Tanre, D., Smirnov, A., Eck, T. F., Slutsker, I., Abuhassan, N., Newcomb, W. W., Schafer, J. S., Chatenet, B., Lavenu, F., Kaufman, Y. J., Castle, J. V., Setzer, A., Markham, B., Clark, D., Frouin, R., Halthore, R., Karneli, A., O'Neill, N. T., Pietras, C., Pinker, R. T., Voss, K., and Zibordi, G.: An emerging ground-based aerosol climatology: Aerosol optical depth from AERONET, J. Geophys. Res.-Atmos., 106, 12067–12097, https://doi.org/10.1029/2001jd900014, 2001.
Horwell, C. J. and Baxter, P. J.: The respiratory health hazards of volcanic ash: a review for volcanic risk mitigation, B. Volcanol., 69, 1–24, https://doi.org/10.1007/s00445-006-0052-y, 2006.
Hsu, N. C., Lee, J., Sayer, A. M., Kim, W., Bettenhausen, C., and Tsay, S. C.: VIIRS Deep Blue Aerosol Products Over Land: Extending the EOS Long-Term Aerosol Data Records, J. Geophys. Res.-Atmos., 124, 4026–4053, https://doi.org/10.1029/2018jd029688, 2019.
Huang, C., Li, J., Sun, W., Chen, Q., Mao, Q.-J., and Yuan, Y.: Long-Term Variation Assessment of Aerosol Load and Dominant Types over Asia for Air Quality Studies Using Multi-Sources Aerosol Datasets, https://doi.org/10.3390/rs13163116, 2021.
Huang, J. P., Wang, T. H., Wang, W. C., Li, Z. Q., and Yan, H. R.: Climate effects of dust aerosols over East Asian arid and semiarid regions, J. Geophys. Res.-Atmos., 119, 11398–11416, https://doi.org/10.1002/2014jd021796, 2014a.
Huang, R. J., Zhang, Y., Bozzetti, C., Ho, K. F., Cao, J. J., Han, Y., Daellenbach, K. R., Slowik, J. G., Platt, S. M., and Canonaco, F.: High secondary aerosol contribution to particulate pollution during haze events in China, Nature, 514, 218, https://doi.org/10.1038/nature13774, 2014b.
Huang, X., Ding, A., Wang, Z., Ding, K., Gao, J., Chai, F., and Fu, C.: Amplified transboundary transport of haze by aerosol–boundary layer interaction in China, Nat. Geosci., 13, 428–434, https://doi.org/10.1038/s41561-020-0583-4, 2020.
Husar, R. B., Tratt, D. M., Schichtel, B. A., Falke, S. R., Li, F., Jaffe, D., Gasso, S., Gill, T., Laulainen, N. S., Lu, F., Reheis, M. C., Chun, Y., Westphal, D., Holben, B. N., Gueymard, C., McKendry, I., Kuring, N., Feldman, G. C., McClain, C., Frouin, R. J., Merrill, J., DuBois, D., Vignola, F., Murayama, T., Nickovic, S., Wilson, W. E., Sassen, K., Sugimoto, N., and Malm, W. C.: Asian dust events of April 1998, J. Geophys. Res.-Atmos., 106, 18317–18330, https://doi.org/10.1029/2000jd900788, 2001.
Jethva, H., Torres, O., Field, R. D., Lyapustin, A., Gautam, R., and Kayetha, V.: Connecting Crop Productivity, Residue Fires, and Air Quality over Northern India, Sci. Rep., 9, 16594, https://doi.org/10.1038/s41598-019-52799-x, 2019.
Jin, S., Zhang, M., Ma, Y., Gong, W., Chen, C., Yang, L., Hu, X., Liu, B., Chen, N., Du, B., and Shi, Y.: Adapting the Dark Target Algorithm to Advanced MERSI Sensor on the FengYun-3-D Satellite: Retrieval and Validation of Aerosol Optical Depth Over Land, IEEE T. Geosci. Remote, 59, 8781–8797, https://doi.org/10.1109/TGRS.2020.3021021, 2021.
Kahn, R. A., Gaitley, B. J., Martonchik, J. V., Diner, D. J., Crean, K. A., and Holben, B.: Multiangle Imaging Spectroradiometer (MISR) global aerosol optical depth validation based on 2 years of coincident Aerosol Robotic Network (AERONET) observations, J. Geophys. Res.-Atmos., 110, D10S04, https://doi.org/10.1029/2004JD004706, 2005.
Kaufman, Y. J., Koren, I., Remer, L. A., Rosenfeld, D., and Rudich, Y.: The effect of smoke, dust, and pollution aerosol on shallow cloud development over the Atlantic Ocean, P. Natl. Acad. Sci. USA, 102, 11207–11212, https://doi.org/10.1073/pnas.0505191102, 2005.
Kendall, M. G.: Rank Correlation Methods, 4th Edition, Charles Griffin, London, 1975.
King, M. D., Kaufman, Y. J., Menzel, W. P., and Tanre, D.: REMOTE-SENSING OF CLOUD, AEROSOL, AND WATER-VAPOR PROPERTIES FROM THE MODERATE RESOLUTION IMAGING SPECTROMETER (MODIS), IEEE T. Geosci. Remote, 30, 2–27, https://doi.org/10.1109/36.124212, 1992.
Kulkarni, A. and Von Storch, H.: Monte Carlo Experiments on the Effect of Serial Correlation on the Mann–Kendall Test of Trend, Meteorol. Z., 4, 82–85, https://doi.org/10.1127/metz/4/1992/82, 1995.
Kumar, M., Parmar, K. S., Kumar, D. B., Mhawish, A., Broday, D. M., Mall, R. K., and Banerjee, T.: Long-term aerosol climatology over Indo-Gangetic Plain: Trend, prediction and potential source fields, Atmos. Environ., 180, 37–50, https://doi.org/10.1016/j.atmosenv.2018.02.027, 2018.
Lelieveld, J., Evans, J. S., Fnais, M., Giannadaki, D., and Pozzer, A.: The contribution of outdoor air pollution sources to premature mortality on a global scale, Nature, 525, 367–371, https://doi.org/10.1038/nature15371, 2015.
Lenoble, J., Remer, L., and Tanre, D.: Aerosol Remote Sensing, Springer-Verlag Berlin Heidelberg, XXXVIII, 390 pp., https://doi.org/10.1007/978-3-642-17725-5, 2013.
Levy, R. C., Remer, L. A., Kleidman, R. G., Mattoo, S., Ichoku, C., Kahn, R., and Eck, T. F.: Global evaluation of the Collection 5 MODIS dark-target aerosol products over land, Atmos. Chem. Phys., 10, 10399–10420, https://doi.org/10.5194/acp-10-10399-2010, 2010.
Levy, R. C., Mattoo, S., Munchak, L. A., Remer, L. A., Sayer, A. M., Patadia, F., and Hsu, N. C.: The Collection 6 MODIS aerosol products over land and ocean, Atmos. Meas. Tech., 6, 2989–3034, https://doi.org/10.5194/amt-6-2989-2013, 2013.
Levy, R., Hsu, C., et al.: MODIS Atmosphere L2 Aerosol Product. NASA MODIS Adaptive Processing System, Goddard Space Flight Center, USA [data set], https://doi.org/10.5067/MODIS/MOD04_L2.061, 2015.
Li, Z. Q., Lau, W. K. M., Ramanathan, V., Wu, G., Ding, Y., Manoj, M. G., Liu, J., Qian, Y., Li, J., Zhou, T., Fan, J., Rosenfeld, D., Ming, Y., Wang, Y., Huang, J., Wang, B., Xu, X., Lee, S. S., Cribb, M., Zhang, F., Yang, X., Zhao, C., Takemura, T., Wang, K., Xia, X., Yin, Y., Zhang, H., Guo, J., Zhai, P. M., Sugimoto, N., Babu, S. S., and Brasseur, G. P.: Aerosol and monsoon climate interactions over Asia, Rev. Geophys., 54, 866–929, https://doi.org/10.1002/2015rg000500, 2016.
Limbacher, J. A., Kahn, R. A., and Lee, J.: The new MISR research aerosol retrieval algorithm: a multi-angle, multi-spectral, bounded-variable least squares retrieval of aerosol particle properties over both land and water, Atmos. Meas. Tech., 15, 6865–6887, https://doi.org/10.5194/amt-15-6865-2022, 2022.
Liu, B., Ma, X., Guo, J., Li, H., Jin, S., Ma, Y., and Gong, W.: Estimating hub-height wind speed based on a machine learning algorithm: implications for wind energy assessment, Atmos. Chem. Phys., 23, 3181–3193, https://doi.org/10.5194/acp-23-3181-2023, 2023.
Liu, X. G., Li, J., Qu, Y., Han, T., Hou, L., Gu, J., Chen, C., Yang, Y., Liu, X., Yang, T., Zhang, Y., Tian, H., and Hu, M.: Formation and evolution mechanism of regional haze: a case study in the megacity Beijing, China, Atmos. Chem. Phys., 13, 4501–4514, https://doi.org/10.5194/acp-13-4501-2013, 2013.
Livezey, R. E. and Chen, W. Y.: Statistical Field Significance and its Determination by Monte Carlo Techniques, Mon. Weather Rev., 111, 46–59, https://doi.org/10.1175/1520-0493(1983)111<0046:SFSAID>2.0.CO;2, 1983.
Luo, Y. X., Zheng, X. B., Zhao, T. L., and Chen, J.: A climatology of aerosol optical depth over China from recent 10 years of MODIS remote sensing data, Int. J. Climatol., 34, 863–870, https://doi.org/10.1002/joc.3728, 2014.
Ma, Y. and Gong, W.: Evaluating the Performance of SVM in Dust Aerosol Discrimination and Testing its Ability in an Extended Area, IEEE J. Select. Top. Appl. Earth Observ. Remote Sens., 5, 1849–1858, https://doi.org/10.1109/JSTARS.2012.2206572, 2012.
Ma, Y., Gong, W., and Mao, F.: Transfer learning used to analyze the dynamic evolution of the dust aerosol, J. Quantit. Spectrosc. Ra. Transf., 153, 119–130, https://doi.org/10.1016/j.jqsrt.2014.09.025, 2015.
Mallet, M., Dubovik, O., Nabat, P., Dulac, F., Kahn, R., Sciare, J., Paronis, D., and Léon, J. F.: Absorption properties of Mediterranean aerosols obtained from multi-year ground-based remote sensing observations, Atmos. Chem. Phys., 13, 9195–9210, https://doi.org/10.5194/acp-13-9195-2013, 2013.
Mallet, M., Roger, J. C., Despiau, S., Dubovik, O., and Putaud, J. P.: Microphysical and optical properties of aerosol particles in urban zone during ESCOMPTE, Atmo. Res., 69, 73–97, https://doi.org/10.1016/j.atmosres.2003.07.001, 2003.
Mann, H. B.: NONPARAMETRIC TESTS AGAINST TREND, Econometrica, 13, 245–259, https://doi.org/10.2307/1907187, 1945.
Mao, X. Q., Zhou, J., and Corsetti, G.: How Well Have China's Recent Five-Year Plans Been Implemented for Energy Conservation and Air Pollution Control?, Environ. Sci. Technol., 48, 10036–10044, https://doi.org/10.1021/es501729d, 2014.
Masuoka, E., Fleig, A., Wolfe, R. E., and Patt, F.: Key characteristics of MODIS data products, IEEE T. Geosci. Remote, 36, 1313–1323, https://doi.org/10.1109/36.701081, 1998.
Mhawish, A., Sorek-Hamer, M., Chatfield, R., Banerjee, T., Bilal, M., Kumar, M., Sarangi, C., Franklin, M., Chau, K., Garay, M., and Kalashnikova, O.: Aerosol characteristics from earth observation systems: A comprehensive investigation over South Asia (2000–2019), Remote Sens. Environ., 259, 112410, https://doi.org/10.1016/j.rse.2021.112410, 2021.
NASA: Aeronet, NASA [data set], https://aeronet.gsfc.nasa.gov/new_web/download_all_v3_aod.html (last access: 3 November 2022), 2023a.
NASA: FIRM, NASA [data set], https://firms.modaps.eosdis.nasa.gov/ (last access: 11 July 2023), 2023b.
NASA/LARC/SD/ASDC: MISR Level 2 Aerosol parameters V003, NASA Langley Atmospheric Science Data Center DAAC [data set], https://doi.org/10.5067/TERRA/MISR/MIL2ASAE_L2.003-23, 1999.
Nakajima, T., Yoon, S. C., Ramanathan, V., Shi, G. Y., Takemura, T., Higurashi, A., Takamura, T., Aoki, K., Sohn, B. J., Kim, S. W., Tsuruta, H., Sugimoto, N., Shimizu, A., Tanimoto, H., Sawa, Y., Lin, N. H., Lee, C. T., Goto, D., and Schutgens, N.: Overview of the Atmospheric Brown Cloud East Asian Regional Experiment 2005 and a study of the aerosol direct radiative forcing in east Asia, J. Geophys. Res.-Atmos., 112, 23, https://doi.org/10.1029/2007jd009009, 2007.
Ou, Y., Chen, C., Ying, Z., Li, K., Shi, Z., Tsung, J., Xu, H., Peng, Z., Xie, Y., and Luo, J.: Evaluation of MERRA-2 Aerosol Optical and Component Properties over China Using SONET and PARASOL/GRASP Data, Remote Sens., 14, 821, https://doi.org/10.3390/rs14040821, 2022.
Paliwal, U., Sharma, M., and Burkhart, J. F.: Monthly and spatially resolved black carbon emission inventory of India: uncertainty analysis, Atmos. Chem. Phys., 16, 12457–12476, https://doi.org/10.5194/acp-16-12457-2016, 2016.
Pettitt, A.: A Non-Parametric Approach to the Change-Point Problem, Journal of the Royal Statistical Society. Series C, Appl. Stat., 28, 126–135, https://doi.org/10.2307/2346729, 1979.
Popp, T., De Leeuw, G., Bingen, C., Brühl, C., Capelle, V., Chedin, A., Clarisse, L., Dubovik, O., Grainger, R., Griesfeller, J., Heckel, A., Kinne, S., Klüser, L., Kosmale, M., Kolmonen, P., Lelli, L., Litvinov, P., Mei, L., North, P., Pinnock, S., Povey, A., Robert, C., Schulz, M., Sogacheva, L., Stebel, K., Stein Zweers, D., Thomas, G., Tilstra, L. G., Vandenbussche, S., Veefkind, P., Vountas, M., and Xue, Y.: Development, Production and Evaluation of Aerosol Climate Data Records from European Satellite Observations (Aerosol_cci), Remote Sens., 8, 421, https://doi.org/10.3390/rs8050421, 2016.
Ramanathan, V. and Carmichael, G.: Global and regional climate changes due to black carbon, Nat. Geosci., 1, 221–227, https://doi.org/10.1038/ngeo156, 2008.
Randles, C. A., da Silva, A. M., Buchard, V., Colarco, P. R., Darmenov, A., Govindaraju, R., Smirnov, A., Holben, B., Ferrare, R., Hair, J., Shinozuka, Y., and Flynn, C. J.: The MERRA-2 Aerosol Reanalysis, 1980 Onward. Part I: System Description and Data Assimilation Evaluation, J. Climate, 30, 6823–6850, https://doi.org/10.1175/jcli-d-16-0609.1, 2017.
Reddington, C., Yoshioka, M., Balasubramanian, R., Ridley, D., Toh, Y. Y., Arnold, S., and Spracklen, D.: Contribution of vegetation and peat fires to particulate air pollution in Southeast Asia, Environ. Res. Lett., 9, 094006, https://doi.org/10.1088/1748-9326/9/9/094006, 2014.
Remer, L. A., Kaufman, Y. J., Tanré, D., Mattoo, S., Chu, D. A., Martins, J. V., Li, R. R., Ichoku, C., Levy, R. C., and Kleidman, R. G.: The MODIS Aerosol Algorithm, Products, and Validation, J. Atmos. Sci., 62, 947–973, https://doi.org/10.1175/JAS3385.1, 2005.
Rose, A. N., McKee, J. J., Urban, M. L., Bright, E. A., and Sims, K. M.: LandScan 2018 (2018), Oak Ridge National Laboratory [dataset], https://doi.org/10.48690/1524213, 2019.
Rosenfeld, D., Zhu, Y. N., Wang, M. H., Zheng, Y. T., Goren, T., and Yu, S. C.: Aerosol-driven droplet concentrations dominate coverage and water of oceanic low-level clouds, Science, 363, eaav0566, https://doi.org/10.1126/science.aav0566, 2019.
Rosenfeld, D., Lohmann, U., Raga, G. B., O'Dowd, C. D., Kulmala, M., Fuzzi, S., Reissell, A., and Andreae, M. O.: Flood or drought: How do aerosols affect precipitation?, Science, 321, 1309–1313, https://doi.org/10.1126/science.1160606, 2008.
Satheesh, S. K. and Srinivasan, J.: Enhanced aerosol loading over Arabian Sea during the pre-monsoon season: Natural or anthropogenic?, Geophys. Res. Lett., 29, 21-21–21-24, https://doi.org/10.1029/2002GL015687, 2002.
Sayer, A. M. and Knobelspiesse, K. D.: How should we aggregate data? Methods accounting for the numerical distributions, with an assessment of aerosol optical depth, Atmos. Chem. Phys., 19, 15023–15048, https://doi.org/10.5194/acp-19-15023-2019, 2019.
Sayer, A. M., Hsu, N. C., Bettenhausen, C., and Jeong, M. J.: Validation and uncertainty estimates for MODIS Collection 6 “Deep Blue” aerosol data, J. Geophys. Res.-Atmos., 118, 7864–7872, https://doi.org/10.1002/jgrd.50600, 2013.
Sayer, A. M., Munchak, L. A., Hsu, N. C., Levy, R. C., Bettenhausen, C., and Jeong, M. J.: MODIS Collection 6 aerosol products: Comparison between Aqua's e-Deep Blue, Dark Target, and ”merged” data sets, and usage recommendations, J. Geophys. Res.-Atmos., 119, 13965–13989, https://doi.org/10.1002/2014jd022453, 2014.
Sen, P.: Estimates of the Regression Coefficient Based on Kendall's Tau, J. Am. Stat. Assoc., 63, 1379–1389, https://doi.org/10.1080/01621459.1968.10480934, 1968.
Shi, Y., Zhang, M., Ma, Y., Gong, W., Chen, S., Jin, S., and Liu, B.: A novel simplified method for surface albedo together with a look-up table to get an 18-year assessment of surface aerosol direct radiative effect in central and East China, Atmos. Environ., 117858, https://doi.org/10.1016/j.atmosenv.2020.117858, 2020.
Singh, N., Mhawish, A., Deboudt, K., Singh, R. S., and Banerjee, T.: Organic aerosols over Indo-Gangetic Plain: Sources, distributions and climatic implications, Atmos. Environ., 157, 59–74, https://doi.org/10.1016/j.atmosenv.2017.03.008, 2017.
Sinyuk, A., Holben, B. N., Eck, T. F., Giles, D. M., Slutsker, I., Korkin, S., Schafer, J. S., Smirnov, A., Sorokin, M., and Lyapustin, A.: The AERONET Version 3 aerosol retrieval algorithm, associated uncertainties and comparisons to Version 2, Atmos. Meas. Tech., 13, 3375–3411, https://doi.org/10.5194/amt-13-3375-2020, 2020.
Smirnov, A., Holben, B. N., Eck, T. F., Dubovik, O., and Slutsker, I.: Cloud-screening and quality control algorithms for the AERONET database, Remote Sens. Environ., 73, 337–349, 2000.
IPCC: Climate Change 2007: The Physical Science Basis. Contribution of Working Group I to the Fourth Assessment Report of the Intergovernmental Panel on Climate Change, edited by: Solomon, S., Qin, D., Manning, M., Chen, Z., Marquis, M., Averyt, K. B., Tignor, M., and Miller, H. L., Cambridge University Press, Cambridge, United Kingdom and New York, NY, USA, 996 pp., 2007.
Sulis, M., Paniconi, C., Rivard, C., Harvey, R., and Chaumont, D.: Assessment of climate change impacts at the catchment scale with a detailed hydrological model of surface-subsurface interactions and comparison with a land surface model, Water Resour. Res., 47, W01513, https://doi.org/10.1029/2010wr009167, 2011.
Tao, M., Wang, J., Li, R., Chen, L., Xu, X., Wang, L., Tao, J., Wang, Z., and Xiang, J.: Characterization of Aerosol Type Over East Asia by 4.4 km MISR Product: First Insight and General Performance, J. Geophys. Res.-Atmos., 125, D031909, https://doi.org/10.1029/2019jd031909, 2020.
Theil, H.: A Rank-Invariant Method of Linear and Polynomial Regression Analysis, Proceedings of the Koninklijke Nederlandse Akademie Wetenschappen, Series A – Mathematical Sciences, 53, 386–392, https://doi.org/10.1007/978-94-011-2546-8_20, 1950.
Tie, X. X., Wu, D., and Brasseur, G.: Lung cancer mortality and exposure to atmospheric aerosol particles in Guangzhou, China, Atmos. Environ., 43, 2375–2377, https://doi.org/10.1016/j.atmosenv.2009.01.036, 2009.
Unkaševiæ, M., Tošiæ, I., and Vujoviæ, D.: Variability and probability of annual and extreme precipitation over Serbia and Montenegro, Theor. Appl. Climatol., 79, 103–109, https://doi.org/10.1007/s00704-004-0060-9, 2004.
Vernier, J. P., Thomason, L. W., Pommereau, J. P., Bourassa, A., Pelon, J., Garnier, A., Hauchecorne, A., Blanot, L., Trepte, C., Degenstein, D., and Vargas, F.: Major influence of tropical volcanic eruptions on the stratospheric aerosol layer during the last decade, Geophys. Res. Lett., 38, L12807, https://doi.org/10.1029/2011GL047563, 2011.
Von Storch, H.: Misuses of statistical analysis in climate research, Analysis of Climate Variability: Applications of Statistical Techniques, 11–26, https://doi.org/10.1007/978-3-662-03744-7_2, 1999.
Wang, T., Tang, J., Sun, M., Liu, X., Huang, Y., Huang, J., Han, Y., Cheng, Y., Huang, Z., and Li, J.: Identifying a transport mechanism of dust aerosols over South Asia to the Tibetan Plateau: A case study, Sci. Total Environ., 758, 143714, https://doi.org/10.1016/j.scitotenv.2020.143714, 2021.
Wang, W., Chen, Y., Becker, S., and Liu, B.: Variance Correction Prewhitening Method for Trend Detection in Autocorrelated Data, J. Hydrol. Eng., 20, 04015033, https://doi.org/10.1061/(ASCE)HE.1943-5584.0001234, 2015.
Wijngaard, J., Tank, A., and Können, G.: Homogeneity of 20th Century European Daily Temperature and Precipitation Series, Int. J. Climatol., 23, 679–692, https://doi.org/10.1002/joc.906, 2003.
Wilks, D. S.: On “Field Significance” and the False Discovery Rate, J. Appl. Meteorol. Climatol., 45, 1181–1189, https://doi.org/10.1175/JAM2404.1, 2006.
Wilks, D. S.: “The Stippling Shows Statistically Significant Grid Points”: How Research Results are Routinely Overstated and Overinterpreted, and What to Do about It, B. Am. Meteorol. Soc., 97, 2263–2273, https://doi.org/10.1175/BAMS-D-15-00267.1, 2016.
Xie, G. Q., Wang, M., Pan, J., and Zhu, Y.: Spatio-temporal variations and trends of MODIS C6.1 Dark Target and Deep Blue merged aerosol optical depth over China during 2000–2017, Atmos. Environ., 214, 116846, https://doi.org/10.1016/j.atmosenv.2019.116846, 2019.
Xu, X., Yang, X., Zhu, B., Tang, Z., Wu, H., and Xie, L.: Characteristics of MERRA-2 black carbon variation in east China during 2000–2016, Atmos. Environ., 222, 117140, https://doi.org/10.1016/j.atmosenv.2019.117140, 2020.
Yue, S. and Hashino, M.: LONG TERM TRENDS OF ANNUAL AND MONTHLY PRECIPITATION IN JAPAN1, JAWRA J. Am. Water Resour. Assoc., 39, 587–596, https://doi.org/10.1111/j.1752-1688.2003.tb03677.x, 2003.
Yue, S., Pilon, P., Phinney, B., and Cavadias, G.: The influence of autocorrelation on the ability to detect trend in hydrological series, Hydrol. Process., 16, 1807–1829, https://doi.org/10.1002/hyp.1095, 2002.
Zhang, M., Ma, Y., Wang, L., Gong, W., Hu, B., and Shi, Y.: Spatial-temporal characteristics of aerosol loading over the Yangtze River Basin during 2001–2015, Int. J. Climatol., 38, 2138–2152, https://doi.org/10.1002/joc.5324, 2018.
Zhang, M., Jin, S., Ma, Y., Fan, R., Wang, L., Gong, W., and Liu, B.: Haze events at different levels in winters: A comprehensive study of meteorological factors, Aerosol characteristics and direct radiative forcing in megacities of north and central China, Atmos. Environ., 245, 118056, https://doi.org/10.1016/j.atmosenv.2020.118056, 2021.
Zhang, Q., Jiang, X., Tong, D., Davis, S. J., Zhao, H., Geng, G., Feng, T., Zheng, B., Lu, Z., and Streets, D. G.: Transboundary health impacts of transported global air pollution and international trade, Nature, 543, 705–709, https://doi.org/10.1038/nature21712, 2017.
Zhao, X. J., Zhao, P. S., Xu, J., Meng,, W., Pu, W. W., Dong, F., He, D., and Shi, Q. F.: Analysis of a winter regional haze event and its formation mechanism in the North China Plain, Atmos. Chem. Phys., 13, 5685–5696, https://doi.org/10.5194/acp-13-5685-2013, 2013.
Zhu, A., Ramanathan, V., Li, F., and Kim, D.: Dust plumes over the Pacific, Indian, and Atlantic Oceans: Climatology and radiative impact, J. Geophys. Res., 112, D16208, https://doi.org/10.1029/2007JD008427, 2007.