the Creative Commons Attribution 4.0 License.
the Creative Commons Attribution 4.0 License.
 | 18 Jan 2023
Varying chiral ratio of pinic acid enantiomers above the Amazon rainforest
Denis Leppla
Nora Zannoni
Leslie Kremper
Jonathan Williams
Christopher Pöhlker
Marta Sá
Maria Christina Solci
Thorsten Hoffmann
Chiral chemodiversity plays a crucial role in biochemical processes such as insect and plant communication. However, the vast majority of organic aerosol studies do not distinguish between enantiomeric compounds in the particle phase. Here we report chirally specified measurements of secondary organic aerosol (SOA) at the Amazon Tall Tower Observatory (ATTO) at different altitudes during three measurement campaigns at different seasons. Analysis of filter samples by liquid chromatography coupled to mass spectrometry (LC-MS) has shown that the chiral ratio of pinic acid (C9H14O4) varies with increasing height above the canopy. A similar trend was recently observed for the gas-phase precursor α-pinene but more pronounced. Nevertheless, the measurements indicate that neither the oxidation of (+/−)-α-pinene nor the incorporation of the products into the particulate phase proceeds with stereo preference and that the chiral information of the precursor molecule is merely transferred to the low-volatility product. The observation of the weaker height gradient of the present enantiomers in the particle phase at the observation site can be explained by the significant differences in the atmospheric lifetimes of reactant and product. Therefore, it is suggested that the chiral ratio of pinic acid is mainly determined by large-scale emission processes of the two precursors, while meteorological, chemical, or physicochemical processes do not play a particular role. Characteristic emissions of the chiral aerosol precursors from different forest ecosystems, in some cases even with contributions from forest-related fauna, could thus provide large-scale information on the different contributions to biogenic secondary aerosols via the analytics of the chiral particle-bound degradation products.
- Article
(698 KB) - Full-text XML
-
Supplement
(2040 KB) - BibTeX
- EndNote


The Amazon basin is one of the most pristine ecosystems on Earth and extends over a region of about 6 ×10⁶ km2 in South America. Approximately 80 % of this region is covered with rainforest, which accounts for circa 40 % of all tropical forests on the globe (Goulding and Barthem, 2003; Andreae et al., 2015). Various studies estimated the total aboveground carbon content of the Amazon forest at about 86–108 Pg C (Saatchi et al., 2007; Baccini et al., 2012), demonstrating its crucial role in climate change and for life on Earth in general. In addition to the importance of the Amazon rainforest for the global carbon cycle, its role within the hydrological cycle is one of its most important functions and is responsible for the most biodiverse ecosystem on Earth (Hoorn et al., 2010; Wittmann et al., 2013). The immense biodiversity, however, is constantly threatened by deforestation and land use change (Vieira et al., 2008; Pöhlker et al., 2019). In particular, forest fires are the primary source of pollution. One of the consequences of these anthropogenic activities is significant seasonal variations in aerosol particle concentrations in the Amazon basin, which strongly affect the radiation budget, cloud physics, and precipitation (Martin et al., 2010; Pöschl et al., 2010; Artaxo et al., 2013). However, even without human influence, an estimated 760 Tg C is released into the atmosphere annually worldwide in the form of biogenic volatile organic compounds (BVOCs; Sindelarova et al., 2014). Rapid reactions with atmospheric reactants, such as OH radicals and ozone, lead to products with lower volatility and subsequently to the formation of secondary organic aerosols (SOAs; Kroll and Seinfeld, 2008). Organic compounds account for up to 90 % of the total atmospheric particulate matter in tropical forests (Kanakidou et al., 2005) and directly and indirectly affect the Earth's climate.
Monoterpenes are considered an important fraction of BVOCs and comprise a huge variety of individual chemical compounds (Guenther et al., 2012). Many of those are chiral and carry stereogenic centers, resulting in enantiomeric structures. Although chiral molecules play a critical role in insect and plant communication (Phillips et al., 2003; Mori, 2014), they are rarely distinguished in studies regarding atmospheric chemistry. Although there are a number of studies that have looked at the different diastereomers, particularly in isoprene oxidation (Nozière et al., 2011; González et al., 2014), the analysis of enantiomers using chiral phases and their direct analysis is rare. There are several reasons for this. Besides the analytical challenges, another reason is that enantiomers have identical physical and chemical properties in an otherwise non-chiral environment, such as boiling point, mass, and also reaction rate with atmospheric oxidants (OH, O3, and NO3). However, when oligomerization based on chiral building blocks occurs, a process also relevant to secondary organic aerosol formation (Tolocka et al., 2004; Hallquist et al., 2009), changes in physicochemical properties may well occur. It has been shown that physical and chemical properties, such as melting point and water solubility, can then be determined by stereochemistry (Katsumoto et al., 2010; Baker et al., 2015; Cash et al., 2016). Thus, chirality might affect the ability of SOA formation and, consequently, influence, for example, the radiative forcing and cloud processing of aerosol particles.
Recently, Zannoni et al. (2020) have reported significant variances in the enantiomeric ratio of α-pinene with increasing altitude at the Amazon Tall Tower Observatory (ATTO) site in the Amazon rainforest. This unexpected result was attributed to strong local sources, such as insects, which may be responsible of changing the predominant ambient ratio of (−)- and (+)-α-pinene. Through subsequent atmospheric oxidation, the chiral information should be transferred to the particle phase since, for certain oxidation reactions, the stereochemical centers are retained. Pinic acid is an oxygenated product of α-pinene ozonolysis and a key product of atmospheric volatile organic compound (VOC) degradation compounds identified at the molecular level (Christoffersen et al., 1998; Ma et al., 2007; Yasmeen et al., 2011; Mutzel et al., 2016). Due to its two carboxyl functions, it has a relatively low vapor pressure and thus a strong tendency to partition into the particle phase. Another important product of the α-pinene oxidation is 3-methyl-1,2,3-butanetricarboxylic acid (MBTCA; Szmigielski et al., 2007; Yasmeen et al., 2010; Müller et al., 2012; Claeys et al., 2007), which would actually be a better marker substance for particle-bound VOC oxidation products due to its even lower volatility. However, MBTCA has lost the original chiral information due to the breakup of the four-membered ring. Here we show that the chiral ratio of pinic acid in the Amazon rainforest exhibits an excess of one enantiomer. The results reflect the trend observed in the gas phase, indicating a direct link between BVOC emissions and SOA concentrations through chirality.
2.1 Measurement campaigns and filter sampling
Ambient aerosol particles were collected during three campaigns (22–31 October 2018, 4–14 March 2019, and 20–26 September 2019) in the Amazon rainforest at the ATTO station. The research site is already well described by Andreae et al. (2015). Briefly, the ATTO is located about 150 km northeast of Manaus, Brazil, and about 12 km northeast of the Uatumã River within the Uatumã Sustainable Development Reserve (UDSR). The site is located on a plateau ∼ 120 m above sea level and is surrounded by dense, non-flooded upland forest (terra firme) with a maximum tree canopy height of approximately 40 m. It is a region with high biodiversity, including a large tree species richness with 60 families, 206 genera, and 417 species. The sources of the VOCs are therefore diverse and attribution (e.g., from which sources individual terpenes originate) is difficult (Andreae et al., 2015). The area between the river and the plateau is primarily characterized by floodplain forests and white sandy soil ecosystems of the savanna (campinas) and forest (campinarana) types. The seasonal shift in the Intertropical Convergence Zone (ITCZ) influences the meteorological characteristics at the ATTO, with clean and wet conditions from February to May and polluted and dry conditions from August to November (Pöhlker et al., 2019; more details can be found in the Supplement). Key meteorological parameters, trace gas concentrations, and particle concentrations are continuously recorded at the station.
PM2.5 filter samples were collected from the 80, 150, and 320 m platforms of the ATTO tower (coordinates 02∘08.752′ S, 59∘00.335′ W) during the 2018 dry season and 2019 wet season. During the 2019 dry season, an instrument was moved from the 150 m platform to the ground. Aerosol particles were collected on filters consisting of borosilicate glass microfibers bonded with PTFE (polytetrafluoroethylene; Pallflex®Emfab™, 70 mm diameter). To exclude particles with aerodynamic diameters larger than 2.5 µm, a pre-separator (Digitel, DPM2.3) was installed upstream of the filter holder. The flow rate was kept constant at 38 L min−1. In order to distinguish between daytime and nighttime, the sampling time was 12 h on average. This also ensured sufficient aerosol mass on the filter. Additionally, particle-size-resolved filter samples were collected at the smaller 80 m triangular mast (coordinates 02∘08.602′ S, 59∘00.033′ W). For this purpose, an aerosol inlet at a height of 60 m was connected to a micro-orifice uniform deposit impactor (MOUDI; TSI GmbH, 125R), which allowed sampling of 13 different stages with particle diameters between 10 µm and 10 nm. The flow rate was kept constant at 10 L min−1. The filter samples were stored in a freezer at −25 ∘C until analysis. A total of 203 filter samples were collected and analyzed.
2.2 Chamber experiments
We performed ozonolysis experiments with enantiomerically pure (−)- and (+)-α-pinene (Sigma-Aldrich, 99 %; enantiomeric excess (ee) 97 %) to identify the resulting pinic acid enantiomers. For this purpose, we used a 100 L glass reaction chamber that was completely darkened. Prior to an experiment, the chamber was purged with synthetic air overnight to remove residual particles and reactants from the gas phase. In addition, an activated carbon trap was used to eliminate all organic compounds in the airstream. For each experiment, the chamber was flushed with humidified synthetic air at a constant rate of 6 L min−1, resulting in a relative humidity of 50 %. Ozone was generated using the calibration system of an ozone analyzer (Dasibi, 1008-RS) and then introduced into the chamber at a flow rate of 3 L min−1. The ozone concentration stabilized at about 800 ppb (parts per billion). The VOC precursor compound was placed in a diffusion test gas source maintained at 40 ∘C (Thorenz et al., 2012). A flow rate of 1 L min−1 was set to transport the VOCs into the reaction chamber. On average, an α-pinene concentration of 200 ppb was present in the chamber. The particle size distribution for diameters between 10 and 800 nm was recorded using a scanning mobility particle sizer (SMPS; GRIMM Aerosol Technik Ainring GmbH & Co. KG, Advanced CPC 5.416). Details can be found in the Supplement.
2.3 Sample preparation and LC-MS analysis
One half of each filter was extracted three times with 1.5 mL in a 9 : 1 mixture of methanol and water (Fisher Scientific, Optima™ grade) in a laboratory shaker for 30 min. The resulting extracts were combined and filtered through a 0.2 µm PTFE syringe filters (Carl Roth GmbH + Co. KG, ROTILABO® KC94.1) to remove undissolved material. The solvent was then completely evaporated under a gentle N2 stream, and 700 µL of a 9 : 1 mixture of water and acetonitrile (Fisher Scientific, Optima™ grade) was added to the remaining residue. All samples were analyzed using an ultra-high performance liquid chromatograph (UHPLC; Thermo Fisher Scientific Inc., UltiMate 3000) coupled to an Orbitrap mass spectrometer (MS; Thermo Fisher Scientific Inc., Q Exactive™). The instrument was equipped with an electrospray ionization (ESI) source and operated in the negative mode. The MS system was regularly calibrated with a negative ion calibration solution (Thermo Fisher Scientific Inc., Pierce™). The mass resolution was 140 000 at 200, with mass accuracies less than 1 ppm (parts per million). To obtain sufficient ion signal intensities, the following ESI-MS parameters were applied: spray voltage −3.2 kV, capillary temperature 300 ∘C, auxiliary gas flow 10, sheath gas flow 30, and S-lens radio frequency (RF) level 50 %. Chiral separation was performed on an amylose-based tris(3-chloro-5-methylphenylcarbamate) column (150 × 2.1 mm ID, 5 µm, Daicel, CHIRALPAK® IG). Eluent A (water with 2 % acetonitrile and 0.04 % formic acid) and Eluent B (acetonitrile with 2 % water) were used for isocratic separation (80 : 20) at a constant flow of 200 µL min−1. Several characteristic marker species for biogenic SOA, such as pinic acid, pinonic acid, and 3-methyl-1,2,3-butanetricarboxylic acid (MBTCA), but also compounds such as levoglucosan, were used to optimize and verify the chromatographic performance. For this purpose, calibration solutions were prepared in a mixture of water and acetonitrile (9 : 1), with concentrations ranging from 0.5 to 800 ng mL−1. The solutions for blank determination were prepared in the same way. The column temperature was maintained at 25 ∘C. To ensure the identification of pinic acid in the collected aerosol samples, a standard compound was synthesized according to Moglioni et al. (2000). Seven-point calibration curves were generated for the target analyte, pinic acid, with concentrations ranging from 0.5 to 500 ng mL−1. The resulting calibration functions showed correlation coefficients > 0.98. The limit of detection (LOD) for pinic acid gave a value of 1.74 ng mL−1.
To identify the two enantiomers of pinic acid, a synthesized reference standard was analyzed by high-performance liquid chromatography coupled with mass spectrometry (HPLC-MS). The liquid chromatography method was optimized to ensure baseline separation of the two stereoisomers. The liquid chromatograph (LC) method was optimized to ensure baseline separation of the two stereoisomers. The corresponding chromatogram is shown in Fig. 1a. Integration of the reference standard resulted in almost equal signal areas, indicating a racemic standard compound. As confirmed by chamber experiments (Fig. 1c), the first signal (red line) can be assigned to the oxidation product of enantiomerically pure (+)-α-pinene. It is referred to as E1 in this study. In the subsequent experiment, enantiomerically pure (−)-α-pinene was oxidized. Accordingly, the later eluting second signal resulted from the ozonolysis of pure (−)-α-pinene and is designated as E2. As can be seen in Fig. 1c, E1 was also detected after the oxidation of (−)-α-pinene. This was caused by memory effects from the previous chamber experiment with (+)-α-pinene, a common observation in SOA experiments caused by pinic acid condensation on the chamber walls and revolatilization in subsequent experiments. This was also confirmed by the observation of a steady decrease in this carryover in further experiments. However, these results allowed the unambiguous identification and quantification of both pinic acid stereoisomers in the measurements of filter samples from the Amazon rainforest. Since the particular molecular formula C9H14O4 ( 185.0819) is common for oxidation products of various monoterpenes (Kourtchev et al., 2015), for example also for the products of the oxidation of Δ-3-carene and sabinene, i.e., sabinic and 3-caric acid (Larsen et al., 2001), additional signals were observed in the measurements at the ATTO tower besides those formed by the α-pinene oxidation (Fig. 1b). No further assignment of these signals was made in this study.
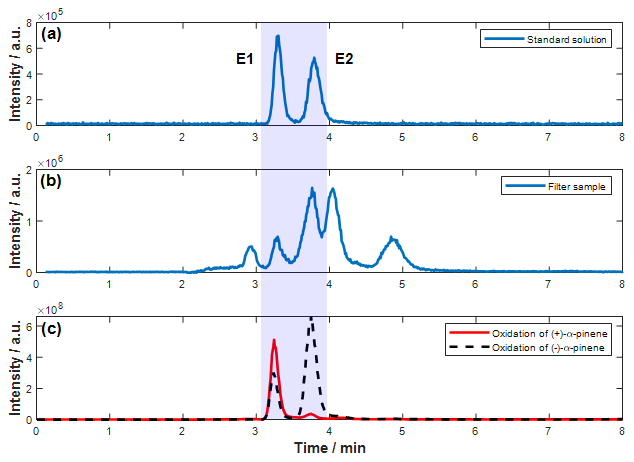
Figure 1Typical chromatograms of pinic acid C9H14O4 ([M−H]− 185.0819). Both stereoisomers are baseline separated in a reference standard aqueous solution (a). Integration resulted in equal areas, which indicates a racemic mixture. Panel (b) illustrates an exemplary analysis of a filter sample. These experiments revealed additional signals at 185.0819, a typical mass for monoterpene oxidation products. Panel (c) highlights the results of the chamber experiments to distinguish between both stereoisomers of pinic acid (E1 in red results from the ozonolysis of (+)-α-pinene and E2 in dashed black results from the ozonolysis of (−)-α-pinene).
3.1 Vertical concentration gradients of pinic acid on PM2.5 filter samples
Zannoni et al. (2020) showed, with measurements made at the ATTO tower, that the enantiomeric ratio of α-pinene varies with (+)-α-pinene dominating at canopy level and (−)-α-pinene dominating at the top level of the tower. The ratio was observed to be independent of wind direction and speed, and the authors suggest the presence of a potent uncharacterized local (+)-α-pinene-rich source, possibly linked to herbivory and termites. Here, we report similar observations for the chiral ratio of pinic acid enantiomers in the particle phase. Figure 2 illustrates the atmospheric concentrations of both stereoisomers in nanograms per cubic meter (ng m−3) measured at different heights at ATTO during the dry season in October 2018 (denoted as DS18), the wet season in March 2019 (WS19), and the dry season in September 2019 (DS19). The displayed data correspond to the calculated mean values for the respective campaign in the morning hours (07:00–12:00 local time, LT, only for DS19), during the daytime (07:00–17:00 LT for DS18 and WS19; 12:00–17:00 LT for DS19), and during the nighttime (17:00–07:00 LT). The instrumental detection limits were sufficiently low for both pinic acid stereoisomers (see Fig. S5 in the Supplement), which enabled the reliable quantification of most atmospheric concentrations. However, some samples revealed concentrations of E1 below the detection limit. This occurred mainly for samples taken during the wet season with generally lower particle concentrations (see the Supplement) and for measurements at 320 m during DS19. Nevertheless, these values were included in the calculation of the chiral ratio, as they still represent the trend.
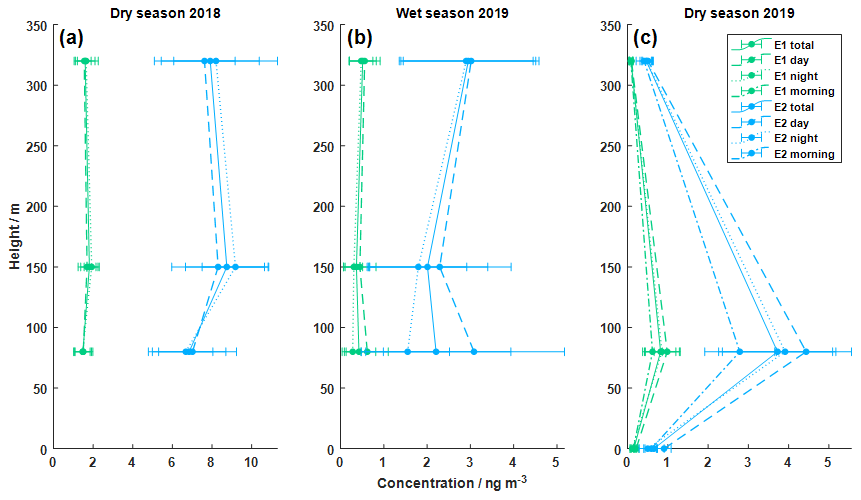
Figure 2Vertical concentration profiles of the pinic acid enantiomers E1 and E2 during three different campaigns (panel a is dry season in 2018, specifically October 2018, panel b is the wet season in 2019, specifically March 2019, and panel c is the dry season in 2019, specifically September 2019). Aerosol filter samples were collected at 80, 150, and 320 m for the dry season in 2018 and the wet season in 2019. For the dry season in 2019, the instrument at 150 m was moved to the ground level at 0 m. Daytime refers to 07:00–17:00 LT, and nighttime refers to 17:00–07:00 LT during the first two campaigns. For the third campaign, the time resolution was improved, with the morning time between 07:00–12:00 LT, daytime between 12:00–17:00 LT, and nighttime between 17:00–07:00 LT. All times are local time. The data points correspond to the mean values of all measurements.
As can be seen in Fig. 2, all samples had higher concentrations of E2 than E1, with maximum values at 80 and 150 m for the dry seasons. The higher concentrations of the E2 precursor (−)-α-pinene could be an explanation for this observation. The highest average concentrations of E2 were measured during DS18 at 150 m with (9 ± 2) ng m−3 (errors are represented by 1 standard deviation of the data sets), while the lowest average concentrations of (0.09 ± 0.04) ng m−3 were recorded during DS19 at 320 m. All values are listed in Table 1. Contrary to expectations, the concentrations at 320 m during DS19 were significantly lower than during DS18 and lower than the values of WS19. However, during this period (DS19), significantly lower total particle masses were also observed (see the SMPS data in Fig. S8). This may have caused the significantly lower pinic acid concentrations on the top of the sampling platform. During the DS19 campaign, the aerosol collector was moved from 150 m to the ground level to include chemistry below the canopy in our observations. Concentrations for pinic acid were lower below the canopy, which was also reported by Plewka et al. (2006) during measurements in a coniferous forest in Germany. They concluded that increased actinic radiation above the canopy could be the reason for this observation. However, the significantly lower ozone concentrations below the canopy and particle sinks due to dry deposition also fit this observation. Thus, the measured concentration profiles suggest photochemical processes and oxidation chemistry above the forest. Additionally, as recently reported by Bourtsoukidis et al. (2018), soil can be excluded as a potentially effective monoterpene source at ATTO. Consequently, lower ground-level concentrations of pinic acid are expected. The α-pinene emissions exhibit a pronounced day–night cycle and reach their maximum together with photosynthetically active radiation (PAR) and temperature between about 11:00 to 14:00 LT (Zannoni et al., 2020). In comparison, a temporal shift in the diel concentration maxima is expected for the particulate phase, which is caused by mixing and chemical aging. As assumed, the mean concentrations of the measured VOC oxidation products were higher during the daytime in each campaign, except for 80 and 320 m during DS18 (Fig. 2). But, of course, the coarse temporal resolution of the present measurements prevents the determination of more detailed diel concentration profiles.
Table 1Average concentration values for E1 and E2 at different heights during three measurement campaigns. Errors are represented as standard deviations of the data set. Additionally, the calculated enantiomeric ratio, ER, is listed.
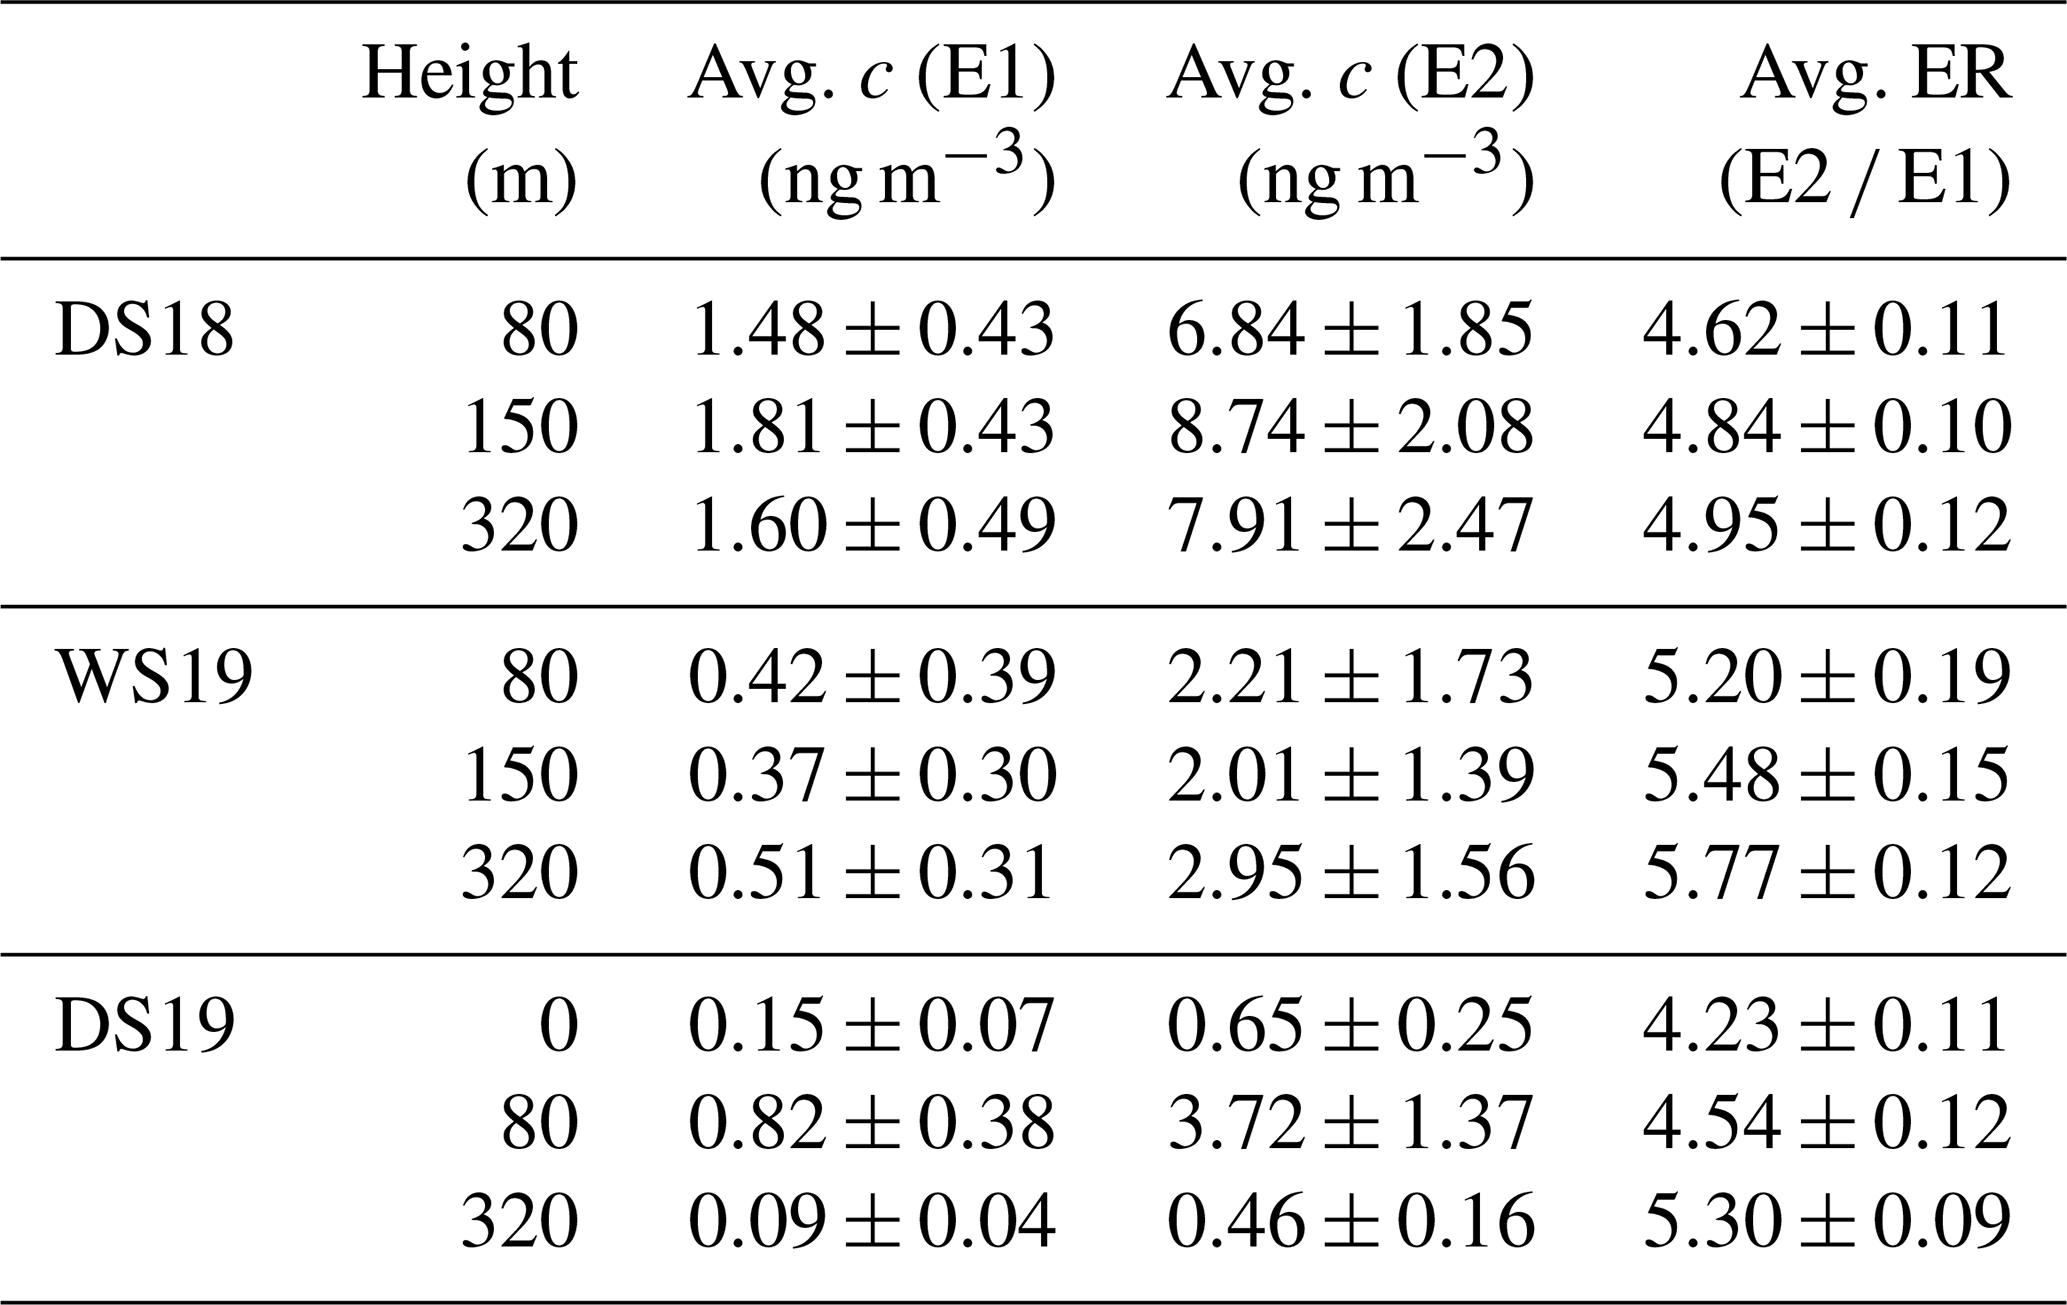
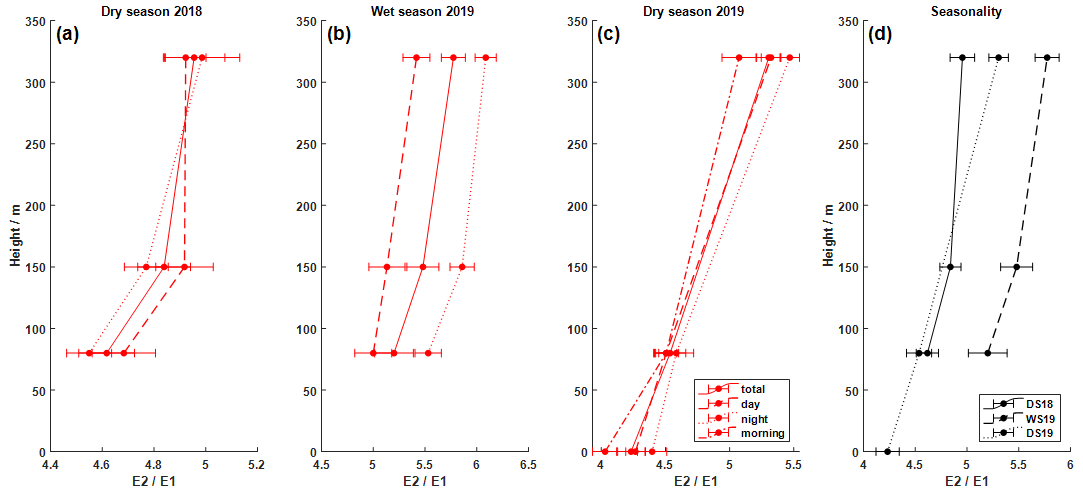
Figure 3Vertical profiles of the enantiomeric ratio E2 E1 (a–c). The local times correspond to those shown in Fig. 2. Additionally, the comparison for all campaigns is shown in panel (d) (DS is the dry season, and WS is the wet season). There is a constant increase in E2 compared to E1 with increasing altitude. All values are in the same magnitude. However, the wet season was characterized by slightly larger ratios.
Figure 3 shows the calculated enantiomer ratios for both stereoisomers of pinic acid (E2 E1). The most remarkable result is that the ratio increases consistently with tower height over all measurement periods. Although the absolute concentrations of the pinic acid enantiomers vary considerably between campaigns, the chiral ratios are always in the range of 4–6. The dry seasons are characterized by ratios of about 4.6 ± 0.1 and 4.5 ± 0.1 at 80 m, while the wet season shows elevated values of 5.2 ± 0.2. At 320 m, the E2 enantiomer resulting from (−)-α-pinene oxidation is even more dominant, leading to ratios of 4.9 ± 0.1 and 5.30 ± 0.09 during the dry seasons and 5.8 ± 0.1 during the wet season, respectively. Compared to the vertical concentration gradients of pinic acid in Fig. 2, the enantiomer ratios increase with tower height, regardless of the absolute concentrations. This fits very well with the observations of Zannoni et al. (2020), as they described similar results for the chiral ratio of (−)-α-pinene (+)-α-pinene, i.e., the precursors of the analytes measured here. Increasing values from 0.38 to 6.5 (40 and 320 m, respectively) were reported, with (−)-α-pinene being the dominant species in the gas phase at the top of ATTO. The chamber experiments performed (Fig. 1) showed that E2 is the oxidation product of (−)-α-pinene. Therefore, as shown in Fig. 3, the chiral ratio in the particulate phase behaves similarly to that in the gas phase but is much less pronounced. It ranges from 4.2 ± 0.1 near the ground to 5.8 ± 0.1 at 320 m altitude. Remarkably, as reported by Zannoni et al. (2020), there was little variation in the two α-pinene enantiomers in the gas phase during the 2018 wet season. This finding is not consistent with the results from the particulate phase as shown in Fig. 3, at least when compared to the 2019 results. Similar to the dry seasons, the chiral ratio of pinic acid also shows steady growth with increasing tower height during the wet season.
The emission of α-pinene and the ratio of enantiomers released is determined by the vegetation and thus, for ecosystem measurement sites such as ATTO, by the local flora, possibly with additional contributions from the local fauna such as termites (Zannoni et al., 2020). Therefore, the measurements at different altitudes in the present study first reflect differences in releases from different source regions, which ultimately depend on the effective measurement altitude (Arriga et al., 2017). Thus, the measurements reflect local sources at lower levels and regional influences at higher levels (Bakwin et al., 1998; Andrews et al., 2014). Because of the high reactivity of biogenic VOCs to OH radicals and ozone, the mean tropospheric lifetime of α-pinene is only 2.6 h ([OH] 2.0–106 molec. cm−3) and 4.6 h ([O3] 7–1011 molec. cm−3), respectively (Atkinson, 1997, 2000; Kesselmeier and Staudt, 1999). Thus, strong local sources such as insects can alter the enantiomer distribution in the gas phase. Consequently, the chiral ratio for α-pinene at ATTO varies strongly with increasing tower height. However, oxidative formation and especially depletion of pinic acid occur on different timescales, with estimated lifetimes of several days (Rogge et al., 1993; Rudich et al., 2007; Schauer et al., 1996). The difference between the two enantiomers is therefore much less pronounced for the chiral oxidation products but also reflects the different footprint ranges.
3.2 Daily variations in pinic acid concentrations
Figure 4 shows the absolute concentrations for E1 and E2 of pinic acid near the ground (blue), at 80 m (dark green), 150 m (green), and 320 m (light green) for the three measurement campaigns. In general, absolute concentrations at the respective tower heights vary rather slightly within each campaign, with the greatest variation just above the canopy on the 80 m platform.
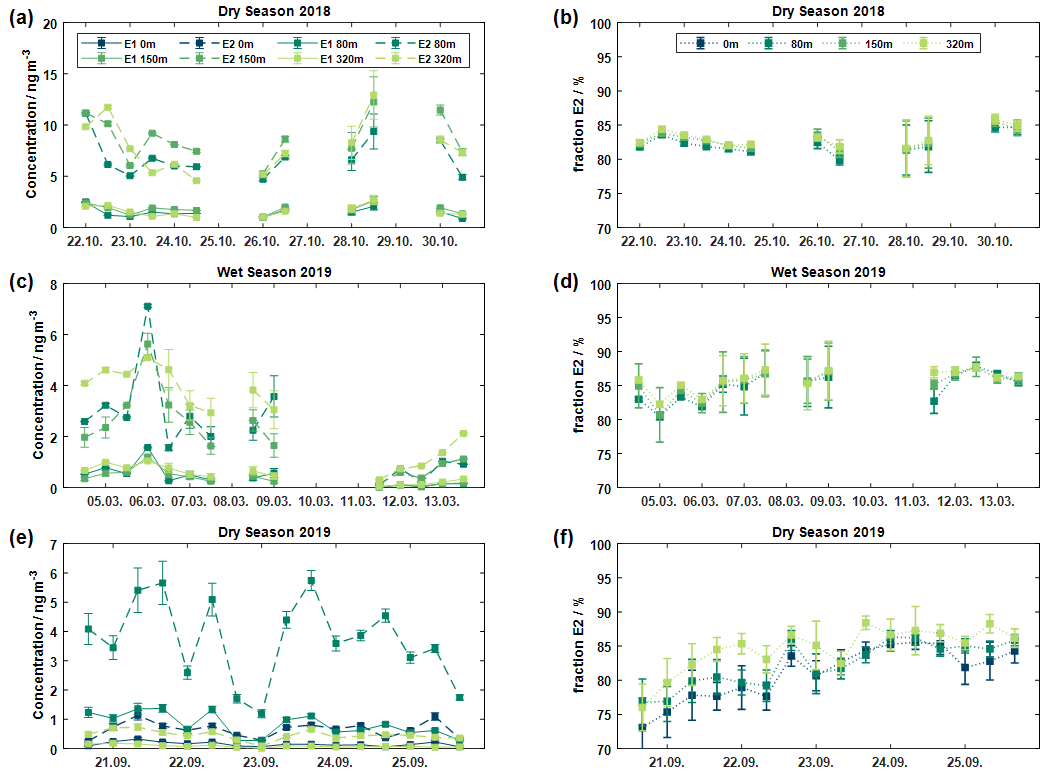
Figure 4Absolute concentrations of E1 and E2 at different heights at ATTO are displayed in panels (a), (c), and (e) for three different measurement campaigns, respectively. The resulting chiral relative abundance of E2 is illustrated in panels (b), (d), and (f). Each data point corresponds to a sample collected at ATTO. The analysis of aerosol samples at ground level (0 m) was only performed during the dry season 2019.
It is clear that the 80 m values are more influenced by local sources than the 150 m and 320 m heights. This is evident for both the DS19 and WS19 campaigns. In particular, the daytime samples (6, 7, and 9 March 2019) show different concentration trends at 80 m height compared to the higher tower levels. An obvious explanation is characterized by an effective coupling between the forest canopy and the superjacent atmosphere caused by strong turbulent activity during the daytime (Andreae et al., 2015). Measurements within this roughness sublayer (RSL) are expected to be strongly influenced by the various roughness elements. In general, the RSL is thought to extend to approximately 2 to 3 times the canopy height of about 40 m (Raupach et al., 1996; Williams et al., 2007; Chor et al., 2017). In addition, according to Dias-Júnior et al. (2019), the RSL merges directly into the adjacent convective mixed layer. Thus, similar conditions exist for both 150 and 320 m heights, resulting in decoupled concentration profiles compared to 80 m.
The proportions of the two enantiomers showed almost constant ratios for both the different sampling heights and within each measurement campaign (see Fig. 4b, d, f). However, as indicated above, the ratios were also quite similar between the different campaigns. A certain trend can be seen in the dry season of 2019 (Fig. 4f), as here the relative concentration of E2 increased over time at all observation heights. All these observations supported the idea that the chiral ratio is determined by mixing and transport processes rather than by the preferential formation of a particular enantiomer.
3.3 Particle-size-resolved measurements at the triangular mast
In addition to the PM2.5 filter samples, MOUDI measurements were carried out to investigate the chiral ratio of pinic acid at different particle diameters. Size-resolved samples were collected at the 60 m inlet of the triangular mast during each campaign. Figure 5 shows the concentration of E1 and E2 in the different particle fractions. Similar to the PM2.5 samples, all MOUDI samples were dominated by the E2 enantiomer. However, especially in the size range with small particles (diameter ≤ 100 nm) and large particles (diameter ≥ 1000 nm), low total particle mass concentrations were measured (see Fig. S9), resulting partly in concentrations of the dicarboxylic acid below the detection limit. Nevertheless, these values were included in the figure as they illustrate the general trend. All measurements showed elevated concentrations of pinic acid for the particle size range between 180 and 560 nm diameter. Maximum concentrations of (0.027 ± 0.002) ng m−3 for E1 and (0.113 ± 0.023) ng m−3 for E2 were determined in both dry seasons. The rainy season reached maximum concentrations of (0.026 ± 0.020) ng m−3 for E1 and (0.077 ± 0.059) ng m−3 for E2. It should be noted that these results are mean concentrations that include four and two MOUDI measurements, respectively. This is due to the fact that the sampling time was significantly extended to ensure sufficient aerosol mass loadings on the filters.
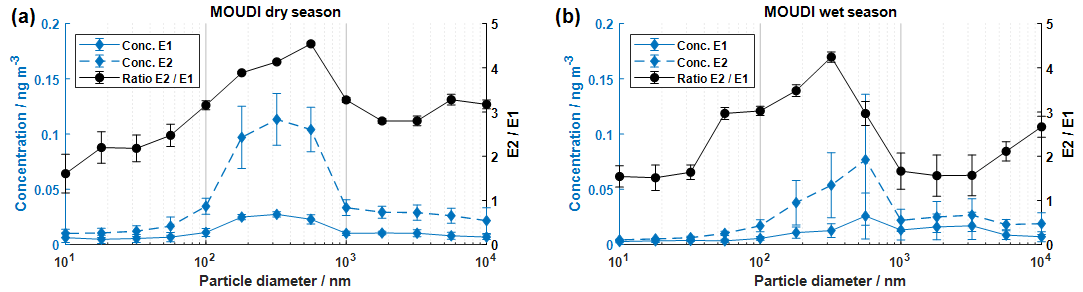
Figure 5Particle-size-resolved MOUDI measurements of pinic acid at the triangular mast (60 m; panel a shows the dry season, and panel b shows the wet season). The concentrations of E1 and E2 are illustrated together with the resulting chiral ratio. Both seasons revealed elevated concentrations in the particle size range between 180 and 560 nm in diameter. The concentrations for small particle diameters (< 56 nm) were partially below the limit of detection. The respective values are still shown to illustrate the trend. The data points correspond to the mean values of all measurements.
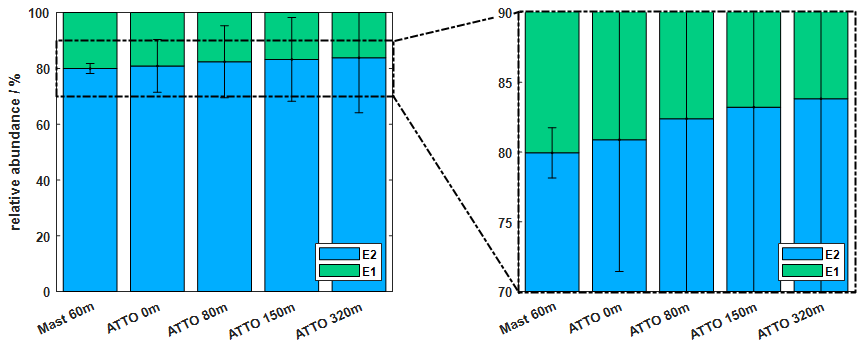
Figure 6The average relative abundance is illustrated for five different sampling locations at the triangular mast and ATTO tower for all seasons. The right panel shows a magnified version to highlight the increasing fraction of E2 with tower height. Apparently, the triangular mast exhibits a different local emission signature caused by the dense inclusion into the forest structure.
The concentrations of E1 and E2 showed essentially similar size distributions to the particle size distribution measured with SMPS systems during the respective measurement periods (see Fig. S9). Accordingly, the highest concentrations of pinic acid are found in particles with diameters between 100 and 600 nm, which represents the accumulation mode of the particle size distribution. In fact, the absolute concentrations are slightly lower compared to the samples collected at ATTO, which could have two reasons. First, the MOUDI samples were collected with a 60 m inlet, which may result in particle losses in the inlet lines. Second, the sampling time was extended to several days, which could obviously favor sampling artifacts such as the evaporation/decomposition of the target analyte during sampling. Consequently, lower concentrations of pinic acid are found. The resulting chiral ratios between E2 and E1 tend to be lower, with average values of 4.2 and 3.6 for the dry and wet seasons, respectively, but are still quite similar to the measurements presented previously at ATTO. The observed shape of the size distribution of the ratio of the two enantiomers, also shown in Fig. 5, is interesting but not easily explained. The comparatively high relative contributions of E1 (E2 E1 value ratios between 1.5 and 3) in the particularly small (< 100 nm) and particularly large particles (> 1000 nm) are striking. As discussed above, such behavior could be caused by an aerosol matrix that is also chiral, meaning that, for example, the E1 enantiomer is preferentially incorporated into the particle phase. Although such behavior can certainly not be ruled out by our measurements, there are other possible explanations. In principle, the particle size is also related to the different ages of the aerosol particles. The very small particle fractions are comparatively young because, after particle formation (whether released as small primary particles or newly formed by gas–particle conversion), condensation processes from the gas phase (or coagulation) cause the particles to grow so that they transition to larger particle regions with increasing age. Thus, a different ratio of the two enantiomers could be explained by the fact that the chiral precursors of the particles formed in the immediate vicinity of the measurement site have a different ratio here than in a more spacious environment. Indeed, Zannoni et al. (2020) was able to measure higher (+)-α-pinene concentrations (i.e., the precursor of E1) closer to the measurement site than far above the ground. However, the again relatively small E2 E1 ratios of particles larger than 1000 nm do not fit such an interpretation. Finally, the cause could be an analytical artifact that simply shows small but constant additive effects at lower concentrations (e.g., due to additive cross-interference from coeluting substances). Future measurements will have to show which of the possible explanations really explains the observations made.
Figure 6 again compares the results at the two different sites and the different measurement heights with respect to the relative abundances of E1 and E2 for all seasons. Unlike the ATTO tower, the triangular mast is fully integrated into the forest structure without any clearing and therefore may better represent the local emission signature at low altitudes. Zannoni et al. (2020) suggested that insects could be a potential source to alter the chiral ratio of monoterpenes. In particular, termites have shown (+)-α-pinene-enriched emissions. Apparently, their contribution can shift the chiral ratio from locally dominant (+)-α-pinene to (−)-α-pinene.
The present study reports the concentrations and ratios of the two enantiomers of pinic acid within and above the Amazon rainforest at the ATTO site. In all samples, the enantiomer from the oxidation of (−)-α-pinene dominated, confirming the results of precursor measurements at the same site. Similar to the gas phase, a gradient in the ratios of the two enantiomers with increasing tower height was also evident in the particle phase. This observation was consistent over three measurement campaigns from October 2018 to September 2019. The measurements shown at different heights suggest that the results reflect differences in the releases of the chiral precursors, which do depend on the effective measurement height. Thus, local sources influence the results at lower levels, and regional sources influence those at higher levels. Somewhat different patterns were observed at 80 m sampling height than at the higher levels, which again indicates that, for measurements at 80 m, the local emission conditions have a greater influence on the results. The results obtained from the triangular mast support this assumption.
Overall, the presented results show that the chiral relationship of the biogenic precursor compound α-pinene is preserved in the oxidation products studied here and can thus be used to interpret the biogenic emission sources. However, due to the different lifetimes of the precursor VOC and the particle-bound oxidation products, using the chiral ratios of the longer-lived compound provides a larger-scale picture of precursor emissions, while also revealing local and regional influences. However, it should also be mentioned that further improvements in analytical methods would be useful. The molecular formula C9H14O4 of pinic acid can be formed by a number of other monoterpenes, which makes a reliable quantification at very low concentrations difficult. Therefore, in particular, an increase in the amounts of analyte transferred to LC/MS analysis, e.g., through further sample preparation steps to reduce solvent volumes, would be extremely helpful. In addition, further chamber experiments with other relevant BVOCs would certainly be helpful to identify and assign the additional LC signals observed. This could potentially provide further helpful information on large-scale biogenic VOC releases and their contributions to the atmospheric particulate phase.
The data sets are available at upon registration at https://www.attodata.org (last access: 25 January 2022), and more information can be given by Thorsten Hoffmann (t.hoffmann@uni-mainz.de).
The supplement related to this article is available online at: https://doi.org/10.5194/acp-23-809-2023-supplement.
DL conducted the aerosol sampling and the sample preparation. DL analyzed the data and wrote the first draft. NZ helped to collect the aerosol samples. DL and LK were responsible for the chamber experiments. LK and CP provided the SMPS data. The meteorological data were provided by MS. TH supervised the study. DL and TH wrote the final paper with the help of JW and MCS. All authors contributed to the scientific exchange and read and revised the paper.
The contact author has declared that none of the authors has any competing interests.
Publisher's note: Copernicus Publications remains neutral with regard to jurisdictional claims in published maps and institutional affiliations.
For the operation of the ATTO site, we acknowledge the support by the German Federal Ministry of Education and Research (BMBF), the Brazilian Ministério da Ciência, Technologia e Inovação (MCTI/FINEP), the Amazon State University (UEA), FAPEAM, LBA/INPA, and SDS/CEUC/RDS-Uatumã. We also acknowledge the support from the Max Planck Graduate Center, the Max Planck Society, and the Instituto Nacional de Pesquisas da Amazonia (INPA).
This research has been supported by the German
Federal Ministry of Education and Research (BMBF, grant no. 01LK1602D)); the Brazilian Ministério da Ciência, Technologia e Inovação
(MCTI/FINEP); the Amazon State University (UEA); Fundação de Amparo à Pesquisa do Estado do Amazonas (FAPEAM); LBA/INPA;
and SDS/CEUC/RDS-Uatumã.
This open-access publication was funded by Johannes Gutenberg University Mainz.
This paper was edited by Alexander Laskin and reviewed by two anonymous referees.
Andreae, M. O., Acevedo, O. C., Araùjo, A., Artaxo, P., Barbosa, C. G. G., Barbosa, H. M. J., Brito, J., Carbone, S., Chi, X., Cintra, B. B. L., da Silva, N. F., Dias, N. L., Dias-Júnior, C. Q., Ditas, F., Ditz, R., Godoi, A. F. L., Godoi, R. H. M., Heimann, M., Hoffmann, T., Kesselmeier, J., Könemann, T., Krüger, M. L., Lavric, J. V., Manzi, A. O., Lopes, A. P., Martins, D. L., Mikhailov, E. F., Moran-Zuloaga, D., Nelson, B. W., Nölscher, A. C., Santos Nogueira, D., Piedade, M. T. F., Pöhlker, C., Pöschl, U., Quesada, C. A., Rizzo, L. V., Ro, C.-U., Ruckteschler, N., Sá, L. D. A., de Oliveira Sá, M., Sales, C. B., dos Santos, R. M. N., Saturno, J., Schöngart, J., Sörgel, M., de Souza, C. M., de Souza, R. A. F., Su, H., Targhetta, N., Tóta, J., Trebs, I., Trumbore, S., van Eijck, A., Walter, D., Wang, Z., Weber, B., Williams, J., Winderlich, J., Wittmann, F., Wolff, S., and Yáñez-Serrano, A. M.: The Amazon Tall Tower Observatory (ATTO): overview of pilot measurements on ecosystem ecology, meteorology, trace gases, and aerosols, Atmos. Chem. Phys., 15, 10723–10776, https://doi.org/10.5194/acp-15-10723-2015, 2015.
Andrews, A. E., Kofler, J. D., Trudeau, M. E., Williams, J. C., Neff, D. H., Masarie, K. A., Chao, D. Y., Kitzis, D. R., Novelli, P. C., Zhao, C. L., Dlugokencky, E. J., Lang, P. M., Crotwell, M. J., Fischer, M. L., Parker, M. J., Lee, J. T., Baumann, D. D., Desai, A. R., Stanier, C. O., De Wekker, S. F. J., Wolfe, D. E., Munger, J. W., and Tans, P. P.: CO2, CO, and CH4 measurements from tall towers in the NOAA Earth System Research Laboratory's Global Greenhouse Gas Reference Network: instrumentation, uncertainty analysis, and recommendations for future high-accuracy greenhouse gas monitoring efforts, Atmos. Meas. Tech., 7, 647–687, https://doi.org/10.5194/amt-7-647-2014, 2014.
Arriga, N., Rannik, Ü., Aubinet, M., Carrara, A., Vesala, T., and Papale, D.: Experimental validation of footprint models for eddy covariance CO2 flux measurements above grassland by means of natural and artificial tracers, Agr. Forest Meteorol., 242, 75–84, https://doi.org/10.1016/j.agrformet.2017.04.006, 2017.
Artaxo, P., Rizzo, L. V., Brito, J. F., Barbosa, H. M. J., Arana, A., Sena, E. T., Cirino, G. G., Bastos, W., Martin, S. T., and Andreae, M. O.: Atmospheric aerosols in Amazonia and land use change: From natural biogenic to biomass burning conditions, Faraday Discuss., 165, 203–235, https://doi.org/10.1039/c3fd00052d, 2013.
Atkinson, R.: Gas-Phase Tropospheric Chemistry of Volatile Organic Compounds: 1. Alkanes and Alkenes, J. Phys. Chem. Ref. Data, 26, 215–290, https://doi.org/10.1063/1.556012, 1997.
Atkinson, R.: Atmospheric chemistry of VOCs and NOx, Atmos. Environ., 34, 2063–2101, https://doi.org/10.1016/S1352-2310(99)00460-4, 2000.
Baccini, A., Goetz, S. J., Walker, W. S., Laporte, N. T., Sun, M., Sulla-Menashe, D., Hackler, J., Beck, P. S. A., Dubayah, R., Friedl, M. A., Samanta, S., and Houghton, R. A.: Estimated carbon dioxide emissions from tropical deforestation improved by carbon-density maps, Nat. Clim. Change, 2, 182–185, https://doi.org/10.1038/nclimate1354, 2012.
Baker, M. B., Albertazzi, L., Voets, I. K., Leenders, C. M. A., Palmans, A. R. A., Pavan, G. M., and Meijer, E. W.: Consequences of chirality on the dynamics of a water-soluble supramolecular polymer, Nat. Commun., 6, 6234, https://doi.org/10.1038/ncomms7234, 2015.
Bakwin, P. S., Tans, P. P., Hurst, D. F., and Zhao, C.: Measurements of carbon dioxide on very tall towers: results of the NOAA/CMDL program, Tellus B, 50, 401–415, https://doi.org/10.3402/tellusb.v50i5.16216, 1998.
Bourtsoukidis, E., Behrendt, T., Yañez-Serrano, A. M., Hellén, H., Diamantopoulos, E., Catão, E., Ashworth, K., Pozzer, A., Quesada, C. A., Martins, D. L., Sá, M., Araujo, A., Brito, J., Artaxo, P., Kesselmeier, J., Lelieveld, J., and Williams, J.: Strong sesquiterpene emissions from Amazonian soils, Nat. Commun., 9, 2226, https://doi.org/10.1038/s41467-018-04658-y, 2018.
Cash, J. M., Heal, M. R., Langford, B., and Drewer, J.: A review of stereochemical implications in the generation of secondary organic aerosol from isoprene oxidation, Environm. Sci.-Proc. Imp., 18, 1369–1380, https://doi.org/10.1039/c6em00354k, 2016.
Chor, T. L., Dias, N. L., Araújo, A., Wolff, S., Zahn, E., Manzi, A., Trebs, I., Sá, M. O., Teixeira, P. R., and Sörgel, M.: Flux-variance and flux-gradient relationships in the roughness sublayer over the Amazon forest, Agr. Forest Meteorol., 239, 213–222, https://doi.org/10.1016/j.agrformet.2017.03.009, 2017.
Christoffersen, T., Hjorth, J., Horie, O., Jensen, N., Kotzias, D., Molander, L., Neeb, P., Ruppert, L., Winterhalter, R., Virkkula, A., Wirtz, K., and Larsen, B.: cis-pinic acid, a possible precursor for organic aerosol formation from ozonolysis of α-pinene, Atmos. Environ., 32, 1657–1661, https://doi.org/10.1016/S1352-2310(97)00448-2, 1998.
Claeys, M., Szmigielski, R., Kourtchev, I., van der Veken, P., Vermeylen, R., Maenhaut, W., Jaoui, M., Kleindienst, T. E., Lewandowski, M., Offenberg, J. H., and Edney, E. O.: Hydroxydicarboxylic acids: markers for secondary organic aerosol from the photooxidation of alpha-pinene, Environ. Sci. Technol., 41, 1628–1634, https://doi.org/10.1021/es0620181, 2007.
Dias-Júnior, C. Q., Dias, N. L., Santos, R. M. N., Sörgel, M., Araújo, A., Tsokankunku, A., Ditas, F., Santana, R. A., Randow, C., Sá, M., Pöhlker, C., Toledo Machado, L. A., Sá, L. D., Moran-Zuloaga, D., Janssen, R., Acevedo, O., Oliveira, P., Fisch, G., Chor, T., and Manzi, A.: Is There a Classical Inertial Sublayer Over the Amazon Forest?, Geophys. Res. Lett., 46, 5614–5622, https://doi.org/10.1029/2019GL083237, 2019.
González, N. J. D., Borg-Karlson, A.-K., Artaxo, P., Guenther, A., Krejci, R., Nozière, B., and Noone, K.: Primary and secondary organics in the tropical Amazonian rainforest aerosols: chiral analysis of 2-methyltetraols, Environm. Sci.-Proc. Imp., 16, 1413–1421, https://doi.org/10.1039/c4em00102h, 2014.
Goulding, M. and Barthem, R.: The Smithsonian atlas of the Amazon, Smithsonian Institution; Combined Academic, Washington, D.C., Chesham, 325 pp., ISBN 1-58834-135-6, 2003.
Guenther, A. B., Jiang, X., Heald, C. L., Sakulyanontvittaya, T., Duhl, T., Emmons, L. K., and Wang, X.: The Model of Emissions of Gases and Aerosols from Nature version 2.1 (MEGAN2.1): an extended and updated framework for modeling biogenic emissions, Geosci. Model Dev., 5, 1471–1492, https://doi.org/10.5194/gmd-5-1471-2012, 2012.
Hallquist, M., Wenger, J. C., Baltensperger, U., Rudich, Y., Simpson, D., Claeys, M., Dommen, J., Donahue, N. M., George, C., Goldstein, A. H., Hamilton, J. F., Herrmann, H., Hoffmann, T., Iinuma, Y., Jang, M., Jenkin, M. E., Jimenez, J. L., Kiendler-Scharr, A., Maenhaut, W., McFiggans, G., Mentel, Th. F., Monod, A., Prévôt, A. S. H., Seinfeld, J. H., Surratt, J. D., Szmigielski, R., and Wildt, J.: The formation, properties and impact of secondary organic aerosol: current and emerging issues, Atmos. Chem. Phys., 9, 5155–5236, https://doi.org/10.5194/acp-9-5155-2009, 2009.
Hoorn, C., Wesselingh, F. P., ter Steege, H., Bermudez, M. A., Mora, A., Sevink, J., Sanmartín, I., Sanchez-Meseguer, A., Anderson, C. L., Figueiredo, J. P., Jaramillo, C., Riff, D., Negri, F. R., Hooghiemstra, H., Lundberg, J., Stadler, T., Särkinen, T., and Antonelli, A.: Amazonia through time: Andean uplift, climate change, landscape evolution, and biodiversity, Science, 330, 927–931, https://doi.org/10.1126/science.1194585, 2010.
Kanakidou, M., Seinfeld, J. H., Pandis, S. N., Barnes, I., Dentener, F. J., Facchini, M. C., Van Dingenen, R., Ervens, B., Nenes, A., Nielsen, C. J., Swietlicki, E., Putaud, J. P., Balkanski, Y., Fuzzi, S., Horth, J., Moortgat, G. K., Winterhalter, R., Myhre, C. E. L., Tsigaridis, K., Vignati, E., Stephanou, E. G., and Wilson, J.: Organic aerosol and global climate modelling: a review, Atmos. Chem. Phys., 5, 1053–1123, https://doi.org/10.5194/acp-5-1053-2005, 2005.
Katsumoto, Y., Kubosaki, N., and Miyata, T.: Molecular approach to understand the tacticity effects on the hydrophilicity of poly(N-isopropylacrylamide): solubility of dimer model compounds in water, J. Phys. Chem. B, 114, 13312–13318, https://doi.org/10.1021/jp107442h, 2010.
Kesselmeier, J. and Staudt, M.: Biogenic Volatile Organic Compounds (VOC): An Overview on Emission, Physiology and Ecology, J. Atmos. Chem., 33, 23–88, https://doi.org/10.1023/A:1006127516791, 1999.
Kourtchev, I., Doussin, J.-F., Giorio, C., Mahon, B., Wilson, E. M., Maurin, N., Pangui, E., Venables, D. S., Wenger, J. C., and Kalberer, M.: Molecular composition of fresh and aged secondary organic aerosol from a mixture of biogenic volatile compounds: a high-resolution mass spectrometry study, Atmos. Chem. Phys., 15, 5683–5695, https://doi.org/10.5194/acp-15-5683-2015, 2015.
Kroll, J. H. and Seinfeld, J. H.: Chemistry of secondary organic aerosol: Formation and evolution of low-volatility organics in the atmosphere, Atmos. Environ., 42, 3593–3624, https://doi.org/10.1016/j.atmosenv.2008.01.003, 2008.
Larsen, B. R., Di Bella, D., Glasius, M., Winterhalter, R., Jensen, N. R., and Hjorth, J.: Gas-Phase OH Oxidation of Monoterpenes: Gaseous and Particulate Products, J. Atmos. Chem., 38, 231–276, https://doi.org/10.1023/A:1006487530903, 2001.
Ma, Y., Willcox, T. R., Russell, A. T., and Marston, G.: Pinic and pinonic acid formation in the reaction of ozone with alpha-pinene, Chem. Commun., 1328–1330, https://doi.org/10.1039/B617130C, 2007.
Martin, S. T., Andreae, M. O., Artaxo, P., Baumgardner, D., Chen, Q., Goldstein, A. H., Guenther, A., Heald, C. L., Mayol-Bracero, O. L., McMurry, P. H., Pauliquevis, T., Pöschl, U., Prather, K. A., Roberts, G. C., Saleska, S. R., Silva Dias, M. A., Spracklen, D. V., Swietlicki, E., and Trebs, I.: Sources and properties of Amazonian aerosol particles, Rev. Geophys., 48, RG2002, https://doi.org/10.1029/2008RG000280, 2010.
Moglioni, A. G., García-Expósito, E., Aguado, G. P., Parella, T., Branchadell, V., Moltrasio, G. Y., and Ortuño, R. M.: Divergent routes to chiral cyclobutane synthons from (−)-alpha-pinene and their use in the stereoselective synthesis of dehydro amino acids, J. Org. Chem., 65, 3934–3940, https://doi.org/10.1021/jo991773c, 2000.
Mori, K.: Stereochemical studies on pheromonal communications, P. Jpn. Acad. B-Phys., 90, 373–388, https://doi.org/10.2183/pjab.90.373, 2014.
Müller, L., Reinnig, M.-C., Naumann, K. H., Saathoff, H., Mentel, T. F., Donahue, N. M., and Hoffmann, T.: Formation of 3-methyl-1,2,3-butanetricarboxylic acid via gas phase oxidation of pinonic acid – a mass spectrometric study of SOA aging, Atmos. Chem. Phys., 12, 1483–1496, https://doi.org/10.5194/acp-12-1483-2012, 2012.
Mutzel, A., Rodigast, M., Iinuma, Y., B?ge, O., and Herrmann, H.: Monoterpene SOA: Contribution of first-generation oxidation products to formation and chemical composition, Atmos. Environ., 130, 136–144, https://doi.org/10.1016/j.atmosenv.2015.10.080, 2016.
Nozière, B., González, N. J. D., Borg-Karlson, A.-K., Pei, Y., Redeby, J. P., Krejci, R., Dommen, J., Prevot, A. S. H., and Anthonsen, T.: Atmospheric chemistry in stereo: A new look at secondary organic aerosols from isoprene, Geophys. Res. Lett., 38, L11807, https://doi.org/10.1029/2011GL047323, 2011.
Phillips, M. A., Wildung, M. R., Williams, D. C., Hyatt, D. C., and Croteau, R.: cDNA isolation, functional expression, and characterization of (+)-α-pinene synthase and (−)-α-pinene synthase from loblolly pine (Pinus taeda): Stereocontrol in pinene biosynthesis, Arch. Biochem. Biophys., 411, 267–276, https://doi.org/10.1016/S0003-9861(02)00746-4, 2003.
Plewka, A., Gnauk, T., Brüggemann, E., and Herrmann, H.: Biogenic contributions to the chemical composition of airborne particles in a coniferous forest in Germany, Atmos. Environ., 40, 103–115, https://doi.org/10.1016/j.atmosenv.2005.09.090, 2006.
Pöhlker, C., Walter, D., Paulsen, H., Könemann, T., Rodríguez-Caballero, E., Moran-Zuloaga, D., Brito, J., Carbone, S., Degrendele, C., Després, V. R., Ditas, F., Holanda, B. A., Kaiser, J. W., Lammel, G., Lavrič, J. V., Ming, J., Pickersgill, D., Pöhlker, M. L., Praß, M., Löbs, N., Saturno, J., Sörgel, M., Wang, Q., Weber, B., Wolff, S., Artaxo, P., Pöschl, U., and Andreae, M. O.: Land cover and its transformation in the backward trajectory footprint region of the Amazon Tall Tower Observatory, Atmos. Chem. Phys., 19, 8425–8470, https://doi.org/10.5194/acp-19-8425-2019, 2019.
Pöschl, U., Martin, S. T., Sinha, B., Chen, Q., Gunthe, S. S., Huffman, J. A., Borrmann, S., Farmer, D. K., Garland, R. M., Helas, G., Jimenez, J. L., King, S. M., Manzi, A., Mikhailov, E., Pauliquevis, T., Petters, M. D., Prenni, A. J., Roldin, P., Rose, D., Schneider, J., Su, H., Zorn, S. R., Artaxo, P., and Andreae, M. O.: Rainforest aerosols as biogenic nuclei of clouds and precipitation in the Amazon, Science, 329, 1513–1516, https://doi.org/10.1126/science.1191056, 2010.
Raupach, M. R., Finnigan, J. J., and Brunei, Y.: Coherent eddies and turbulence in vegetation canopies: The mixing-layer analogy, Bound.-Lay. Meteorol., 78, 351–382, https://doi.org/10.1007/BF00120941, 1996.
Rogge, W. F., Mazurek, M. A., Hildemann, L. M., Cass, G. R., and Simoneit, B. R.: Quantification of urban organic aerosols at a molecular level: Identification, abundance and seasonal variation, Atmos. Environ. A-Gen., 27, 1309–1330, https://doi.org/10.1016/0960-1686(93)90257-Y, 1993.
Rudich, Y., Donahue, N. M., and Mentel, T. F.: Aging of organic aerosol: bridging the gap between laboratory and field studies, Annu. Rev. Phys. Chem., 58, 321–352, https://doi.org/10.1146/annurev.physchem.58.032806.104432, 2007.
Saatchi, S. S., Houghton, R. A., Dos Santos Alvala, R. C., Soares, J. V., and Yu, Y.: Distribution of aboveground live biomass in the Amazon basin, Glob. Change Biol., 13, 816–837, https://doi.org/10.1111/j.1365-2486.2007.01323.x, 2007.
Schauer, J. J., Rogge, W. F., Hildemann, L. M., Mazurek, M. A., Cass, G. R., and Simoneit, B. R.: Source apportionment of airborne particulate matter using organic compounds as tracers, Atmos. Environ., 30, 3837–3855, https://doi.org/10.1016/1352-2310(96)00085-4, 1996.
Sindelarova, K., Granier, C., Bouarar, I., Guenther, A., Tilmes, S., Stavrakou, T., Müller, J.-F., Kuhn, U., Stefani, P., and Knorr, W.: Global data set of biogenic VOC emissions calculated by the MEGAN model over the last 30 years, Atmos. Chem. Phys., 14, 9317–9341, https://doi.org/10.5194/acp-14-9317-2014, 2014.
Szmigielski, R., Surratt, J. D., Gómez-González, Y., van der Veken, P., Kourtchev, I., Vermeylen, R., Blockhuys, F., Jaoui, M., Kleindienst, T. E., Lewandowski, M., Offenberg, J. H., Edney, E. O., Seinfeld, J. H., Maenhaut, W., and Claeys, M.: 3-methyl-1,2,3-butanetricarboxylic acid: An atmospheric tracer for terpene secondary organic aerosol, Geophys. Res. Lett., 34, D16312, https://doi.org/10.1029/2007GL031338, 2007.
Thorenz, U. R., Kundel, M., Müller, L., and Hoffmann, T.: Generation of standard gas mixtures of halogenated, aliphatic, and aromatic compounds and prediction of the individual output rates based on molecular formula and boiling point, Anal. Bioanal. Chem., 404, 2177–2183, https://doi.org/10.1007/s00216-012-6202-5, 2012.
Tolocka, M. P., Jang, M., Ginter, J. M., Cox, F. J., Kamens, R. M., and Johnston, M. V.: Formation of Oligomers in Secondary Organic Aerosol, Environ. Sci. Technol., 38, 1428–1434, https://doi.org/10.1021/es035030r, 2004.
Vieira, I. C. G., Toledo, P. M., Silva, J. M. C., and Higuchi, H.: Deforestation and threats to the biodiversity of Amazonia, Braz. J. Biol., 68, 949–956, https://doi.org/10.1590/s1519-69842008000500004, 2008.
Williams, C. A., Scanlon, T. M., and Albertson, J. D.: Influence of surface heterogeneity on scalar dissimilarity in the roughness sublayer, Bound.-Lay. Meteorol., 122, 149–165, https://doi.org/10.1007/s10546-006-9097-x, 2007.
Wittmann, F., Householder, E., Piedade, M. T. F., Assis, R. L. de, Schöngart, J., Parolin, P., and Junk, W. J.: Habitat specifity, endemism and the neotropical distribution of Amazonian white-water floodplain trees, Ecography, 36, 690–707, https://doi.org/10.1111/j.1600-0587.2012.07723.x, 2013.
Yasmeen, F., Vermeylen, R., Szmigielski, R., Iinuma, Y., Böge, O., Herrmann, H., Maenhaut, W., and Claeys, M.: Terpenylic acid and related compounds: precursors for dimers in secondary organic aerosol from the ozonolysis of α- and β-pinene, Atmos. Chem. Phys., 10, 9383–9392, https://doi.org/10.5194/acp-10-9383-2010, 2010.
Yasmeen, F., Szmigielski, R., Vermeylen, R., Gómez-González, Y., Surratt, J. D., Chan, A. W. H., Seinfeld, J. H., Maenhaut, W., and Claeys, M.: Mass spectrometric characterization of isomeric terpenoic acids from the oxidation of α-pinene, β-pinene, d-limonene, and Δ3-carene in fine forest aerosol, J. Mass Spectrom., 46, 425–442, https://doi.org/10.1002/jms.1911, 2011.
Zannoni, N., Leppla, D., Lembo Silveira de Assis, P. I., Hoffmann, T., Sá, M., Araújo, A., and Williams, J.: Surprising chiral composition changes over the Amazon rainforest with height, time and season, Commun. Earth Environ., 1, 9317, https://doi.org/10.1038/s43247-020-0007-9, 2020.