the Creative Commons Attribution 4.0 License.
the Creative Commons Attribution 4.0 License.
 | 19 Jul 2023
Towards near-real-time air pollutant and greenhouse gas emissions: lessons learned from multiple estimates during the COVID-19 pandemic
Hervé Petetin
Oriol Jorba
Hugo Denier van der Gon
Jeroen Kuenen
Ingrid Super
Claire Granier
Thierno Doumbia
Philippe Ciais
Robin D. Lamboll
Sabine Schindlbacher
Bradley Matthews
Carlos Pérez García-Pando
The 2020 COVID-19 crisis caused an unprecedented drop in anthropogenic emissions of air pollutants and greenhouse gases. Given that emissions estimates from official national inventories for the year 2020 were not reported until 2 years later, new and non-traditional datasets to estimate near-real-time emissions became particularly relevant and widely used in international monitoring and modelling activities during the pandemic. This study investigates the impact of the COVID-19 pandemic on 2020 European (the 27 EU member states and the UK) emissions by comparing a selection of such near-real-time emission estimates, with the official inventories that were subsequently reported in 2022 under the Convention on Long-Range Transboundary Air Pollution (CLRTAP) and the United Nations Framework Convention on Climate Change (UNFCCC). Results indicate that annual changes in total 2020 emissions reported by official and near-real-time estimates are fairly in line for most of the chemical species, with NOx and fossil fuel CO2 being reported as the ones that experienced the largest reduction in Europe in all cases. However, large discrepancies arise between the official and non-official datasets when comparing annual results at the sector and country level, indicating that caution should be exercised when estimating changes in emissions using specific near-real-time activity datasets, such as time mobility data derived from smartphones. The main examples of these differences are observed for the manufacturing industry NOx (relative changes ranging between −21.4 % and −5.4 %) and road transport CO2 (relative changes ranging between −29.3 % and −5.6 %) total European emissions. Additionally, significant discrepancies are observed between the quarterly and monthly distribution of emissions drops reported by the various near-real-time inventories, with differences of up to a factor of 1.5 for total NOx during April 2020, when restrictions were at their maximum. For residential combustion, shipping and the public energy industry, results indicate that changes in emissions that occurred between 2019 and 2020 were mainly dominated by non-COVID-19 factors, including meteorology, the implementation of the Global Sulphur Cap and the shutdown of coal-fired power plants as part of national decarbonization efforts, respectively. The potential increase in NMVOC emissions from the intensive use of personal protective equipment such as hand sanitizer gels is considered in a heterogeneous way across countries in officially reported inventories, indicating the need for some countries to base their calculations on more advanced methods. The findings of this study can be used to better understand the uncertainties in near-real-time emissions and how such emissions could be used in the future to provide timely updates to emission datasets that are critical for modelling and monitoring applications.
- Article
(3512 KB) - Full-text XML
-
Supplement
(3296 KB) - BibTeX
- EndNote


Under the United Nations Economic Commission for Europe (UNECE) Convention on Long-Range Transboundary Air Pollution (CLRTAP) (UNECE, 2012) and the United Nations Framework Convention on Climate Change (UNFCCC) (UNFCCC, 1992), as well as corresponding EU legislation (i.e. the National Emission reduction Commitments Directive, European Commission, 2016; the Monitoring Mechanism Regulation, European Commission, 2013), EU member states and the UK are obliged to report annual emission inventories of air pollutants (APs) and greenhouse gases (GHGs). These reported inventories form the basis for monitoring progress towards collective goals as well as national emission ceilings and reduction commitments (e.g. the Effort Sharing Decision, European Commission, 2009). Parties must submit their emission inventories on an annual basis in accordance with the corresponding reporting guidelines and following the emission estimation methodologies described in the European Monitoring and Evaluation Programme/European Environment Agency (EMEP/EEA) air pollutant emission inventory guidebook (EEA, 2019) for APs and the Intergovernmental Panel on Climate Change (IPCC) Guidelines for National Greenhouse Gas Inventories (IPCC, 2019) for GHGs.
Despite providing consistent and robust time series of emission estimates, official emission inventory submissions are reported with a 2-year time lag. The lagged reporting deadlines (i.e. reporting in a given year (Y) shall typically include annual emissions estimates from 1990 to Y−2) reflect the time needed to finalize accurate national statistics (e.g. official energy consumption statistics) and the cost, time and effort entailed to collect and process them for compiling emission inventories. As a result, in addition to the inherent uncertainties in emission inventories, this time lag can introduce additional uncertainties when these datasets are used (and extrapolated) in certain modelling applications, mainly air quality forecasting systems, as they may not represent current emission sources accurately (Tong et al., 2012). This limitation can be largely amplified in the event of major and unexpected emission changes, such as during the 2008–2009 global economic recession (Castellanos and Boersma, 2012; Peters et al., 2012) or more recently the COVID-19 pandemic. Given the sharp drop in mobility and associated emissions caused by the COVID-19 crisis, alternative methods to estimate near-real-time emissions were developed, with the objective of contributing to numerical modelling exercises aiming at understanding the impact of those emission changes on air quality levels (e.g. Badia et al., 2021; Barré et al., 2021; Gaubert et al., 2021; Schneider et al., 2022). These emission datasets included the use of near-real-time activity information that is not traditionally used in officially reported inventories, such as mobility data derived from smartphones, congestion statistics obtained from navigation applications, or near-real-time electricity load and generation statistics published by national transmission system operators, among others. Seminal studies tackling the impact of COVID-19 upon primary emissions include Le Quéré et al. (2020), Forster et al. (2020a), Guevara et al. (2021, 2022a), Liu et al. (2020a, b), Doumbia et al. (2021), Harkins et al. (2021) and Zheng et al. (2021). In reaction to the COVID-19 pandemic and the growing interest in near-real-time emission estimates, some European countries started to publish quarterly (e.g. the UK, BEIS, 2022; the Netherlands, CBS, 2022) and monthly (e.g. France, CITEPA, 2022) estimates of emissions based on preliminary energy data. Results from these studies suggest that near-real-time emission estimates could be used to provide timely updates to emission trends, especially in the case of other significant and unexpected anthropogenic emission changes (e.g. economic and energy crises, armed conflicts). However, before they can be used to complement official emission inventories and be integrated into air quality forecasting systems, an assessment of their reliability and associated uncertainty is needed.
This study provides an intercomparison of 2020 emission changes derived from officially reported inventories and multiple near-real-time estimates for various APs (i.e. NOx, NMVOC, SO2, NH3, PM10, PM2.5) and GHGs (i.e. CO2 and CH4) for European Union countries (EU27) plus the United Kingdom (EU27 + UK). Specifically, we evaluated the magnitude of relative emission changes reported by both official and non-official estimates for individual pollutant sources. Considering the emission drops associated with COVID-19 restrictions occurred in a heterogeneous way and at specific periods of the year, the study not only focuses on annual emission changes, but also includes comparisons of intra-annual variability reported by the different near-real-time emission estimates (i.e. quarterly and monthly level). The results of this intercomparison exercise are used to produce recommendations on how best to approach near-real-time emission estimates.
Section 2 describes the methods and datasets considered for the intercomparison, while Sect. 3 discusses the results obtained in terms of annual, quarterly and monthly relative emission changes by pollutant, country and sector. The main conclusions and lessons learned from this work are provided in Sect. 4.
This study compares AP and GHG emission changes in 2020 as provided by four near-real-time emission estimates and the officially reported inventories under the CLRTAP and UNFCCC, respectively. A description of each dataset and summary of methodologies are provided in Table 1 and Sect. 2.1 and 2.2.
Table 1Main characteristics of the emission datasets considered in the intercomparison work.
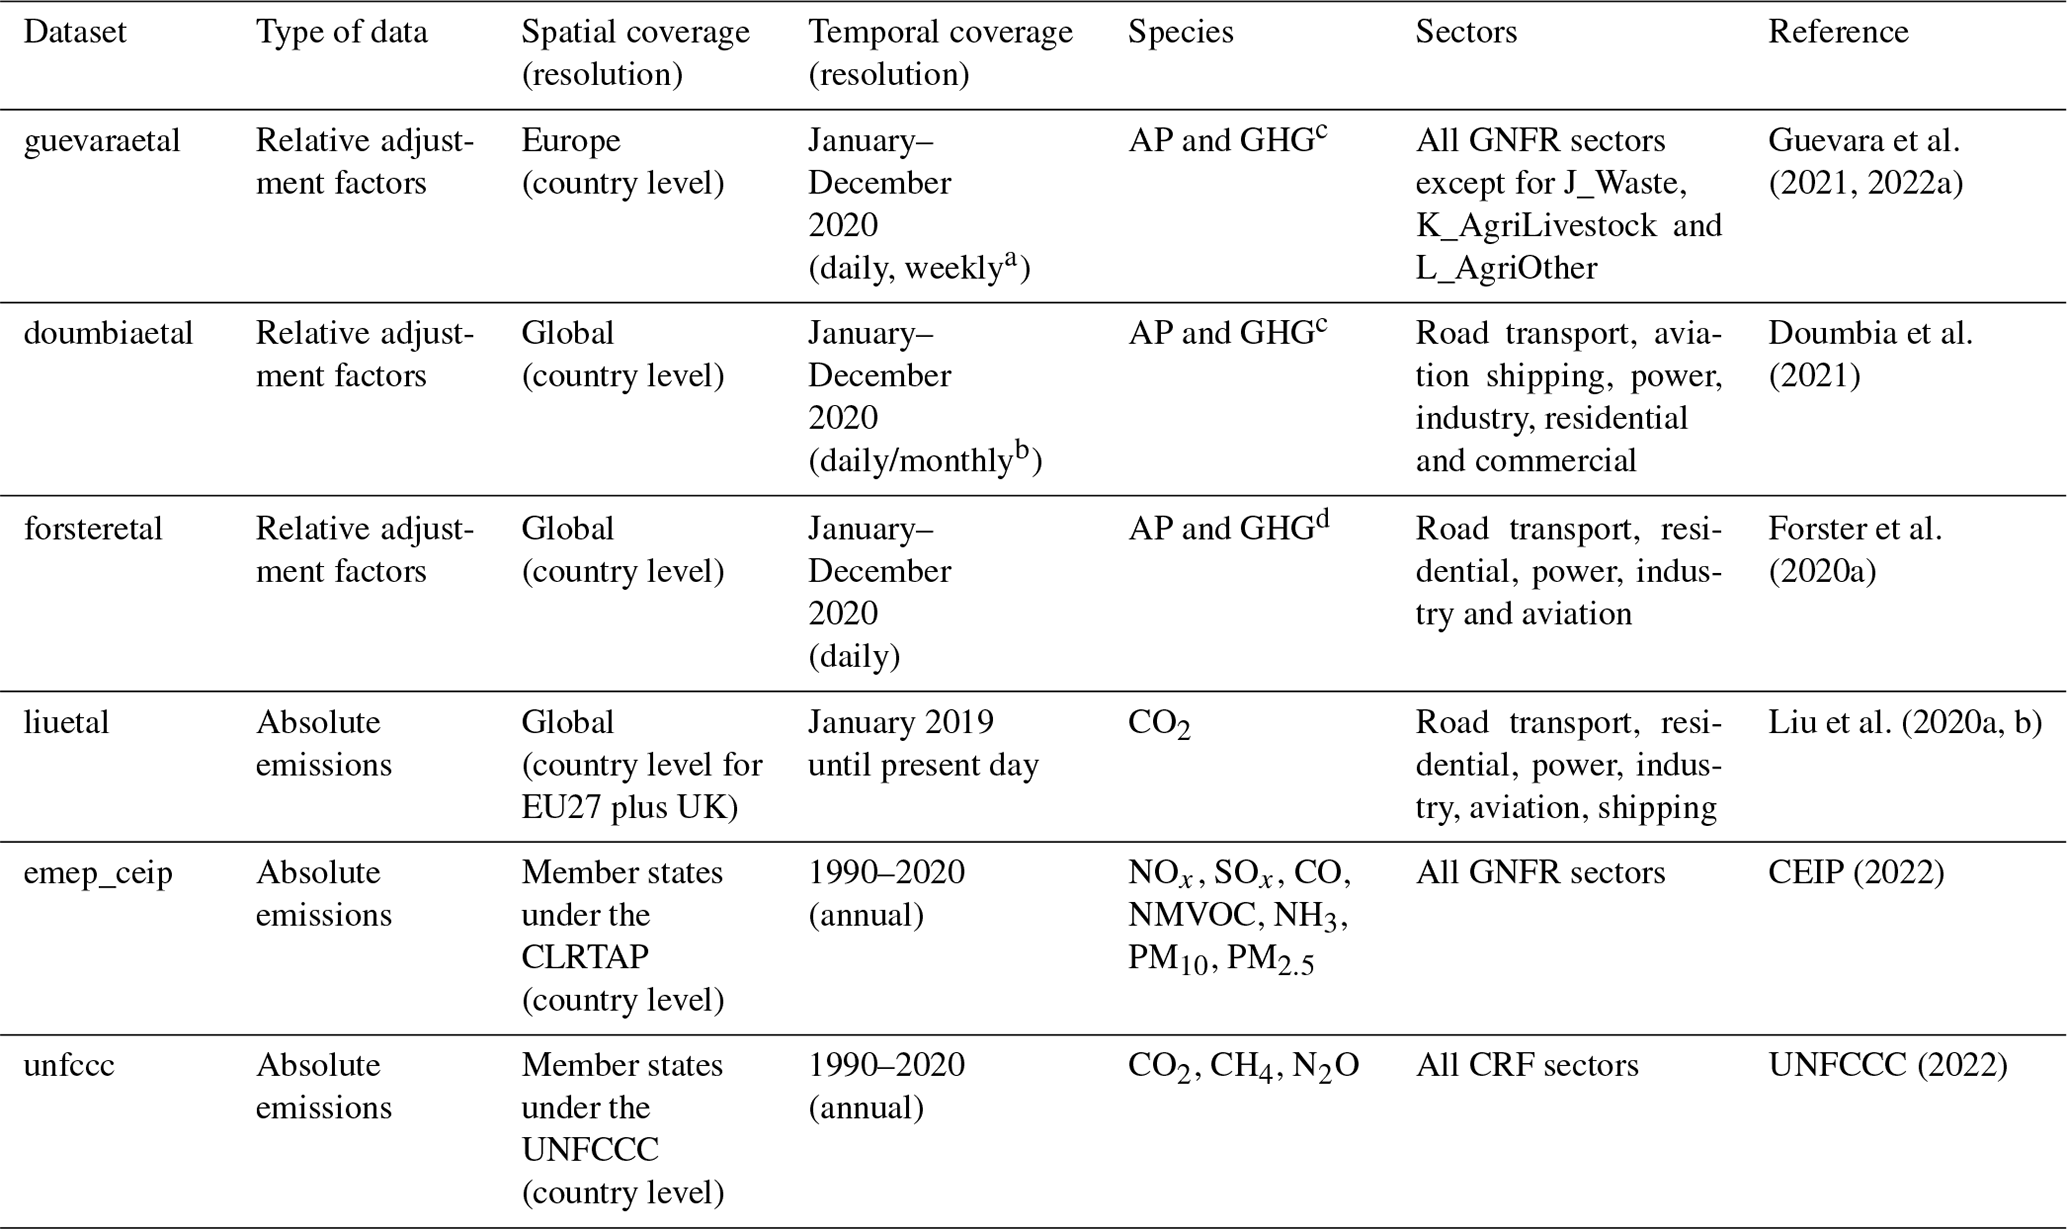
a Daily for all sectors except for shipping (weekly). b Daily for all sectors except for shipping and aviation (monthly). c Relative adjustment factors are country-, sector- and species-dependent. d Relative adjustment factors are only country- and sector-dependent (the same factors are assumed for all AP and GHG species).
2.1 Officially reported emissions
Officially reported emissions of NOx, NMVOC, CO, SO2, NH3 and PM2.5 (reporting year 2022) for 2019 and 2020 were obtained from the EMEP Centre on Emission Inventories and Projections (CEIP, 2022; hereinafter referred to as emep_ceip), containing sectoral emissions following the Gridded Nomenclature For Reporting (GNFR) classification system. Officially reported 2019 and 2020 emissions of CO2 and CH4 (reporting year 2022) were obtained from the national inventory submissions to the UNFCCC (UNFCCC, 2022; hereinafter referred to as unfccc). GHG emission data at the common reporting format (CRF) level were converted to the GNFR classification system according to the CRF-GNFR crosswalk of Kuenen et al. (2022a). A detailed description of the activity data and emission factors used to estimate officially reported emissions is provided by each country under the informative inventory reports (IIRs) for the APs (CEIP, 2022) and the national inventory reports (NIRs) for the GHGs (UNFCCC, 2022).
2.2 Near-real-time estimates
Methodologies and proxies used by each near-real-time database to derive emission estimates are summarized in Table 2.
The Copernicus Atmosphere Monitoring Service (CAMS) COVID-19 emission adjustment factor dataset (Guevara et al., 2022a; hereinafter referred to as guevaraetal) is a European dataset of daily sector-, pollutant- and country-dependent emission adjustment factors associated with the COVID-19 mobility restrictions for the year 2020. Adjustment factors are expressed as a percentage of emission changes compared to a 2020 business-as-usual scenario, i.e. the emissions that would have been released in 2020 in the absence of COVID-19 restrictions and under the same meteorological conditions. The resulting dataset covers a total of nine emission sectors, which are grouped according to the GNFR classification system, including road transport, the energy industry, the manufacturing industry, residential and commercial combustion, aviation, shipping, off-road transport, use of solvents, and fugitive emissions from transportation and distribution of fossil fuels. The adjustment factors were developed considering activity information traditionally used to estimate emissions, such as energy statistics or traffic counts, as well as information derived from Google COVID-19 community mobility data (Google LLC, 2021) and machine learning techniques. The adjustment factors developed by Guevara et al. (2022a) are pollutant-dependent and consider the heterogeneous impact of the COVID-19 restrictions across the different activities in some sectors (e.g. light-duty vehicles versus heavy-duty vehicles in the road transport sector, GNFR_F, or essential versus non-essential industrial activities in the manufacturing industry sector, GNFR_B).
The COvid-19 adjustmeNt Factors fOR eMissions (CONFORM; Doumbia et al., 2021; hereinafter referred to as doumbiaetal) provides a global dataset of emission adjustment factors per country and sector that quantify relative changes in emissions compared to a business-as-usual situation in 2020. The activity factors are estimated using data from a variety of sources, including Google mobility reports for the road transport, residential, commercial and manufacturing industry sectors; total electricity load for the power generation sector; data on air transportation published by the Knowledge Centre on Migration and Demography (KCMD) Dynamic Data Hub for the aviation sector; and statistics on container ship port calls reported by the United Nations Conference on Trade and Development for maritime emissions. In contrast to the CAMS datasets, for each sector the constructed adjustment factors are homogeneous across species.
Like CONFORM, Forster et al. (2020a) report a dataset of global emission adjustment factors that vary per country and sector and cover the whole year of 2020 (hereinafter referred to as forsteretal). Adjustment factors are also derived in large part from Google mobility data (i.e. for the surface transport, residential, public, commercial and manufacturing industry sectors). For the power sector, weighted Google mobility data reported for the workplace, residential and retail categories are considered to construct the adjustment factors, which are then scaled to match the CO2 global emission change reported by Le Quéré et al. (2020). For the air traffic and maritime sector, the Le Quéré et al. (2020) emission trends for international and national aviation and shipping are directly used, which were derived from the total number of departing flights reported by the Official Aviation Guide of the Airways (OAG) and shipping activity forecasts provided by the World Trade Organization, respectively. The developed adjustment factors were later used by Lamboll et al. (2021) to produce gridded projections of emission scenarios and run general circulation models to investigate the impact of national lockdown measures on climate. This slightly modified the approach to aviation emissions, which were globally scaled in proportion to the total number of aircraft flying at that time, reported by Flightradar24.
The Carbon Monitor initiative (Liu et al., 2020a, b; hereinafter referred to as liuetal) provides estimates of global daily CO2 emissions from fossil fuel combustion and cement production. Daily emissions are estimated from annual emissions from the Emissions Database for Global Atmospheric Research inventory (EDGAR; Crippa et al., 2019) in the base year 2019 and a diverse range of activity data, which are used to downscale and extrapolate in time annual emissions to a daily level from each sector. The activity proxies considered include electrical power generation for power plant emissions, production data and production indices of industry processes for industrial manufacturing emissions, mobility indices (TomTom data for >200 cities in Europe aggregated to country scale) for road transport emissions, flight location data (Flightradar24 database) for aviation emissions, and shipping mobility statistics (metric tonnes of cargo from the UN COMTRADE monitor database) for maritime emissions. Residential emissions are assumed to vary only according to population-weighted daily temperature. Emissions are reported per sector (for six sectors) and country or group of countries. A specific European version of Carbon Monitor was recently released, which reports emissions from each of the individual countries of the EU27 + UK bloc (Ke et al., 2022a). The sectors included in the dataset are road transport, the energy industry, the manufacturing industry, residential and commercial building fuel use, aviation, and shipping. Unlike the previous three datasets, Carbon Monitor does not provide information on relative emission changes but estimates of daily absolute emissions from January 2019 until the present, with a ∼ 3-month latency after the time of emission.
Table 2Summary of the methodologies and proxies considered in the near-real-time estimates per sector.
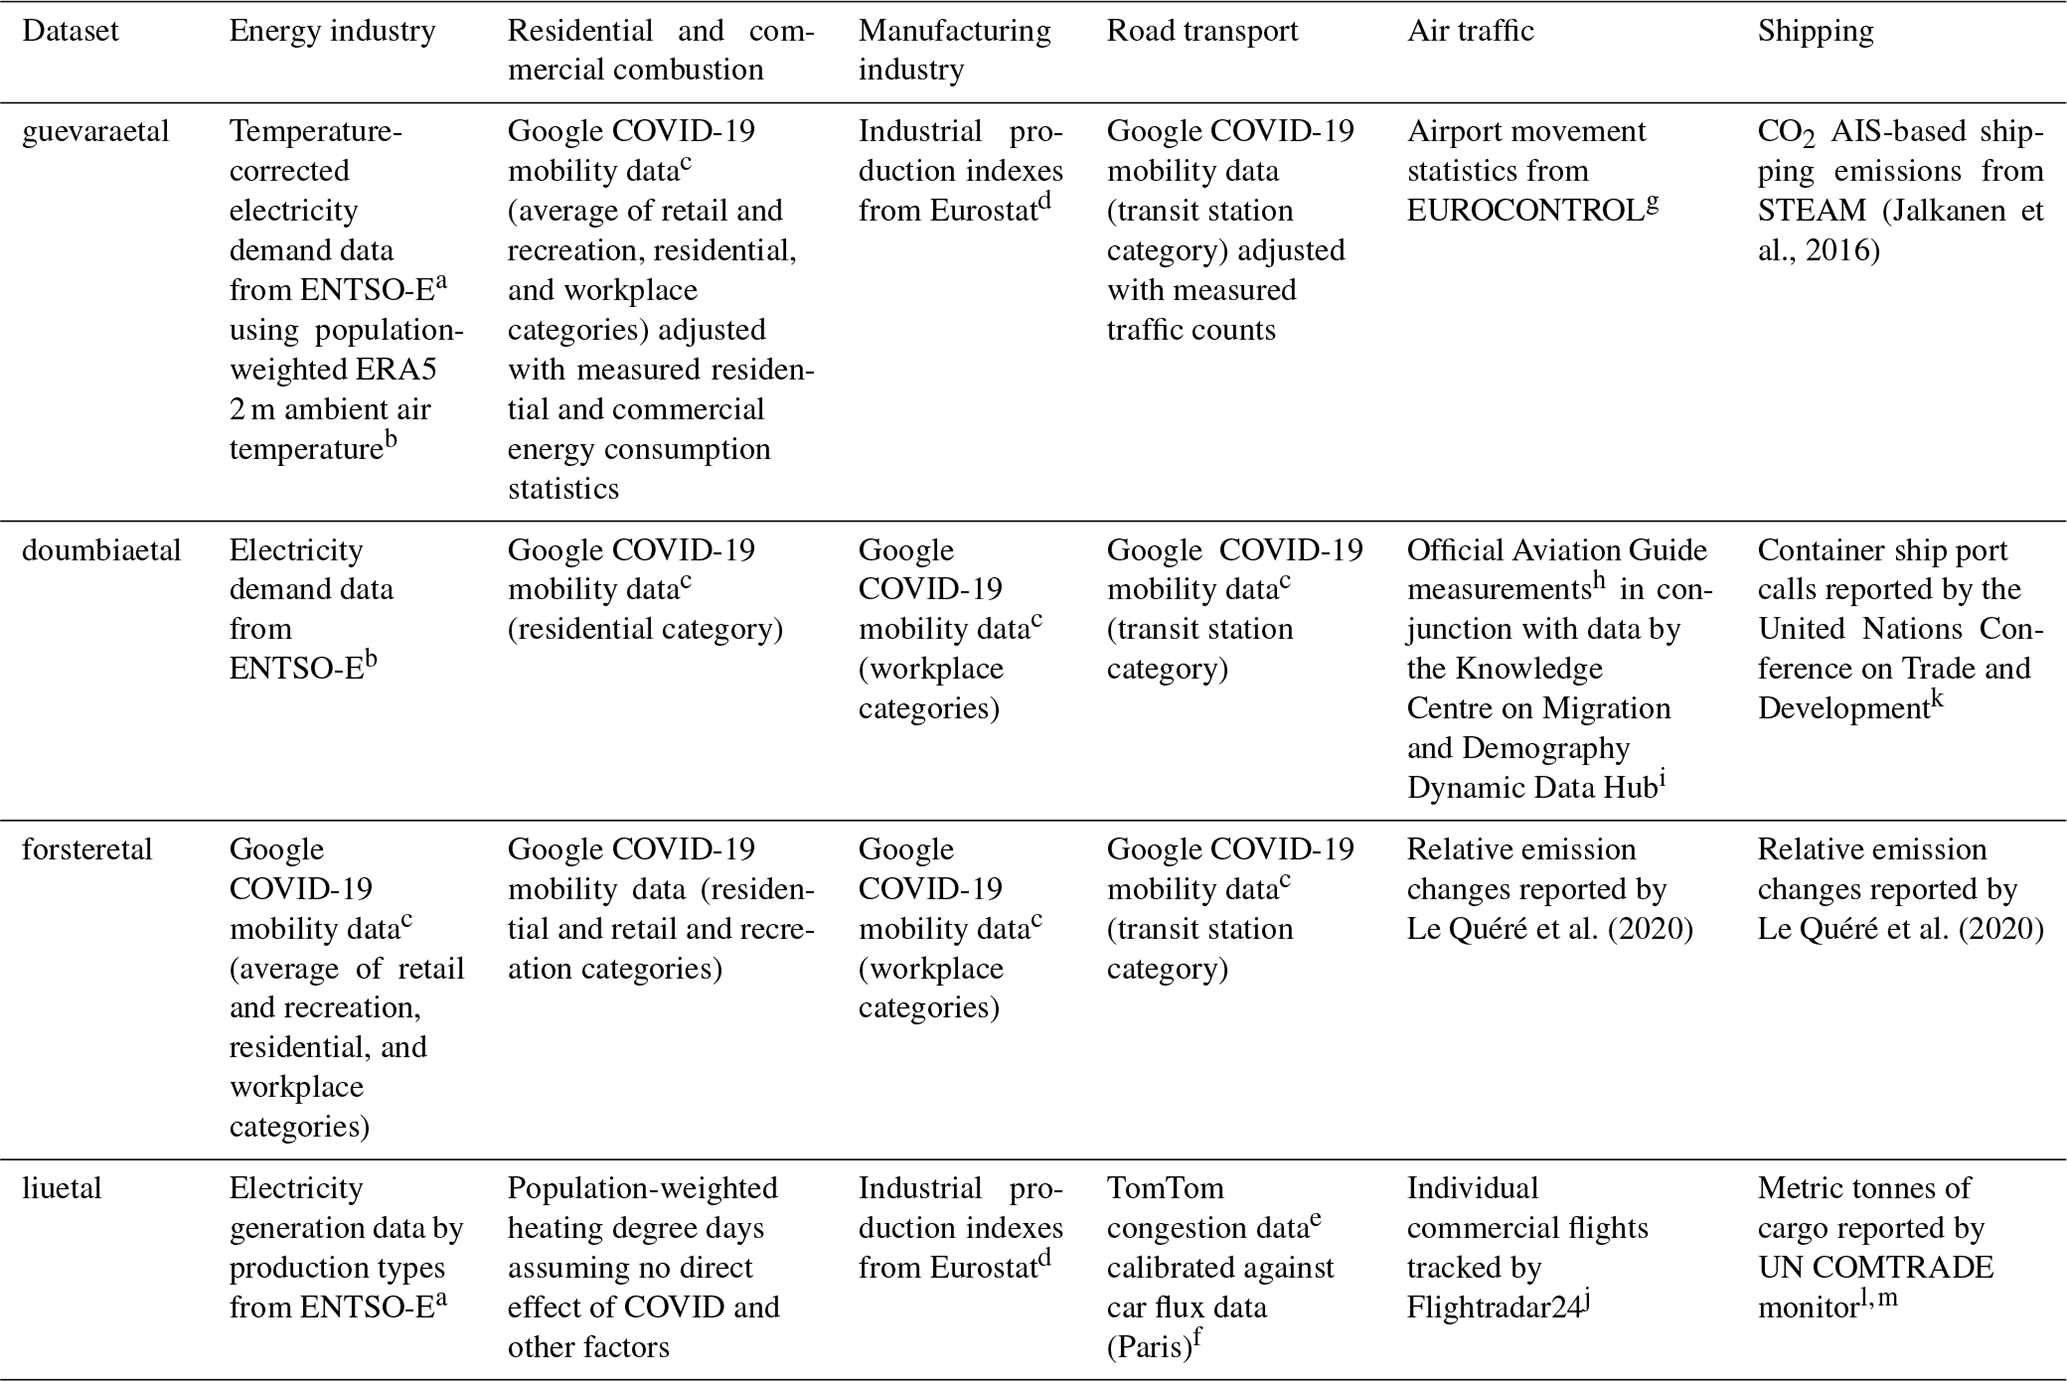
a ENTSO-E (2022). b C3S (2017). c Google LCC (2021). d Eurostat (2021). e https://www.tomtom.com/en_gb/traffic-index/, last access: November 2022. f https://opendata.paris.fr/pages/home/, last access: November 2022. g EUROCONTROL (2021). h https://www.oag.com/coronavirus-airline-schedules-data, last access: November 2022. i https://migration-demography-tools.jrc.ec.europa.eu/data-hub/, last access: November 2022. j https://www.flightradar24.com, last access: November 2022. k https://unctad.org/news/covid-19-shipping-data-hints-some-recovery-global-trade, last access: November 2022. l Cerdeiro et al. (2020). m https://comtrade.un.org/data/ais, last access: May 2023.
2.3 Baseline for the estimation of 2020 relative emission changes
The estimation of relative changes (RC) in 2020 emissions per GNFR sector s, country c and pollutant p is computed as indicated in Eq. (1):
where are the annual emissions reported for 2020 per GNFR sector s, country c and pollutant p, and are the annual emissions reported for the baseline scenario per GNFR sector s, country c and pollutant p.
The baseline considered for the officially reported emissions (i.e. emep_ceip and unfccc) and liuetal is the year 2019 (from EDGARv4.3 in liuetal) because the three datasets report emissions for that year as well as for 2020. For the three other near-real-time datasets (i.e. guevaraetal, doumbiaetal, forsteretal) the baseline considered is the Copernicus CAMS-REG_v5.1 2020 business-as-usual (BAU) emission inventory (Kuenen et al., 2022b), which reports AP and GHG emissions for 2020 ignoring the impact of COVID-19, while 2020 emissions are estimated by combining this inventory with the adjustment factors reported by each dataset.
The use of different baselines implies that the relative changes estimated by officially reported emissions and liuetal are related not only to the effect of the COVID-19 restrictions, but also to other factors such as changes in meteorology or the implementation of new emission regulations between 2019 and 2020, while the computed relative changes for guevaraetal, doumbiaetal and forsteretal only account for the COVID-19 effect. Consequently, this comparison brings the opportunity of disentangling the COVID-19 impacts from other effects on 2020 emissions.
In this section, we compare relative changes in 2020 emissions as reported by the official and non-official estimates described in Sect. 2. The comparison focuses on EU27 + UK and is performed at the annual (Sect. 3.1) and monthly (Sect. 3.2) scales.
3.1 Annual emission changes
Annual changes in NOx, NMVOC, CO, SO2, PM2.5, NH3, CO2 and CH4 emissions per GNFR sector at the EU27 + UK level are summarized in Tables 3 and 4. Figure 1 shows the relative contribution [%] of each GNFR sector to total 2019 emissions at the EU27 + UK level to support the analysis performed.
CO2 (−12.2 %) and NOx (−11.3 %) are the pollutants that experienced the largest reduction in Europe according to official estimates (unfccc and emep_ceip, respectively), the values reported by doumbiaetal and liuetal for CO2 (−12.2 % and −11.6 %, respectively) and guevaraetal for NOx (−10.5 %) being the ones closest to them. These findings are in line with the fact that road transport contributes substantially to CO2 and NOx emissions (Fig. 1) and, at the same time, was the most affected sector by the COVID-19 restrictions, after aviation. Also, in agreement with official estimates, NH3 and CH4 are reported by the near-real-time datasets as the species that experienced the lowest reductions (i.e. −1.1 % and −1.4 % according to official estimates and between −0.9 % and 0.1 % according to non-official estimates). Considering that agricultural and waste management practices contribute to more than 80 % of total NH3 and CH4 emissions (Fig. 1), the results reinforce the hypothesis that these activities remained mostly unaffected during the COVID-19 mobility restrictions and lockdowns.
For SO2, CO and PM2.5, official relative emission changes reported by emep_ceip (−10.8 %, −8.2 % and −4.1 %) are much larger than the ones reported by guevaraetal (−4.6 %, −4.7 % and −2.1 %). For SO2, discrepancies between results are mainly driven by the differences reported for the public power sector (A_PublicPower), which represent more than 30 % of total SO2 (Fig. 1). For this sector, the three non-official estimates report changes in emissions ranging from −7.2 % to −2.7 %, which are significantly lower than the official estimates (−19.5 %) (see Sect. 3.1.1 for further details). In the case of doumbiaetal and forsteretal, the underestimation in the public power sector is compensated for by a significant overestimation of the SO2 emission reduction in the manufacturing industry sector (B_Industry). While official estimates report a reduction of 7.8 %, doumbiaetal and forsteretal indicate reductions of 20.2 % and 22.8 %, respectively. A similar situation is observed for CO2, for which only liuetal is in line with the emission changes reported by unfccc for the public power sector (i.e. −14.4 % versus −11.8 %).
For CO and PM2.5, differences in relative emission changes reported by guevaraetal and official estimates are mainly driven by the discrepancies observed in the residential and commercial stationary combustion activities (C_OtherStaComb), the largest contributor to total emissions for these two species (Fig. 1). Guevaraetal shows an increase in emissions (1.7 % for CO and 1.8 % for PM2.5), while emep_ceip indicates a reduction of 2.7 % for CO and 1.9 % for PM2.5. The discrepancies are much larger when looking at the results reported by forsteretal (6.6 % for both CO and PM2.5) and doumbiaetal (5.9 % for CO and 6.0 % for PM2.5). Section 3.1.3 goes into detail about the reasons for these discrepancies. As seen for SO2, the good agreement between CO and PM2.5 total emission changes reported by forsteretal/doumbiaetal and emep_ceip is the result of an error compensation: the aforementioned underestimation in the residential and commercial stationary combustion activities is balanced with an overestimation in the reductions reported by official estimates for the manufacturing industry (e.g. −3 % according to emep_ceip versus −21.0 % according to doumbiaetal for PM2.5) and road transport (e.g. −19 % according to emep_ceip versus −27 % according to forsteretal for CO) sectors.
It is worth mentioning the large reduction in SO2 shipping emissions reported by official estimates (−46.3 %), which is mainly caused by the 2020 Global Sulphur Cap, which entered into force on 1 January 2020. The reduction reported by guevaraetal for this sector and pollutant is much lower (−11 %), as it only accounts for the impact of COVID-19 restrictions. Nevertheless, when looking at NOx and CO2 shipping emissions, a much better agreement is found between the relative changes reported by emep_ceip (−13.5 %), unfccc (−11 %) and guevaraetal (−11 %), confirming that the larger reduction found for SO2 is mainly linked to a non-COVID-19 effect. For the shipping sector, important discrepancies are observed between the official estimates and the results reported by the other near-real-time datasets (doumbiaetal, forsteretal and liuetal), as they report only global emission changes and do not distinguish between European and non-European seas. The relative CO2 emission reductions reported by liuetal (−3.1 %) and doumbiaetal (−9.5 %) are lower than the official UNFCCC estimates (−11 %), while forsteretal reductions are more than 2 times larger (−23.5 %). The large inconsistency found for forsteretal could be related not only to the differences in terms of spatial coverage, but also to the fact that for this database emission trends for shipping were derived from forecasted activity (see Sect. 2.2) rather than measured statistics. Finally, for NMVOC guevaraetal reports the closest emission reduction value to official estimates, both being quite low (−2.1 % and −2.5 %, respectively).
Table 3Relative changes [%] in NOx, NMVOC, CO, SO2, PM2.5 and NH3 emissions per GNFR sector at the EU27 + UK as reported by official (emep_ceip) and non-official (guevaraetal, doumbiaetal, forsteretal) estimates.
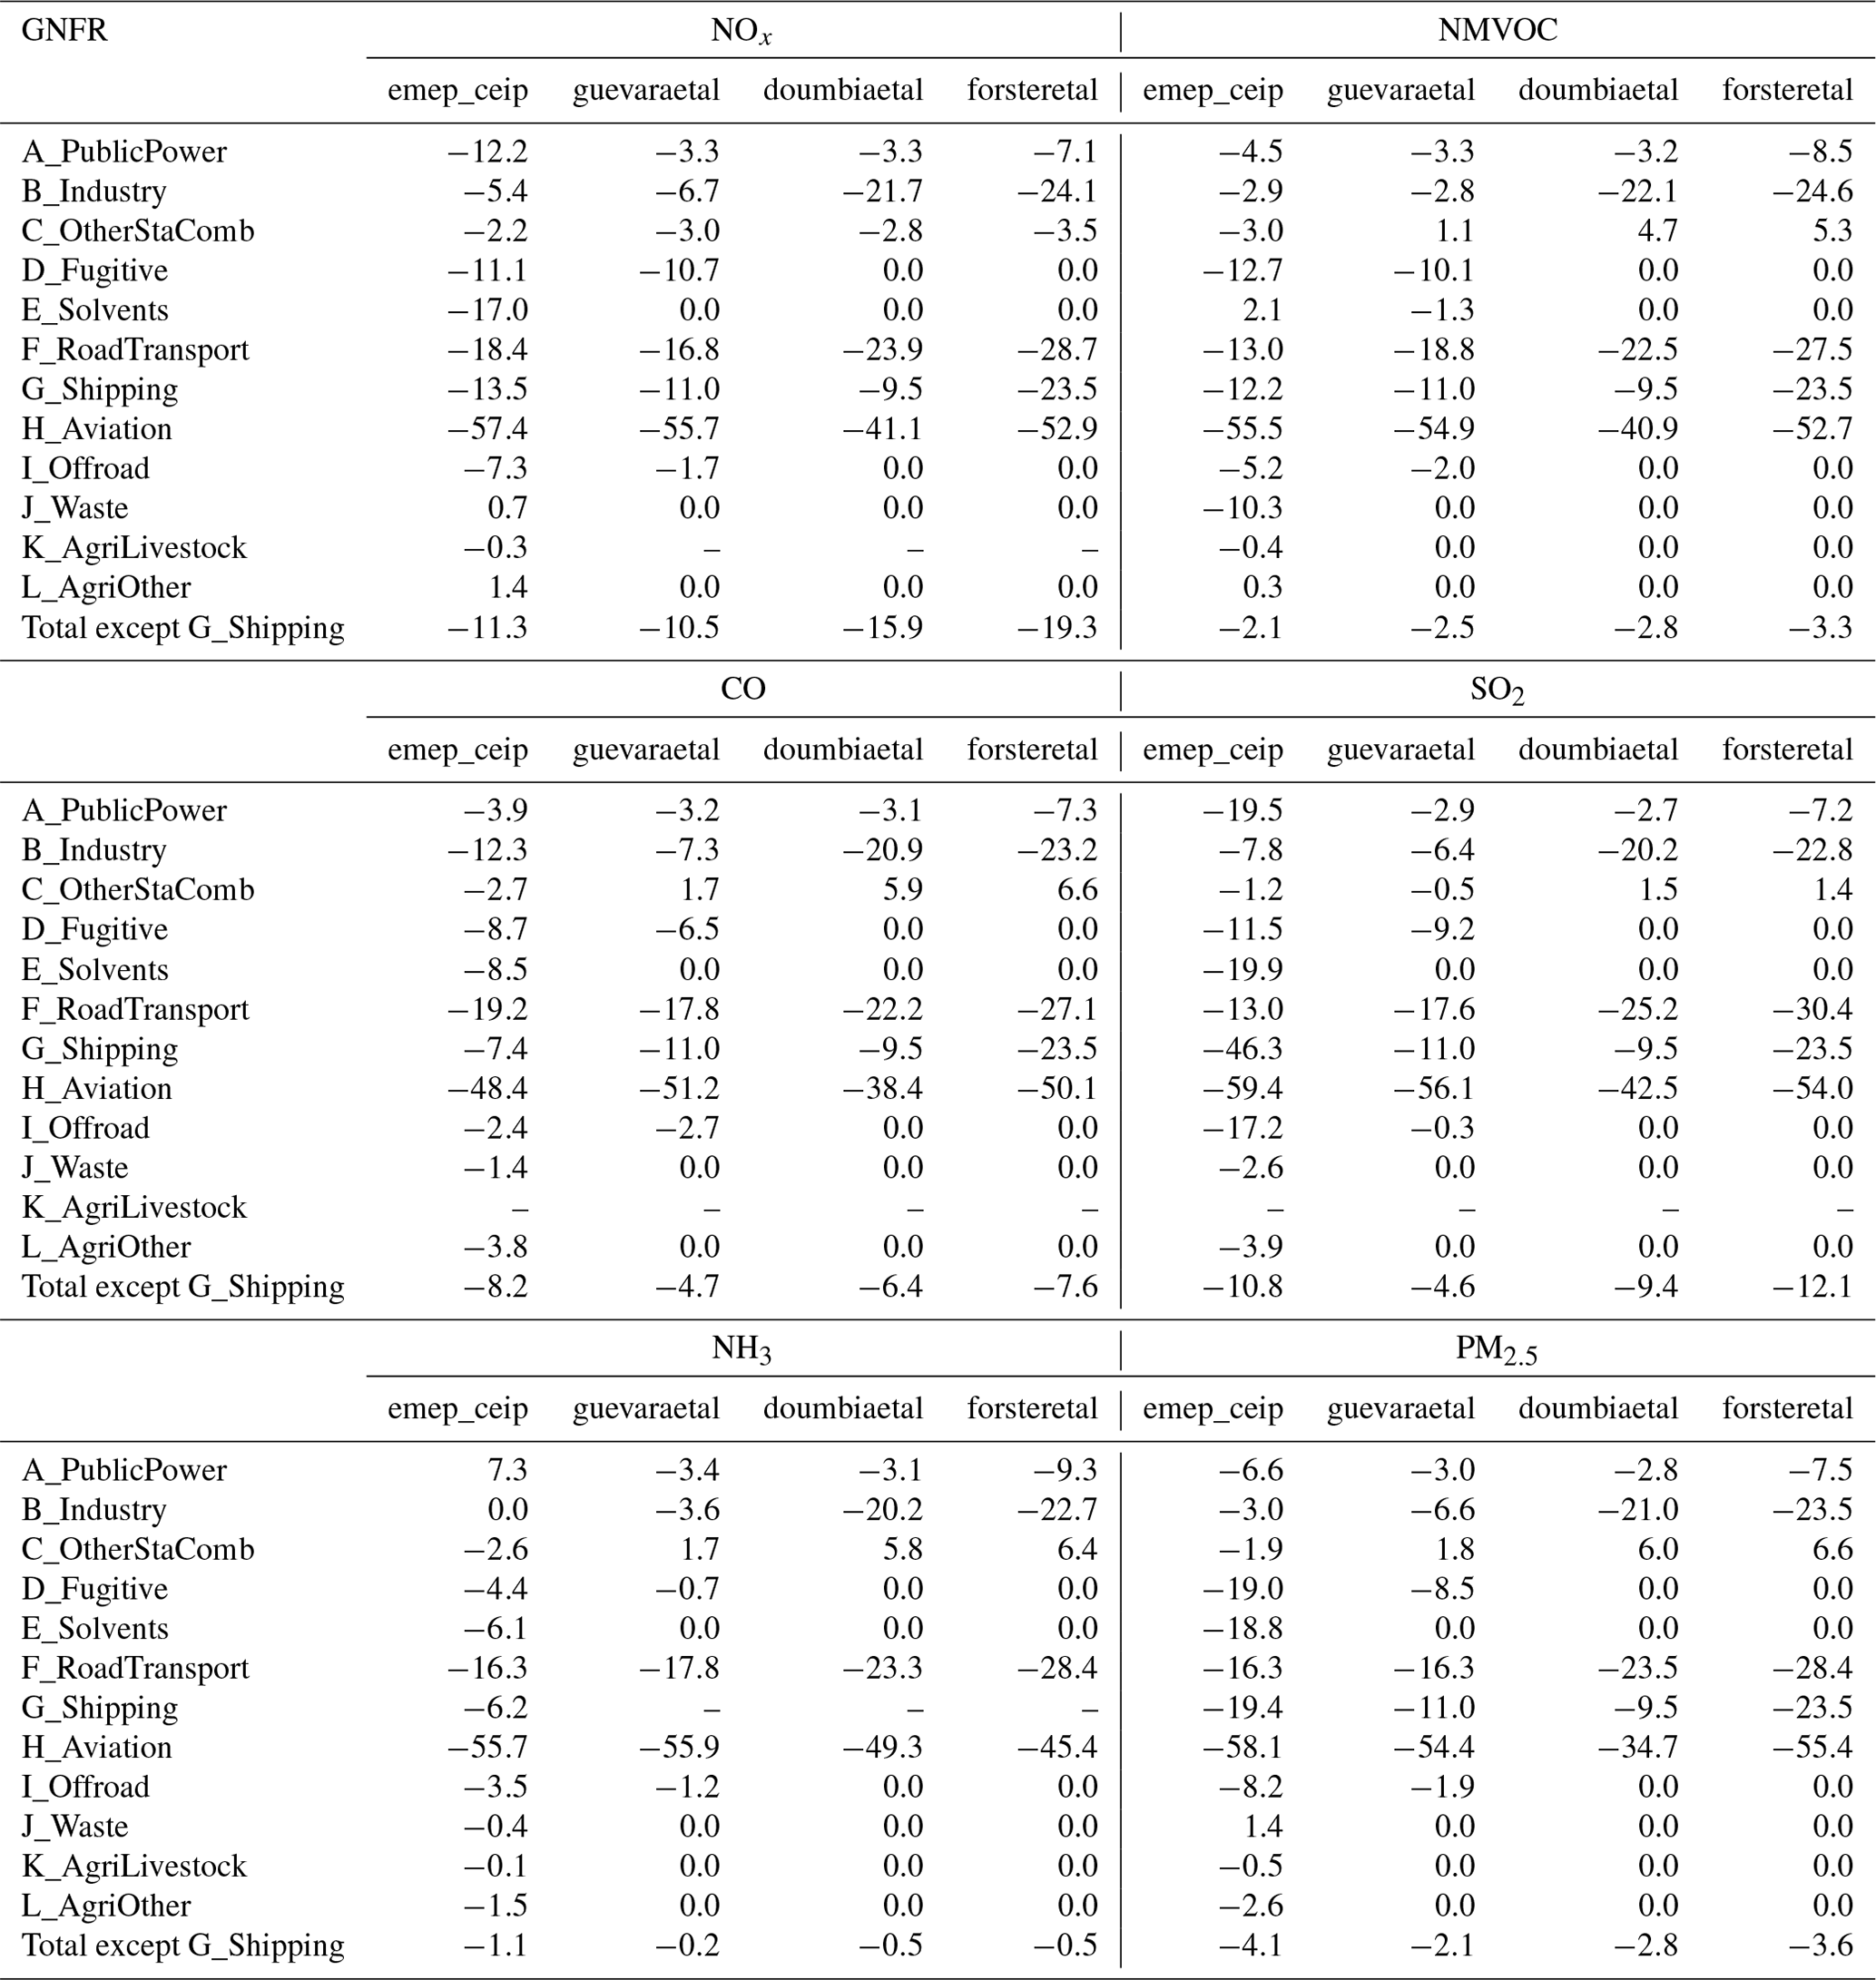
Table 4Relative changes [%] in CO2 and CH4 emissions per GNFR sector at the EU27 + UK as reported by official (unfccc) and non-official (guevaraetal, doumbiaetal, forsteretal, liuetal) estimates.
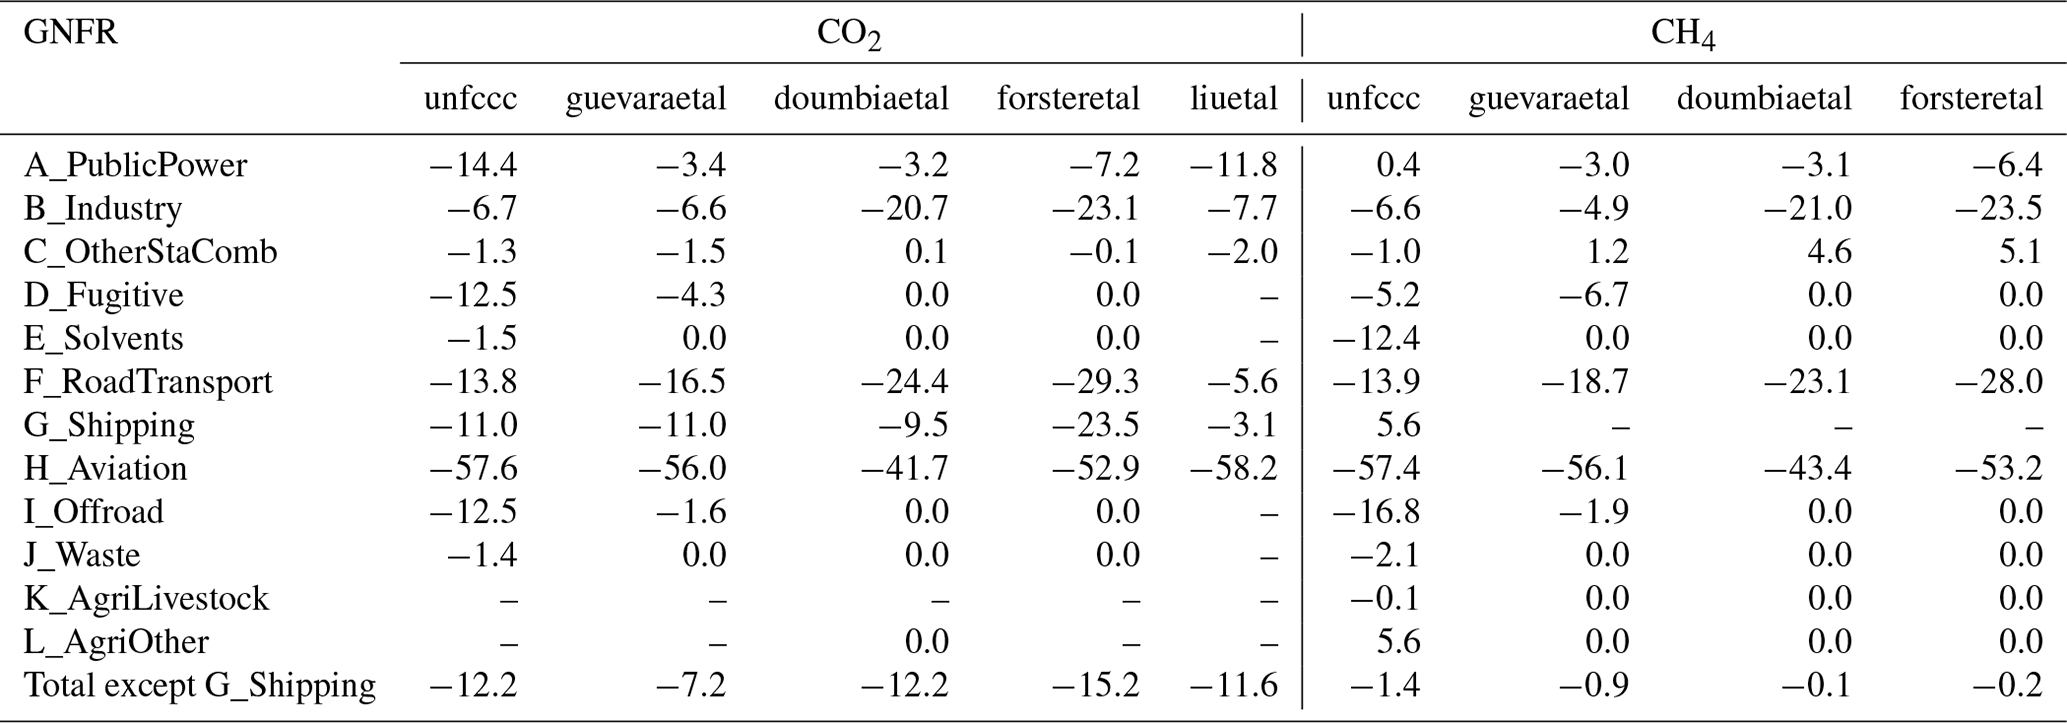
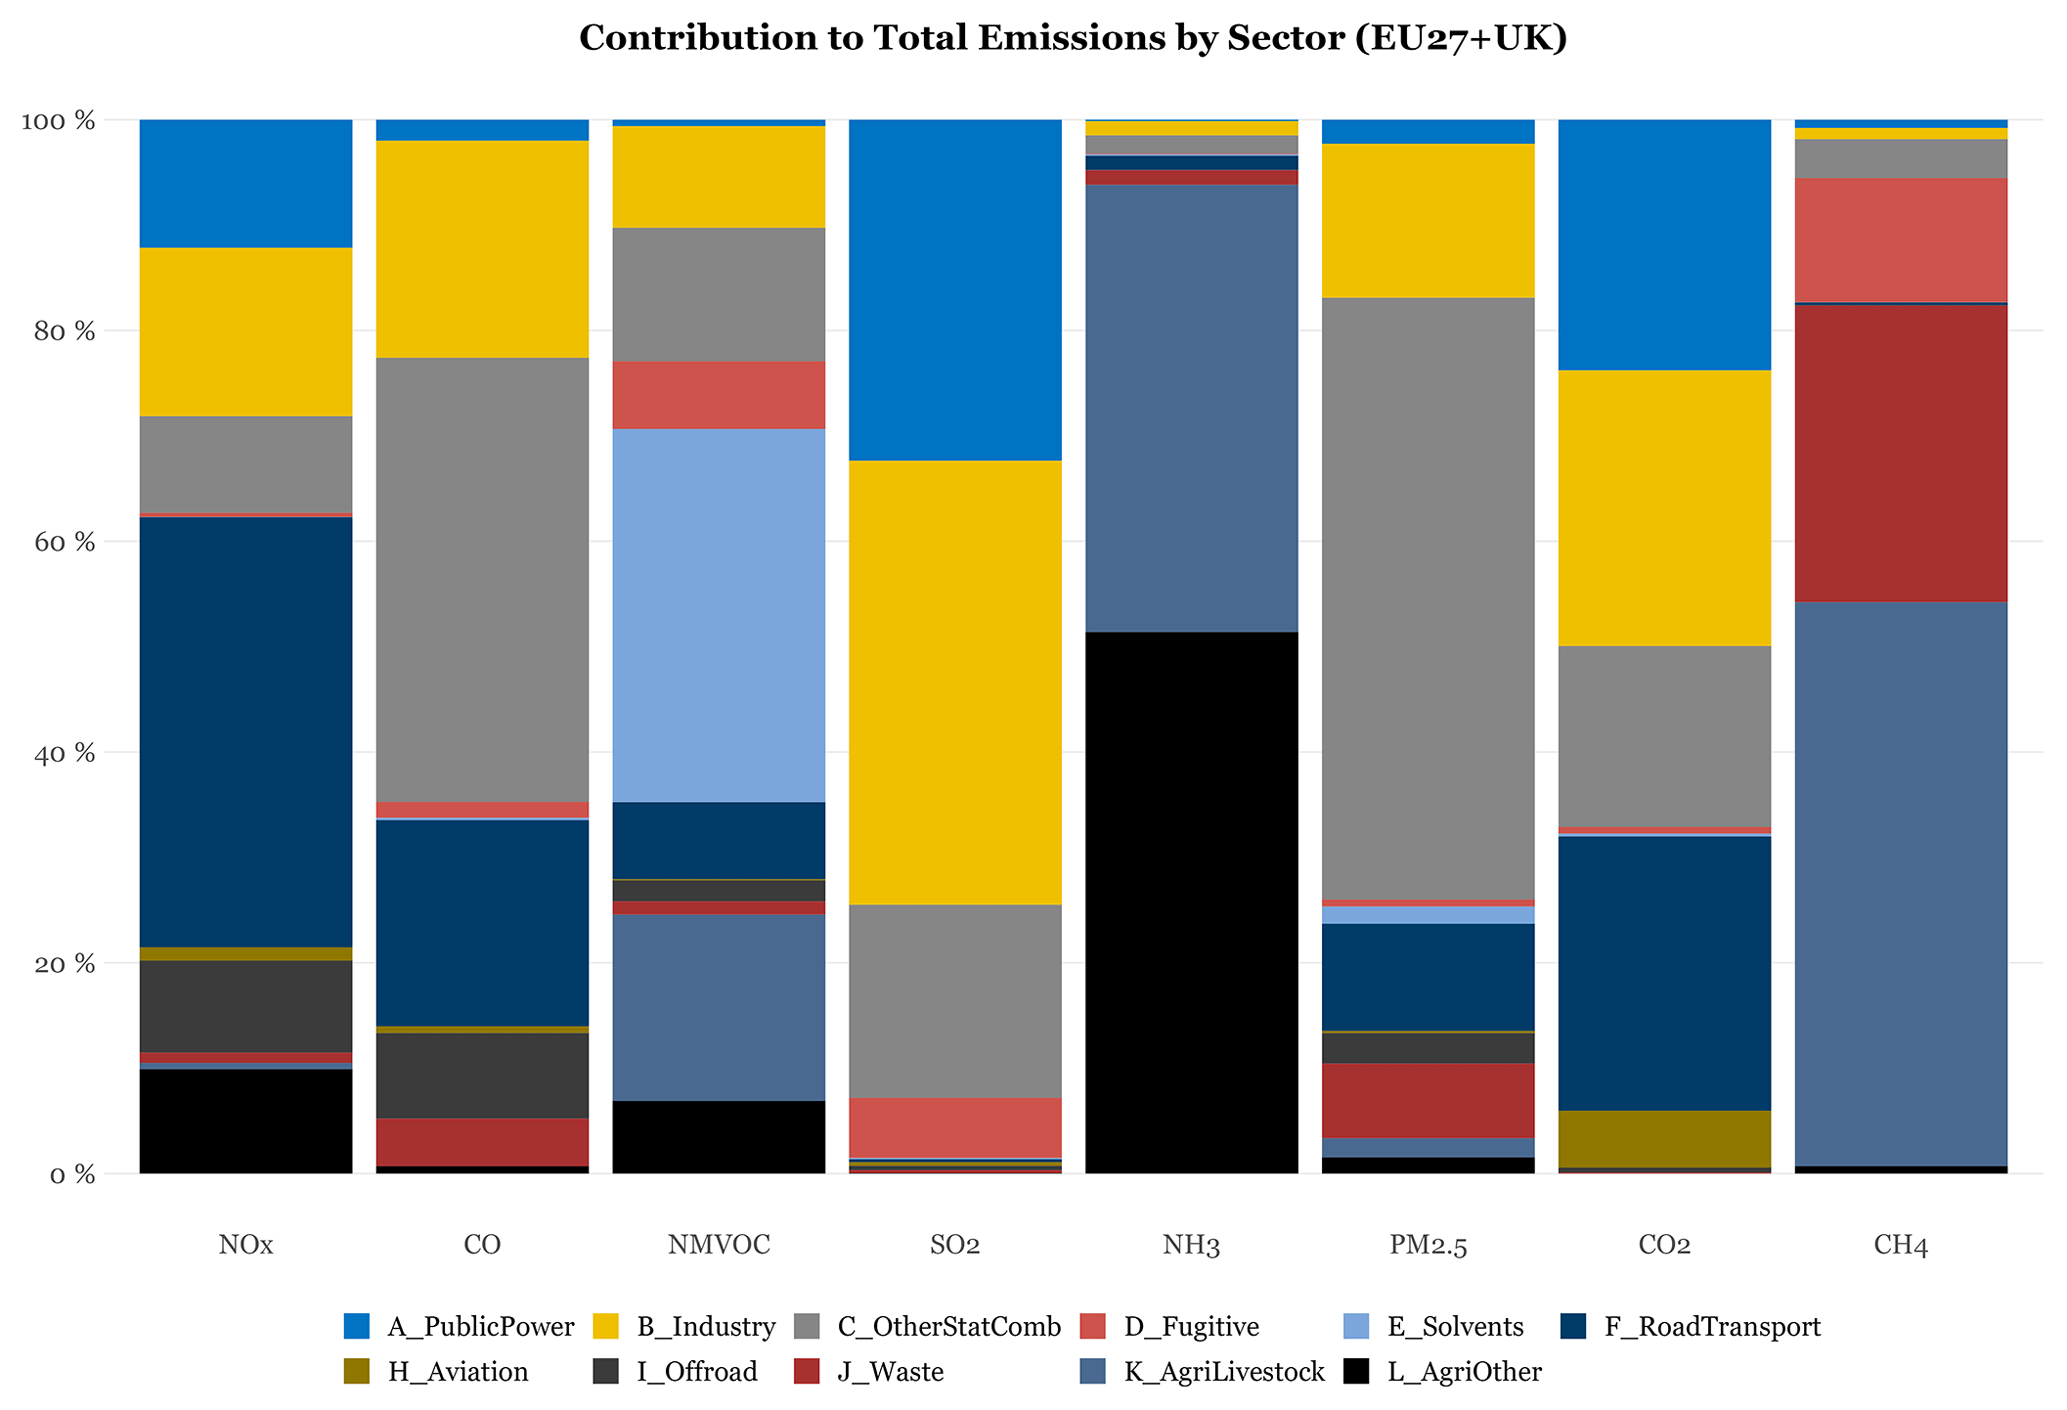
Figure 1Sectoral contributions [%] to total 2019 emissions at the EU27 + UK level (CEIP, 2022; UNFCCC, 2022). Emissions are reported following the Gridded Nomenclature For Reporting (GNFR) classification system. Shipping emissions (GNFR_G) are excluded from the analysis.
Changes observed at the country level per individual sector are discussed in the following Sect. 3.1.1 to 3.1.8. For each sector, we focus the analysis on the species for which the sector reports a contribution larger than 20 % to the total EU27 + UK bloc emissions of the respective species (Fig. 1). For those sectors with contributions lower than 20 % for any species (i.e. aviation, fugitive emissions from fossil fuels, off-road mobile sources), we considered the most representative species. Note that sectors GNFR_J (waste management), GNFR_K (agriculture, livestock) and GNFR_L (agriculture and other practices including the use of fertilizers and agricultural waste burning) were excluded from the discussion as all the near-real-time datasets assumed that emissions from these sources did not change in 2020 due to a lack of specific activity information or because of the nature of the European COVID-19 restriction policies, which considered these activities to be essential during lockdowns. As shown in Fig. S1 in the Supplement, this hypothesis is consistent with the official estimates, which report relative changes in emissions of a maximum of ±5 % in most countries.
3.1.1 Public power
Figure 2a and b show the relative SO2 and CO2 emission changes [%] reported by each dataset per country and at the EU27 + UK level for the public power sector (GNFR_A).
For SO2, the three near-real-time datasets consistently report much lower relative changes than official estimates. This discrepancy is partially because guevaraetal and doumbiaetal assume that COVID-19 restrictions had an impact on total electricity demand but not on the electricity mix, which slightly shifted towards renewables and therefore implied an additional reduction in activity in fossil fuel power plants (IEA, 2022). However, one of the most relevant aspects of these discrepancies is the role that national decarbonization trends played in the drop of emissions between 2019 and 2020. This is illustrated with the examples of Spain and Estonia, which are among the countries showing the largest drop in emissions according to official reports (i.e. −60 % and −45 %, respectively). For Spain, the reduction is mainly related to the shutdown of seven coal-fired power plants in June 2020, as they were unable to comply with stricter EU air pollution standards (Europe Beyond Coal, 2022, Fig. S2), whereas the reduction in Estonia is due to a drop of 44 % in the electricity produced by oil shale (IEA, 2022). In both countries, these reductions are part of commitments to a sustainable transition towards climate neutrality and that were started to be executed before the outbreak of the COVID-19 crisis, e.g. in Estonia, power production from oil shale has already dropped by more than half from 9.5 to 4.3 TWh between 2018 and 2019.
For CO2, similar discrepancies are observed between official and near-real-time estimates, except for liuetal, whose results are much more in line with unfccc because its relative emission changes consider changes in the electricity production by fuel type between 2019 and 2020 and therefore integrate the impact of the decarbonization efforts in the electric power sector, even though emission factors for each fuel type are assumed to be constant (equal to the year) in their methodology. This is clearly observed in Spain and Estonia, where liuetal reproduces the officially reported drops well (i.e. −26 % according to unfccc and −21 % according to liuetal for Spain; −35 % according to unfccc and −40 % according to liuetal for Estonia).
Changes in official emissions reported by emep_ceip and unfccc are generally consistent across SO2 and CO2, except in some countries such as Lithuania and Latvia, where SO2 remains almost unchanged (4 % and −6 %), while CO2 significantly increases (more than 50 %) and decreases (−25 %), respectively. For these two countries, the reason for this inconsistency is a significant change in the amount of electricity produced from natural gas between 2019 and 2020 (90 % for Lithuania and −65 % for Latvia; IEA, 2022), which had a significant impact on CO2 emissions but was almost negligible in terms of SO2 changes due to the low sulfur content associated with this fuel. In other countries, such as Luxembourg and Croatia, the large discrepancies between changes in SO2 (increases of approximately +50 % and +100 %, respectively) and CO2 emissions (changes below 5 %) may indicate an issue with the reported data.
3.1.2 Manufacturing industry
As shown in Fig. 2c and d, guevaraetal and liuetal are the near-real-time estimates that present the closest values to the official NMVOC and CO2 relative changes reported for the industrial manufacturing sector, respectively. Oppositely, for doumbiaetal and forsteretal large discrepancies are observed with official estimates, especially in the case of NMVOC, where the reductions reported at the EU27 + UK level are 4.5 and 8.5 times larger, respectively. Both guevaraetal and liuetal consider the use of industrial production indexes as a proxy for this sector, while doumbiaetal and forsteretal rely on Google mobility data.
It is worth noting how guevaraetal reproduces the heterogenous changes across both pollutants at the EU27 + UK level, with NMVOC presenting an approximately 2 times lower reduction (−2.9 %) than CO2 (−6.7 %). This result can be partially explained by the fact that during the lockdowns the food and chemical industries (both of which contribute significantly to total NMVOC industrial emissions) were considered to be essential; as a consequence, their activity was less reduced than that of other energy-intensive industrial branches such as iron and steel manufacturing or non-metallic mineral products, which present larger contributions to total industrial CO2 emissions.
Inconsistencies between emep_ceip and unfccc official emission changes are observed for Cyprus and Malta, with NMVOC emissions remaining almost unchanged, while CO2 shows increases of 20 % to 30 %. In the case of small countries like these two, the national emissions are rather sensitive to dynamics at the single-facility level, resulting in large relative year-to-year changes.
3.1.3 Residential and commercial stationary combustion activities
For this sector, relative PM2.5 emission changes reported by all the near-real-time datasets are inconsistent with official estimates (Fig. 2e and f). While the first group indicates a general increase in emissions, the former reports a decrease in almost all European countries. The differences between official and non-official estimates are in general much larger for doumbiaetal and forsteretal than for guevaraetal. This could be explained by the fact that, while all three datasets use Google mobility reports as a data proxy for this sector, guevaraetal is the only one that adjusted the original values considering energy consumption statistics from the residential and commercial sectors (Guevara et al., 2022a). All in all, the message from the three near-real-time estimates is the same: during 2020 people spent more time at home due to confinement measures, and therefore the consumption of residential wood combustion, which represents more than 90 % of total PM2.5 from this sector, increased when compared to a 2020 business-as-usual situation. Nevertheless, and as explained in Sect. 2.3, relative changes reported by emep_ceip use 2019 as a baseline, and therefore they include not only the effect of COVID-19, but also the impact of meteorological changes. As reported by the Copernicus Climate Change Service (C3S), Europe experienced its warmest winter on record in 2020, with temperatures up to 5 ∘C warmer than the 1981–2010 seasonal average in north-eastern Europe (C3S, 2020a). The impact of the exceptionally mild winter temperatures in 2020 is illustrated in Fig. 4a, which shows the relative changes in the number of heating degree days (HDDs) per European country between 2019 and 2020 (Eurostat, 2022). Overall, HDD was −5 % lower in 2020 when compared to 2019, with values up to −20 % in Malta and approximately −10 % in Finland, France or Estonia. However, the increase in temperatures was not uniform, and some countries such as Bulgaria and Hungary presented increases in the HDD of approximately +5 %. Because HDD is an indicator designed to describe the energy requirements of buildings, a decrease (increase) in its value implies a decrease (increase) in the combustion of fuels and associated emissions needed for space heating. Figure 4b shows a scatterplot of relative changes in PM2.5 emissions as reported by emep_ceip and in HDD per country. It is observed in several countries that a clear relationship is identified, with emissions decreasing when the HDD decreases (e.g. Finland) and the other way around (e.g. Bulgaria). These findings are consistent with those reported by Ciais et al. (2022) using ENTSO-G daily gas consumption data in buildings, who also showed that climate variations played a larger role in residential energy consumption across Europe in 2020 than COVID-19-induced stay-home orders, except in Italy and France. Nevertheless, the relationship is not always consistent. For instance, in Estonia PM2.5 emissions and HDD present relative changes of similar magnitude but of opposite sign (+10 % and −10 %, respectively), indicating that other factors, such as fuel switching or inconsistencies in the officially reported emission time series, among others, could play a role.
For CO2, it is observed that liuetal is the near-real-time estimate that is generally more in line with the official unfccc emission changes. This result is consistent with the fact that of the near-real-time datasets only liuetal account for the impact of meteorology, which at the same time reinforces the hypothesis that changes in this sector are mainly driven by changes in the meteorology. As a matter of fact, liuetal assumes that changes in emissions are only driven by changes in population-weighted 2 m temperature for this sector, and no impact from COVID-19 is included in the 2020 emissions. This can be illustrated by the fact that both liuetal and the relative changes in the HDD point out Malta as the country experiencing the largest decrease (around −20 % in both cases). This result, however, contrasts with the relative changes reported by unfccc, which indicate a nearly +10 % increase in CO2 emissions in this country.
3.1.4 Fugitive emissions from fossil fuels
Figure 5a and b show the relative changes in CH4 emissions from activities related to the extraction, processing and delivery of fossil fuels to the point of final use. Guevaraetal is the only near-real-time dataset that reports information for this sector, while all the other estimates assume no changes in emissions during 2020. Results are fairly in line with official estimates at the EU27 + UK level (−5.2 % versus −7.2 % for CH4). It is also interesting to see how guevaraetal can reproduce the large drop in emissions that occurred in Greece (close to −40 %), which is related to a significant decrease in coal mining activities (Guevara et al., 2022a).
The officially reported drop in European CH4 emissions (not only for this sector but also for total emissions as stated in Table 4) contrasts with recent observational-based studies that claimed increases in CH4 emissions during 2020 using TROPOMI observations and inverse-modelling techniques (McNorton et al., 2022). As reported by Stevenson et al. (2022), the increased CH4 atmospheric growth captured by TROPOMI is probably due to the net effect of NOx, CO and NMVOC emission changes on CH4 atmospheric lifetime rather than on changes in primary emission sources.
3.1.5 Solvents
For the sector solvent use, only guevaraetal reports changes in emissions in 2020, as the other near-real-time datasets do not report information for this sector. However, the changes estimated by guevaraetal only focus on a few industrial activities (i.e. metal degreasing and printing) and do not cover the domestic use of solvents, which results in a very limited change in the total NMVOCs at the EU27 + UK level (−1.3 %). Interestingly, large inconsistencies are observed in the official relative changes reported between European countries. While most of them indicate changes in total emissions between −5 % and +5 %, significant increases (e.g. +50 % in the Netherlands, +33 % in Finland, +25 % in Portugal) and decreases (e.g. −25 % in Lithuania) are observed in certain countries. This inconsistency is mainly driven by the heterogeneous estimation of changes in NMVOC emissions from the use of the so-called pandemic products (e.g. hand sanitizer gels). This hypothesis is illustrated in Fig. 3, which shows official relative NMVOC emission changes for the domestic solvent use sector (NFR2D3a). Similarly to what is observed at the GNFR level, NMVOC emission changes from this activity are very heterogeneous across countries, with Portugal, the Netherlands and Finland presenting increases larger than 100 %, and many other countries presenting changes ranging from −5 % to 5 %. The COVID-19 recommendation on the use of hand sanitizers as a safety measure was a measure consistently implemented across European governments during 2020, and, therefore, its impact on NMVOC emissions from this activity should be, in theory, also consistent across nationally reported inventories. However, several countries use a very basic emission estimation method (tier 1) for this activity, which uses population data as activity data and thus does not reflect the increased use of hand sanitizers.
3.1.6 Road transport
For the traffic sector, guevaraetal is the dataset more in line with the NOx (Fig. 5c) and CO2 (Fig. 5d) relative changes reported by official estimates at the EU27 + UK level and in those countries that were the most affected by COVID-19 restrictions (e.g. Spain, Italy, the UK, France). Doumbiaetal and forsteretal present the largest discrepancies with official NOx estimates, with relative changes between 1.5 and 2 times larger on average (Fig. 5c). When compared to unfccc, results by liuetal tend to present lower CO2 emission changes (2.5 times lower at the EU27 + UK level, Fig. 5d). Differences are particularly relevant in those countries where liuetal suggests almost no changes in CO2 emissions (e.g. Austria, Germany) or even slight increases (e.g. Estonia, Lithuania) (Fig. 5d). In fact, official estimates do not report any country with increasing NOx or CO2 road transport emissions in 2020, Romania being the country closest to a negligible change (−2.3 % for CO2). Out of all the near-real-time estimates, guevaraetal and liuetal are the only ones that combined the use of new mobility metrics (Google reports and TomTom congestion statistics, respectively) with traditional statistics (measured traffic counts) to derive the impact of COVID-19 restrictions on this sector. Contrary to what is shown for the public power or the residential sectors, the good agreement observed between guevaraetal and ceip_emep/unfccc suggests that the changes in emissions from this sector were almost exclusively related to the COVID-19 mobility restrictions.
3.1.7 Aviation
The aviation sector reports the largest drops in emissions according to all official and non-official estimates (Fig. 5e). At the same time, it is also the sector with the fewest differences in estimates at the EU27 + UK level, with overall CO2 reductions ranging from −53 % to −58 %, except for doumbiaetal, which reports much lower reductions (−41.7 %). The analysis at the country level though suggests that liuetal is the dataset that is more in line with the official results reported by unfccc. The reduction in emissions is quite consistent across countries, except for Bulgaria and Luxembourg, where reductions are significantly below the average (−30 % and −10 %, respectively), and only liuetal is capable of partially reproducing them (−40 % and −20 %, respectively). Results by doumbiaetal tend to underestimate the reductions reported by unfccc by a factor of 1.6 on average (e.g. −66 % versus −54 % for Italy and −57 % versus −37 % for Poland). While unfccc and liuetal report changes in emissions from landing and takeoff (LTO) and cruise domestic operations, doumbiaetal, guevaraetal and forsteretal only reflect changes from LTO from both domestic and international air traffic, which could explain why the discrepancies are larger.
3.1.8 Off-road mobile sources
As for the case of the fugitive emissions from fossil fuels (Sect. 3.1.4), for off-road mobile source emissions only guevaraetal considers the impact of COVID-19 restrictions. However, and as shown in Fig. 5f, significant discrepancies exist between this dataset and the official emep_ceip estimates, with the former reporting larger NOx emission reductions (−7.3 % versus −1.7 %). The methodology of guevaraetal considered the impact of the mobility restrictions only in industrial machinery, assuming that other types of machinery included in this sector (i.e. agricultural, gardening, recreational boats) were not affected by the pandemic. Interestingly, all official estimates report a decrease in emissions, except for the cases of Portugal and Greece, where increases of +6 % and +38 % are observed, respectively.
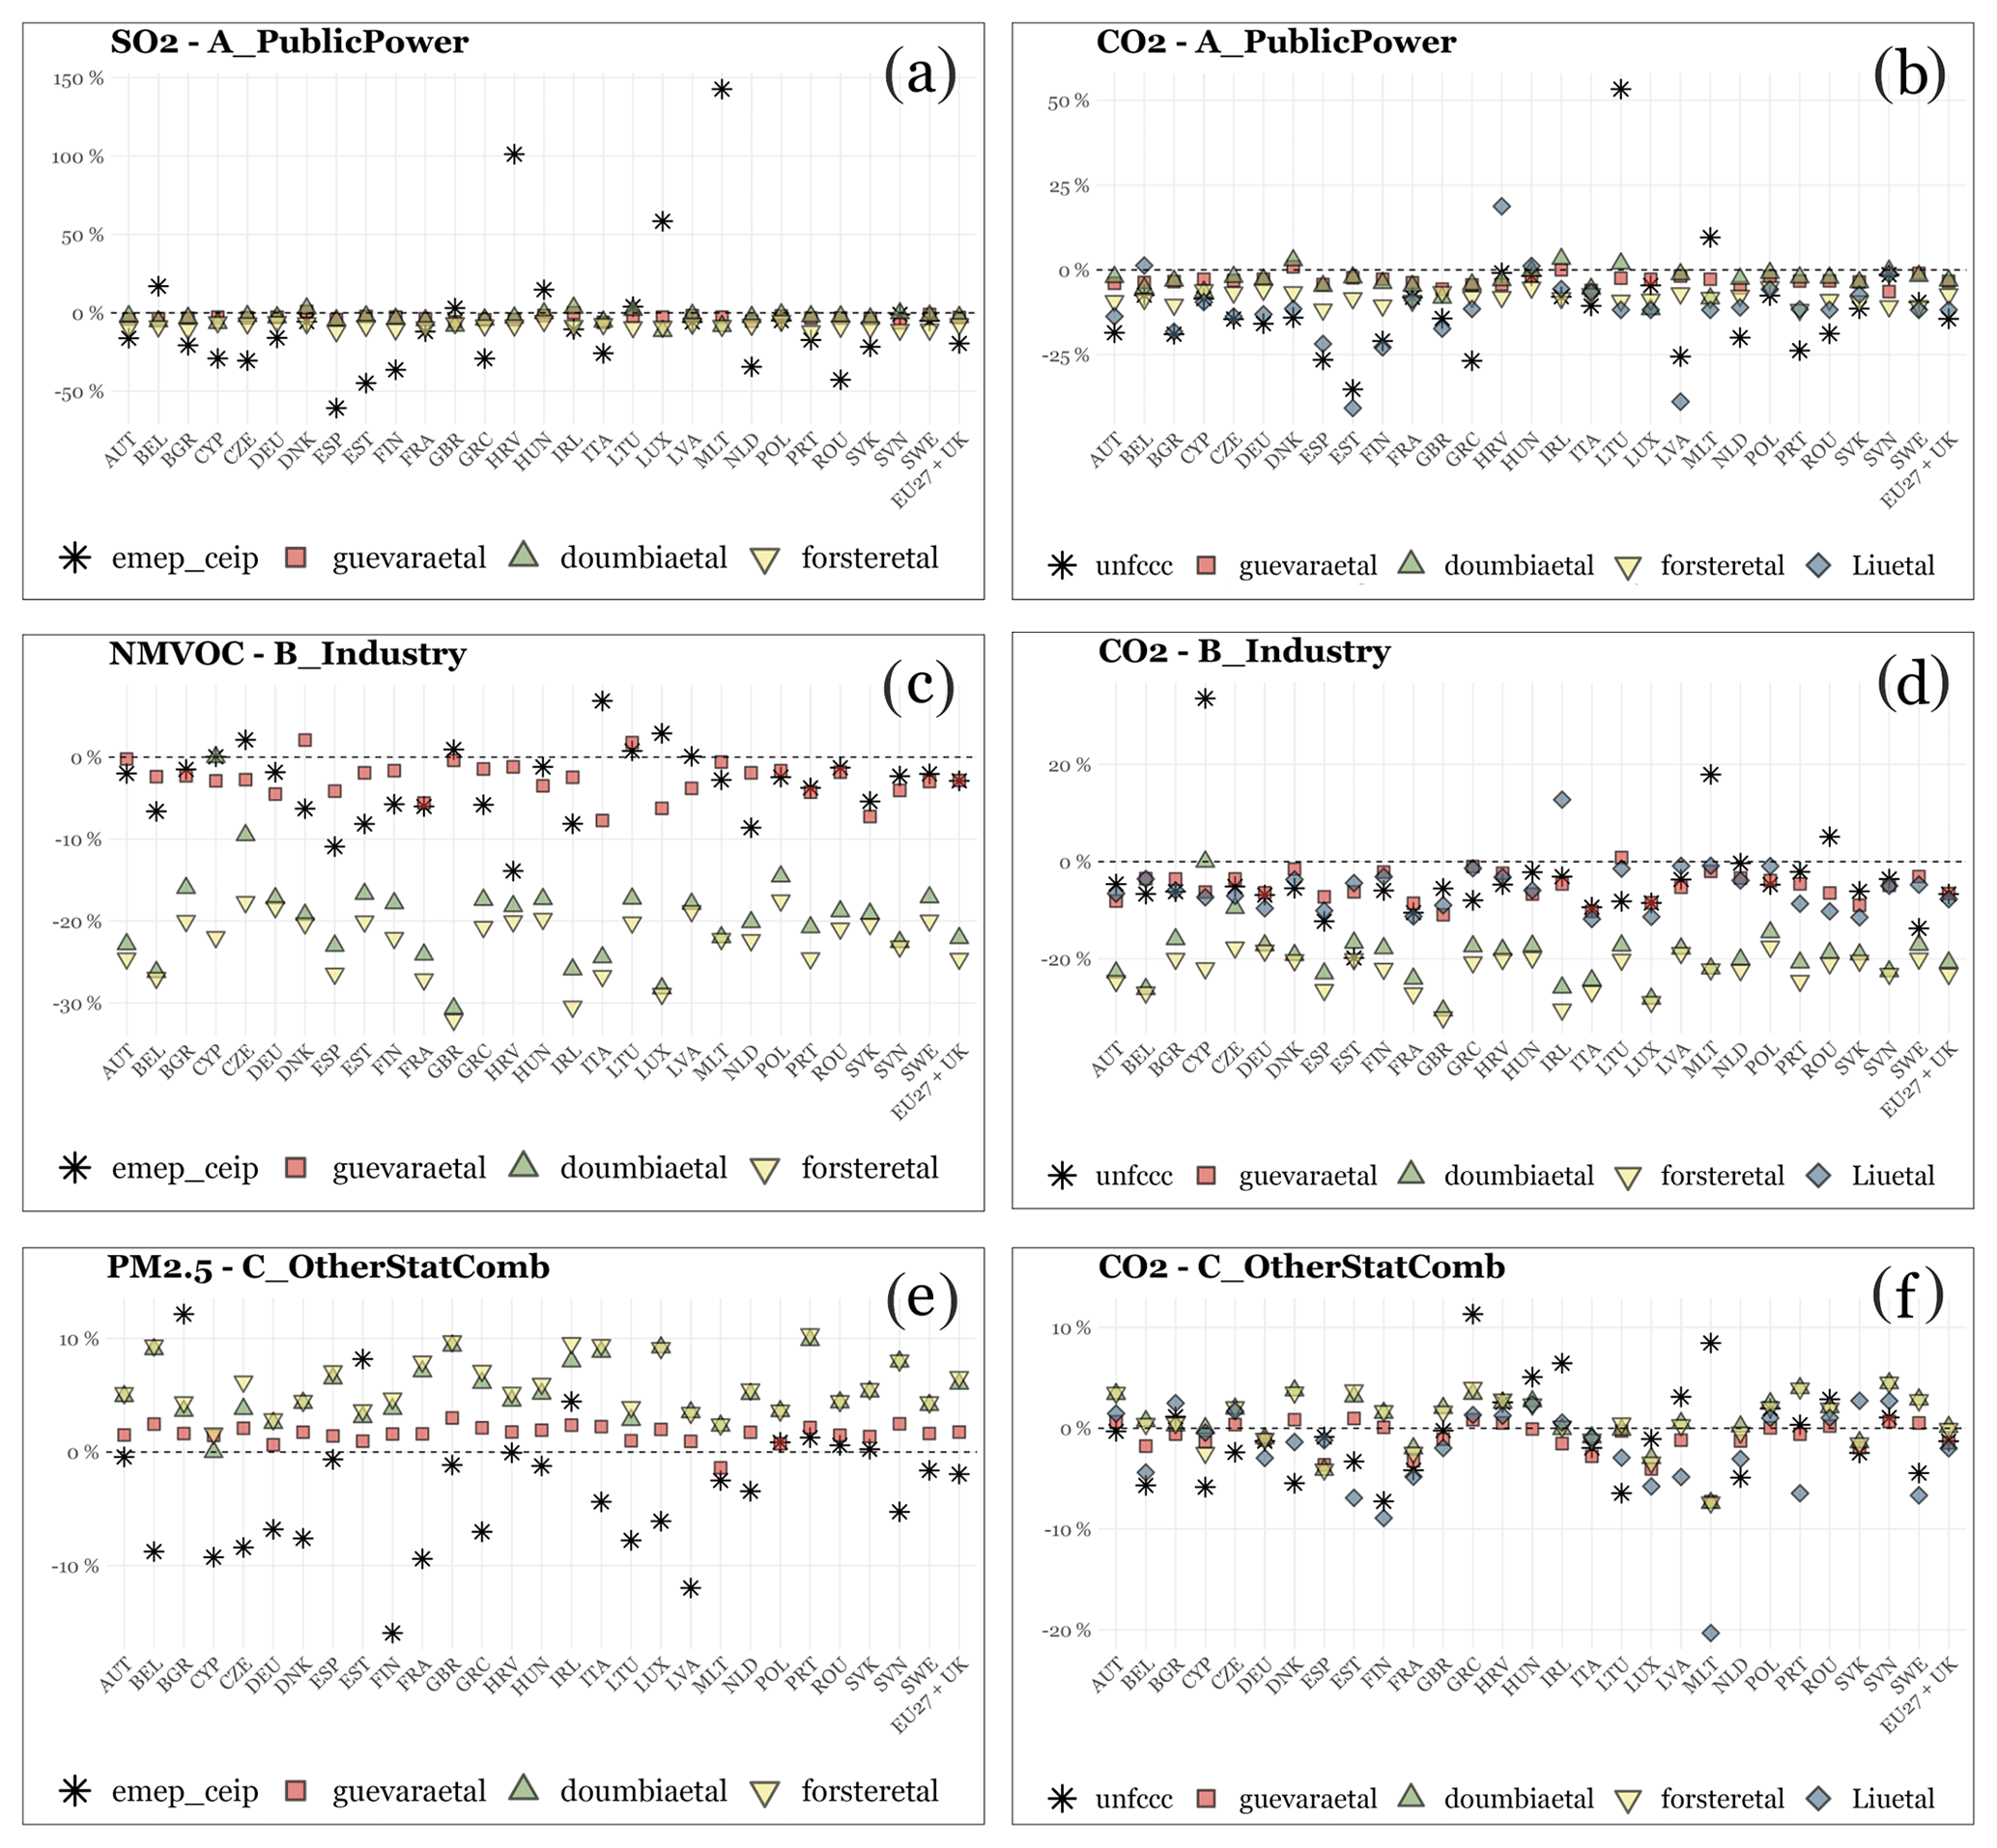
Figure 2Relative emission changes [%] reported by official (emep_ceip, unfccc) and non-official datasets (guevaraetal, forsteretal, doumbiaetal, liuetal) per country and at the EU27 + UK level for the public power sector (a, b), the manufacturing industry sector (c, d) and other stationary combustion activities (e, f).
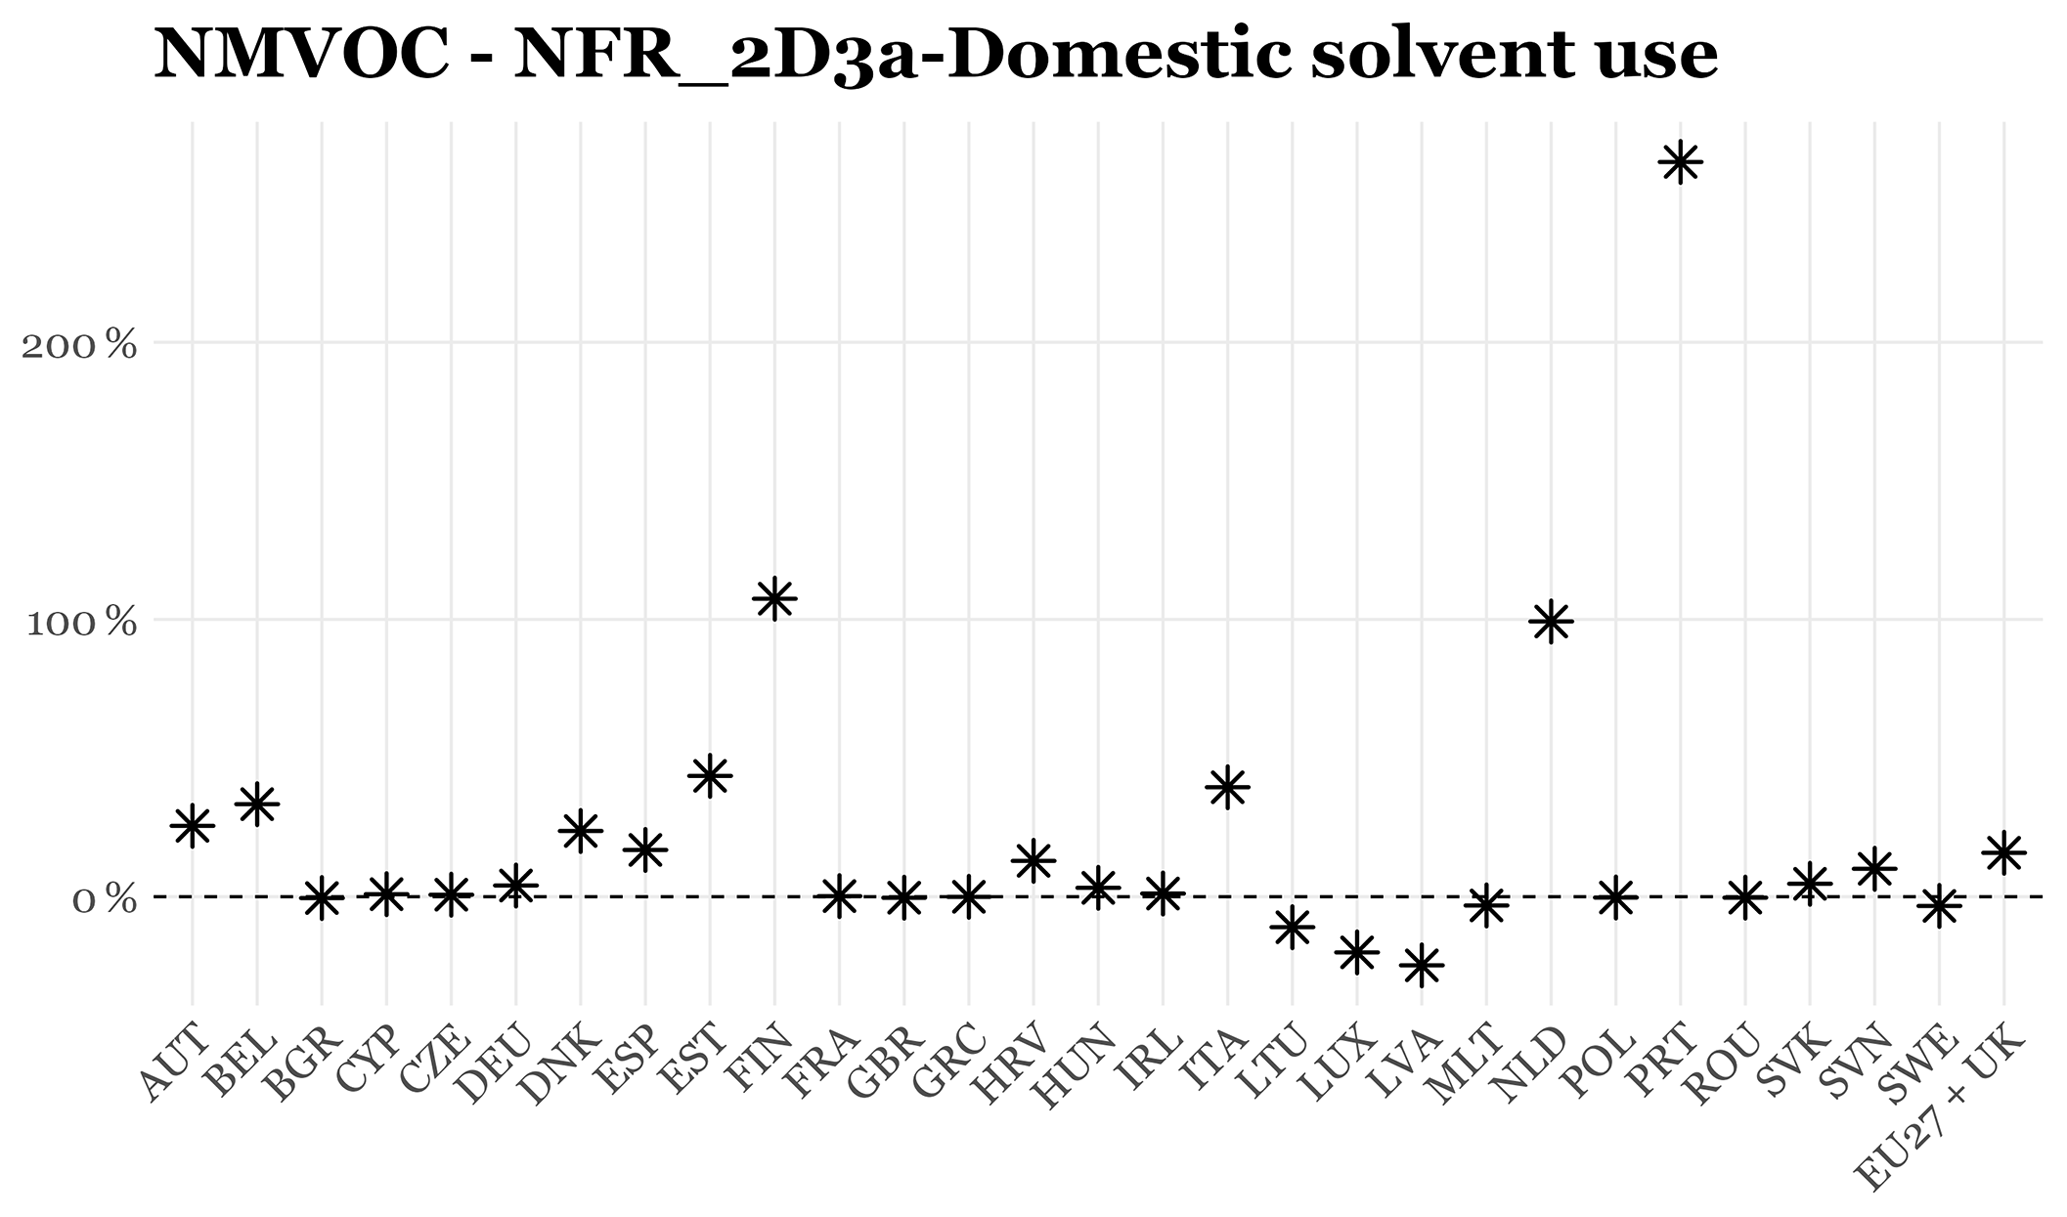
Figure 3Relative NMVOC emission changes [%] reported by official estimates (emep_ceip) per country and at the EU27 + UK level for the domestic use of solvent activity (Nomenclature for Reporting, NFR, code 2D3a) (CEIP, 2022).
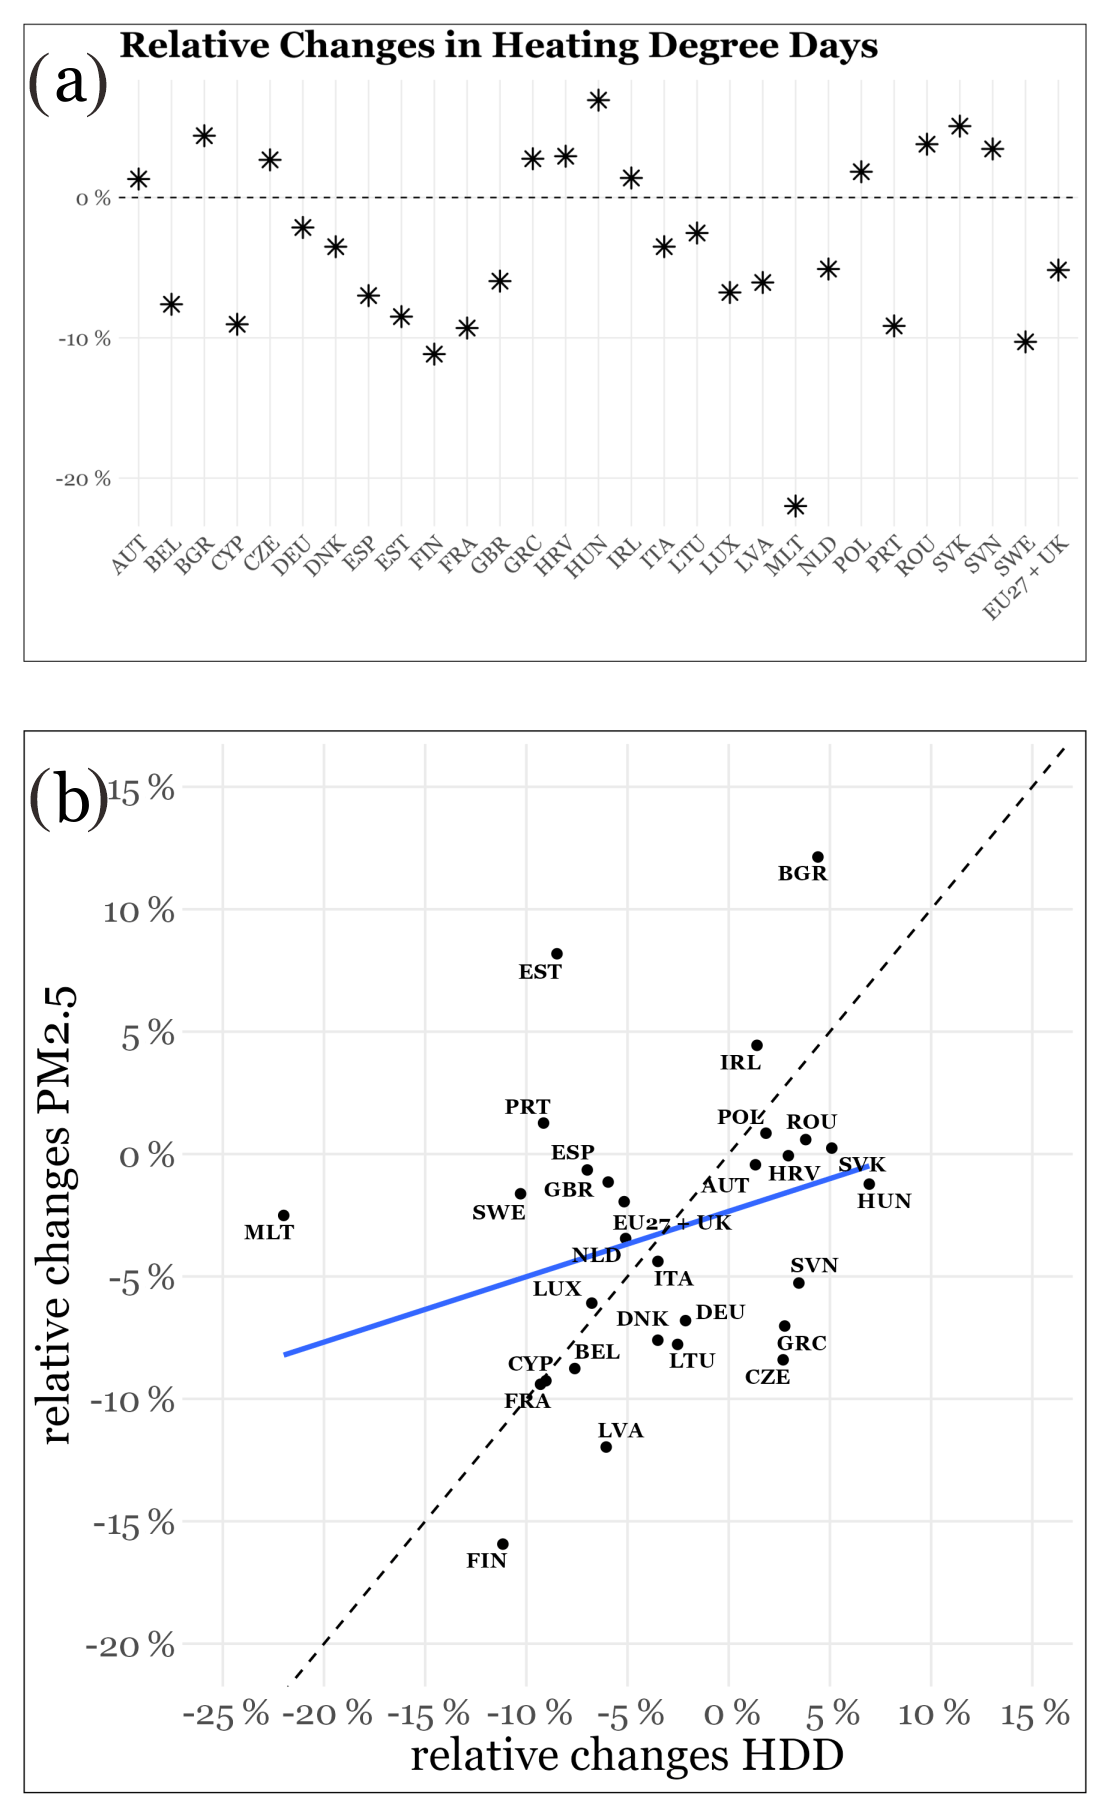
Figure 4Relative changes [%] in the number of heating degree days (HDDs) per country and at the EU27 + UK level between 2019 and 2020 (Eurostat, 2022) (a) and scatterplot showing the relative changes in the HDD and PM2.5 emissions from the residential and commercial sector per country and at the EU27 + UK level (b).
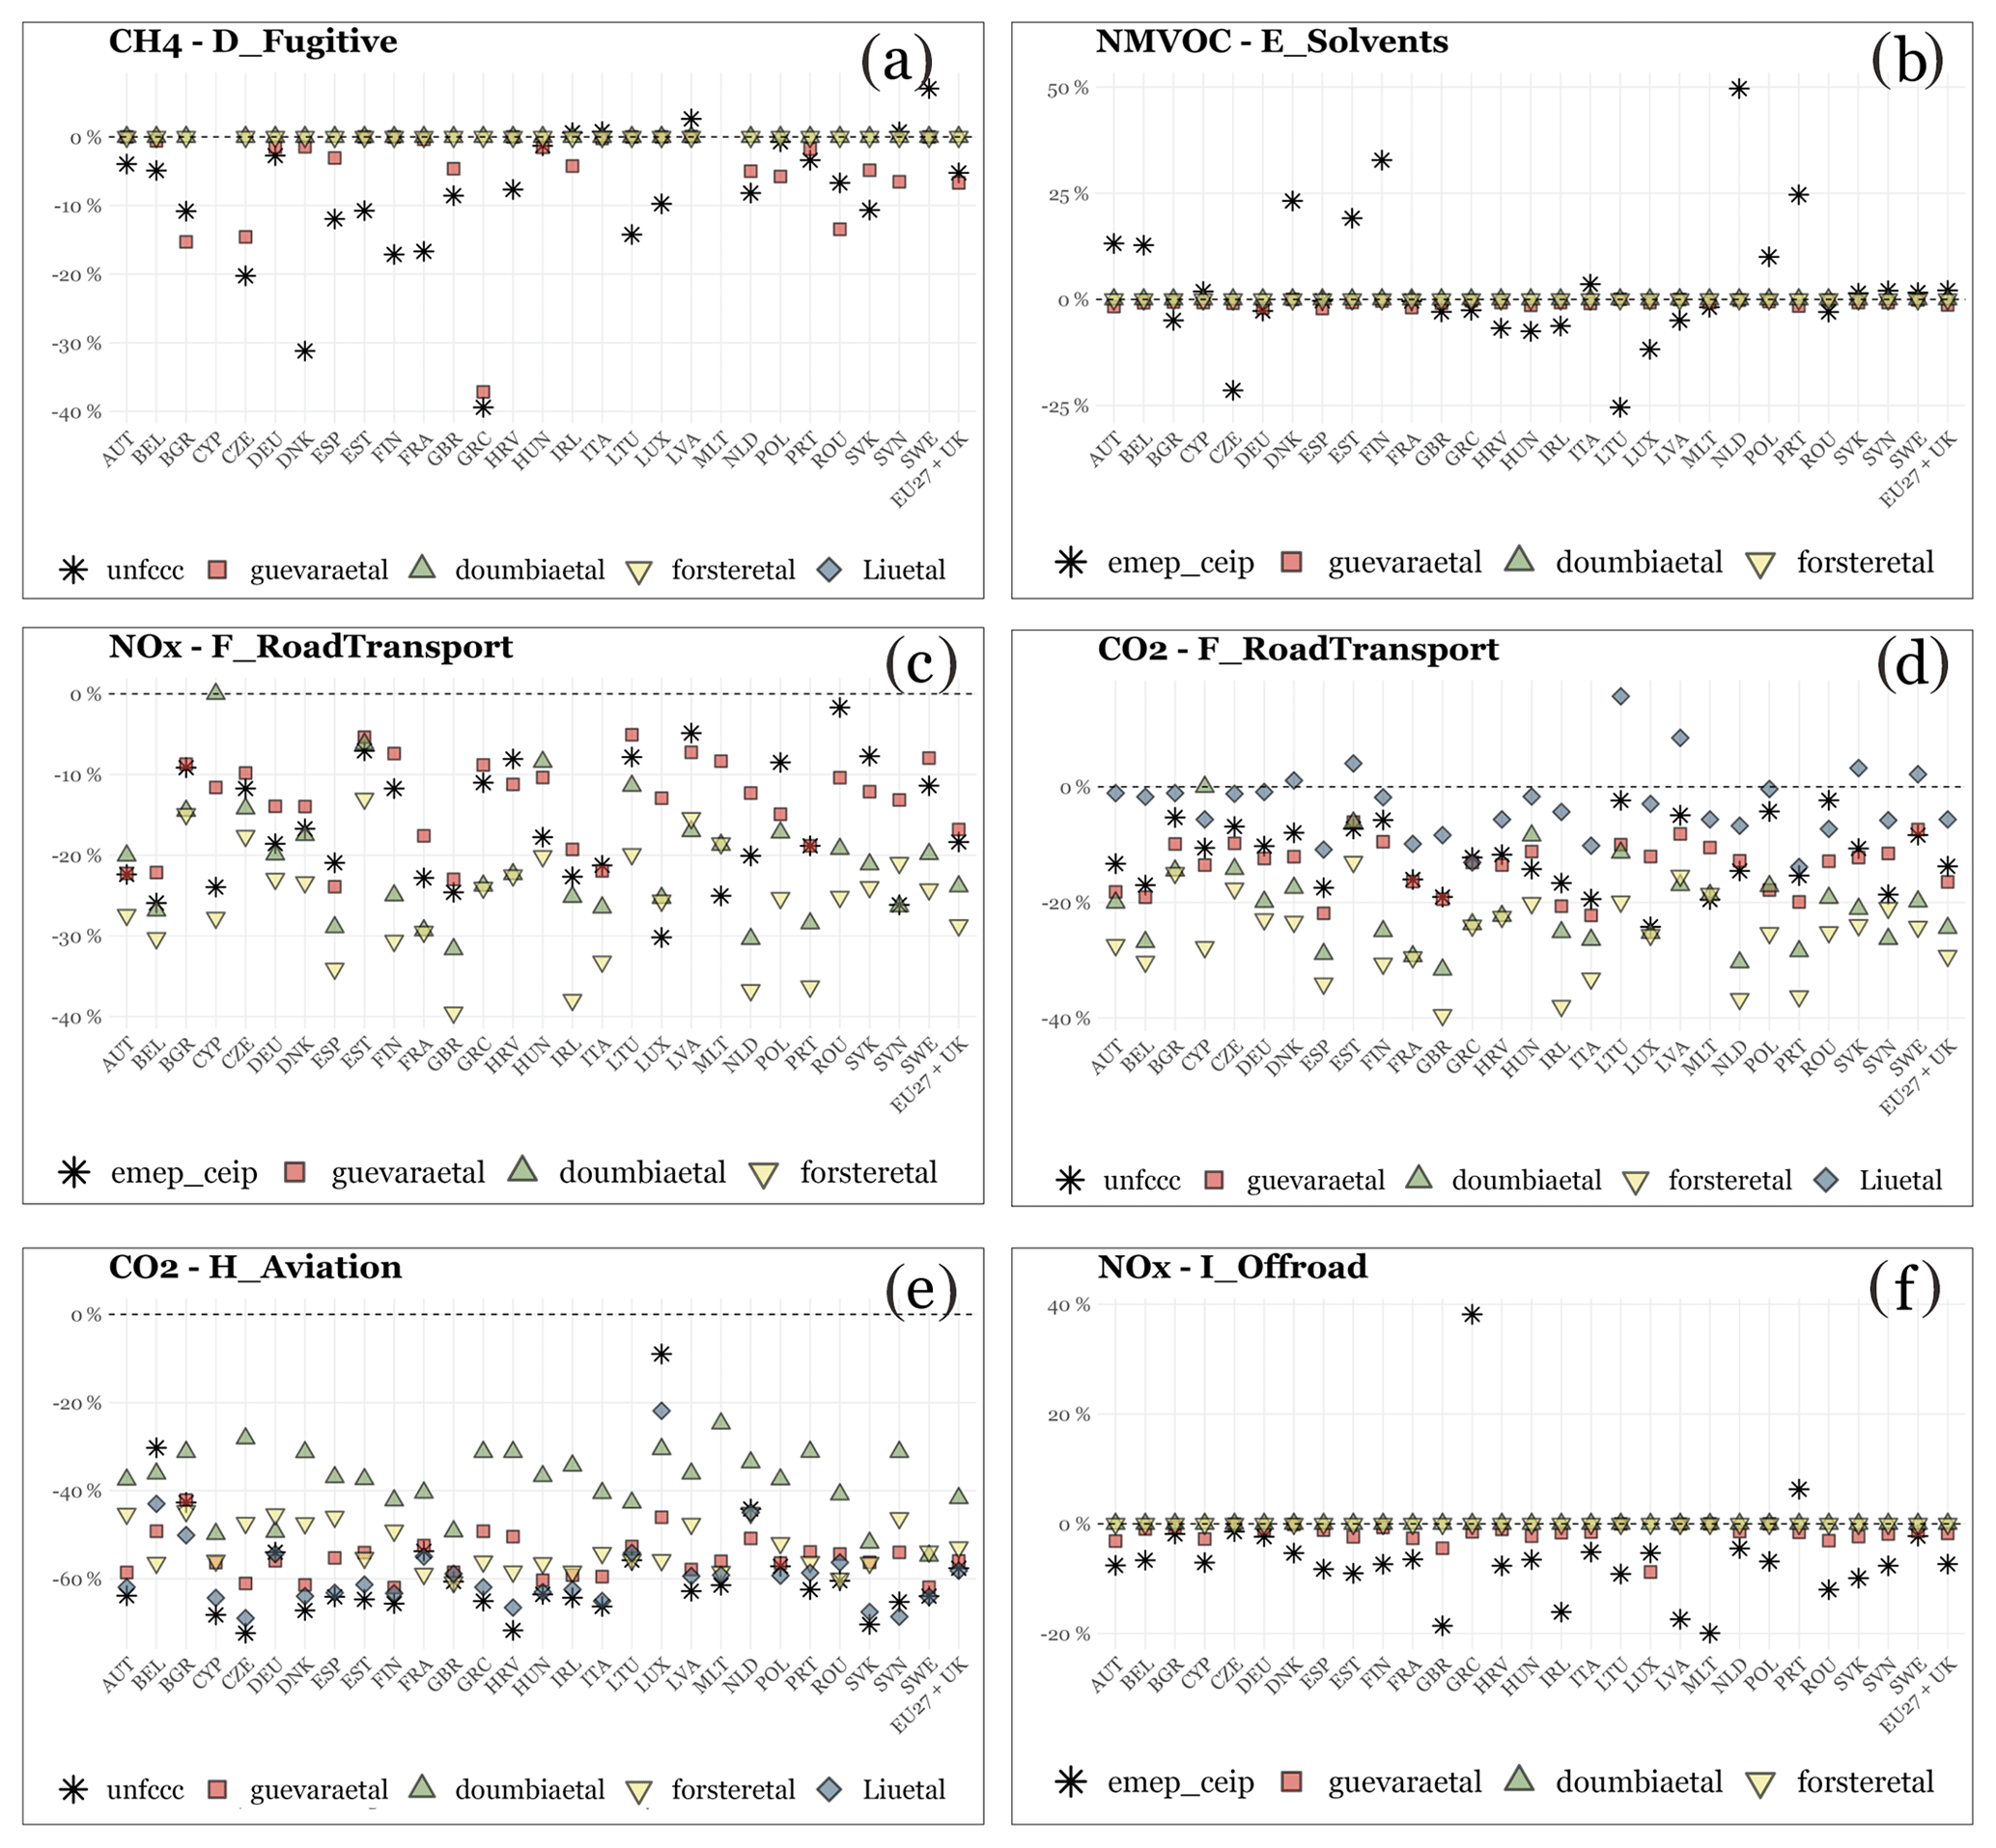
Figure 5Relative emission changes [%] reported by official (emep_ceip, unfccc) and non-official datasets (guevaraetal, forsteretal, doumbiaetal, liuetal) per country and at the EU27 + UK level for the fugitive fossil fuel sector (a), the use of solvent sector (b) road transport (c, d), aviation (e) and the off-road mobile sources (f).
3.2 Monthly and quarterly emission changes
Figure 6 shows the relative changes in monthly NOx and CO2 emissions that occurred in the EU27 + UK as reported by each of the near-real-time datasets described in Sect. 2.2. Officially reported data could not be included in this comparison, as emissions are available only at the annual level for most of the countries, and just a few of them publicly disclose information at a finer resolution (i.e. monthly, quarterly), as discussed later in this section.
For total NOx and CO2, a similar temporal pattern is reported by the four datasets, with (i) the largest drops occurring during the first round of lockdowns (March to May), (ii) emissions getting closer to pre-pandemic levels when national governments rolled back COVID-19 measures (June to September) and (iii) a new round of lower-intensity drops associated with the second pandemic wave in Europe (October to December). However, discrepancies exist regarding the magnitude of the changes reported by each dataset over the three periods.
For NOx, the drops reported by guevaraetal during March–May and October–December are 1.3 to 2.3 times lower than those provided by forsteretal and doumbiaetal. Significant differences of a similar magnitude are also observed during summertime, when doumbiaetal and forsteretal report much larger reductions when compared to guevaraetal. These discrepancies are mainly driven by the different NOx emission changes estimated for road transport during the same periods (Fig. 6c). When looking at the NOx emissions changes in the manufacturing industry sector (Fig. 6d), discrepancies between datasets occur in terms of both the magnitude and the timing of the drops. Concerning the temporal aspect, both doumbiaetal and forsteretal reproduce a pattern similar to that of road transport emissions, with a first drop occurring during March–May (reductions up to −53 % and −55 % in April), a recovery period during the summer and a second drop between November–December (reductions up to between −29 % and −32 % in December). Oppositely, guevaraetal results suggest a pronounced recovery from May onwards, with emission reductions reaching levels very close to business-as-usual by the end of the year (−0.05 % in December). These results are in line with the fact that most restrictions imposed in October, November and December were generally more lenient than those implemented in March–April (e.g. curfews, limited social gatherings, early closing times for restaurants and bars) and had no effect on the manufacturing industry. The differences between doumbiaetal/forsteretal and guevaraetal results can be directly linked to the activity proxies considered for the manufacturing industrial sector. The first two datasets considered Google mobility data to estimate changes in industrial emissions, whereas guevaraetal results are based on changes in industrial production indices.
For road transport CO2 emissions (Fig. 6d), the drops reported by liuetal in April (around −28 %) are almost 2 times lower than those estimated by the other three datasets (between −50 % and −60 %). For this sector, the consistency observed between guevaraetal, doumbiaetal and forsteretal during the first wave of the COVID-19 pandemic (i.e. March, April and May) is dissipated in summer, especially during July and August, when forsteretal suggests important decreases in emissions (close to −20 %), doumbiaetal indicates reductions of around −10 % and guevaraetal reports moderate decreases (approximately −5 %). The drops reported for traffic CO2 emissions by forsteretal and doumbiaetal are back in line during the second wave of contamination (i.e. November and December, close to −40 %), with the results estimated by guevaraetal and liuetal being much lower once again (between 2 and 5 times). For CO2 emissions from the public power sector (Fig. 6f), liuetal already reports significant drops in January and February (approximately −20 %), before the beginning of the pandemic. This result reinforces the hypothesis discussed in Sect. 3.1.1, which indicates that changes in 2020 emissions from this sector were mainly driven by national coal phase-out commitments that have continuously been implemented since the UN Paris Agreement was adopted during the COP21 in December 2015. For this sector, results reported by guevaraetal and doumbiaetal are generally in line, since in both cases the electricity demand data from ENTSO-E are used as the main proxy to derive the emission adjustment factors (Table 2).
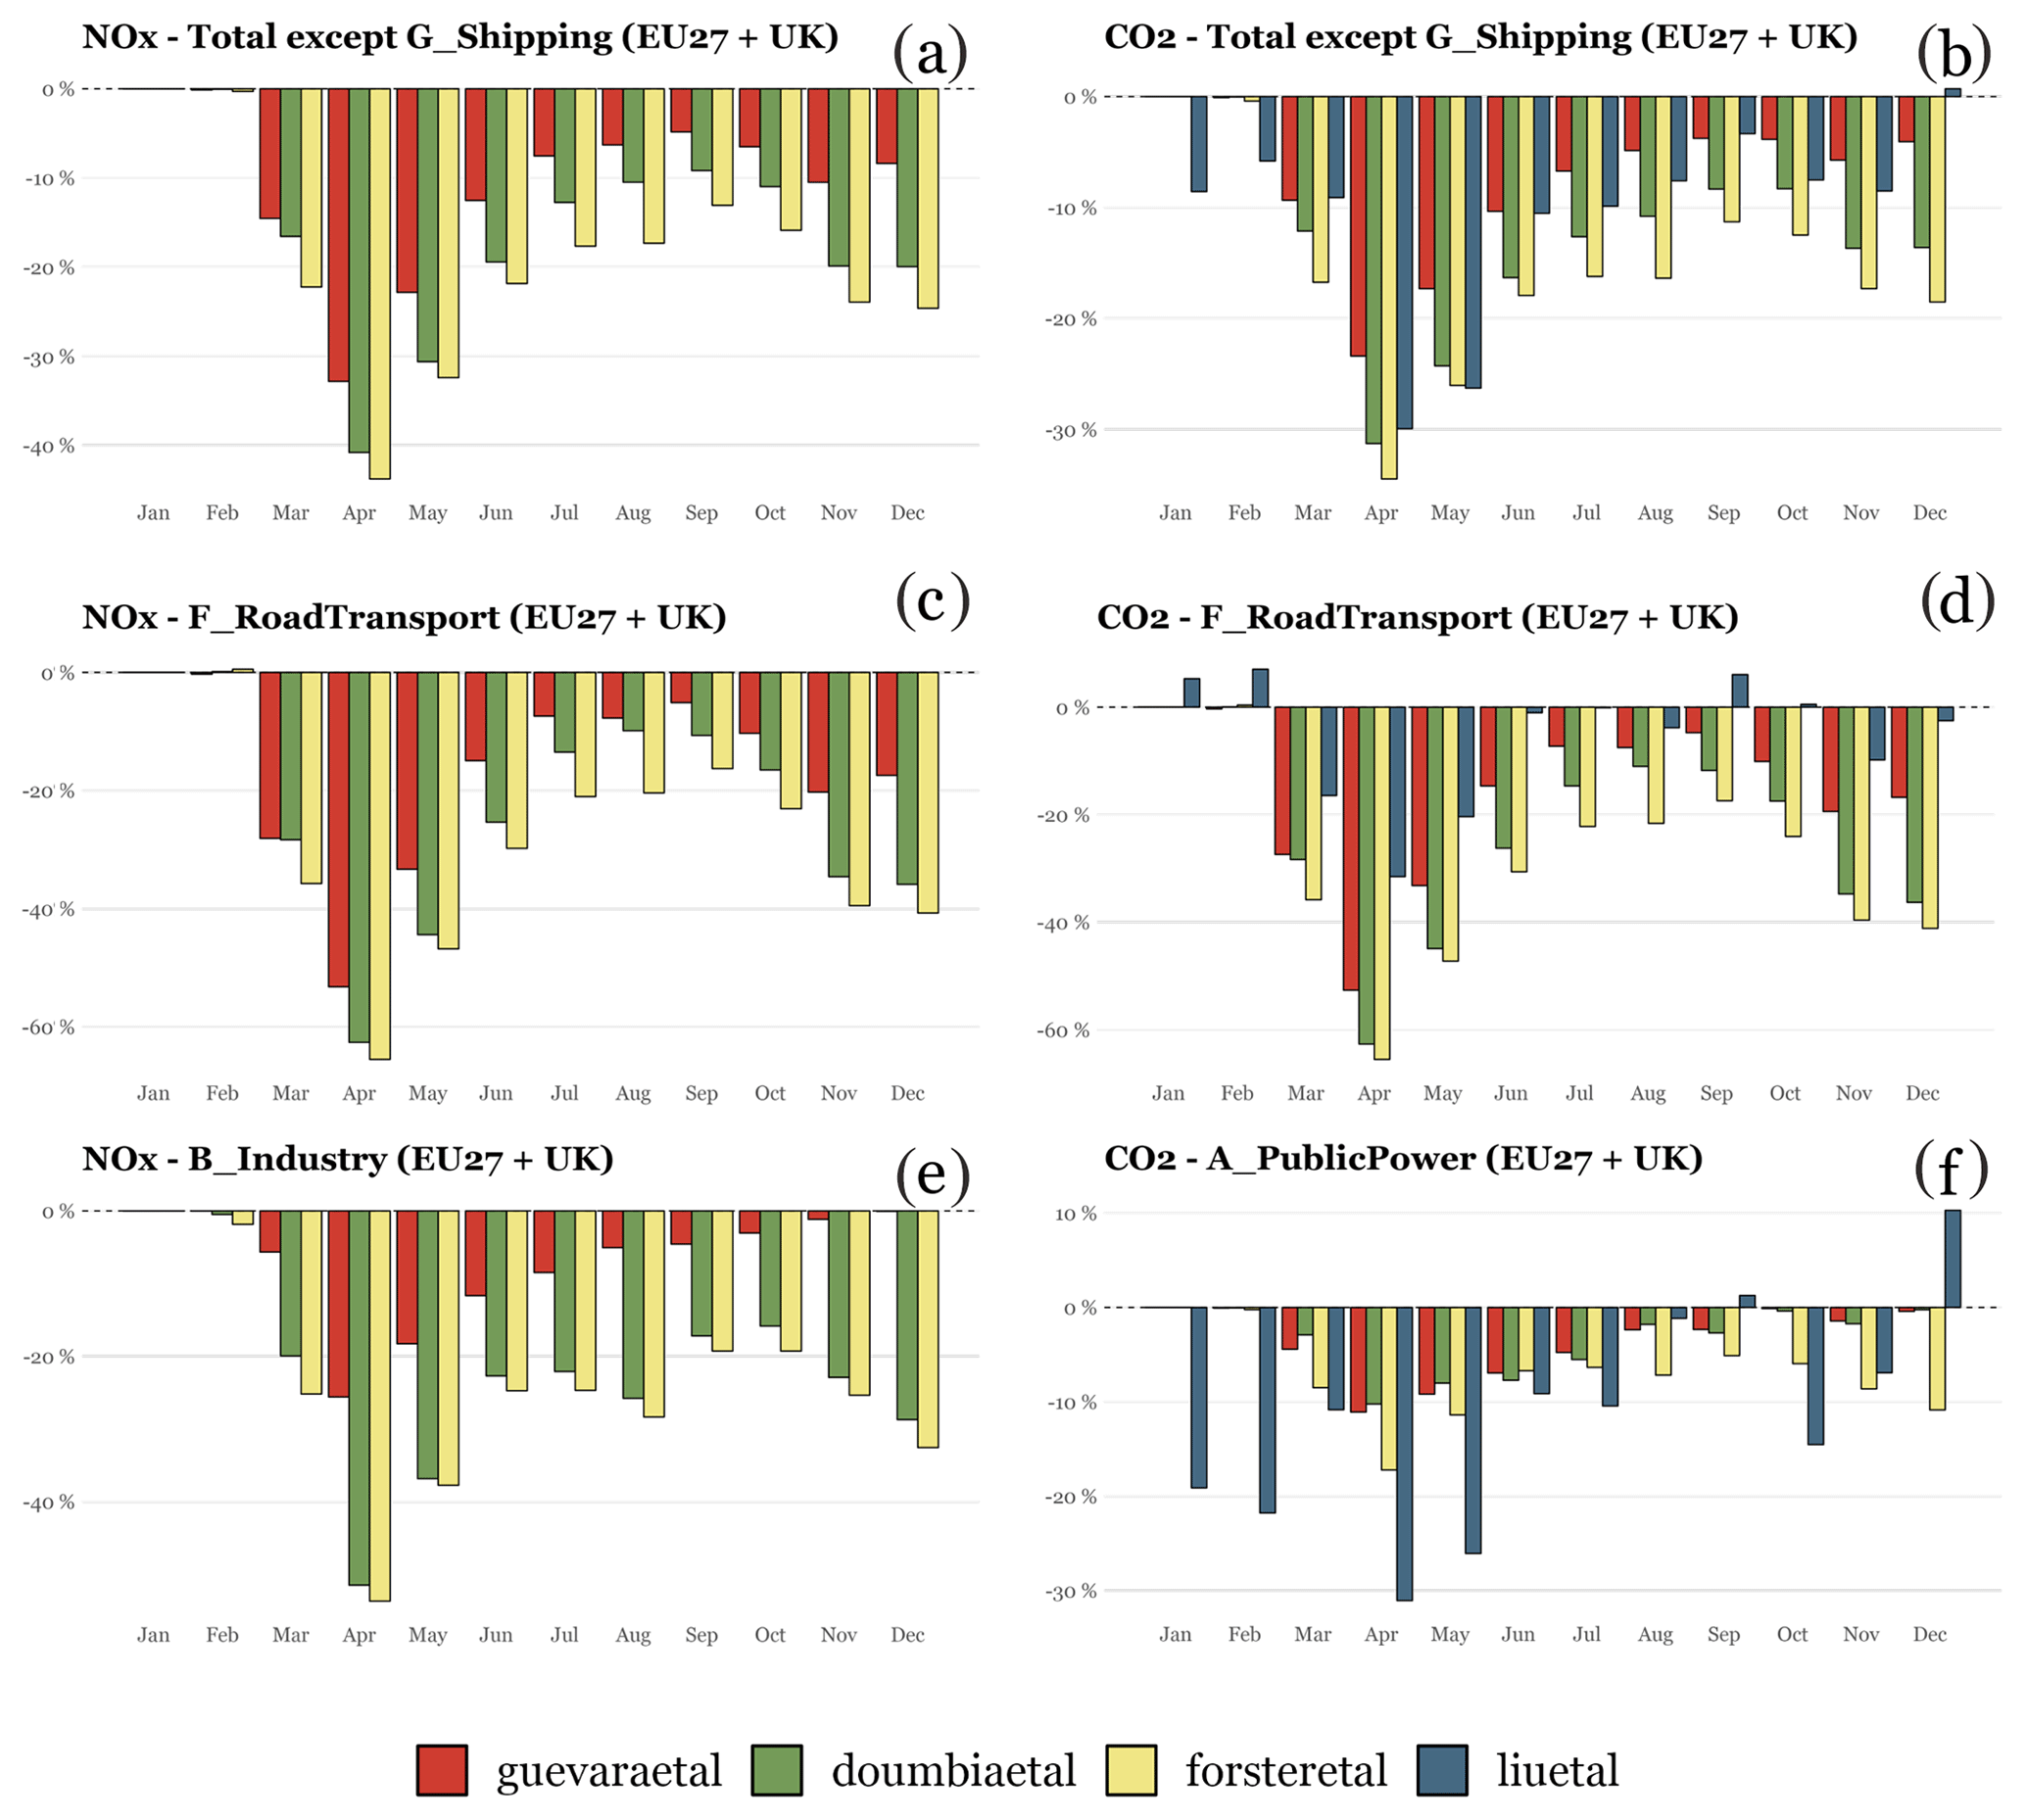
Figure 6Relative NOx and CO2 monthly emission changes [%] reported by each near-real-time dataset at the EU27 + UK level for total emissions except shipping (a, b) and selected sectors, including road transport (c, d), the manufacturing industry (e) and public power (f).
Figures 7 and 8 present a comparison of the near-real-time estimates against publicly disclosed national monthly (France, CITEPA, 2022) and quarterly (the UK, BEIS, 2022; the Netherlands, CBS, 2022) estimates reported by national inventory agencies. For the UK and the Netherlands, official results are only provided for GHGs and five general sectors, whereas for France information is available for both APs and GHGs at a detailed activity level (75 subsectors), allowing a more extended comparison (i.e. NOx and CO2 for total emissions and selected sectors).
The guevaraetal results are the ones closest to the French NOx official estimates (i.e. the Centre Interprofessionnel Technique d'Études de la Pollution Atmospherique, CITEPA) during the periods corresponding to the two main waves of pandemic prevention and control policies (i.e. March–May and October–December). This consistency is observed for total emissions (Fig. 7a) as well as for the road transport (Fig. 7c) and industrial manufacturing (Fig. 7e) sectors. The largest discrepancy between the two datasets is observed in April (−49 % versus −38 %) and is mainly driven by differences in the manufacturing industry sector (−38 % versus −26 %), the results reported for road transport being the same (−64 %). The doumbiaetal and forsteretal datasets tend to overestimate the official NOx emission reductions during the two lockdown periods, the largest discrepancy occurring for the manufacturing industry sector in November and December, when the two near-real-time datasets indicate reductions of around −30 %, while CITEPA reports values above BAU levels (up to 9 %). This inconsistency is in line with the results from Fig. 6e previously discussed. The drops in total NOx emissions that occurred during April and May (−38 % and −27 %) are also overestimated by both doumbiaetal (−59 % and −47 %) and forsteretal (−60 % and −45 %). Regarding total CO2 emissions (Fig. 7b), guevaraetal and liuetal are in general the datasets more in line with official estimates. The same conclusion is obtained when looking at the results for the road transport sector (Fig. 7d). The drops reported by CITEPA during April and May (−63 % and −37 %) are well reproduced by guevaraetal (−61 % and −33 %), slightly underestimated by liuetal (−50 % and −26 %), and significantly overestimated by doumbiaetal (−80 % and −59 %) and forsteretal (−79 % and −57 %). As shown before (Sect. 3.1.1), liuetal is the dataset that generally better reproduces the official changes reported for the public power sector (Fig. 7f), being able to capture the increases that occurred during summertime, which are partially linked to the record temperatures experienced in France (C3S, 2020b) and the associated increase in the energy demand for the use of air conditioning systems. Despite the good agreement between liuetal and CITEPA for this sector, some important discrepancies are still observed, mainly in April, when the near-real-time dataset significantly overestimates the reported drop (−44 % versus −71 %).
The official relative CO2 quarterly emission changes estimated by the Department for Business, Energy and Industrial Strategy (BEIS) for the UK are in good agreement with the results reported by guevaraetal and liuetal, while a general overestimation is observed for doumbiaetal and forsteretal (Fig. 8a). All datasets report the largest drop in the second quarter of the year, i.e. −24 % according to BEIS and guevaraetal, −30 % according to liuetal, −33 % according to doumbiaetal, and −35 % according to forsteretal. For the Netherlands, liuetal is the one closest to the Centraal Bureau voor de Statistiek (CBS; Central Agency for Statistics) official estimates for all quarters (e.g. −15 % in both cases during the second quarter), the results by forsteretal and doumbiaetal again being the ones that present the largest discrepancy (Fig. 8b). Interestingly, the drop in CO2 emissions reported during the first quarter of the year (−11 %) is of the same magnitude as the ones reported during the second (−15 %) and fourth (−10 %) quarters, when national lockdowns were implemented. This drop is only partially reproduced by liuetal, and it is mainly related to a drop in the CO2 emissions from the power sector (not shown), which was triggered by the retirement of hard-coal-fired power plants by the end of 2019.
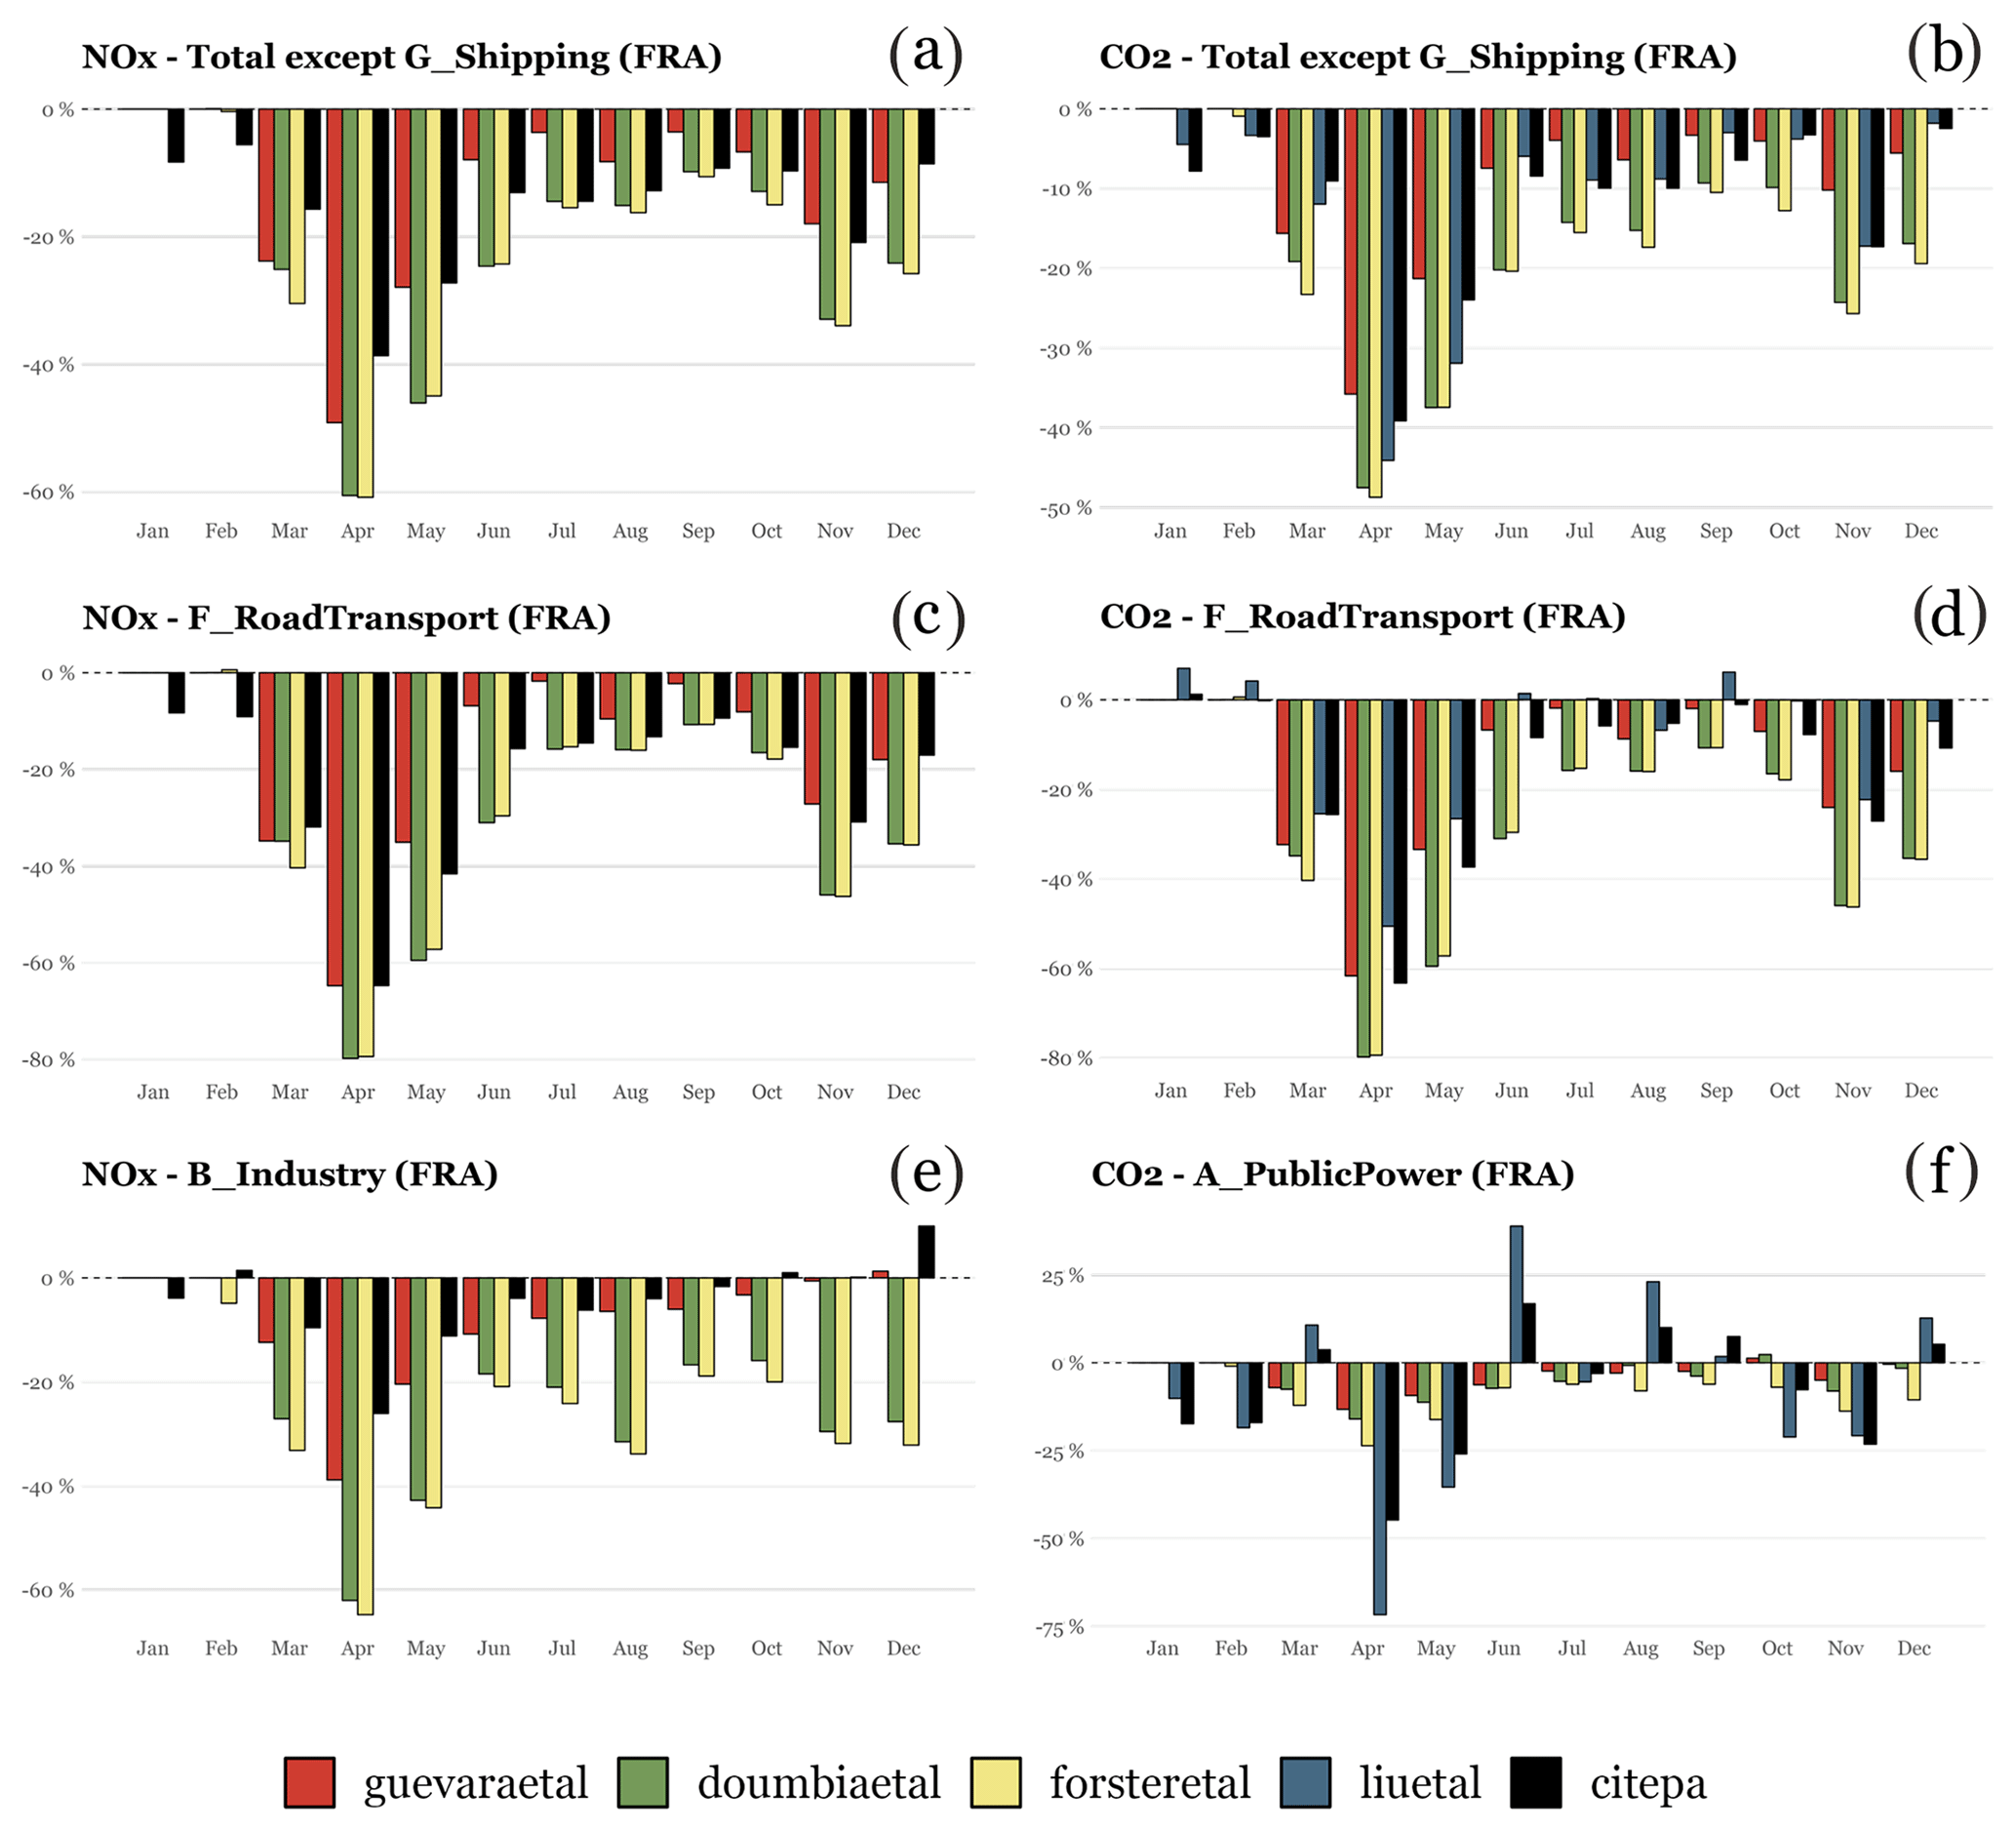
Figure 7Relative NOx and CO2 monthly emission changes [%] reported by each near-real-time dataset and CITEPA (2022) for France for total emissions except shipping (a, b) and selected sectors, including road transport (c, d), the manufacturing industry (e) and public power (f).
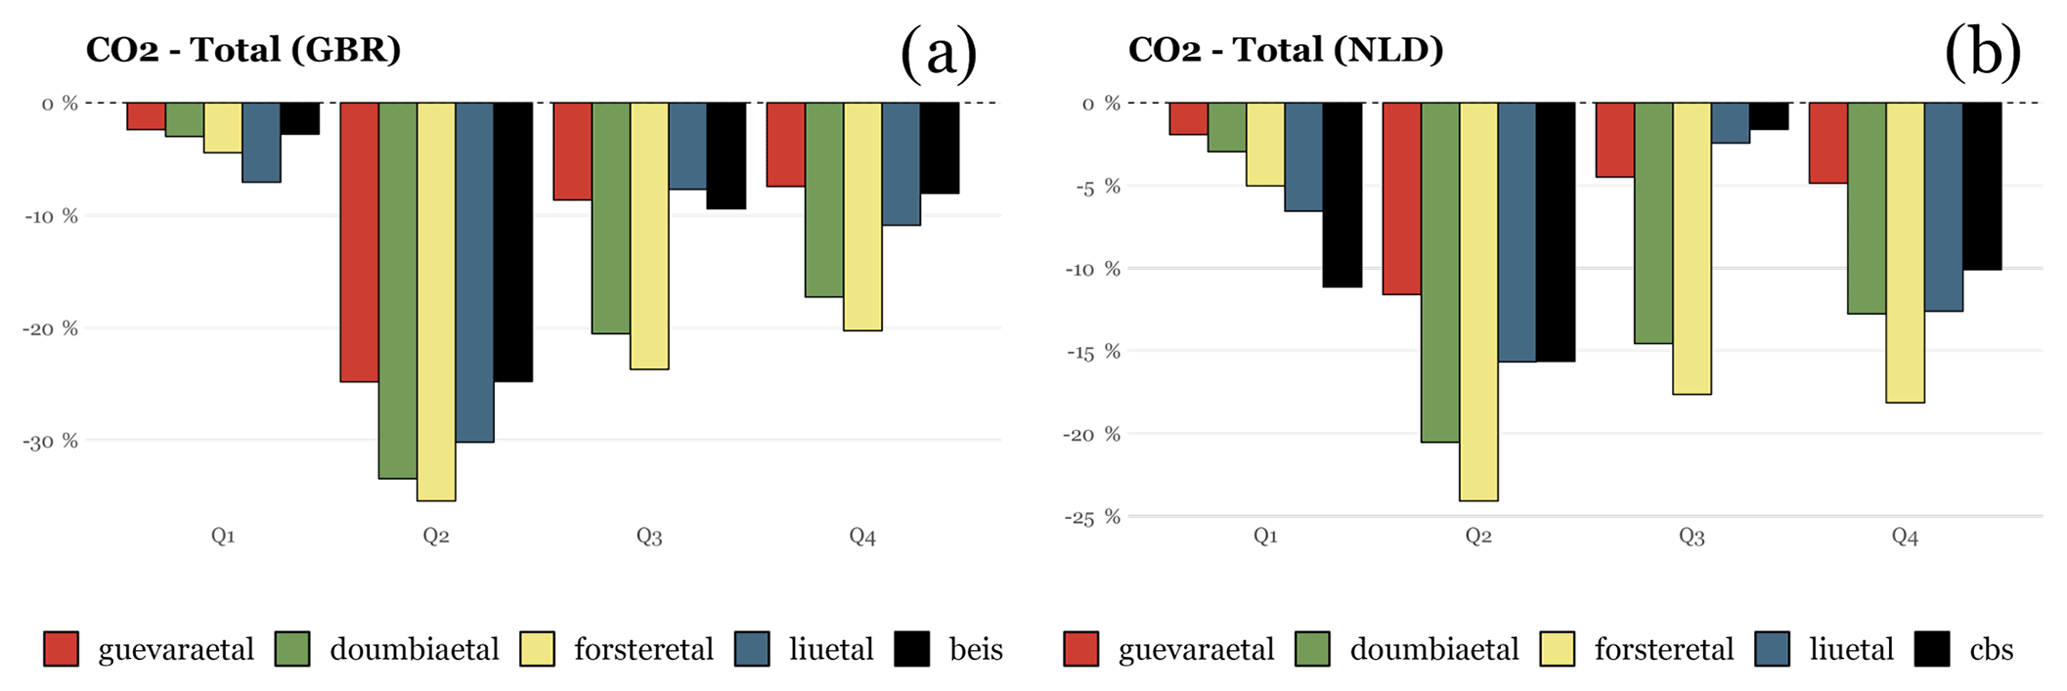
Figure 8Relative total CO2 quarterly emission changes [%] reported by each near-real-time dataset and official estimates from BEIS (2022) and CBS (2022) for the UK (a) and the Netherlands (b), respectively.
This work presents the results of an intercomparison of relative European anthropogenic emission changes in 2020 reported by official and non-official estimates. Official estimates include the national inventories of air pollutants (APs; NOx, NMVOC, SO2, NH3, PM2.5) and greenhouse gases (GHGs; CO2 and CH4) reported under the CLRTAP and the UNFCCC, respectively. The selection of near-real-time emission estimates includes the CAMS COVID-19 European emission adjustment factors (guevaraetal), the global CONFORM dataset (doumbiaetal), the COVID-19 estimates developed by Forster et al. (2020a) (forsteretal) and the CO2 emission estimates reported by the Carbon Monitor initiative (liuetal). The comparison focusses on the EU27 + UK and is performed on an annual, quarterly and monthly basis. The following conclusions were obtained from the intercomparison work:
-
NOx and CO2 are consistently being reported by official and non-official estimates as the pollutants that experienced the largest reductions in Europe in 2020 (−11.3 % and −12.2 % according to official estimates). Similarly, NH3 and CH4 are reported by official and the near-real-time datasets as the species with the lowest reductions (i.e. −1.1 % and −1.4 % according to official estimates and between −0.9 % and 0.1 % according to non-official estimates).
-
Despite this agreement, large discrepancies arise between the official and non-official datasets when comparing results for specific sectors and countries.
-
The guevaraetal dataset tends to be more in line with official AP relative emission change estimates, while the results reported by forsteretal and doumbiaetal, which are largely derived from Google mobility data, present larger discrepancies.
-
Results reported by liuetal are generally in a good agreement with official CO2 estimates, except for the road transport sector, where they tend to report relative emission reductions much lower than those provided by the UNFCCC official inventories.
-
For the residential combustion, public energy industry and shipping sectors, changes in emissions that occurred between 2019 and 2020 were mainly dominated by non-COVID-19 factors, such as meteorology (i.e. warmer winter), the implementation of national decarbonization plans in the electricity sector and the introduction of the Global Sulphur Cap rule, respectively.
-
The increase in NMVOC emissions from the use of pandemic products (e.g. hand sanitizer gels) is heterogeneously considered in official CLRTAP inventories, as several countries use a very basic emission estimation method (tier 1) that uses population data as activity data and thus does not reflect the increased use of these products.
-
Relative changes in AP and GHG emissions reported by the CLRTAP and UNFCCC official estimates are in general consistent. However, some discrepancies were detected in some cases (e.g. changes in SO2 versus CO2 emissions from public power), which could be attributed to issues with the reported data or the coordination between AP and GHG inventory development efforts.
-
Regarding monthly relative changes in total NOx and CO2, similar patterns are observed in the different near-real-time estimates, with the largest drops occurring during the first round of lockdowns (March to May); emissions getting closer to business-as-usual levels between June and September, coinciding with the ease of restrictions; and a new round of lower-intensity drops occurring between October to December, when a second pandemic wave affected Europe. However, important discrepancies exist regarding the magnitude of the changes reported by each dataset during the three periods, which are again related to the different activity proxies used to estimate the drops in emissions.
-
When compared to official quarterly and monthly estimates reported by national inventory agencies, guevaraetal and liuetal are again the datasets that are in a better agreement, for both total emissions and specific sectors, including road transport, the manufacturing industry and public power.
-
The present intercomparison work does not allow for checking the quality of the near-real-time estimates in an absolute way, since, even being based on local data and detailed estimation methodologies, official national emission inventories also have uncertainties associated with them and cannot be considered to be the ground truth. Nonetheless, the cases where datasets converge on similar trends could be interpreted as providing an encouraging cross-verification of the official and independent emission inventories.
-
Linked to the previous point, official emission inventory estimates are subject to continuous revisions as the underlying data (e.g. energy statistics, emission factors) and estimation methodologies are updated or improved every year. These revisions may occasionally incur significant changes to emissions from specific countries/sectors/species (e.g. Kuenen et al., 2022a) and subsequently to the corresponding comparison results presented in this work
The COVID-19 outbreak has remarkably contributed to a crucial change in how we quantify and understand emissions of APs and GHGs. New datasets and proxies based on inter alia mobility and congestion data derived from smartphones or GPS systems have emerged that did not exist before or were not extensively being considered by the emission modelling community. The near-real-time estimates presented in this work demonstrate how emission compilation methodologies can take advantage of the emergence of big data from remote sensing technologies and smart devices. The irruption of these technologies and associated datasets, which are expected to continue growing, provides the opportunity for a change of paradigm in the production of emission estimates for monitoring and modelling applications, mainly air quality forecasting. As proposed by Tong et al. (2012), improved predictions of air quality require bringing emission science to a new level and moving from inventory-based data processing approaches (i.e. generation of hourly model-ready emission data by processing existing and pre-calculated annual emission estimates) to modelling approaches that use and integrate near-real-time data collected from multiple networks and monitors. The need for near-real-time emission information has grown not only because of the COVID-19 pandemic, but also as a result of an increased interest from the general public in climate mitigation and environmental protection, as well as subsequent events that are causing disruptions to the business-as-usual emission levels, most notably the war in Ukraine and the associated energy crisis.
Despite the new opportunities created by the aforementioned technological advancements, estimating emissions in near-real-time still presents several challenges. Firstly, the results of this intercomparison work highlight that caution is required when using new mobility data to estimate changes in emissions and that these proxies should be combined with traditional statistics such as measured traffic counts or energy consumption statistics. However, traditional information is still difficult to acquire in a consistent way, particularly when working at the global level, as the number of global repositories giving access to near-real-time and high-resolution emission proxy information is very scarce. As previously highlighted, the results reported by the guevaraetal dataset, which covers only Europe, are generally more in line with official estimates. This demonstrates how difficult it is to obtain accurate and consistent local information when working at the global level. At the same time, differences between guevaraetal and officially reported emissions for specific sectors and countries indicate that uncertainties are large, even in the case of large disturbances such as the COVID-19 pandemic, and that current approaches might miss normal interannual variations. Secondly, digitized near-real-time information arising from new smart technologies covering key sectors such as electricity production, aviation or road transport is emerging; however, for some other relevant activities, such as the use of solvents, residential and commercial combustion (particularly residential wood combustion), and agricultural activities, it is likely that near-real-time activity monitoring will remain scarce. Observations from satellite-based sensors are key to partially overcome this limitation, as exemplified by the Global Fire Assimilation System (GFAS; Kaiser et al., 2021) for monitoring biomass burning emissions or the use of very high-resolution satellites (e.g. WorldView3, WV3) to detect and quantify CH4 emitters (Irakulis-Loitxate et al., 2022), among others.
Officially reported AP (i.e. NOx, NMVOC, SO2, CO, NH3 and PM2.5) and GHG (i.e. CO2 and CH4) emissions for 2019 and 2020 (reporting year 2022) were obtained from https://www.ceip.at/webdab-emission-database/reported-emissiondata (CEIP, 2022) and https://unfccc.int/ghg-inventories-annex-i-parties/2022 (UNFCCC, 2022), respectively. The collection of the CAMS COVID-19 emission adjustment factors reported by Guevara et al. (2022a) is available from https://doi.org/10.24380/k966-3957 (Guevara et al., 2022b). The CONFORM emission adjustment factors reported by Doumbia et al. (2021) are available from https://doi.org/10.25326/88 (Doumbia et al., 2020). The emission adjustment factors reported by Forster et al. (2020a) are available from https://doi.org/10.5281/zenodo.3957826 (Forster et al., 2020b). The CO2 European emissions reported by Carbon Monitor (Liu et al., 2020a) are available from https://doi.org/10.6084/m9.figshare.20219024.v2 (Ke et al., 2022b). The Copernicus CAMS-REG_v5.1 2020 business-as-usual (BAU) emission inventory (Kuenen et al., 2022b) is distributed from the Emissions of atmospheric Compounds and Compilation on Ancillary Data (ECCAD) system (https://doi.org/10.24380/eptm-kn40, Kuenen et al., 2022b).
A numeric file containing annually and monthly processed emissions per country, the GNFR sector, and pollutants is provided as part of the Supplement of the paper. For the official inventories (EMEP-CEIP and UNFCCC) and Liu et al. (2020a) we provide the corresponding emissions reported for the years 2019 and 2020. For Guevara et al. (2022a), Doumbia et al. (2021) and Forster et al. (2020a) we provide the CAMS-REG_v5.1 business-as-usual (BAU) 2020 emissions and the result of combining this inventory with the COVID-19 emission adjustment factors reported by each of the three databases. The file is provided in Excel format and includes a README sheet describing each information field.
The supplement related to this article is available online at: https://doi.org/10.5194/acp-23-8081-2023-supplement.
MG conceived and coordinated the study. MG, HP, OJ and CPGP prepared the comparison plots and contributed to the interpretation and discussion of the results. HDvdG, JK, IS, CG, TD, PC, ZL, SaS, BM and RDL contributed to the interpretation and discussion of the results. OJ and CPGP supervised the work. MG prepared the manuscript with contributions from all co-authors.
The contact author has declared that none of the authors has any competing interests.
Publisher’s note: Copernicus Publications remains neutral with regard to jurisdictional claims in published maps and institutional affiliations.
The research leading to these results has received funding from the Copernicus Atmosphere Monitoring Service (CAMS), which is implemented by the European Centre for Medium-Range Weather Forecasts (ECMWF) on behalf of the European Commission. We acknowledge support from the VITALISE project (PID2019-108086RA-I00) funded by MCIN/AEI/10.13039/501100011033; from the MITIGATE project (PID2020-116324RA695 I00/AEI/10.13039/501100011033) from the Agencia Estatal de Investigación (AEI); from the BROWNING project (RTI2018-099894-BI00) from the Ministerio de Ciencia, Innovación y Universidades; from the AXA Research Fund; and from the European Research Council (grant no. 773051, FRAGMENT). Authors also thank the two anonymous reviewers for their constructive feedback, which helped improve the quality of the paper.
This research has been supported by the Agencia Estatal de Investigación (grant nos. PID2019-108086RA-I00 and PID2020-116324RA695), the Ministerio de Ciencia e Innovación (grant no. RTI2018-099894-BI00), the AXA Research Fund (Axa Chair Sand and Dust Storms), the European Research Council, the H2020 European Research Council (grant no. 773051), and the European Centre for Medium-Range Weather Forecasts (Copernicus Atmosphere Monitoring Service (grant no. CAMS2_61)).
This paper was edited by Frank Dentener and reviewed by two anonymous referees.
Badia, A., Langemeyer, J., Codina, X., Gilabert, J., Guilera, N., Vidal, V., Segura, R., Vives, M., and Villalba, G.: A take-home message from COVID-19 on urban air pollution reduction through mobility limitations and teleworking, Urban Sustain., 1, 35, https://doi.org/10.1038/s42949-021-00037-7, 2021.
Barré, J., Petetin, H., Colette, A., Guevara, M., Peuch, V.-H., Rouil, L., Engelen, R., Inness, A., Flemming, J., Pérez García-Pando, C., Bowdalo, D., Meleux, F., Geels, C., Christensen, J. H., Gauss, M., Benedictow, A., Tsyro, S., Friese, E., Struzewska, J., Kaminski, J. W., Douros, J., Timmermans, R., Robertson, L., Adani, M., Jorba, O., Joly, M., and Kouznetsov, R.: Estimating lockdown-induced European NO2 changes using satellite and surface observations and air quality models, Atmos. Chem. Phys., 21, 7373–7394, https://doi.org/10.5194/acp-21-7373-2021, 2021.
BEIS: Provisional UK greenhouse gas emissions national statistics, 2021, https://www.gov.uk/government/statistics/provisional-uk-greenhouse-gas-emissions-national-statistics-2021 (last access: January 2023), 2022. C3S (Copernicus Climate Change Service): ERA5: Fifth generation of ECMWF atmospheric reanalyses of the global climate, Copernicus Climate Change Service Climate Data Store (CDS), https://cds.climate.copernicus.eu/cdsapp#!/home (last access: May 2021), 2017.
C3S (Copernicus Climate Change Service): Climate bulletin. European State of the Climate 2020, Warm winter, https://climate.copernicus.eu/esotc/2020/warm-winter (last access: October 2022), 2020a.
Castellanos, P. and Boersma, K.: Reductions in nitrogen oxides over Europe driven by environmental policy and economic recession, Sci. Rep., 2, 265, https://doi.org/10.1038/srep00265, 2012.
CBS: Emissions of greenhouse gases according to IPCC guidelines, quarter, https://www.cbs.nl/nl-nl/cijfers/detail/84979ENG (last access: January 2023), 2022.
Cerdeiro, D. A., Komaromi, A., Liu, Y., and Saeed, M.: World Seaborne Trade in Real Time: A Proof of Concept for Building AIS-based Nowcasts from Scratch, IMF Working Paper, Working Paper No. 2020/057, https://www.imf.org/en/Publications/WP/Issues/2020/05/14/World-Seaborne-Trade-in-Real-Time-A-Proof-of-Concept-for-Building-AIS-based-Nowcasts-from-49393 (last access: May 2023), 2020.
CEIP: EMEP Centre on Emissions Inventories and Projections. Officially reported emission data, https://www.ceip.at/webdab-emission-database/reported-emissiondata (last access: October 2022), 2022.
Ciais, P., Bréon, F. M., Dellaert, S., Wang, Y., Tanaka, K., Gurriaran, L., Francoise, Y., Davis, S. J., Hong, C., Penuelas, J., Janssens, I., Obersteiner, M., Deng, Z., and Liu, Z: Impact of lockdowns and winter temperatures on natural gas consumption in Europe, Earth's Future, 10, e2021EF002250, https://doi.org/10.1029/2021EF002250, 2022.
CITEPA: Monthly emissions barometer, https://www.citepa.org/fr/barometre/ (last access: January 2023), 2022.
Copernicus Climate Change Service (C3S): Climate bulletin, Surface air temperarure for August 2020, https://climate.copernicus.eu/surface-air-temperature-august-2020 (last access: October 2022), 2020b.
Crippa, M., Oreggioni, G., Guizzardi, D., Muntean, M., Schaaf, E., Lo Vullo, E., Solazzo, E., Monforti-Ferrario, F., Olivier, J., and Vignati, E.: Fossil CO2 and GHG emissions of all world countries, EUR 29849 EN, Publications Office of the European Union, Luxembourg, ISBN 978-92-76-11025-5, https://doi.org/10.2760/655913, 2019.
Doumbia, T., Granier, C., Elguindi, N., Bouarar, I., Darras, S., Brasseur, G., Gaubert, B., Liu, Y., Shi, X., Stavrakou, J., Tilmes, S., Lacey, F., Deroubaix, A., and Wang, T.: The CONFORM covid-19 global emission factors, ECCAD [data set], https://doi.org/10.25326/88, 2020.
Doumbia, T., Granier, C., Elguindi, N., Bouarar, I., Darras, S., Brasseur, G., Gaubert, B., Liu, Y., Shi, X., Stavrakou, T., Tilmes, S., Lacey, F., Deroubaix, A., and Wang, T.: Changes in global air pollutant emissions during the COVID-19 pandemic: a dataset for atmospheric modeling, Earth Syst. Sci. Data, 13, 4191–4206, https://doi.org/10.5194/essd-13-4191-2021, 2021.
Europe Beyond Coal: Europe's coal exit, Overview of national coal phase out commitments, https://beyond-coal.eu/europes-coal-exit/ (last access: November 2022), 2022.
European Commission: Decision No 406/2009/EC on the effort of Member States to reduce their greenhouse gas emissions to meet the Community's greenhouse gas emission reduction commitments up to 2020, https://eur-lex.europa.eu/legal-content/EN/ALL/?uri=CELEX:32009D0406 (last access: October 2022), 2009.
European Commission: Regulation (EU) No 525/2013 on a mechanism for monitoring and reporting greenhouse gas emissions and for reporting other information at national and Union level relevant to climate change, https://eur-lex.europa.eu/legal-content/EN/TXT/?qid=1400596096197&uri=CELEX:32013R0525 (last access: October 2022), 2013.
European Commission: Directive (EU) 2016/2284 on the reduction of national emissions of certain atmospheric pollutants, https://eur-lex.europa.eu/legal-content/EN/TXT/?uri=uriserv:OJ.L_.2016.344.01.0001.01.ENG&toc=OJ:L:2016:344:TOC (last access: October 2022), 2016.
EEA: EMEP/EEA Air Pollutant Emission Inventory Guidebook, https://www.eea.europa.eu/publications/emep-eea-guidebook-2019 (last access: October 2022), 2019.
ENTSO-E: Transparency Platform, https://transparency.entsoe.eu/ (last access: May 2023), 2022.
EUROCONTROL: European Organisation for the Safety of Air Navigation, Operations at airports, https://ansperformance.eu/data/ (last access: March 2021), 2021.
Eurostat: Industrial Production Index overview, https://ec.europa.eu/eurostat/statistics-explained/index.php/Industrial_production_(volume)_index_overview (last access: May 2021), 2021.
Eurostat: Heating and Cooling degree days, statistics, https://ec.europa.eu/eurostat/statistics-explained/index.php?title=Heating_and_cooling_degree_days_-_statistics (last access: October 2022), 2022.
Forster, P. M., Forster, H. I., Evans, M. J., Gidden, M. J., Jones, C. D., Keller, C. A., Lamboll, R. D., Le Quéré, C., Rogelj, J., Rosen, D., Schleussner, C.-F., Richardson, T. B., Smith, C. J., and Turnock, S. T.: Current and future global climate impacts resulting from COVID-19, Nat. Clim. Change, 10, 913–919, https://doi.org/10.1038/s41558-020-0883-0, 2020a.
Forster, P., Lamboll, R., and Rogelj, J.: Emissions changes in 2020 due to Covid19 (4.0), Zenodo [data set], https://doi.org/10.5281/zenodo.3957826, 2020b.
Gaubert, B., Bouarar, I., Doumbia, T., Liu, Y., Stavrakou, T., Deroubaix, A., Darras, S., Elguindi, N., Granier, C., Lacey, F., Müller, J. F., Shi, X., Tilmes, S., Wang, T., and Brasseur, G. P.: Global changes in secondary atmospheric pollutants during the 2020 COVID-19 pandemic, J. Geophys. Res.-Atmos., 126, e2020JD034213. https://doi.org/10.1029/2020JD034213, 2021.
Google LLC: Google COVID-19 Community Mobility Reports, https://www.google.com/covid19/mobility/ (last access: October 2021), 2021.
Guevara, M., Jorba, O., Soret, A., Petetin, H., Bowdalo, D., Serradell, K., Tena, C., Denier van der Gon, H., Kuenen, J., Peuch, V.-H., and Pérez García-Pando, C.: Time-resolved emission reductions for atmospheric chemistry modelling in Europe during the COVID-19 lockdowns, Atmos. Chem. Phys., 21, 773–797, https://doi.org/10.5194/acp-21-773-2021, 2021.
Guevara, M., Petetin, H., Jorba, O., Denier van der Gon, H., Kuenen, J., Super, I., Jalkanen, J.-P., Majamäki, E., Johansson, L., Peuch, V.-H., and Pérez García-Pando, C.: European primary emissions of criteria pollutants and greenhouse gases in 2020 modulated by the COVID-19 pandemic disruptions, Earth Syst. Sci. Data, 14, 2521–2552, https://doi.org/10.5194/essd-14-2521-2022, 2022a.
Guevara, M., Petetin, H., Jorba, O., and Pérez García-Pando, C.: CAMS-REG_EAF-COVID19 emission adjustment factors, Copernicus Atmosphere Monitoring Service [data set], https://doi.org/10.24380/k966-3957, 2022b.
Harkins, C., McDonald, B. C., Henze, D. K., and Wiedinmyer, C.: A fuel-based method for updating mobile source emissions during the COVID-19 pandemic, Environ. Res. Lett., 16, 065018, https://doi.org/10.1088/1748-9326/ac0660, 2021.
IEA: Key energy statistics, https://www.iea.org/countries/ (last access: October 2022), 2022.
IPCC: 2019 Refinement to the 2006 IPCC Guidelines for National Greenhouse Gas Inventories, edited by: Calvo Buendia, E., Tanabe, K., Kranjc, A., Baasansuren, J., Fukuda, M., Ngarize, S., Osako, A., Pyrozhenko, Y., Shermanau, P., and Federici, S., IPCC, Switzerland, https://www.ipcc-nggip.iges.or.jp/public/2019rf/index.html (last access: October 2022), 2019.
Irakulis-Loitxate, I., Gorroño, J., Zavala-Araiza, D., and Guanter, L.: Satellites Detect a Methane Ultra-emission Event from an Offshore Platform in the Gulf of Mexico, Environ. Sci. Tech. Let., 9, 520–525, https://doi.org/10.1021/acs.estlett.2c00225, 2022.
Jalkanen, J.-P., Johansson, L., and Kukkonen, J.: A comprehensive inventory of ship traffic exhaust emissions in the European sea areas in 2011, Atmos. Chem. Phys., 16, 71–84, https://doi.org/10.5194/acp-16-71-2016, 2016.
Kaiser, J. W., Heil, A., Andreae, M. O., Benedetti, A., Chubarova, N., Jones, L., Morcrette, J.-J., Razinger, M., Schultz, M. G., Suttie, M., and van der Werf, G. R.: Biomass burning emissions estimated with a global fire assimilation system based on observed fire radiative power, Biogeosciences, 9, 527–554, https://doi.org/10.5194/bg-9-527-2012, 2012.
Ke, P., Deng, Z., Zhu, B., Zheng, B., Wang, Y., Boucher, O., Arous, S. B., Zhou, C., Dou, X., Sun, T., Li, Z., Yan, F., and Cui, D., Hu, Y., Huo, D., Pierre, J., Engelen, R., Davis, S. J., Ciais, P., and Liu, Z.: Carbon Monitor Europe, near-real-time daily CO2 emissions for 27 EU countries and the United Kingdom, arXiv [preprint] https://doi.org/10.48550/ARXIV.2211.01944, 2022a.
Ke, P., Deng, Z., Zhu, B., Zheng, B., Wang, Y., Boucher, O., Dou, X., Sun, T., Li, Z., Yan, F., Cui, D., Hu, Y., Davis, S. J., Ciais, P., and Liu, Z.: Carbon Monitor Europe, a near-real-time and country-level monitoring of daily CO2 emissions for European Union and the United Kingdom, figshare [data set], https://doi.org/10.6084/m9.figshare.20219024.v2, 2022b.
Kuenen, J., Dellaert, S., Visschedijk, A., Jalkanen, J.-P., Super, I., and Denier van der Gon, H.: CAMS-REG-v4: a state-of-the-art high-resolution European emission inventory for air quality modelling, Earth Syst. Sci. Data, 14, 491–515, https://doi.org/10.5194/essd-14-491-2022, 2022a.
Kuenen, J., Dellaert, S., Visschedijk, A., Jalkanen, J.-P., Super, I., and Denier van der Gon, H.: Copernicus Atmosphere Monitoring Service regional emissions version 5.1 business-as-usual 2020 (CAMS-REG-v5.1 BAU 2020), Copernicus Atmosphere Monitoring Service, ECCAD [data set], https://doi.org/10.24380/eptm-kn40, 2022b.
Lamboll, R. D., Jones, C. D., Skeie, R. B., Fiedler, S., Samset, B. H., Gillett, N. P., Rogelj, J., and Forster, P. M.: Modifying emissions scenario projections to account for the effects of COVID-19: protocol for CovidMIP, Geosci. Model Dev., 14, 3683–3695, https://doi.org/10.5194/gmd-14-3683-2021, 2021.
Le Quéré, C., Jackson, R. B., Jones, M. W., Smith, A. J. P., Abernethy, S., Andrew, R. M., De-Gol, A. J., Willis, D. R., Shan, Y., Canadell, J. G., Friedlingstein, P., Creutzig, F., and Peters, G. P.: Temporary reduction in daily global CO2 emissions during the COVID-19 forced confinement, Nat. Clim. Change, 10, 647–653, https://doi.org/10.1038/s41558-020-0797-x, 2020.
Liu, Z., Ciais, P., Deng, Z., Davis, S. J., Zheng, B., Wang, Y., Cui, D., Zhu, B., Dou, X., Ke, P., Sun, T., Guo, R., Zhong, H., Boucher, O., Bréon, F.-M., Lu, C., Guo, R., Xue, J., Boucher, E., Tanaka, K., and Chevallier, F.: Carbon Monitor, a near-real-time daily dataset of global CO2 emission from fossil fuel and cement production, Sci. Data, 7, 392, https://doi.org/10.1038/s41597-020-00708-7, 2020a.
Liu, Z., Ciais, P., Deng, Z., Lei, R., Davis, S. J., Feng, S., Zheng, B., Cui, D., Dou, X., Zhu, B., Guo, R., Ke, P., Sun, T., Lu, C., He, P., Wang, Y., Yue, X., Wang, Y., Lei, Y., Zhou, H., Cai, Z., Wu, Y., Guo, R., Han, T., Xue, J., Boucher, O., Boucher, E., Chevallier, F., Tanaka, K., Wei, Y., Zhong, H., Kang, C., Zhang, N., Chen, B., Xi, F., Liu, M., Bréon, F.-M., Lu, Y., Zhang, Q., Guan, D., Gong, P., Kammen, D. M., He, K., and Schellnhuber, H. J.: Near-real-time monitoring of global CO2 emissions reveals the effects of the COVID-19 pandemic, Nat. Commun., 11, 5172, https://doi.org/10.1038/s41467-020-18922-7, 2020b.
McNorton, J., Bousserez, N., Agustí-Panareda, A., Balsamo, G., Cantarello, L., Engelen, R., Huijnen, V., Inness, A., Kipling, Z., Parrington, M., and Ribas, R.: Quantification of methane emissions from hotspots and during COVID-19 using a global atmospheric inversion, Atmos. Chem. Phys., 22, 5961–5981, https://doi.org/10.5194/acp-22-5961-2022, 2022.
Peters, G., Marland, G., Le Quéré, C., Boden, T., Canadell, J. G., and Raupach, M. R.: Rapid growth in CO2 emissions after the 2008–2009 global financial crisis, Nat. Clim. Change, 2, 2–4, https://doi.org/10.1038/nclimate1332, 2012.
Schneider, R., Masselot, P., Vicedo-Cabrera, A. M., Sera, F., Blangiardo, M., Forlani, C., Douros, J., Jorba, O., Adani, M., Kouznetsov, R., Couvidat, F., Arteta, J., Raux, B., Guevara, M., Colette, A., Barré, J., Peuch, V.-H., and Gasparrini, A.: Differential impact of government lockdown policies on reducing air pollution levels and related mortality in Europe, Sci. Rep., 12, 726, https://doi.org/10.1038/s41598-021-04277-6, 2022.
Stevenson, D. S., Derwent, R. G., Wild, O., and Collins, W. J.: COVID-19 lockdown emission reductions have the potential to explain over half of the coincident increase in global atmospheric methane, Atmos. Chem. Phys., 22, 14243–14252, https://doi.org/10.5194/acp-22-14243-2022, 2022.
Tong, D. Q., Lee, P., and Saylor, R. D.: New Direction: the need to develop process based emission forecasting models, Atmos. Environ., 47, 560–561, https://doi.org/10.1016/j.atmosenv.2011.10.070, 2012.
UNECE: 1999 Protocol to Abate Acidification, Eutrophication and Ground-level Ozone to the Convention on Long-range Transboundary Air Pollution, as amended on 4 May 2012, https://www.unece.org/fileadmin/DAM/env/documents/2013/air/eb/ECE.EB.AIR.114_ENG.pdf (last access: October 2022), 2012.
UNFCCC: United Nations Framework Convention on Climate Change, https://unfccc.int/resource/docs/convkp/conveng.pdf (last access: October 2022), 1992.
UNFCCC: National Inventory Submissions 2022, https://unfccc.int/ghg-inventories-annex-i-parties/2022 (last access: October 2022), 2022.
Zheng, B., Zhang, Q., Geng, G., Chen, C., Shi, Q., Cui, M., Lei, Y., and He, K.: Changes in China's anthropogenic emissions and air quality during the COVID-19 pandemic in 2020, Earth Syst. Sci. Data, 13, 2895–2907, https://doi.org/10.5194/essd-13-2895-2021, 2021.