the Creative Commons Attribution 4.0 License.
the Creative Commons Attribution 4.0 License.
 | 14 Jul 2023
Airborne observations of peroxy radicals during the EMeRGe campaign in Europe
Maria Dolores Andrés Hernández
Vladyslav Nenakhov
Yangzhuoran Liu
John Philip Burrows
Birger Bohn
Eric Förster
Florian Obersteiner
Andreas Zahn
Theresa Harlaß
Helmut Ziereis
Hans Schlager
Benjamin Schreiner
Flora Kluge
Katja Bigge
Klaus Pfeilsticker
In this study, airborne measurements of the sum of hydroperoxyl (HO2) and organic peroxy (RO2) radicals that react with nitrogen monoxide (NO) to produce nitrogen dioxide (NO2), coupled with actinometry and other key trace gases measurements, have been used to test the current understanding of the fast photochemistry in the outflow of major population centres. The measurements were made during the airborne campaign of the EMeRGe (Effect of Megacities on the transport and transformation of pollutants on the Regional to Global scales) project in Europe on board the High Altitude and Long Range Research Aircraft (HALO). The measurements of RO on HALO were made using the in situ instrument Peroxy Radical Chemical Enhancement and Absorption Spectrometer (PeRCEAS). RO is to a good approximation the sum of peroxy radicals reacting with NO to produce NO2. RO mixing ratios up to 120 pptv were observed in air masses of different origins and composition under different local actinometric conditions during seven HALO research flights in July 2017 over Europe.
Radical production rates were estimated using knowledge of the photolysis frequencies and the precursor concentrations measured on board, as well as the relevant rate coefficients. Generally, high concentrations were measured in air masses with high production rates. In the air masses investigated, is primarily produced by the reaction of O1D with water vapour and the photolysis of nitrous acid (HONO) and of the oxygenated volatile organic compounds (OVOCs, e.g. formaldehyde (HCHO) and glyoxal (CHOCHO)). Due to their short lifetime in most environments, the RO concentrations are expected to be in a photostationary steady state (PSS), i.e. a balance between production and loss rates is assumed. The production and loss rates and the suitability of PSS assumptions to estimate the mixing ratios and variability during the airborne observations are discussed. The PSS assumption for is considered robust enough to calculate mixing ratios for most conditions encountered in the air masses measured. The similarities and discrepancies between measured and PSS calculated mixing ratios are discussed. The dominant terminating processes for in the pollution plumes measured up to 2000 m are the formation of nitrous acid, nitric acid, and organic nitrates. Above 2000 m, HO2–HO2 and HO2–RO2 reactions dominate the removal. calculations by the PSS analytical expression inside the pollution plumes probed often underestimated the measurements. The underestimation is attributed to the limitations of the PSS equation used for the analysis. In particular, this expression does not account for the yields of from the oxidation and photolysis of volatile organic compounds, VOCs, and OVOCs other than those measured during the EMeRGe research flights in Europe. In air masses with NO mixing ratios ≤50 pptv and low ratios, the measured is overestimated by the analytical expression. This may be caused by the formation of H2O and O2 from OH and HO2, being about 4 times faster than the rate of the OH oxidation reaction of the dominant OVOCs considered.
- Article
(8218 KB) - Full-text XML
-
Supplement
(1246 KB) - BibTeX
- EndNote


Hydroperoxyl (HO2) and organic peroxy (RO2, where R stands for any organic group) radicals are reactive species that play a key role in the chemistry of the troposphere. In combination with the hydroxyl (OH) radical, HO2 and RO2 take part in rapid chemical processes that control the lifetime of many key trace constituents in the troposphere. Examples of key tropospheric processes involving HO2 and RO2 are as follows:
-
the catalytic cycles which produce and destroy ozone (O3);
-
the generation of inorganic acids, which are precursors of aerosol and important chemical constituents in both summer and winter smog (e.g. sulfuric acid, H2SO4, and nitric acid, HNO3);
-
the generation of organic acids and the production of hygroscopic hydrogen peroxide (H2O2) and organic peroxides (ROOH), which enter aerosol and cloud droplets;
-
the generation of organic peroxy nitrates (RO2NO2), peroxyacetyl nitrate (CH3COO2NO2, PAN), and other summer smog constituents.
The abundance of HO2 and RO2 in the free troposphere has a non-linear and complex dependency on photochemistry, initiated by solar actinic radiation, and on the concentration of the precursors, such as carbon monoxide (CO), volatile organic compounds (VOCs), and peroxides. It also strongly depends on the amounts of nitrogen monoxide (NO) and nitrogen dioxide (NO2) due to the gas-phase reactions of NO and NO2 with the OH and organic oxy (RO) radicals formed during the radical interconversion. The main production and loss processes of HO2 and RO2 in the troposphere are summarised as follows:
In addition, HO2 and RO2 participate in radical interconversion reactions such as
Reactions (R23) and (R25a) are two of the most important reactions in the troposphere as they lead to O3 formation via Reactions (R27) and (R28). The rate of Reaction (R22) in the atmosphere compared to that of Reaction (R26) is negligible.
The sum of HO2 and RO2 that react with NO to produce NO2 can be estimated by assuming that the interconversion of NO to NO2 reaches a photostationary steady state (PSS), in which production and loss of NO2 are to a good approximation equal.
The PSS assumption for [NO2] in the following mechanism (Reactions R23 to R29) leads to Eq. (1):
where is the photolysis frequency of NO2; ( cm3 molecules−1 s−1 at 298 K and 1 atm) is the rate coefficient of the reaction of NO with O3; and is usually estimated for the most abundant peroxy radicals HO2 and CH3O2 by assuming a 1:1 HO2 to CH3O2 ratio and averaging the ( cm3 molecules−1 s−1 at 298 K and 1 atm) and ( cm3 molecules−1 s−1 at 298 K and 1 atm) rate coefficients for the reaction with NO. As noted by Parrish et al. (1986), the PSS assumption for NO2 requires conditions with sufficient and stable solar irradiation, ensuring stable .
The radical calculation made on the assumption of the NO2 steady state is very sensitive to the accuracy of the NO2 to NO ratio and the O3 measurements. The comparison of calculated using Eq. (1) with ground-based (e.g. Ridley et al., 1992; Cantrell et al., 1997; Carpenter et al., 1998; Volz-Thomas et al., 2003) as well as airborne measurements has shown in the past different degrees of agreement. The underestimations and overestimations found in air masses with different chemical compositions are not well understood. For the case of airborne measurements, the NO2 steady-state calculation generally overestimates the measured peroxy radicals (Cantrell et al., 2003a, b). The differences observed could not be attributed to systematic changes in NO, altitude, water vapour, or temperature, although these variables are often correlated. The NO to NO2 ratio calculated from NO measured using an in situ technique and NO2 measured using remote sensing (more detail about the measurement techniques is given in Table 1) used in this study is considered not to have sufficient accuracy to calculate [HO2+RO2] from the NO2 steady-state approach.
Ground-based (Mihelcic et al., 2003; Kanaya et al., 2007, 2012; Elshorbany et al., 2012; Lu et al., 2012, 2013; Tan et al., 2017, 2018; Whalley et al., 2018, 2021; Lew et al., 2020) and airborne (Crawford et al., 1999; Tan et al., 2001; Cantrell et al., 2003b) measurements have also been compared with model simulations of HO2 and RO2. The discrepancies encountered depend upon the chemical composition of the air mass and the chemical mechanisms and constraints used in the model simulations. Recently, Tan et al. (2019) and Whalley et al. (2021) reported experimental radical budget calculations using the PSS assumption for OH, HO2, and RO2 together with the published reaction rate coefficients of Reactions (R1) to (R26), which control OH, HO2, and RO2 in the lower troposphere, and the ground-based measurements of all relevant reactants and photolysis frequencies. In this study, a similar approach has been used (i.e. the sum of HO2 and RO2 is assumed to be in PSS) to calculate the amount of peroxy radicals in the air masses measured on board of the High Altitude and Long Range Research Aircraft (HALO) over Europe during the first campaign of the EMeRGe (Effect of Megacities on the transport and transformation of pollutants on the Regional to Global scales) project. The available onboard measurements of are defined as the total sum of OH, RO, and peroxy radicals (i.e. RO OH RO + HORO2, where RO2 are the organic peroxy radicals producing NO2 in their reaction with NO). As the amount of OH and RO is much smaller, to a good approximation is the sum of HO2 and those RO2 radicals that react with NO to produce NO2. For the calculation, is assumed to be in PSS, and an analytical expression is developed with a manageable degree of complexity to estimate the concentration and mixing ratios of . The simultaneous onboard measurements of trace gases and photolysis frequencies are used to constrain the estimate of the concentration.
In contrast to other experimental deployments, the concentrations and/or mixing ratios of the majority of the key species involved in Reactions (R1) to (R26) were continuously measured on board HALO during the EMeRGe campaign. This enables the use of a large number of measurements to constrain the PSS calculation of . Consequently, this data set provides an excellent opportunity to gain deeper insight into the source and sink reactions of and the applicability of the PSS assumption for the different pollution regimes and related weather conditions in the free troposphere.
The overarching objective of the EMeRGe project is to test and improve the current understanding of the photochemical and heterogeneous processing of pollution outflows from major population centres (MPCs) and their impact on the atmosphere. Two intensive observational periods (IOPs) were carried out to investigate selected European and Asian MPC outflows. The European IOP took place from 10 to 28 July 2017 (http://www.iup.uni-bremen.de/emerge/home/home.html, last access: 19 June 2023). An extensive set of in situ and remote sensing airborne measurements of trace gases and aerosol particles were made on board the HALO aircraft (see http://www.halo-spp.de, last access: 19 June 2023) along flight tracks in the lower layers of the troposphere from northwest Europe to the Mediterranean region.
During EMeRGe in Europe, HALO made a total of 53 flight hours distributed over seven flights to investigate the chemical composition of the outflows from the target MPCs: London, Paris, Benelux, Ruhr metropolitan area, Po Valley, and urban agglomerations such as Rome, Madrid, and Barcelona. The flight tracks are shown in Fig. 1. All measurement flights started from the aircraft hangar at the DLR in Oberpfaffenhofen, southwest of Munich, Germany. To achieve the scientific goals, 60 % of the flights flew at altitudes below 3000 m. Vertical profiles of trace constituents were typically made by keeping the flight altitude constant at different flight levels upwind and downwind of the target MPCs. The flights are named E-EU-FN, where E stands for EMeRGe, EU for Europe, and FN is the two-digit flight number. More details about the EMeRGe IOP in Europe and the set of instruments deployed on board the HALO aircraft are described elsewhere (Andrés Hernández et al., 2022).
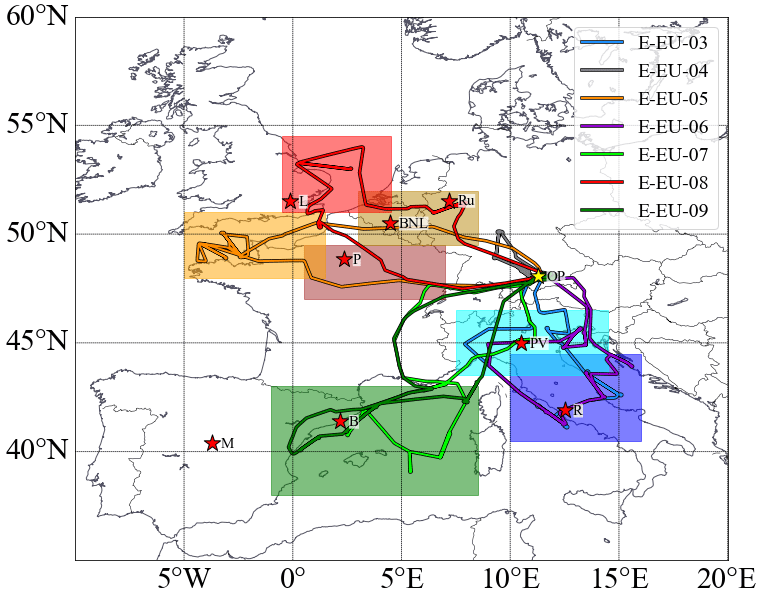
Figure 1The research flight tracks made by HALO during the EMeRGe Europe campaign on 11, 13, 17, 20, 24, 26 and 28 July 2017 (E-EU-03 to E-EU-09, respectively, colour coded). MPC target areas are colour coded by shading, and the targeted locations/regions are marked with red stars, M: Madrid, B: Barcelona, P: Paris, L: London; BNL: Benelux; Ru: Ruhr area; PV: Po Valley, R: Rome. The location of the aircraft hangar at the DLR in Oberpfaffenhofen (OP), Germany, is indicated by a yellow star.
The measurements on board HALO during EMeRGe were made using the Peroxy Radical Chemical Enhancement and Absorption Spectrometer (PeRCEAS). PeRCEAS combines the peroxy radical chemical amplification (PeRCA) and cavity ring-down spectroscopy (CRDS) techniques in a dual-channel instrument. Each channel has a separate chemical reactor and detector, which operate alternatively in both background and amplification modes to account for the rapid background variations during airborne measurements. In both modes, NO is continuously added to the air sampled at the reactor, while CO is only added in the amplification mode to initiate the chain conversion of into NO2. In the amplification mode, the sum of the NO2 produced from ambient through the chain reaction, the ambient NO2, the NO2 produced from the ambient O3–NO reagent gas reaction, and the NO2 produced in the inlet from any other sources (e.g. thermal decomposition of PAN) is measured. In the background mode, the sum of the ambient NO2, the NO2 produced from the ambient O3–NO reagent gas reaction, and NO2 produced in the inlet from any other sources is measured. The is retrieved by dividing the difference in NO2 concentration (ΔNO2) between amplification and background mode by the conversion efficiency of to NO2, which is referred to as eCL (effective chain length). The PeRCEAS instrument and its specifications have been described in detail elsewhere (Horstjann et al., 2014; George et al., 2020; George, 2022).
The two chemical reactors for sampling the ambient air are part of the DUal channel Airborne peroxy radical Chemical Amplifier (DUALER) inlet installed inside a pylon located on the outside of the HALO fuselage. During the EMeRGe campaign in Europe, a reagent gas mixing ratio of 30 ppmv NO ([NO] = 1.46×10¹⁴ molecules cm−3 at 296 K, 200 mbar) and of 9 % CO ([CO] = 4.4×10¹⁷ molecules cm−3 at 296 K, 200 mbar) was added to the sample flow for the chemical conversion of to NO2. The DUALER inlet was operated at an internal pressure of 200 mbar to achieve stable chemical conversion. The HO2 and RO2 detection sensitivity depends on the rates of loss of HO2 and RO2 by Reactions (R19) and (R22). The latter depends on the concentration of the reagent gas NO added and the reaction rate coefficients, where k22 is larger than k19. The average eCL for a 1:1 HO2 to CH3O2 mixture under the DUALER conditions during the campaign in Europe was determined to be 50±8 from laboratory calibrations, where the error is the ±1σ standard deviation estimated from the reproducibility of the experimental determinations. Likewise, the ratio was determined to be 65 % for the measurement conditions (George et al., 2020). The values obtained from calibrations before and after the campaign agreed within their experimental errors.
Although the DUALER pressure is kept constant below the ambient pressure, variations in dynamical pressure >10 mbar during the flight change the residence time and induce turbulence inside the inlet (Kartal et al., 2010; George et al., 2020). These may lead to different physical losses of radicals before amplification and affect the eCL. In the measurements presented in this study, variations in dynamical pressure of this magnitude were only encountered during flight level changes of the aircraft. When used during the analysis, these data sets are either excluded or flagged (P_flag). The effect of the ambient air humidity on eCL (Mihele and Hastie, 1998; Mihele et al., 1999; Reichert et al., 2003) has been accounted for by a calibration procedure reported in George et al. (2020). The [H2O] in the DUALER inlet was lower than 1×10¹⁷ molecules cm−3 for 60 % of measurements during EMeRGe in Europe, for which the eCLwet=76 % of eCLdry. At the highest humidity observed during the campaign, i.e. [H2O] molecules cm−3, the eCLwet is 55 % of eCLdry (see Fig. S1 in the Supplement).
In addition to the measurement of from PeRCEAS, other in situ and remote sensing measurements and basic aircraft data from HALO are used in this study. Details of the corresponding instruments are summarised in Table 1. The remote sensing instruments used on HALO during EMeRGe were the mini-differential optical absorption spectrometer (miniDOAS) and the Heidelberg airborne imaging DOAS instrument (HAIDI). The miniDOAS observes the atmosphere using six telescopes: two being optimised for the ultraviolet, two for the visible, and two for the near-infrared (nIR). Three telescopes observe in nadir-viewing mode and three in limb-viewing mode. The three limb scanning telescopes point to the starboard side perpendicular to the aircraft fuselage axis. They are rotated to compensate for roll relative to the horizon. A variant of the DOAS retrieval technique uses least square fitting of the measured and radiative transfer modelled absorption along the line of sight to retrieve the differential slant column density (dSCD) of the target gas and a scaling reference gas. The latter is the dimer of molecular oxygen (O4). As the vertical profile of the concentrations of O2 and thus O4 are known, the mixing ratios of the target gas at the flight altitude are obtained from the target gas and O4 dSCDs (for more details, see Stutz et al., 2017; Hüneke et al., 2017; Kluge et al., 2020; and Rotermund et al., 2021). The HAIDI nadir observations are used to retrieve dSCDs below the aircraft. The dSCDs from HAIDI are then converted to mixing ratios using knowledge of the aircraft altitude and the corresponding geometric air mass factor (AMF), calculated by a radiative transfer model under a well-mixed NO2 layer assumption. As a result of this assumption, the calculated mixing ratios for HAIDI target gases are lower limits and similar to the actual values while flying within and close to a well-mixed boundary layer. In spite of the differences in sampling volume and temporal and spatial resolution between the in situ and remote sensing measurement techniques, the concentrations of the gas HCHO measured by both techniques were in good agreement, and the concentrations of the NO2 (remote sensing) and NOy (in situ) were consistent (for more details, see Schumann, 2020).
Table 1List of the airborne measurements and instrumentation used in this study. PeRCA: peroxy radical chemical amplification; CRDS: cavity ring-down spectroscopy; PTR-MS: proton-transfer-reaction mass spectrometer; AT-BS: adsorption tube and bag air sampler; TD-GC-MS: thermal desorption gas chromatography and mass spectrometry; DOAS: differential optical absorption spectrometry; Univ.: University; KIT: Karlsruher Institut für Technologie; DLR: Deutsches Zentrum für Luft- und Raumfahrt; IPA: Institut für Physik der Atmosphäre; FZ: Forschungszentrum; FX: Flugexperimente; HKMS: HALO Karlsruher Mass Spectrometer; VUV: visible–UV; SR: spectroradiometer; BAHAMAS: Basic Halo Measurement and Sensor System; FAIRO: Fast Accurate aIRborne Ozone instrument; CATS: cavity ring-down spectrometer and Tedlar bag sampler.

4.1 Airborne measurements during EMeRGe in Europe
mixing ratios up to 120 pptv were measured during the campaign, as shown in Fig. 2. Typically, the highest mixing ratios were observed below 3000 m over southern Europe.
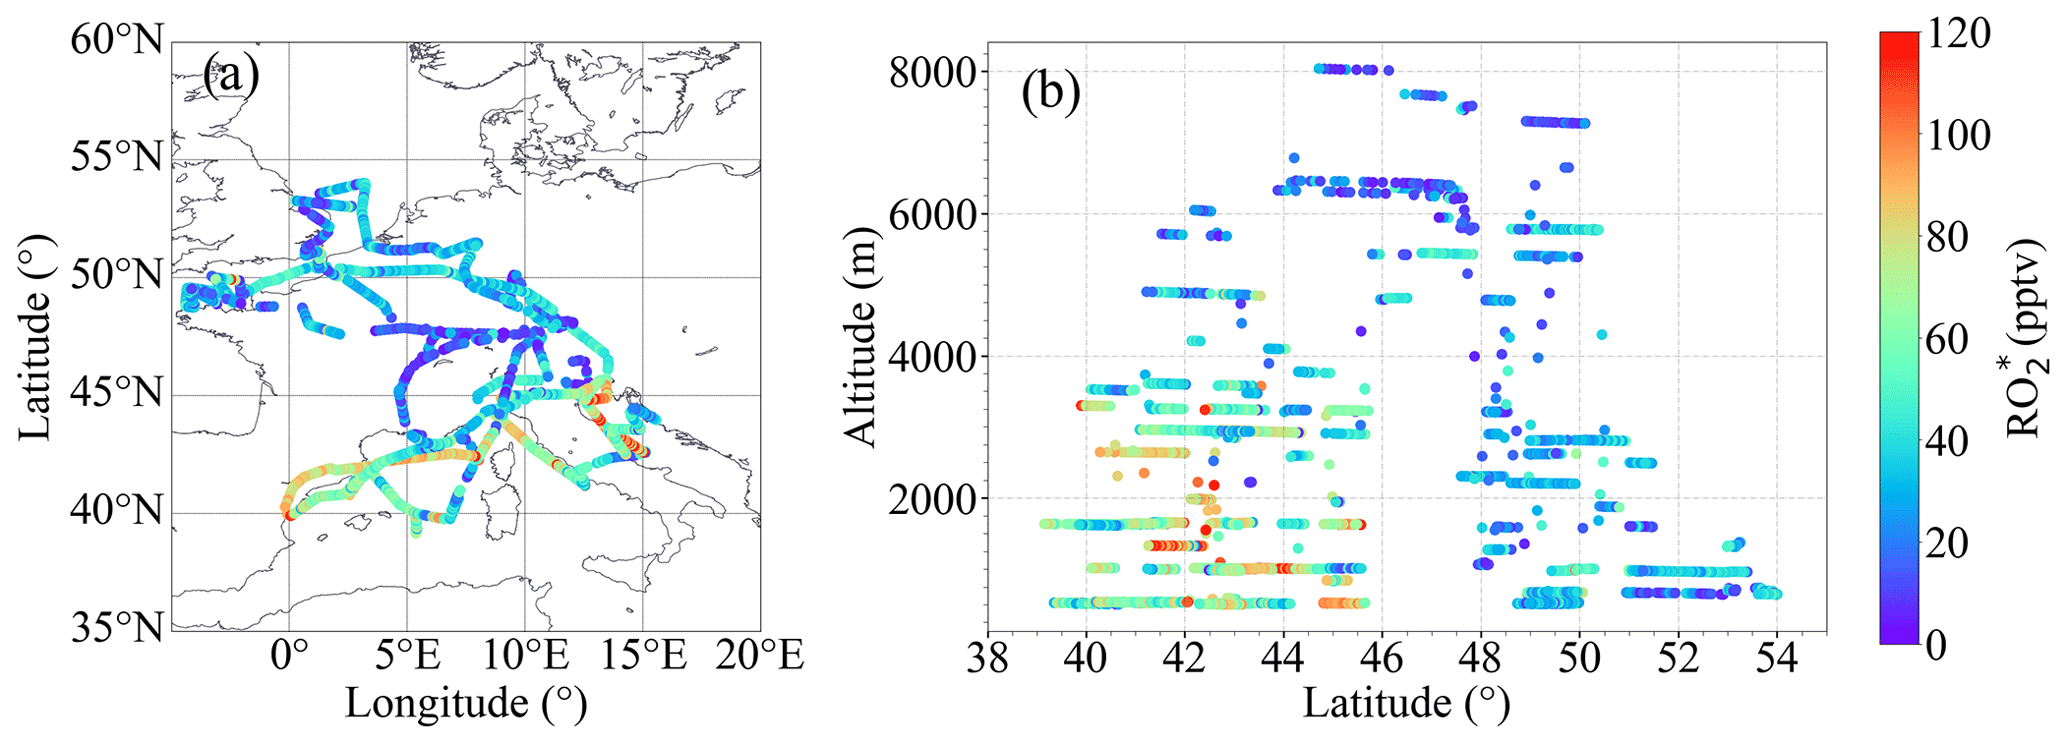
Figure 2 measured during EMeRGe-Europe: (a) as a function of longitude and latitude and (b) as a function of latitude and altitude.
The origin and thus the composition of the air sampled during the seven flights over Europe were different and heterogeneous. Typically, the air masses measured were influenced by emissions from MPCs and their surroundings and sometimes by biomass burning transported over short or long distances. The concentration and mixing ratio of rather depends on the insolation and the chemical composition of the air probed, particularly on the abundance of precursors, than on the origin of the air masses. Since species are controlled by fast chemical and photochemical processes, the air mass origin and trajectory are not used in the calculation of RO concentrations and mixing ratios but are of interest as the source of precursors. Thus, the variability and its production rates provide valuable insight into the photochemical activity of the air masses probed.
Changes in as a function of latitude and altitude, as shown in Fig. 2, confirm the heterogeneity of the photochemical activity in the air masses probed. Figure 3 shows the vertical profiles averaged for the EMeRGe flights over Europe in 500 m altitude bins. The error bars are standard errors (i.e. ±1σ standard deviation of each bin). The vertical profiles may be biased as the higher altitudes have fewer measurements than those below 3000 m, as mentioned in Sect. 2. The vertical profiles are a composite from averaging flights with legs carried out at different longitudes and latitudes and are only shown to summarise the variability in the composition of the air masses measured during the campaign.
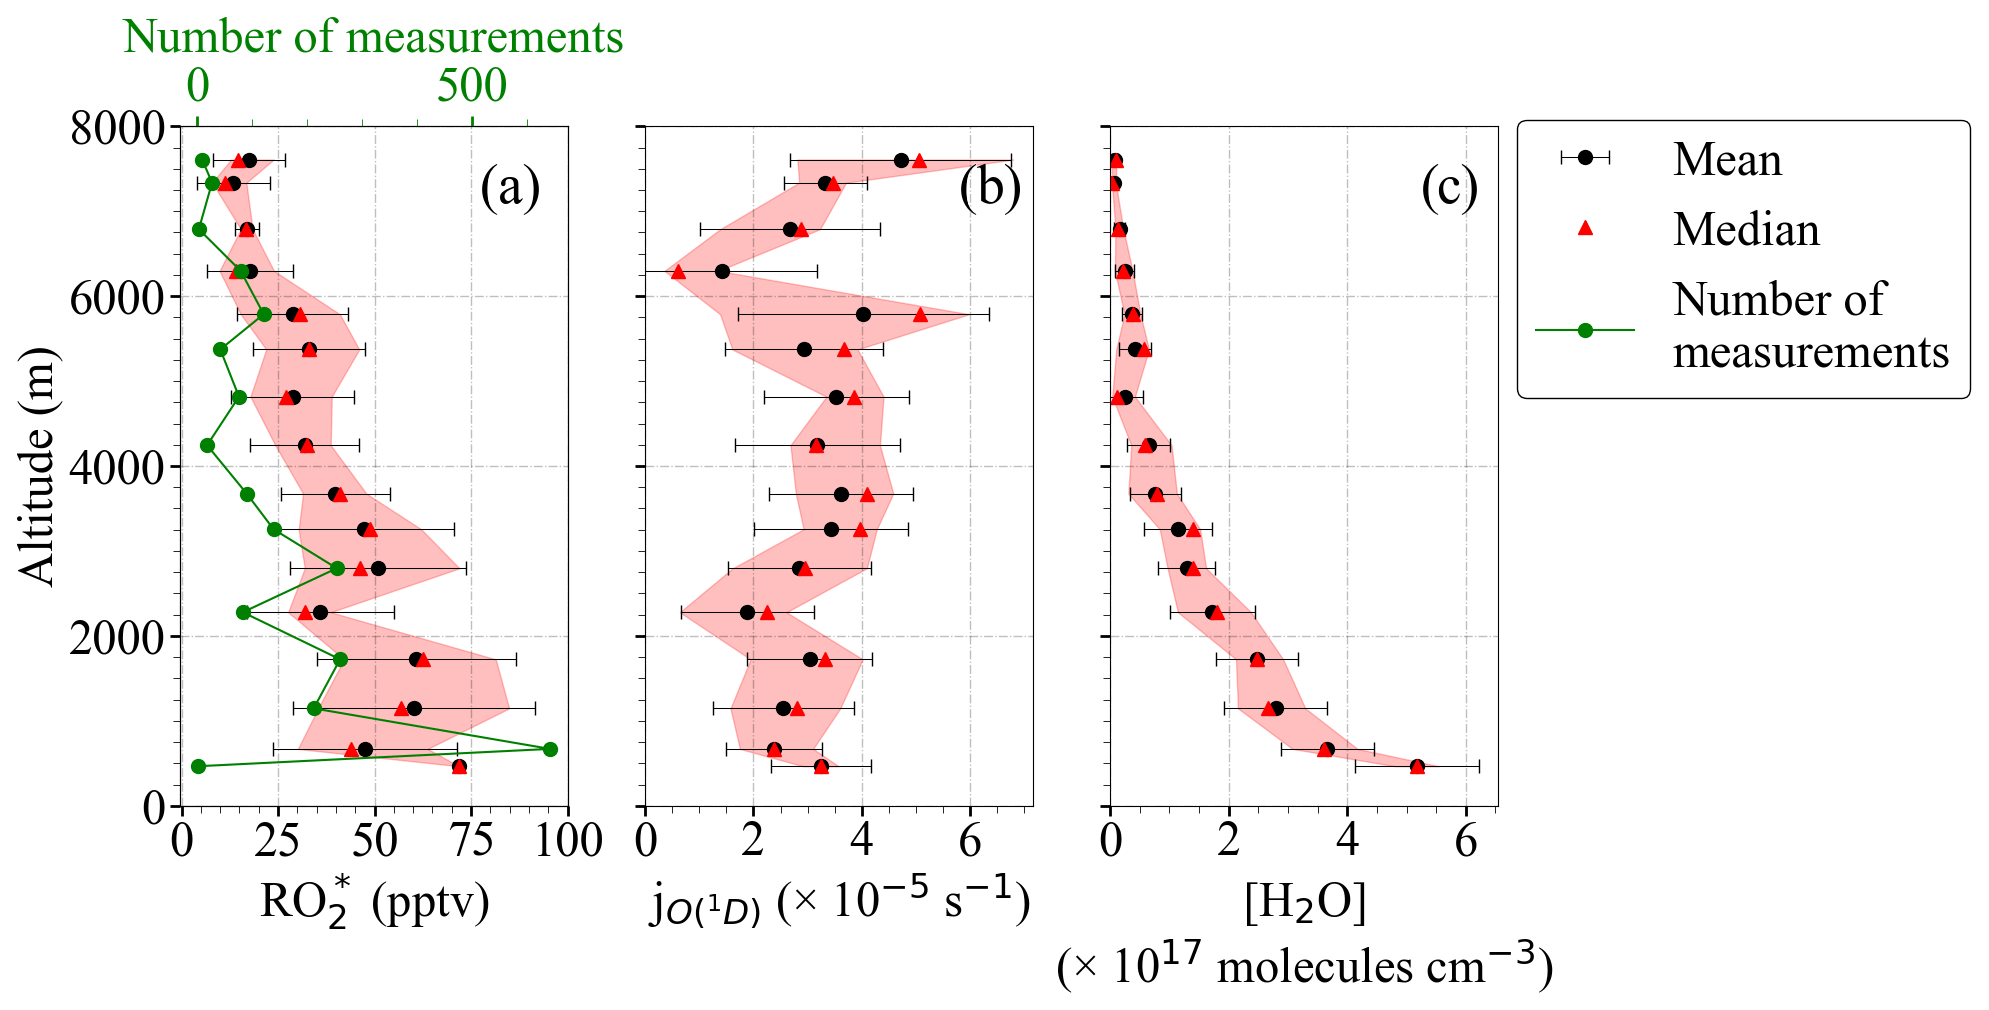
Figure 3Composite average vertical profiles of (a) , (b) , and (c) [H2O] observations. The measurements are binned over 500 m altitude. The error bars are the ±1σ standard deviation of each bin. Median values (red triangles), the interquartile 25 %–75 % range (shaded red area), and the number of individual measurements for each bin (in green) are additionally plotted.
Most of the EMeRGe measurements below 2000 m were carried out in the outflow of MPCs, which are expected to contain significant amounts of precursors. HALO flew at the lowest altitudes during flight legs over the English Channel, the Mediterranean, and the North Sea. The H2O concentration in the air masses decreased steadily with altitude as expected. The higher relative variability in H2O observed at 3000 m and the increase at 5000 m are associated with measurements under stormy conditions, often over the Alps.
4.2 production rates
The rate of production of from Reactions (R1) to (R13) is given by
where OVOC stands for oxygenated volatile organic compounds, and γ is the effective yield from ozonolysis of alkenes.
In this study, Eq. (2) has been applied to the measurements taken within the EMeRGe campaign in Europe. There were no H2O2 measurements available for EMeRGe. However, the results reported by Tan et al. (2001) indicate that the rate of OH production from the H2O2 photolysis is not significant except when NOx is low. To be more precise, for conditions having NO <50 ppt, the partitioning of HOx is strongly shifted to HO2. HO2 then predominantly reacts with itself or RO2 to form peroxides, which can in turn photolyse. For conditions with NO >50 pptv, the rates of reactions of HOx with NOx are faster than those of HO2 with HO2 and RO2. As the NO mixing ratio was higher than 50 pptv in 75 % of the air masses probed in Europe, the photolysis of H2O2 was as a first approximation assumed not to be a significant source of OH for the EMeRGe data set considered in this study.
Formaldehyde (HCHO), acetaldehyde (CH3CHO), acetone (CH3C(O)CH3), and glyoxal (CHOCHO) were the OVOCs measured in EMeRGe directly forming radicals through photolysis. They are produced in the photolysis and oxidation of VOCs and are likely the most abundant and reactive OVOCs present. In this study they were assumed to be the dominant VOCs in the air masses probed.
There were no measurements of alkenes provided in EMeRGe. Consequently, the ozonolysis term in Eq. (2) was not included in the analysis.
The above assumptions lead to Eq. (3), which calculates the production rate () for the EMeRGe measurements as follows:
The production rate of molecules can be expressed in units of mixing ratio of by dividing with the air concentration at each altitude, calculated from the pressure and temperature measurements (for the vertical profile and the latitudinal distribution of , see Figs. S2 and S3 in the Supplement). Figure 4 shows the composite averaged vertical profile of all measured mixing ratios colour-coded with the calculated . For the sake of representativeness and comparability, the number of measurements in each altitude bin is shown in Fig. 4b. The higher mixing ratios observed below 4000 m are typically associated with pptv s−1. Above 4000 m, both and start to decrease with altitude, as expected. This is related to the decrease in H2O and other radical precursor concentrations with altitude, as detailed in Figs. 5 and 6. In previous airborne campaigns at various parts of the world, vertical distributions showed a local maximum between 1500 and 4000 m, as reported by Tan et al. (2001), Cantrell et al. (2003a, b), and Andrés-Hernández et al. (2009). In the present work, this local maximum is more evident for measurements with pptv s−1.
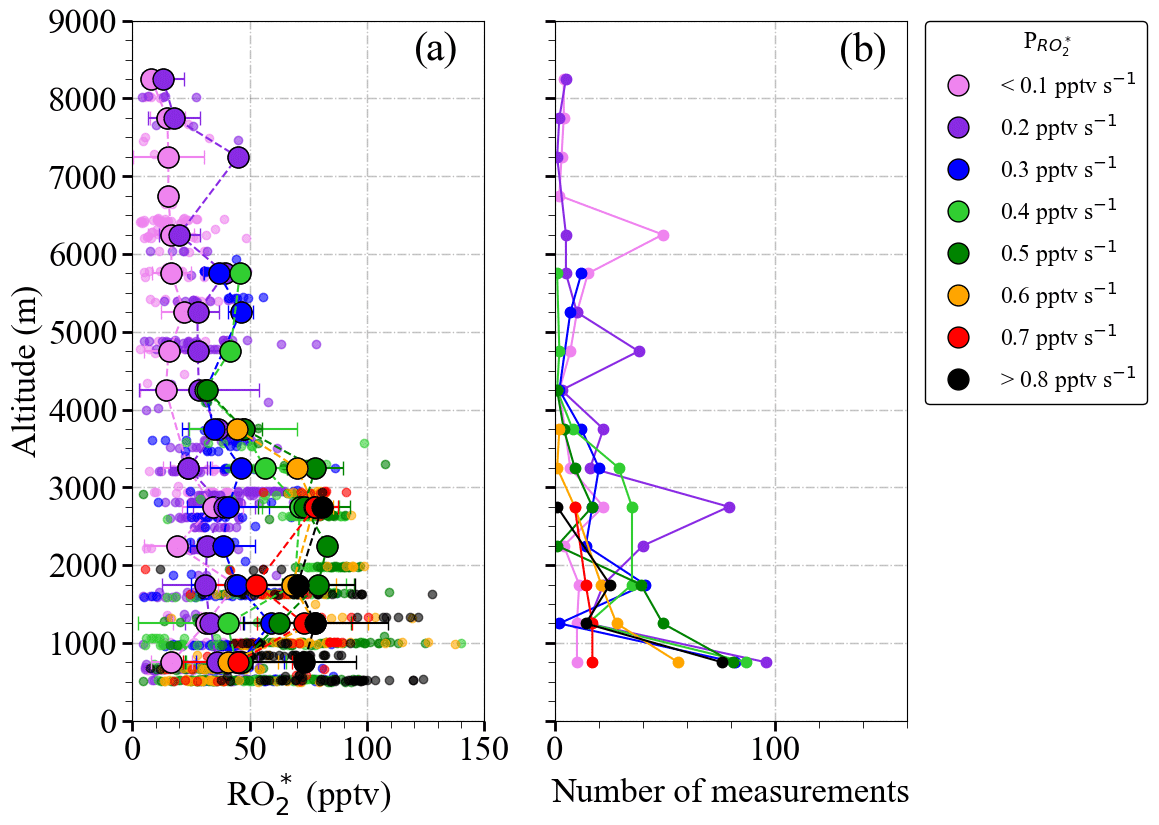
Figure 4(a) Composite averaged vertical distribution of measured colour-coded according to the value of ; (b) the number of measurements in each altitude bin. Small circles are 1 min individual measurements binned with values in 0.1 pptv s−1 intervals. Larger circles result from a further binning over 500 m altitude steps. All the production rates below 0.1 pptv s−1 and above 0.8 pptv s−1 are binned to 0.1 and 0.8 pptv s−1, respectively. The error bars are the standard deviation for each altitude bin.
Figure 5 shows the fractional contribution of the production rate from each radical precursor reaction included in Eq. (3) as a function of altitude. The data are classified into three groups according to the rate of change of production of the mixing ratio: pptv s−1 (Fig. 5a), pptv s−1 (Fig. 5b), and pptv s−1 (Fig. 5c) to show the lowest, most common, and highest ranges, respectively, encountered during the campaign. For 89 % of the measurements, pptv s−1 applies, while the rest of the data are equally distributed in the other two ranges. The data in each group are always binned over 500 m when available.
Typically, the high amount of H2O in the air masses probed leads to the reaction of O1D with H2O (Reactions R1–R2a), being the highest radical production rate (≥50 %) below 4000 m. As the amount of H2O reduces with altitude, the relative contribution from O3 photolysis decreases. Above 4000 m, HCHO, HONO, and CHOCHO photolysis contributions range between 20 % to 40 %, 2.5 % to 30 %, and 5 % to 25 %, respectively. The HCHO contribution increases up to 80 % during measurements above 6000 m. The contributions of CH3CHO and CH3C(O)CH3 photolysis are, in contrast, practically negligible (<5 %).
The vertical changes of the precursor mixing ratios and photolysis frequencies used to calculate in Fig. 5 are shown in Fig. 6a to f. pptv s−1 is associated with measurements under cloudy conditions, towards sunset where the photolysis frequencies are low, or at altitudes above 5000 m in air masses with a low amount of precursors. Values of pptv s−1 are found for air masses, measured below 2000 m in the outflow of MPCs over the sea, for conditions having sufficient insolation ( S−1) and a high content of precursors (HCHO >1000 pptv and HONO >100 pptv). The increase in the photolysis frequencies as a function of altitude is concurrent with decreases in precursor concentrations. As a result, the rates do not significantly vary with altitude in the air masses investigated.
In previous airborne campaigns, Tan et al. (2001) and Cantrell et al. (2003b) reported a reduction of the fractional contribution of the reaction of O(1D) with H2O as the value decreases. At very low values (<0.03 pptv s−1), the sum of all other production terms exceeded the fraction from the O(1D) + H2O term. For these conditions, H2O2 and VOCs photolysis dominated . For the EMeRGe data set in Europe, only 6 % of is below 0.06 pptv s−1.
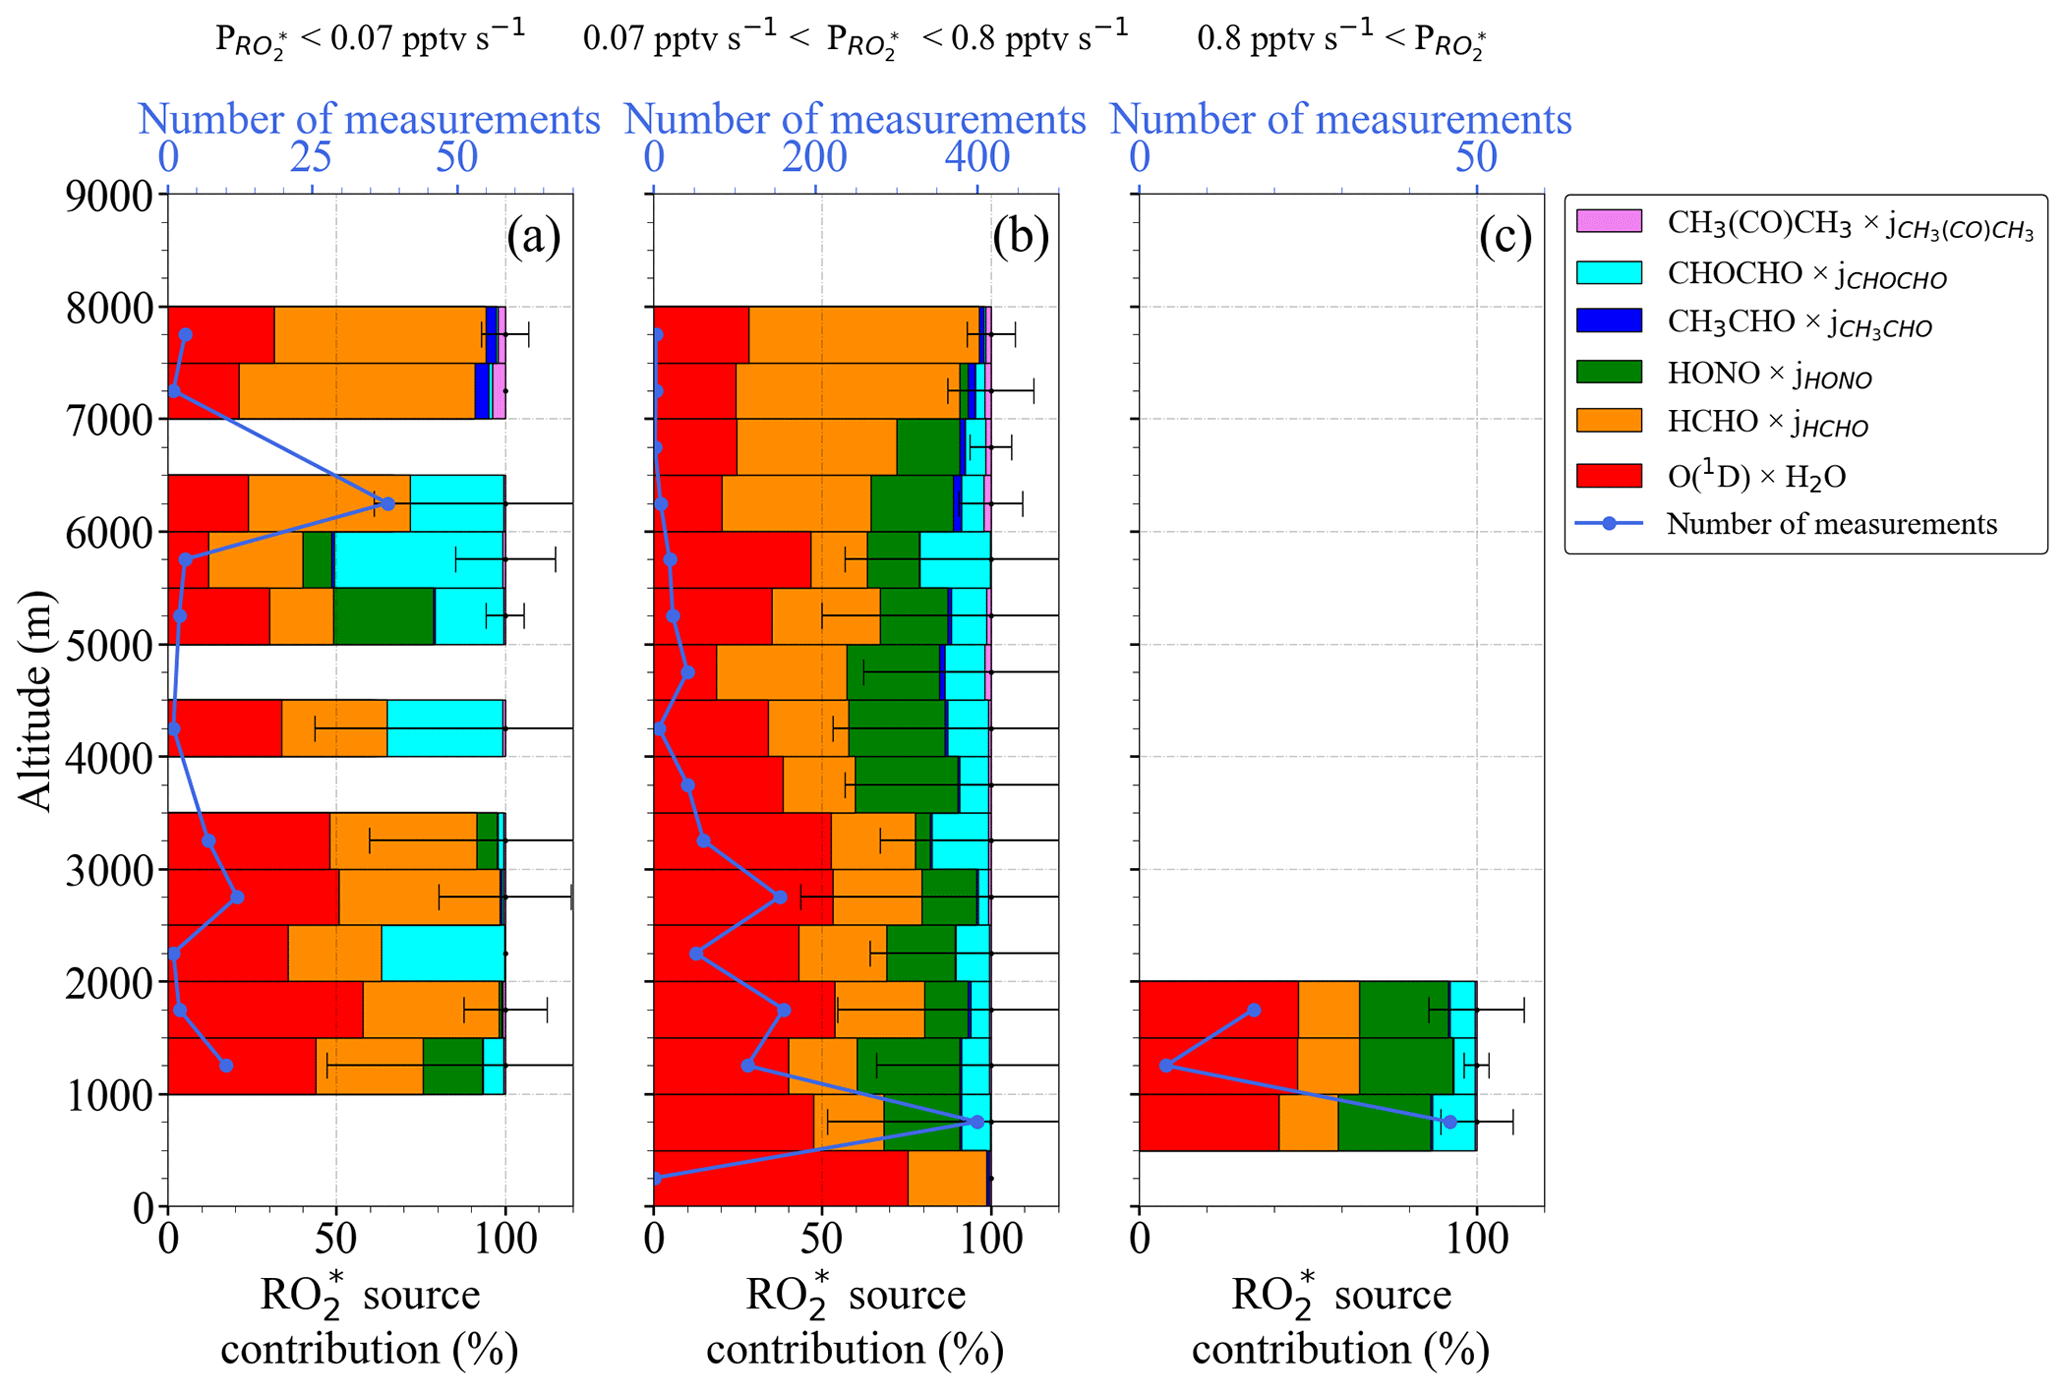
Figure 5Total and fractional precursor contributions estimated using Eq. (3) as a function of altitude for (a) pptv s−1, (b) 0.07 pptv s pptv s−1, and (c) pptv s−1. Note the different scales in the number of measurements.
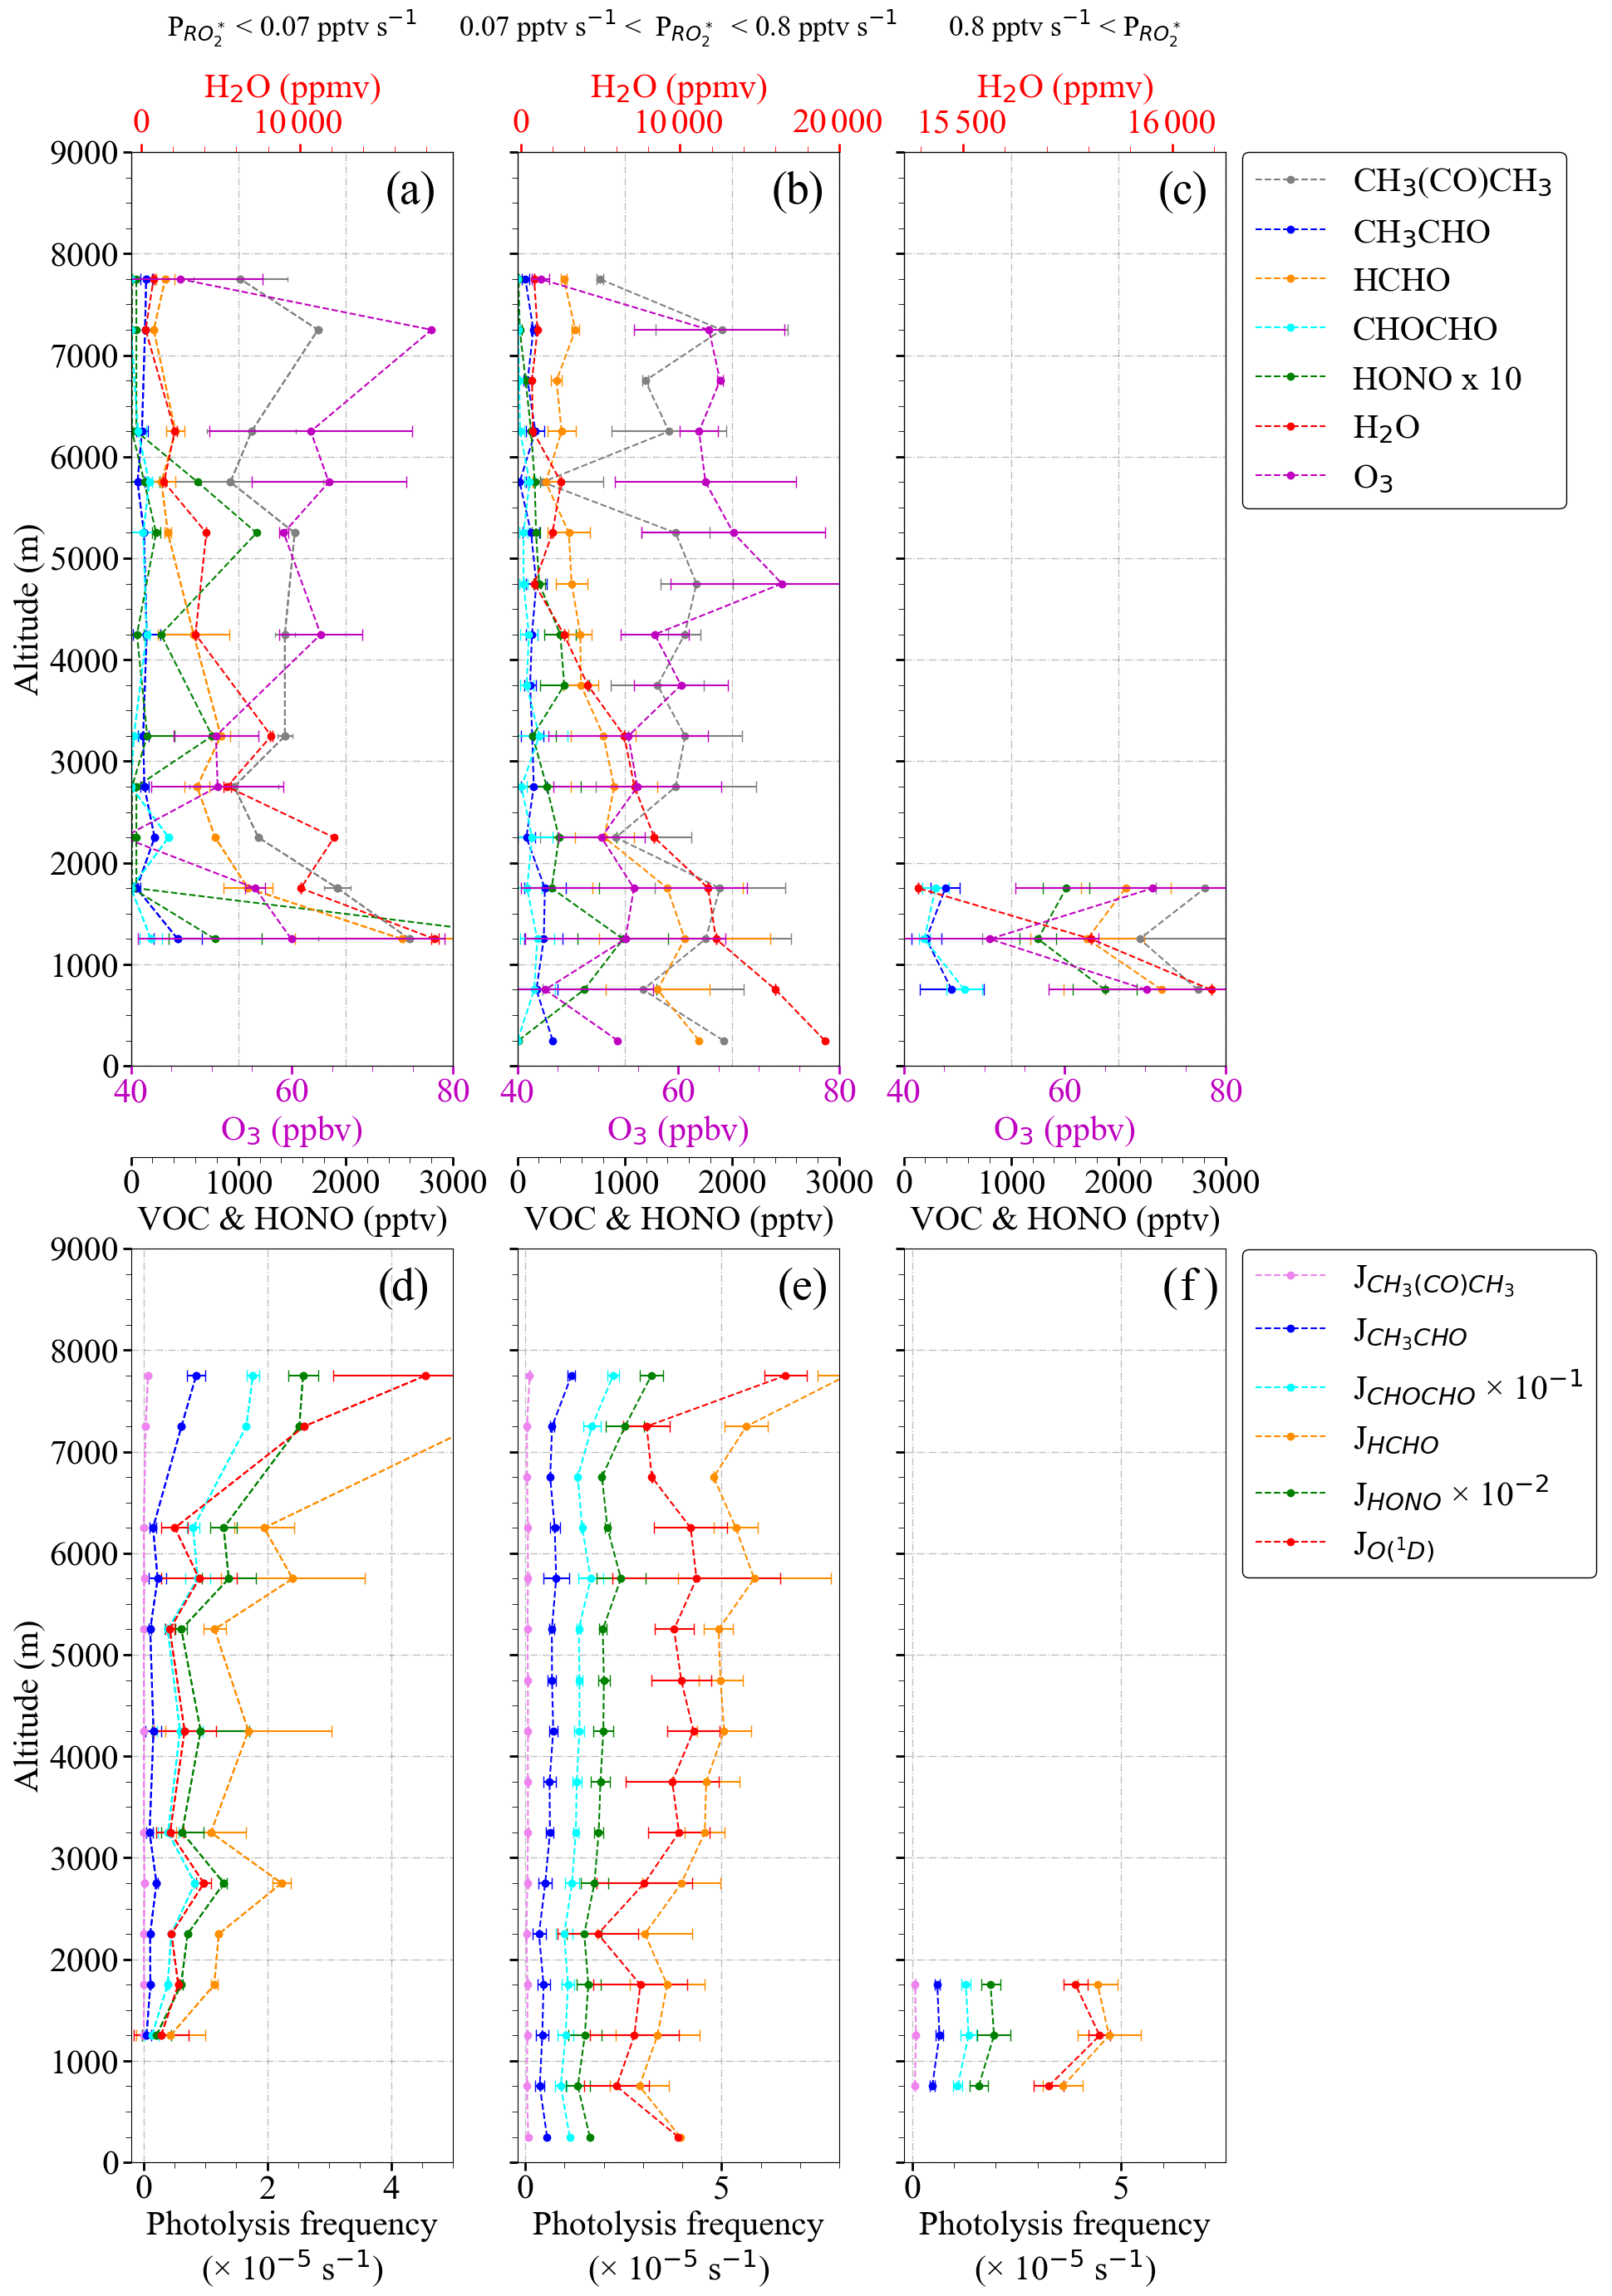
Figure 6Vertical distribution and variation of (a) to (c) precursor mixing ratios; (d) to (f) photolysis frequencies for the bins as in Fig. 5. Note the different scales in the H2O concentration.
4.3 PSS estimation of the mixing ratios
Under most ambient conditions in the troposphere, the species are short-lived, and the chemical lifetime of is much shorter than the chemical transport time into and out of an air mass being probed. Consequently, pseudo-steady-state conditions prevail, and the radical production and destruction rates are balanced:
The Reactions (R5) to (R7), (R12), (R16b), and (R23) to (R26) are interconversion reactions between OH, RO, HO2, and RO2 and do consequently occur without radical losses. Solving Eq. (4) leads to Eq. (5) if – reactions are assumed to be the dominant radical terminating processes.
where jHCHO, , , and jCHOCHO are respectively j8, j9, j10, and j11, as in Table S1 in the Supplement, and represents an effective self-reaction rate coefficient, comprising HO2–HO2, HO2–RO2, and RO2–RO2 reaction rates.
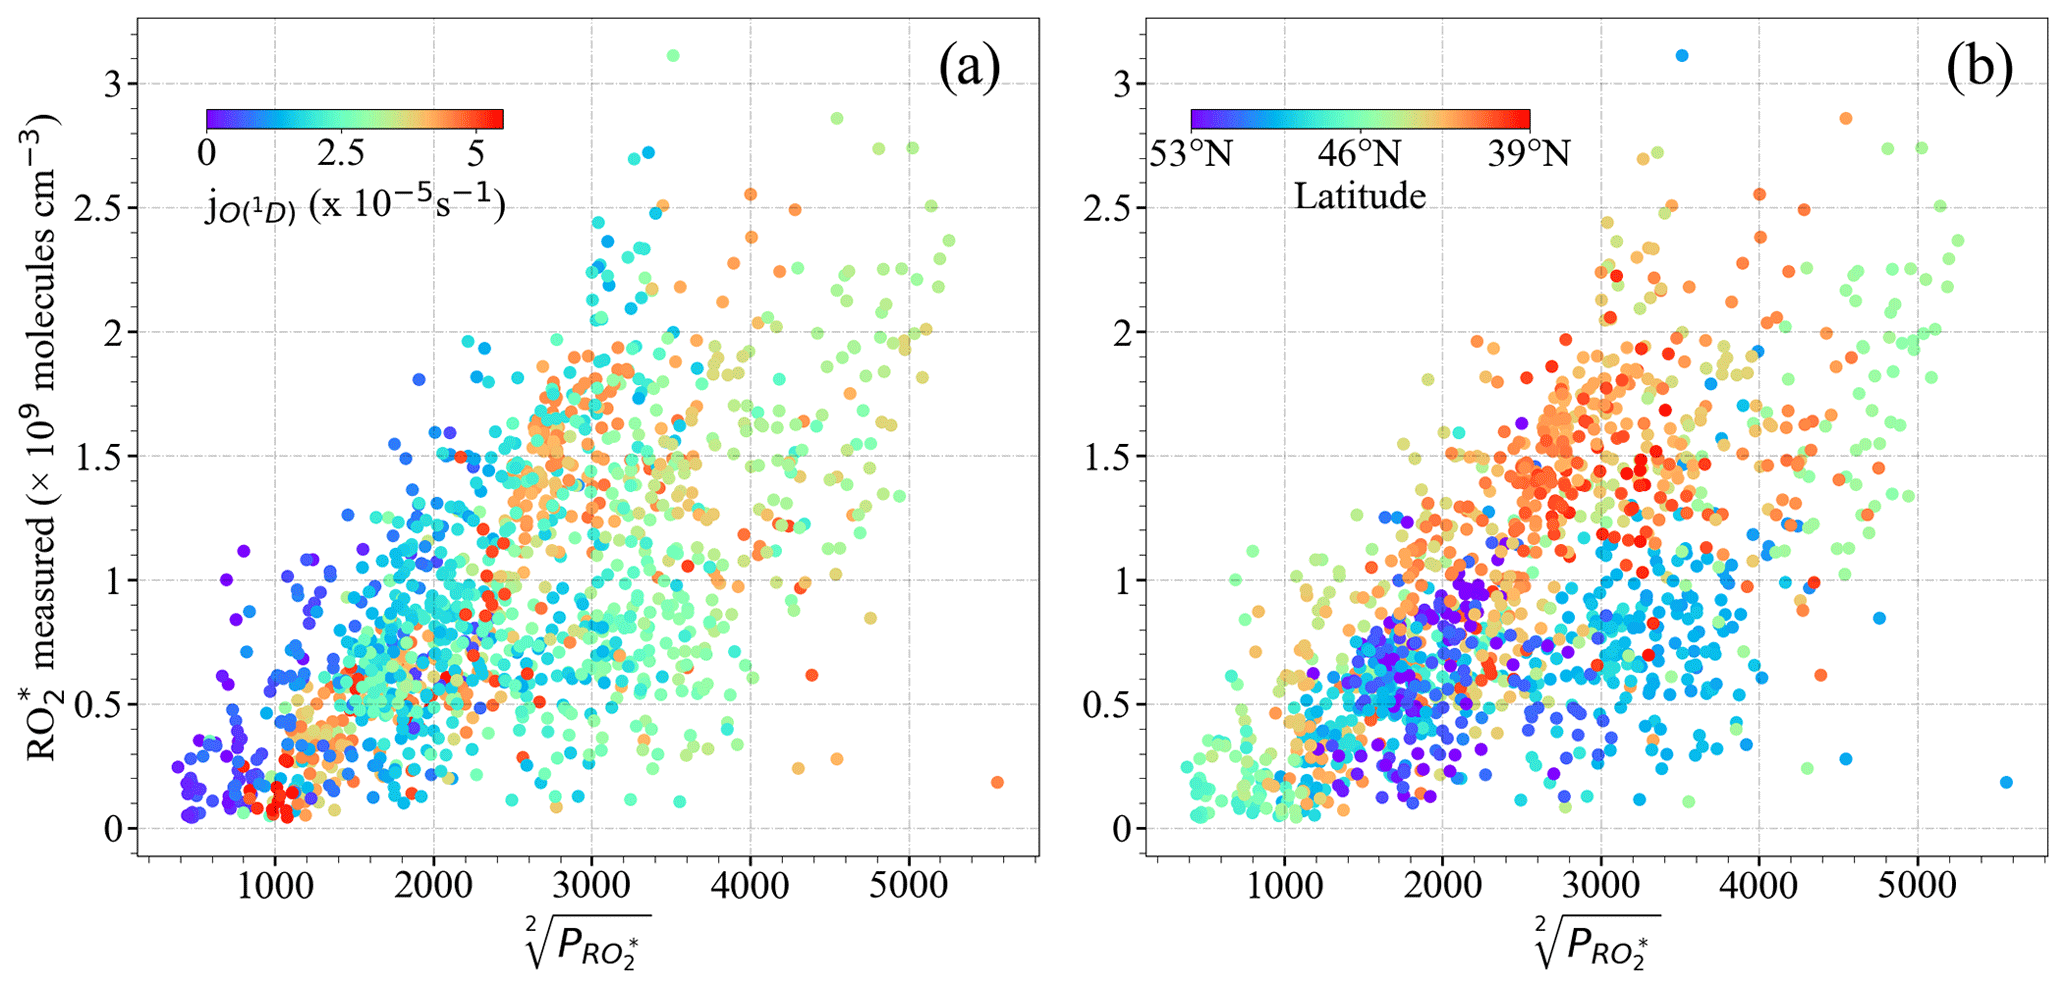
Consequently, the concentrations are expected to correlate with the square root of the .
Figure 7 shows the relationship between the measured [] and the calculated . Generally, both [] and increase with the photolysis frequency of O3 (. Measurements with [] molecules cm−3, , and were made above 6000 m, where the amount of precursors is low. The relatively weak correlation observed between [] and indicates the necessity of other radical terminating processes and/or missing radical formation terms in the calculation. Apart from this, the spread in the diagram confirms that the effective self-reaction rate varies widely in the air masses probed, likely due to the effect of changes in HO2 and ∑RO2 concentrations in the individual loss reaction rate coefficients. Photochemical processing is expected to be enhanced over southern Europe due to the prevailing conditions of high insolation and temperatures during the EMeRGe flights, which might lead to the rapid production of from the photochemical oxidations of CO and VOCs. This is also reflected in the higher and [] observed in southern Europe as compared to those in northern Europe (Fig. 7b).
The correlation between [] and improves when the measurements south and north of 47∘ N are separately analysed (Fig. 8). For a given [], the calculated is higher for the measurements north of 47∘ N than south of 47∘ N. The lowest [] to ratios are associated with higher NOx (NO + NO2), especially north of 47∘ N, indicating the urban character and higher amounts of the precursors of the air probed (Fig. 8d). Please note that these results are only valid for the data set acquired over Europe during EMeRGe flights and do not yield a relationship between [] and , which is generally applicable under all conditions for these two latitude windows.
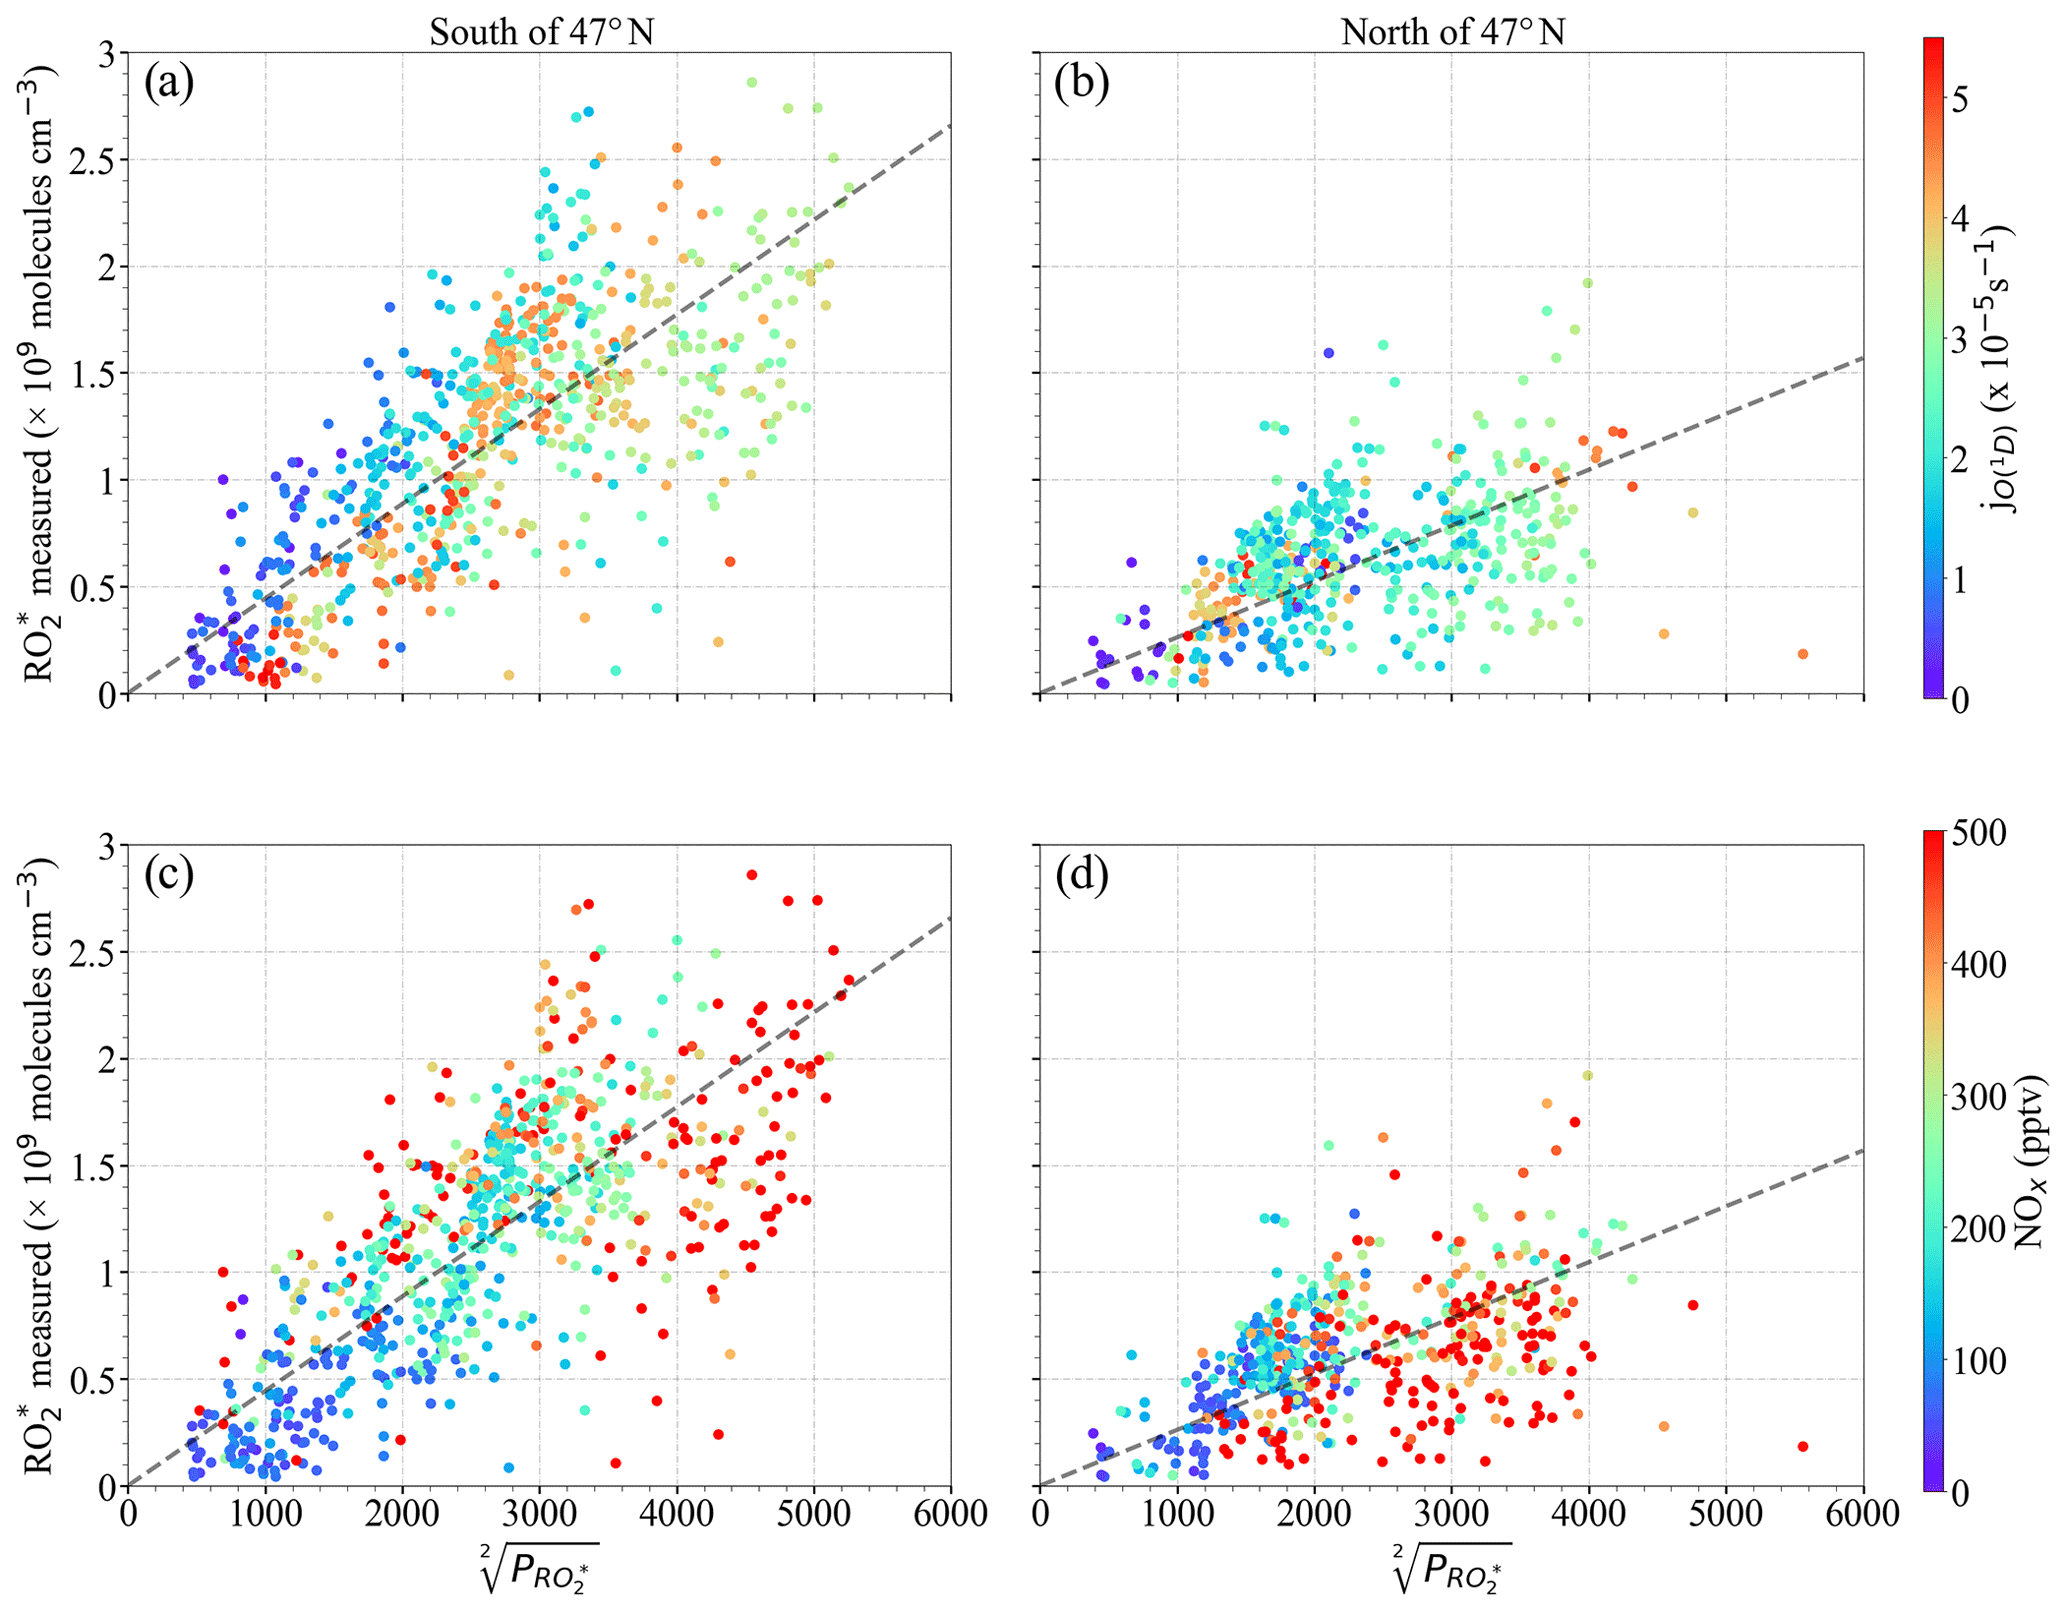
Figure 8Measured [] versus for the following latitudes: (a, c) south of 47∘ N and (b, d) north of 47∘ N. Note that (a) and (b) are colour-coded with ; (c) and (d) are colour-coded with the NOx mixing ratio. The dashed lines indicate the linear fit for visual support.
The relationship between and is further investigated to identify the dominant loss process in the air masses considered in this study. As stated in Sect. 3, HO2 and RO2 are not speciated but retrieved as by the PeRCEAS instrument. Because not all peroxy radicals are detected equally by the instrument, the comparison of measured and calculated values is complicated. To investigate this, the changes in the HO2 to the total RO ratios have been taken into consideration by δ (i.e. [HO2] =δ[] and [CH3O2] = (1−δ) []) in the analysis. As a first approach, RO2 is assumed to consist only of CH3O2 to reduce the complexity of the calculations by considering only CH3O2 reaction rate constants. The reaction channel (R25b) is not considered in the calculation since the yield of this channel is <5 % (Burkholder et al., 2019) for CH3O2+ NO reaction. Moreover, as mentioned in Sect. 3, the ratio was determined to be 65 % for the measurement conditions (George et al., 2020).
Equation (5) is additionally extended to include effective yields from VOC oxidation and radical losses through HONO and HNO3 formation:
where β is the effective yield of OH in the reaction of O(1D) with H2O given by
On the left-hand side of Eq. (6), 1−ρ accounts for the effective yield of HO2+RO2 production through the radical initiation Reactions (R2a) and (R3) and Reactions (R5) to (R7) and (R12). As the calculation is constrained with onboard measurements, only the reactions of measured VOCs were considered in Reaction (R12). Similarly, on the right-hand side of Eq. (6), ρ accounts for the radical termination through the OH + NO, OH + NO2, and OH + HONO reactions (Reactions R19 to R21) relative to the radical undergoing OH to peroxy radical conversion.
Consequently, ρ is given by
Measurements of CH4, HCHO, CH3CHO, CHOCHO, CH3OH, and CH3C(O)CH3 on board HALO are available and implemented in Eq. (6). These comprise the most abundant and reactive OVOCs and are considered to be a representative surrogate for the VOCs that act as precursors through oxidation and photolysis. During the EMeRGe campaign in Europe, k12a× [HCHO] and k12b×[CH3CHO] have the highest contribution to 1−ρ from all the OVOC measured. Their impact on the budget is found to be similar, because their respective concentrations compensate for the difference in the rate coefficients of their reactions with OH ( cm3 molecule−1 s−1 and cm3 molecule−1 s−1 at 298 K and 1 atm). Despite its high mixing ratios measured, CH3C(O)CH3 is less important in the 1−ρ term. This is because the rate coefficient k(T)12c is significantly slower than k12a and k12b (see Table S1 in the Supplement). Similarly, the contribution of CHOCHO and CH3OH is an order of magnitude lower than that of HCHO and CH3CHO.
Concerning the term on the right-hand side of Eq. (6), the HO2 reaction with O3 has a negligible effect as k24 is almost 4 orders of magnitude smaller than k23, and the NO concentrations remained about 3 orders of magnitude smaller than the O3 measured during the campaign.
The impact of the methylglyoxal (CH3C(O)C(O)H) photolysis was also investigated by using the CH3C(O)C(O)H∗ measurements provided by the miniDOAS instrument. The CH3C(O)C(O)H∗ measured is the sum of CH3C(O)C(O)H and a fraction of other substituted dicarbonyls (mainly 2,3-butanedione, C3H6O2), with similar visible absorption spectra. For the calculation, CH3C(O)C(O)H was assumed to be half of CH3C(O)C(O)H∗ as recommended by Zarzana et al. (2017) and Kluge et al. (2020). The calculated by including CH3C(O)C(O)H photolysis systematically overestimated the measurements. As the adequacy of the recommended factor of 0.5 varies with the actual air mass composition, CH3C(O)C(O)H was not included in the calculations.
Figure 9 shows the fractional contribution of the destruction rate () calculated for a 1:1 mixture of HO2 and CH3O2 using the reactions included in Eq. (6) as a function of altitude. The data are classified into three groups according to the rate of destruction of mixing ratio: pptv s−1 (a), pptv s−1 (b), and pptv s−1 (c) to show the lowest, most common, and highest ranges, respectively, encountered during the EMeRGe campaign. For 90 % of the measurements, pptv s−1 applies, while the rest of the data are equally distributed in the other two ranges. The data in each group are always binned over 500 m when available.
As can be seen in Fig. 9, the ±1σ standard deviation of the obtained bins is very high. In spite of this, the HO2–CH3O2 and HO2–HO2 reactions seem to dominate the radical destruction processes in the air masses probed. Their combined contribution is >70 % in all the cases except in the 1000 m bin of pptv s−1. Other significant radical losses occur through the HONO and HNO3 formation. The contribution of the CH3O2+ CH3O2 reaction to the total destruction rate is <5 %.
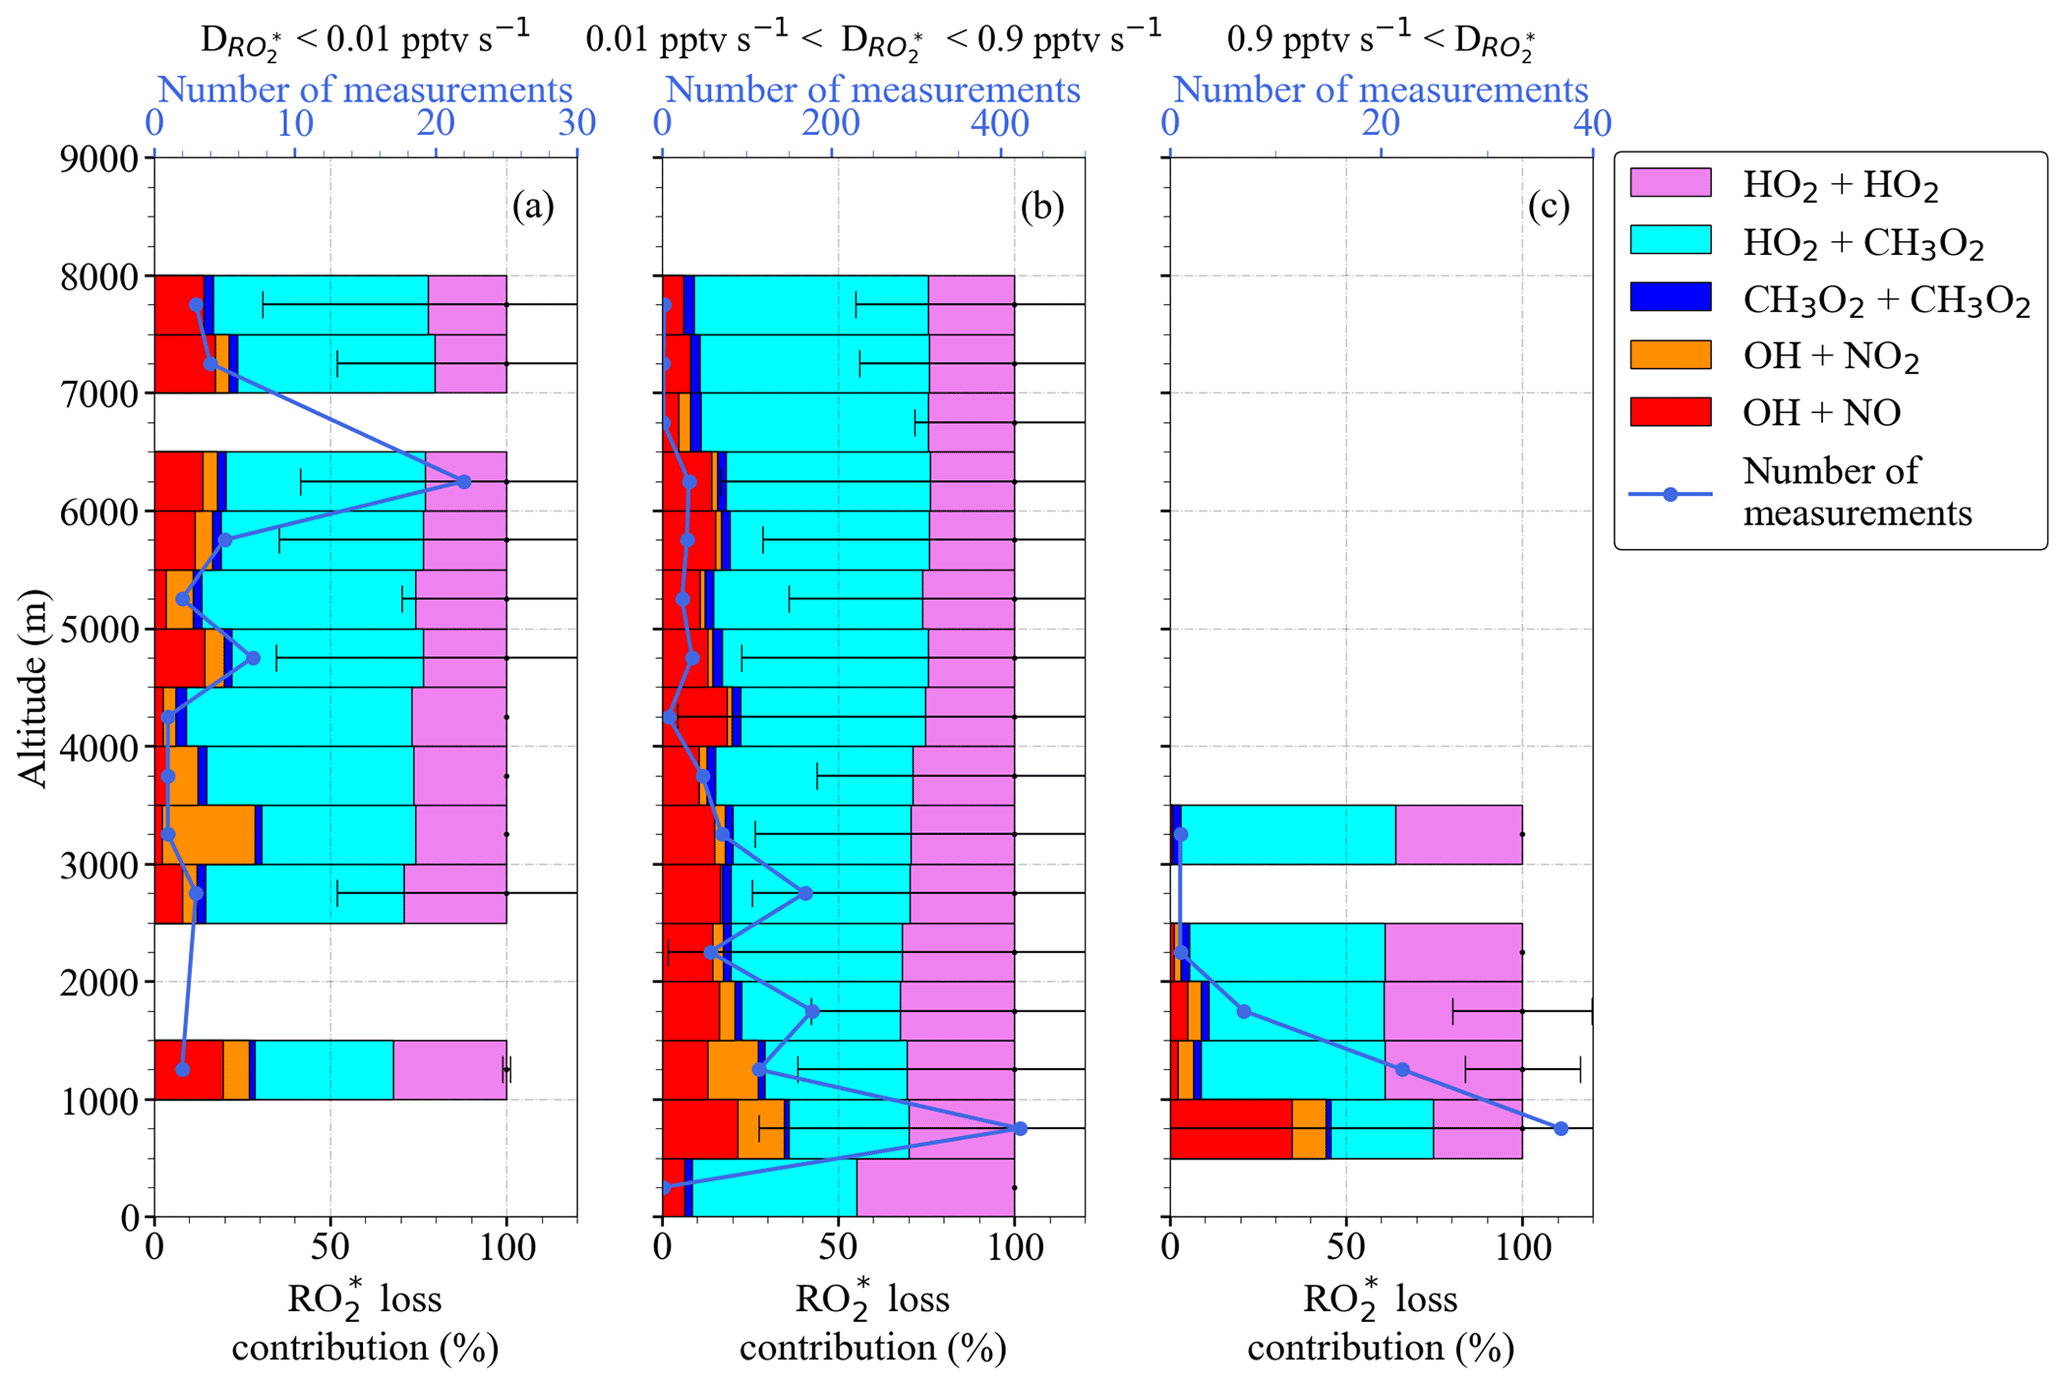
Figure 9 destruction rate ( and fractional contributions from loss reactions in Eq. (6) as a function of altitude for (a) pptv s−1, (b) 0.01 pptv s pptv s−1, and (c) pptv s−1. Note the different scales in the number of measurements.
Since Eq. (6) is quadratic in [], it can be solved for , where “c” stands for calculated, as
where
and where is a weighed rate coefficient of self-reactions for a 1:1 mixture of HO2 and CH3O2, comprises the formation of HONO and HNO3, and is the gross production of .
The second solution of the quadratic equation gives negative values for ; therefore, it is assumed to have no physical meaning. A more detailed derivation of Eqs. (6) and (9) are given in the Supplement.
Figure 10 shows the measured (hereinafter referred to as ) mixing ratio versus the calculated mixing ratio using Eq. (9). and are the measured and calculated respectively for δ=1 (i.e. RO) and δ=0.5 (i.e. HO2=RO2). The eCL values corresponding to δ=1 and δ=0.5 used for the retrievals were determined in laboratory experiments, as reported by George et al. (2020). The small circles represent 1 min , whereas the large circles are the mean of the binned over 10 pptv intervals. The data are colour-coded with the onboard NO measurements. The linear regression slopes are around 0.7 (R2=0.96), indicating an overall 25 %–30 % overestimation of the . The y-axis intercept is below the instrumental detection limit for most measurement conditions.
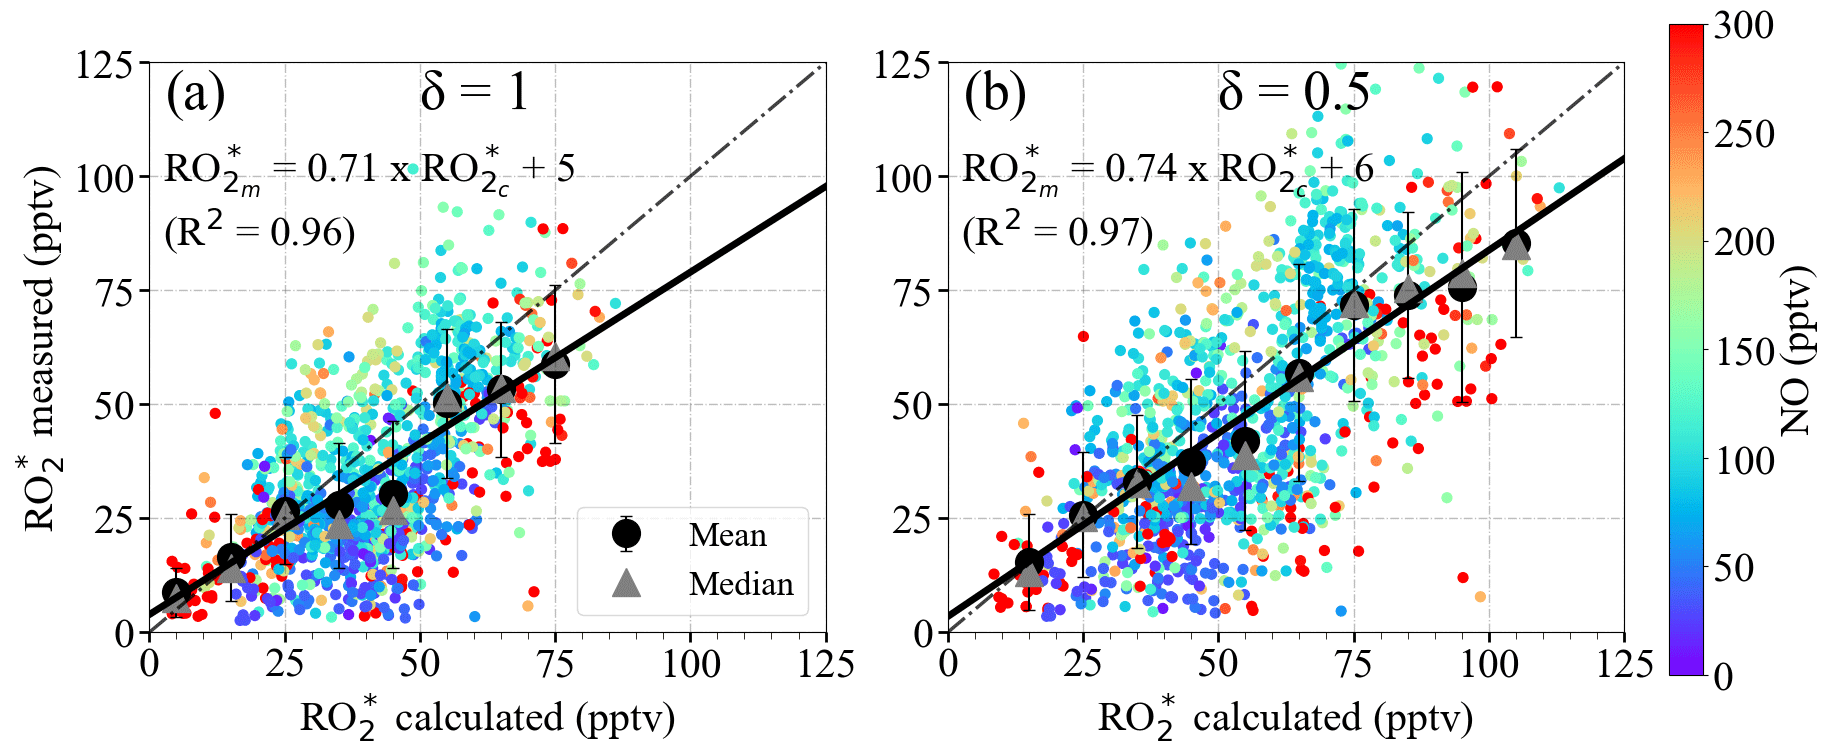
Figure 10 versus using Eq. (9) for (a) δ=1 and (b) δ=0.5. The data are colour-coded with the measured NO mixing ratios. The 1 min data (small circles), the mean of the binned over 10 pptv intervals (large circles), and the median of each bin (grey triangles) are shown. The error bars indicate the ±1σ standard deviation of each bin. The linear regression for the binned values (solid line) and the 1:1 relation (dashed line) are also depicted for reference.
Figure 11 shows the vertical profiles of and mixing ratios calculated for δ=0.5, averaged for the EMeRGe flights over Europe in 500 m altitude bins. seems to overestimate for altitudes above 4000 m. As mentioned in Sect. 4.1, the vertical profiles are a composite from averaging flights with legs carried out at different longitudes and latitudes. Therefore, the differences between and have been studied in more detail with respect to the composition of the individual air masses (see the and mixing ratios as a function of latitude and altitude in Fig. S4 in the Supplement).
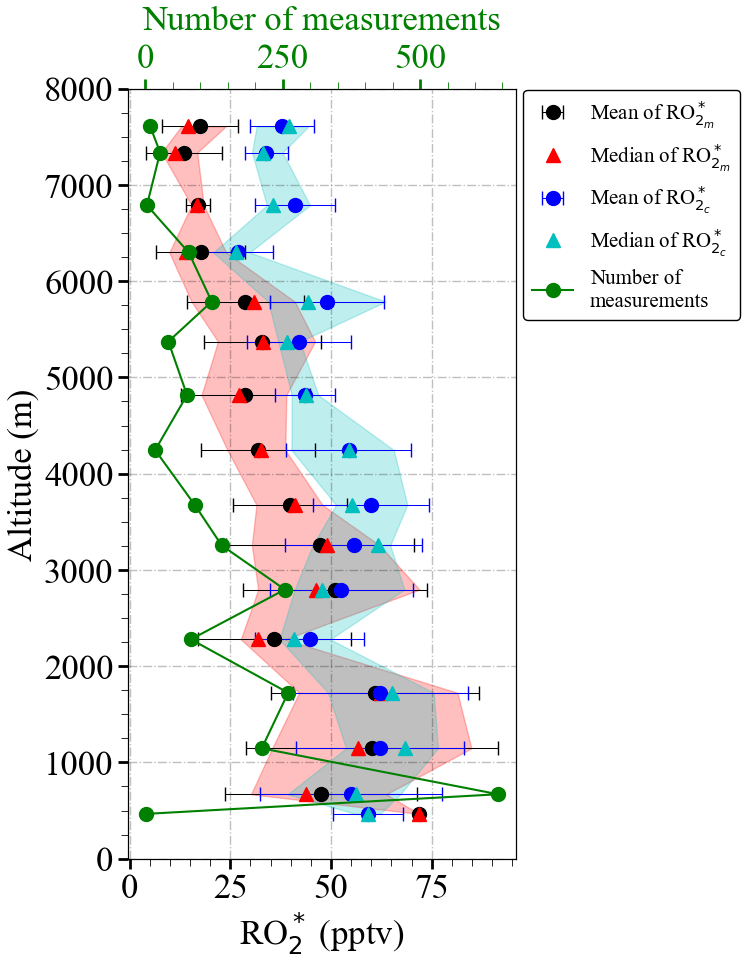
Figure 11Vertical distribution of the mean and mean using Eq. (9) for δ=0.5 for the EMeRGe data set in Europe. The measurements are binned over 500 m altitude. The error bars are the ±1σ standard deviation of each bin. Median values (red and cyan triangles), the interquartile 25 %–75 % range (red and blue shaded areas), and the number of individual measurements for each bin (in green) are additionally plotted.
Figure 12 shows the data for δ=0.5 colour-coded with NO; NOx; the sum of HCHO, CH3CHO, CHOCHO, CH3OH, and CH3C(O)CH3 (from now on referred to as ΣVOCs), as a surrogate for the amount of OVOCs acting as precursors; and the ΣVOCs to NO ratio. The largest differences between and are observed for the bins around 50 pptv. The values overestimate the mostly for pptv observed above ≈4000 m. These air masses are characterised by NO <50 pptv, ∑VOCs typically below 4 ppbv, high ΣVOCs NO ratios (>50), and low insolation conditions (i.e. s−1) (see Fig. S5 in the Supplement). Under these insolation conditions, the radical production rate is expected to be low, and the – reactions are expected to dominate the loss processes. As OH and H2O2 were not measured during the EMeRGe campaign in Europe, Eq. (9) does not include the loss Reactions (R17) and (R18), which might be significant under such conditions (Tan et al., 2001) and explain the overestimation of . This is also the case for the overestimations observed below 40 pptv at other altitudes, where NO <50 pptv but the ΣVOCs NO ratios remain low. The overestimation may therefore be independent of the ΣVOCs NO ratios. For NO ≤50 pptv, NO2≤100 pptv, RO pptv, and HCHO ≤1 ppbv, the rate of Reaction (R17), which forms H2O and O2 from OH and HO2, is about 4 times faster than the rate of the OH oxidation reaction of the dominant OVOCs (Reaction R12) considered in this study or the rate of formation of HONO (Reaction R19).
is both underestimated and overestimated for ∑VOCs mixing ratios greater than 7 ppbv. The composition of these air masses is very different, as reflected by the ΣVOCs NO ratios. This implies that Eq. (9) does not capture the peroxy radical yields adequately from the measured VOCs and OVOC in these cases. The differences between and may be explained in part by (a) changes in OH yields due to additional VOC oxidation processes, which are not in Eq. (9); (b) production from the photolysis of carbonyls, which were not measured; (c) production from the ozonolysis of alkenes or unidentified biogenic terpene emissions; and/or (d) overestimation of the loss processes.
In addition, Eq. (9) does not consider the loss of RO2 through the organic nitrate formation (Reaction R25b), which results in an underestimation of radical loss in the presence of RO2 with organic groups larger than CH3. Tan et al. (2019) reported that changing the yields for organic nitrate formation channel in Reaction (R25) from 5 % to 20 % has a small but notable influence on their experimental budget analysis. Similarly, the RO2 loss through organic nitrate formation, which is not included in Eq. (9), might explain the overestimations for ∑VOC <2 ppb, ∑VOCs NO <20, and for NO >200 pptv.
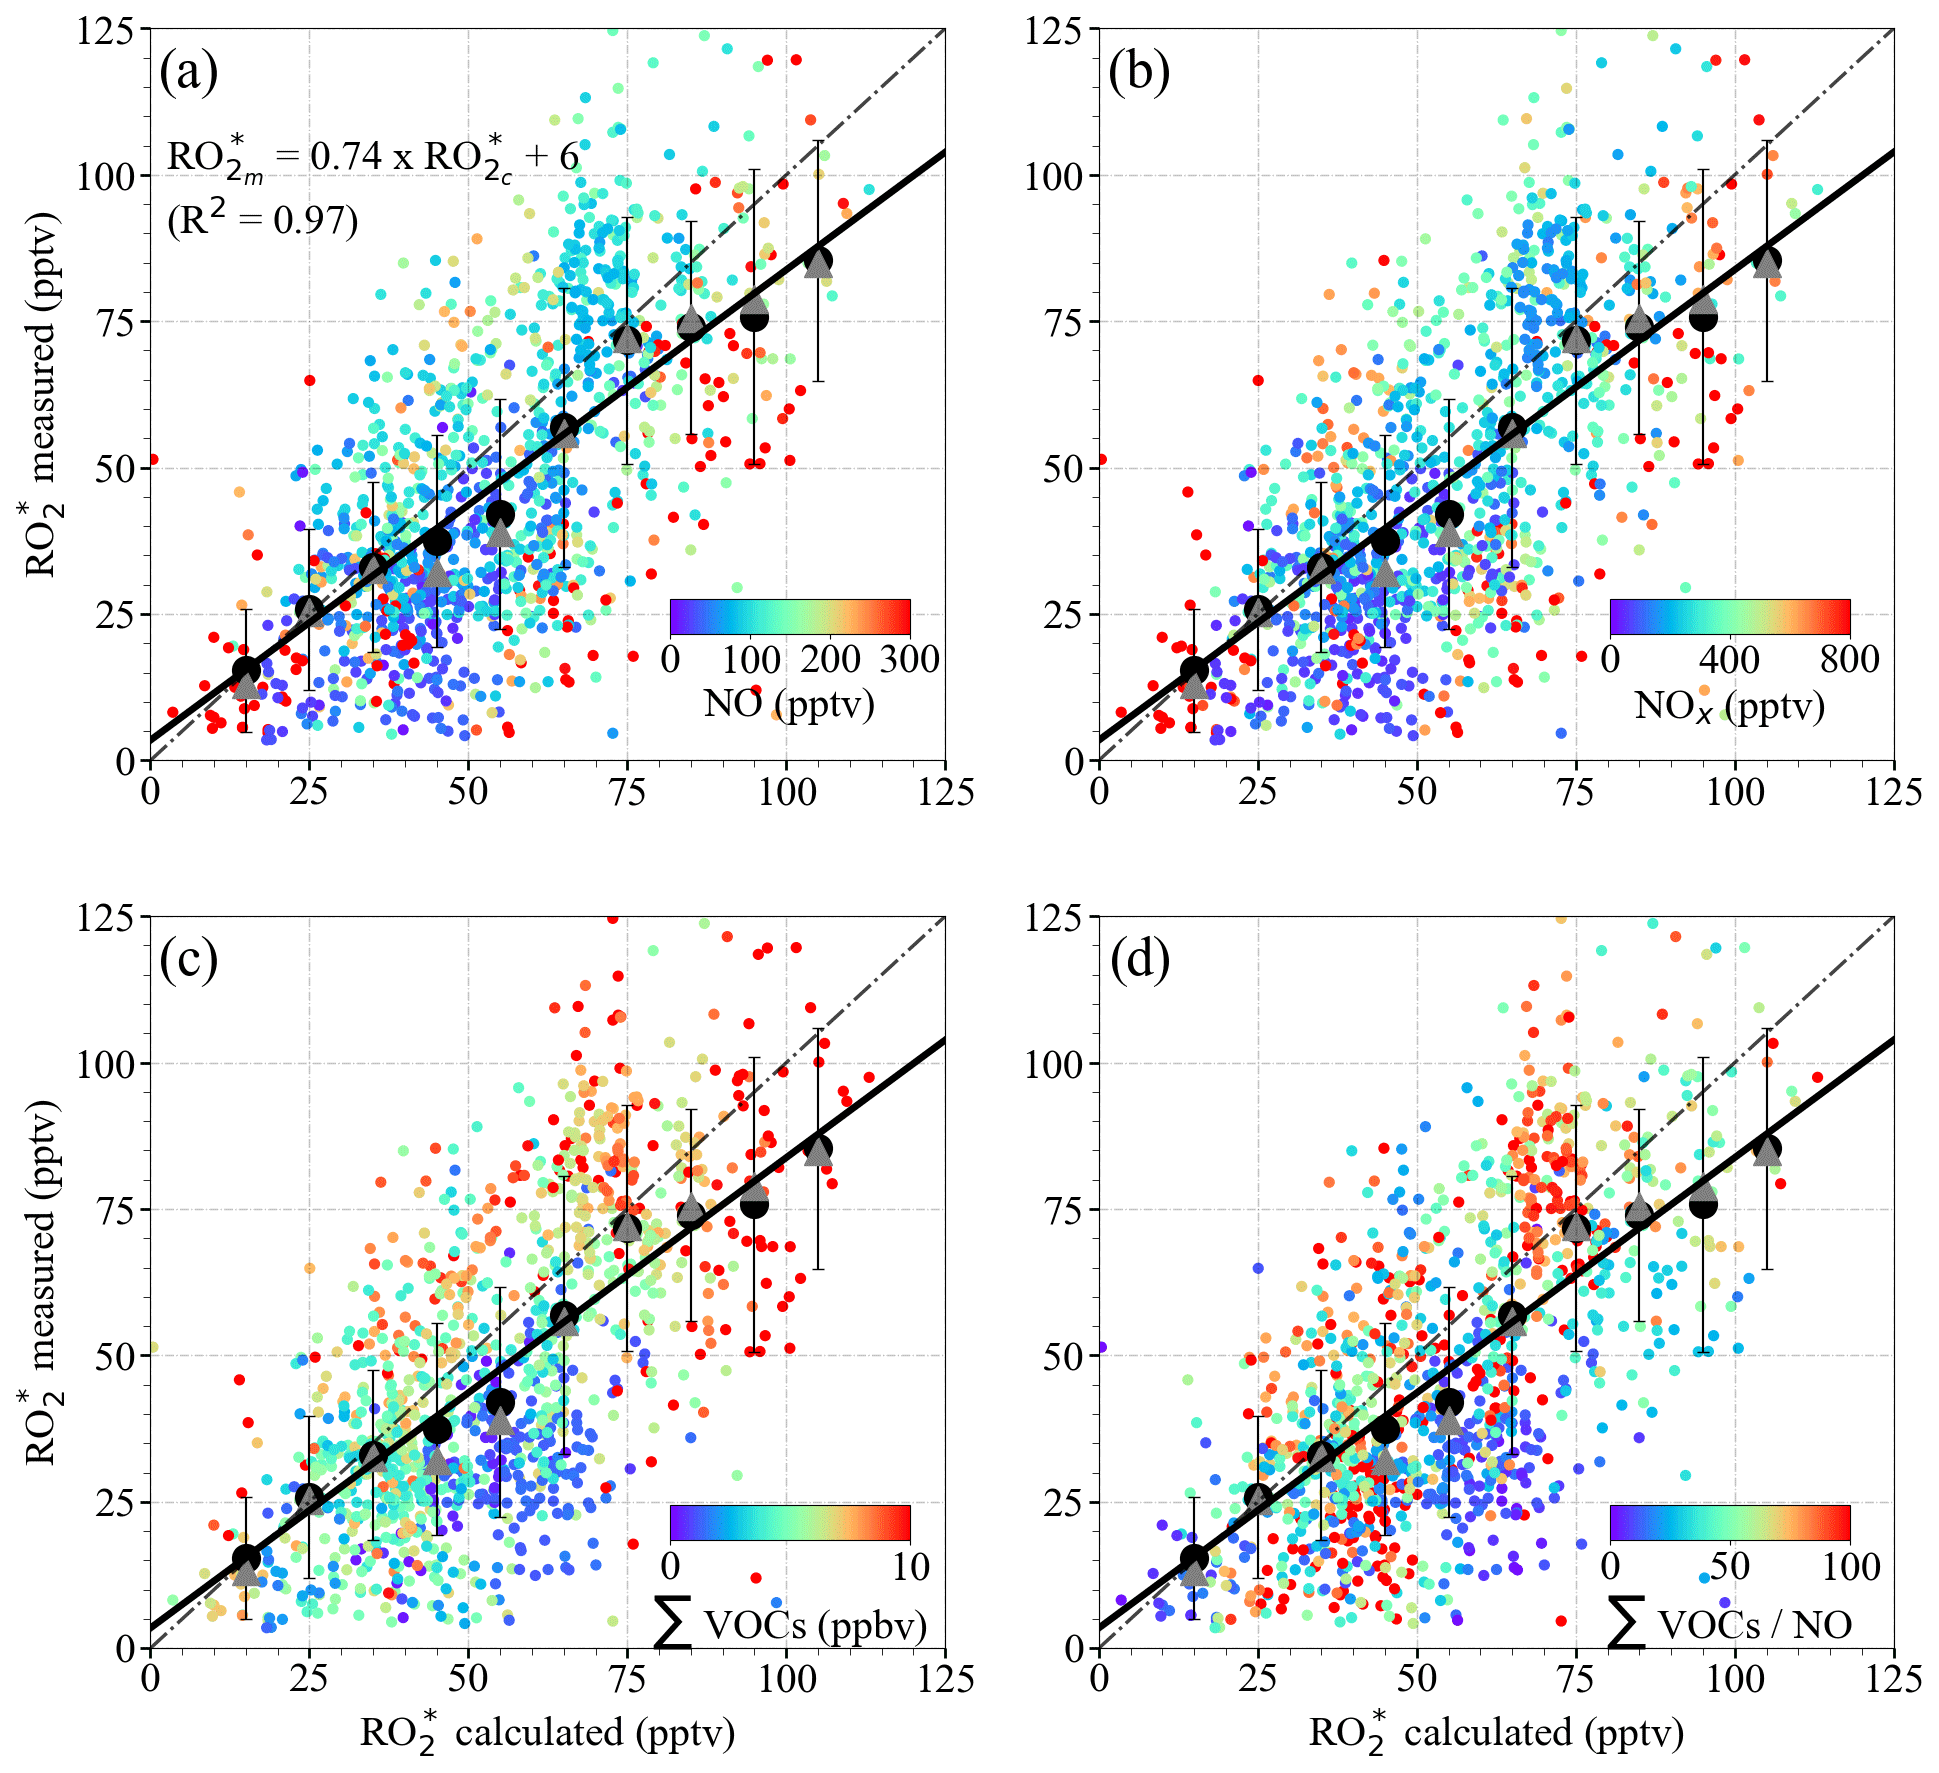
Figure 12 versus using Eq. (9) for δ=0.5 colour-coded with the measured (a) NO mixing ratio; (b) NOx mixing ratio; (c) ΣVOCs mixing ratio, where ΣVOCs = HCHO + CH3CHO + (CHO)2+ CH3OH + CH3C(O)CH3; and (d) ΣVOCs NO ratio. The 1 min data (small circles), the mean of the binned over 10 pptv intervals (large circles), and the median of each bin (triangles) are shown. The error bars represent the ±1σ standard deviation of each bin. The linear regression for the binned values (solid line) and the 1:1 relationship (dashed line) are plotted for reference.
Although considered small, the spatial and temporal differences in the in situ measurements of the key trace gases (O3, NO, H2O, CO, CH4, VOCs) as compared to those of the remote sensing observations (NO2 and HONO) used in Eq. (9) may also contribute to the overall spread observed in Fig. 12. Although the temporal evolution and the amount of the trace gases measured using in situ and remote sensing instruments agree reasonably well, as shown for HCHO in Fig. 13, the remote sensing instruments have, in general, larger air sampling volumes compared to that of in situ instruments. This may occasionally lead to significant differences depending on the location of the pollutant layers with respect to HALO. In addition, PTR-MS measurements of HCHO might include interferences from molecular fragments of other compounds in the sample air (Inomata et al., 2008). Further details about the accuracy and comparability of the onboard instrumentation during the campaign can be found elsewhere (Schumann, 2020).
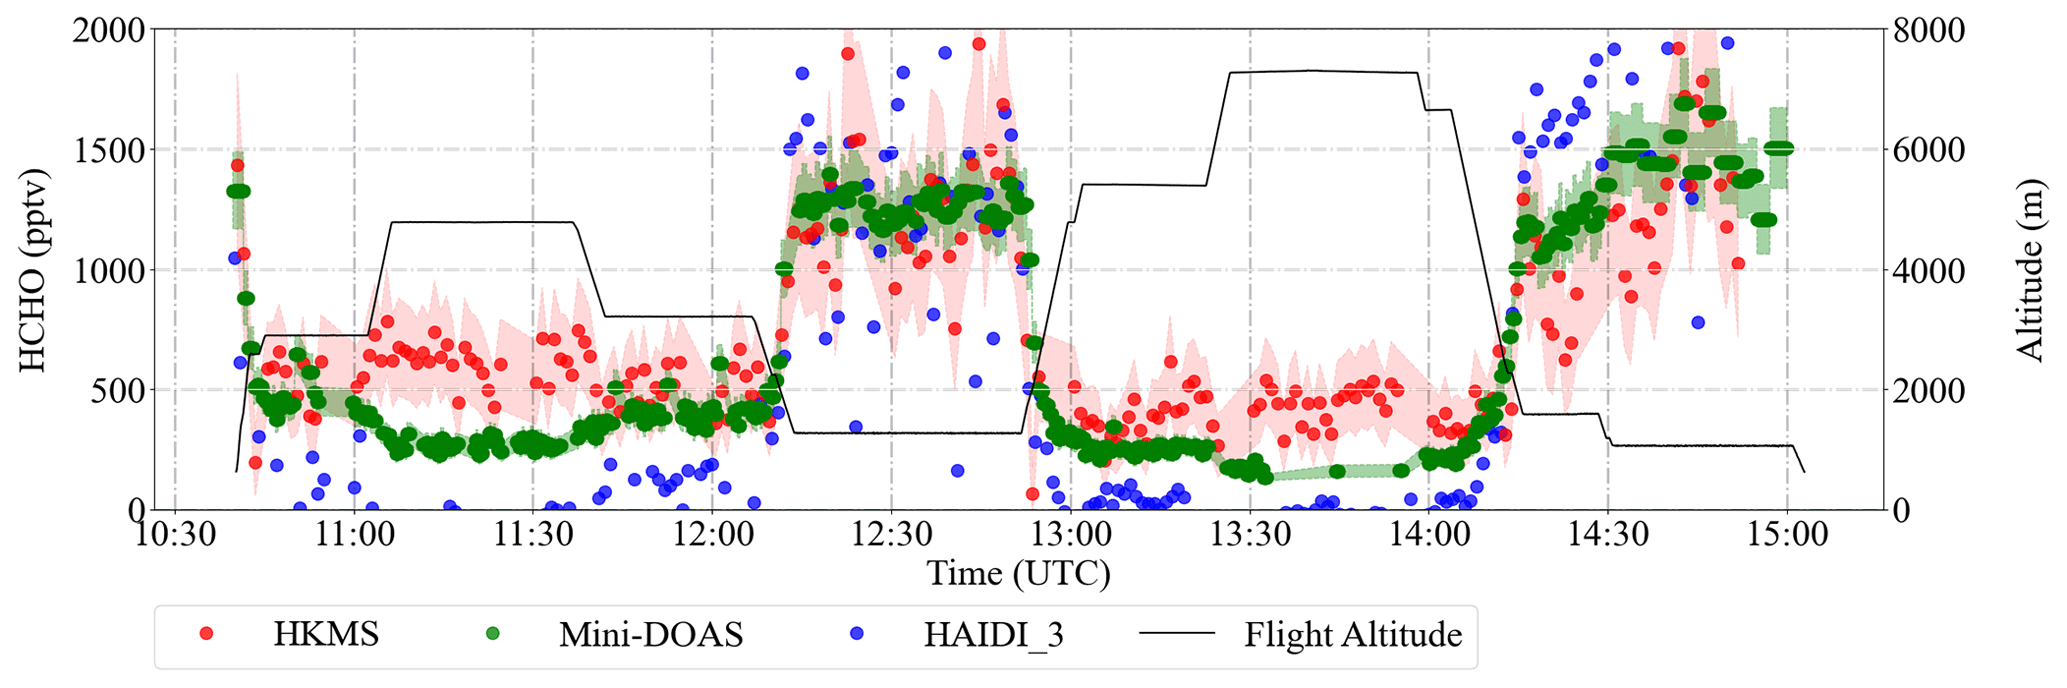
Figure 13An example of the time series of the measured HCHO mixing ratios retrieved from the remote sensing (HAIDI in blue and miniDOAS in green) and in situ (HKMS in red) instruments during the E-EU-04 flight on 14 July 2017. The shaded region shows ±1σ uncertainties of the HKMS and miniDOAS instruments. The flight altitude is depicted in black.
In summary, apart from the inaccuracies in the reaction rate coefficients, the differences between and might be caused by a combined effect of the limitations of the analytical expression to simulate complex non-linear chemistry and the measurement uncertainties arising from the spatial heterogeneity of the plume for the remote sensing instruments. Consequently, the quantification of limiting factors in Eq. (9) require the analysis of the pollution events encountered along the flights individually.
The ratio of to ( ) has been used to assess the applicability of Eq. (9) for the calculation of in the air masses probed. In Fig. 14, the data are colour-coded with respect to , H2O, ΣVOCs, and NOx. The air masses probed at altitudes above 2000 m are close to the PSS assumptions used to develop Eq. (9), and consequently, the ratio remains ≤1. In contrast, is at its highest value below 2000 m, reaching up to 3. At these altitudes, most of the flights in Europe were carried out in pollution plumes, in which both the amounts of NOx and precursors are high. The analytical expression does not capture the variations resulting from fast non-linear photochemistry present in these pollution plumes. This is the case for the measurements made between 42 and 46∘ N in the outflow of the Po Valley and Rome. ∑VOCs >7 ppbv and NOx mixing ratios >500 pptv indicate high radical precursor loading and relatively fresh emissions. The is also >2 in the measurements over the English Channel (between 50 and 52∘ N) with ∑VOCs and NOx mixing ratios >7 ppbv and 1000 pptv, respectively.
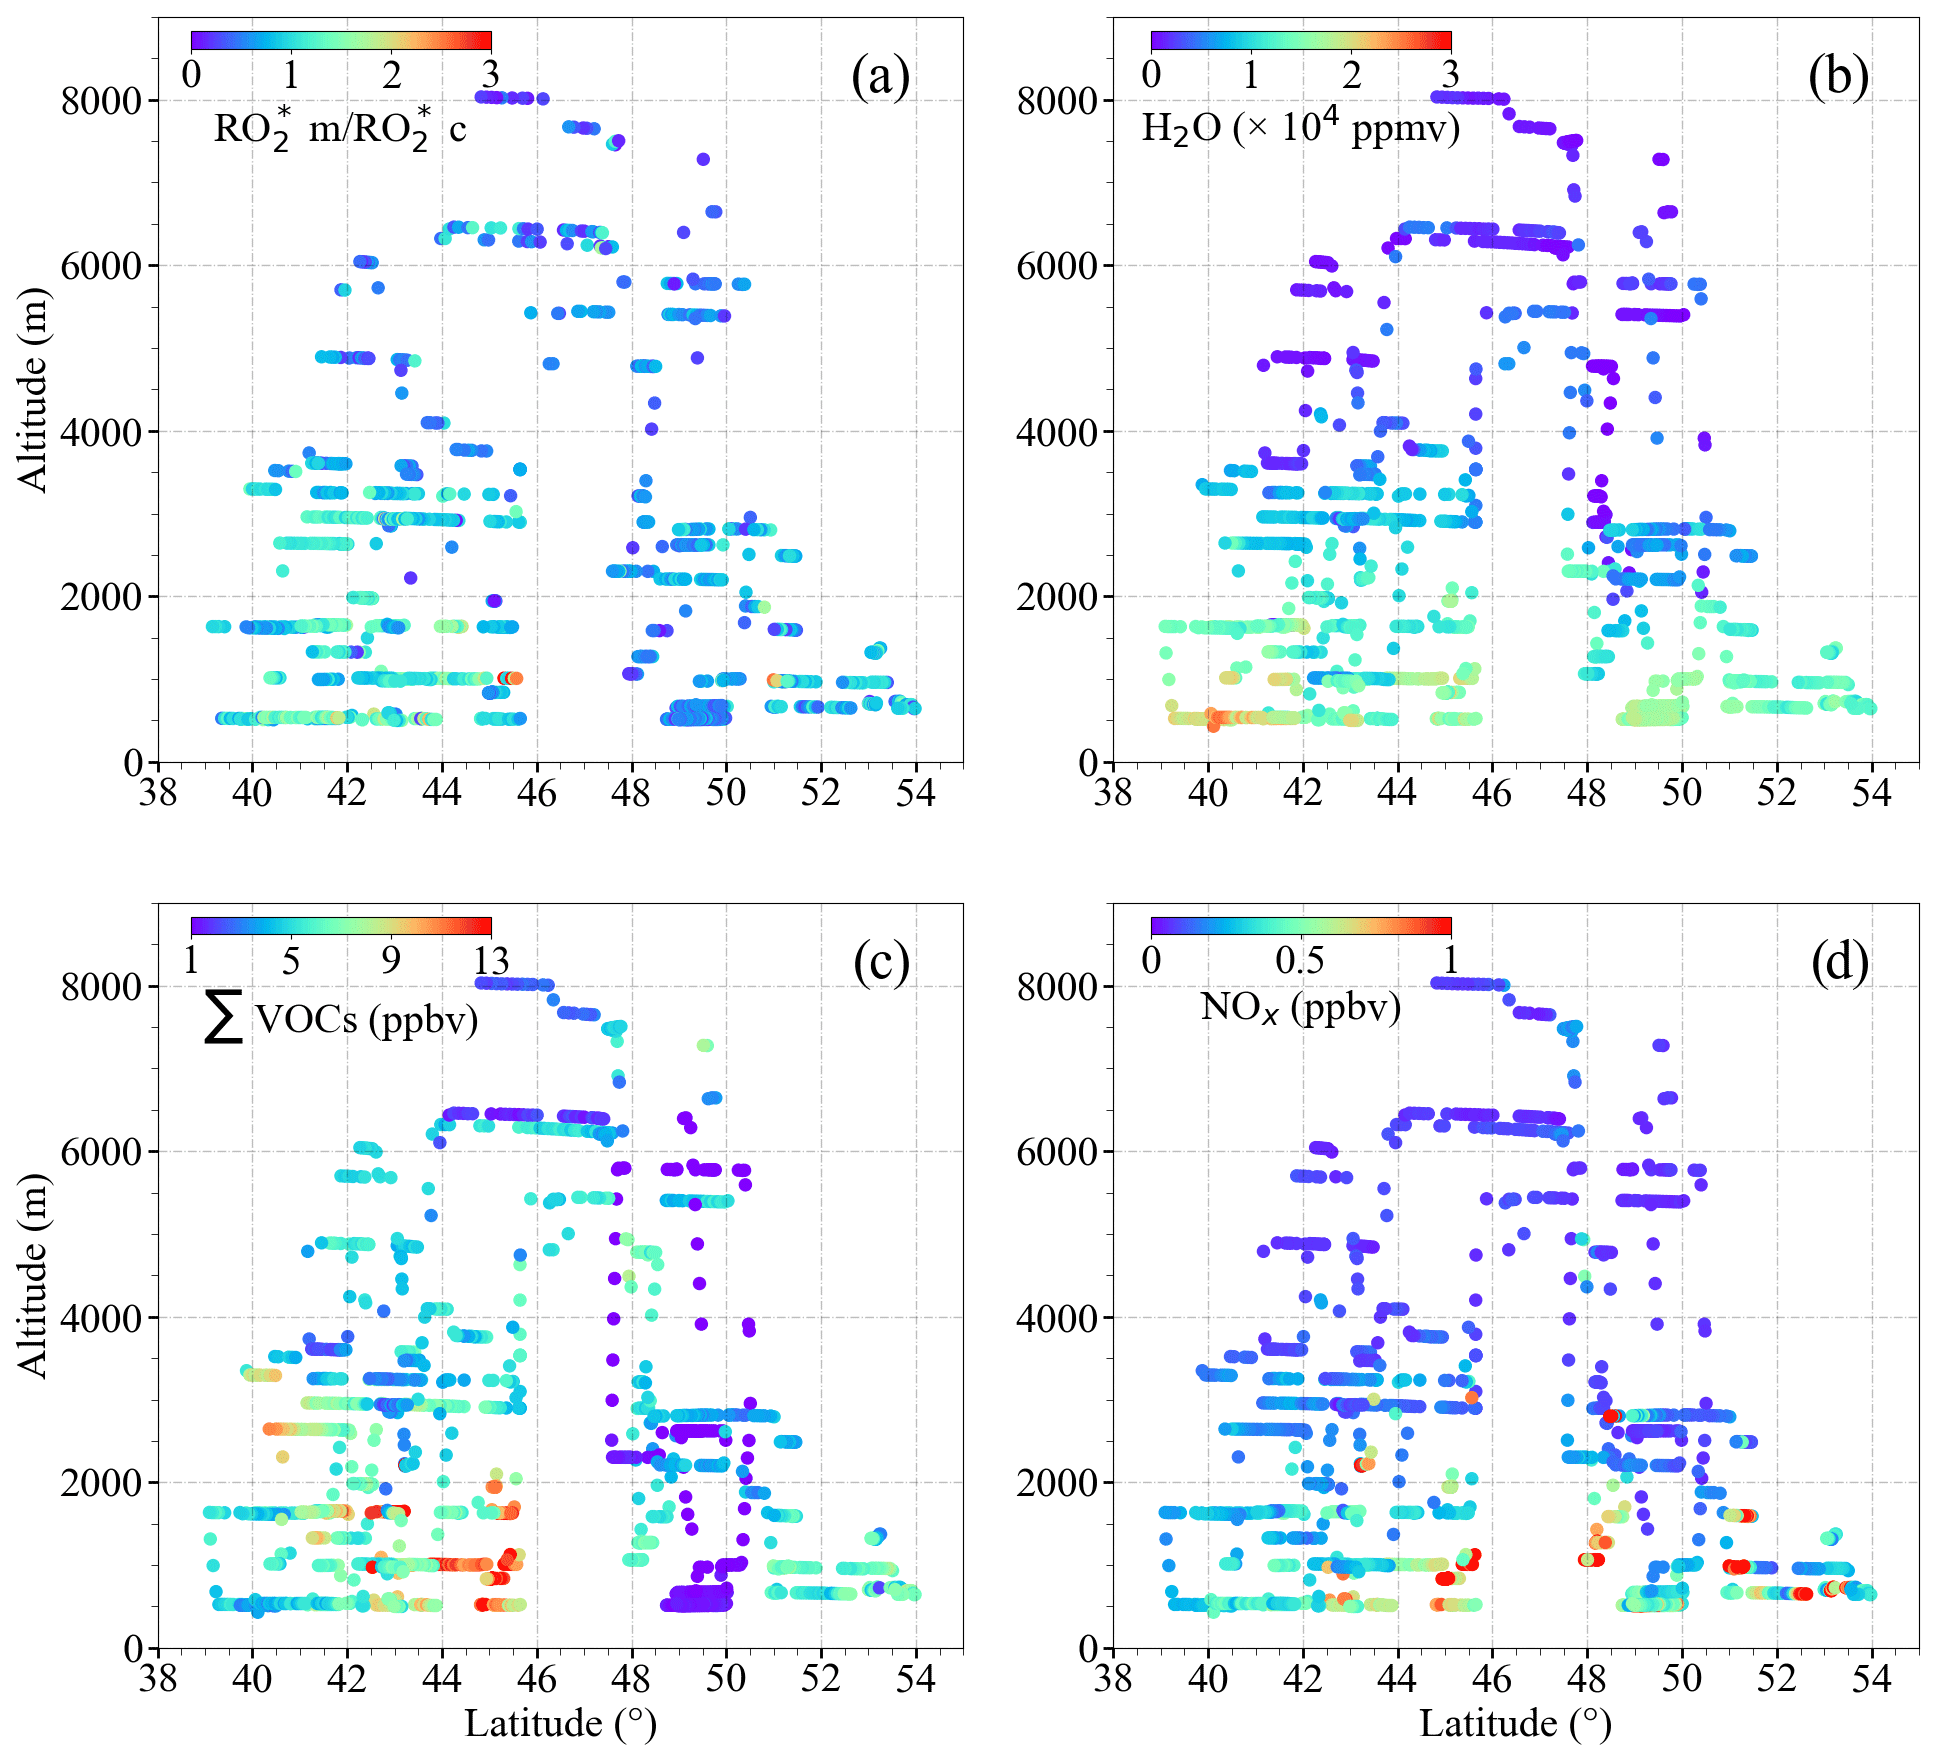
Figure 14Plots of (a) the ratio of to ( ) assuming that δ=0.5; (b) H2O; (c) ∑VOCs; (d) NOx as a function of latitude and altitude for the EMeRGe measurements in Europe.
The applicability of Eq. (9) for calculating the in-flight measurements of along the track of the E-EU-03 flight on 11 July 2017 was studied in more detail. The E-EU-03 flight investigated the outflow of selected MPCs in Italy (i.e. Po Valley and Rome). Consequently, the flight track was routed along the western coast of Italy and included vertical profiling over the Tyrrhenian Sea upwind of Rome (see Fig. S6 in the Supplement). As indicated by , in Fig. 15, cloudless conditions dominated throughout the flight track. The values agree reasonably well with throughout this period except in the pollution plume measured from 12:05 to 12:25 UTC. In this plume, CO, NO, NO2, HONO, NOy, and HCHO were 100 ppbv, 180 pptv, 150 pptv, 120 pptv, 1 ppbv and 2 ppbv, respectively. The values are approximately 20 % underestimated by during this period. Backward trajectories calculated using FLEXTRA (Stohl et al., 1995; Stohl and Seibert, 1998) indicate the transport of pollution through the Mediterranean mixed with dust plumes originating from Tunisia. The NO mixing ratios observed indicate the proximity to emission sources.
The measurements of VOCs used in Eq. (9) may not be representative of the actual complex VOC composition in the plume measured from 12:05 to 12:25 UTC. Consequently, the RO2 to HO2 ratio, the branching ratios, and effective rate coefficients for – reactions might not be well represented in Eq. (9). Taking CH3O2 as a surrogate for all RO2 might lead to uncertainties in the calculations in the presence of OVOCs with larger organic chains. On the experimental side, changes in the HO2 to RO2 ratio affect the accuracy of the PeRCEAS retrieval of the total sum of radicals. As noted in Sect. 3, in this study RO HO, and the eCL is determined for a 1:1 mixture of HO2:CH3O2 (i.e. δ=0.5 is used for the retrieval). However, the HO2 to CH3O2 ratio is not expected to remain constant in all the air masses probed. For a 3:1 ratio of HO2:RO2, the would decrease by 10 %. Similarly, a HO2:RO2 ratio of 1:3 would lead to an increase of 10 % in the reported . This uncertainty is well below the in-flight uncertainty of the PeRCEAS instrument indicated by the error bars in Fig. 14 (George et al., 2020) and cannot account for the overall underestimation. However, it might reduce the differences observed between and in particular cases. A complete explanation of the variability of in the pollution plumes measured within the campaign in Europe is beyond the scope of this analysis and requires an investigation by high-resolution chemical models.
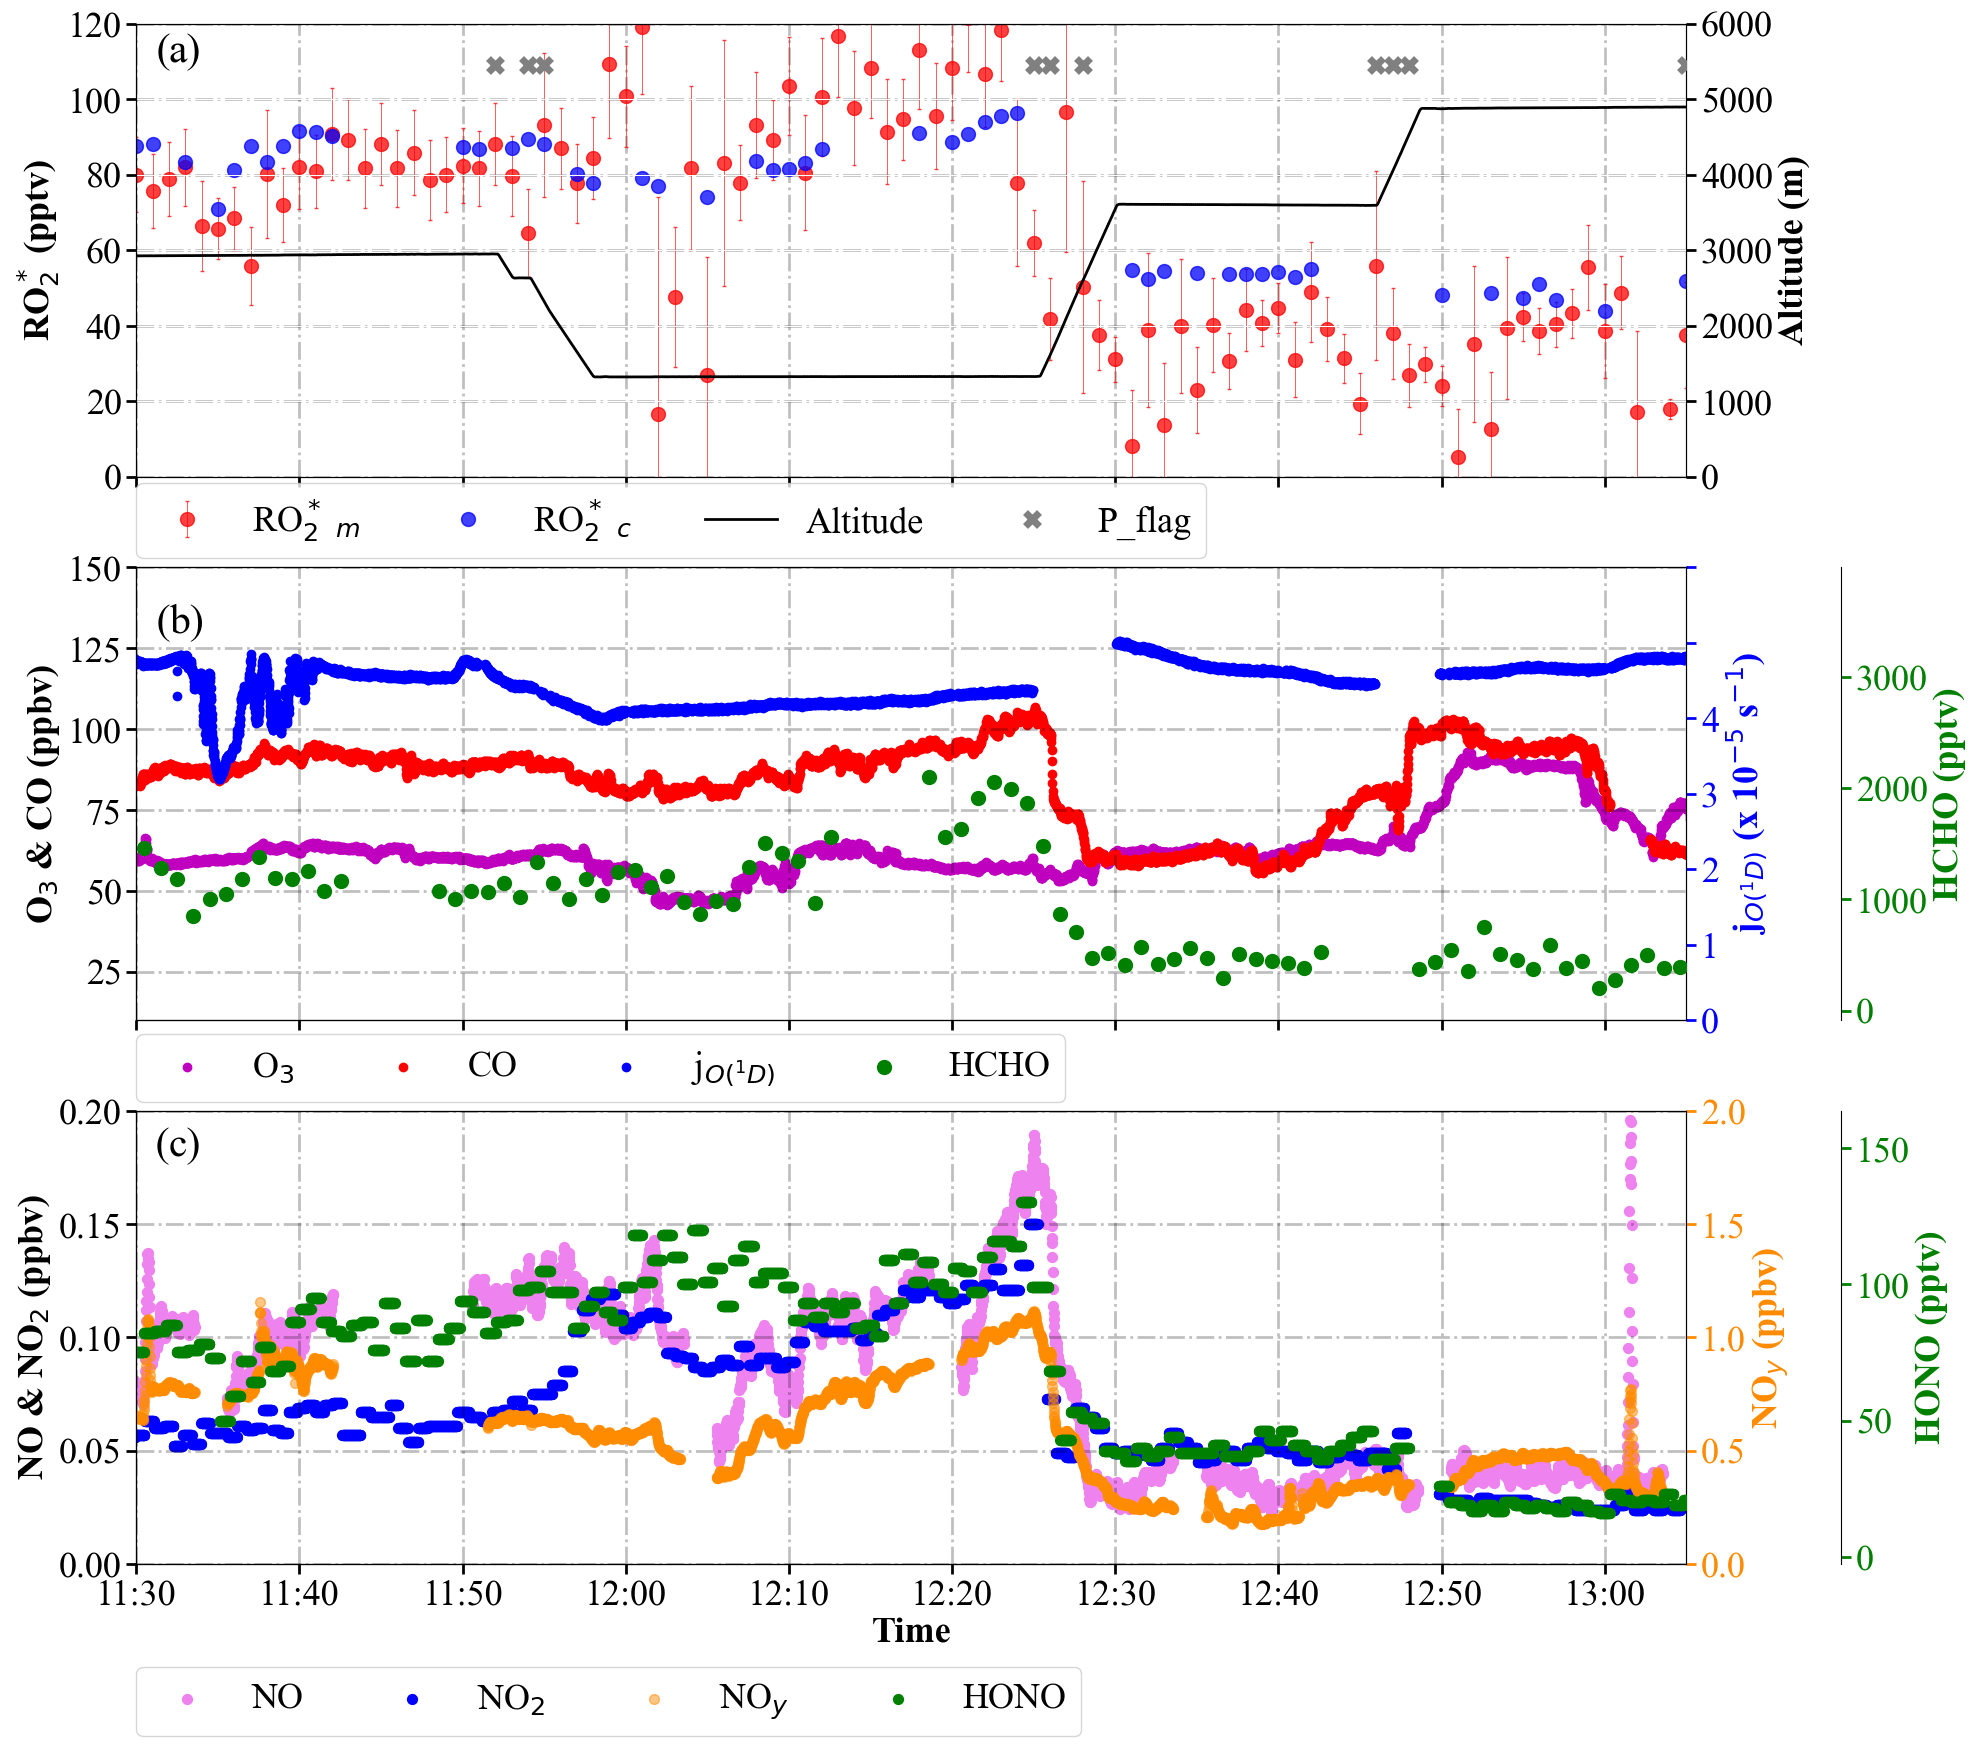
Figure 15Temporal variation of and , selected radical precursors, and along the E-EU-03 flight track: (a) and mixing ratios. The flight altitude is indicated in black. The P_flag indicates measurements affected by dynamical pressure variation in the inlet; (b) O3, CO, HCHO mixing ratios, and ; (c) NO, NO2, NOy, and HONO mixing ratios.
4.4 Comparison of results with other studies
4.4.1 production rate
Cantrell et al. (2003b) proposed that the production of , , is equal to the sum of two terms representing – reactions and the –NOx reactions in the troposphere. As a result of this assumption, these authors describe the relationship between HO2, RO2, , and NOx as
where kRR and kRN refer to effective rate coefficients for – and –NOx reactions, respectively, and are calculated as fit parameters. Solving Eq. (10) for [HO2+RO2]2 leads to
where and where . For low NOx and/or high , B becomes negligible compared to A. Then [HO2+RO2] approaches and is independent of NOx. For high NOx and/or low , [HO2+RO2] approaches zero.
The and values for the EMeRGe observations in Europe, binned in 0.1 pptv s−1 intervals, were fitted according to the procedure by Cantrell et al. (2003b), and the results are shown in Fig. 16. The obtained fit parameters for Fig. 16a and b are and . The calculated by Eq. (9) appears to be close to the linear function of the NOx measured. Similar to the results of the study by Cantrell et al. (2003b), a decrease in with NOx is identified for NOx>1000 pptv. does not show any decrease with increase in NOx for pptv s−1. This might be explained by the underestimation of radical losses through organic nitrate formation in Eq. (9) as explained in Sect. 4.3.
Despite the low agreement of the fitted lines with the , a decrease in as a function of NOx is still observed. The disagreement between and the curves estimated using Eq. (11) implies that the simplified Eq. (10) from Cantrell et al. (2003b) is insufficient to adequately describe the chemical and physical processes occurring in the air masses probed. Part of the disagreement might arise from missing terms in the calculated using Eq. (3) or inaccuracies related to the NO to NO2 ratio in the air mass, which are more evident at higher . As expected, the ratio of calculated [] to has a negative linear dependence on the measured [NOx] (see Fig. 16c). The comparable relationship of to [NOx] is not linear for NOx<100 pptv approximately (see Fig. 16d). This indicates that the simplified approach by Cantrell et al. (2003b) is not applicable to the more complex non-linear processes involved in the air masses investigated within EMeRGe.
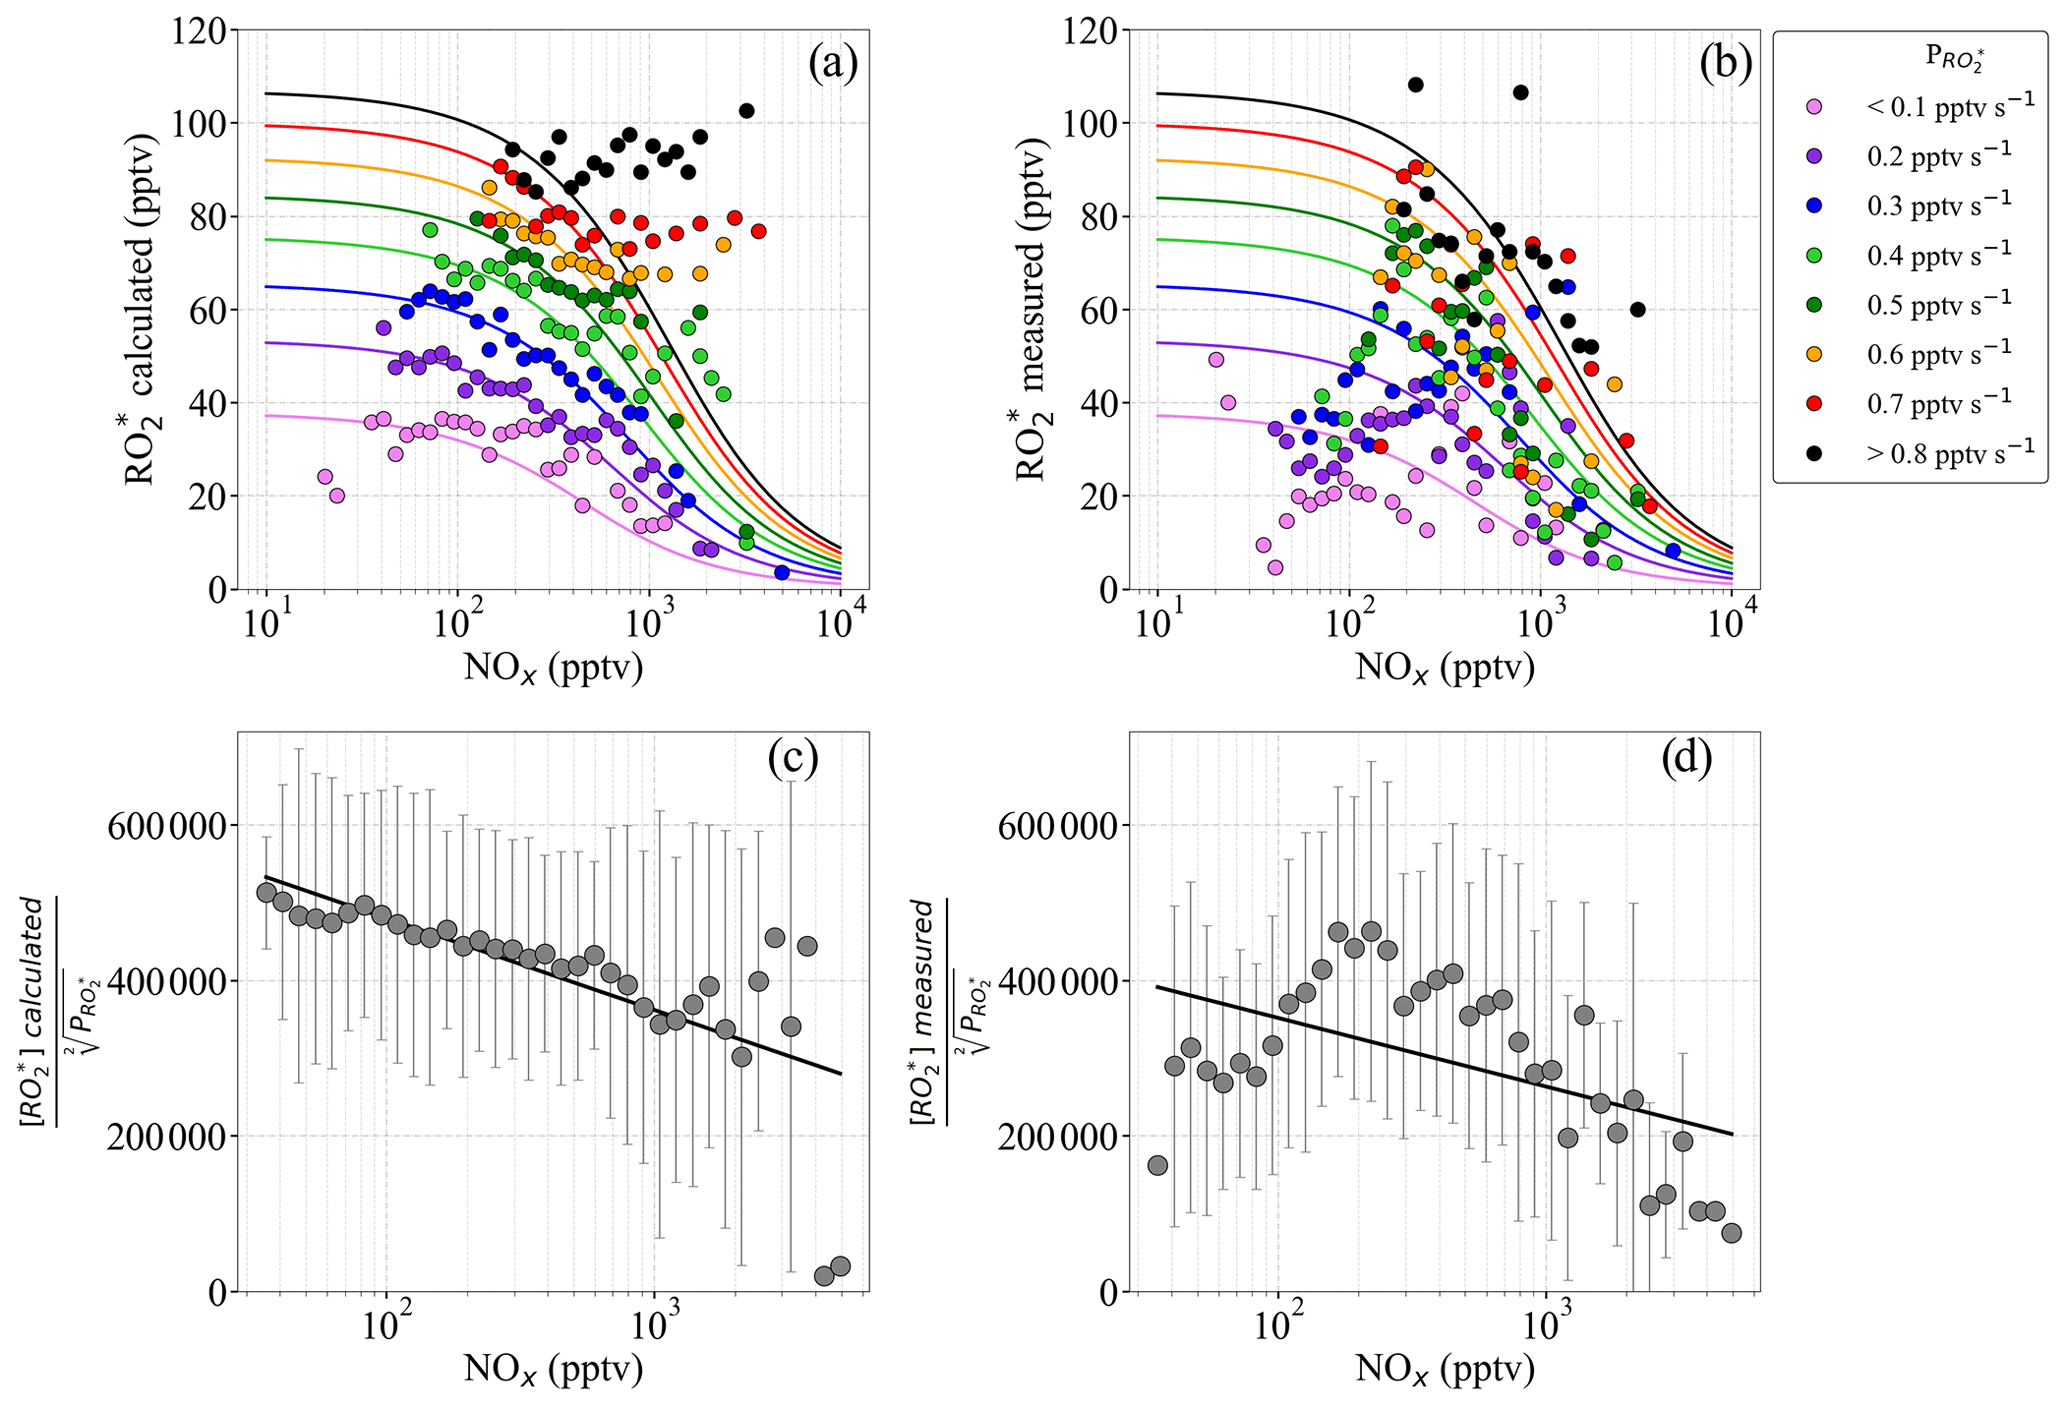
Figure 16(a) binned into intervals of 0.1 pptv s−1 versus binned NOx; (b) binned into intervals of 0.1 pptv s−1 versus binned NOx; (c) ratio of to versus NOx; and (d) to ratio versus NOx. The data in panels (a) and (b) are assigned different colours, as a function of the radical production rate interval. The NOx observations are binned into 50 equidistant intervals on a logarithmic scale. The solid lines in panels (a) and (b) are the least square fits, obtained using Eq. (10). In panels (c) and (d), the ratios of to and to are binned into 50 NOx intervals equidistant on the logarithmic scale from 10 to 10 000 pptv. Error bars indicate the ±1σ standard deviation for the distribution in each bin.
4.4.2 O3 production rate
The O3 production rate ( is calculated from the EMeRGe Europe data set using the reaction of with NO in a similar manner to that used in previous studies of photochemical processes in urban environments (e.g. Kleinman et al., 1995; Volz-Thomas et al., 2003; Mihelcic et al., 2003; Cantrell et al., 2003b; and references herein).
where is taken as the average of and .
Figure 17 shows the mean calculated using Eq. (12) from and as a function of NO. The measured NO mixing ratios are binned into 50 bins. The bin size increases with NO to keep the points equidistant on the logarithmic scale. The calculated values for the and agree well within the standard deviation of the bins.
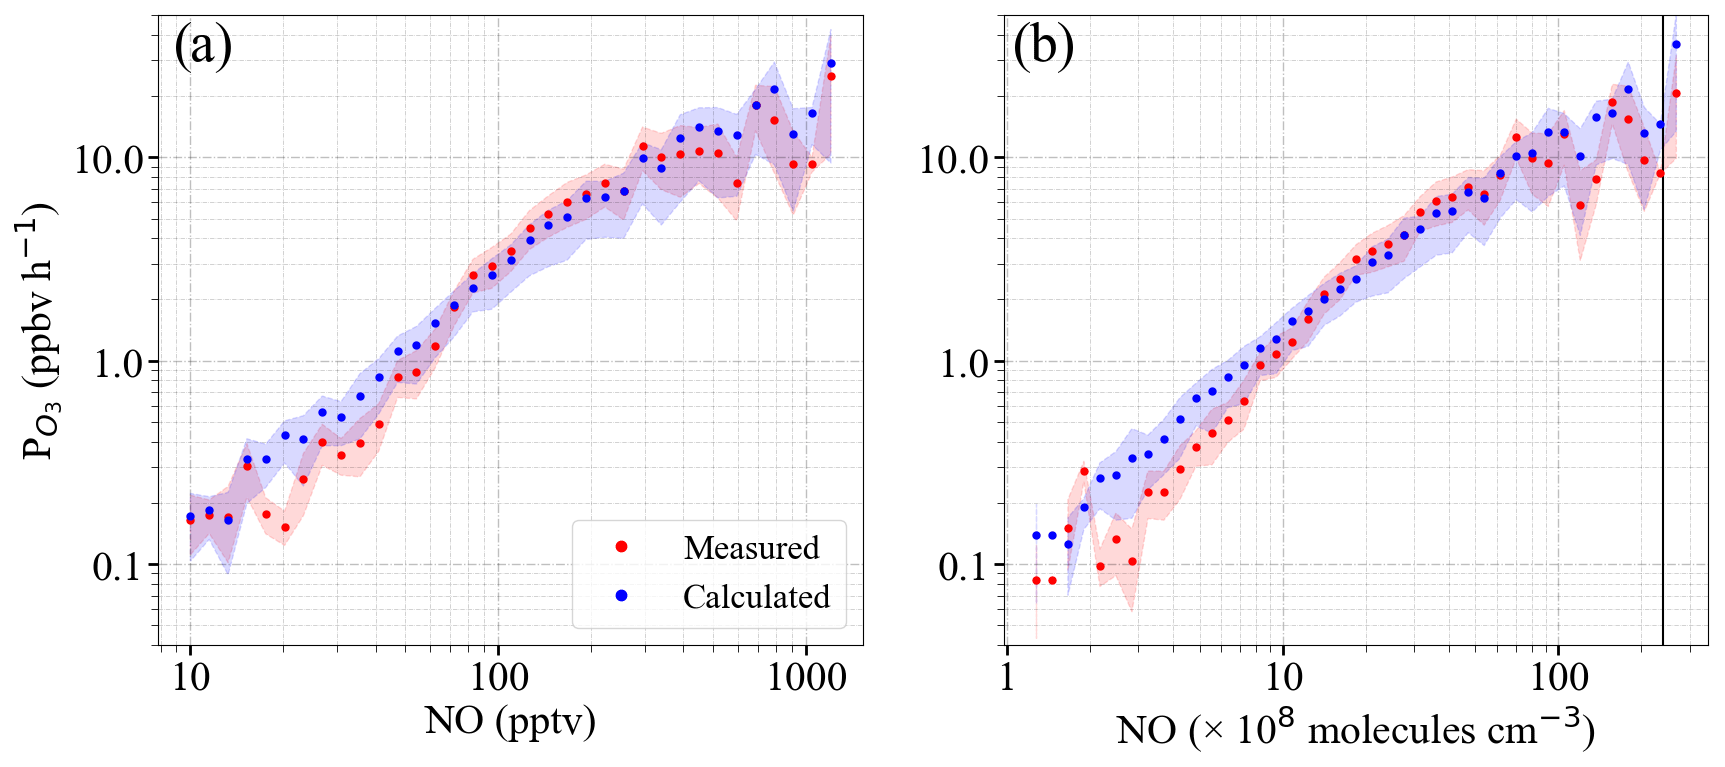
Figure 17Calculated O3 production rate ( determined using (red dots) and (blue dots) as a function of the following: (a) NO mixing ratio and (b) NO number density. The 1 min measurements are binned into 50 bins of NO equidistant on the logarithmic scale for panel (a) from 10 to 10 000 pptv and for panel (b) from 5×10⁷ to 3.5×10¹⁰ molecules cm−3, respectively. The shaded area shows the ±1σ standard deviation of each bin. To facilitate comparison with ground-based measurements, the black line plotted in panel (b) is the number density corresponding to 1 ppbv NO at 1000 mbar and 25 ∘C.
Similar values have been reported for ground-based measurements in polluted areas such as Wangdu (Tan et al., 2017) and Beijing (Whalley et al., 2021) and similar ranges of peroxy radicals and NO mixing ratios. In previous work, Whalley et al. (2018) calculated to be about an order of magnitude lower than that found in this study from observations in central London for about an order of magnitude lower amount of HO2+RO2. For NO >1 ppbv, the estimated from the measurement of HO2 and RO2 or from the assumptions of an HO2 to RO2 ratio were underestimated by the models in other studies in the urban atmosphere (e.g. Martinez et al., 2003; Ren et al., 2003; Kanaya et al., 2008; Mao et al., 2010; Kanaya et al., 2012; Ren et al., 2013; Brune et al., 2016; Griffith et al., 2016). This behaviour is generally attributed to an underestimate of the concentration of RO2 with a large organic group, which likely undergoes multiple bimolecular reactions with NO before forming an HO2 radical.
During the EMeRGe campaign in Europe, the NO mixing ratios were <1 ppbv (approximately molecules cm−3). The ozone production rates obtained for both and are in reasonable agreement with other modelling studies in urban environments where the mixing ratio of NO is <1 ppbv (Tan et al., 2017; Whalley et al., 2021).
This study exploits the airborne measurements of various atmospheric constituents on board HALO over Europe in summer 2017 to investigate radical photochemistry in the probed air masses. values are calculated by assuming a photostationary steady state (PSS) of and are compared with the actual measurements. The calculation is constrained by the simultaneous airborne measurements of radical precursors, photolysis frequencies, and reactants of such as NOx and O3. The calculated radical production rates, , do not significantly vary with altitude in the air masses investigated as the increase in the photolysis frequencies as a function of altitude is concurrent with decreases in precursor concentrations.
The significance and the importance of selected initiating and terminating processes in the chemistry are investigated by gradually increasing the complexity of the analytical expression. The agreement of the calculations with the measurements over a wide range of chemical composition and insolation conditions improves when the analytical expression is extended to account for effective radical yields from VOC oxidation and radical losses through nitrate and nitrite formation. The measured is usually overestimated when NO is <50 pptv in the air probed. This behaviour might be explained by loss processes involving reactions with OH (e.g. the reaction of HO2 with OH but possibly to a lesser extent the three-body reaction of OH with itself to make H2O2). These reactions may become significant loss processes at low NO concentrations as measured during the campaign but are excluded from the analytical expression, which is constrained by onboard measurements. Similarly, the RO2 loss through organic nitrate is also excluded from the analytical expression. These reactions may become significant loss processes in the presence of RO2 with organic groups larger than CH3. This might explain some of the overestimations by the analytical expression observed for NO >200 pptv.
The calculated under assumption of a photostationary state mostly underestimated the measured in polluted plumes of urban origin at altitudes below 2000 m. Changes in the HO2 to RO2 ratios in different plumes can account for the disagreement in particular cases. In pollution plumes with the sum of the OVOCs measured mixing ratios being higher than 7 ppbv approximately, the underestimation of the measurements can reach up to 80 %. In these plumes, the oxidation and/or photolysis of VOCs, which were not measured, and the ozonolysis of alkenes might be significant sources of , limiting the accuracy of the analytical expression. More information about peroxy radical speciation and VOC partitioning is required to better describe the fast photochemistry in these pollution plumes.
However, the analytical expression developed is robust enough to simulate the radical chemistry in most of the conditions in the free troposphere encountered during EMeRGe in Europe. Speciated radical and VOC measurements in future campaigns would facilitate the estimation of radical loss reactions in air masses having NO <50 pptv and improve radical production rate estimations in pollution plumes having a high amount of VOCs, where non-linear complex chemistry is involved. Comparing measurements with calculations from the analytical expression helps to identify different chemical and physical regimes, which can be used to constrain future model studies.
The calculated O3 production rates for NO <1 ppbv are in the same order of magnitude as those previously reported for urban environments. This indicates that the selected production and loss processes and observations of the radical precursors on board are, to a good approximation, adequate for the estimation of the O3 production in the measured air masses in the free troposphere over Europe.
The EMeRGe data are available at the HALO database (https://doi.org/10.17616/R39Q0T, re3data.org, 2022) and can be accessed upon registration. Further data can be made available upon request to the corresponding author.
The supplement related to this article is available online at: https://doi.org/10.5194/acp-23-7799-2023-supplement.
MG, VN, and YL undertook the measurements, flying as key scientists on board HALO. VN led the deployment of PeRCEAS in the HALO aircraft. MG led the analysis of the PeRCEAS measurements and prepared the manuscript with contributions from all co-authors. MDAH and JPB initiated the EMeRGe research project and consortium, acted as co-principal and principal investigators, and participated in the measurement campaigns. They developed the overarching EMeRGe scientific objectives and the required measurement portfolio, directed the EMeRGe research campaigns, and participated in the data analysis presented. AZ, BB, BS, EF, FO, FK, HS, HZ, KB, KP, and TH have contributed by providing their measurements made on board HALO during the campaign and participated in the discussion of results.
The contact author has declared that none of the authors has any competing interests.
Publisher's note: Copernicus Publications remains neutral with regard to jurisdictional claims in published maps and institutional affiliations.
This article is part of the special issue “Effect of Megacities on the Transport and Transformation of Pollutants at Regional and Global Scales (EMeRGe) (ACP/AMT inter-journal SI)”. It is not associated with a conference.
The authors thank the DLRFX and HALO EMeRGe teams for the HALO flight organisation and implementation. Special thanks are given to Lisa Kaser, Frank Probst, Michael Großrubatscher, Stefan Grillenbeck, and Marc Puskeiler for flight coordination and planning; to Alexander Wolf and Thomas Leder, the flight engineers; and to the BAHAMAS team. The authors also thank enviscope GmbH, in particular Nicole Brehm and Rolf Maser, for the support during the integration and preparation phase of the IOP in Europe.
Midhun George, M. Dolores Andrés Hernández, Vladyslav Nenakhov, Yangzhuoran Liu, and John Phillip Burrows thank Wilke Thomssen for support during the preparation and integration phases of EMeRGe and Heiko Schellhorn for continuous technical support and retrieval of model data during the campaigns.
The study was funded in part by the German Research Foundation (Deutsche
Forschungsgemeinschaft; DFG) HALO-SPP 1294, as well as the University of Bremen and the State of
Bremen, IPA, DLR, Oberpfaffenhofen, Germany. The contributions from Benjamin Schreiner, Flora Kluge,
and Klaus Pfeilsticker were supported via the DFG (grant nos. PF 384/16, PF 384/17 and PF 384/19).
KB was granted funding via the DFG (grant no. Pl 193/21-1) and received
additional financial from the Heidelberg Graduate School for Physics. Eric Förster was
supported via the DFG (grant no. NE 2150/1-1) and received additional
financial support from the Karlsruhe Institute of Technology. Midhun George, Yangzhuoran Liu, Maria Dolores Andrés Hernández,
and John Philip Burrows received financial support from the University of Bremen.
The article processing charges for this open-access publication were covered by the University of Bremen.
This paper was edited by Barbara Ervens and Nga Lee Ng and reviewed by four anonymous referees.
Andrés-Hernández, M. D., Kartal, D., Reichert, L., Burrows, J. P., Meyer Arnek, J., Lichtenstern, M., Stock, P., and Schlager, H.: Peroxy radical observations over West Africa during AMMA 2006: photochemical activity in the outflow of convective systems, Atmos. Chem. Phys., 9, 3681–3695, https://doi.org/10.5194/acp-9-3681-2009, 2009.
Andrés Hernández, M. D., Hilboll, A., Ziereis, H., Förster, E., Krüger, O. O., Kaiser, K., Schneider, J., Barnaba, F., Vrekoussis, M., Schmidt, J., Huntrieser, H., Blechschmidt, A.-M., George, M., Nenakhov, V., Harlass, T., Holanda, B. A., Wolf, J., Eirenschmalz, L., Krebsbach, M., Pöhlker, M. L., Kalisz Hedegaard, A. B., Mei, L., Pfeilsticker, K., Liu, Y., Koppmann, R., Schlager, H., Bohn, B., Schumann, U., Richter, A., Schreiner, B., Sauer, D., Baumann, R., Mertens, M., Jöckel, P., Kilian, M., Stratmann, G., Pöhlker, C., Campanelli, M., Pandolfi, M., Sicard, M., Gómez-Amo, J. L., Pujadas, M., Bigge, K., Kluge, F., Schwarz, A., Daskalakis, N., Walter, D., Zahn, A., Pöschl, U., Bönisch, H., Borrmann, S., Platt, U., and Burrows, J. P.: Overview: On the transport and transformation of pollutants in the outflow of major population centres – observational data from the EMeRGe European intensive operational period in summer 2017, Atmos. Chem. Phys., 22, 5877–5924, https://doi.org/10.5194/acp-22-5877-2022, 2022.
Bohn, B. and Lohse, I.: Calibration and evaluation of CCD spectroradiometers for ground-based and airborne measurements of spectral actinic flux densities, Atmos. Meas. Tech., 10, 3151–3174, https://doi.org/10.5194/amt-10-3151-2017, 2017.
Brito, J. and Zahn, A.: An unheated permeation device for calibrating atmospheric VOC measurements, Atmos. Meas. Tech., 4, 2143–2152, https://doi.org/10.5194/amt-4-2143-2011, 2011.
Brune, W. H., Baier, B. C., Thomas, J., Ren, X., Cohen, R. C., Pusede, S. E., Browne, E. C., Goldstein, A. H., Gentner, D. R., Keutsch, F. N., Thornton, J. A., Harrold, S., Lopez-Hilfiker, F. D., and Wennberg, P. O.: Ozone production chemistry in the presence of urban plumes, Faraday Discuss., 189, 169–189, https://doi.org/10.1039/c5fd00204d, 2016.
Burkholder, J. B., Sander, S. P., Abbatt, J., Barker, J. R., Cappa, C., Crounse, J. D., Dibble, T. S., Huie, R. E., Kolb, C. E., Kurylo, M. J., Orkin, V. L. Wilmouth, D. M., and Wine P. H.: Chemical Kinetics and Photochemical Data for Use in Atmospheric Studies, Evaluation No. 19, JPL Publication 19-5, Jet Propulsion Laboratory, Pasadena, http://jpldataeval.jpl.nasa.gov (last access: 29 June 2023), 2019.
Cantrell, C. A., Shetter, R. E., Calvert, J. G., Eisele, F. L., Williams, E., Baumann, K., Brune, W. H., Stevens, P. S., and Mather J. H.: Peroxy radicals from photostationary state deviations and steady state calculations during the Tropospheric OH Photochemistry Experiment at Idaho Hill, Colorado, 1993, J. Geophys. Res., 102, 6369, https://doi.org/10.1029/96JD01703, 1997.
Cantrell, C. A., Edwards, G. D., Stephens, S., Mauldin, L., Kosciuch, E., Zondlo, M., and Eisele, F.: Peroxy radical observations using chemical ionisation mass spectrometry during TOPSE, J. Geophys. Res., 108, 8381, https://doi.org/10.1029/2002JD002715, 2003a.
Cantrell, C. A., Edwards, G. D., Stephens, S., Mauldin, R. L., Zondlo, M. A., Kosciuch, E., Eisele, F. L., Shetter, R. E., Lefer, B. L., Hall, S., Flocke, F., Weinheimer, A., Fried, A., Apel, E., Kondo, Y., Blake, D. R., Blake, N. J., Simpson, I. J., Bandy, A. R., Thornton, D. C., Heikes, B. G., Singh, H. B., Brune, W. H., Harder, H., Martinez, M., Jacob, D. J., Avery, M. A., Barrick, J. D., Sachse, G. W., Olson, J. R., Crawford, J. H., and Clarke, A. D.: Peroxy radical behaviour during the Transport and Chemical Evolution over the Pacific (TRACE-P) campaign as measured aboard the NASA -3B aircraft, J. Geophys. Res., 108, 8797, https://doi.org/10.1029/2003JD003674, 2003b.
Carpenter, L. J., Clemitshaw, K. C., Burgess, R. A., Penkett, S. A., Cape, J. N., and McFadyen, G. C.: Investigation and evaluation of the photochemical steady state, Atmos. Environ., 32, 3353–3365, https://doi.org/10.1016/S1352-2310(97)00416-0, 1998.
Chen, H., Winderlich, J., Gerbig, C., Hoefer, A., Rella, C. W., Crosson, E. R., Van Pelt, A. D., Steinbach, J., Kolle, O., Beck, V., Daube, B. C., Gottlieb, E. W., Chow, V. Y., Santoni, G. W., and Wofsy, S. C.: High-accuracy continuous airborne measurements of greenhouse gases (CO2 and CH4) using the cavity ring-down spectroscopy (CRDS) technique, Atmos. Meas. Tech., 3, 375–386, https://doi.org/10.5194/amt-3-375-2010, 2010.
Crawford, J., Davis, D., Olson, J., Chen, G., Liu, S., Gregory, G., Barrick, J., Sachse, G., Sandholm, S., Heikes, B., Singh, H., and Blake, D.: Assessment of upper tropospheric HOx sources over the tropical Pacific based on NASA GTE/PEM data: Net effect on HOx and other photochemical parameters, J. Geophys. Res., 104, 16255–16273, https://doi.org/10.1029/1999JD900106, 1999.
Elshorbany, Y. F., Kleffmann, J., Hofzumahaus, A., Kurtenbach, R., Wiesen, P., Brauers, T., Bohn, B., Dorn, H.-P., Fuchs, H., Holland, F., Rohrer, F., Tillmann, R., Wegener, R., Wahner, A., Kanaya, Y., Yoshino, A., Nishida, S., Kajii, Y., Martinez, M., Kubistin, D., Harder, H., Lelieveld, J., Elste, T., Plass-Dülmer, C., Stange, G., Berresheim, H., and Schurath, U.: HOx budgets during HOxComp: A case study of HOx chemistry under NOx-limited conditions, J. Geophys. Res.-Atmos., 117, D03307, https://doi.org/10.1029/2011JD017008, 2012.
General, S., Pöhler, D., Sihler, H., Bobrowski, N., Frieß, U., Zielcke, J., Horbanski, M., Shepson, P. B., Stirm, B. H., Simpson, W. R., Weber, K., Fischer, C., and Platt, U.: The Heidelberg Airborne Imaging DOAS Instrument (HAIDI) – a novel imaging DOAS device for 2-D and 3-D imaging of trace gases and aerosols, Atmos. Meas. Tech., 7, 3459–3485, https://doi.org/10.5194/amt-7-3459-2014, 2014.
George, M.: Airborne measurement and interpretation of peroxy radical concentrations with a focus on the oxidation mechanisms in the Asian free troposphere, PhD thesis, University of Bremen, https://doi.org/10.26092/elib/1639, 2022.
George, M., Andrés Hernández, M. D., Nenakhov, V., Liu, Y., and Burrows, J. P.: Airborne measurement of peroxy radicals using chemical amplification coupled with cavity ring-down spectroscopy: the PeRCEAS instrument, Atmos. Meas. Tech., 13, 2577–2600, https://doi.org/10.5194/amt-13-2577-2020, 2020.
Gerbig, C., Kley, D., Volz-Thomas, A., Kent, J., Dewey, K., and McKenna, D. S.: Fast response resonance fluorescence CO measurements aboard the C-130: Instrument characterisation and measurements made during North Atlantic Regional Experiment 1993, J. Geophys. Res., 101, 29229–29238, 1996.
Griffith, S. M., Hansen, R. F., Dusanter, S., Michoud, V., Gilman, J. B., Kuster, W. C., Veres, P. R., Graus, M., de Gouw, J. A., Roberts, J., Young, C., Washenfelder, R., Brown, S. S., Thalman, R., Waxman, E., Volkamer, R., Tsai, C., Stutz, J., Flynn, J. H., Grossberg, N., Lefer, B., Alvarez, S. L., Rappenglueck, B., Mielke, L. H., Osthoff, H. D., and Stevens, P. S.: Measurements of Hydroxyl and Hydroperoxy Radicals during CalNexLA: Model Comparisons and Radical Budgets, J. Geophys. Res.-Atmos., 121, 4211–4232, https://doi.org/10.1002/2015JD024358, 2016.
Horstjann, M., Andrés Hernández, M. D., Nenakhov, V., Chrobry, A., and Burrows, J. P.: Peroxy radical detection for airborne atmospheric measurements using absorption spectroscopy of NO2, Atmos. Meas. Tech., 7, 1245–1257, https://doi.org/10.5194/amt-7-1245-2014, 2014.
Hüneke, T., Aderhold, O.-A., Bounin, J., Dorf, M., Gentry, E., Grossmann, K., Grooß, J.-U., Hoor, P., Jöckel, P., Kenntner, M., Knapp, M., Knecht, M., Lörks, D., Ludmann, S., Matthes, S., Raecke, R., Reichert, M., Weimar, J., Werner, B., Zahn, A., Ziereis, H., and Pfeilsticker, K.: The novel HALO mini-DOAS instrument: inferring trace gas concentrations from airborne UV/visible limb spectroscopy under all skies using the scaling method, Atmos. Meas. Tech., 10, 4209–4234, https://doi.org/10.5194/amt-10-4209-2017, 2017.
Inomata, S., Tanimoto, H., Kameyama, S., Tsunogai, U., Irie, H., Kanaya, Y., and Wang, Z.: Technical Note: Determination of formaldehyde mixing ratios in air with PTR-MS: laboratory experiments and field measurements, Atmos. Chem. Phys., 8, 273–284, https://doi.org/10.5194/acp-8-273-2008, 2008.
Kanaya, Y., Cao, R., Akimoto, H., Fukuda, M., Komazaki, Y., Yokouchi, Y., Koike, M., Tanimoto, H., Takegawa, N., and Kondo, Y.: Urban photochemistry in central Tokyo: 1. Observed and modeled OH and HO2 radical concentrations during the winter and summer of 2004, J. Geophys. Res.-Atmos., 112, D21312, https://doi.org/10.1029/2007jd008670, 2007.
Kanaya, Y., Fukuda, M., Akimoto, H., Takegawa, N., Komazaki, Y., Yokouchi, Y., Koike, M., and Kondo, Y.: Urban photochemistry in central Tokyo: 2. Rates and regimes of oxidant (O3 + NO2) production, J. Geophys. Res., 113, D06301, https://doi.org/10.1029/2007JD008671, 2008.
Kanaya, Y., Hofzumahaus, A., Dorn, H.-P., Brauers, T., Fuchs, H., Holland, F., Rohrer, F., Bohn, B., Tillmann, R., Wegener, R., Wahner, A., Kajii, Y., Miyamoto, K., Nishida, S., Watanabe, K., Yoshino, A., Kubistin, D., Martinez, M., Rudolf, M., Harder, H., Berresheim, H., Elste, T., Plass-Dülmer, C., Stange, G., Kleffmann, J., Elshorbany, Y., and Schurath, U.: Comparisons of observed and modeled OH and HO2 concentrations during the ambient measurement period of the HOxComp field campaign, Atmos. Chem. Phys., 12, 2567–2585, https://doi.org/10.5194/acp-12-2567-2012, 2012.
Kartal, D., Andrés-Hernández, M. D., Reichert, L., Schlager, H., and Burrows, J. P.: Technical Note: Characterisation of a DUALER instrument for the airborne measurement of peroxy radicals during AMMA 2006, Atmos. Chem. Phys., 10, 3047–3062, https://doi.org/10.5194/acp-10-3047-2010, 2010.
Kleinman, L., Lee, Y.-N., Springston, S. R., Lee, J. H., Nunnermacker, L., Weinstein-Lloyd, J., Zhou, X., and Newman, L.: Peroxy radical concentration and ozone formation rate at a rural site in southeastern United States, J. Geophys. Res., 100, 7263–7273, 1995.
Kluge, F., Hüneke, T., Knecht, M., Lichtenstern, M., Rotermund, M., Schlager, H., Schreiner, B., and Pfeilsticker, K.: Profiling of formaldehyde, glyoxal, methylglyoxal, and CO over the Amazon: normalized excess mixing ratios and related emission factors in biomass burning plumes, Atmos. Chem. Phys., 20, 12363–12389, https://doi.org/10.5194/acp-20-12363-2020, 2020.
Lew, M. M., Rickly, P. S., Bottorff, B. P., Reidy, E., Sklaveniti, S., Léonardis, T., Locoge, N., Dusanter, S., Kundu, S., Wood, E., and Stevens, P. S.: OH and HO2 radical chemistry in a midlatitude forest: measurements and model comparisons, Atmos. Chem. Phys., 20, 9209–9230, https://doi.org/10.5194/acp-20-9209-2020, 2020.
Lu, K. D., Rohrer, F., Holland, F., Fuchs, H., Bohn, B., Brauers, T., Chang, C. C., Häseler, R., Hu, M., Kita, K., Kondo, Y., Li, X., Lou, S. R., Nehr, S., Shao, M., Zeng, L. M., Wahner, A., Zhang, Y. H., and Hofzumahaus, A.: Observation and modelling of OH and HO2 concentrations in the Pearl River Delta 2006: a missing OH source in a VOC rich atmosphere, Atmos. Chem. Phys., 12, 1541–1569, https://doi.org/10.5194/acp-12-1541-2012, 2012.
Lu, K. D., Hofzumahaus, A., Holland, F., Bohn, B., Brauers, T., Fuchs, H., Hu, M., Häseler, R., Kita, K., Kondo, Y., Li, X., Lou, S. R., Oebel, A., Shao, M., Zeng, L. M., Wahner, A., Zhu, T., Zhang, Y. H., and Rohrer, F.: Missing OH source in a suburban environment near Beijing: observed and modelled OH and HO2 concentrations in summer 2006, Atmos. Chem. Phys., 13, 1057–1080, https://doi.org/10.5194/acp-13-1057-2013, 2013.
Mallaun, C., Giez, A., and Baumann, R.: Calibration of 3-D wind measurements on a single-engine research aircraft, Atmos. Meas. Tech., 8, 3177–3196, https://doi.org/10.5194/amt-8-3177-2015, 2015.
Mao, J., Jacob, D. J., Evans, M. J., Olson, J. R., Ren, X., Brune, W. H., Clair, J. M. St., Crounse, J. D., Spencer, K. M., Beaver, M. R., Wennberg, P. O., Cubison, M. J., Jimenez, J. L., Fried, A., Weibring, P., Walega, J. G., Hall, S. R., Weinheimer, A. J., Cohen, R. C., Chen, G., Crawford, J. H., McNaughton, C., Clarke, A. D., Jaeglé, L., Fisher, J. A., Yantosca, R. M., Le Sager, P., and Carouge, C.: Chemistry of hydrogen oxide radicals (HOx) in the Arctic troposphere in spring, Atmos. Chem. Phys., 10, 5823–5838, https://doi.org/10.5194/acp-10-5823-2010, 2010.
Martinez, M., Harder, H., Kovacs, T. A., Simpas, J. B., Bassis, J., Lesher, R., Brune, W. H., Frost, G. J., Williams, E. J., Stroud, C. A., Jobson, B. T., Roberts, J. M., Hall, S. R., Shetter, R. E., Wert, B., Fried, A., Alicke, B., Stutz, J., Young, V. L., White, A. B., and Zamora, R. J.: OH and HO2 concentrations, sources, and loss rates during the Southern Oxidants Study in Nashville, Tennessee, summer 1999, J. Geophys. Res.-Atmos., 108, 4617, https://doi.org/10.1029/2003jd003551, 2003.
Mihelcic, D., Holland, F., Hofzumahaus, A., Hoppe, L., Konrad, S., Müsgen, P., Pätz, H.-W., Schäfer, H.-J., Schmitz, T., Volz-Thomas, A., Bächmann, K., Schlomski, S., Platt, U., Geyer, A., Alicke, B., and Moortgat, G. K.: Peroxy radicals during BERLIOZ at Pabstthum: Measurements, radical budgets and ozone production, J. Geophys. Res.-Atmos., 108, 8254, https://doi.org/10.1029/2001JD001014, 2003.
Mihele, C. M. and Hastie, D. R.: The sensitivity of the radical amplifier to ambient water vapour, Geophys. Res. Lett., 25, 1911–1913, https://doi.org/10.1029/98GL01432, 1998.
Mihele, C. M., Mozurkewich, M., and Hastie, D. R.: Radical loss in a chain reaction of CO and NO in the presence of water: Implications for the radical amplifier and atmospheric chemistry, Int. J. Chem. Kinet., 31, 145–152, https://doi.org/10.1002/(SICI)1097-4601(1999)31:2<145::AID-KIN7>3.0.CO;2-M, 1999.
Parrish, D. D., Trainer, M., Williams, E. J., Fahey, D. W., Hobler, G., Eubank, C. S., Liu, S.C., Murphy, P. C. , Albritton, D. L. and Fehsenfeld, F. C.: Measurements of the NOx-O3 photostationary state at Niwot Ridge, Colorado, J. Geophys. Res., 91, 5361–5370, 1986.
re3data.org: HALO database; editing status 2021-11-17, re3data.org – Registry of Research Data Repositories [data set], https://doi.org/10.17616/R39Q0T, 2022.
Reichert, L., Andrés Hernández, M. D., Stöbener, D., Burkert, J., and Burrows, J. P.: Investigation of the effect of water complexes in the determination of peroxy radical ambient concentrations: implications for the atmosphere, J. Geophys. Res, 108, 4017–4032, https://doi.org/10.1029/2002JD002152, 2003.
Ren, X., Harder, H., Martinez, M., Lesher, R. L., Oliger, A., Shirley, T., Adams, J., Simpas, J. B., and Brune, W. H.: HOX concentrations and OH reactivity observations in New York City during PMTACS-NY2001, Atmos. Environ., 37, 3627–3637, 2003.
Ren, X., van Duin, D., Cazorla, M., Chen, S., Mao, J., Zhang, L., Brune, W. H., Flynn, J. H., Grossberg, N., Lefer, B. L., Rappenglück, B., Wong, K. W., Tsai, C., Stutz, J., Dibb, J. E., Thomas Jobson, B., Luke, W. T., and Kelley, P.: Atmospheric oxidation chemistry and ozone production: Results from SHARP 2009 in Houston, Texas, J. Geophys. Res., 118, 5770–5780, https://doi.org/10.1002/jgrd.50342, 2013.
Ridley, B. A., Madronich, S., Chatfield, R. B., Walega, J. G., and Shetter, R. E.: Measurements and model simulations of the photostationary state during the Mauna Loa observatory photochemistry experiment: Implications for radical concentrations and ozone production and loss rates, J. Geophys. Res., 97, 10375–10388, 1992.
Rotermund, M. K., Bense, V., Chipperfield, M. P., Engel, A., Grooß, J.-U., Hoor, P., Hüneke, T., Keber, T., Kluge, F., Schreiner, B., Schuck, T., Vogel, B., Zahn, A., and Pfeilsticker, K.: Organic and inorganic bromine measurements around the extratropical tropopause and lowermost stratosphere: insights into the transport pathways and total bromine, Atmos. Chem. Phys., 21, 15375–15407, https://doi.org/10.5194/acp-21-15375-2021, 2021.
Schumann, U.: Measurement and model data comparisons for the HALO-FAAM formation flight during EMeRGe on 17 July 2017, Zenodo [data set], https://doi.org/10.5281/zenodo.4427965, 2020.
Stohl, A. and Seibert, P.: Accuracy of trajectories as determined from the conservation of meteorological tracers, Q. J. Roy. Meteor. Soc., 124, 1465–1484, https://doi.org/10.1256/smsqj.54906, 1998.
Stohl, A., Wotawa, G., Seibert, P., and Kromp-Kolb, H.: Interpolation Errors in Wind Fields as a Function of Spatial and Temporal Resolution and Their Impact on Different Types of Kinematic Trajectories, J. Appl. Meteorol., 34, 2149–2165, https://doi.org/10.1175/1520-0450(1995)034<2149:IEIWFA>2.0.CO;2, 1995.
Stutz, J., Werner, B., Spolaor, M., Scalone, L., Festa, J., Tsai, C., Cheung, R., Colosimo, S. F., Tricoli, U., Raecke, R., Hossaini, R., Chipperfield, M. P., Feng, W., Gao, R.-S., Hintsa, E. J., Elkins, J. W., Moore, F. L., Daube, B., Pittman, J., Wofsy, S., and Pfeilsticker, K.: A new Differential Optical Absorption Spectroscopy instrument to study atmospheric chemistry from a high-altitude unmanned aircraft, Atmos. Meas. Tech., 10, 1017–1042, https://doi.org/10.5194/amt-10-1017-2017, 2017.
Tan, D., Faloona, I., Simpas, J. B., Brune, W., Olson, J., Crawford, J., Avery, M., Sachse, G., Vay, S., Sandholm, S., Guan, H.-W., Vaughn, T., Mastromarino, J., Heikes, B., Snow, J., Podolske, J., and Singh, H.: OH and HO2 in the tropical Pacific: Results from PEMTropics B, J. Geophys. Res., 106, 32667–32681, 2001.
Tan, Z., Fuchs, H., Lu, K., Hofzumahaus, A., Bohn, B., Broch, S., Dong, H., Gomm, S., Häseler, R., He, L., Holland, F., Li, X., Liu, Y., Lu, S., Rohrer, F., Shao, M., Wang, B., Wang, M., Wu, Y., Zeng, L., Zhang, Y., Wahner, A., and Zhang, Y.: Radical chemistry at a rural site (Wangdu) in the North China Plain: observation and model calculations of OH, HO2 and RO2 radicals, Atmos. Chem. Phys., 17, 663–690, https://doi.org/10.5194/acp-17-663-2017, 2017.
Tan, Z., Rohrer, F., Lu, K., Ma, X., Bohn, B., Broch, S., Dong, H., Fuchs, H., Gkatzelis, G. I., Hofzumahaus, A., Holland, F., Li, X., Liu, Y., Liu, Y., Novelli, A., Shao, M., Wang, H., Wu, Y., Zeng, L., Hu, M., Kiendler-Scharr, A., Wahner, A., and Zhang, Y.: Wintertime photochemistry in Beijing: observations of ROx radical concentrations in the North China Plain during the BEST-ONE campaign, Atmos. Chem. Phys., 18, 12391–12411, https://doi.org/10.5194/acp-18-12391-2018, 2018.
Tan, Z., Lu, K., Hofzumahaus, A., Fuchs, H., Bohn, B., Holland, F., Liu, Y., Rohrer, F., Shao, M., Sun, K., Wu, Y., Zeng, L., Zhang, Y., Zou, Q., Kiendler-Scharr, A., Wahner, A., and Zhang, Y.: Experimental budgets of OH, HO2, and RO2 radicals and implications for ozone formation in the Pearl River Delta in China 2014, Atmos. Chem. Phys., 19, 7129–7150, https://doi.org/10.5194/acp-19-7129-2019, 2019.
Volz-Thomas, A., Pätz, H.-W., Houben, N., Konrad, S., Mihelcic, D., Klüpfel, T., and Perner, D.: Inorganic trace gases and peroxy radicals during BERLIOZ at Pabstthum: An investigation of the photostationary state of NOx and O3, J. Geophys. Res., 108, PHO 4-1, https://doi.org/10.1029/2001JD001255, 2003.
Whalley, L. K., Stone, D., Dunmore, R., Hamilton, J., Hopkins, J. R., Lee, J. D., Lewis, A. C., Williams, P., Kleffmann, J., Laufs, S., Woodward-Massey, R., and Heard, D. E.: Understanding in situ ozone production in the summertime through radical observations and modelling studies during the Clean air for London project (ClearfLo), Atmos. Chem. Phys., 18, 2547–2571, https://doi.org/10.5194/acp-18-2547-2018, 2018.
Whalley, L. K., Slater, E. J., Woodward-Massey, R., Ye, C., Lee, J. D., Squires, F., Hopkins, J. R., Dunmore, R. E., Shaw, M., Hamilton, J. F., Lewis, A. C., Mehra, A., Worrall, S. D., Bacak, A., Bannan, T. J., Coe, H., Percival, C. J., Ouyang, B., Jones, R. L., Crilley, L. R., Kramer, L. J., Bloss, W. J., Vu, T., Kotthaus, S., Grimmond, S., Sun, Y., Xu, W., Yue, S., Ren, L., Acton, W. J. F., Hewitt, C. N., Wang, X., Fu, P., and Heard, D. E.: Evaluating the sensitivity of radical chemistry and ozone formation to ambient VOCs and NOx in Beijing, Atmos. Chem. Phys., 21, 2125–2147, https://doi.org/10.5194/acp-21-2125-2021, 2021.
Zahn, A., Weppner, J., Widmann, H., Schlote-Holubek, K., Burger, B., Kühner, T., and Franke, H.: A fast and precise chemiluminescence ozone detector for eddy flux and airborne application, Atmos. Meas. Tech., 5, 363–375, https://doi.org/10.5194/amt-5-363-2012, 2012.
Zarzana, K. J., Min, K.-E., Washenfelder, R. A., Kaiser, J., Krawiec-Thayer, M., Peischl, J., Neuman, J. A., Nowak, J. B., Wagner, N. L., Dubè, W. P., St. Clair, J. M., Wolfe, G. M., Hanisco, T. F., Keutsch, F. N., Ryerson, T. B., and Brown, S. S.: Emissions of Glyoxal and Other Carbonyl Compounds from Agricultural Biomass Burning Plumes Sampled by Aircraft, Environ. Sci. Technol., 51, 11761–11770, https://doi.org/10.1021/acs.est.7b03517, 2017.
Ziereis, H., Minikin, A., Schlager, H., Gayet, J. F., Auriol, F., Stock, P., Baehr, J., Petzold, A., Schumann, U., Weinheimer, A., Ridley, B., and Ström, J.: Uptake of reactive nitrogen on cirrus cloud particles during INCA, Geophys. Res. Lett., 31, L05115, https://doi.org/10.1029/2003GL018794, 2004.
The CH3 produced from the oxidation of CH4 or the photolysis of VOCs further reacts with O2 to form CH3O2. The net or overall reaction is used, because the formation of CH3O2 is much faster than the CH3 formation due to the high amount of O2 present in the atmosphere.
H and CHO formed through the VOC photolysis further react with O2 to form HO2. The net or overall reaction is used, because the formation of HO2 is much faster than the H and CHO formation due to the high amount of O2 present in the atmosphere.
- Abstract
- Introduction
- EMeRGe field campaign in Europe
- PeRCEAS and other instruments on board HALO during EMeRGe
- Results and discussion
- Summary and conclusions
- Data availability
- Author contributions
- Competing interests
- Disclaimer
- Special issue statement
- Acknowledgements
- Financial support
- Review statement
- References
- Supplement