the Creative Commons Attribution 4.0 License.
the Creative Commons Attribution 4.0 License.
 | 14 Jul 2023
Spatiotemporal variation characteristics of global fires and their emissions
Xingchuan Yang
Yikun Yang
Zhenyao Shen
Intense regional fires are a common occurrence in the context of climate warming and have progressively evolved into one of the major natural disasters in terrestrial ecosystems, posing a serious hazard to the atmosphere and climate change. We investigated the spatial distribution, intensity, emission changes, and meteorological differences between fires in different fire-active and fire-prone regions globally based on multi-source satellite remote sensing fire data, emission data, and meteorological data in order to better understand the change trend of fire activity at multiple spatial and temporal scales. The findings demonstrate that while the burned area (BA) has decreased slowly over the last 20 years, the burned fraction (BF), the fire count (FC), and the fire radiative power (FRP) all exhibit pronounced regional and seasonal variations. The physical characteristics of fires, including the BF, FC, and FRP, experience greater seasonal variation as latitude increases, with summer and autumn being the seasons with the most frequent fire occurrence worldwide. This study also shows that the emissions declined substantially between 2012 and 2020 in northern Canada, Alaska, and northeastern China, whereas it notably increased in the Siberia region during the same period, primarily due to a rise in summer emissions. The results based on classification show that the difference in CO2 produced by fires among regions is relatively small. Excluding CO2, aerosol emissions (the total of organic carbon (OC), total carbon (TC), black carbon (BC)) ranged from 78.6 % to 84.2 %, while the least significant air pollutants (the total of PM2.5, SO2, and NOx) ranged from 5.8 % to 11.7 %. The abundance of vegetation predominately affects the intensity change in fire development, while the weather conditions can also indirectly influence the incidence of fire by altering the growth condition of vegetation. Correspondingly, the increase in temperature in the Northern Hemisphere's middle- and high-latitude forest regions is likely the major cause for the increase in fires and emissions, while the change in fires in tropical regions was largely influenced by the decrease in precipitation and relative humidity. This study contributes to the understanding of regional variations in fire activity and emission variability and provides support for the control of fire activity across regions and seasons.
- Article
(7028 KB) - Full-text XML
-
Supplement
(1060 KB) - BibTeX
- EndNote


A significant natural disturbance factor that can directly damage the surface vegetation and pose a serious threat to biodiversity is fire (Akagi et al., 2011; Requia et al., 2021; Turetsky et al., 2015). A lot of aerosols, greenhouse gases, and trace gases are released into the atmosphere during fires, which has an impact on the chemistry of the atmosphere and the carbon cycle in ecosystems (Bian et al., 2007; Fan et al., 2021; Jaffe et al., 2004; Permar et al., 2021; Turetsky et al., 2015). More studies are identifying wildfire as a significant contributor to global climate change as a result of the numerous negative effects it has on the atmospheric environment (Ding et al., 2021; Kaulfus et al., 2017; Liang et al., 2022).
Although fires have an impact on climate change, there is evidence that climate has an even greater impact on global biomass burning than human activities in some periods (Marlon et al., 2013). In addition to directly influencing the likelihood of fires, rainfall and temperature can indirectly modify vegetation productivity (i.e., fuel richness), which in turn influence the intensity of fires (Engelmann et al., 2021; Kloss et al., 2019; Yu and Ginoux, 2022). Rainfall before the growing season is frequently a significant barrier to fire activity in areas with limited biomass according to earlier literature (Govender et al., 2006; Jolly et al., 2015). However, in regions with a lot of biomass, the main causes of wildfire activity are high temperatures and seasonal drought (Bowman et al., 2020; Requia et al., 2021). Extreme and prolonged droughts caused by abnormal changes in the weather–climate system, such as El Niño, have long been a key driver of regional fires (Andela and van der Werf, 2014; Kloss et al., 2019). In addition to natural variables, human activities also have an impact on the occurrence and progression of fires. Land management and fire control strategies are among these activities, and they are also significantly influenced by population density, socioeconomic development, and surface landscape (Bistinas et al., 2014; van der Werf et al., 2006; Zheng et al., 2021).
Fires have a harmful effect on the climate and human society (Cascio, 2018; Li et al., 2021). On one hand, fires can substantially worsen air quality and endanger human health by spewing out harmful gases (Liu et al., 2021; O'Neill et al., 2021; Reid et al., 2016). For instance, while anthropogenic emissions of air pollutants in China considerably fell during the COVID-19 pandemic in early 2020, contaminants from fires on the Indochina Peninsula caused abnormal rises in PM2.5 and CO concentrations in southwestern China (Fan et al., 2021). Similar to this, large wildfires in southeastern Australia in 2019 led to an increase in aerosol optical density and carbonaceous aerosols of over 30 % (Ohneiser et al., 2022; Yang et al., 2021). Additionally, research has revealed that wildfire-produced aerosol particles raise the risk of premature death by an estimated 5 %–8 % globally, particularly in tropical locations where flames are more likely to endanger human life and property (Requia et al., 2021). Fires, on the other hand, create aerosols that can have an impact on local, regional, and even global radiation balances. For instance, the transport of Russian biomass burning aerosols over South Korea reduces solar radiation by 57 % (Lee et al., 2005).
In fact, a series of studies have been carried out on short-term wildfire events at the regional scale based on station observations, aircraft measurements, and model simulations (Bowman et al., 2020; Giglio et al., 2010; Lu et al., 2016; Yu and Ginoux, 2022). Researchers have also proposed indicators like fire count (FC) and burned area (BA) to describe the physical properties and processes of fires in order to better explain fire characteristics and discriminate different types of fires (Senande-Rivera et al., 2022; Zheng et al., 2021). The quantitative descriptions of fire events in various regions, however, are still extremely variable according to the findings of previous studies (Andela et al., 2017; Liang et al., 2022), necessitating further consideration of both global and regional factors and in-depth research into the reasons behind regional variations. In terms of BA, forest fires made up the majority of the area burned in equatorial Asia, followed by the North America. Savanna fires were extremely prevalent in Africa and considerably less prevalent in South America. Farmland fires were the most prevalent in Europe and the Middle East, while grassland fires were dominant in central Asia and South America (Giglio et al., 2013; van Wees et al., 2022). The majority of the world's regions, particularly those with forests at middle and high latitudes, will see a future with a higher danger of wildfires as global warming progresses (Yu and Ginoux, 2022; Zhu et al., 2021).
In the past decade or so, although the reduction in anthropogenic fires in tropical areas has led to a reduction in the global area of fires the trend in other regions is on the rise, the frequency of extreme wildfire events is increasing, and the difference in seasonal variation is more obvious (Bowman et al., 2020; Senande-Rivera et al., 2022; Zheng et al., 2021). Several recent studies (Huang et al., 2023; Xu et al., 2022) have found that the BA of wildfires on the West Coast of the United States and the Indochina Peninsula in Southeast Asia has increased and has significant synoptic-scale changes, and the strongest frequency spectra in these regions are on a timescale of 1 and 2 weeks, respectively. The former is controlled by wind speed and humidity, while the latter is mainly modulated by rainfall (Huang et al., 2023). Clearly, it is not enough just to target key regions with typical wildfire events, such as those in the western United States, Australia, and central Africa (Damoah et al., 2004; Xue et al., 2021; Yu et al., 2021). Meanwhile, the information regarding the emissions of various compounds caused by fires still has great uncertainty (Zhang et al., 2016; Zheng et al., 2021). Therefore, it is necessary to strengthen long-term, systematic investigations of fire frequency, intensity, and emission characteristics on a worldwide basis.
Based on multi-source remote sensing data and the Global Fire Assimilation System (GFAS), this study will systematically analyze the long-term changes in fire distribution, intensity, and emissions at global and regional scales. At the same time, this study will quantify the regional variations in fire characteristics and discover the importance of meteorological factors influencing the fire. The study intends to (1) quantify the patterns of worldwide distribution of fire count, area, and intensity; (2) examine the characteristics and regional variations in aerosols and greenhouse gases generated by fires; and (3) explore the potential reasons for these patterns and variations by integrating straightforward climatic indicators. This study adds to our understanding of worldwide and typical long-term trends in fire activity and multi-substance emissions and supports future predictions of fire and emission changes in various places. This paper is organized as follows. The primary summary is presented in Sect. 4 after Sect. 3 gives the results and discussions and Sect. 2 outlines the data and methods used in this study.
2.1 Study area
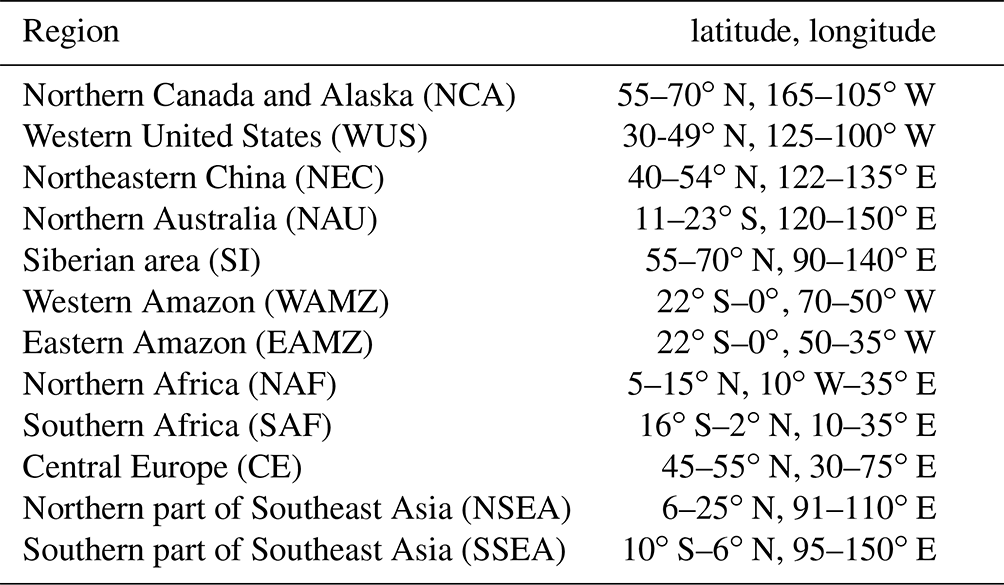
To better analyze the variation characteristics and regional differences between fires, this study focused on two spatial scales: the global scale and 12 typical regions with frequent fires. The selection of 12 regions considered the vegetation growth and cover, the distribution and intensity of fire activity over the years, and the combination of typical areas from previous case studies (Spracklen et al., 2015; Yang et al., 2021; Zheng et al., 2021). The names and latitude and longitude ranges of the 12 typical regions are shown in Table 1, with the specific spatial distribution to be further explained in Sect. 3.
Table 1The 12 typical regions and their geographical locations.
2.2 Fire, emission, and weather data
2.2.1 Fire data
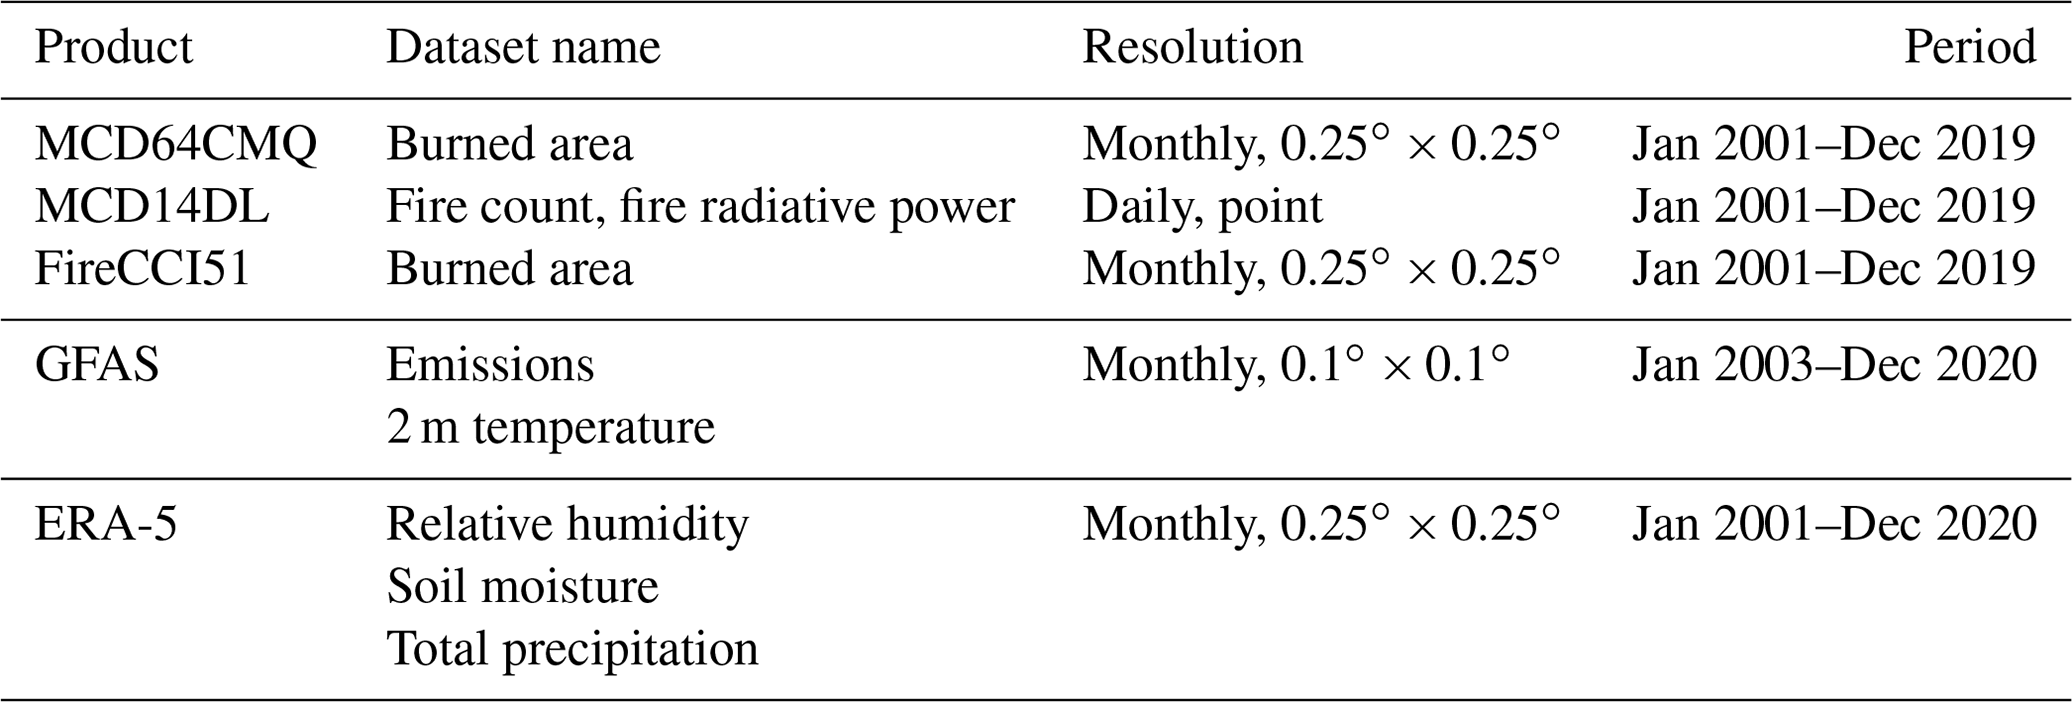
The Moderate Resolution Imaging Spectroradiometer (MODIS) sensors on the Terra and Aqua platforms are capable of monitoring fires and are currently an important source of global data on fire locations and areas burned (Giglio et al., 2009; Yang et al., 2021). MCD64 is the Collection 6 MODIS burned-area-product suite (Giglio et al., 2018). MCD64 uses active fire observations to analyze the statistical characteristics of burning-related and non-burning-related changes and uses Bayesian probability testing methods to classify burned or unburned grid cells across the globe (Giglio et al., 2018). In this paper, a monthly climate modeling grid burned-area product (MCD64CMQ) with a spatial resolution of 0.25∘ × 0.25∘ from 2001 to 2019 is used.
The MOD14 product based on Terra sensor and the MYD14 product based on Aqua sensor are the most widely used Level 2 fire product (Giglio et al., 2016, 2018). The MODIS satellite is fully automated in fire detection and can produce daily global fire information, including geographic coordinates of fire, date and time of fire occurrence, and confidence coefficient. This paper uses fire count and fire radiative power of the global combined (Terra and Aqua) MODIS near-real-time (NRT) active fire products (MCD14DL) from 2001 to 2019 with a confidence coefficient of more than 50 % (Giglio et al., 2016, 2018).
FireCCI51 is the latest version of the global burned area developed within the European Space Agency's (ESA) Climate Change Initiative (CCI) programme, under the Fire Disturbance project (FireCCI) (Lizundia-Loiola et al., 2020). It is an improved version of FireCCI50 and generates the world's first BA product with 250 m spatial resolution. FireCCI51 combines MODIS spectral information at 250 m spatial resolution with thermal anomaly information from MODIS active fire products to produce global burned-area products.
2.2.2 Fire emission data
The fire emission data used in this study is the Global Fire Assimilation System (GFAS), which has been widely used in previous studies (Fan et al., 2021; Kaiser et al., 2012; Li et al., 2020; Pan et al., 2020). Note that different products could provide biomass burning OC emissions with large differences (Kaiser et al., 2012; Pan et al., 2020), introducing uncertainties into our analysis. For example, Li et al. (2020) suggested the low biases of GFAS in biomass emissions. However, there are also studies (Kaiser et al., 2012; Pan et al., 2020) showing that GFAS is more stable than other data in the description of fire emissions, which is suitable for the analysis and comparison of fire emission trends in this study. Thus, the NASA's Terra and Aqua MODIS active fire products are used by the GFAS to estimate daily fire emissions with a horizontal resolution of 0.1∘ (Kaiser et al., 2012).
2.2.3 Climate data
ECMWF is the European Centre for Medium-Range Weather Forecasts. The fifth-generation atmospheric reanalysis of the ECMWF (ERA-5) provides many atmospheric variables with a horizontal resolution of 0.25∘ × 0.25∘ and a time resolution of up to 1 h. Compared to the ECMWF Interim Re-Analysis (ERA-Interim), ERA-5 provides substantial improvements in both horizontal and vertical resolution and covers the period since 1979 (Albergel et al., 2018). The ERA-5 reanalysis data ingests more data sources, uses an updated numerical weather prediction model and data assimilation system, and is widely used (Fan et al., 2021; Guo et al., 2021; Yang et al., 2021). In this study, the 2 m temperature, total precipitation, relative humidity, and soil moisture from the ERA-5 dataset are used. Table 2 shows the specific names, resolutions, and period information of the above multi-source observation data and reanalysis data.
2.3 Analysis method
The statistical methods used in this study are all conventional statistical methods and are specified as follows. In this paper, the spatial and temporal distribution characteristics of global fire activity and intensity are analyzed by combining burned area (BA), burned fraction (BF), fire count (FC), and fire radiative power (FRP). The BA and BF are from the MCD64CMQ dataset, where BF is the proportion of burned area to the total area in each grid cell. The FC and FRP are point data with geographic location information from the MCD14DL dataset. In this paper, fire points are distributed in a global grid of 0.25∘ × 0.25∘ according to their latitude and longitude to obtain the average value of each grid at yearly and seasonal timescales. In addition, the trend analysis was carried out for the climate data at the global scale using the Mann–Kendall (M-K) statistical test with Sen's slope method. Specifically, Sen's slope was applied to evaluate the trend value. Following this, the M-K statistical test was employed to test whether these estimated trends were significant at a given significance level (Gui et al., 2021).
Fire season is involved in the influence of meteorological elements on fire. Here, the specific extraction method of fire season is to rank the monthly burned area in each natural year. The month with 80 % of the annual average burned area is the fire month, and the fire month number is the duration of the fire season (Archibald et al., 2013). The advantage of this classification is that it is completely independent of burned area and does not make any assumptions about seasonal patterns of burning. For example, it can accommodate bimodal fire patterns during the year (i.e., there are two fire seasons in a year). In addition, the calculation of coefficient of variation (CV) is also used in this study to characterize and analyze the uncertainty in various emissions. The CV was calculated as the standard deviation of the data divided by the mean. In addition, the relative change is used in this study to represent the variation of fire characteristics in a region relative to all 12 regions (Eq. 1).
where RC represents the relative change, ki represents the mean of variable i in one region, and fi represents the mean of variable i in 12 study regions.
We use Geographical Detector (Geodetector) to quantify the contribution of meteorological conditions (temperature, relative humidity, soil moisture, and total precipitation) to fire changes in different regions. The Excel version of Geodetector used in this study was obtained from the development team's official website (http://www.geodetector.cn/#_Download,_with_Datasets_1, last access: 10 July 2023). Geodetector can explain the degree of variability of various independent variables (x) to dependent variable (y). Note that the layering of y or x can be geographical space, time, or attributes. The q statistic in the calculation results indicates the degree of interpretation of the corresponding variable, and its value range is 0–1 (Eq. 2). The larger the q is, the stronger the explanatory power of (x) to (y) will be. Geodetector is currently being used extensively in research for quantitative attribution analysis (Wang et al., 2016; Zhang et al., 2019). Readers looking for a detailed description of this model can refer to the studies by Wang et al. (2010, 2016).
where h= 1, …; L is strata of y (burned area and intensity) or x (meteorological variable); Nh and N are the strata h and the number of units in different fire regions; and and σ2 are the variance of the strata h and y value in the fire region, respectively.
3.1 Global temporal and spatial variation characteristics of fires
The BA, which is frequently employed in existing studies as a single metric to quantify fire changes (Senande-Rivera et al., 2022; Zheng et al., 2021), shows a steady decreasing trend based on both global observation data and model simulations (Fig. 1). Unlike global BA results, previous studies have shown an increasing trend in BA in many specific regions, such as the Arctic and the western United States (Burke et al., 2021; Engelmann et al., 2021; Zhu et al., 2021). This study employs the yearly average spatial distribution of BF, FC, and FRP from 2001 to 2019 to thoroughly depict the spatial pattern of fire occurrence and evolution in order to examine and evaluate the distribution characteristics of global fire in a more systematic manner (Fig. 2). In general, BF and FC represent the fire area, whereas FRP is more indicative of fire intensity. Figure 2a and b reveal that the spatial pattern of BF presented by the MCD64CMQ and FireCCI51 datasets is essentially the same, with both demonstrating great spatial heterogeneity.
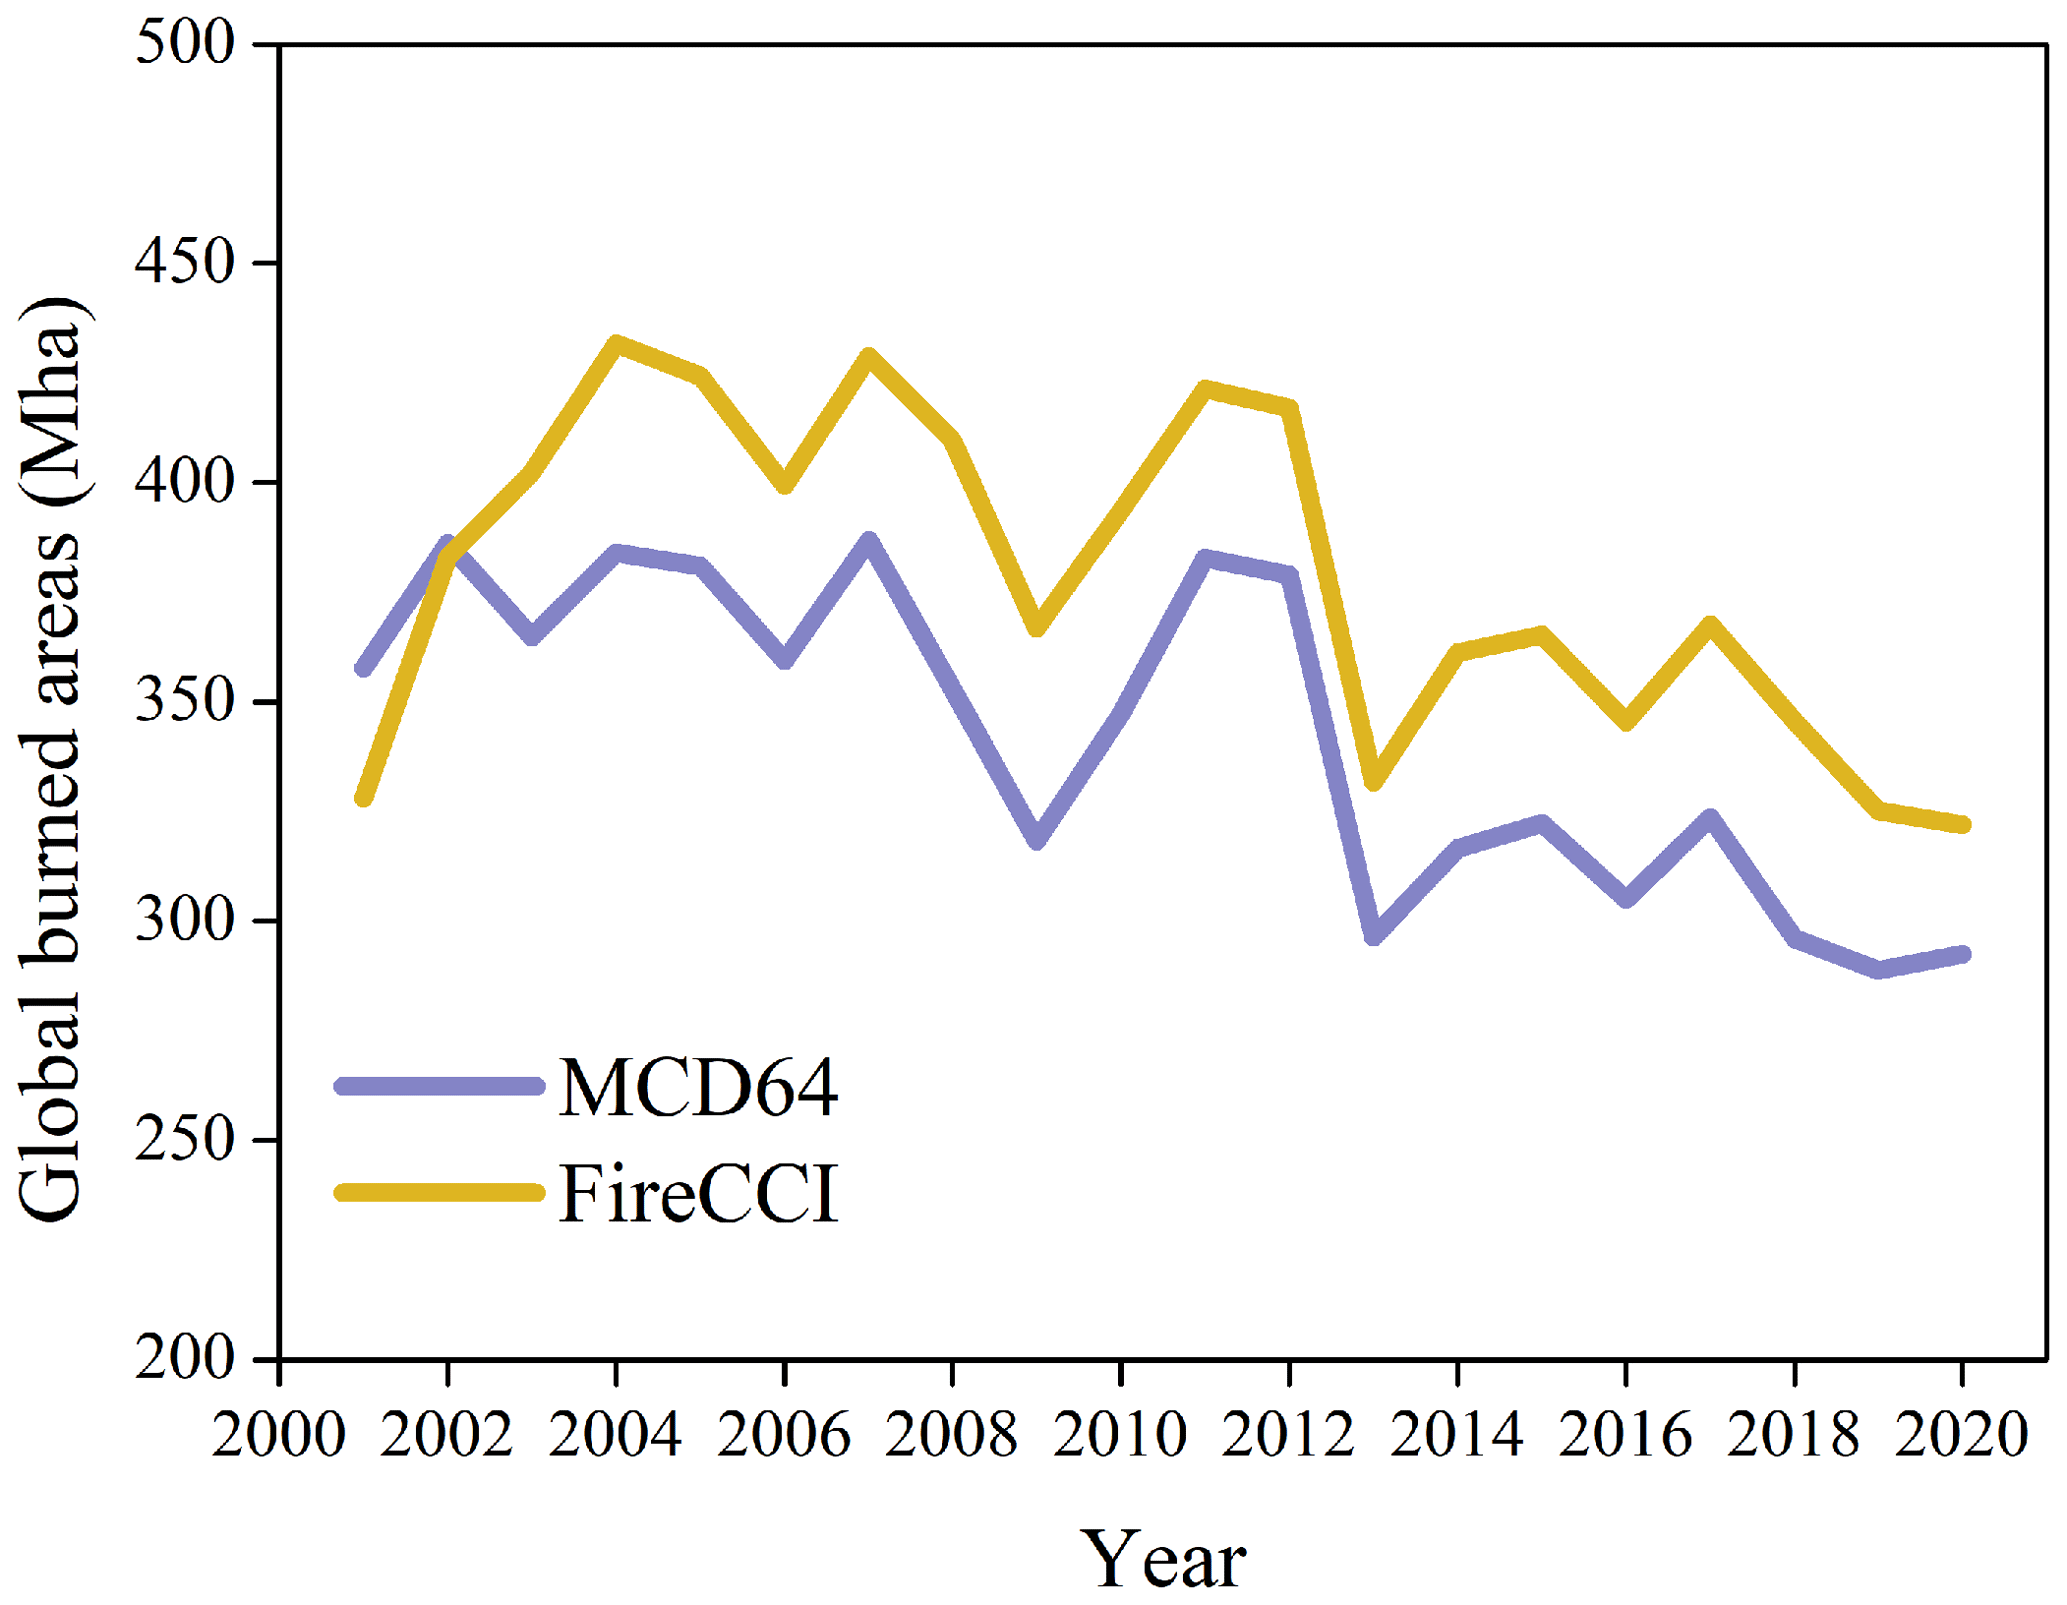
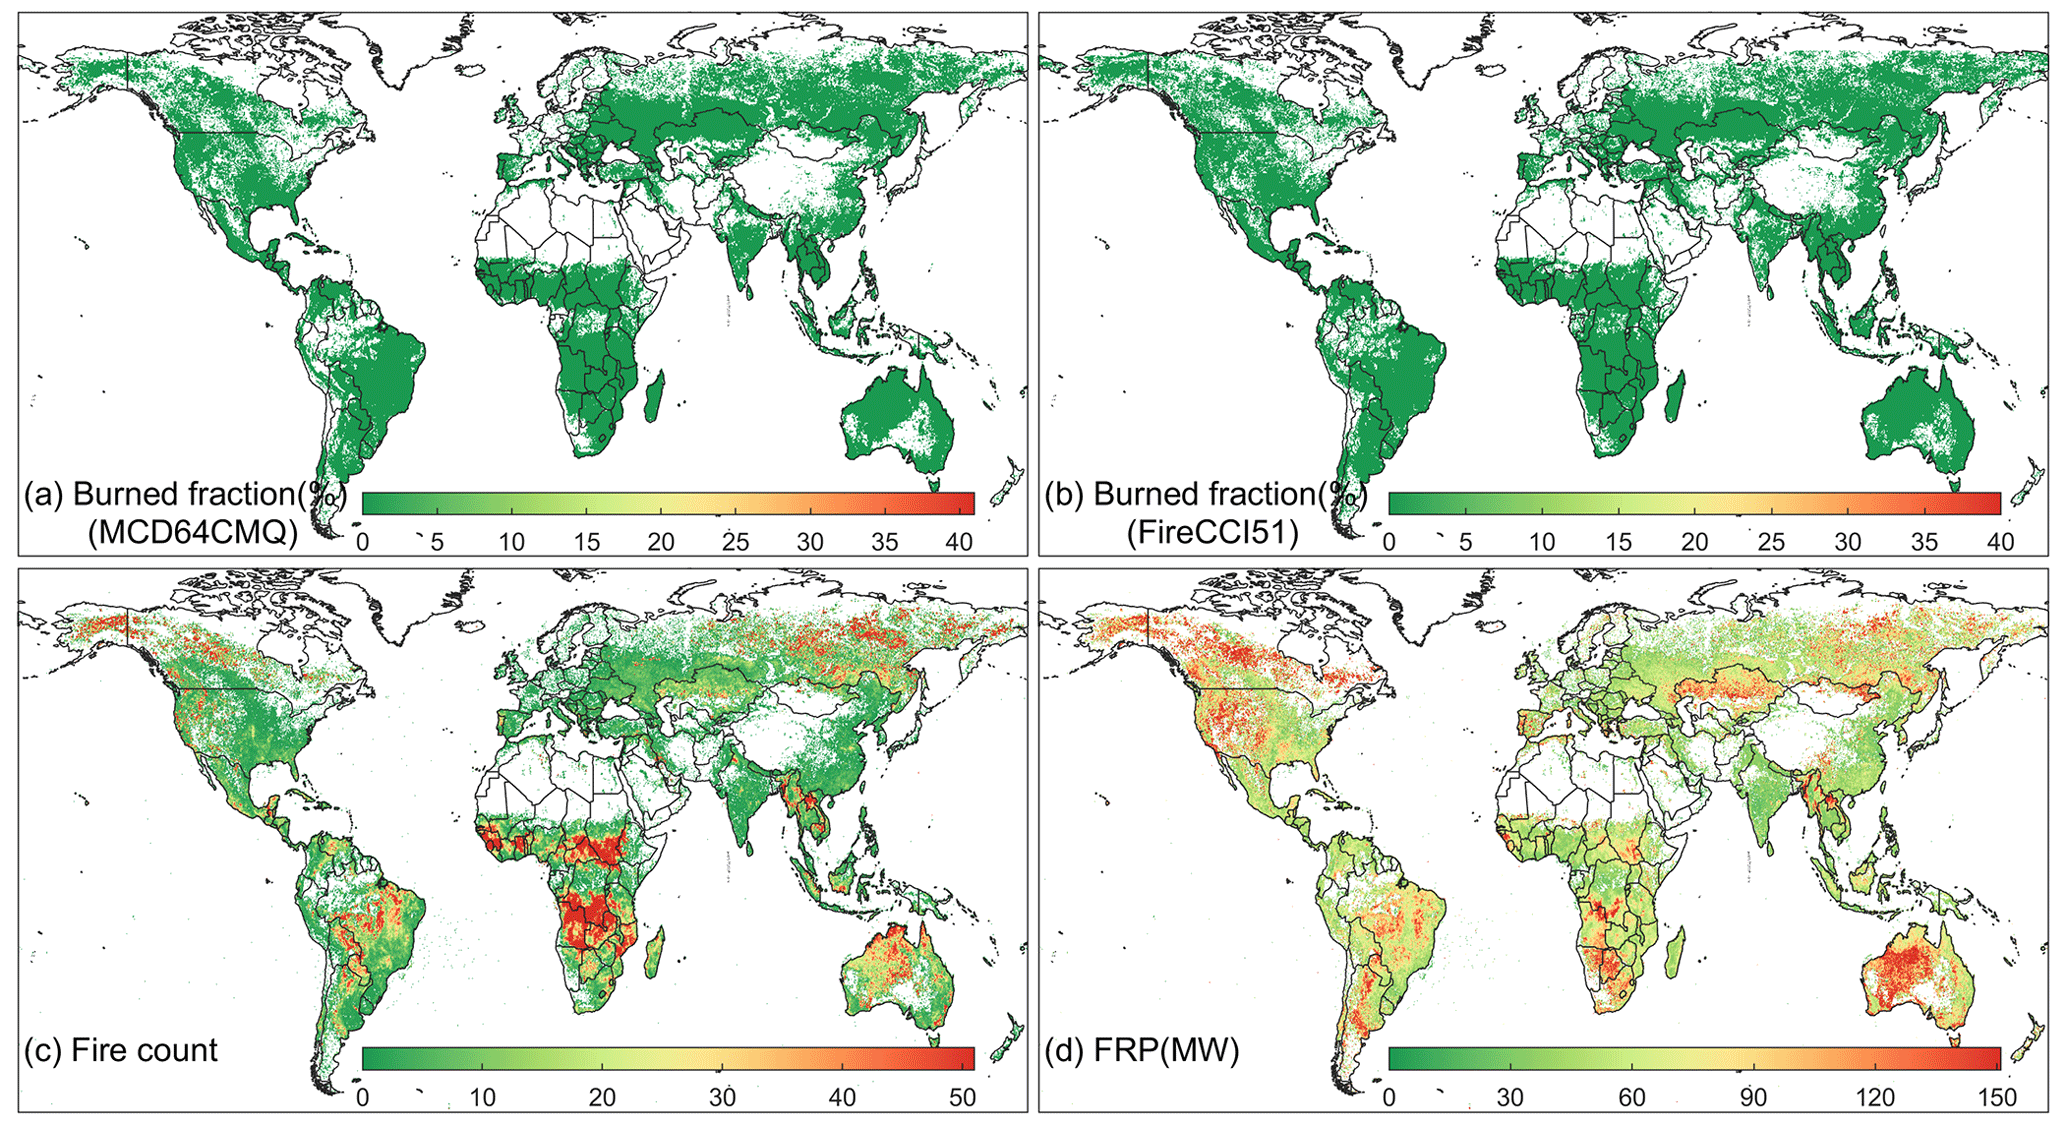
Figure 2The spatial distribution of global fire-burned fraction (BF), fire count (FC), and fire radiation power (FRP) from 2001 to 2019.
From the perspective of spatial distribution (Fig. 2), the tropics, particularly in Africa, northern Australia, and central South America, are regions where the high values of BF are mostly found. Specifically, sub-Saharan Africa and northern Australia have BF values that generally surpass 20 %, and the greatest value even reaches 40 %. At the same time, boreal forest distribution zones in Canada, the western United States, central Europe, and Russia constitute the banded high fire occurrence zones in the middle and high latitudes of the Northern Hemisphere. In addition, parts of Southeast Asia and southern North America also have high fire rates, with BF averages of about 10 %–20 %. In contrast, the prevalence of fire is low, with BF below 10 %, in southeastern China, southern Asia, the southeastern United States, and the southeastern part of South America, which is consistent with existing research findings that vegetation abundance (i.e., availability of fuel) is a key factor in determining the likelihood of fires (Huangfu et al., 2021; Liu et al., 2017; Turetsky et al., 2015). Therefore, the arid and semi-arid regions with less vegetation cover (e.g., western China, the Middle East, and the Sahara) and polar regions with lower temperatures have extremely low fire rates.
The overall spatial distribution for FC is similar to that for BF (Fig. 2c). As FC reflects more fire point quantity information, it shows sporadic and spotty high value distribution of boreal coniferous forest and contiguous distribution of fire points in tropical rainforest and grassland. The multi-year average FC in southern Africa exceeds 50, and the average FC in the western United States, Alaska, and the boreal forest of Russia is about 30–50. In the arid and semi-arid areas with sparse vegetation cover and areas with low temperature, there is almost no fire point. From the perspective of land use type, the BA and FC show linear correlation in most cases. Specifically, in forests fires mainly increase in temperate and boreal forest areas, in farmland fires mainly increase in southern and eastern Asia, and the area of global grassland fires generally shows a downward trend, except for in parts of the United States and Australia.
FRP in Fig. 2d shows the global fire burning intensity. The boreal forest regions in southwestern Australia, North America, and Russia have high FRP average values that can surpass 120 MW, although BF in these areas is not high. In contrast, FRP released during fires was not high in regions where fires occurred most frequently, such as the Amazon Basin, African savannas and rainforests, and northern Australia, which is consistent with previous findings (Chen et al., 2018; Kumar et al., 2022; Ohneiser et al., 2022; Requia et al., 2021; Yu et al., 2021). This is mostly due to the following two factors: vegetation types and climatic conditions. Compared to savanna areas, temperate forest areas have more biomass and more combustible tree species, such as spruce. However, compared to herbaceous fires, fires in wooded environments spread more slowly, and canopy fire generation is minimal in savannas and woods. On the other hand, frequent rainfall in tropical areas compared to temperate fire burn zones may reduce fire intensity, particularly when temperate forest areas undergo prolonged drought, leading to much higher fire intensity (Jaffe et al., 2004; Konovalov et al., 2021; Zhuang et al., 2021). It should be noted that the FRP data integrates all the radiation energy from the 1 km2 window, and thus it includes both radiation from open flame burning and radiation from smoldering (non-open flame combustion). In reality, fires in grassland areas provide the majority of the radiation power that has been observed, whereas smolder is more common in forested areas in both cold and temperate zones. Since BF does not effectively show the occurrence of such smoldering, there is a certain difference between FRP and BF. It is necessary to examine the distribution of global and regional fire physical characteristics from the perspective of a multi-index combination in light of the aforementioned kinds of combustion and data identification disparities. In general, the burning area and the number of fires are linearly related in most soil use types. Specifically, in forests fires mainly increase in temperate and northern forest areas, in farmland fires mainly increase in southern and eastern Asia, and the area of global grassland fires generally shows a downward trend, except for in parts of the United States and Australia.
The seasonal average spatial distribution characteristics of BF, FC, and FRP worldwide from 2001 to 2019 are depicted in detail in Fig. 3. In terms of seasonal distribution, the global fire activity in spring is relatively low, and there are large BF, FC, and FRP values only in southern Africa, northern Southeast Asia, and northern Australia during this time. BF, FC, and FRP reach annual peaks in the rainforests of southern Africa, central Asia, and the temperate and boreal forest regions of the Northern Hemisphere during summer, when there is a major rise in fire activity worldwide. Autumn fire activity increased a lot in northern Australia, southern central South America, the African savanna, and the Malay Archipelago, while it declined in central Asia and the southern African rainforests. The most noticeable change during the winter is a steep decline in fire activity in the Northern Hemisphere, with strong fire activity primarily happening in the western and northern parts of Australia and the African savanna. In general, there are obvious spatial differences in the area, quantity, and intensity of global fires. The seasonal variation of fires increases, especially as latitude increases. This is mostly due to the fact that appropriate meteorological conditions and biomass fuels work together to control wildfire occurrence (Kloss et al., 2019; Zhang et al., 2022; Zhuang et al., 2021). Additionally, although there were only minor seasonal variations in the physical characteristics (BF, FC, and FRP) defining fires, there were relatively obvious regional variations (Figs. 2 and 3).
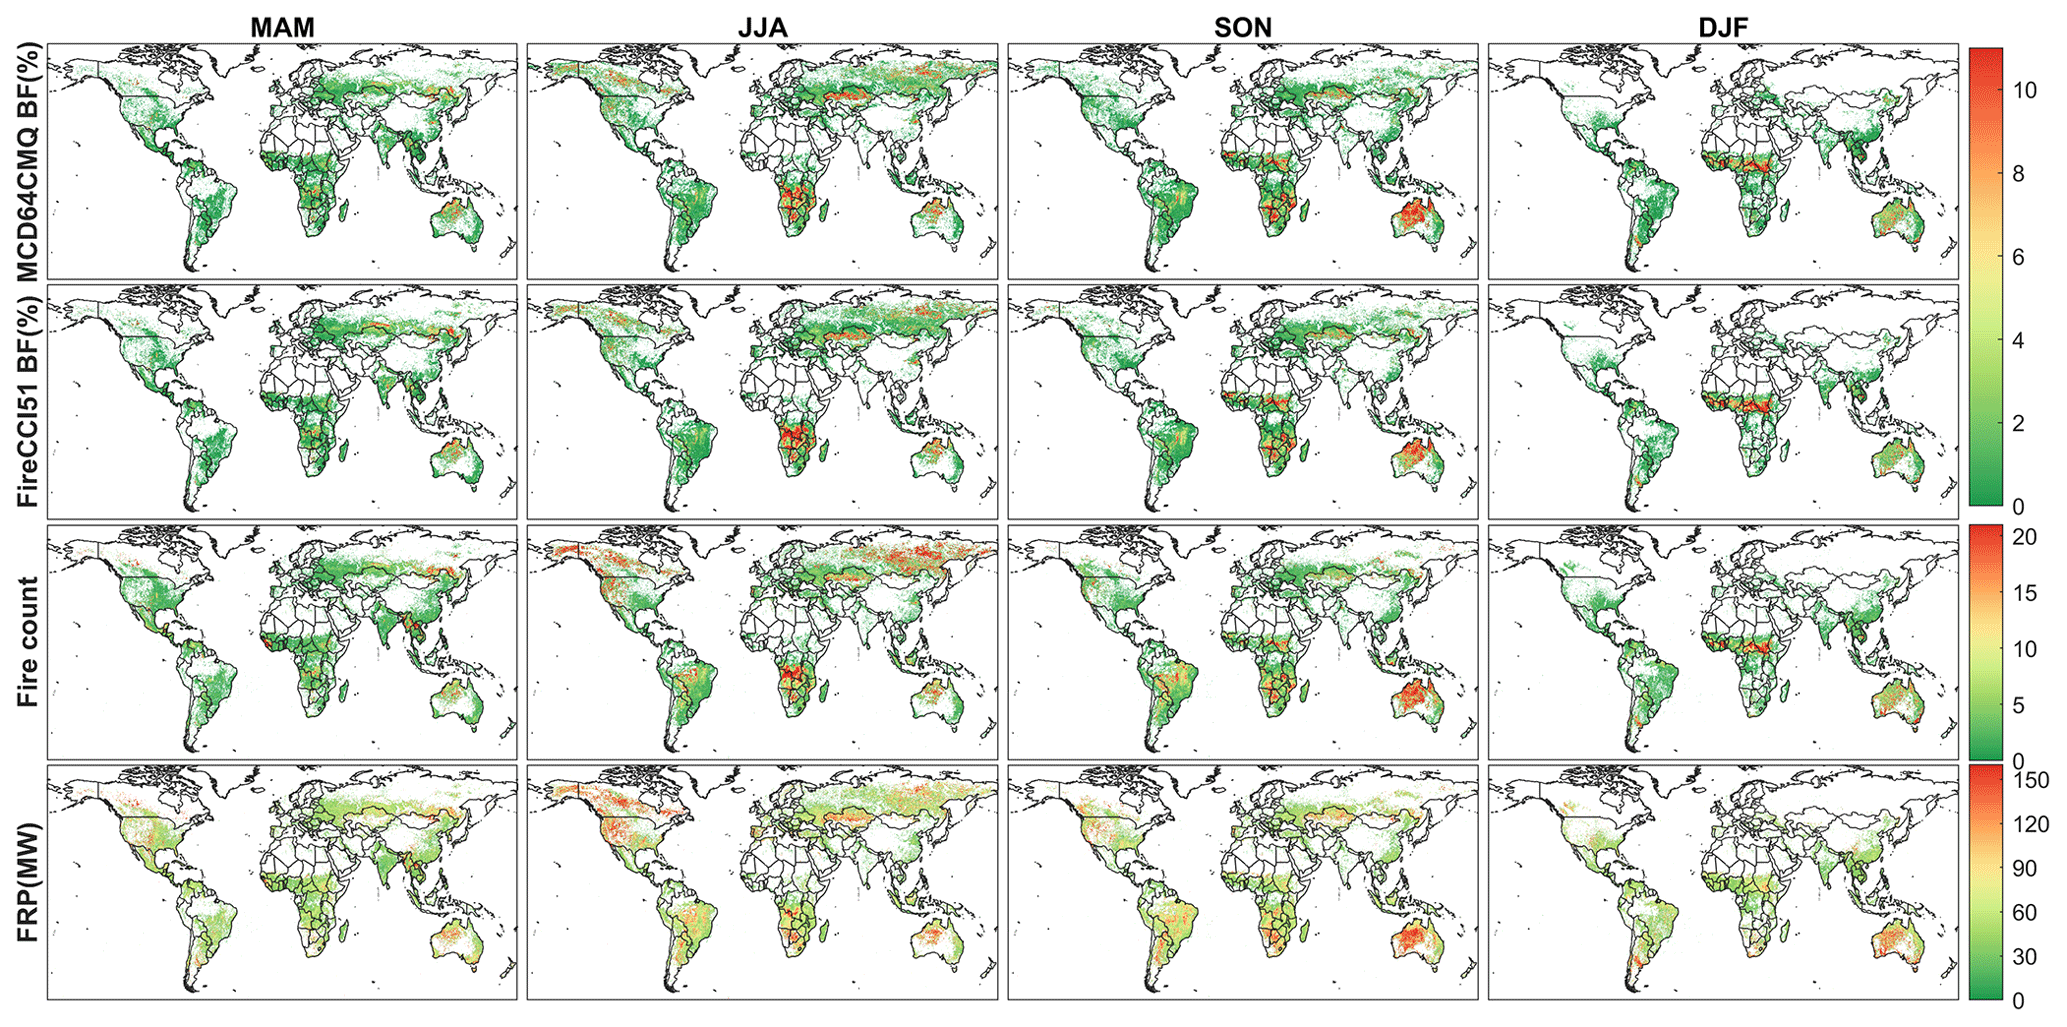
Figure 3Seasonal spatial distribution of global fire-burned fraction (BF), fire count (FC), and fire radiation power (FRP) from 2001 to 2019.
The northern part of the Indochina Peninsula and the northeastern part of China are experiencing an increase in fire activity, which is primarily related to agricultural activities like crop residue burning in these regions. This is especially true with the intensification of agriculture and the expansion of agricultural scale, which may result in an increase in burning under human control (Andela et al., 2017; Feng et al., 2021). In contrast, fire activity is reducing in central Asia, which is correlated with a wetter environment and an increase in grazing lands (Hao et al., 2021). Because agricultural land is still being abandoned widely and there are fewer fires started by seasonal burning, eastern Europe and western Russia saw a sharp decrease in fire activity (Jaffe et al., 2004; Konovalov et al., 2021). In Oceania, while fire activity in Australia's northern section generally decreased, it increased in its western and southeastern regions, which may be tied to El Niño–Southern Oscillation (ENSO) occurrences (Andela et al., 2014; Yang et al., 2021; Yu et al., 2021).
3.2 Inter-regional fire variation characteristics and emission difference analysis
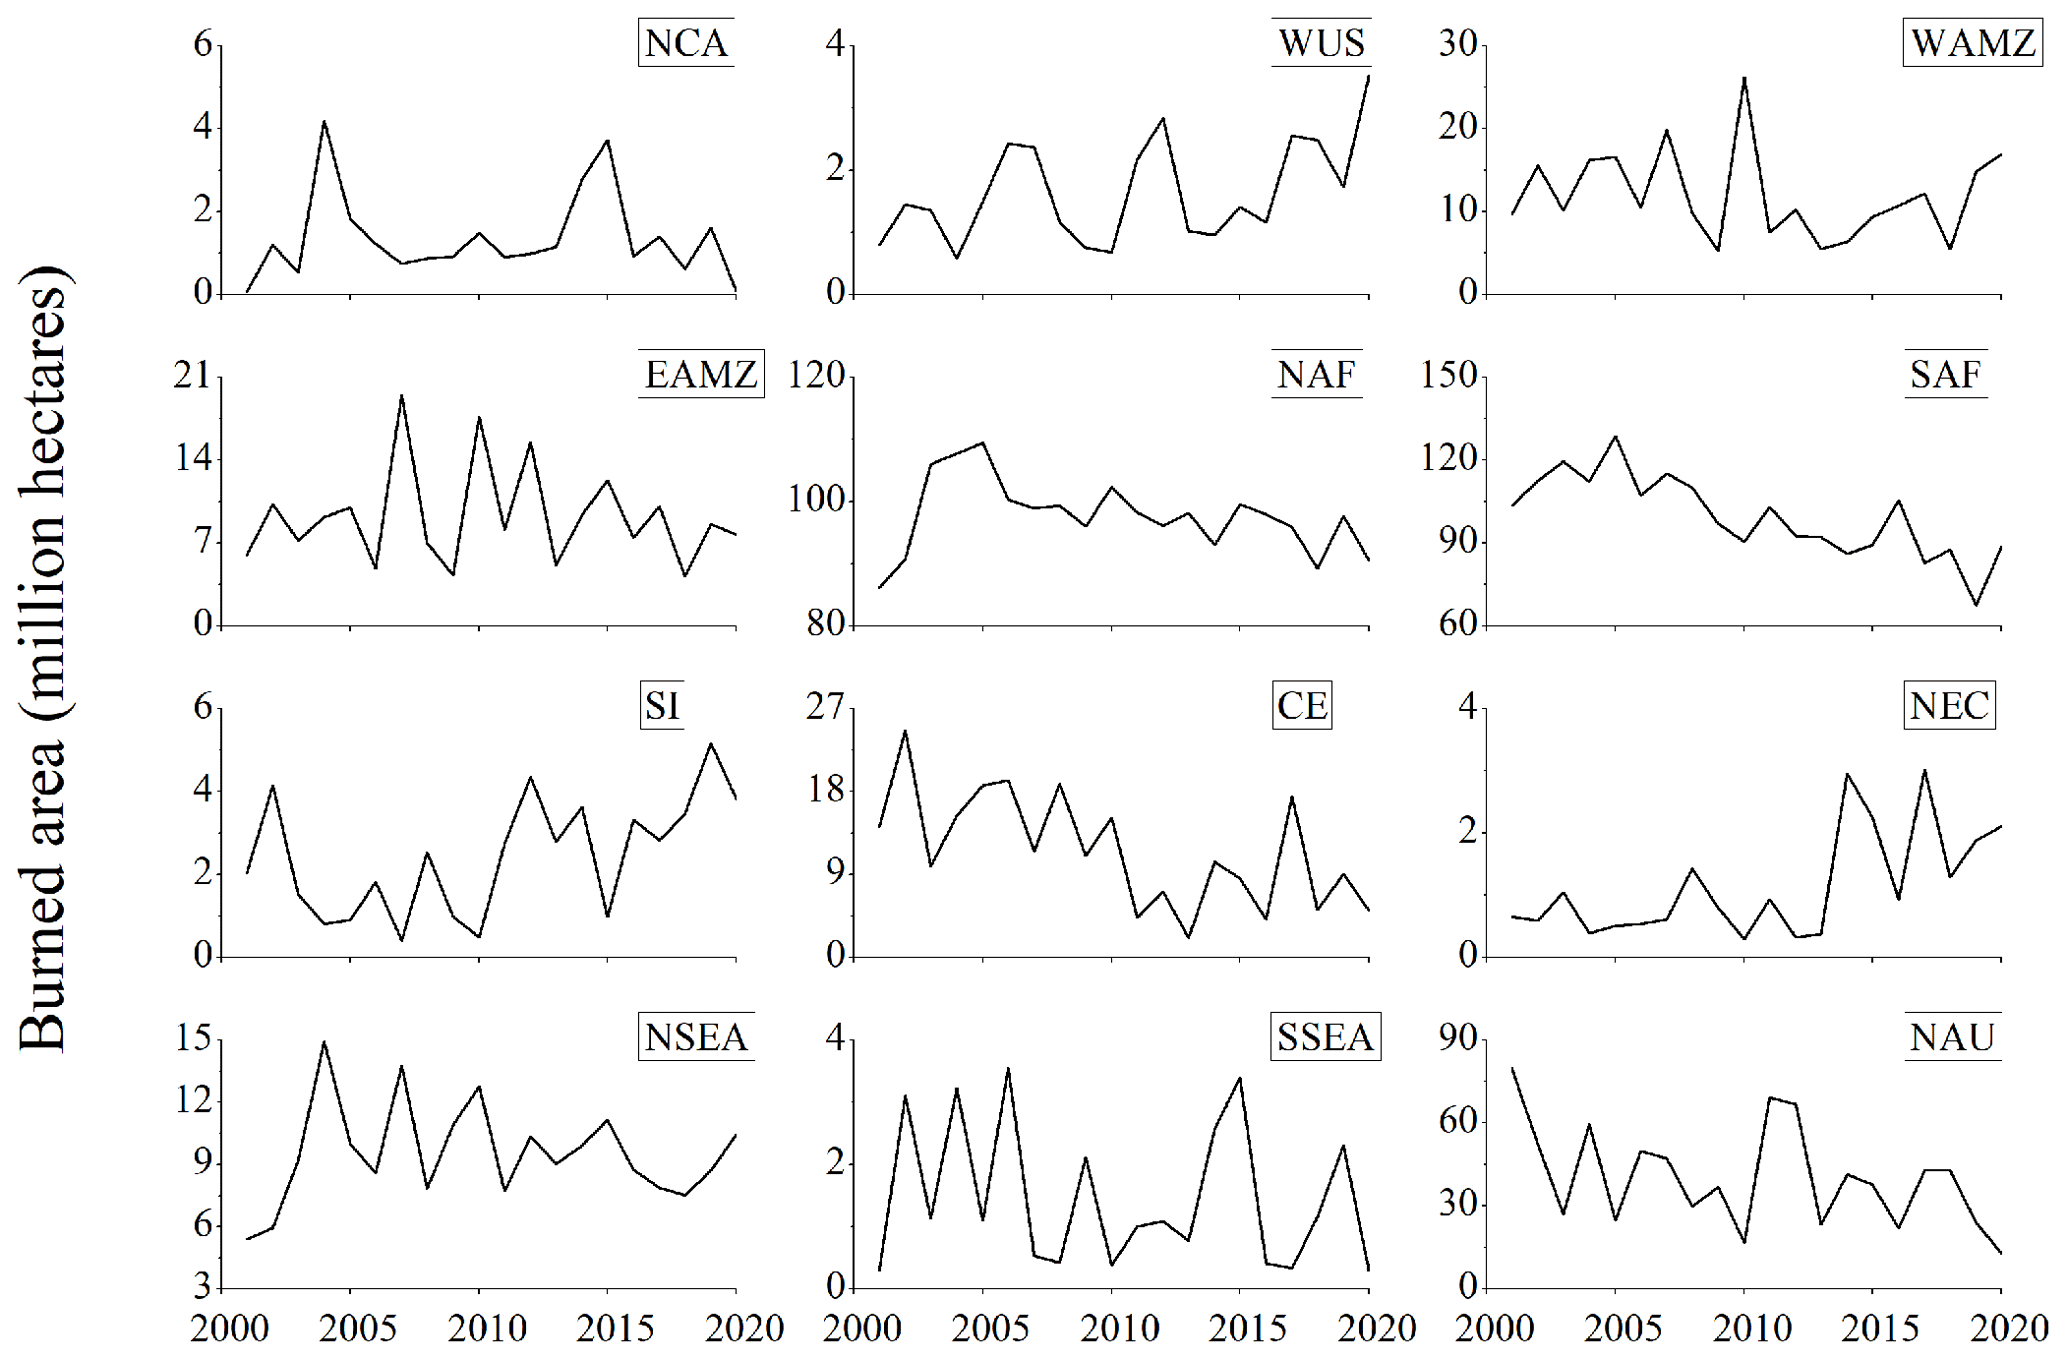
Based on the analysis in Sect. 3.1, the distribution and intensity of global fire both show spatial heterogeneity. According to the spatial distribution characteristics of BF, FC, FRP, and the normalized difference vegetation index (NDVI), combined with data from previous studies, 12 fire-prone regions (Fig. S1 in the Supplement) were divided to further analyze the physical variation characteristics and emission differences between fires among regions. Although the global fire BA shows a downward trend, the changes in 12 regions are not consistent (Fig. 4). Specifically, the BA increased in the WUS, SI, and SI regions, and decreased in the NAF, SAF, and CE regions, while the trend change in other regions was not obvious. At the same time, we need point out that the regions with large BA are mainly located at low latitudes, such as NAF, SAF, and NAU, and their changes have a greater contribution to the reduction in global BA.
We examine the relative changes in BA, FRP, and plume top height (APT) among the 12 fire regions. Specifically, relative change refers to the change in each region relative to the average level of 12 regions (Eq. 1). The analysis period is slightly adjusted to 2003–2020 because we used GFAS data for this portion. In the 12 fire regions, the relationship between APT, FRP, and BA was nonlinear and lacked regular regional variation features, as shown in Fig. 5. The relative change difference in APT is less than that of BA and FRP, and the differences among the 12 regions are basically within ±20 %, while the relative change difference in BA is concentrated within ±80 %. Regarding the FRP, the differences among other regions except NCA are relatively consistent and mainly distributed within the range of ±60 %. APT, like FRP, is be able to be used not only as an index to measure fire intensity but also as a reflection of the ability of fire emissions to affect the environment and climate to a certain extent. This is because the higher the fire plume, the greater the range of environmental pollution and climate forcing effects are likely to be (Bian et al., 2017; Hennigan et al., 2012; Konovalov et al., 2021).
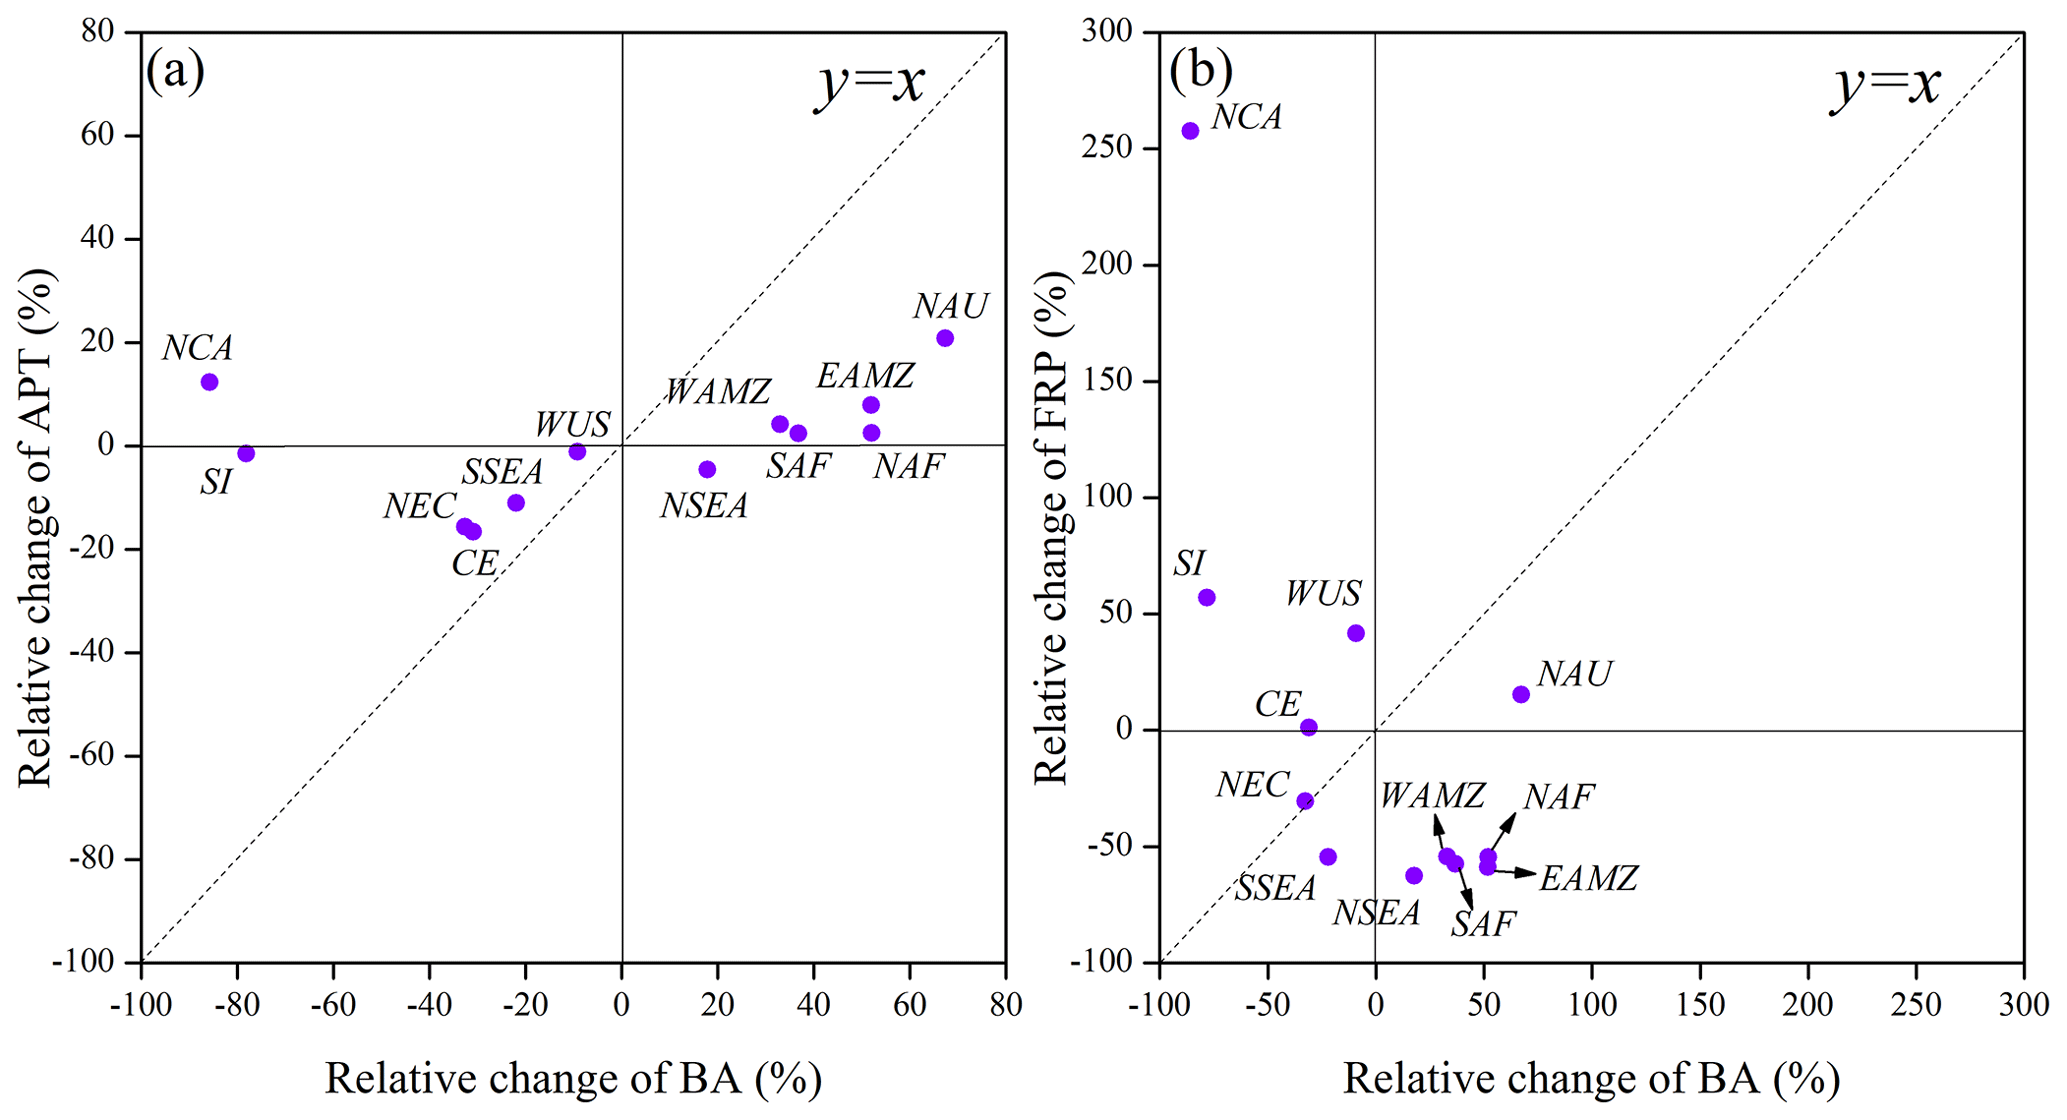
Figure 5The relative changes in the burning area (BA), plume top height (APT), and fire radiation power (FRP) of fires in 12 regions.
The relative changes in BA and APT of NAU are all the highest, and its FRP is also relatively high, as observed in Fig. 5, suggesting that the fire occurred frequently with high intensity. This conclusion is in line with recent research showing an increase in mega-wildfire incidents and a rise in the regional transport contribution of biomass burning aerosols in Australia (Ohneiser et al., 2022; Yang et al., 2021). SI, WUS, and NCA are characterized by low BA but high FRP, which strongly confirms that the intensity of fires in forest areas of middle and high latitudes in the Northern Hemisphere is high, meaning that the probability of fires in temperate and boreal forests may increase under the background of a warming climate. The areas with positive relative changes in BA and close to 0 or even negative relative changes in APT and FRP are mainly concentrated in tropical areas, which reflects that tropical areas have a larger burning range for a longer time period but that fire intensity and plume height are not prominent in these areas.
How the fire emissions change with time is an important topic that needs to be studied urgently at present because it can better reflect its environmental and climate impact potential than simply describing the changes in fire physical characteristics. However, there is still uncertainty in the simulation and quantitative analysis of changes in fire emissions in existing research (Pan et al., 2020; Zheng et al., 2021). For example, studies have shown that the decline in global fire emissions is partly due to reduced deforestation in tropical areas of Asia, including Indonesia, resulting in lower fire emissions (Feng et al., 2021; van der Werf et al., 2010). On the contrary, a new study shows that despite the global decline in fires, the trend of increasing forest burning has not proportionately reduced global carbon emissions from fires (Zheng et al., 2021).
Here, we examine and compare emission characteristics and differences across 12 regions (Figs. 6 and 7). Since carbon monoxide (CO) is frequently treated as a crucial tracer for fires and their emissions (Bian et al., 2007; Ding et al., 2021; Hooghiem et al., 2020), we used CO emission flux as the core indicator to analyze the emission trend of two time periods from 2003 to 2011 and from 2012 to 2020 (Fig. 6). The findings demonstrate that the emissions from biomass burning exhibit distinctive regional and seasonal features. In contrast to SI and NCA, which have the most pronounced seasonal fluctuations and higher absolute values of the emission flux, only EAMZ, SAF, and NAF exhibit relatively mild seasonal changes. Comparing the two periods of 2003–2011 and 2012–2020, most of the 12 regions have similar seasonal characteristics of emissions, and the absolute value of emission flux is also close. The change in global biomass burning emission flux in recent years is not consistent, with most areas showing a decreasing trend or basic invariability. NCA and NEC showed a significant decrease in the mean value of emission fluxes from 2012 to 2020, while SI showed a significant increase in the mean value of emission fluxes from May to November during 2012–2020. Combined with Fig. 5, we can conclude that while the FRP of NCA and SI are both high, the variations in the emission flux over the last 20 years are totally at odds with one another. Therefore, from the perspective of emissions, the future emission potential of SI region is large, and the increase in emissions is mainly concentrated in summer, which is closely related to the temperature increase in Siberia and the whole Northern Hemisphere high-latitude region in recent years, especially the increase in hot weather in spring and summer (Evangeliou et al., 2018; Rantanen et al., 2022). In fact, WUS emissions also increased in summer and decreased in winter in recent years, meaning that the multi-year average emissions have not significantly changed (Fig. 6).
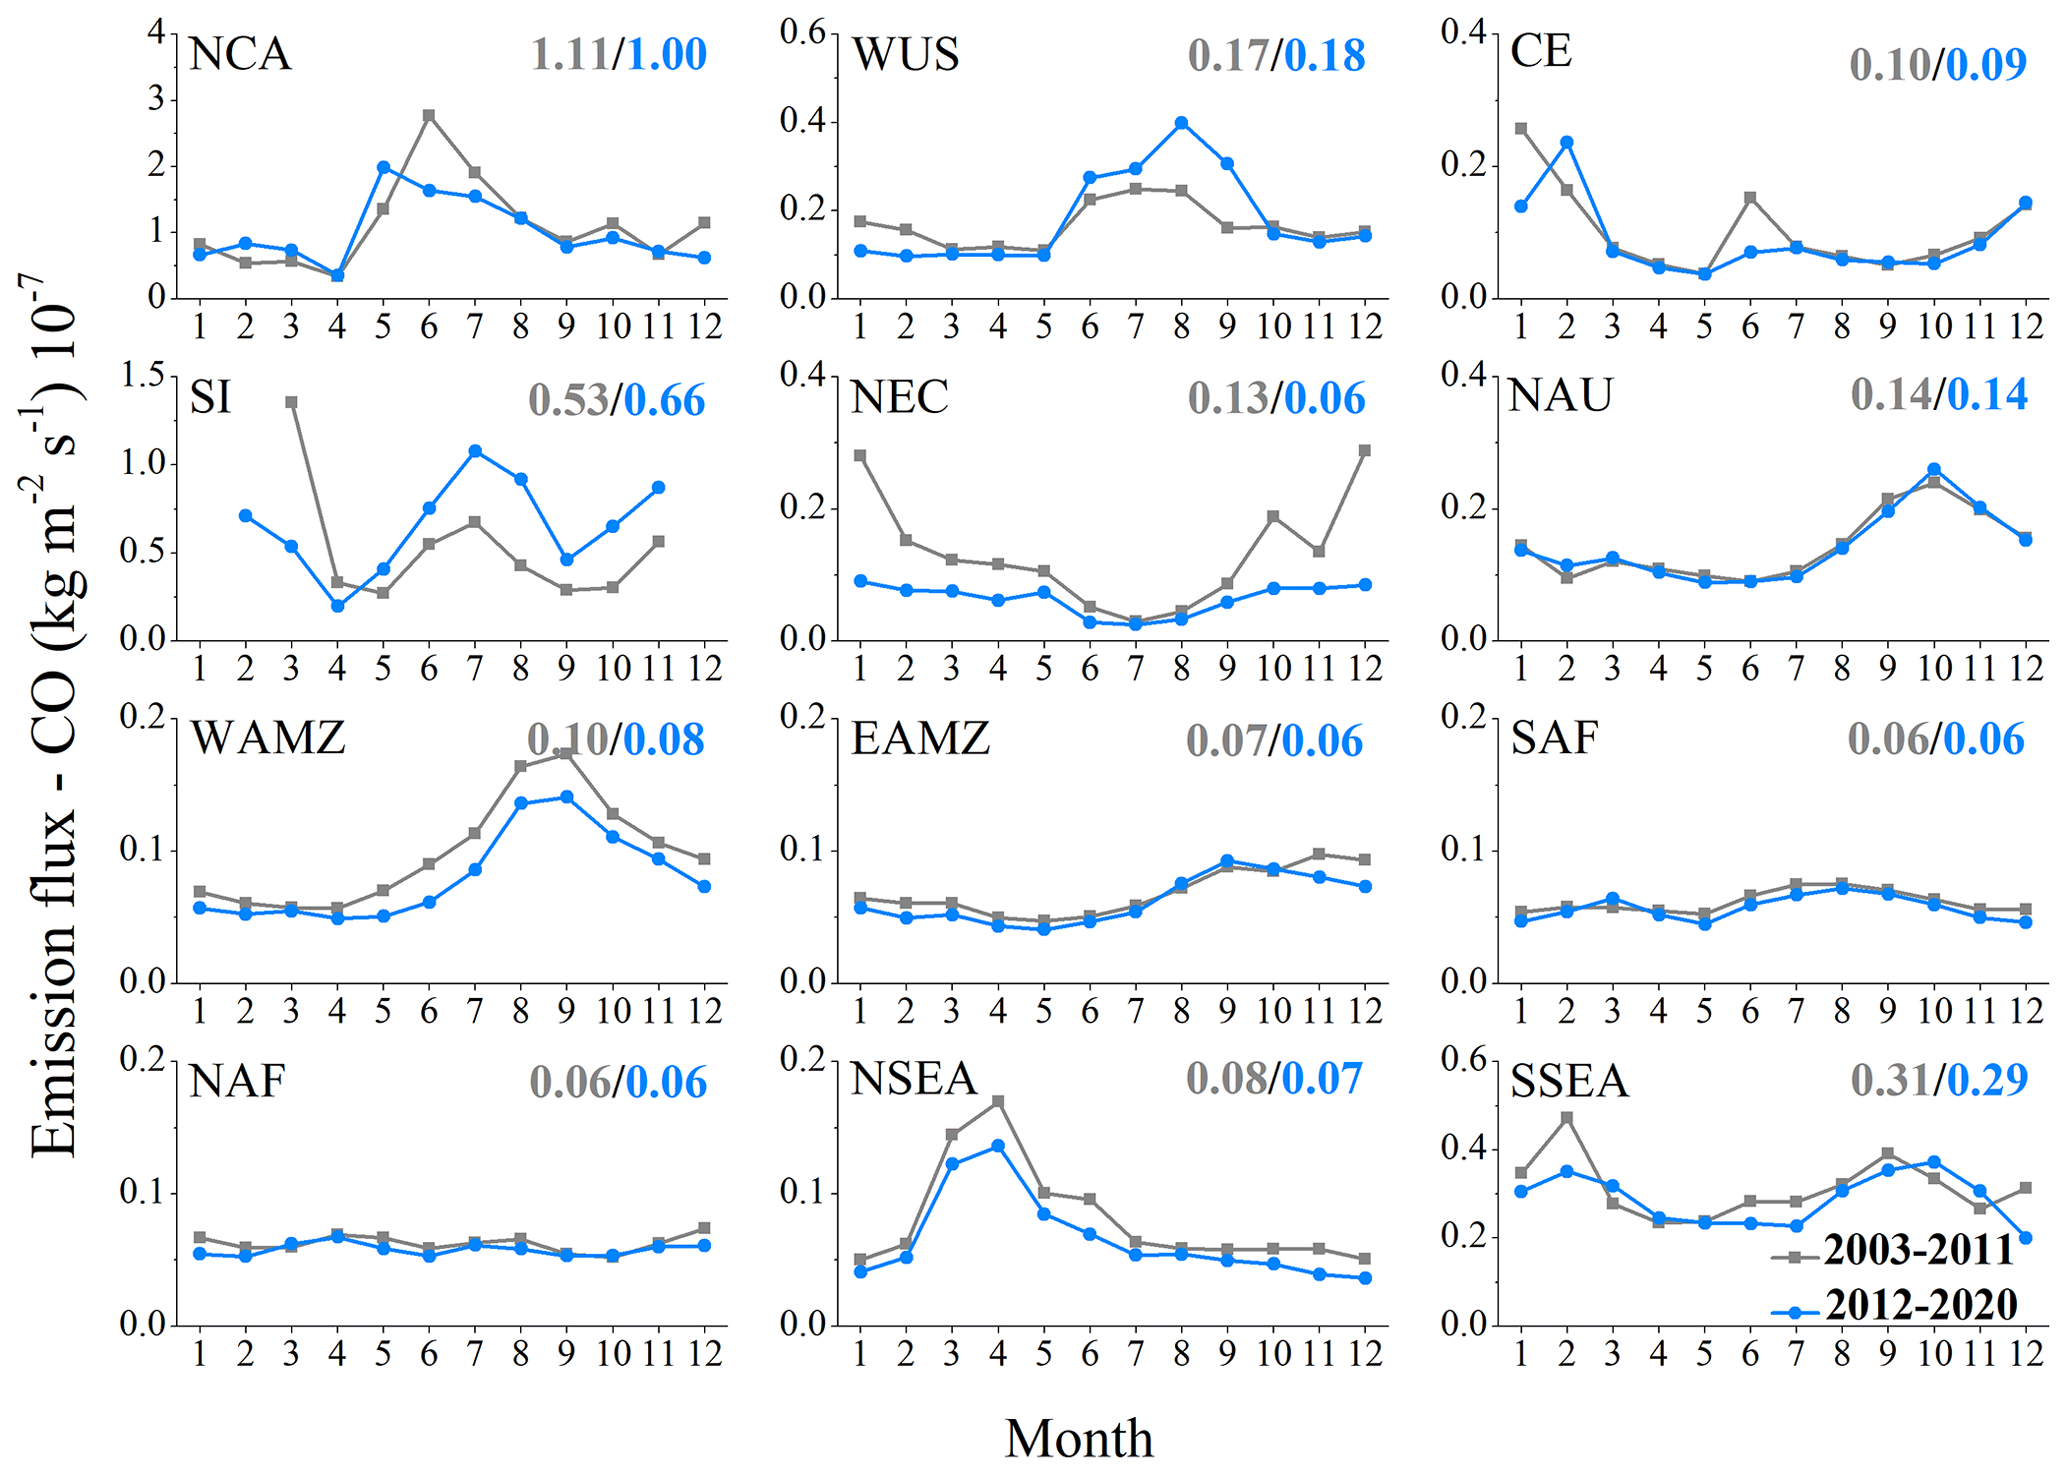
Figure 6Comparison of changes in CO emissions between the two periods. The values in the panels represent the average emission flux of the two periods.
In order to more systematically reveal the variation characteristics of biomass burning emissions and the proportion of different emitted substances in each region, CO2, CH4 and N2O fluxes were selected to characterize greenhouse gases (GHG) emissions; PM2.5, SO2 and NOx fluxes were used to characterize air pollutant emissions; OC, TC and BC fluxes were used to characterize aerosol emissions (Fig. 7). The cumulative emission fluxes of NCA and SI were the highest in all regions, while those of SAF and NAF were the lowest. The cumulative emission fluxes of fire generally showed spatial distribution characteristics that increased with increasing latitude. The emission difference among regions is not only reflected in the absolute value of emission flux but also shows obvious seasonal characteristics. Specifically, NCA, WUS, and WAMZ showed unimodal distribution of high emissions in summer; CE and NEC showed unimodal distribution of high emissions in winter; NAU and NSEA showed unimodal distribution of high emissions in autumn and spring, respectively; and SI showed relatively large variation with multiple peaks and valleys in spring, summer, and autumn. Except for the above regions, the intra-year variation is relatively flat, and the seasonal differences are small. The seasons with the highest fire occurrence and emissions were mainly summer and autumn at a worldwide scale (Figs. 3 and 7).
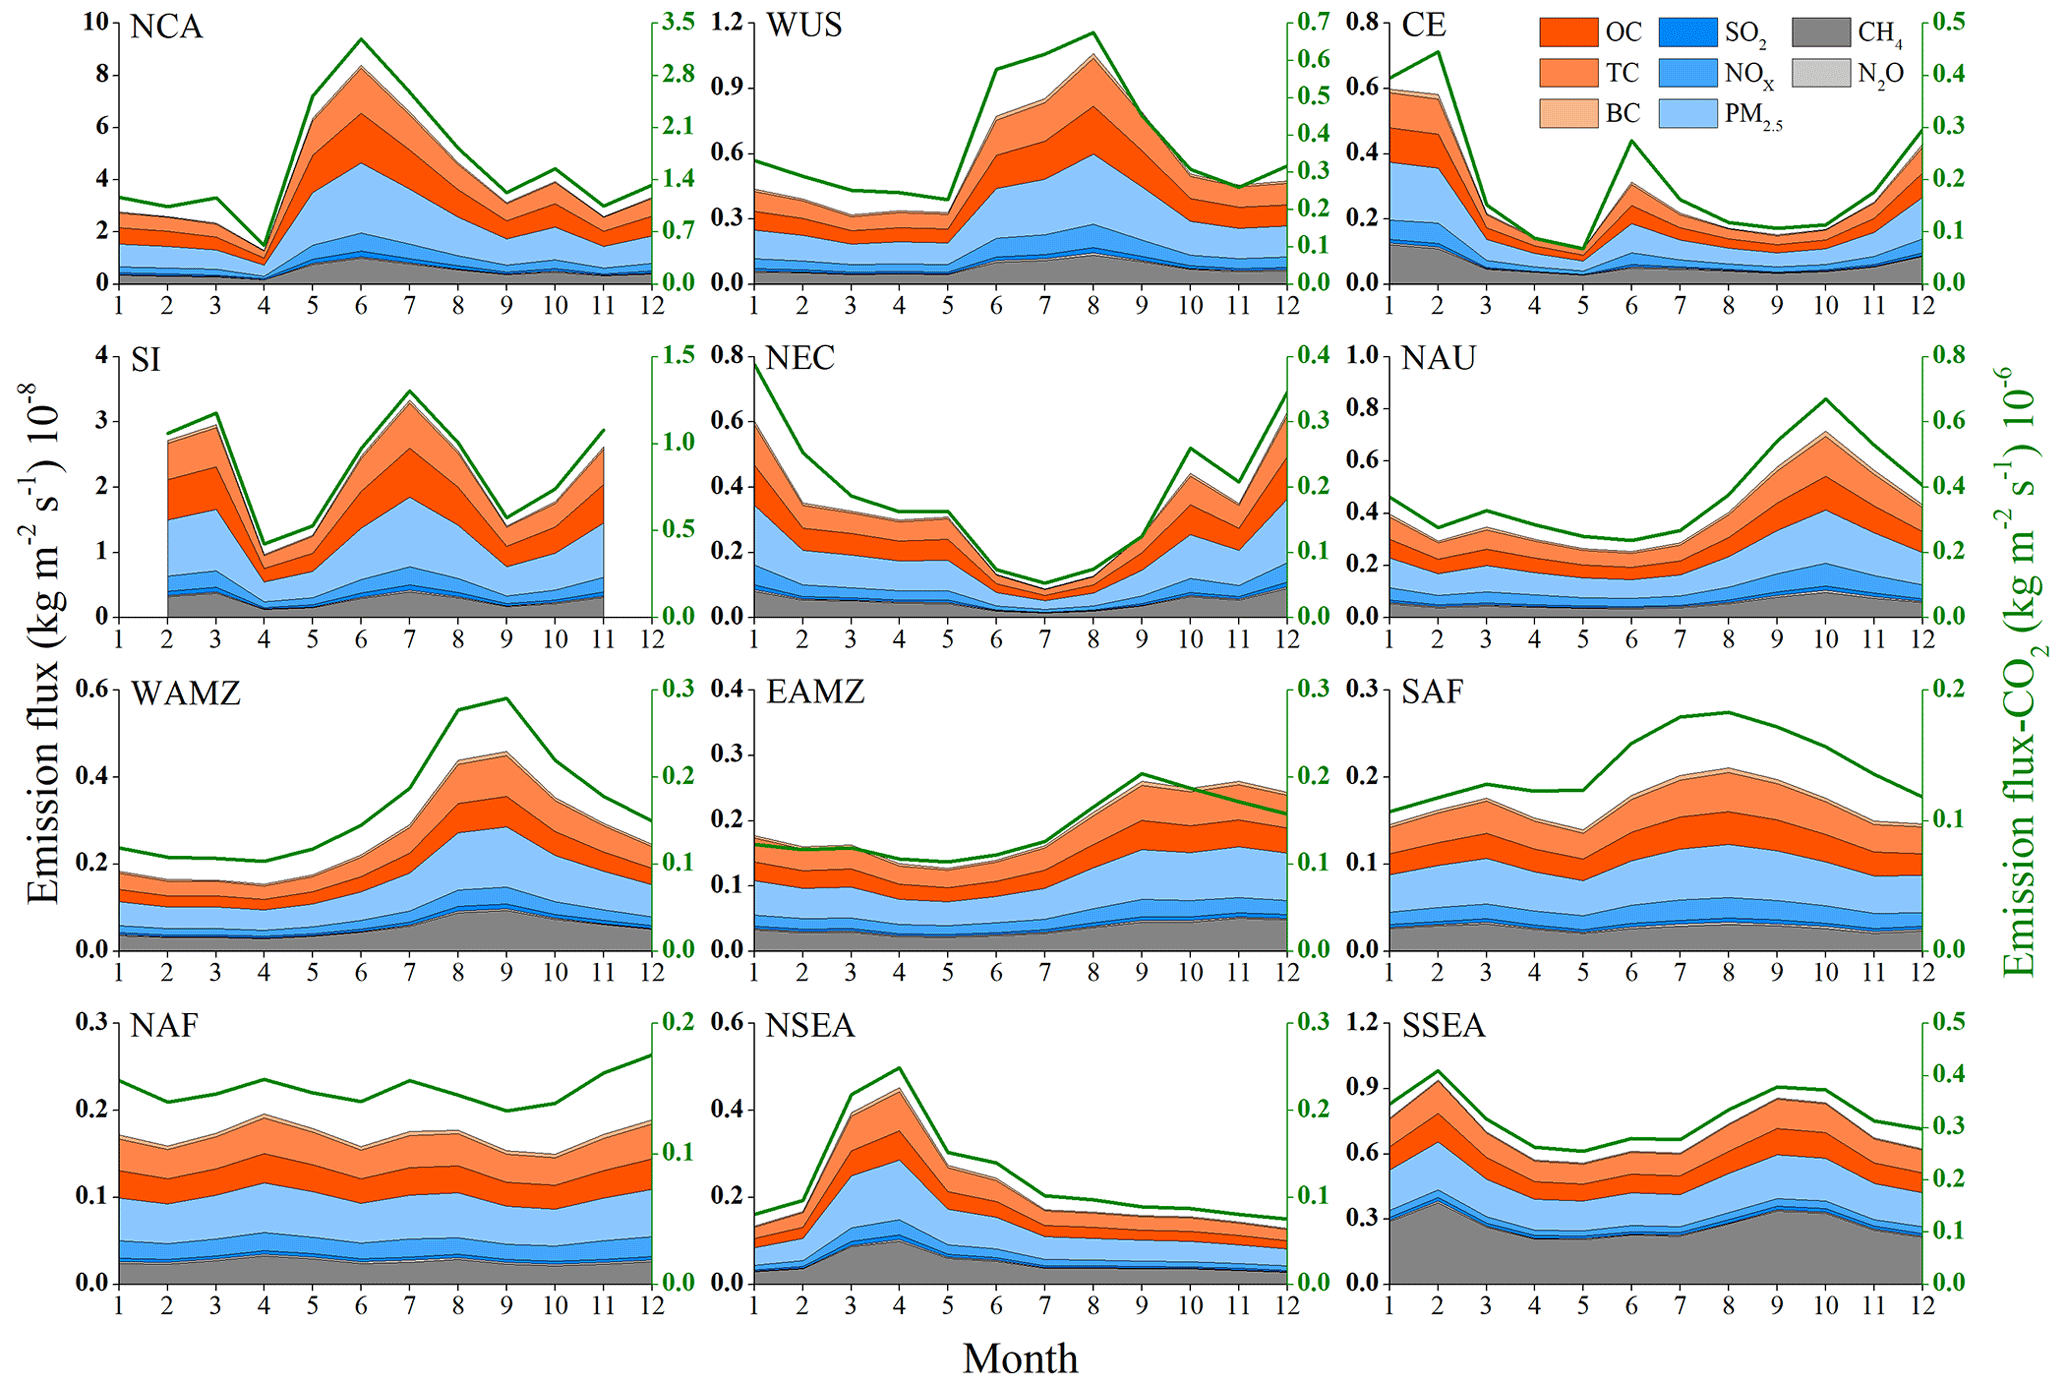
Figure 7Cumulative distribution of emissions in 12 regions (2003–2020). The right y axis is used for CO2, and the left y axis is used for other emissions.
From the perspective of the proportion of each substance, the highest emission flux is CO2 (accounting for more than 90 %), which is far greater than the sum of the emission fluxes of other substances and shows good emission consistency among the study regions. If CO2 is removed, the aerosol emission flux (the sum of OC, TC, and BC) accounts for 78.6 %–84.2 %, followed by air pollutants (the sum of PM2.5, SO2, and NOx) that account for 5.8 %–11.7 %, while the sum of CH4 and N2O accounts for the least, which is about 3.2 %–7.3 %. In this way, there are differences in the emissions of different types of substances among the study regions, and greenhouse gas emissions dominated by CO2 are absolutely dominant. The CO2 released by fires is bound to affect the global carbon cycle and has a feedback effect on the climate system. On the one hand, climate warming may increase the occurrence of fires, which release more CO2 into the atmosphere, thereby exacerbating the global warming and forming a positive feedback. On the other hand, due to the impact of land use change (such as urban expansion, deforestation, and land reclamation), BA has shown a downward trend over the past 20 years (Fig. 1). The reduced fire will, to some extent, slow down the trend of global warming by increasing the terrestrial carbon sink, forming a negative feedback process (Wu et al., 2021, 2022). Despite a general decrease in the area subject to fires, a recent study found that global emissions of carbon from fires have not decreased (Zheng et al., 2021). Therefore, carbon emissions from biomass burning will continue to be an important source of global carbon cycle in future, and the warming effect caused by fires cannot be ignored. In addition, the environmental problems caused by air pollutants and aerosols from fires are equally serious. For example, the particulate matter and CO pollutants emitted from fires in the spring of 2020 caused widespread air pollution in Southeast Asia and eastern Asia (Fan et al., 2021), and multi-year biomass burning emissions in Southeast Asia significantly enhanced low-cloud generation over the northern South China Sea (Ding et al., 2021).
Obviously, absolute value differences in biomass burning emission flux are visible, but its stability and uncertainty remain unknown. To reflect the degree of dispersion of each type of emission data in this study, we specifically calculated the yearly CV value of each type of emission flux (Fig. 8). First, the mean CV for all emission fluxes was over 150 %, with a minimum of 120 % and a maximum over 300 %. This fully indicates that the emissions generated by fire vary greatly. Combined with the results in Figs. 6 and 7, we can preliminarily judge that the emission uncertainties found in this study mainly come from regional differences and seasonal variation characteristics. Secondly, it can be found that although the CV values of emission fluxes of all substances are large, the dispersion degree of GHG emissions is the lowest (161), air pollutants are the highest (202), and aerosol (197) is in between. Thus, this study confirms that, compared with aerosol and air pollutants, fires produce more greenhouse gases with the smallest regional differences, and this is especially true for CO2 (Figs. 7 and 8).
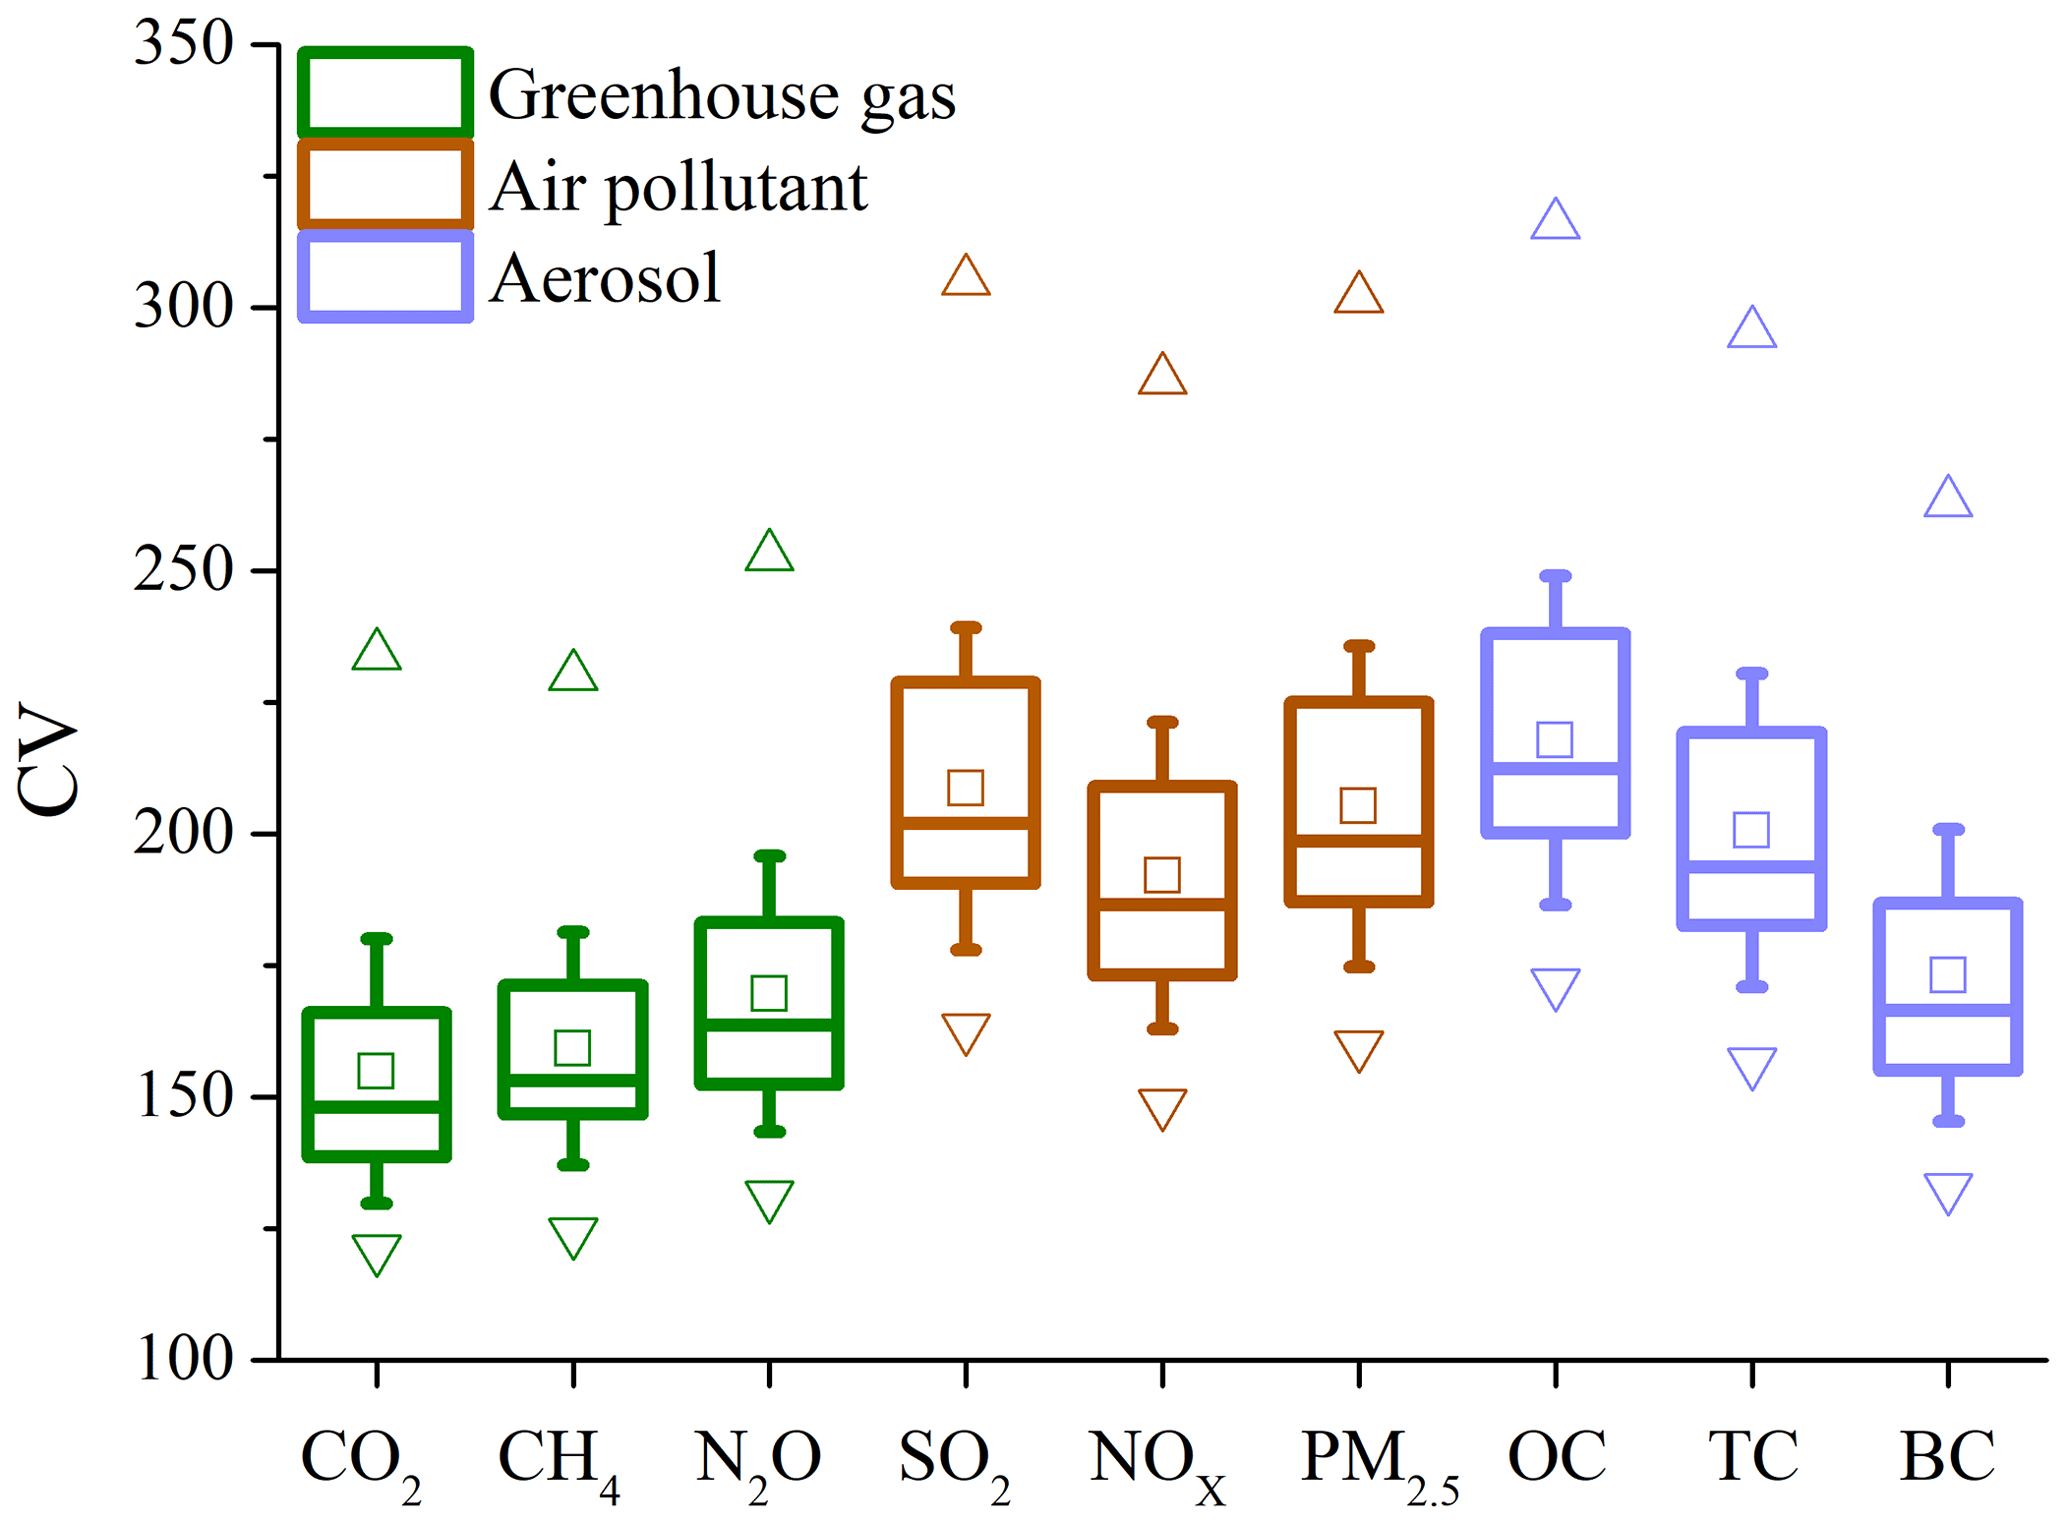
Figure 8The variation coefficient (CV) of regional emissions. The box indicates the median and upper and lower quantiles. In the box plot, an open square represents a mean and the upward-pointing and downward-pointing triangles represent the maximum and minimum values, respectively. The whiskers represent the standard deviation range of the data.
3.3 Driving meteorological factors in fire-burned areas
Based on the findings of earlier research, biomass fuel is a necessary condition for fire activity, and meteorological conditions are an important influencing factor (Andela et al., 2014; Zhuang et al., 2021). Existing studies tend to analyze fire activity and its driving factors in a certain region or use fire weather index and other comprehensive meteorological indices to establish a correlation with fire events (Grillakis et al., 2022). However, with these results it is difficult to answer how meteorological factors affect fire activity in different regions. To explore the influence of meteorological conditions on fire activities in different regions, this study selected the four indicators of temperature, precipitation, relative humidity, and soil moisture for analysis.
Figure 9 shows the global annual trends in temperature, precipitation, relative humidity, and soil moisture from 2001 to 2019. As can be seen from Fig. 9a, the temperature in most parts of the global land area shows an upward trend, especially in parts of the Northern Hemisphere at high latitudes, which show a larger increase (> 0.05∘ yr−1). In contrast, the temperature in the northern United States, central and eastern Canada, northern Central Asia, and northern India showed a downward trend, most of which were about −0.05–0∘ yr−1. The variation in global total precipitation is relatively complex. The increases and decreases in precipitation over the ocean are significantly larger than those over the land, and their distribution is more consistent with the influence of atmospheric circulation (Fig. 9b). In terms of the land areas of interest, the precipitation in eastern North America, northern Europe, southern Asia, and eastern East Asia showed an increasing trend, while the precipitation in western North America, central and eastern Europe, Siberia, the Indochina Peninsula and northern China showed a decreasing trend. In contrast, precipitation changes are larger in the tropics and the Southern Hemisphere, with obvious polarization. For example, in northwestern South America, Africa, and eastern Malaysia, precipitation obviously increased (> 0.025 mm yr−1), while precipitation in eastern and southern South America, central and southern Africa, and northern Australia showed a decreasing trend (about −0.020 mm yr−1). Both relative humidity and soil moisture can have a direct impact on the occurrence of fire and can also have an indirect impact by affecting the transpiration and development of vegetation (Tian et al., 2022; Yue et al., 2017). The relative humidity showed an obvious upward trend in central North America and South America, southern Asia, and the Tibetan Plateau, while it mainly decreased in other continental regions (Fig. 9c). The change in soil moisture is relatively fragmented because it is more easily disturbed by human activities (such as irrigation, farming) than other variables. Note that the change in soil moisture is also affected by precipitation (Fig. 9b and d).
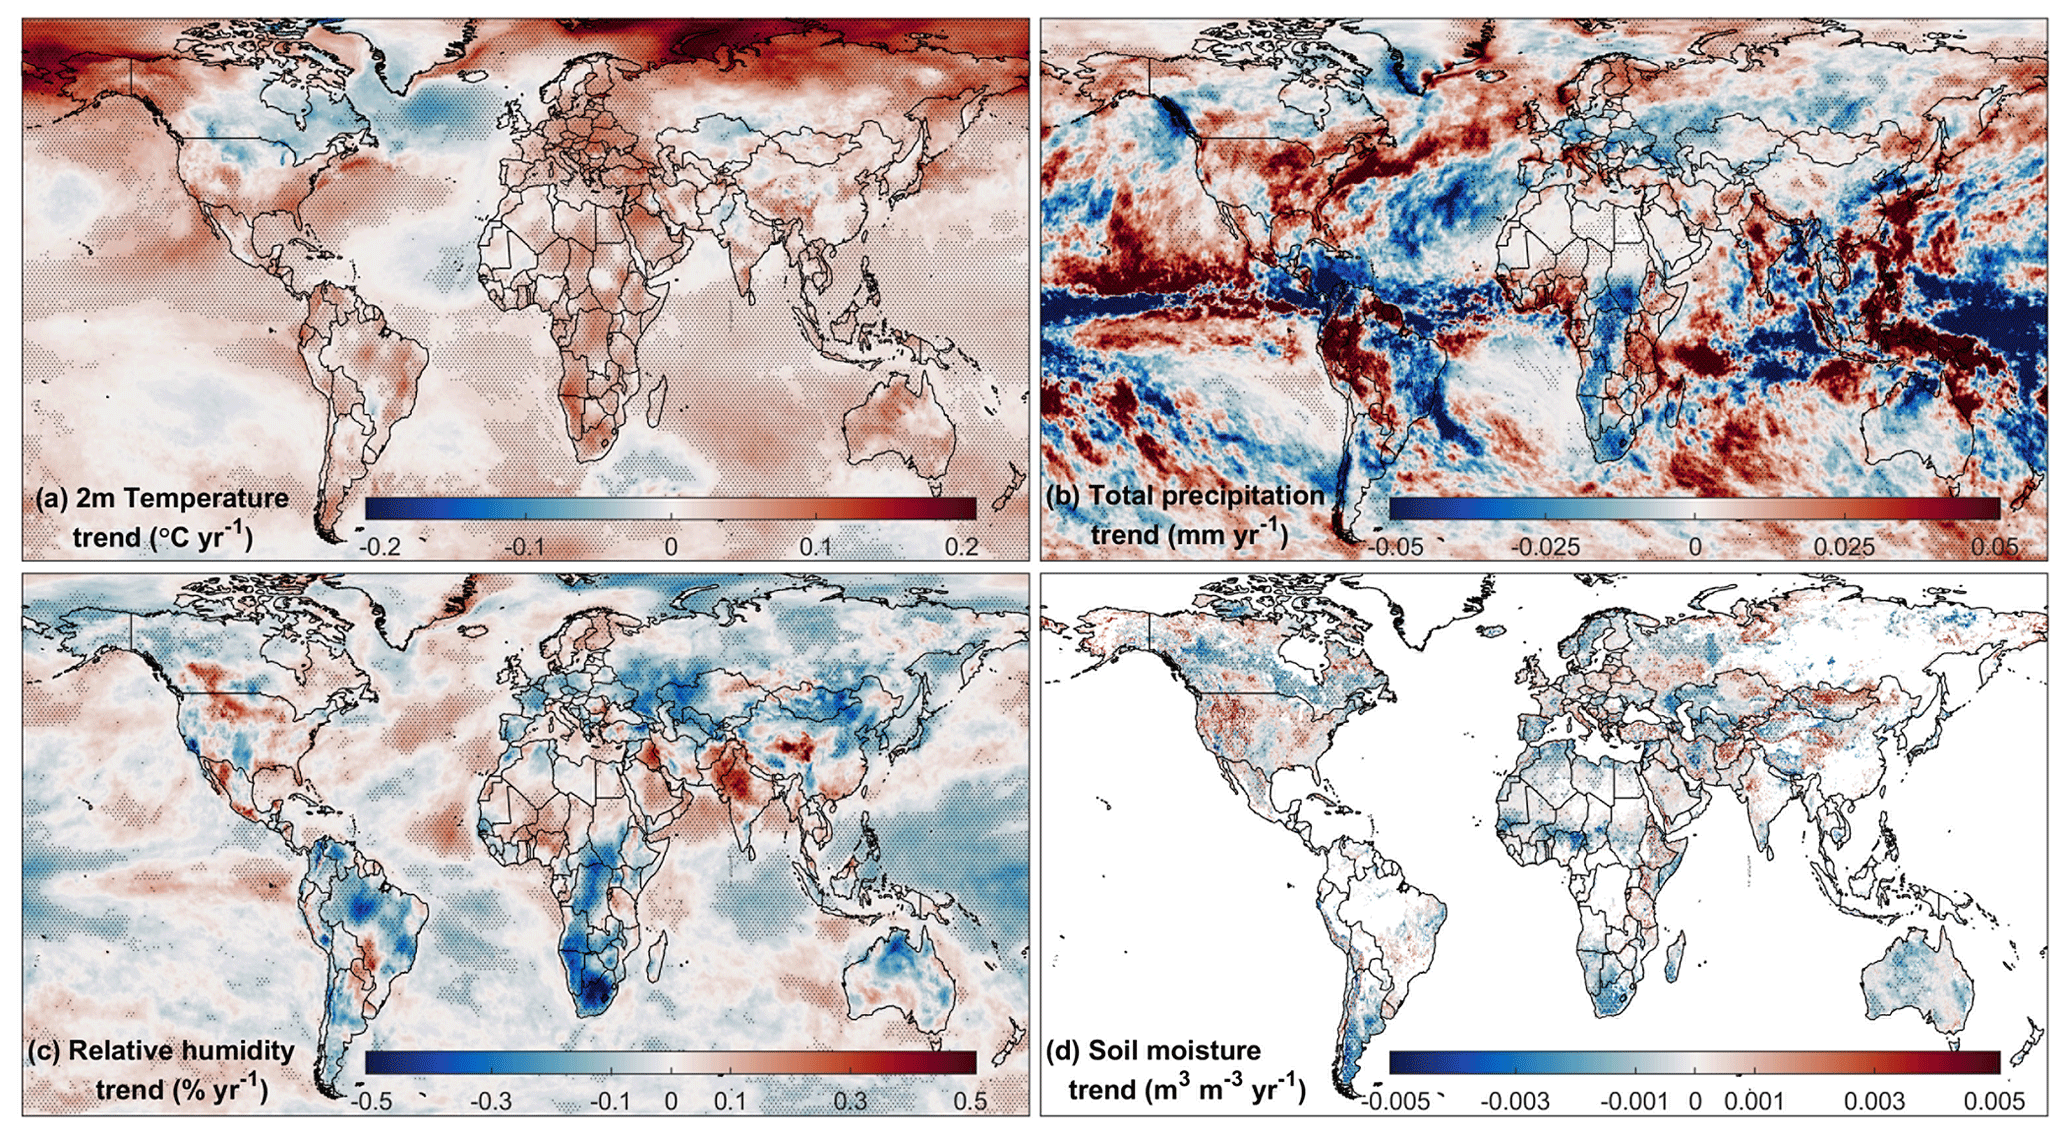
Figure 9Global trends in temperature, total precipitation, relative humidity (1000 hPa) and soil moisture from 2001 to 2019. The “*” in the figure represents that the trend has passed the 95 % significance test.
Table 3Influence degree of meteorological factors on fire changes in different regions. T is temperature, RH is relative humidity, SM is soil moisture, and P is total precipitation.
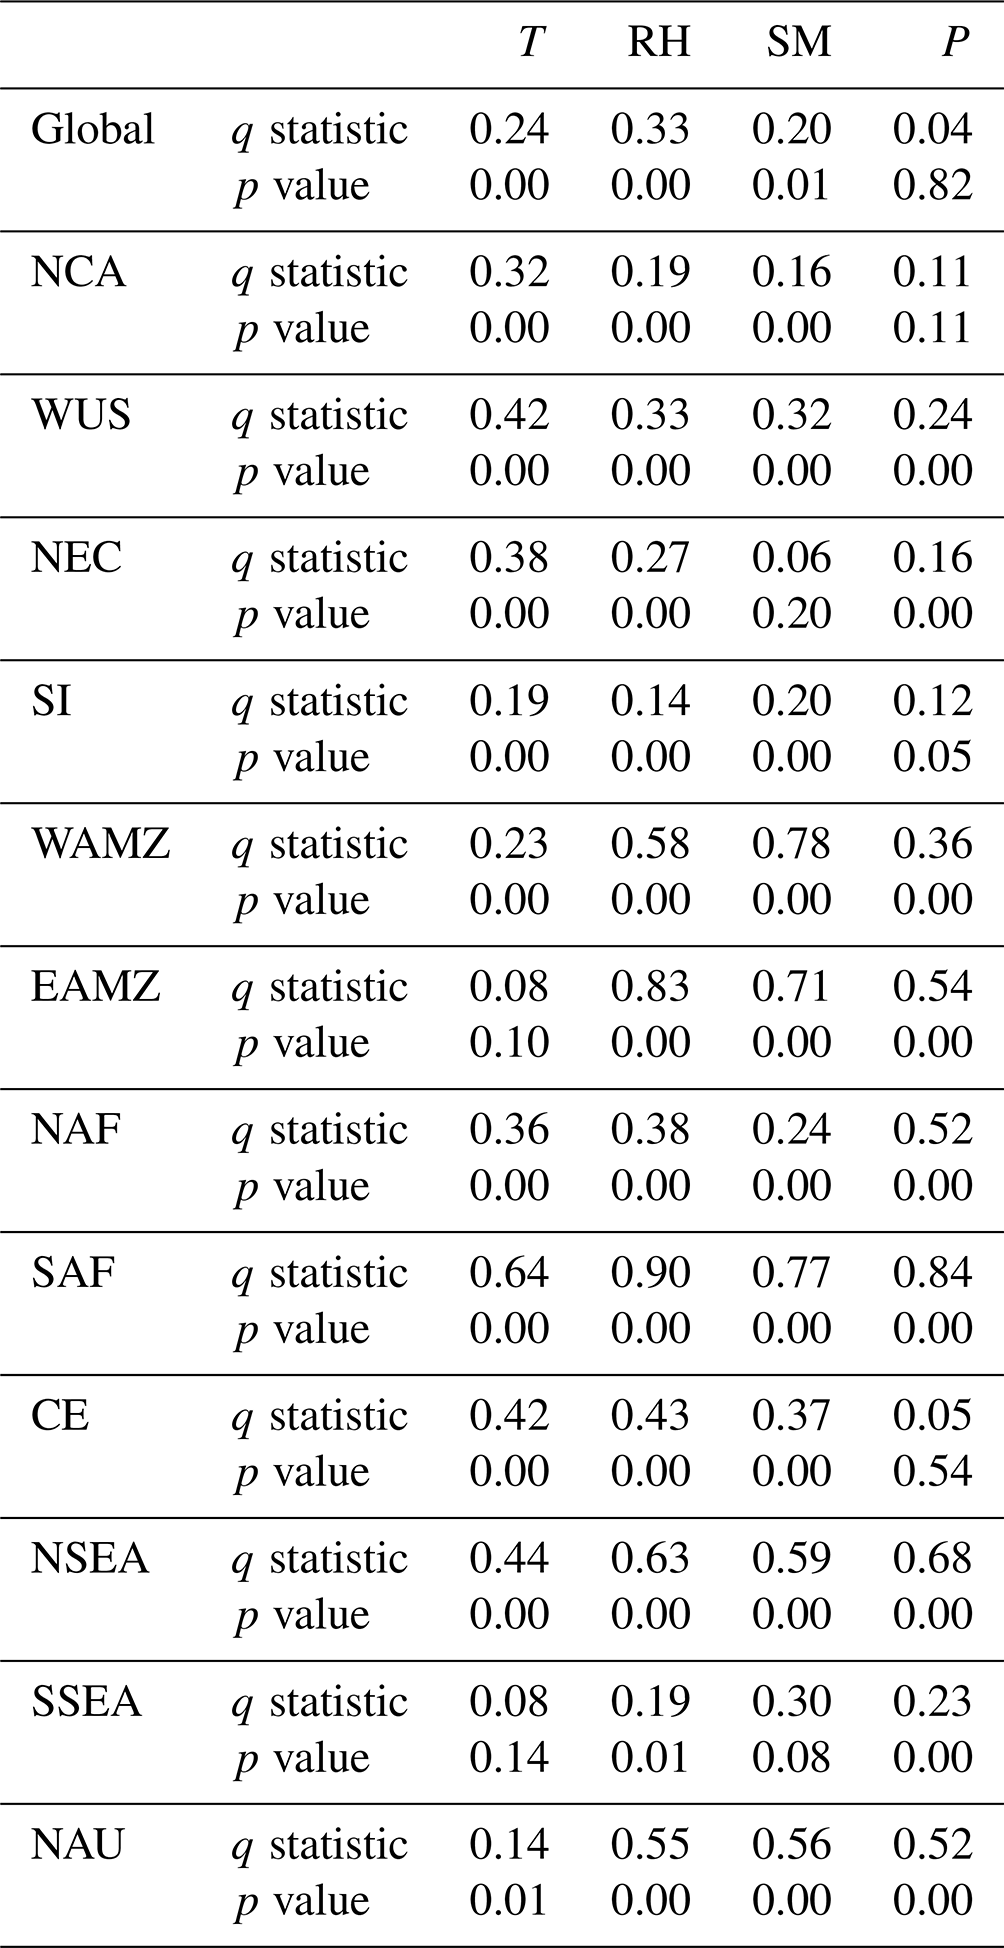
Table 4The impact of interaction between meteorological factors on fire changes in different regions. T is temperature, RH is relative humidity, SM is soil moisture, and P is total precipitation. The bold numbers indicate that the interaction factor has a significant difference regarding the impact on fire compared with a single meteorological factor.
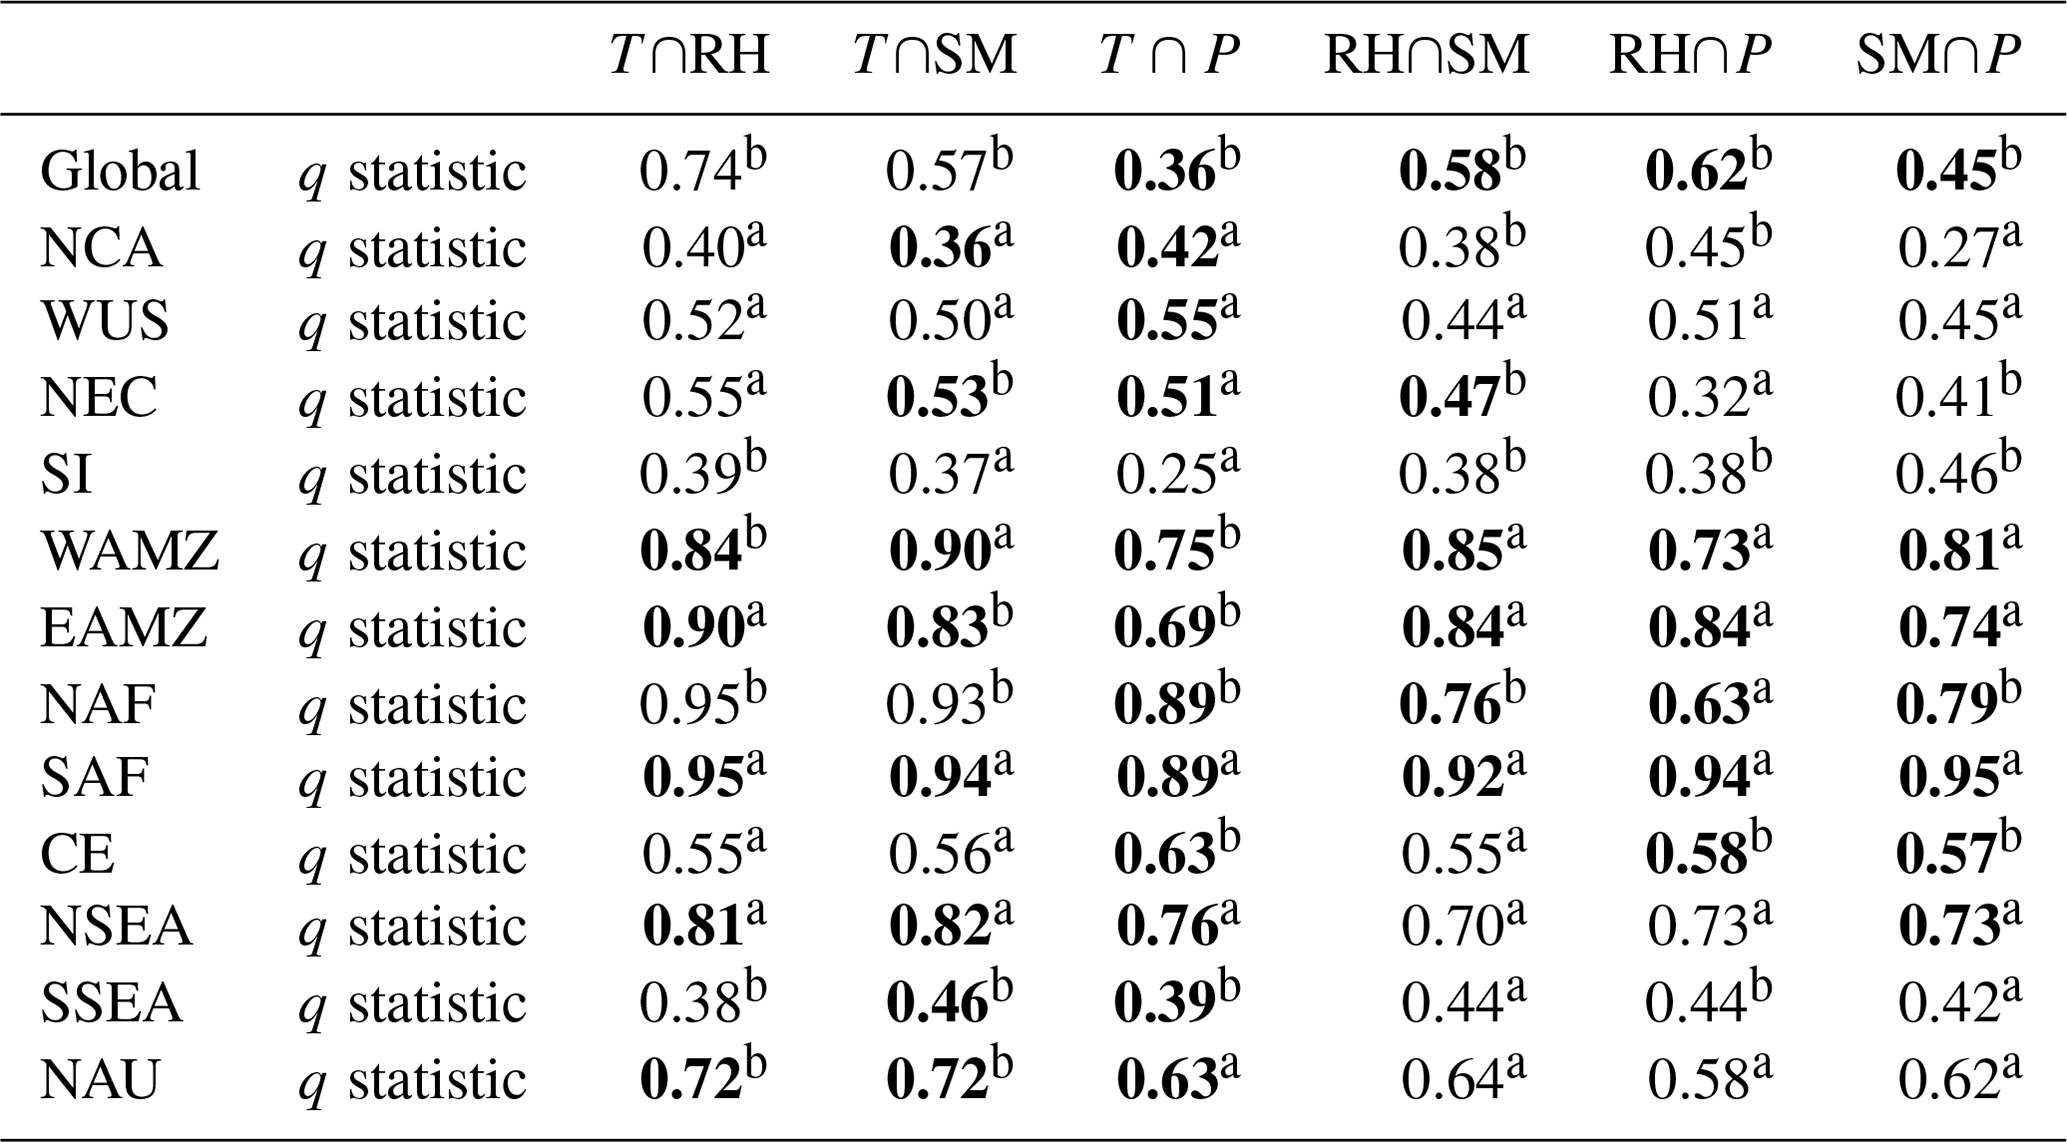
a The interaction belongs to bi-factor enhancement. b The interaction belongs to nonlinear enhancement.
This study further investigated the variation trend and spatial distribution characteristics of temperature, precipitation, relative humidity, and soil moisture during the fire season (Fig. S2). In general, the variation trend of meteorological factors in the fire season is similar to the annual variation trend in spatial pattern. Due to the large regional and seasonal differences in meteorological factors, this study conducted annual and seasonal sliding trend analysis of each variable in each region to further explore the influence of meteorological factors in each region on fire activities (Figs. S3–S6). In 2001–2019, the precipitation in the western Amazon region decreased in summer, and the relative humidity and soil moisture showed a declining trend in summer and autumn, which was favorable for the occurrence and spread of fire. As a result, the peak value of BA in the western Amazon region rose prior to 2007 before falling, which was congruent with the rise in relative humidity and soil moisture. BA in the eastern Amazon region showed a slight increasing trend, which may be related to the increase in temperature and the decrease in precipitation and soil moisture in the past decade. From the perspective of meteorological factors, the significant increase in relative humidity and soil moisture can promote the growth of vegetation, which is conducive to vegetation recovery and reduces the risk of fire (Brandt et al., 2017; Yue et al., 2017). In recent years, the precipitation in central Europe has increased, and the relative humidity and soil humidity have increased after decreasing, which is conducive to the growth of vegetation and makes the air more humid. At the same time, the reduction in summer temperature also reduces the risk of wildfires (Chen et al., 2020; Hao et al., 2021).
The temperature in NCA increased significantly in recent years (Fig. 9), and precipitation (summer and autumn), relative humidity (spring and summer), and soil moisture (spring and winter) showed an increasing trend. As a result, the plant growth period was prolonged in these locations as precipitation and soil moisture increased, which was beneficial to the growth of vegetation, and hence more combustible materials were stored. However, higher temperatures in summer increased the risk of fire occurrence, which eventually caused increased emissions from biomass burning (Junghenn Noyes et al., 2022). Similar fluctuations and reasons are present in WUS fire activity (Kaulfus et al., 2017; Lu et al., 2016; Xue et al., 2021). In recent years, SI has revealed a considerable rise in biomass burning emissions, particularly during the summer (Fig. 6). This is mainly due to the increase in temperature in the SI area (especially in spring and summer), the significant decrease in precipitation and soil moisture (summer and autumn), and the non-significant downward trend of relative humidity. In addition, the rise in temperature and the loss of soil moisture in winter further increased the possibility of fire disasters in winter, which is conducive to the formation of smoldering phenomena in SI (Chan et al., 2020; Konovalov et al., 2021). The above results indicate that, on the one hand, climate warming has greatly improved vegetation productivity and increased biomass fuels, especially in the extratropical Northern Hemisphere (Zhang et al., 2022). At the same time, a warmer climate promotes snowmelt, which causes fire seasons to start earlier but end later. On the other hand, global warming leads to higher summer temperatures and increased drought conditions, thus increasing the risk of extreme fires.
Finally, we quantified the impact of meteorological factors on fire changes in different regions based on the statistical model of geographical detectors (Table 3). Globally, the influence of temperature and relative humidity on fire is relatively high, which can explain 24 % and 33 % of the causes of fires, while the contribution of total precipitation is low and not significant. Regionally, the changes in fire occurrence in the middle and high latitudes of the Northern Hemisphere may be more susceptible to temperature. The proportion of temperature that can explain the change in fires in the NCA, WUS, NEC, CE, and SI areas is 32 %, 42 %, 38 %, 42 %, and 19 %, respectively. These areas have long winters, are covered with snow and have few open fires. Fire activities and high-emission periods are mainly concentrated in summer and autumn, so forest fire prevention in this period should be strengthened in the future. In contrast, fire activities in tropical areas (including the Amazon, Africa, Southeast Asia, and northern Australia) are more sensitive to relative humidity, soil moisture, and precipitation. This may be because the temperature change in different seasons in these areas is not obvious, but the drought caused by water vapor reduction is more likely to promote the increase in wildfires (Bowman et al., 2020; Brandt et al., 2017).
As shown in Table 4, the ability of interactions between meteorological factors to explain fire changes has been greatly improved compared with the use of a single meteorological factor. Especially for the Amazonian (WAMZ, EAMZ) and African (NAF, SAF) regions, where human activities are relatively less involved, natural meteorological elements can explain more than 70 % of fire changes. In areas with more human activities, human control has greatly changed the fire occurrence, and thus the contribution from interpretations of meteorological factors is relatively limited, which generally does not exceed 60 %. For example, in the eastern United States, western Europe, and eastern regions of China, despite the change in meteorological factors being large, fire activity has generally been stable over the past 20 years, which is mainly attributed to the fact that most of the land surface types are urban land, with fewer combustible substances, and the surface landscape (such as road network) has separated the vegetation areas (Andela et al., 2017; Fan et al., 2021; Feng et al., 2021; Zhang et al., 2018). In reality, there are many natural and human factors that can cause and affect fires, such as lightning or arson, which have not been considered in this study. This research mainly attempts to conduct quantitative exploration from the perspective of the atmospheric environment and the ways that it may affect fire changes.
Multi-source satellite remote sensing data were used in this study to analyze the spatiotemporal characteristics of global fire activity and intensity at timescales over the last 20 years, and fire emission data (GFAS) were used to quantitatively analyze emission fluxes and seasonal variations in typical regions. Finally, using the ERA-5 meteorological data, it assessed the effects of fire and fire duration meteorological factors on biomass burning and emissions at the global and typical regional levels. This study clarifies the global and regional fire activities and their emission characteristics and provides a reference for quantifying the impact of meteorological factors on fires. Specific conclusions are as follows.
-
The global fire burning area showed a slow decreasing trend. The fire activities (BF, FC, and FRP) were quite different among regions and had seasonal variation characteristics that were high in summer and autumn and low in winter and spring. Specifically, the seasonal fluctuation in fire events increased with increases in latitude. Fuel richness and climate conditions are the key factors that determine the occurrence and development of fire.
-
Although the fire-burned area has decreased over the past 20 years, there has not been a corresponding reduction in the amount of emissions caused by fires worldwide. The primary type of emissions from biomass burning is greenhouse gases with CO2 as the dominant component, followed by aerosol and air pollution. There were differences in emissions among the 12 typical regions. The tropical region and the Southern Hemisphere showed relatively weak changes in emissions, while the increased fire activity in forested regions of middle and high latitudes in the Northern Hemisphere, especially in summer, was the main cause of the overall increase in regional emissions in the past decade.
-
Regional variations in meteorological conditions clearly affect the frequency and severity of fires. When there is less human interference, variations in climatic variables, including temperature, precipitation, relative humidity, and soil moisture have a stronger correlation with changes in fire activity and intensity. For instance, meteorological factors can explain more than 70 % of fire changes in the Amazonian and African rainforests. In regions with relatively strict artificial fire management, such as the eastern United States, western Europe, and China, fire activity has generally been stable over the past 20 years. This is mostly attributable to the development of artificial fire suppression techniques and the division of vegetative regions into surface landscapes and built-up urban areas.
The MOD14 product and FireCCI51 dataset can be downloaded from https://firms.modaps.eosdis.nasa.gov/download/ (last access: 25 February 2023, Giglio et al., 2016) and https://climate.esa.int/en/projects/fire/data/ (last access: 12 February 2023, Lizundia-Loiola et al., 2020), respectively. The MCD64CMQ product can be downloaded from https://modis-fire.umd.edu/ba.html (last access: 23 February 2023, Giglio et al., 2018). Fire emission data from the Global Fire Assimilation System (GFAS) can be downloaded from (https://atmosphere.copernicus.eu/global-fire-emissions/, last access: 3 February 2022, Kaiser et al., 2012). ERA-5 Reanalysis data were provided by the European Centre for Medium Weather Forecasts (https://doi.org/10.24381/cds.f17050d7, Hersbach et al., 2019). Data related to the results can be obtained from https://doi.org/10.5281/zenodo.7997467 (Fan, 2023).
The supplement related to this article is available online at: https://doi.org/10.5194/acp-23-7781-2023-supplement.
CZ designed the research, and CZ and HF carried out the research and wrote the manuscript. XY provided constructive comments and revised the manuscript many times. YY and ZS provided constructive comments about the research. All authors made substantial contributions to this work.
The contact author has declared that none of the authors has any competing interests.
Publisher's note: Copernicus Publications remains neutral with regard to jurisdictional claims in published maps and institutional affiliations.
This work was supported by the National Natural Science Foundation of China (grant nos. 41925022 and 42205178) and the China Postdoctoral Science Foundation (grant no. 2022M720459).
This research has been supported by the National Natural Science Foundation of China (grant nos. 41925022 and 42205178) and the China Postdoctoral Science Foundation (grant no. 2022M720459).
This paper was edited by Hang Su and reviewed by Qingqing Xu and one anonymous referee.
Akagi, S. K., Yokelson, R. J., Wiedinmyer, C., Alvarado, M. J., Reid, J. S., Karl, T., Crounse, J. D., and Wennberg, P. O.: Emission factors for open and domestic biomass burning for use in atmospheric models, Atmos. Chem. Phys., 11, 4039–4072, https://doi.org/10.5194/acp-11-4039-2011, 2011.
Albergel, C., Dutra, E., Munier, S., Calvet, J.-C., Munoz-Sabater, J., de Rosnay, P., and Balsamo, G.: ERA-5 and ERA-Interim driven ISBA land surface model simulations: which one performs better?, Hydrol. Earth Syst. Sci., 22, 3515–3532, https://doi.org/10.5194/hess-22-3515-2018, 2018.
Andela, N. and van der Werf, G.: Recent trends in African fires driven by cropland expansion and El Niño to La Niña transition, Nat. Clim. Change, 4, 791–795, https://doi.org/10.1038/nclimate2313, 2014.
Andela, N., Morton, D. C., Giglio, L., Chen, Y., van der Werf, G. R., Kasibhatla, P. S., DeFries, R. S., Collatz, G. J., Hantson, S., Kloster, S., Bachelet, D., Forrest, M., Lasslop, G., Li, F., Mangeon, S., Melton, J. R., Yue, C., and Randerson, J. T.: A human-driven decline in global burned area, Science, 356, 1356–1362, https://doi.org/10.1126/science.aal4108, 2017.
Archibald, S., Lehmann, C. E. R., Gómez-Dans, J. L., and Bradstock, R. A.: Defining pyromes and global syndromes of fire regimes, P. Natl. Acad. Sci. USA, 110, 6442–6447, https://doi.org/10.1073/pnas.1211466110, 2013.
Bian, H., Chin, M., Kawa, R., Duncan, B., Arellano Jr., A., and Kasibhatla, R.: Uncertainty of global CO simulations constraint by biomass burning emissions, J. Geophys. Res., 112, D23308, https://doi.org/10.1029/2006JD008376, 2007.
Bian, Q., Jathar, S. H., Kodros, J. K., Barsanti, K. C., Hatch, L. E., May, A. A., Kreidenweis, S. M., and Pierce, J. R.: Secondary organic aerosol formation in biomass-burning plumes: theoretical analysis of lab studies and ambient plumes, Atmos. Chem. Phys., 17, 5459–5475, https://doi.org/10.5194/acp-17-5459-2017, 2017.
Bistinas, I., Harrison, S. P., Prentice, I. C., and Pereira, J. M. C.: Causal relationships versus emergent patterns in the global controls of fire frequency, Biogeosciences, 11, 5087–5101, https://doi.org/10.5194/bg-11-5087-2014, 2014.
Bowman, D., Williamson, G., Yebra, M., Lizundia-Loiola, J., Pettinari, M. L., Shah, S., Bradstock, R., and Chuvieco, E.: Wildfires: Australia needs national monitoring agency, Nature, 584, 188–191, https://doi.org/10.1038/d41586-020-02306-4, 2020.
Brandt, M., Rasmussen, K., Peñuelas, J., Tian, F., Schurgers, G., Verger, A., Mertz, O., Palmer, J. R. B., and Fensholt, R.: Human population growth offsets climate-driven increase in woody vegetation in sub-Saharan Africa, Nat. Ecol. Evol., 1, 0081, https://doi.org/10.1038/s41559-017-0081, 2017.
Burke, M., Driscoll, A., Heft-Neal, S., Xue, J., Burney, J., and Wara, M.: The changing risk and burden of wildfire in the United States, P. Natl. Acad. Sci. USA, 118, e2011048118, https://doi.org/10.1073/pnas.2011048118, 2021.
Cascio, W. E.: Wildland fire smoke and human health, Sci. Total Environ., 624, 586–595, https://doi.org/10.1016/j.scitotenv.2017.12.086, 2018.
Chan, L. K., Nguyen, K. Q., Karim, N., Yang, Y., Rice, R. H., He, G., Denison, M. S., and Nguyen, T. B.: Relationship between the molecular composition, visible light absorption, and health-related properties of smoldering woodsmoke aerosols, Atmos. Chem. Phys., 20, 539–559, https://doi.org/10.5194/acp-20-539-2020, 2020.
Chen, J., Budisulistiorini, S. H., Miyakawa, T., Komazaki, Y., and Kuwata, M.: Secondary aerosol formation promotes water uptake by organic-rich wildfire haze particles in equatorial Asia, Atmos. Chem. Phys., 18, 7781–7798, https://doi.org/10.5194/acp-18-7781-2018, 2018.
Chen, S., Wu, R., Chen, W., Yao, S., and Yu, B.: Coherent interannual variations of springtime surface temperature and temperature extremes between central-northern Europe and Northeast Asia, J. Geophys. Res.-Atmos., 125, e2019JD032226, https://doi.org/10.1029/2019JD032226, 2020.
Damoah, R., Spichtinger, N., Forster, C., James, P., Mattis, I., Wandinger, U., Beirle, S., Wagner, T., and Stohl, A.: Around the world in 17 days – hemispheric-scale transport of forest fire smoke from Russia in May 2003, Atmos. Chem. Phys., 4, 1311–1321, https://doi.org/10.5194/acp-4-1311-2004, 2004.
Ding, K., Huang, X., Ding, A. Wang, M., Su, H., Kerminen, V.-M., Petäjä, T., Tan, Z., Wang, Z., Zhou, D., Sun, J., Liao, H., Wang, H., Carslaw, K., Wood, R., Zuidema, P., Rosenfeld, D., Kulmala, M., Fu, C., Pöschl, U., Cheng Y., and Andreae, M. O.: Aerosol-boundary-layer-monsoon interactions amplify semi-direct effect of biomass smoke on low cloud formation in Southeast Asia, Nat. Commun., 12, 6416, https://doi.org/10.1038/s41467-021-26728-4, 2021.
Engelmann, R., Ansmann, A., Ohneiser, K., Griesche, H., Radenz, M., Hofer, J., Althausen, D., Dahlke, S., Maturilli, M., Veselovskii, I., Jimenez, C., Wiesen, R., Baars, H., Bühl, J., Gebauer, H., Haarig, M., Seifert, P., Wandinger, U., and Macke, A.: Wildfire smoke, Arctic haze, and aerosol effects on mixed-phase and cirrus clouds over the North Pole region during MOSAiC: an introduction, Atmos. Chem. Phys., 21, 13397–13423, https://doi.org/10.5194/acp-21-13397-2021, 2021.
Evangeliou, N., Shevchenko, V. P., Yttri, K. E., Eckhardt, S., Sollum, E., Pokrovsky, O. S., Kobelev, V. O., Korobov, V. B., Lobanov, A. A., Starodymova, D. P., Vorobiev, S. N., Thompson, R. L., and Stohl, A.: Origin of elemental carbon in snow from western Siberia and northwestern European Russia during winter–spring 2014, 2015 and 2016, Atmos. Chem. Phys., 18, 963–977, https://doi.org/10.5194/acp-18-963-2018, 2018.
Fan, H., Wang, Y., Zhao, C., Yang, Y., Yang, X., Sun, Y., and Jiang, S.: The role of primary emission and transboundary trans-port in the air quality changes during and after the COVID-19 lockdown in China, Geophys. Res. Lett., 48, e2020GL091065, https://doi.org/10.1029/2020GL091065, 2021.
Fan, H.: Wildfire CODE AND DATA, Zenodo [code/data set], https://doi.org/10.5281/zenodo.7997467, 2023.
Feng, Y., Ziegler, A. D., Elsen, P. R. Liu, Y., He, X., Spracklen, D. V., Holden, J., Jiang, X., Zheng, C., and Zeng, Z.: Upward expansion and acceleration of forest clearance in the mountains of Southeast Asia, Nat. Sustain., 4, 892–899, https://doi.org/10.1038/s41893-021-00738-y, 2021.
Giglio, L., Loboda, T., Roy, D. P., Quayle, B., and Justice, C. O.: An active-fire based burned area mapping algorithm for the MODIS sensor, Remote Sens. Environ., 113, 408–420, https://doi.org/10.1016/j.rse.2008.10.006, 2009.
Giglio, L., Randerson, J. T., van der Werf, G. R., Kasibhatla, P. S., Collatz, G. J., Morton, D. C., and DeFries, R. S.: Assessing variability and long-term trends in burned area by merging multiple satellite fire products, Biogeosciences, 7, 1171–1186, https://doi.org/10.5194/bg-7-1171-2010, 2010.
Giglio, L., Randerson, J. T., and van der Werf, G. R.: Analysis of daily, monthly, and annual burned area using the fourth-generation global fire emissions database (GFED4), J. Geophys. Res.-Biogeo., 118, 317–328, https://doi.org/10.1002/jgrg.20042, 2013.
Giglio, L., Schroeder, W., and Justice, C. O.: The collection 6 MODIS active fire detection algorithm and fire products, Remote Sens. Environ., 178, 31–41, https://doi.org/10.1016/j.rse.2016.02.054, 2016 (data available at: https://firms.modaps.eosdis.nasa.gov/download/, last access: 25 February 2022).
Giglio, L., Boschetti, L., Roy, D. P., Humber, M. L., and Justice, C. O.: The Collection 6 MODIS burned area mapping algorithm and product, Remote Sens. Environ., 217, 72–85, https://doi.org/10.1016/j.rse.2018.08.005, 2018 (data available at: https://modis-fire.umd.edu/ba.html, last access: 23 February 2022).
Govender, N., Trollope, W. S. W., and Van Wilgen, B. W.: The effect of fire season, fire frequency, rainfall and management on fire intensity in savanna vegetation in South Africa, J. Appl. Ecol., 43, 748–758, https://doi.org/10.1111/j.1365-2664.2006.01184.x, 2006.
Grillakis, M., Voulgarakis, A., Rovithakis, A., Seiradakis, K. D., Koutroulis, A., Field, R. D., Kasoar, M., Papadopoulos, A., and Lazaridis, M.: Climate drivers of global wildfire burned area, Environ. Res. Lett., 17, 045021, https://doi.org/10.1088/1748-9326/ac5fa1, 2022.
Gui, K., Che, H., Li, Lei, Zheng, Y., Zhang, L., Zhao, H., Zhong, J., Yao, W., Liang, Y., Wang, Y., and Zhang, X.: The significant contribution of small-sized and spherical aerosol particles to the decreasing trend in total aerosol optical depth over land from 2003 to 2018, Engineering, 16, 82–92, https://doi.org/10.1016/j.eng.2021.05.017, 2021.
Guo, J., Zhang, J., Yang, K., Liao, H., Zhang, S., Huang, K., Lv, Y., Shao, J., Yu, T., Tong, B., Li, J., Su, T., Yim, S. H. L., Stoffelen, A., Zhai, P., and Xu, X.: Investigation of near-global daytime boundary layer height using high-resolution radiosondes: first results and comparison with ERA5, MERRA-2, JRA-55, and NCEP-2 reanalyses, Atmos. Chem. Phys., 21, 17079–17097, https://doi.org/10.5194/acp-21-17079-2021, 2021.
Hao, W. M., Reeves, M. C., Baggett, L. S., Balkanski, Y., Ciais, P., Nordgren, B. L., Petkov, A., Corley, R. E., Mouillot, F., Urbanski, S. P., and Yue, C.: Wetter environment and increased grazing reduced the area burned in northern Eurasia from 2002 to 2016, Biogeosciences, 18, 2559–2572, https://doi.org/10.5194/bg-18-2559-2021, 2021.
Hennigan, C. J., Westervelt, D. M., Riipinen, I., Engelhart, G. J., Lee, T., Collett, J. L., Pandis, S. N., Adams, P. J., and Robinson, A. L.: New particle formation and growth in biomass burning plumes: An important source of cloud condensation nuclei, Geophys. Res. Lett., 39, L09805, https://doi.org/10.1029/2012GL050930, 2012.
Hersbach, H., Bell, B., Berrisford, P., Biavati, G., Horányi, A., Muñoz Sabater, J., Nicolas, J., Peubey, C., Radu, R., Rozum, I., Schepers, D., Simmons, A., Soci, C., Dee, D., and Thépaut, J.-N.: ERA5 monthly averaged data on single levels from 1979 to present, Copernicus Climate Change Service (C3S) Climate Data Store (CDS) [data set], https://doi.org/10.24381/cds.f17050d7, 2019.
Hooghiem, J. J. D., Popa, M. E., Röckmann, T., Grooß, J.-U., Tritscher, I., Müller, R., Kivi, R., and Chen, H.: Wildfire smoke in the lower stratosphere identified by in situ CO observations, Atmos. Chem. Phys., 20, 13985–14003, https://doi.org/10.5194/acp-20-13985-2020, 2020.
Huang, X., Ding, K., Liu, J., Wang, Z., Tang, R., Xue, L., Wang, H., Zhang, Q., Tan, Z., Fu, C., Davis, S. J., Andreae M. O., and Ding, A.: Smoke-weather interaction affects extreme wildfires in diverse coastal regions, Science, 379, 457–461, https://doi.org/10.1126/science.add9843, 2023.
Huangfu, Y., Yuan, B., Wang, S., Wu, C., He, X., Qi, J., deGouw, J., Warneke, C., Gilman, J. B., Wistahler, A., Karl, T., Graus, M., Jobson, B. T., and Shao, M.: Revisiting acetonitrile as tracer of biomass burning in anthropogenic-influenced environments, Geophys. Res. Lett., 48, e2020GL092322, https://doi.org/10.1029/2020GL092322, 2021.
Jaffe, D. A., Bertschi, I., Jaegle, L., Novelli, P., Reid, J. S., Tanimoto, H., Vingarzan, R., and Westphal, D. L.: Long-range transport of Siberian biomass burning emissions and impact on surface ozone in western North America, Geophys. Res. Lett., 31, L16106, https://doi.org/10.1029/2004GL020093, 2004.
Jolly, W., Cochrane, M., Freeborn, P. Holden, Z. A., Brown, T. J., Williamson G. J., and Bowman, D. M. J. S.: Climate-induced variations in global wildfire danger from 1979 to 2013, Nat. Commun., 6, 7537, https://doi.org/10.1038/ncomms8537, 2015.
Junghenn Noyes, K. T., Kahn, R. A., Limbacher, J. A., and Li, Z.: Canadian and Alaskan wildfire smoke particle properties, their evolution, and controlling factors, from satellite observations, Atmos. Chem. Phys., 22, 10267–10290, https://doi.org/10.5194/acp-22-10267-2022, 2022.
Kaiser, J. W., Heil, A., Andreae, M. O., Benedetti, A., Chubarova, N., Jones, L., Morcrette, J.-J., Razinger, M., Schultz, M. G., Suttie, M., and van der Werf, G. R.: Biomass burning emissions estimated with a global fire assimilation system based on observed fire radiative power, Biogeosciences, 9, 527–554, https://doi.org/10.5194/bg-9-527-2012, 2012 (data available at: https://atmosphere.copernicus.eu/global-fire-emissions, last access: 10 July 2023).
Kaulfus, A. S., Nair, U., Jaffe, D., Christopher, S. A., and Goodrick, S.: Biomass burning smoke climatology of the United States: implications for particulate matter air quality, Environ. Sci. Technol., 51, 11731–11741, https://doi.org/10.1021/acs.est.7b03292, 2017.
Kloss, C., Berthet, G., Sellitto, P., Ploeger, F., Bucci, S., Khaykin, S., Jégou, F., Taha, G., Thomason, L. W., Barret, B., Le Flochmoen, E., von Hobe, M., Bossolasco, A., Bègue, N., and Legras, B.: Transport of the 2017 Canadian wildfire plume to the tropics via the Asian monsoon circulation, Atmos. Chem. Phys., 19, 13547–13567, https://doi.org/10.5194/acp-19-13547-2019, 2019.
Konovalov, I. B., Golovushkin, N. A., Beekmann, M., and Andreae, M. O.: Insights into the aging of biomass burning aerosol from satellite observations and 3D atmospheric modeling: evolution of the aerosol optical properties in Siberian wildfire plumes, Atmos. Chem. Phys., 21, 357–392, https://doi.org/10.5194/acp-21-357-2021, 2021.
Kumar, A., Pierce, R. B., Ahmadov, R., Pereira, G., Freitas, S., Grell, G., Schmidt, C., Lenzen, A., Schwarz, J. P., Perring, A. E., Katich, J. M., Hair, J., Jimenez, J. L., Campuzano-Jost, P., and Guo, H.: Simulating wildfire emissions and plume rise using geostationary satellite fire radiative power measurements: a case study of the 2019 Williams Flats fire, Atmos. Chem. Phys., 22, 10195–10219, https://doi.org/10.5194/acp-22-10195-2022, 2022.
Lee, K. H., Kim, J. E., Kim, Y. J., Kim, J., and von Hoyningen-Huene, W.: Impact of the smoke aerosol from Russian forest fires on the atmospheric environment over Korea during May 2003, Atmos. Environ., 39, 85–99, https://doi.org/10.1016/j.atmosenv.2004.09.032, 2005.
Li, Y., Tong, D. Q., Ngan, F., Cohen, M. D., Stein, A. F., Kondragunta, S., Zhang, X., Ichoku, C., Hyer, E. J., and Kahn, R. A.: Ensemble PM2.5 forecasting during the 2018 camp fire event using the HYSPLIT transport and dispersion model, J. Geophys. Res.-Atmos., 125, e2020JD032768, https://doi.org/10.1029/2020JD032768, 2020.
Li, Y., Tong, D., Ma, S., Zhang, X., Kondragunta, S., Li, F., and Saylor, R.: Dominance of wildfires impact on air quality exceedances during the 2020 record-breaking wildfire season in the United States, Geophys. Res. Lett., 48, e2021GL094908, https://doi.org/10.1029/2021GL094908, 2021.
Liang, Y., Stamatis, C., Fortner, E. C., Wernis, R. A., Van Rooy, P., Majluf, F., Yacovitch, T. I., Daube, C., Herndon, S. C., Kreisberg, N. M., Barsanti, K. C., and Goldstein, A. H.: Emissions of organic compounds from western US wildfires and their near-fire transformations, Atmos. Chem. Phys., 22, 9877–9893, https://doi.org/10.5194/acp-22-9877-2022, 2022.
Liu, X., Huey, G., Yokelson, R. J., Selimovic, V., Simpson, I. J., Müller, M., Jimenez, J. L., Campuzano-Jost, P., Beyersdorf, A. J., Blake, D. R., Butterfield, Z., Choi, Y., Crounse, J. D., Day, D. A., Diskin, G. S., Dubey, M. K., Fortner, E., Hanisco, T. F., Hu, W., King, L. E., Kleinman, L., Meinardi, S., Mikoviny, T., Onasch, T. B., Palm, B. B., Peischl, J., Pollack, I. B., Ryerson, T. B., Sachse, G. W., Sedlacek, A. J., Shilling, J. E., Springston, S., St. Clair, J. M., Tanner, D. J., Teng, A. P., Wennberg, P. O., Wisthaler, A., and Wolfe, G. M.: Airborne measurements of western U.S. wildfire emissions: Comparison with prescribed burning and air quality implications, J. Geophys. Res.-Atmos., 122, 6108–6129, https://doi.org/10.1002/2016JD026315, 2017.
Liu, Y., Austin, E., Xiang, J., Gould, T., Larson, T., and Seto, E.: Health impact assessment of the 2020 Washington State wildfire smoke episode: Excess health burden attributable to increased PM2.5 exposures and potential exposure reductions, GeoHealth, 5, e2020GH000359, https://doi.org/10.1029/2020GH000359, 2021.
Lizundia-Loiola, J., Otón, G., Ramo, R., and Chuvieco, E.: A spatio-temporal active-fire clustering approach for global burned area mapping at 250 m from MODIS data, Remote Sens. Environ., 236, 111493, https://doi.org/10.1016/j.rse.2019.111493, 2020 (data available at: https://climate.esa.int/en/projects/fire/data/, last access: 12 February 2022).
Lu, X., Zhang, L., Yue, X., Zhang, J., Jaffe, D. A., Stohl, A., Zhao, Y., and Shao, J.: Wildfire influences on the variability and trend of summer surface ozone in the mountainous western United States, Atmos. Chem. Phys., 16, 14687–14702, https://doi.org/10.5194/acp-16-14687-2016, 2016.
Marlon, J. R., Bartlein, P. J., Daniau, A.-L., Harrison, S. P., Maezumi, S. Y., Power, M. J., Tinner, W., and Vanniére, B.: Global biomass burning: a synthesis and review of Holocene paleofifire records and their controls, Quaternary Sci. Rev., 65, 5–25, https://doi.org/10.1016/j.quascirev.2012.11.029, 2013.
Ohneiser, K., Ansmann, A., Kaifler, B., Chudnovsky, A., Barja, B., Knopf, D. A., Kaifler, N., Baars, H., Seifert, P., Villanueva, D., Jimenez, C., Radenz, M., Engelmann, R., Veselovskii, I., and Zamorano, F.: Australian wildfire smoke in the stratosphere: the decay phase in 2020/2021 and impact on ozone depletion, Atmos. Chem. Phys., 22, 7417–7442, https://doi.org/10.5194/acp-22-7417-2022, 2022.
O’Neill, S. M., Diao, M., Raffuse, S., Al-Hamdan, M., Barik, M., Jia, Y., Reid, S., Zou, Y., Tong, D., West, J. J., Wilkins, J., Marsha, A., Freedman, F., Vargo, J., Larkin, N. K., Alvarado, E., and Loesche, P.: A multi-analysis approach for estimating regional health impacts from the 2017 Northern California wildfires, JAPCA J. Air Waste Ma., 71, 791–814, https://doi.org/10.1080/10962247.2021.1891994, 2021.
Pan, X., Ichoku, C., Chin, M., Bian, H., Darmenov, A., Colarco, P., Ellison, L., Kucsera, T., da Silva, A., Wang, J., Oda, T., and Cui, G.: Six global biomass burning emission datasets: intercomparison and application in one global aerosol model, Atmos. Chem. Phys., 20, 969–994, https://doi.org/10.5194/acp-20-969-2020, 2020.
Permar, W., Wang, Q., Selimovic, V., Wielgasz, C., Yokelson, R. J., Hornbrook, R. S., Hills, A. J., Apel, E. C., Ku, I. T., Zhou, Y., Sive, B. C., Sullivan, A. P., Collett, J. L., Campos, T. L., Palm, B. B., Peng, Q., Thornton, J. A., Garofalo, L. A., Farmer, D. K., Kreidenweis, S. M., Levin, E. J. T., DeMott, P. J., Flocke, F., Fischer, E. V., and Hu, L.: Emissions of Trace Organic Gases From Western U.S. Wildfires Based on WE-CAN Aircraft Measurements, J. Geophys. Res.-Atmos., 126, 1–29, https://doi.org/10.1029/2020JD033838, 2021.
Rantanen, M., Karpechko, A.Y., Lipponen, A., Nordling, K., Hyvärinen, O., Ruosteenoja, K., Vihma, T., and Laaksonen, A.: The Arctic has warmed nearly four times faster than the globe since 1979, Commun. Earth Environ., 3, 168, https://doi.org/10.1038/s43247-022-00498-3, 2022.
Reid, C. E., Brauer, M., Johnston, F. H., Jerrett, M., Balmes, J. R., and Elliott, C. T.: Critical review of health impacts of wildfire smoke exposure, Environ. Health Persp., 124, 1334–1343, https://doi.org/10.1289/ehp.1409277, 2016.
Requia, W. J., Amini, H., Mukherjee, R., Gold, D. R., and Schwartz, J. D.: Health impacts of wildfire-related air pollution in Brazil: a nationwide study of more than 2 million hospital admissions between 2008 and 2018, Nat. Commun., 12, 6555, https://doi.org/10.1038/s41467-021-26822-7, 2021.
Senande-Rivera, M., Insua-Costa, D., and Miguez-Macho, G.: Spatial and temporal expansion of global wildland fire activity in response to climate change, Nat. Commun., 13, 1208, https://doi.org/10.1038/s41467-022-28835-2, 2022.
Spracklen, D. V., Reddington, C. L., and Gaveau, D. L. A.: Industrial concessions, fires and air pollution in Equatorial Asia, Environ. Res. Lett., 10, 091001, https://doi.org/10.1088/1748-9326/10/9/091001, 2015.
Tian, C., Yue, X., Zhu, J., Liao, H., Yang, Y., Lei, Y., Zhou, X., Zhou, H., Ma, Y., and Cao, Y.: Fire–climate interactions through the aerosol radiative effect in a global chemistry–climate–vegetation model, Atmos. Chem. Phys., 22, 12353–12366, https://doi.org/10.5194/acp-22-12353-2022, 2022.
Turetsky, M. R., Benscoter, B., Page, S., Rein, G., Van Der Werf, G. R., and Watts, A.: Global vulnerability of peatlands to fire and carbon loss, Nat. Geosci., 8, 11–14, https://doi.org/10.1038/ngeo2325, 2015.
van der Werf, G. R., Randerson, J. T., Giglio, L., Collatz, G. J., Kasibhatla, P. S., and Arellano Jr., A. F.: Interannual variability in global biomass burning emissions from 1997 to 2004, Atmos. Chem. Phys., 6, 3423–3441, https://doi.org/10.5194/acp-6-3423-2006, 2006.
van der Werf, G. R., Randerson, J. T., Giglio, L., Collatz, G. J., Mu, M., Kasibhatla, P. S., Morton, D. C., DeFries, R. S., Jin, Y., and van Leeuwen, T. T.: Global fire emissions and the contribution of deforestation, savanna, forest, agricultural, and peat fires (1997–2009), Atmos. Chem. Phys., 10, 11707–11735, https://doi.org/10.5194/acp-10-11707-2010, 2010.
van Wees, D., van der Werf, G. R., Randerson, J. T., Rogers, B. M., Chen, Y., Veraverbeke, S., Giglio, L., and Morton, D. C.: Global biomass burning fuel consumption and emissions at 500 m spatial resolution based on the Global Fire Emissions Database (GFED), Geosci. Model Dev., 15, 8411–8437, https://doi.org/10.5194/gmd-15-8411-2022, 2022.
Wang, J. F., Li, X. H., Christakos, G., Liao, Y. L., Zhang, T., Gu, X., and Zheng, X. Y.: Geographical detectors-based health risk assessment and its application in the neural tube defects study of the Heshun region, China, Int. J. Geogr. Inf. Sci., 24, 107–127, https://doi.org/10.1080/13658810802443457, 2010.
Wang, J. F., Zhang, T. L., and Fu, B. J.: A measure of spatial stratified heterogeneit, Ecol. Indic., 67, 250–256, https://doi.org/10.1016/j.ecolind.2016.02.052, 2016.
Wu, C., Venevsky, S., Sitch, S., Mercado, L. M., Huntingford, C., and Staver, A. C.: Historical and future global burned area with changing climate and human demography, One Earth, 4, 517–530, https://doi.org/10.1016/j.oneear.2021.03.002, 2021.
Wu, C., Sitch, S., Huntingford, C., Mercado, L. M., Venevsky, S., Lasslop, G., Archibald, S., and Staver, A. C.: Reduced global fire activity due to human demography slows global warming by enhanced land carbon uptake, P. Natl. Acad. Sci. USA, 119, e2101186119, https://doi.org/10.1073/pnas.2101186119, 2022.
Xu, Q., Westerling, A. L., and Baldwin, W. J.: Spatial and temporal patterns of wildfire burn severity and biomass burning-induced emissions in California, Environ. Res. Lett., 17, 115001, https://doi.org/10.1088/1748-9326/ac9704, 2022.
Xue, Z., Gupta, P., and Christopher, S.: Satellite-based estimation of the impacts of summertime wildfires on PM2.5 concentration in the United States, Atmos. Chem. Phys., 21, 11243–11256, https://doi.org/10.5194/acp-21-11243-2021, 2021.
Yang, X., Zhao, C., Yang, Y., Yan, X., and Fan, H.: Statistical aerosol properties associated with fire events from 2002 to 2019 and a case analysis in 2019 over Australia, Atmos. Chem. Phys., 21, 3833–3853, https://doi.org/10.5194/acp-21-3833-2021, 2021.
Yu, P., Davis, S. M., Toon, O. B., Portmann, R. W., Bardeen, C. G., Barnes, J. E., Telg, H., Maloney, C., and Rosenlof, K. H.: Persistent stratospheric warming due to 2019–2020 Australian wildfire smoke, Geophys. Res. Lett., 48, e2021GL092609, https://doi.org/10.1029/2021GL092609, 2021.
Yu, Y. and Ginoux, P.: Enhanced dust emission following large wildfires due to vegetation disturbance, Nat. Geosci., 15, 878–884, https://doi.org/10.1038/s41561-022-01046-6, 2022.
Yue, C., Ciais, P., Bastos, A., Chevallier, F., Yin, Y., Rödenbeck, C., and Park, T.: Vegetation greenness and land carbon-flux anomalies associated with climate variations: a focus on the year 2015, Atmos. Chem. Phys., 17, 13903–13919, https://doi.org/10.5194/acp-17-13903-2017, 2017.
Zhang, A., Liu, Y., Goodrick, S., and Williams, M. D.: Duff burning from wildfires in a moist region: different impacts on PM2.5 and ozone, Atmos. Chem. Phys., 22, 597–624, https://doi.org/10.5194/acp-22-597-2022, 2022.
Zhang, H., Yee, L. D., Lee, B. H., Curtis, M. P., Worton, D. R., Isaacman-VanWertz, G., Offenberg, J. H., Lewandowski, M., Kleindienst, T. E., Beaver, M. R., Holder, A. L., Lonneman, W. A., Docherty, K. S., Jaoui, M., Pye, H. O. T., Hu, W., Day, D. A., Campuzano-Jost, P., Jimenez, J. L., Guo, H., Weber, R. J., de Gouw, J., Koss, A. R., Edgerton, E. S., Brune, W., Mohr, C., Lopez-Hilfiker, F. D., Lutz, A., Kreisberg, N. M., Spielman, S. R., Hering, S. V., Wilson, K. R., Thornton, J. A., and Goldstein, A. H.: Monoterpenes are the largest source of summertime organic aerosol in the southeastern United States, P. Natl. Acad. Sci. USA, 115, 2038–2043, https://doi.org/10.1073/pnas.1717513115, 2018.
Zhang, L., Wang, T., Zhang, Q., Zheng, J., Xu, Z., and Lv, M.: Potential sources of nitrous acid (HONO) and their impacts on ozone: A WRF-Chem study in a polluted subtropical region, J. Geophys. Res.-Atmos., 121, 3645–3662, https://doi.org/10.1002/2015JD024468, 2016.
Zhang, L., Liu, W., Hou, K., Lin, J., Song, C., Zhou, C., Huang, B., Tong, X., Wang, J., Rhine, W., Jiao, Y., Wang, Z., Ni, R., Liu, M., Zhang, L., Wang, Z., Wang, Y., Li, X., Liu, S., and Wang, Y.: Air pollution exposure associates with increased risk of neonatal jaundice, Nat. Commun., 10, 3741, https://doi.org/10.1038/s41467-019-11387-3, 2019.
Zhang, Y., Piao, S., Sun, Y., Rogers, B. M., Li, X., Lian, X., Liu, Z., Chen, A., and Peñuelas, J.: Future reversal of warming-enhanced vegetation productivity in the Northern Hemisphere, Nat. Clim. Change, 12, 581–586, https://doi.org/10.1038/s41558-022-01374-w, 2022.
Zheng, B., Ciais, P., Chevallier, F., Chuvieco, E., Chen, Y., and Yang, H.: Increasing forest fire emissions despite the decline in global burned area, Sci. Adv., 7, eabh2646, https://doi.org/10.1126/sciadv.abh2646, 2021.
Zhu, X., Xu, X., and Jia, G.: Asymmetrical trends of burned area between eastern and western Siberia regulated by atmospheric oscillation, Geophys. Res. Lett., 48, e2021GL096095, https://doi.org/10.1029/2021GL096095, 2021.
Zhuang, Y., Fu, R., Santer, B. D., Dickinson, R. E., and Hall, A.: Quantifying contributions of natural variability and anthropogenic forcings on increased fire weather risk over the western United States, P. Natl. Acad. Sci. USA, 118, e2111875118, https://doi.org/10.1073/pnas.2111875118, 2021.