the Creative Commons Attribution 4.0 License.
the Creative Commons Attribution 4.0 License.
 | 17 Jan 2023
Impacts of urbanization on air quality and the related health risks in a city with complex terrain
Chenchao Zhan
Hua Lu
Bojun Liu
Zheng Wu
Tijian Wang
Bingliang Zhuang
Mengmeng Li
Shu Li
Urbanization affects air pollutants via urban expansion and emission growth, thereby inevitably changing the health risks involved with air pollutants. However, the health risks related to urbanization are rarely estimated, especially for cities with complex terrain. In this study, a highly urbanized city with severe air pollution and complex terrain (Chengdu) is selected to explore this issue. The effects of urban expansion are further compared with emission growth because air quality management is usually achieved by regulating anthropogenic emissions. Air pollution in Chengdu was mainly caused by PM2.5 and O3 from 2015 to 2021. PM2.5 pollution tended to appear in cold months (November to February) owing to the blocking of air and the stable atmospheric layer, whereas O3 pollution was likely to occur in warm months (April to August) that experience high-temperature and strong-sunlight conditions and are dominated by high-pressure systems. From 2015 to 2021, the 7-year annual average of premature mortality from all non-accidental causes (ANACs) due to PM2.5 and O3 was 9386 (95 % confidence interval (CI) of 6542–11 726) and 8506 (95 % CI of 4817–11 882), respectively. Based on the characteristics of PM2.5 and O3, six numerical experiments were conducted to investigate the impacts of urban expansion and emission growth on the health risks related to air pollutants. The results show that urban land use led to an increase in the air temperature and boundary layer height compared with cropland, which was conducive to the diffusion of PM2.5. Thus, the monthly average surface PM2.5 concentrations decreased by 10.8 µg m−3 (7.6 %) in January. However, the monthly average daily maximum 8 h average (MDA8) O3 concentrations increased by 10.6 µg m−3 (6.0 %) in July owing to the stronger photochemical production and better vertical mixing during daytime. In this case, premature mortality from ANACs due to PM2.5 decreased by 171 (95 % CI of 129–200, or about 6.9 %) in January, and that due to O3 increased by 203 (95 % CI of 122–268, or about 9.5 %) in July. As for the effects of emission growth, the monthly average PM2.5 and MDA8 O3 concentrations increased by 23.9 (16.8 %) and 4.8 µg m−3 (2.7 %), respectively, when anthropogenic emissions were taken into account. Premature mortality from ANACs due to PM2.5 and O3 then increased by 388 (95 % CI of 291–456, or about 15.7 %) and 87 (95 % CI of 54–112, or about 4.1 %), respectively. From a health risk perspective, the effects of urban land use on the health risks related to PM2.5 are about half that of anthropogenic emissions, whereas the effects of urban land use on the health risks related to O3 can be 2 times that of anthropogenic emissions. This emphasizes that, in addition to regulating anthropogenic emissions, urban planning is also important for urban air quality, especially for secondary pollutants like O3.
- Article
(12216 KB) - Full-text XML
-
Supplement
(943 KB) - BibTeX
- EndNote


Air pollutants are substances that damage humans, plants and animals drastically when present in the atmosphere at sufficient concentrations (Baklanov et al., 2016; Kinney, 2018; Pautasso et al., 2010). The most common air pollutants are ozone (O3), fine particulate matter (PM2.5, particulate matter with an aerodynamic diameter of 2.5 µm or less), sulfur dioxide (SO2) and nitrogen oxides (NOx, which is comprised of NO and NO2). These air pollutants threaten human health in many parts of the world, evoking a series of health risks including cardiovascular diseases, respiratory diseases and chronic obstructive pulmonary disease (Brauer et al., 2016; Lelieveld et al., 2013; Manisalidis et al., 2020). According to the World Health Organization (WHO), exposure to ambient air pollutants is associated with 4.2 million premature deaths worldwide annually (https://www.who.int/health-topics/air-pollution#tab=tab_2, last access: 5 January 2023).
Most of those premature deaths occur in urban areas, as urban areas currently host more than 50 % of the population (over 3.5 billion people). This proportion is projected to increase to 70 % by 2050 due to ongoing urbanization (United Nations, 2018). Urbanization since the industrial revolution in the 19th century has led to a profound modification of land use via urban expansion (Seto et al., 2012). Natural surfaces are replaced by impervious surfaces, and the surface physical properties (e.g., albedo, thermal inertia and roughness) and processes (e.g., the exchange of water, momentum and energy) are then modified. These changes in the surface physical properties and processes exert an important influence on urban meteorology and air quality, which has been widely acknowledged in previous studies. Wang et al. (2009) explored the impacts of urban expansion on weather conditions as well as their implications for the O3 concentration in the Pearl River Delta, and they pointed out that urban land use changes can cause a 1.0 %–3.7 % increase in the 2 m temperature, a 5.9 %–6.3 % increase in the planetary boundary layer height and a 4.2 %–8.5 % increase in the surface O3 concentration. Liao et al. (2015) conducted a similar study in the Yangtze River Delta, and they found that urbanization increased the 2 m temperature, planetary boundary layer and surface O3 concentration but decreased the surface PM10 (particulate matter with an aerodynamic diameter of 10 µm or less) concentration. Similar conclusions about the impacts of urbanization on meteorology and air quality have also been reported in the Beijing–Tianjin–Hebei region (Yu et al., 2012) and the Sichuan Basin (H. Wang et al., 2021, 2022).
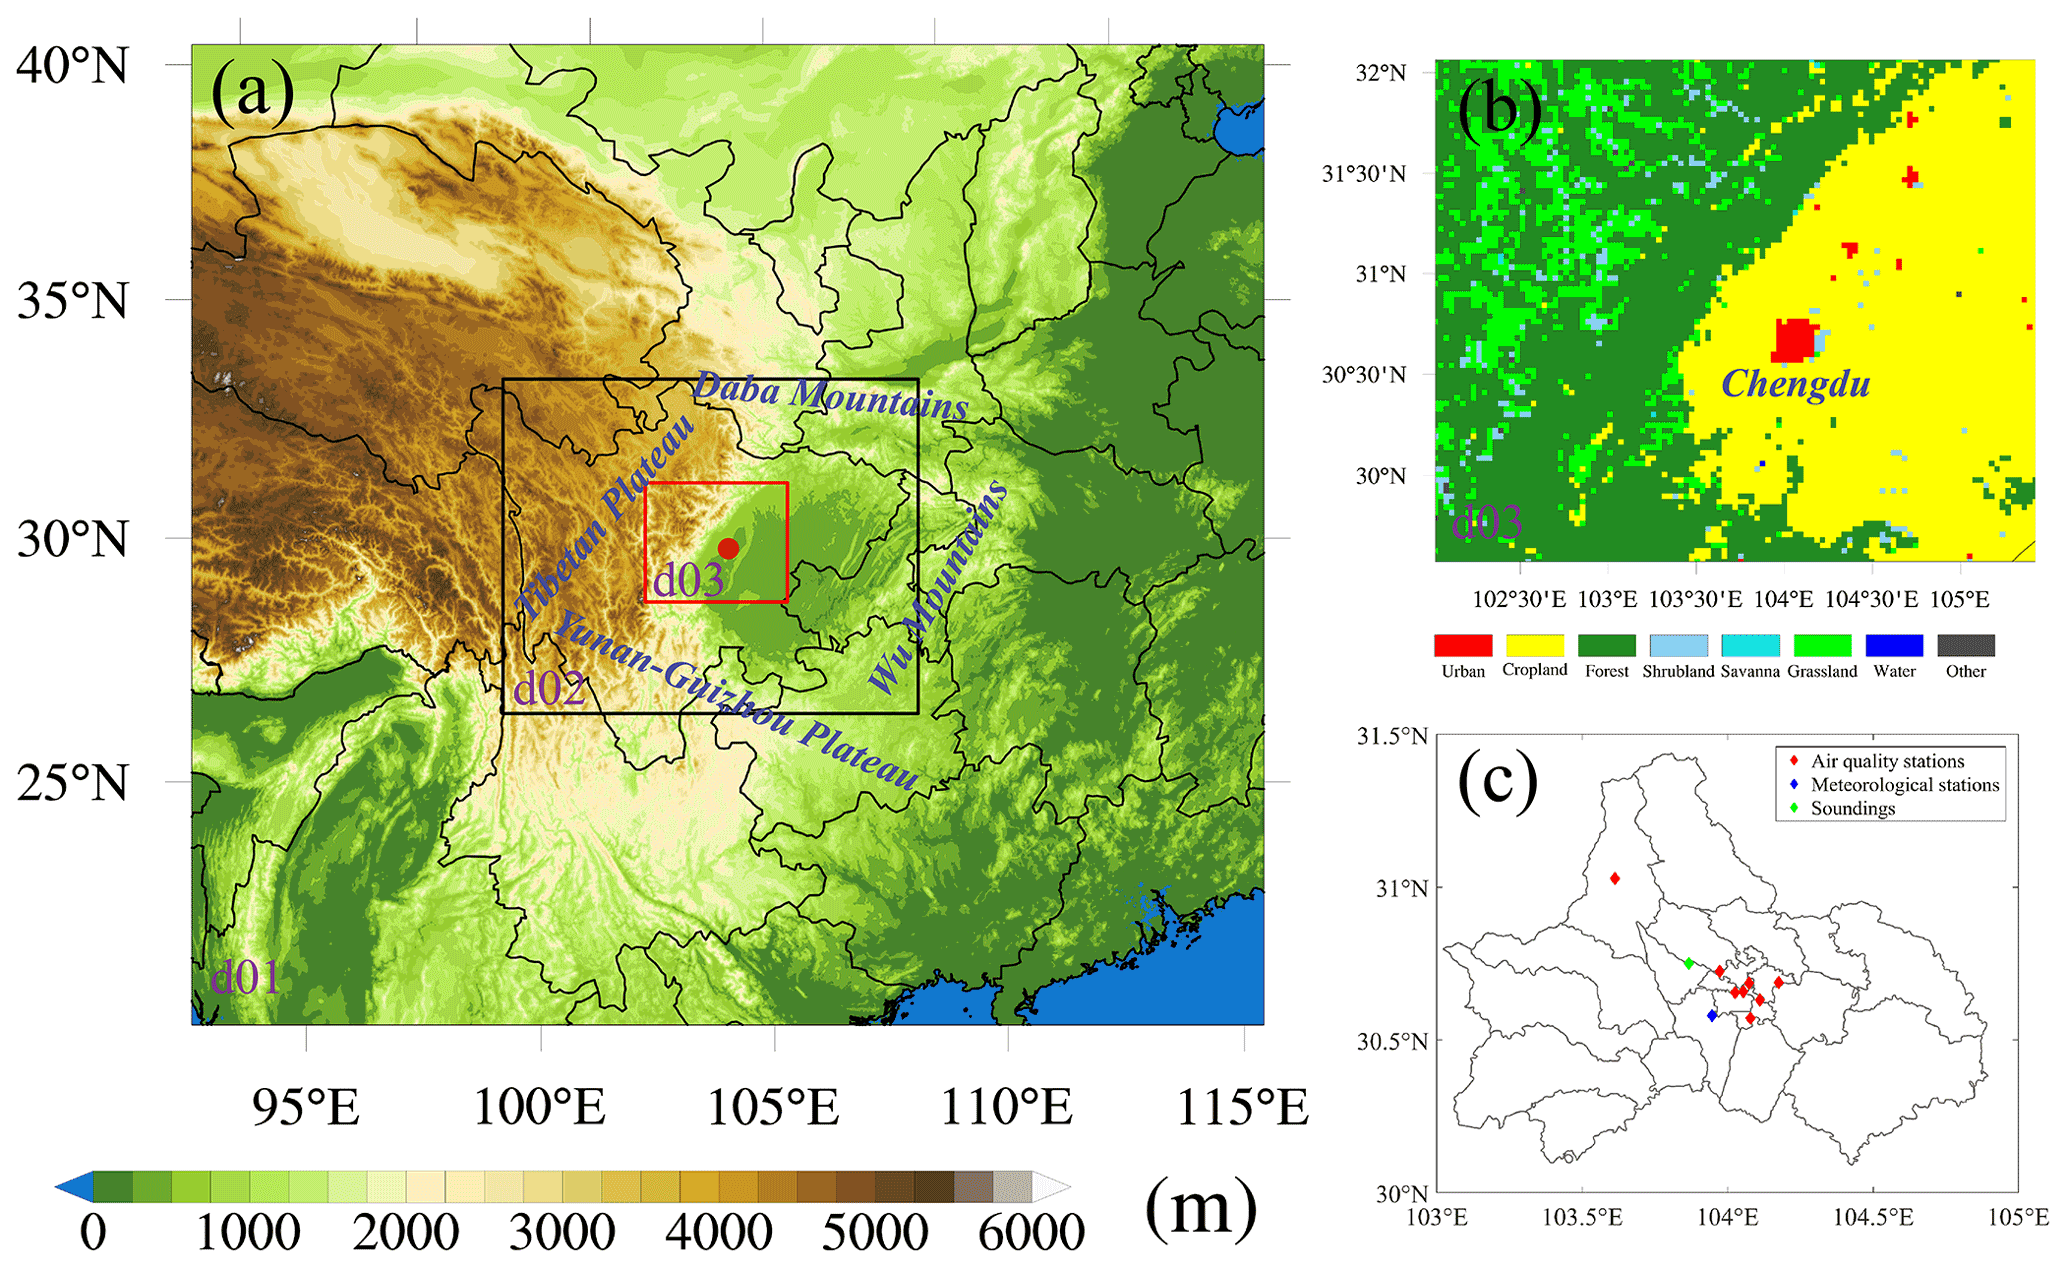
Figure 1(a) Map of three nested Weather Research and Forecasting (WRF) model coupled with Chemistry (WRF-Chem) domains with terrain heights, (b) domain 3 with land cover maps, and (c) the locations of air quality stations, meteorological stations and soundings in Chengdu. The red dot in panel (a) shows the location of Chengdu.
Urban areas are centers of resource utilization and are a major contributor to air pollutant and greenhouse gas emissions (Karl et al., 2019; Qian et al., 2022). According to the UN-Habitat (https://unhabitat.org/topic/energy, last access: 5 January 2023), cities consume about 75 % of global primary energy and emit 50 %–60 % of the world's total greenhouse gases. Air pollutants that originate from anthropogenic sources can accumulate and degrade urban air quality under unfavorable meteorological conditions, characterized by weak winds, which leaves urban dwellers vulnerable to air pollution (Holman et al., 2015; Lin and Zhu, 2018). Excessive emissions are the root cause of poor air quality in urban areas; thus, efforts have been made to reduce anthropogenic emissions to achieve the goal of urban air pollution control. Urbanization can increase urban land use and anthropogenic emissions, which will affect the concentrations as well as health risks of air pollutants. However, the health risks related to urbanization are rarely estimated, especially for cities with complex terrain. This is of great concern to policymakers, and estimation of these heath risks could help inform future air quality control strategies.
Although building in the mountains is not as easy as building on plains, about 12 % of the global population (over 720 million people) resides in mountainous areas for historical, political, strategic and economic reasons. Thus, it is important to understand the fate of air pollutants in mountainous cities where air pollution is usually more severe than in flat locations, as atmospheric dispersion is limited (Zardi and Whiteman, 2013). The mountain–plain wind, resulting from horizontal temperature differences between air over mountain massifs and air over the surrounding plains, is a key feature of the climatology of mountainous regions (Whiteman, 2000) and is important for determining the transport and dispersion of air pollutants. During daytime, the plain-to-mountain wind (plain wind) brings low-level air into the mountain massifs, whereas the mountain-to-plain wind (mountain wind) brings air out of the mountain massifs during nighttime. This wind system can often recirculate urban air pollutants and worsen air quality. Examples of this process can be found in Mexico City (Molina et al., 2010), Hong Kong (Guo et al., 2013), Seoul (Ryu et al., 2013), the Salt Lake Valley (Baasandorj et al., 2017), the Colorado Front Range (Bahreini et al., 2018), the Alps (Karl et al., 2019) and Taiwan (Lee et al., 2019).
Chengdu (30.70∘ N, 104.01∘ E) is the largest city in western China, occupying an area of 12 390 km2 with a population of more than 20 million people. Located in the west of the Sichuan Basin, this city is surrounded by the Tibetan Plateau to the west, the Wu Mountains to the east, the Yunnan–Guizhou Plateau to the south and the Daba Mountains to the north (Fig. 1a). Chengdu has experienced rapid urbanization over the past few decades that has been accompanied by a surge in urban construction and a loss of cropland (Fig. 1b; Dai et al., 2021). Luo et al. (2021) reported that Chengdu's urban area has increased 4-fold from 1996 to 2016. Because of the substantial anthropogenic emissions from human activities and the poor atmospheric diffusion capacity associated with terrain, Chengdu is one of the most polluted cities in China and has suffered from severe PM2.5 and O3 pollution in recent years (Shu et al., 2021; Yang et al., 2020; Zhan et al., 2019). Complex terrain, rapid urbanization and severe air pollution make Chengdu an ideal place to study the impact of urbanization on the health risks related to air pollutants in mountainous areas. The results could also provide valuable insight for other cities with complex terrain in the world.
In this study, we investigate the impacts of urbanization on air pollutant concentrations and the corresponding health risks in Chengdu. We also compare the impacts of urban expansion with emission growth. First, the basic characteristics of air pollutants in Chengdu from 2015 to 2021 are analyzed. The impacts of urbanization on air pollutant concentrations are then investigated using the Weather Research and Forecasting model coupled with Chemistry (WRF-Chem). Finally, premature mortality attributable to changes in air pollutant concentrations is estimated using the standard damage function. The rest of this paper is organized as follows: Sect. 2 introduces the data, the model configurations and the experimental design; Sect. 3 shows the main results and discussions; and the conclusions are given in Sect. 4.
2.1 Air quality and meteorological data
Air pollutants, including PM2.5, PM10, O3, NO2, SO2 and CO, are monitored by the National Environmental Monitoring Center (NEMC) of China. These data are issued hourly on the national urban air quality real-time publishing platform (https://air.cnemc.cn:18007/, last access: 5 January 2023). The monitoring data are strictly in accordance with the national monitoring regulations (http://www.cnemc.cn/jcgf/dqhj/, last access: 5 January 2023). It should be noted that the O3 measurements are reported in micrograms per cubic meter (µg m−3) under standard atmospheric conditions (273.15 K, 1 atm) before September 2018 and at 298.15 K conditions after this time. There are eight air quality stations throughout Chengdu (Fig. 1c), and the urban hourly pollutant concentrations reported in this paper are the average results of measurements at all monitoring sites. The daily PM2.5 concentrations are obtained by averaging observations over 24 h of the day. The daily maximum 8 h average (MDA8) O3 concentrations are calculated only on days with more than 18 h of O3 measurements.
Surface meteorological data, including the 2 m air temperature (T2), the 2 m dew point temperature (TD2), the 10 m wind speed (WS10) and the 10 m wind direction (WD10), are taken from the University of Wyoming website at station ZUUU (http://weather.uwyo.edu/surface/, last access: 5 January 2023). To verify upper-air fields, the sounding observations from Wenjiang (station 56187) are also acquired from this website. These sounding data contain information, such as temperature, dew point temperature and wind speed, at different pressure layers with a time resolution of 12 h (00:00 and 12:00 UTC), and they are often plotted on a Skew-T diagram (https://www.ncl.ucar.edu/Applications/skewt.shtml#ex2, last access: 5 January 2023).
2.2 WRF-Chem model and experimental designs
WRF-Chem is the Weather Research and Forecasting (WRF) model coupled with Chemistry, in which meteorological and chemical variables use the same coordinates, transport schemes and physics schemes in space and time (Grell et al., 2005). WRF-Chem version 3.9.1 is employed in this study. As shown in Fig. 1a, three nested domains are used with a grid spacing of 27, 9 and 3 km, respectively. A total of 32 σ levels extend from the surface to 100 hPa in the vertical direction, with 12 levels located below 2 km to resolve the boundary layer processes. The height of the lowest model level is about 25 m. The MODIS-based land use data, set as default in WRF, are selected. The domains and main options for physical and chemical parameterization schemes are listed in Table 1. The National Centers for Environmental Prediction (NCEP) Final (FNL) reanalysis data with a resolution of 1∘ × 1∘ at 6 h time intervals are adopted as the initial and boundary conditions for meteorological fields. Anthropogenic emissions are provided by the Multi-resolution Emission Inventory for China (MEIC) with a grid resolution of 0.25∘ × 0.25∘. It should be noted that we empirically cut the PM2.5 emissions by about 20 % to avoid overestimation of PM2.5 in the model. Biogenic emissions are calculated online using the Guenther scheme (Guenther et al., 2006).

To estimate the impacts of urbanization, six numerical simulations are designed (Table 2). The year of the numerical simulations is 2017, as the MEIC emission inventory is currently updated to 2017. Considering the computational cost, January is deemed to be representative of cold months with frequent PM2.5 pollution, whereas July is deemed to be representative of warm months with frequent O3 pollution (Sect. 3.1). Jan_Base is a baseline simulation using the MODIS land use data and the MEIC emission inventory over all three domains. The land cover maps in domain 3 are shown in Fig. 1b. Jan_noCD is a sensitivity simulation in which the urban land use of Chengdu is replaced by cropland to examine the impacts of urban expansion. Jan_noEmi is another sensitivity simulation in which the anthropogenic emissions in Chengdu are shut down to identify the impacts of emission growth. The abovementioned three numerical experiments use the same configurations (Table 1), running from 00:00 UTC on 28 December 2016 to 00:00 UTC on 1 February 2017 with the first 96 h as spin-up time. July_Base, July_noCD and July_noEmi are the same as Jan_Base, Jan_noCD and Jan_noEmi, respectively, but they run from 00:00 UTC on 27 June to 00:00 UTC on 1 August 2017 with the first 96 h as spin-up time.
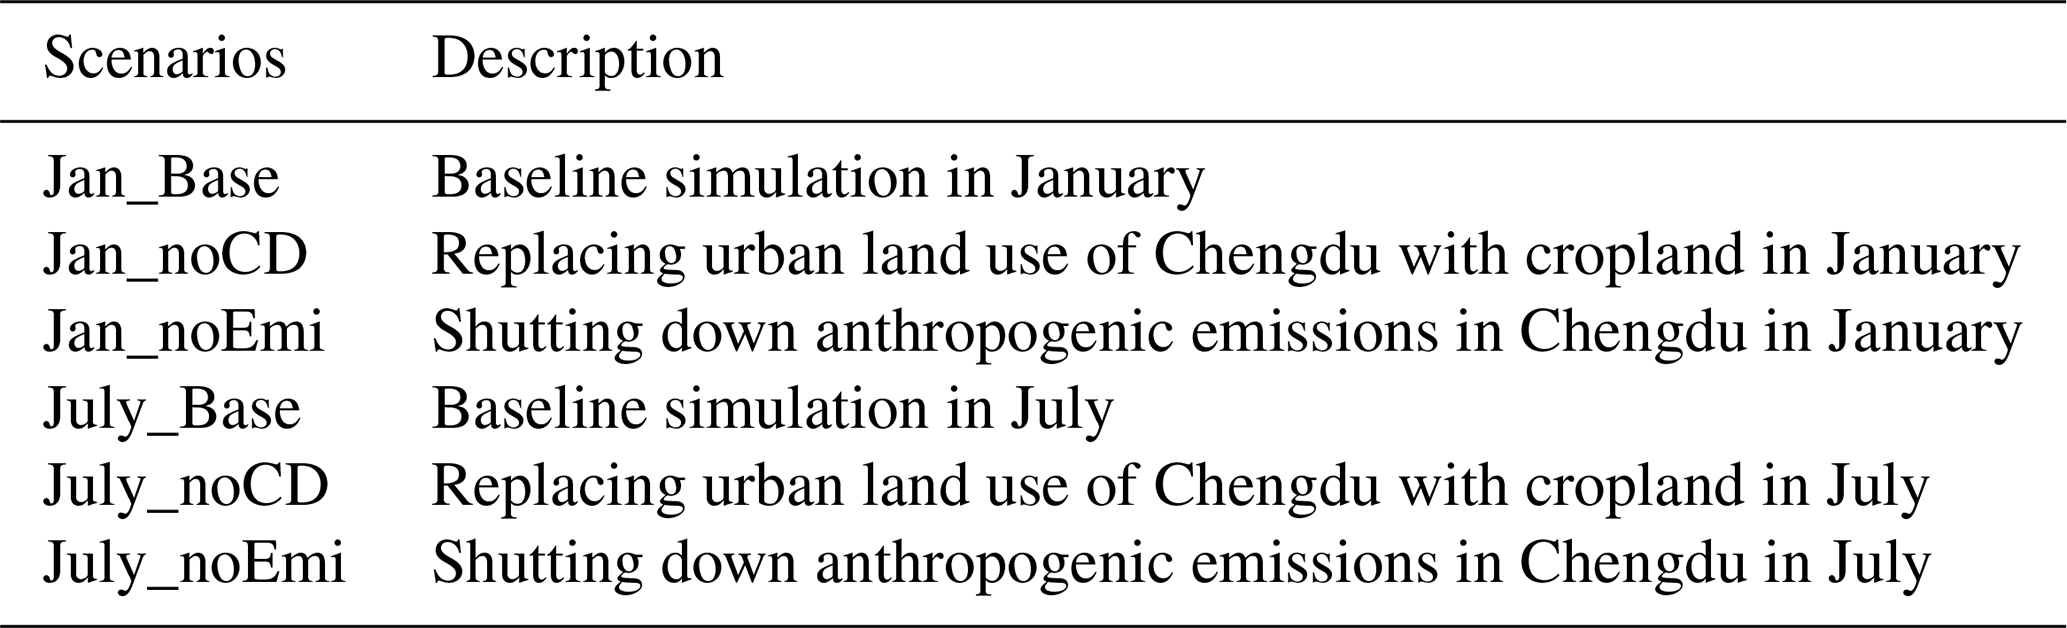
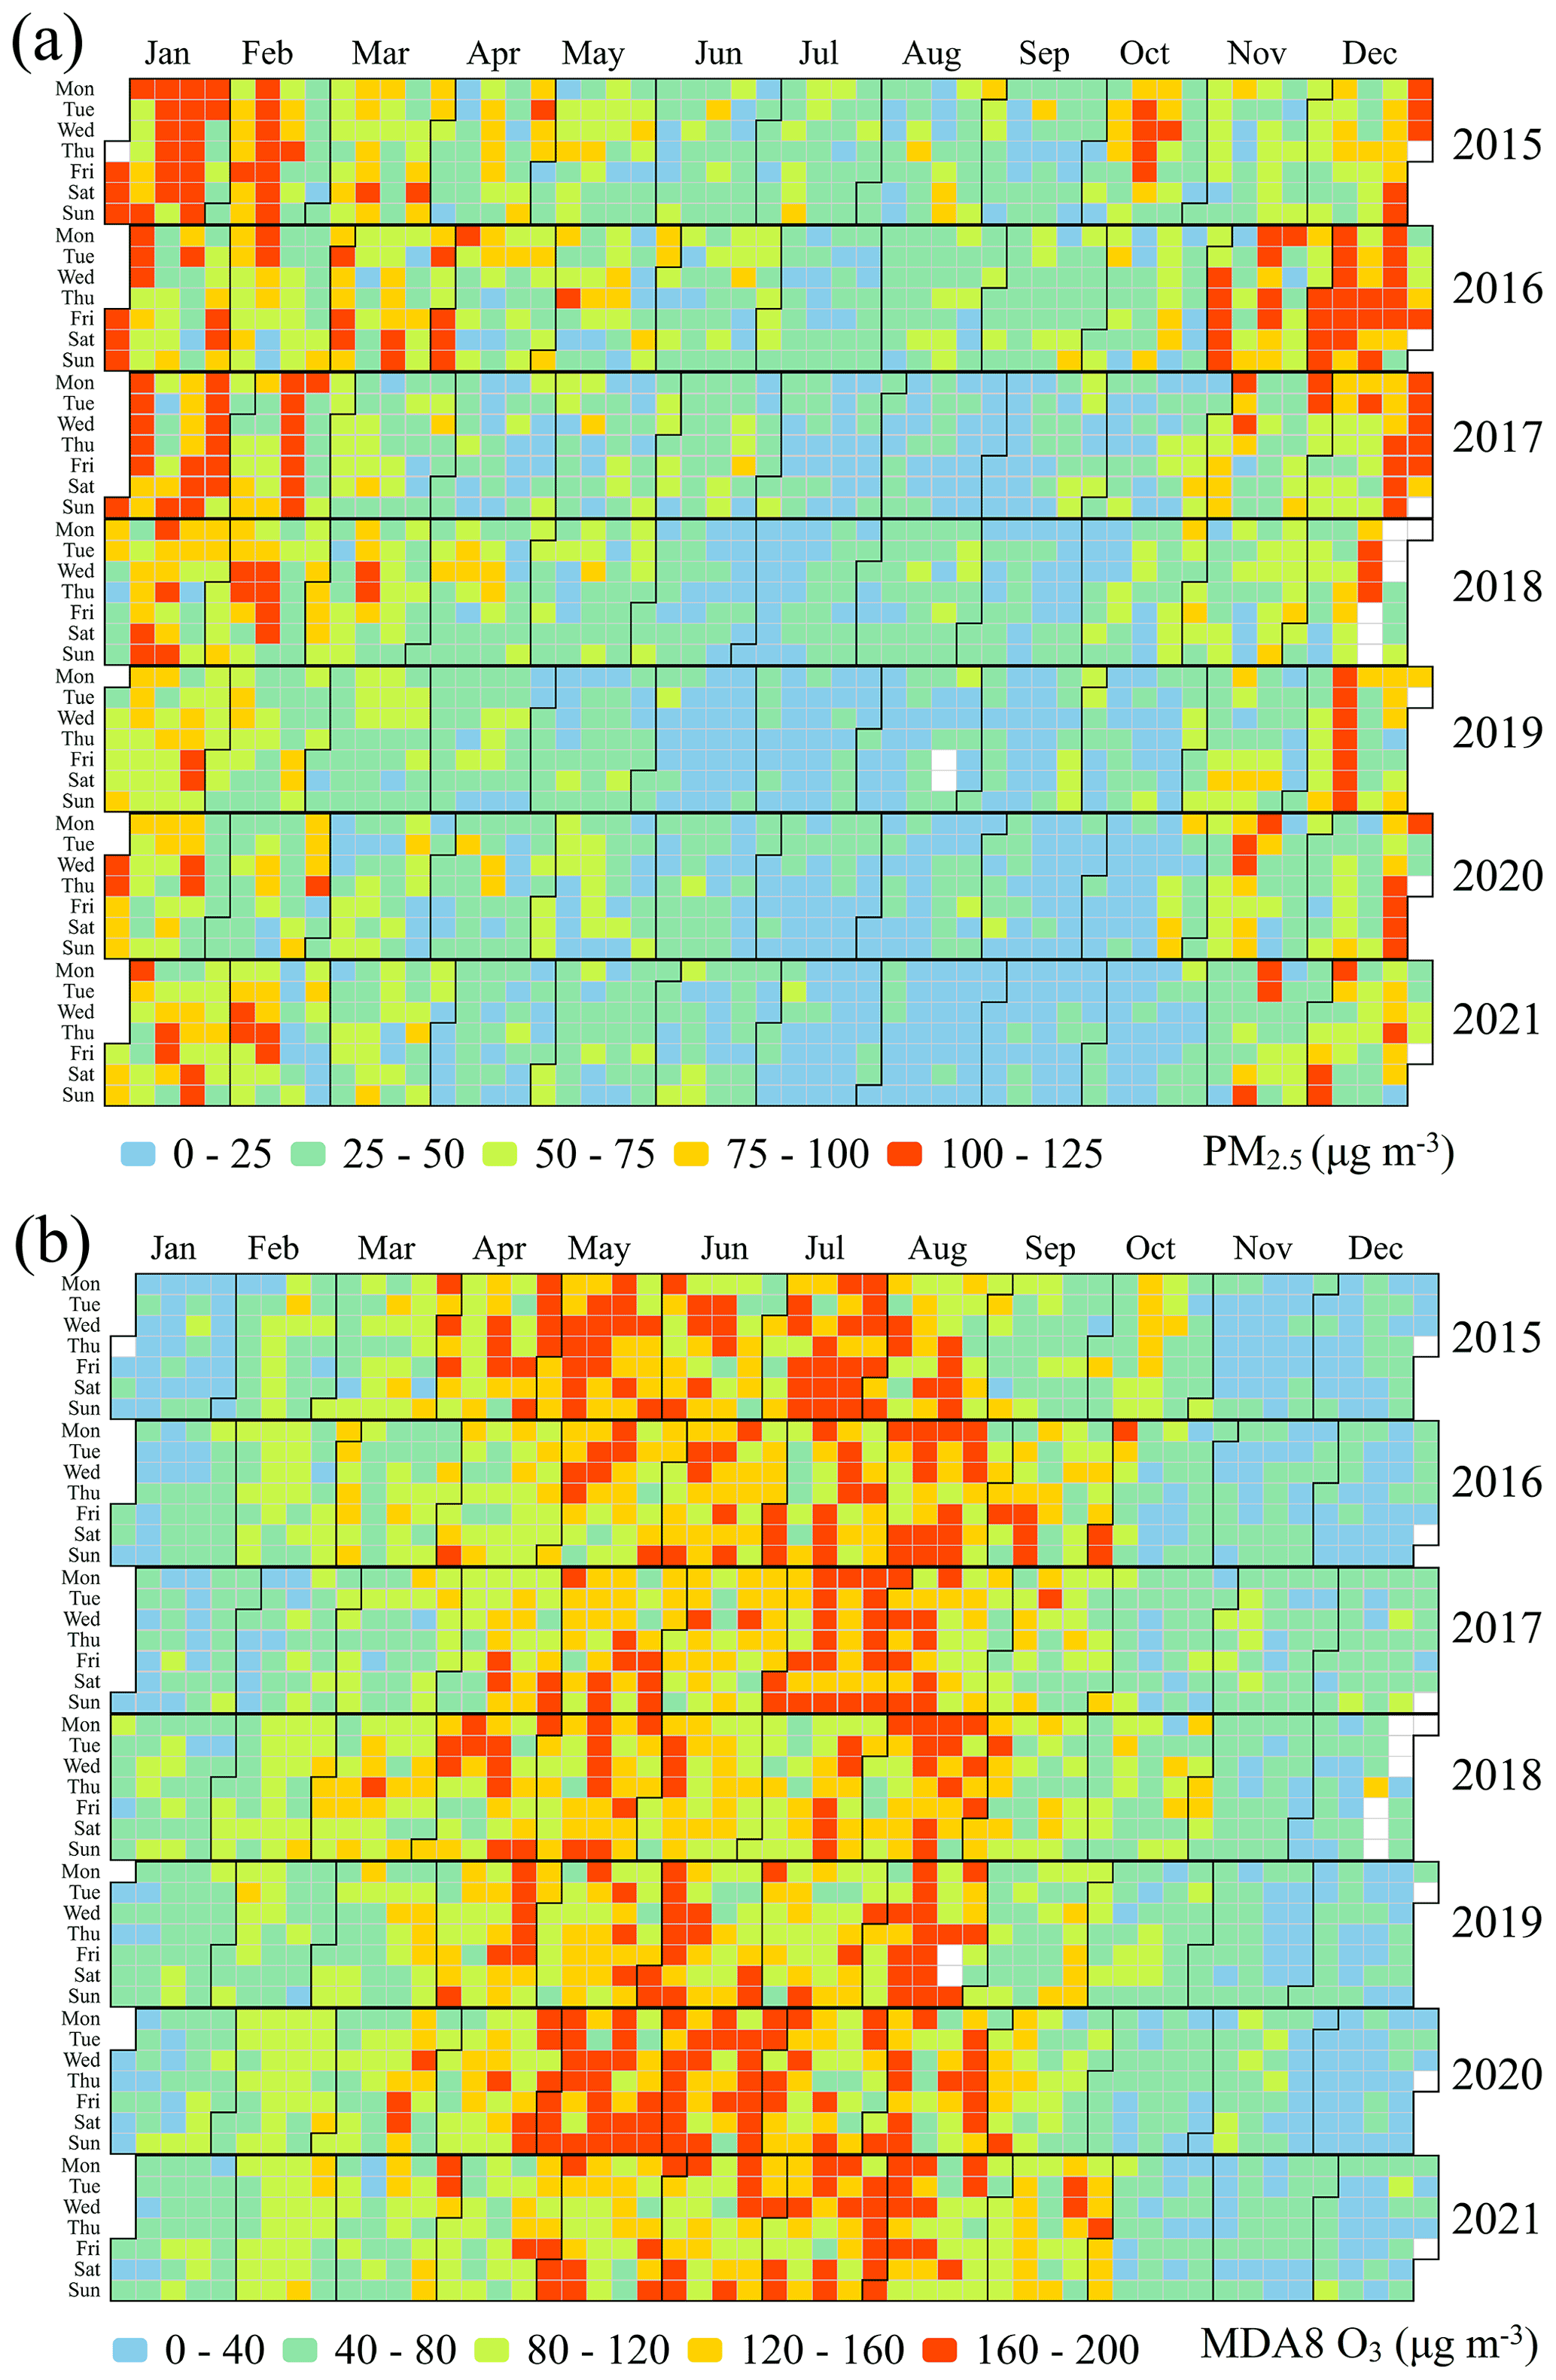
Figure 2Heat maps of (a) daily PM2.5 and (b) MDA8 O3 concentrations in Chengdu from 2015 to 2021.
2.3 Estimation of health risks
Daily premature mortality attributable to PM2.5 and O3 exposure from all non-accidental causes (ANACs), cardiovascular diseases (CVDs), respiratory diseases (RDs) and chronic obstructive pulmonary diseases (COPDs) is estimated using the standard damage function (Anenberg et al., 2010; Zhan et al., 2021):
where ΔM is the daily premature mortality, y0 is the daily baseline mortality rate, RR is the relative risk, is the attributable fraction, and Pop is the exposed population. RR is calculated as follows:
where β is the concentration–response function that relates a unit change in air pollutant concentrations to a change in the health endpoint incidence. In practice, β usually represents the percentage increase in daily mortality associated with a 10 µg m−3 increase in the daily concentrations. C is the exposure concentration, which is the daily average concentration for PM2.5 and the MDA8 O3 concentration for O3. C0 is the threshold concentration. When C is not greater than C0, the value of C−C0 is 0.
In this study, C0 is 10 µg m−3 for daily PM2.5 (Song et al., 2015) and 75.2 µg m−3 for MDA8 O3 (Liu et al., 2018). β and y0 for ANACs, CVDs, RDs and COPDs are summarized in Table 3 (Chen et al., 2017; Yin et al., 2017). The population of Chengdu provided by the National Bureau of Statistics of China for the years from 2015 to 2021 are 16.853 million, 18.582 million, 19.188 million, 19.183 million, 20.409 million, 20.947 million and 20.938 million people, respectively.
We first calculate the PM2.5- and O3-induced daily premature mortality using the methods mentioned above; we then sum the daily premature mortality for the whole year/month to get the total premature mortality. As the largest uncertainty among the factors that determine premature mortality usually comes from β, premature mortality is presented as the mean and 95 % confidence intervals (CIs) based on β at 95 % CI in this study. In addition, it should be noted that we use the average air pollutant concentration at all monitoring sites to represent the air pollutant concentration in Chengdu. Correspondingly, the total population of Chengdu is used as the exposed population. Thus, our results are for Chengdu as a whole and do not address the spatial distribution of premature mortality.
Table 3Daily β and y0values for ANACs, CVDs, RDs and COPDs.
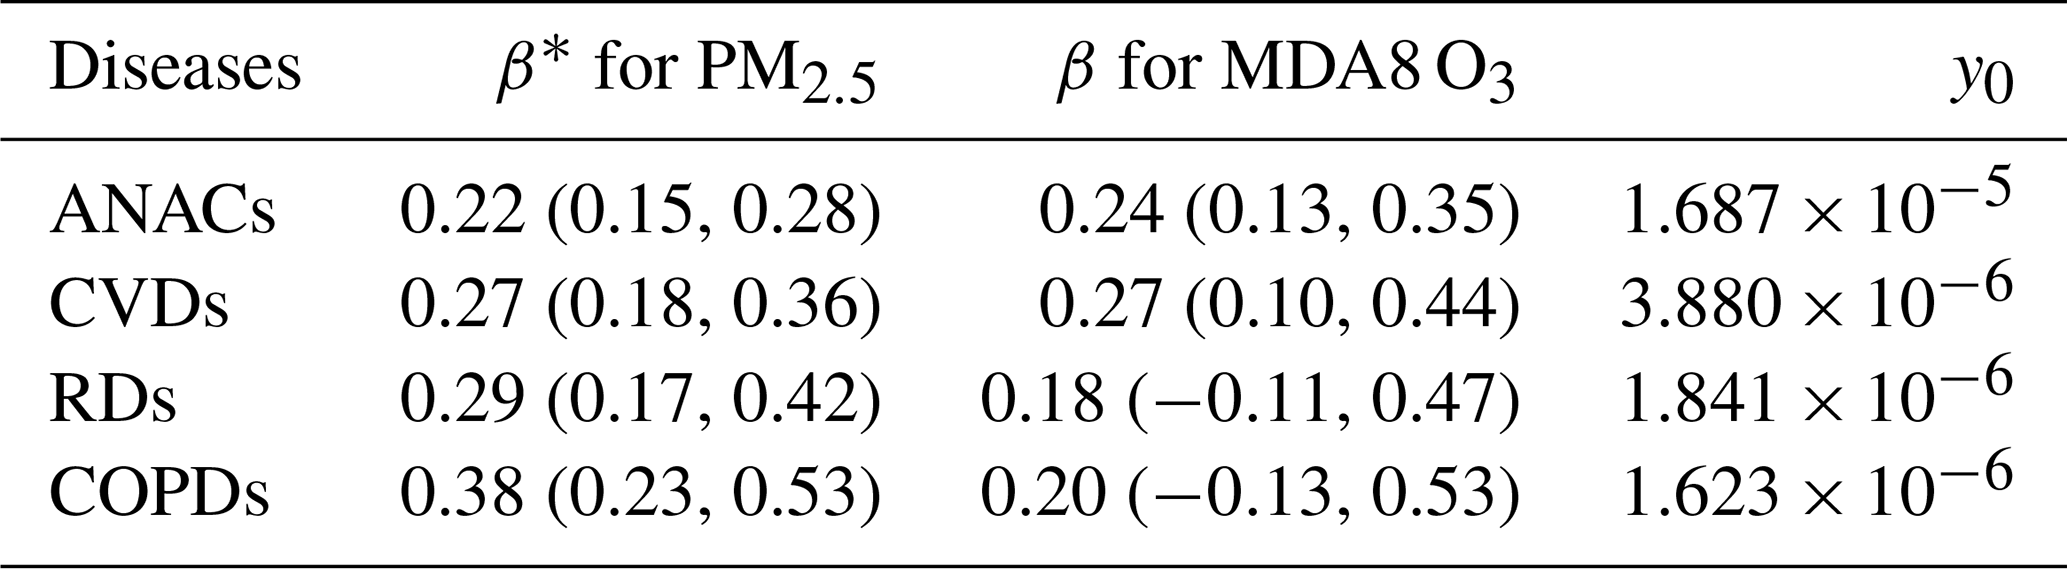
* β is expressed as the percentage increase (posterior mean and 95 % CIs) in daily mortality associated with a 10 µg m−3 increase in daily concentrations.
3.1 PM2.5 and O3 pollution in Chengdu
According to Chinese ambient air quality standards, PM2.5 pollution occurs when daily PM2.5 concentrations are greater than 75 µg m−3, and O3 pollution occurs when MDA8 O3 concentrations are greater than 160 µg m−3. As shown in Fig. 2, Chengdu has suffered from severe PM2.5 and O3 pollution in recent years: there were 97, 101, 68, 53, 33, 43 and 37 PM2.5 pollution episodes and 61, 48, 42, 40, 42, 71 and 48 O3 pollution episodes in Chengdu for the years from 2015 to 2021, respectively. In China, the annual evaluation criterion for PM2.5 is the annual average concentration, whereas it is the 90th percentile of the MDA8 O3 concentration for O3. The annual average concentrations of PM2.5 were 60.7, 59.9, 52.6, 47.2, 40.6, 40.8 and 40.1 µg m−3 in Chengdu for the years from 2015 to 2021, respectively, and the 90th percentile of MDA8 O3 concentrations were 183.0, 167.0, 168.0, 164.0, 171.5, 188.9 and 167.1 µg m−3, respectively. This suggests that PM2.5 pollution improved significantly, whereas O3 pollution did not. Thus, O3 pollution control in Chengdu should be taken seriously in the future. In addition, PM2.5 and O3 pollution had clear seasonal trends: PM2.5 pollution tended to appear in cold months (November to February), whereas O3 pollution tended to appear in warm months (April to August). High PM2.5 concentrations in cold months may be associated with the consumption of fossil fuels for heating as well as frequent temperature inversions, whereas high-temperature and strong-sunlight conditions contribute to the elevated O3 concentrations in warm months.
3.2 Premature mortality attributable to PM2.5 and O3
Severe PM2.5 and O3 pollution are responsible for a large number of premature deaths in Chengdu. For the years from 2015 to 2021, the number of premature deaths from ANACs due to PM2.5 was 10 596 (95 % CI of 7420–13 186), 11 647 (95 % CI of 8140–14 518), 10 154 (95 % CI of 7116–12 630), 8942 (95 % CI of 6214–11 198), 7992 (95 % CI of 5540–10 031), 8298 (95 % CI of 5759–10 402) and 8072 (95 % CI of 5606–10 115), respectively, with a 7-year annual average of 9386 (95 % CI of 6542–11 726). The highest health risk among the diseases was from CVD, with a 7-year annual average of 2609 (95 % CI of 1788–3384), followed by COPD, with a 7-year annual average of 1485 (95 % CI of 941–1983), and RD, with a 7-year annual average of 1321 (95 % CI of 804–1840). This was mainly associated with the daily baseline mortality rate of different diseases (Table 3). Although Chengdu's population increased by 24.2 % from 2015 to 2021, premature mortality due to PM2.5 generally declined (Fig. 3a) owing to reduced PM2.5 concentrations in more recent years (Sect. 3.1).

Figure 3Premature mortality from ANACs, CVDs, RDs and COPDs attributable to (a) PM2.5 and (b) O3 in Chengdu from 2015 to 2021. The dots represent the mean estimate, and the whiskers represent 95 % CIs.
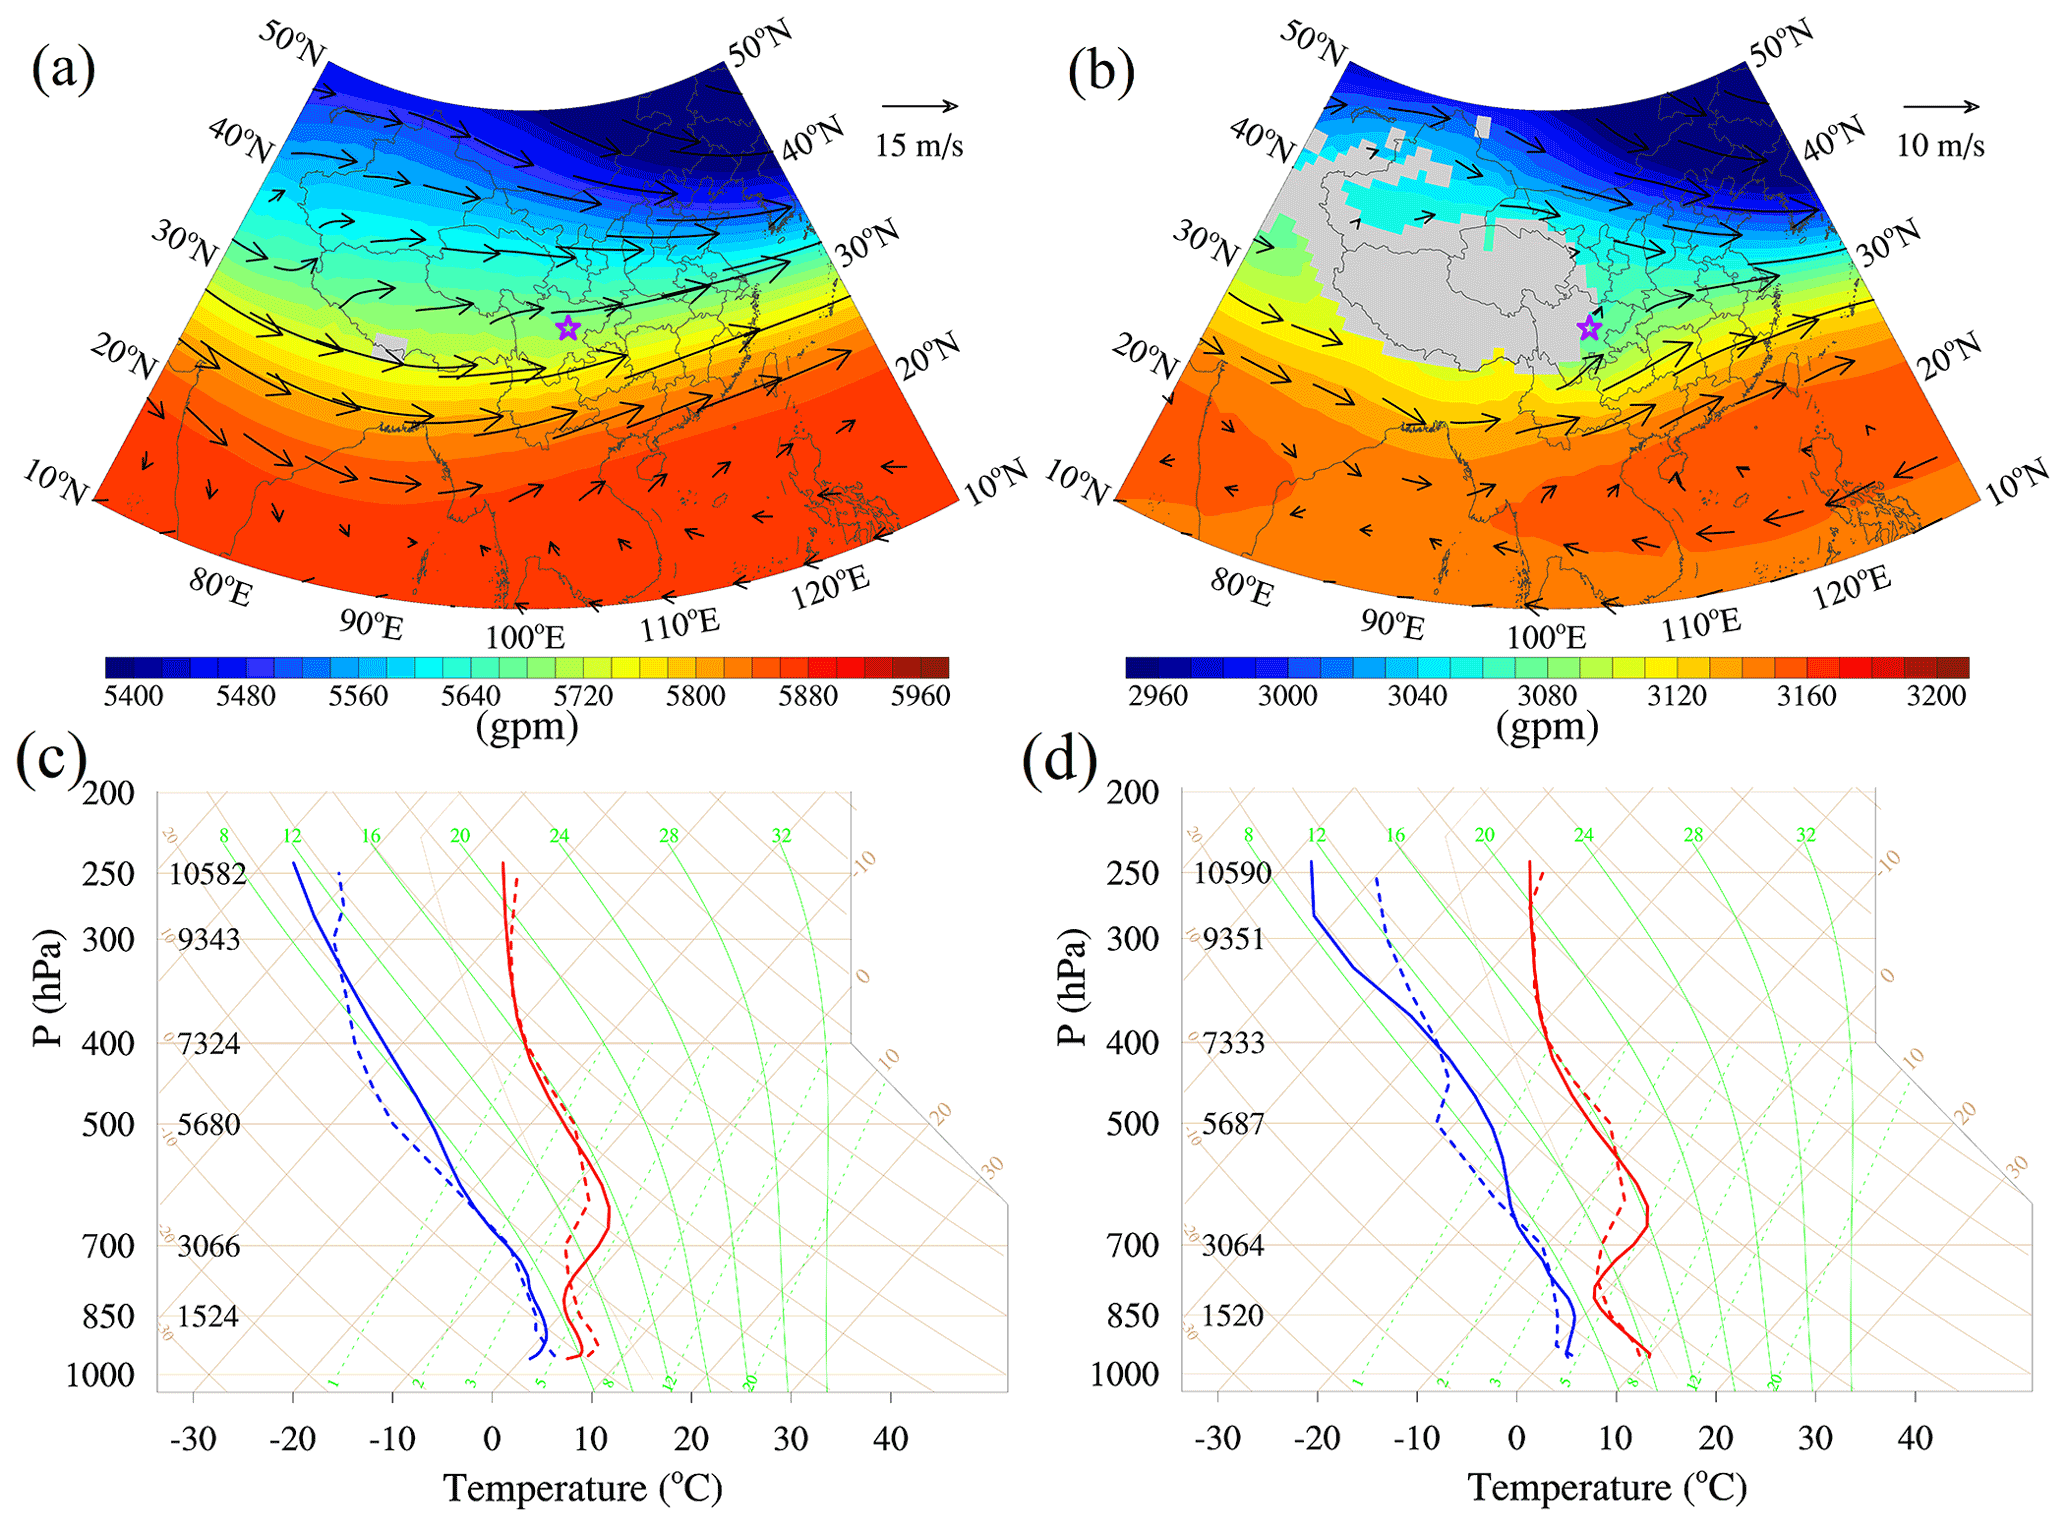
Figure 4The weather charts at (a) 500 hPa and (b) 700 hPa for January 2017 are based on the NCEP FNL reanalysis data. The purple stars show the location of Chengdu. Panels (c) and (d) show the skew-T diagrams at 00:00 UTC and 12:00 UTC, respectively, in January 2017. The red and blue solid lines are the respective simulated air temperature and dew point temperature in the Jan_Base simulation, and the red and blue dashed lines are the respective sounding temperature and dew point temperature. These results are monthly averages.
The number of premature deaths from ANACs due to O3 was 7657 (95 % CI of 4345–10 672), 8025 (95 % CI of 4537–11 227), 7870 (95 % CI of 4451–11 005), 8824 (95 % CI of 4967–12 397), 7919 (95 % CI of 4483–11 065), 10 085 (95 % CI of 5749–13 999) and 9163 (95 % CI of 5185–12 809) for the years from 2015 to 2021, respectively, with a 7-year annual average of 8506 (95 % CI of 4817–11 882). Unlike the overall reduction in premature mortality due to PM2.5, the premature mortality due to O3 increased slightly (Fig. 3a), further indicating the urgent need for powerful O3 control strategies in Chengdu.
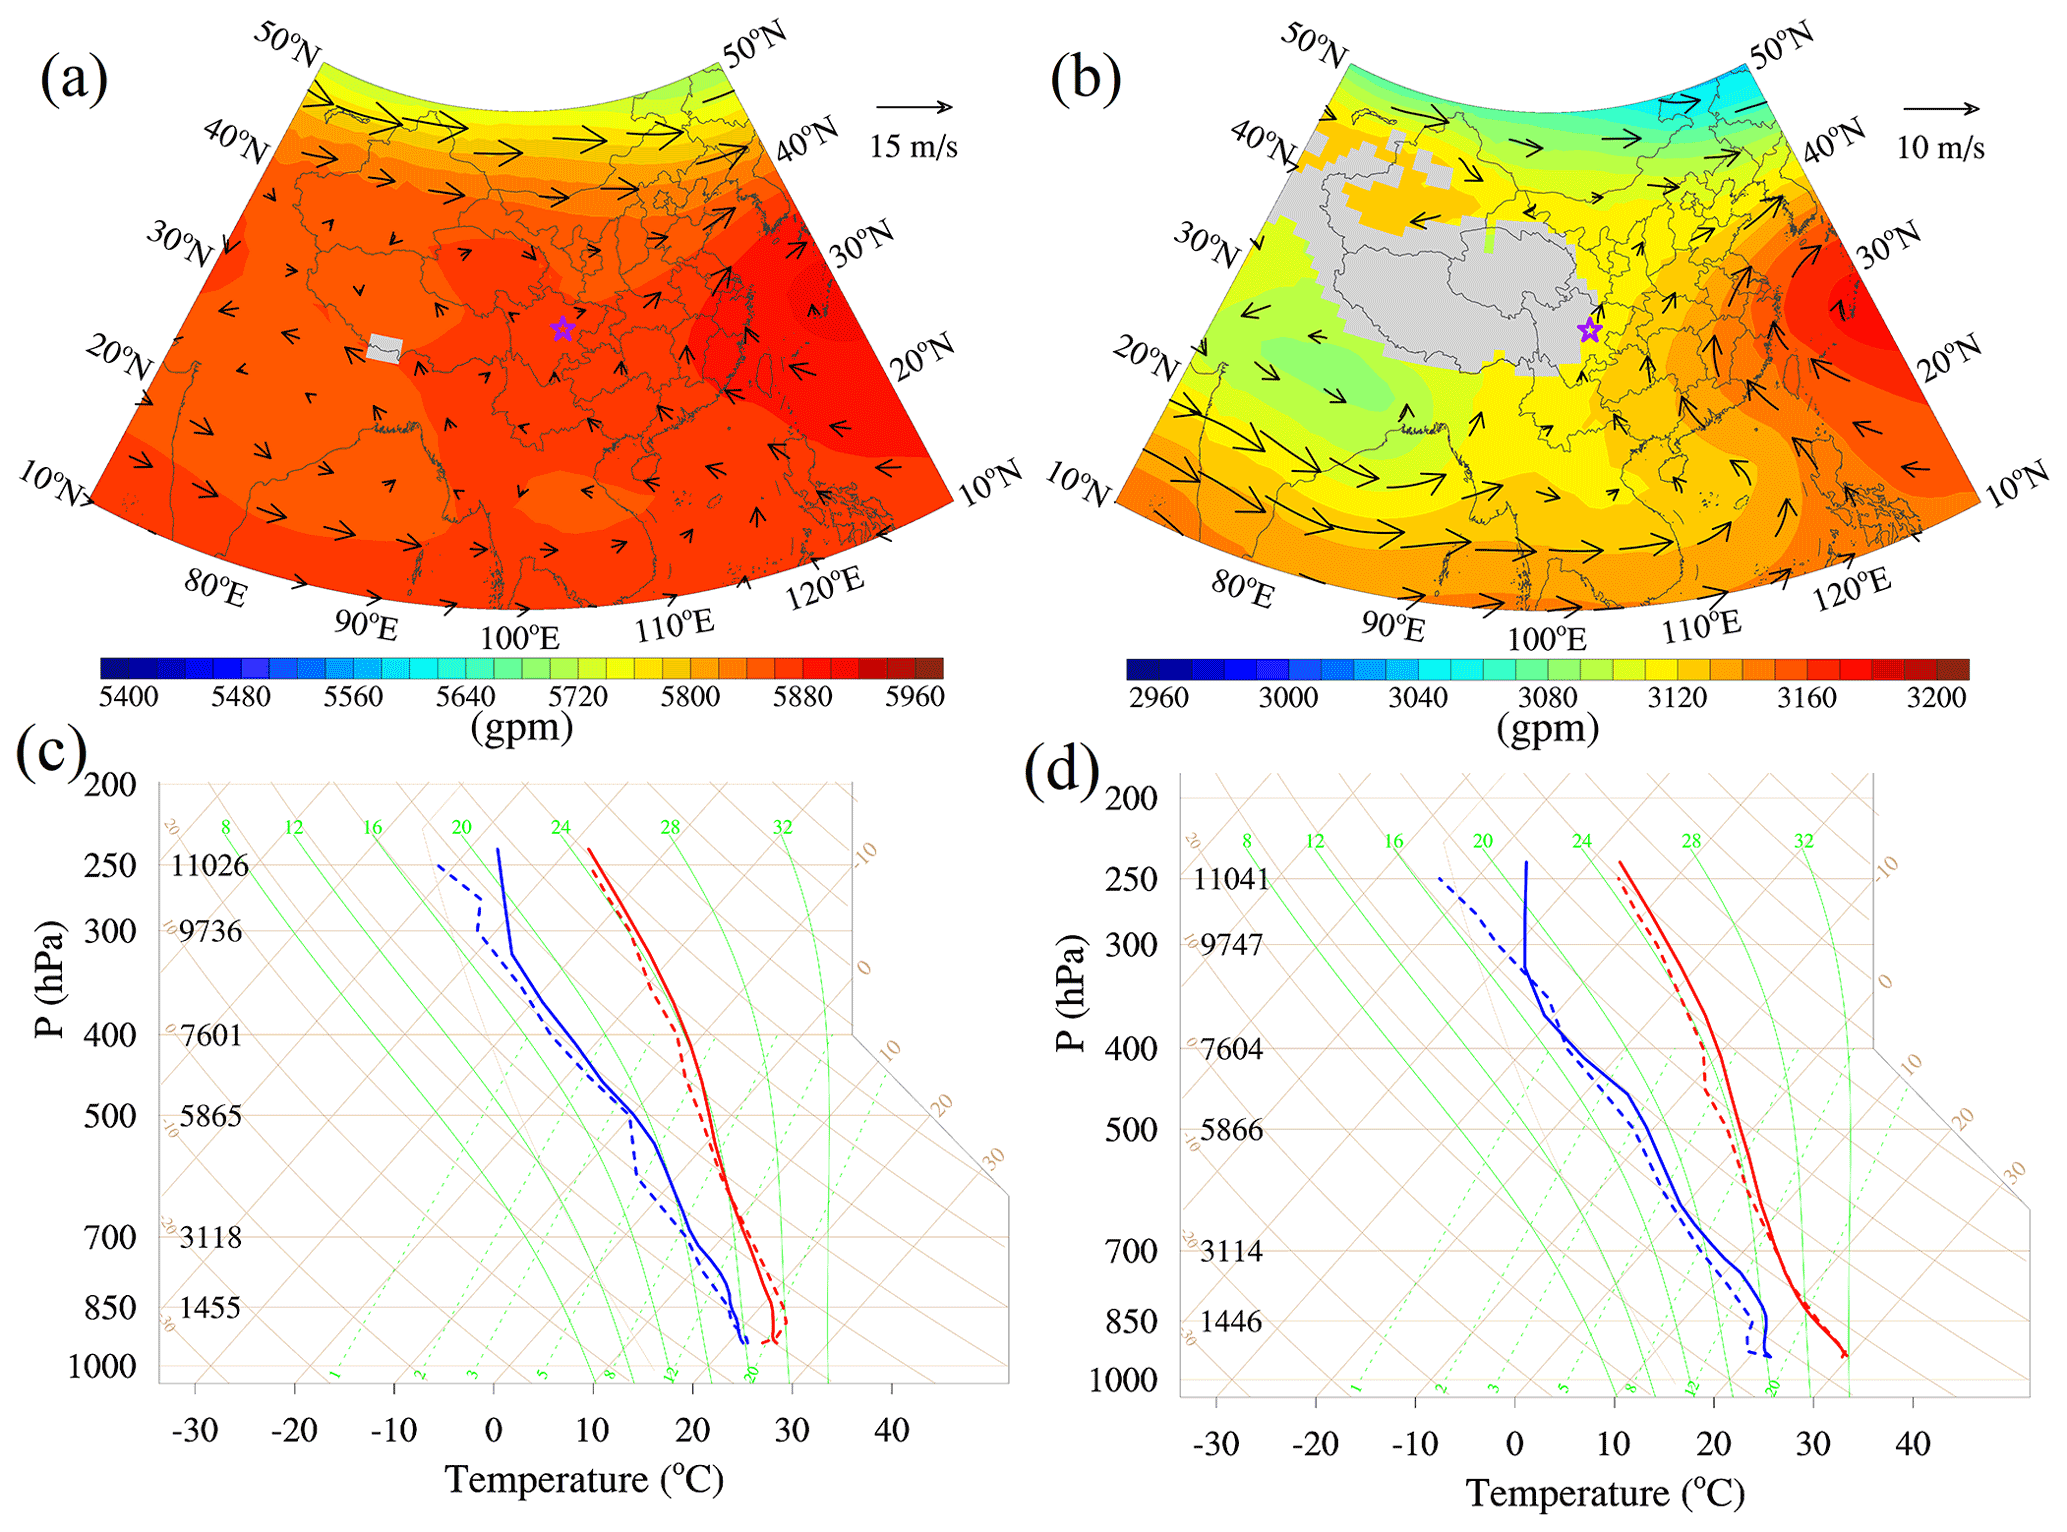
Figure 5The weather charts at (a) 500 hPa and (b) 700 hPa for July 2017 are based on the NCEP FNL reanalysis data. The purple stars show the location of Chengdu. Panels (c) and (d) show the skew-T diagrams at 00:00 UTC and 12:00 UTC, respectively, in July 2017. The red and blue solid lines are the respective simulated air temperature and dew point temperature in the July_Base simulation, and the red and blue dashed lines are the respective sounding temperature and dew point temperature. These results are monthly averages.
3.3 Impacts of urbanization on PM2.5 and O3
3.3.1 Meteorological conditions in January and July
In this study, January and July 2017, when respective PM2.5 and O3 pollution episodes are likely to occur (Fig. 2), are selected to study the role of urbanization. In January 2017, Chengdu experienced PM2.5 pollution for 23 out of 31 d, with a monthly average concentration of 128.8 µg m−3. From the perspective of atmospheric circulations, westerly winds prevailed over Chengdu due to the large north–south geopotential height gradient at 500 hPa (Fig. 4a). However, the westerly winds were blocked by the Tibetan Plateau and, thus, the dispersion of PM2.5 was limited. At 700 hPa, the southwestern airflow originating from the Bay of Bengal could reach Chengdu (Fig. 4b). This warm advection was conducive to the formation of a stable layer near 700 hPa (Fig. 4c, d), which made the vertical diffusion of PM2.5 difficult. The blocking of air and the stable layer were two important reasons for frequent PM2.5 pollution episodes during this period (Hu and Wang, 2021; Ning et al., 2018).
In July 2017, there were 19 d of O3 pollution in Chengdu, and the monthly average MDA8 O3 concentration was 172.9 µg m−3. At 500 hPa, Chengdu was dominated by strong high-pressure systems; thus, the air temperature was high and the wind speed was low (Fig. 5a). The monthly average T2 was as high as 28.6 ∘C, while the monthly average WS10 was only 1.6 m s−1 during this period (Fig. 6b). High temperature favored photochemical reactions of O3, while weak winds trapped O3. Furthermore, the thickness of the stable layer in July was far less than that in January (Figs. 4c, d; 5c, d). A well-developed boundary layer facilitated the vertical mixing of O3 within the boundary layer, which is an important way to maintain high surface O3 concentrations during the daytime (Aneja et al., 2000; Tang et al., 2017).
3.3.2 Evaluation of model performance
We first compare vertical profiles in the model with the sounding data to determine whether the model captures the vertical structure of the troposphere. As shown in Fig. 4c and d and in Fig. 5c and d, the WRF-Chem model can successfully simulate the changes in temperature and dew point temperature in the vertical direction (in both January and July as well as during both daytime and nighttime). Therefore, the vertical results from the model are reliable. Furthermore, simulated variables are compared to observed variables, and the results are presented in Fig. 6. The mean bias (MB) of the simulated and observed concentrations of PM2.5 and O3 are 12.7 and 11.6 µg m−3, respectively, with normalized mean bias (NMB) values of 9.9 % and 12.0 %, respectively, which are within the acceptable standards (NMB <±15 %). The correlation coefficients (COR) of PM2.5 and O3 are 0.44 and 0.77, respectively. The statistical metrics for PM2.5 and O3 are similar to those from previous studies (Y. Wang et al., 2022; Wu et al., 2022), indicating that our model results for PM2.5 and O3 are reasonable and acceptable. With regard to the meteorological variables, T2 is well simulated with low MB (0.2 and 0.1 ∘C, respectively) and high COR (0.76 and 0.70, respectively) values in both January and July. The simulations underestimate TD2 to some extent, with MB values of −1.5 and −2.6 ∘C in January and July, respectively. As for the 10 m wind speed and direction, poor simulation results are predictable in the case of low wind and complex terrain. The observed calm wind frequency was particularly high due to the starting speed of the anemometer (typically 0.5–1 m s−1), resulting in an overestimation of simulated WS10, as in the studies of other scholars (Shu et al., 2021; Wu et al., 2022). With respect to this overestimation, it could also be argued that unresolved topographic features produce an additional drag to that generated by vegetation, but their effects are not considered in WRF (Jimenez and Dudhia, 2012). On the other hand, the model captures the shift in wind direction except for the case of calm wind. In summary, the WRF-Chem model using our configuration has a good capability with respect to simulating PM2.5, O3 and meteorological variables in Chengdu; thus, the simulations can be used for subsequent analysis.

Figure 6(a) Times series of PM2.5, T2, TD2, WS10 and WD10 for January 2017. (b) Times series of O3, T2, TD2 and WS10 and WD10 for July 2017. The black dots are observations. The colored lines and cyan dots are simulated values from the baseline simulations.
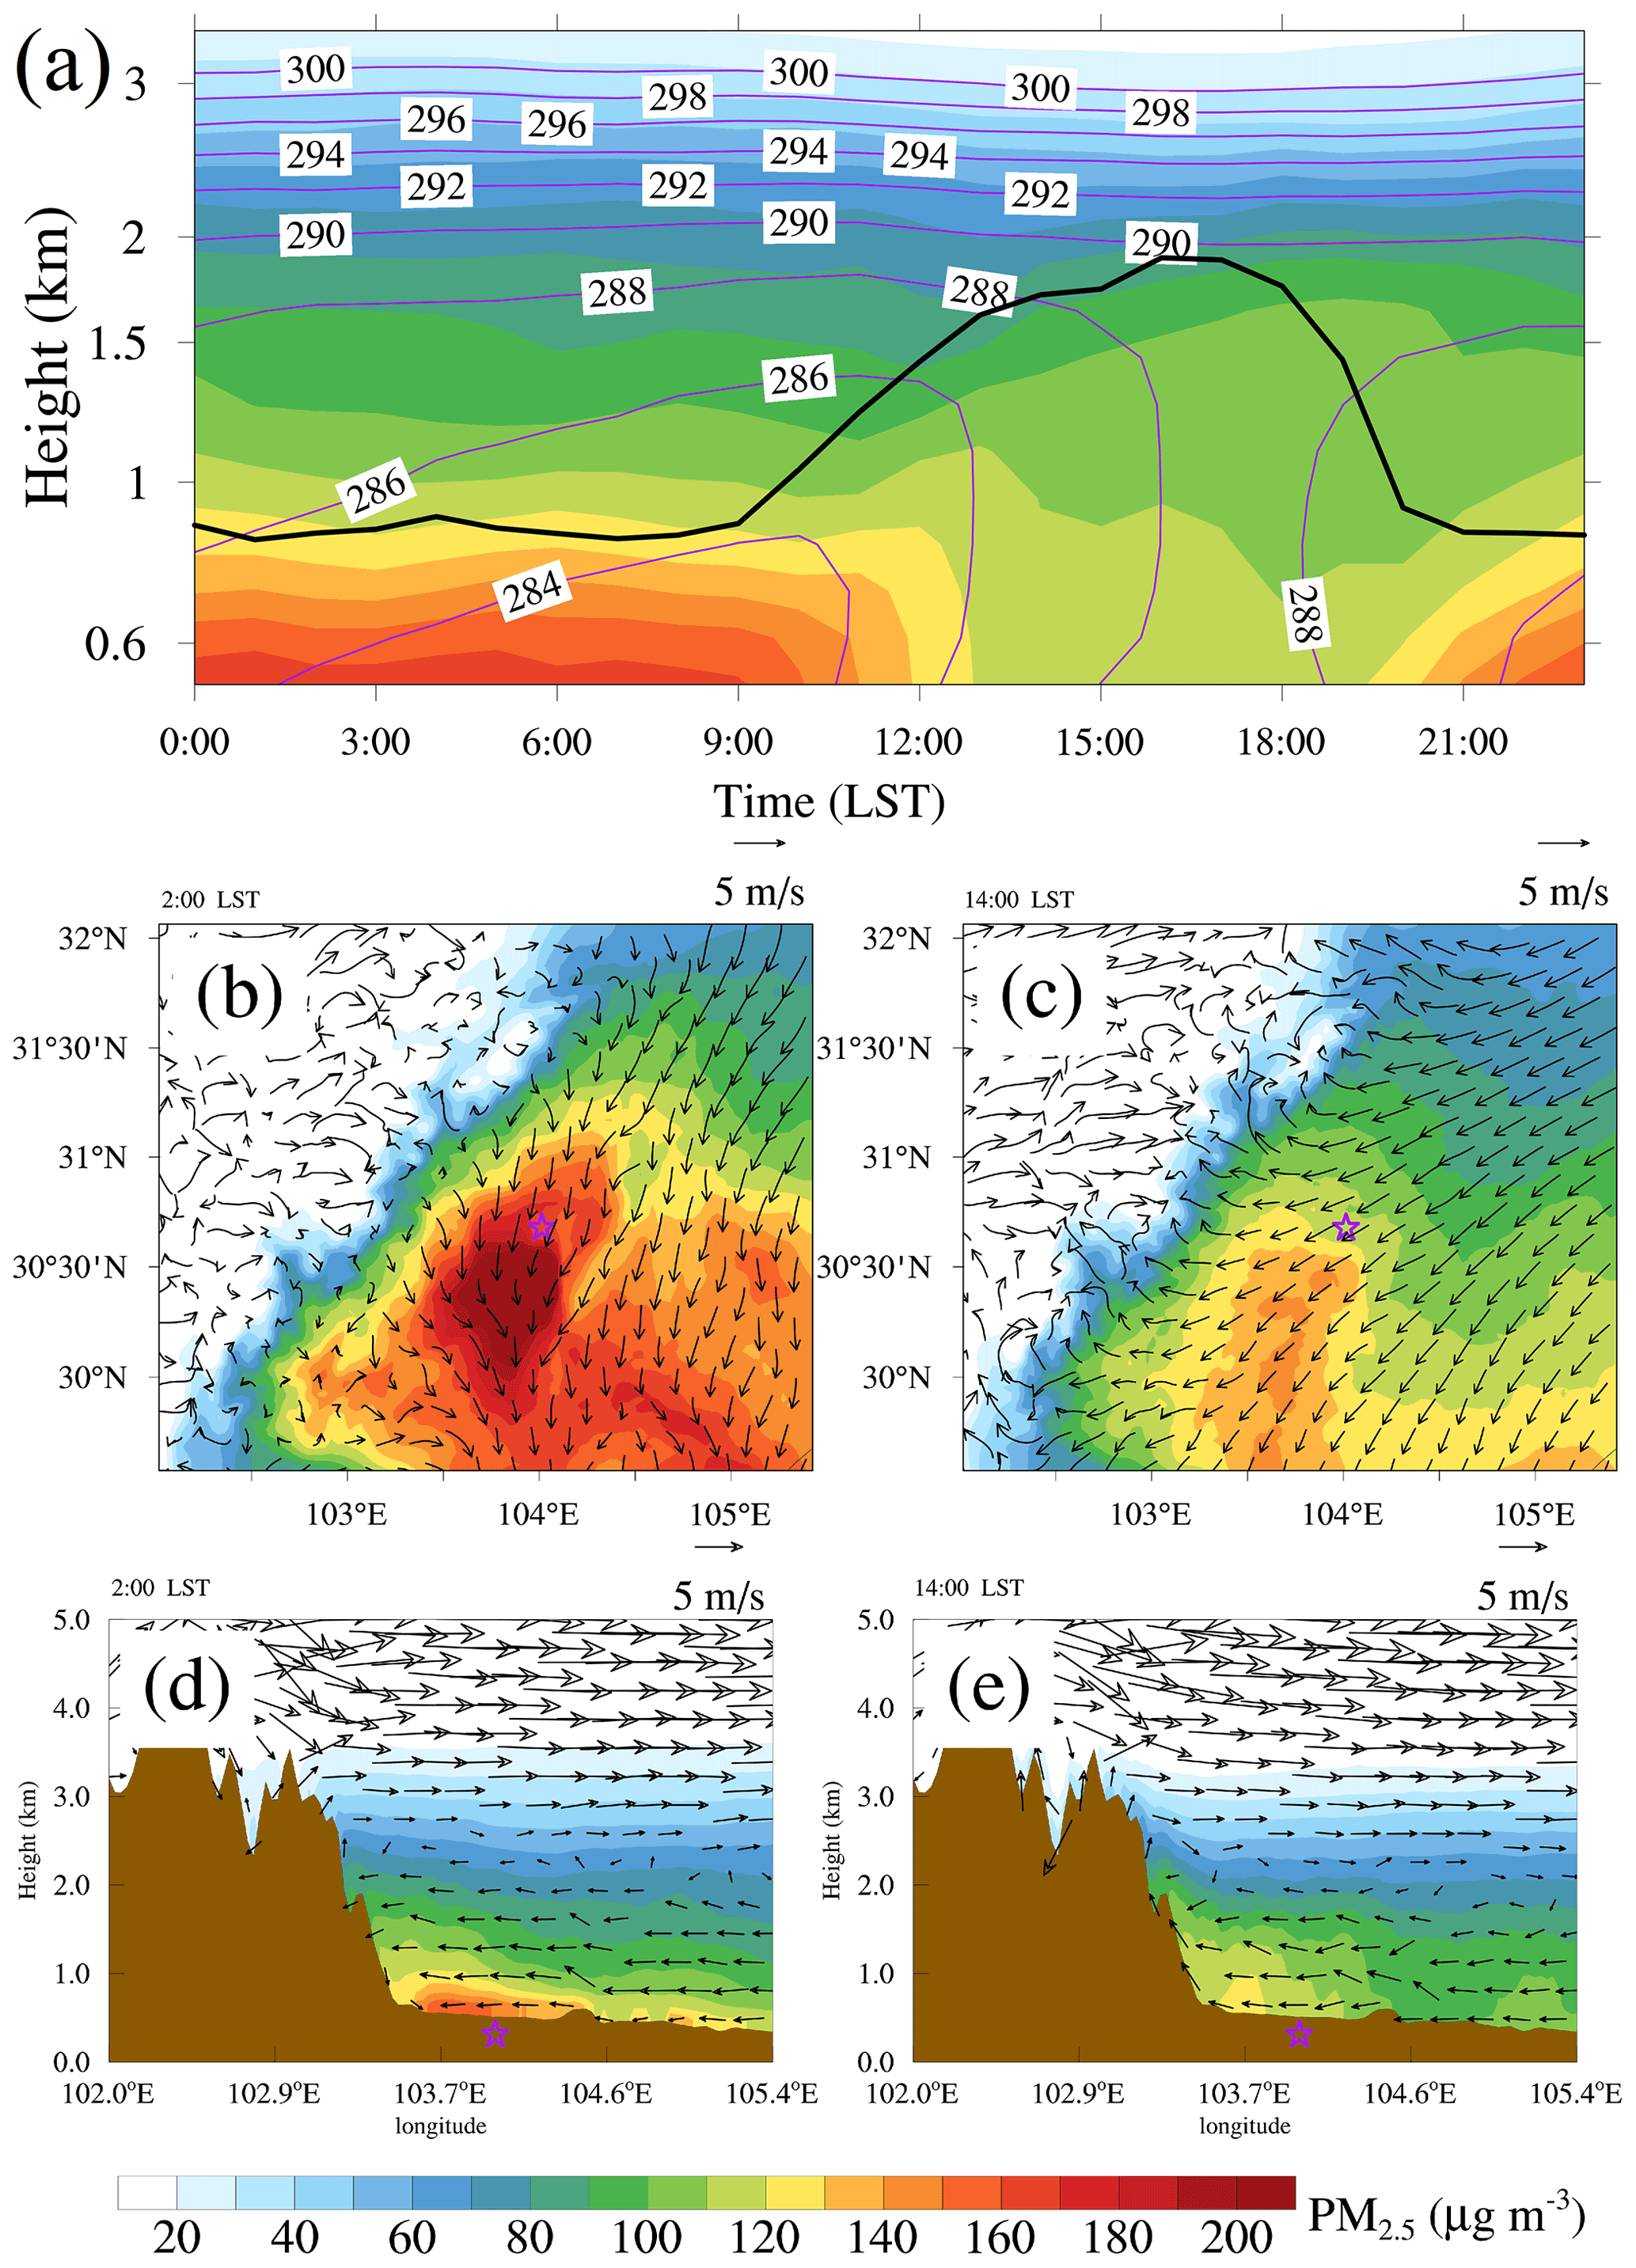
Figure 7(a) Time–altitude cross sections of PM2.5 (colored shading), potential temperature (purple contour lines) and boundary layer height (thick black contour line) at Chengdu. Panels (b) and (c) present the horizontal distributions of PM2.5 with wind vectors at the lowest model level at 02:00 and 14:00 LST, respectively. Panels (d) and (e) present east–west vertical cross sections of PM2.5 with wind vectors at 02:00 and 14:00 LST, respectively. Purple stars show the locations of Chengdu. Brown shaded areas represent the terrain. These results are the monthly average based on the Jan_Base simulation.

Figure 8(a) Time–altitude cross sections of O3 (colored shading), potential temperature (purple contour lines) and boundary layer height (thick black contour lines) at Chengdu. Panels (b) and (c) present the horizontal distributions of O3 with wind vectors at the lowest model level at 02:00 and 14:00 LST, respectively. Panels (d) and (e) present east–west vertical cross sections of O3 with wind vectors at 02:00 and 14:00 LST, respectively. Purple stars show the locations of Chengdu. Brown shaded areas represent the terrain. These results are the monthly average based on the July_Base simulation.
3.3.3 Spatiotemporal variations in PM2.5 and O3
The spatiotemporal characteristics of PM2.5 were first investigated based on the Jan_Base simulation. PM2.5 had a diurnal variation with a high concentration at night and a low concentration at noon, which was contrary to the boundary layer height (Fig. 7a). The nocturnal atmospheric boundary layer was often characterized by a stable boundary layer, and the boundary layer height was only ∼ 320 m above ground. As a consequence, PM2.5 was trapped and maintained on the ground. The daytime atmospheric boundary layer, also known as the convective boundary layer, could develop to ∼ 1300 m above ground. Turbulence in the convective boundary layer could dilute PM2.5 concentrations, resulting in low PM2.5 concentrations at surface. Chengdu is on the eastern side of the Tibetan Plateau, with a large elevation drop exceeding 3000 m over a short horizontal distance (Fig. 1a). In this case, the mountain–plain wind can easily form. During nighttime, the mountain wind was characterized by westerly and downslope flow at lower levels along the eastern slope of the Tibetan Plateau (Fig. 7b, d). Converging with the prevailing northeasterly wind, a PM2.5 pollution belt was likely to form and could spread hundreds of kilometers downstream. The daytime plain wind was nearly a reversal of the nighttime circulation, with easterly and upslope flow over the Sichuan Basin (Fig. 7c, e). The upslope flow could draw PM2.5 to a higher elevation, which could also facilitate vertical dispersion of PM2.5 during the day.
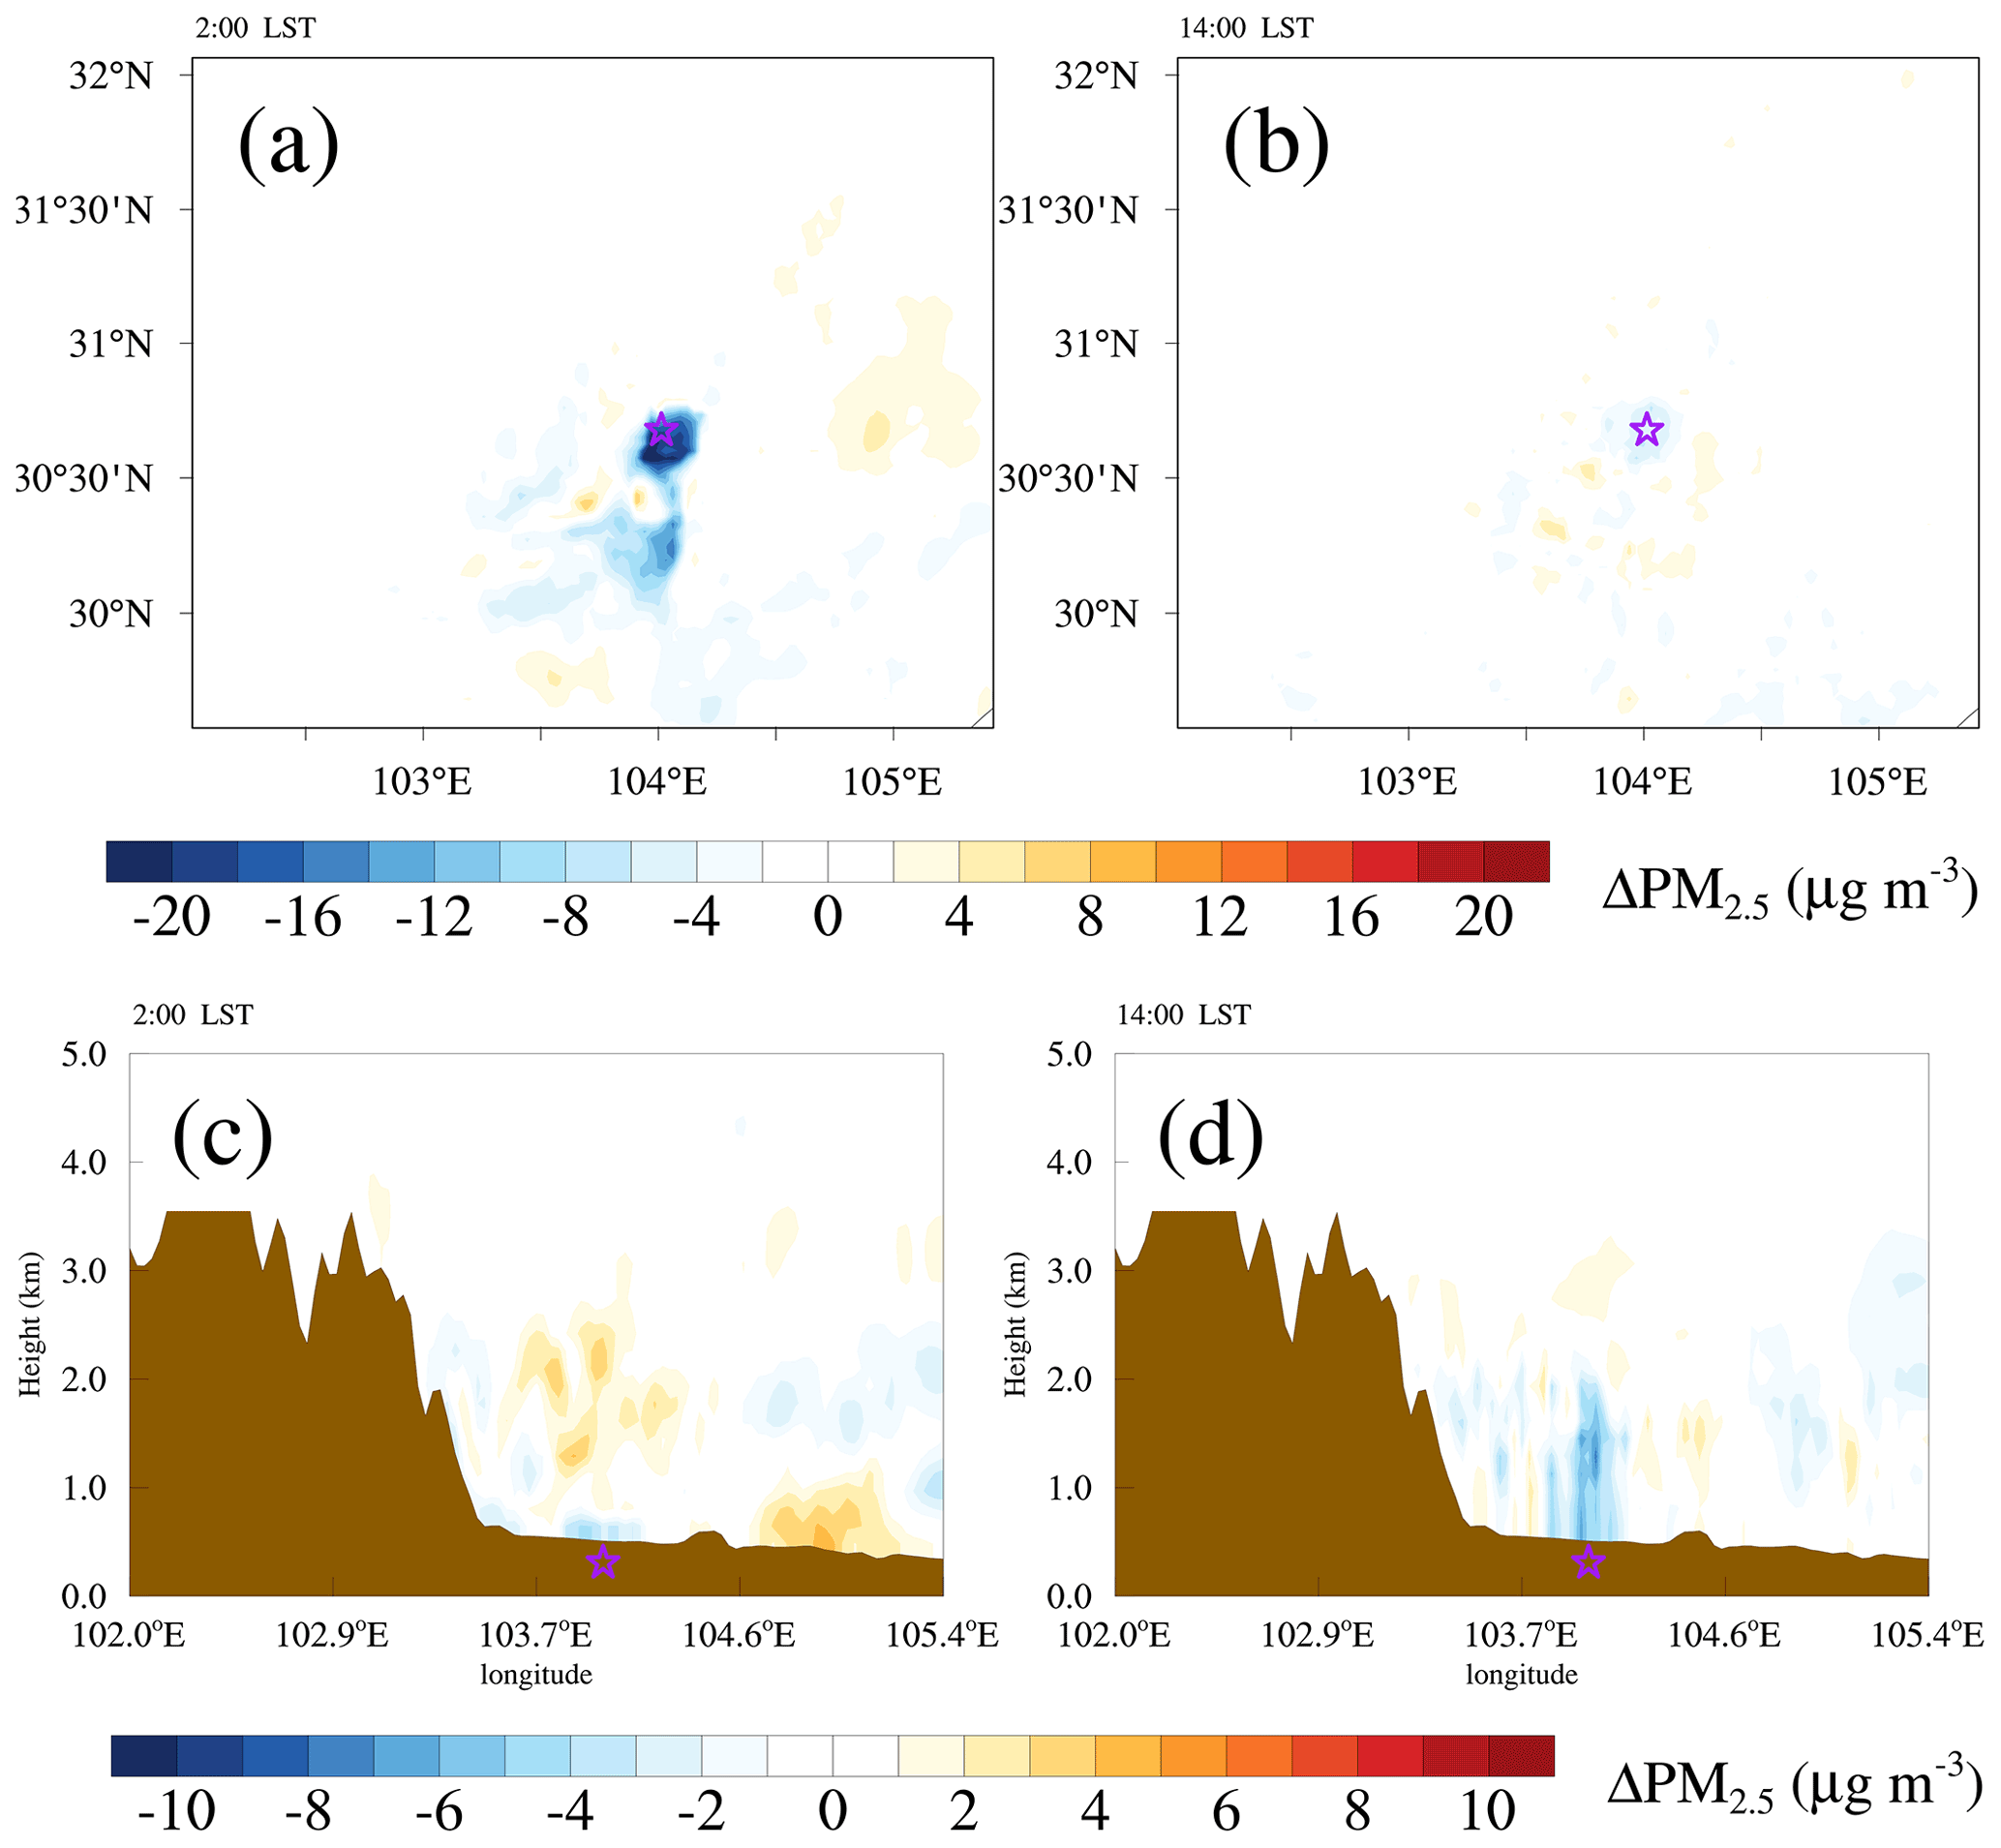
Figure 9Panels (a) and (b) present the horizontal distributions of the differences in PM2.5 at the lowest model level at 02:00 and 14:00 LST, respectively. Panels (c) and (d) present the east–west vertical cross sections of the difference in PM2.5 at 02:00 and 14:00 LST, respectively. Purple stars show the location of Chengdu. Brown shaded areas represent the terrain. These results are the difference between the monthly average of the Jan_Base and Jan_noCD simulations (Jan_Base minus Jan_noCD).
O3 exhibited strong diurnal variation, with an afternoon maximum and an early-morning minimum (Fig. 8a). After sunrise, the nocturnal residual layer was destroyed while the convective boundary layer developed as the surface heated up on account of the incoming radiation. The high-concentration O3 in the residual layer was then transported downward (Hu et al., 2018). Meanwhile, O3 could be generated by photochemical reactions between volatile organic compounds (VOCs) and NOx in the presence of sunlight. Through these two pathways, the surface O3 concentration increased rapidly in the morning (Zhan and Xie, 2022). By noon, O3 was mixed within the convective boundary layer via strong turbulence. Strong photochemical production and vertical mixing could maintain high surface O3 concentrations until late afternoon. The daytime plain wind drove the westward transport of O3 and aggravated O3 pollution along the eastern slope of the Tibetan Plateau (Fig. 8c, e). After sunset, O3 production ceased as the intensity of sunlight diminished. O3 concentrations decreased substantially owing to surface deposition and nitrogen oxide titration (O3 + NO → O2 + NO2) and then gradually reached their minimum in the early morning (Fig. 8b). However, O3 in the nocturnal residual layer was still at a high level, with values of more than 160 µg m−3. The nighttime mountain wind could carry O3-rich air eastward, and it enhanced O3 concentrations aloft over the eastern slope of the Tibetan Plateau (Fig. 8d). Compared with the Jan_Base simulation, O3 with a concentration of ∼ 100 µg m−3 had always existed over the Tibetan Plateau where PM2.5 concentrations were quite low, indicating that the background concentration of O3 was much higher than that of PM2.5. This can pose a huge challenge to O3 pollution control in Chengdu.
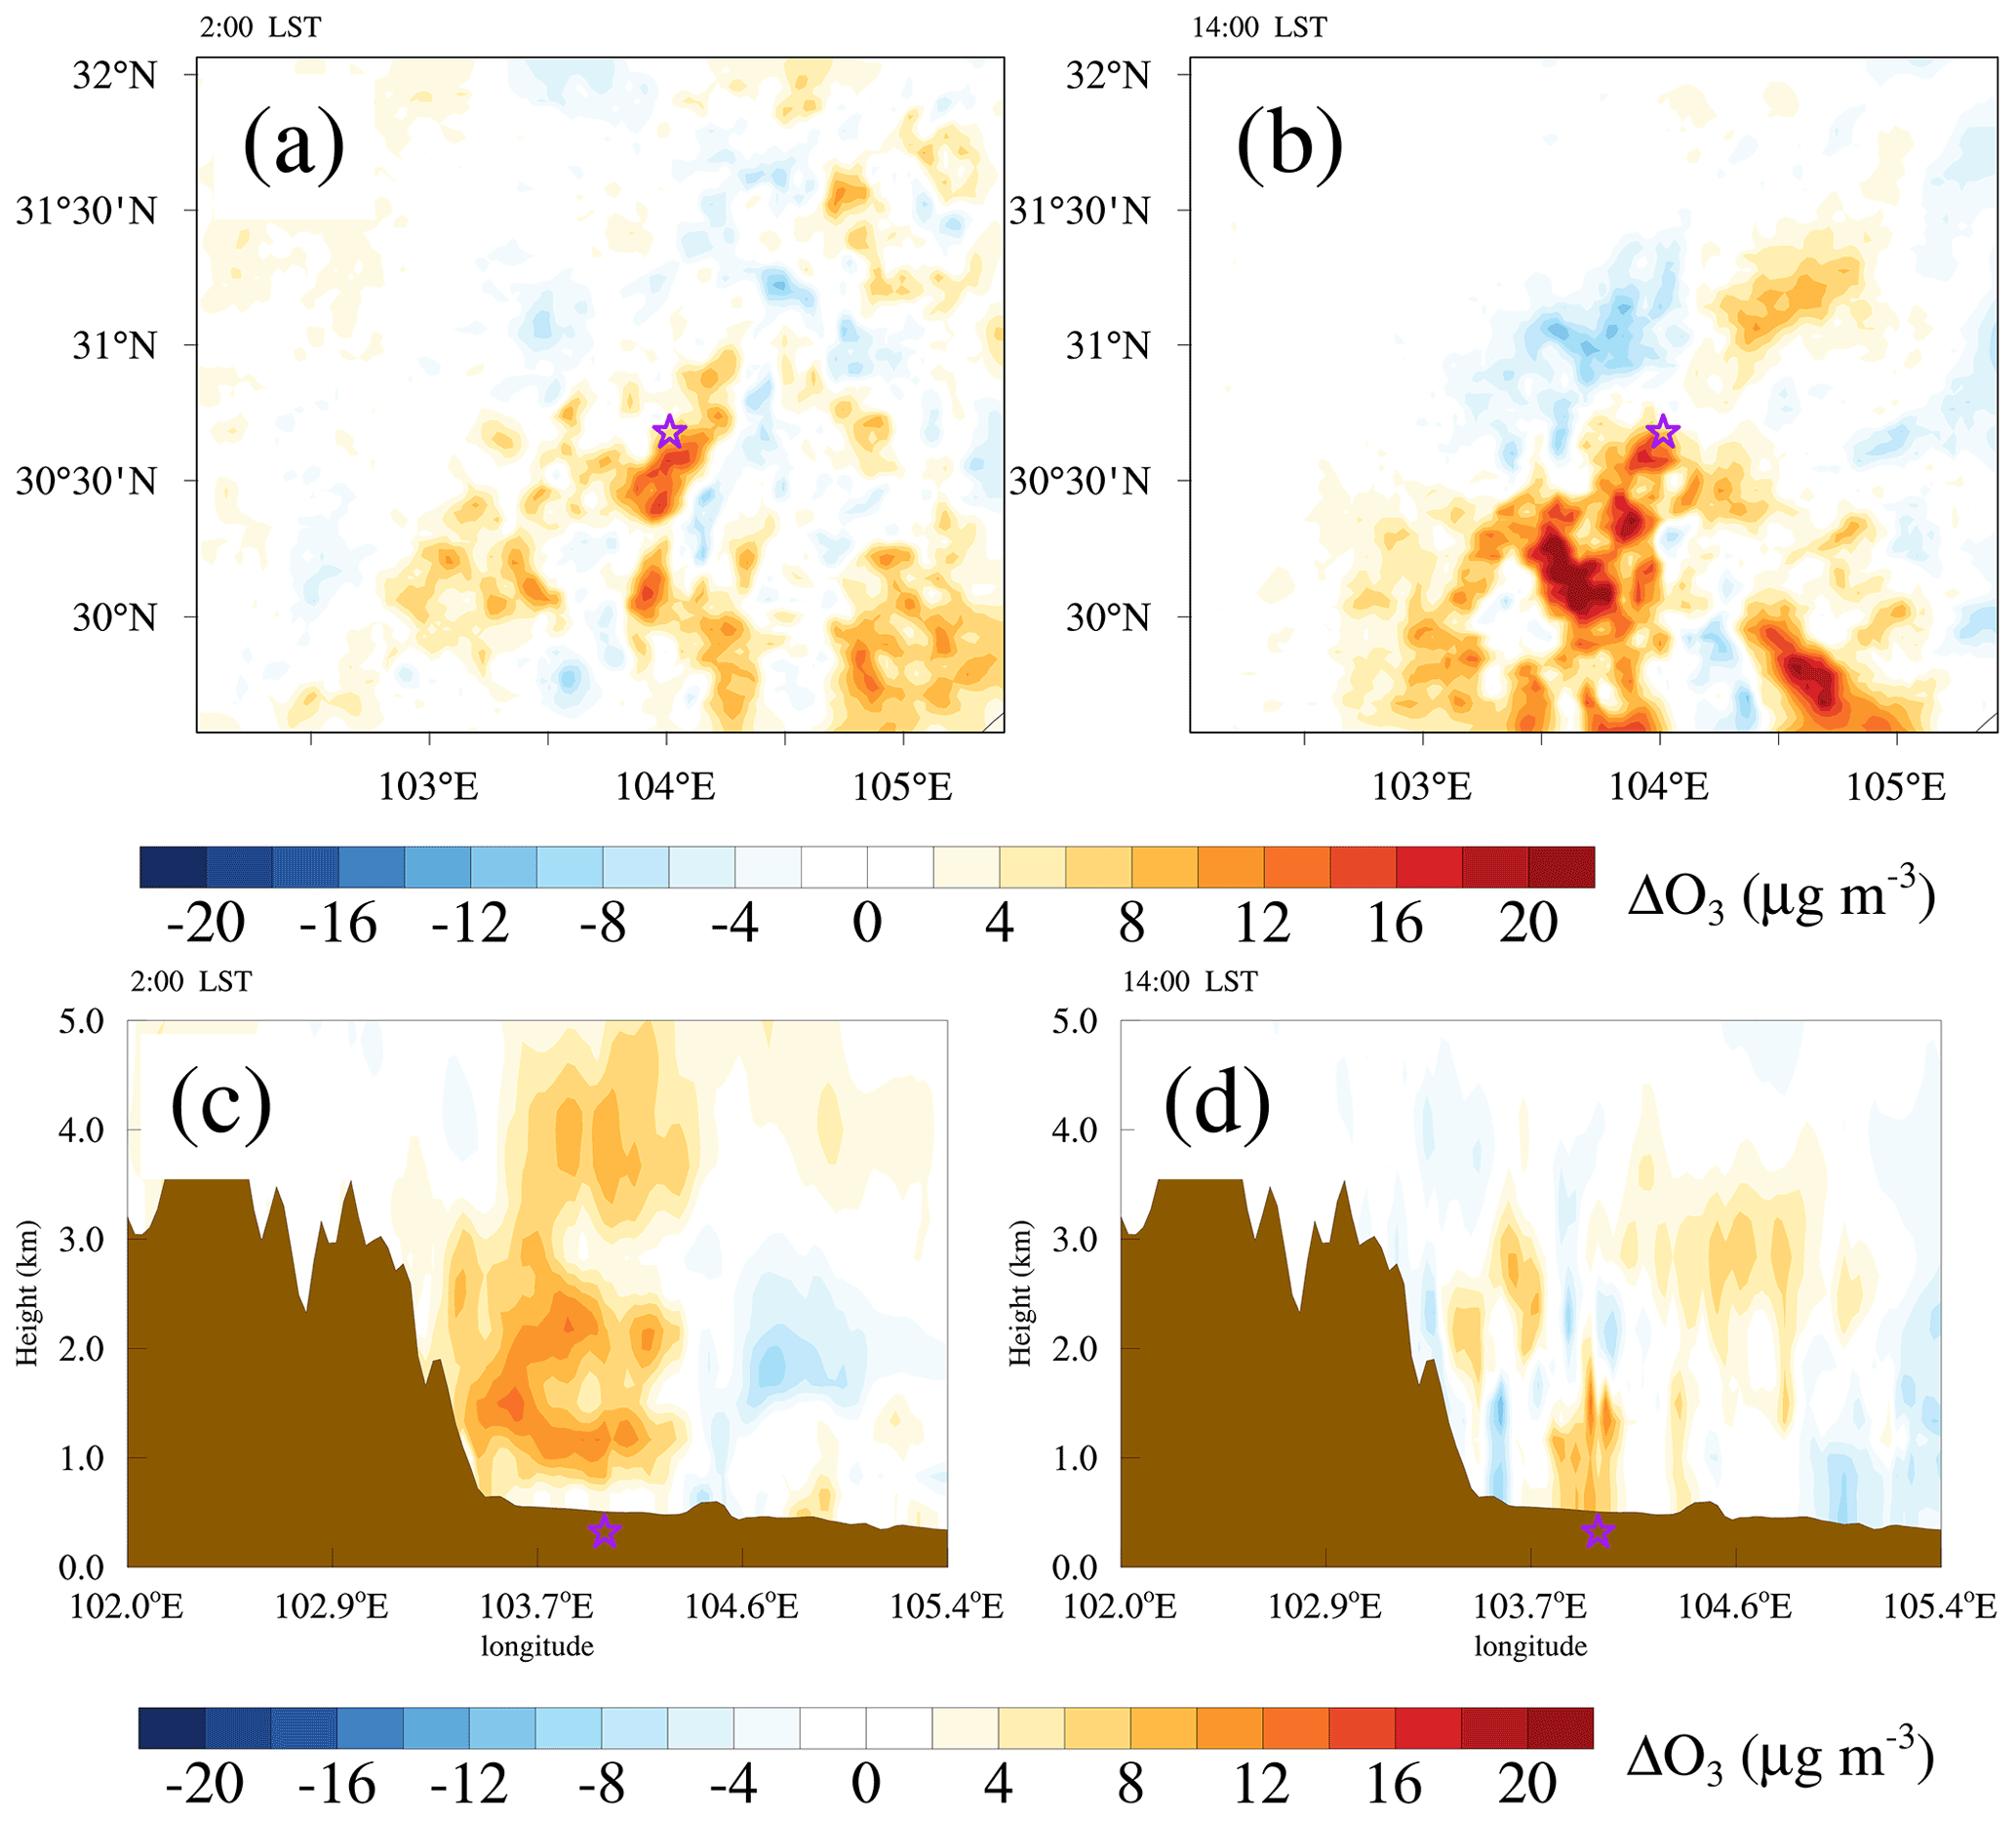
Figure 10Panels (a) and (b) present the horizontal distributions of the differences in O3 at the lowest model level at 02:00 and 14:00 LST, respectively. Panels (c) and (d) present the east–west vertical cross sections of the difference in O3 at 02:00 and 14:00 LST, respectively. Purple stars show the location of Chengdu. Brown shaded areas represent the terrain. These results are the difference between the monthly average of the July_Base and July_noCD simulations (July_Base minus July_noCD).
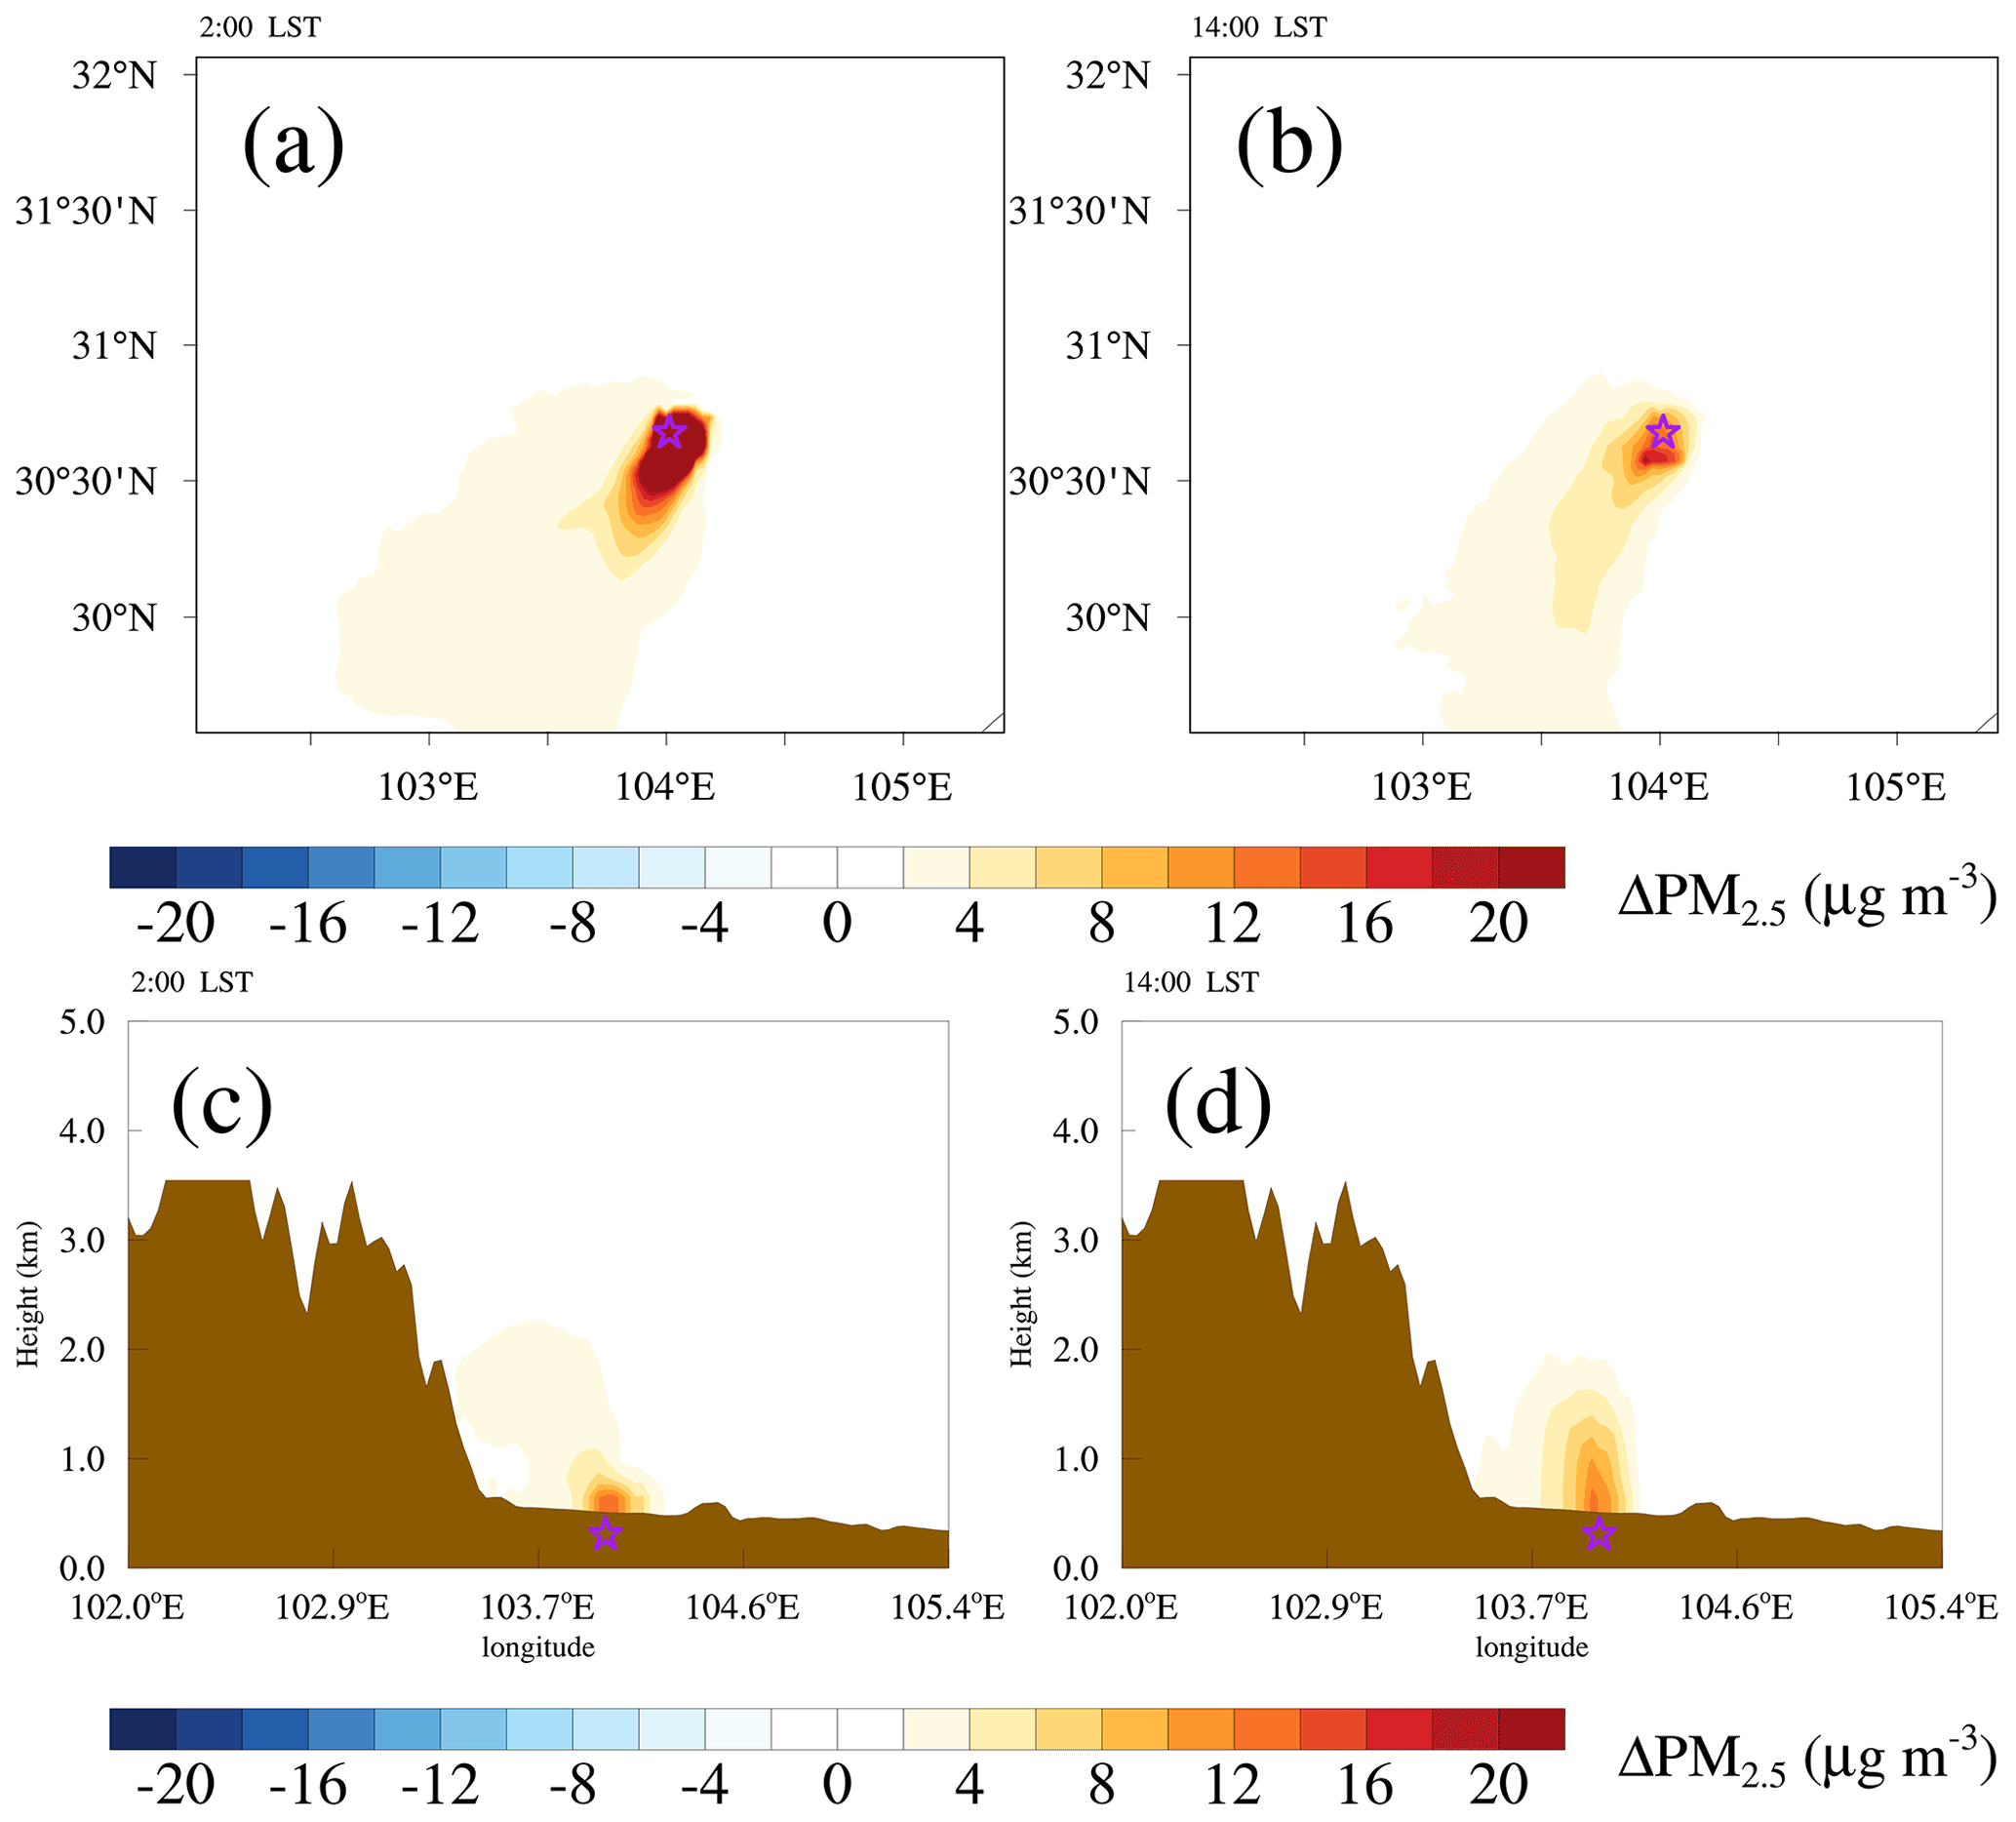
Figure 11Same as Fig. 9 but for the difference between the monthly average of the Jan_Base and Jan_noEmi simulations (Jan_Base minus Jan_noEmi).
3.3.4 Impacts of urban land use on PM2.5 and O3
Modification of urban land use changes surface dynamic and thermal characteristics, affecting the exchange of energy, moisture and momentum and hence altering urban meteorology and air quality. As illustrated in Fig. 9, surface PM2.5 concentrations in the Jan_Base simulation were lower than those in the Jan_noCD simulation, with the monthly average concentrations reduced by 10.8 µg m−3 (7.6 %). Moreover, the decrease in PM2.5 concentrations was larger during nighttime than during daytime. The monthly average PM2.5 concentrations decreased by 13.9 µg m−3 (8.6 %) at 02:00 LST (LST is UTC+8h) but only by 3.0 µg m−3 (2.6 %) at 14:00 LST (Fig. 9a, b). The decrease in surface PM2.5 concentrations was mainly attributed to the modification of the boundary layer height. Urban land use can enhance surface heating and then increases air temperature. The vertical air movement is then enhanced by the warming up of the air temperature, increasing the boundary layer height (Fig. S1), which facilitates the vertical diffusion of surface PM2.5. PM2.5 concentrations increased by 2–6 µg m−3 in the upper boundary layer (∼ 1 km above ground) (Fig. 9c, d), further confirming this point.
O3 is a secondary air pollutant that is not only related to meteorological conditions but also to its precursors (VOCs and NOx). Due to the increase in upward air movement and the boundary layer height induced by urban land use compared with cropland (Fig. S2), like PM2.5, NOx concentrations also decreased near the surface (Liao et al., 2015; Zhu et al., 2017). The decrease in NOx near the surface resulted in an increase in surface O3 at night, as NOx titration was weakened (Fig. 10a, c). Although the elevated boundary layer diluted O3 concentrations to some extent, the nighttime O3 concentrations were mainly dominated by chemical effects and increased by 15.6 µg m−3 (16.0 %) at 02:00 LST (Fig. 10a). During daytime, the increased air temperature was conducive to the photochemical production of O3, and the well-developed convective boundary layer favored the vertical mixing of O3. O3 concentrations also increased (Fig. 10b, d), with the monthly average value increasing by 5.4 µg m−3 (4.5 %) at 14:00 LST. As high O3 concentrations were mainly concentrated in the afternoon, the monthly average MDA8 O3 concentrations finally increased by 10.6 µg m−3 (6.0 %) due to the effects of urban expansion.
3.3.5 Impacts of anthropogenic emissions on PM2.5 and O3
Rising anthropogenic emissions of air pollutants and their precursors can significantly increase ambient air pollution. Therefore, the impacts of anthropogenic emissions are more intuitive than urban land use. Figure 11 shows the differences in PM2.5 between the monthly average of the Jan_Base and Jan_noEmi simulations (Jan_Base minus Jan_noEmi). PM2.5 concentrations in the Jan_Base simulation were significantly higher than those in the Jan_noEmi simulation, with the monthly average concentration enhanced by 23.9 µg m−3 (16.8 %), more than twice the difference between the Jan_Base and Jan_noCD simulations. Furthermore, increases in the PM2.5 concentrations appeared throughout the boundary layer (Fig. 11c, d) and could extend downstream for hundreds of kilometers (Fig. 11a, b), indicating that reducing anthropogenic emissions is an effective way to reduce PM2.5 concentrations.
As for O3, the monthly average O3 concentrations in the July_Base simulation were only 1.6 µg m−3 (1.4 %) higher than those in the July_noEmis simulation at 14:00 LST (Fig. 12b, d), which was much smaller than the change in PM2.5. This phenomenon may be related to the nonlinear sensitivity of O3 to VOCs and NOx precursor emissions. O3 formation regimes can be classified into VOC-limited, NOx-limited and transition regimes depending on the ratio of VOCs to NOx (Jin et al., 2020; Lu et al., 2019). At low ratios (VOC-limited regime), reducing the concentration of NOx would even lead to an increase in O3 formation. Considering that Chengdu remained in a VOC-limited regime during the period from 2013 to 2020 (Tan et al., 2018; Y. Wang et al., 2022), the effects of reducing NOx emissions may be partially offset by changes in VOCs; thus, a reasonable regulation framework that involves joint control of NOx and VOC emissions is necessary to alleviate O3 pollution. Although the presence of anthropogenic emissions reduced the monthly average O3 concentrations by 3.0 µg m−3 (3.1 %) at 2:00 LST, the monthly average MDA8 O3 concentrations in the July_Base simulation were 4.8 µg m−3 (2.7 %) higher than those in the July_noEmis simulation.
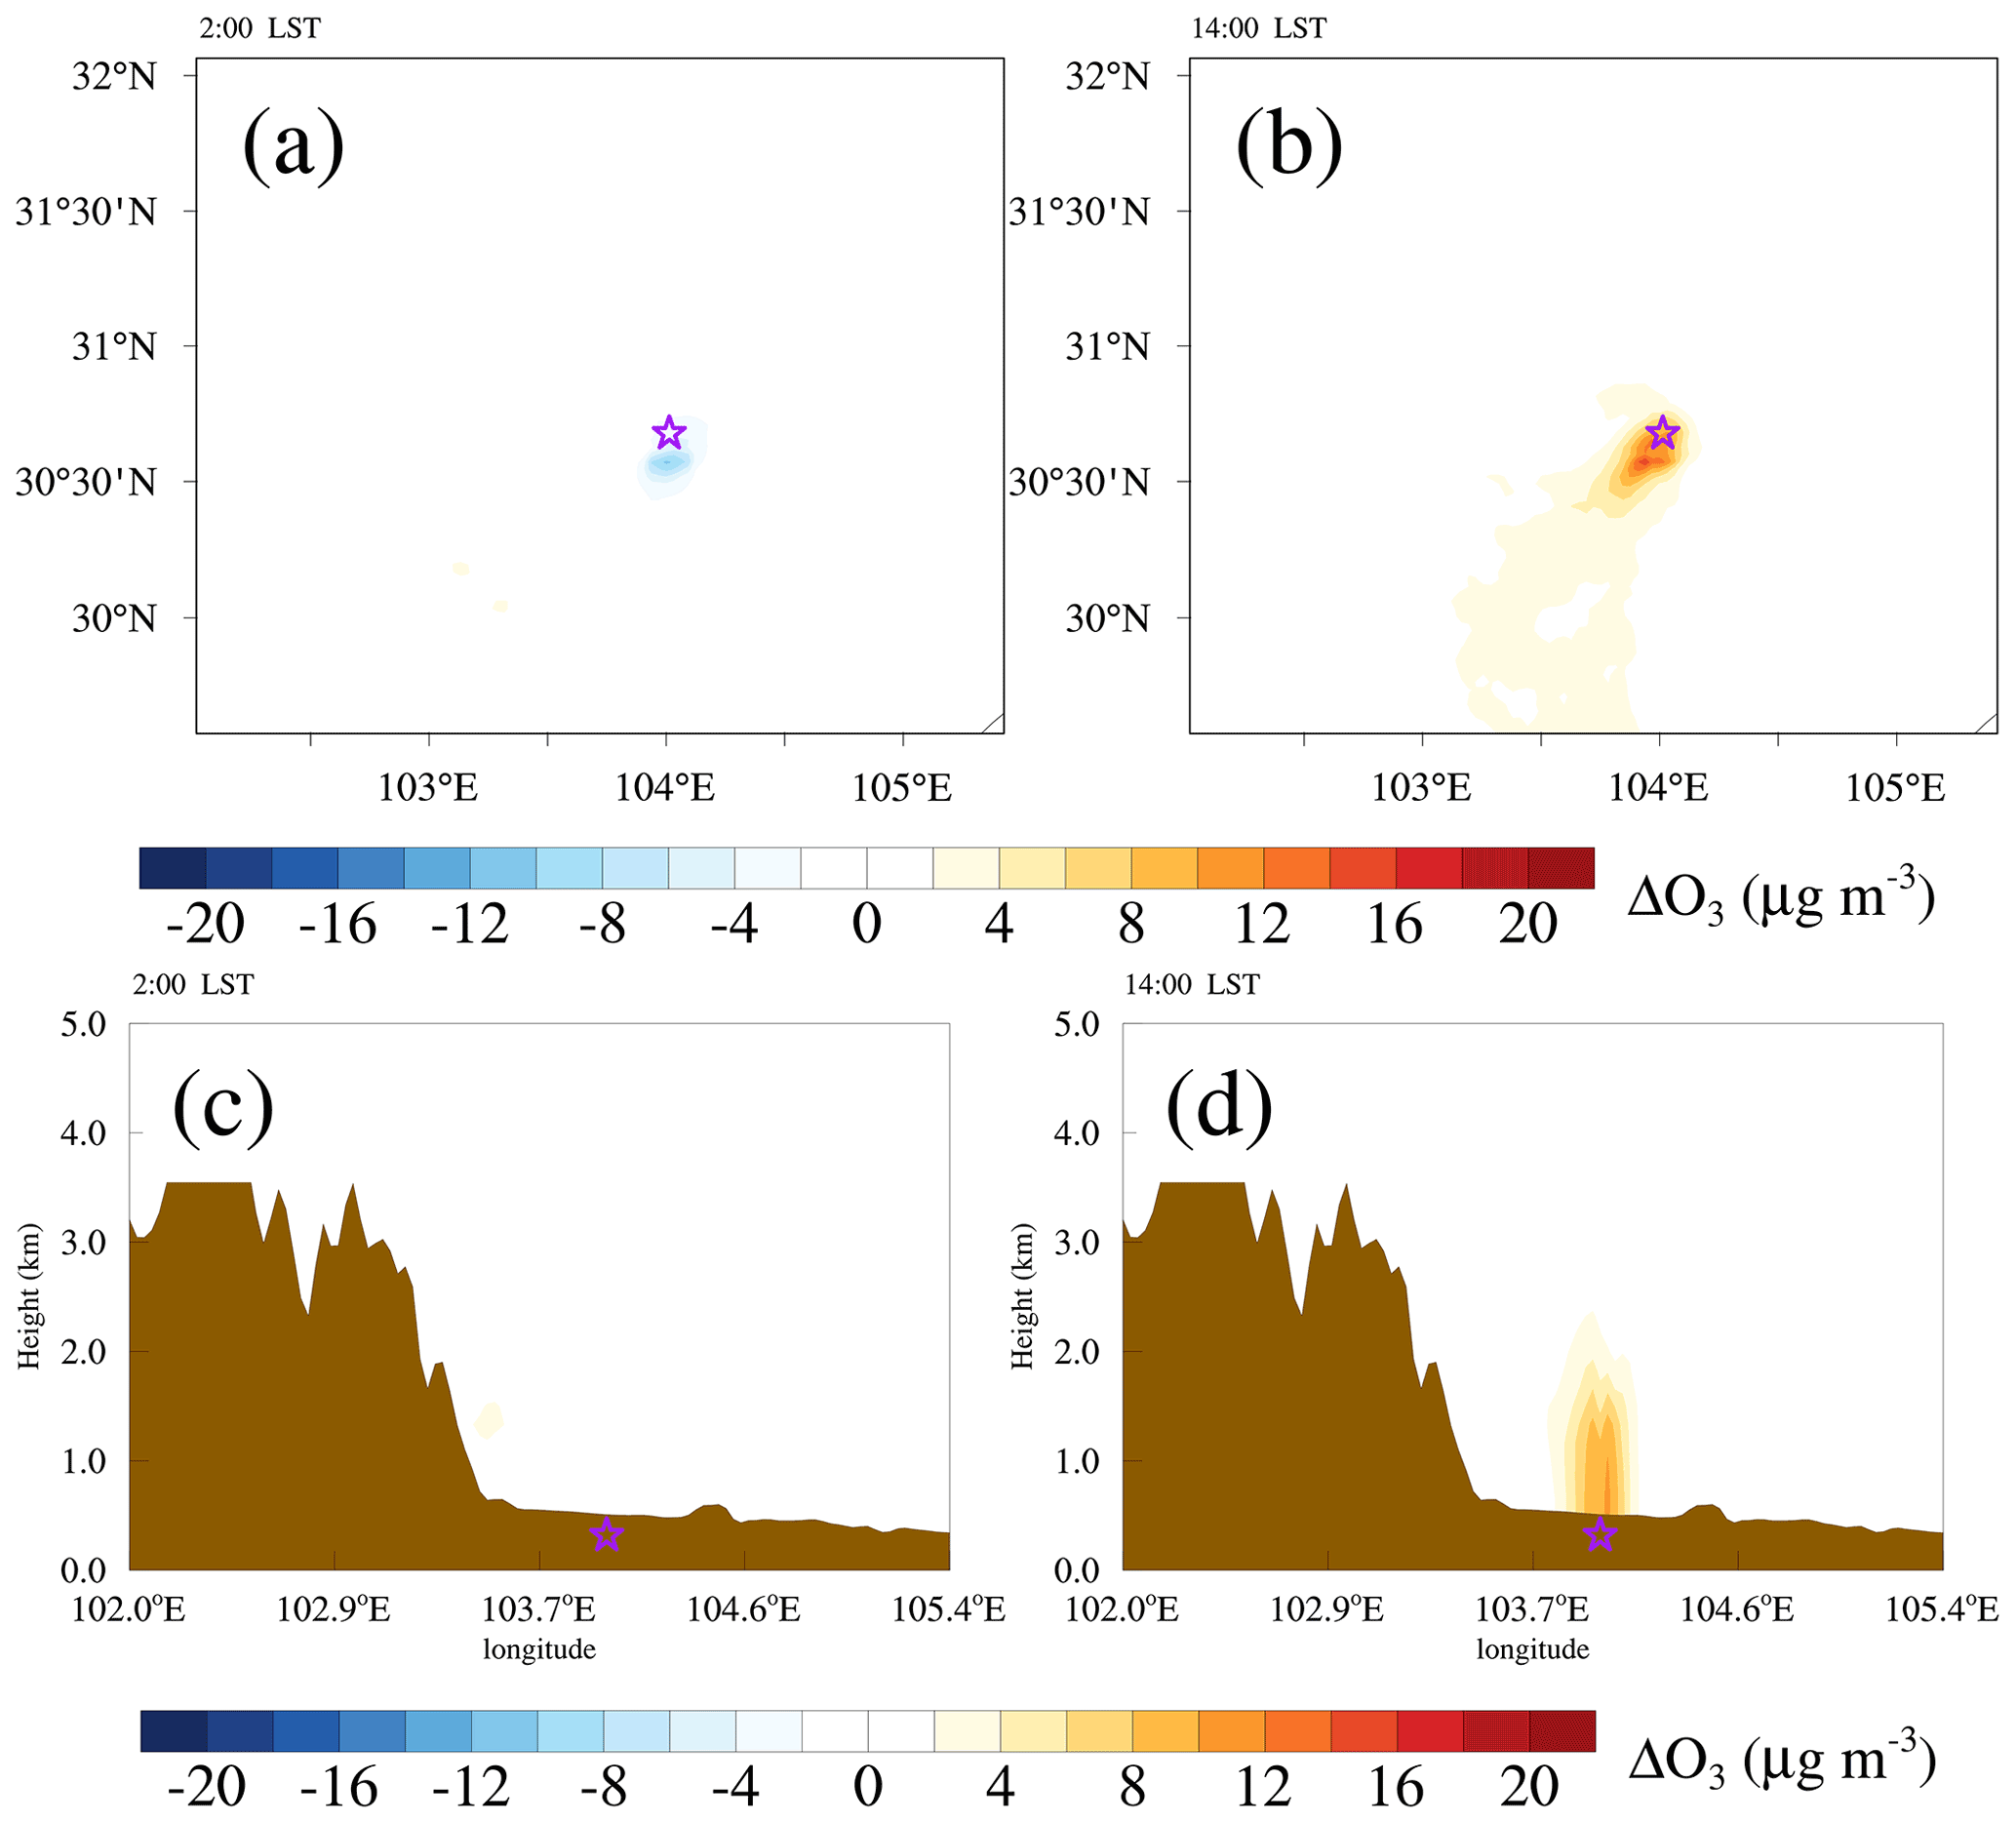
Figure 12Same as Fig. 10 but for the difference between the monthly average of the July_Base and July_noEmi simulations (July_Base minus July_noEmi).
3.4 Health risks caused by urbanization
According to the above results, urban land use decreased the monthly average PM2.5 concentrations by 10.8 µg m−3 (7.6 %) but increased the monthly average MDA8 O3 concentrations by 10.6 µg m−3 (6.0 %). On the other hand, anthropogenic emissions increased both PM2.5 and MDA8 O3 concentrations, with monthly average values of 23.9 µg m−3 (16.8 %) and 4.8 µg m−3 (2.7 %), respectively. We then calculate the changes in premature mortality under different simulation scenarios to assess the health risks related to changes in PM2.5 and O3 concentrations. As shown in Fig. 13, the premature mortality from ANACs, CVDs, RDs and COPDs due to PM2.5 decreased by 171 (95 % CI of 129–200, or about 6.9 %), 45 (95 % CI of 34–53, or about 6.7 %), 22 (95 % CI of 16–27, or about 6.5 %) and 23 (95 % CI of 17–26, or about 6.2 %), respectively, in January 2017 when the Chengdu area was classified as urban land use rather than cropland. On the other hand, anthropogenic emissions in Chengdu increased premature mortality from ANACs, CVDs, RDs and COPDs due to PM2.5 by 388 (95 % CI of 291–456, or about 15.7 %), 102 (95 % CI of 77–121, or about 15.1 %), 51 (95 % CI of 35–62, or about 15.0 %) and 52 (95 % CI of 39–60, or about 14.1 %), respectively. With regard to O3, premature mortality from O3-induced diseases increased when urban land use and anthropogenic emissions were taken into account. Urban land use led to an increase in premature mortality from ANACs, CVDs, RDs and COPDs due to O3 by 203 (95 % CI of 122–268, or about 9.5 %), 51 (95 % CI of 22–71, or about 9.4 %), 18 (95 % CI of −14–35, or about 10.0 %) and 17 (95 % CI of −15–33, or about 9.7 %), respectively, in July 2017 compared with cropland. When anthropogenic emissions in Chengdu were turned on, premature mortality from ANACs, CVDs, RDs and COPDs due to O3 increased by 87 (95 % CI of 54–112, or about 4.1 %), 22 (95 % CI of 10–29, or about 4.1 %), 8 (95 % CI of −7–14, or about 4.4 %) and 7 (95 % CI of −7–13, or about 4.0 %), respectively. In summary, the total premature mortality due to PM2.5 and O3 changed by about −6.9 % and 9.5 % due to urban expansion, and these values changed by about 15.7 % and 4.1 % due to emissions growth.

Figure 13Differences in premature mortality from ANACs, CVDs, RDs and COPDs due to PM2.5 (left of the dotted line) and O3 (right of the dotted line) between the baseline and sensitivity simulations. The dots represent the mean estimate, and the whiskers represent 95 % CIs.
With the development of urbanization, urban land use and anthropogenic emissions increase, thereby affecting urban air quality and, in turn, the health risks associated with air pollutants. In this study, the impacts of urban land use and anthropogenic emissions on air pollutant concentrations and the related health risks in Chengdu, a highly urbanized city with severe air pollution and complex terrain, are quantified. Management of urban air pollution is usually achieved by reducing anthropogenic emissions. Thus, the effects of urban expansion are further compared with those of emissions growth.
Chengdu has been suffering from severe PM2.5 and O3 pollution in recent years. During the years from 2015 to 2021, there were 97, 101, 68, 53, 33, 43 and 37 respective PM2.5 pollution episodes and 61, 48, 42, 40, 42, 71 and 48 respective O3 pollution episodes. Severe PM2.5 and O3 pollution posed huge health risks. The 7-year annual averages of premature mortality from ANACs, CVDs, RDs and COPDs due to PM2.5 were 9386 (95 % CI of 6542–11726), 2609 (95 % CI of 1788–3384), 1321(95 % CI of 804–1840) and 1485 (95 % CI of 941–1983), respectively, and those due to O3 were 8506 (95 % CI of 4817–11882), 2175 (95 % CI of 863–3320), 713 (95 % CI of −492–1664) and 693 (95 % CI of −517–1617), respectively. PM2.5 and O3 pollution showed different seasonal trends: owing to the blocking of air and the stable atmospheric layer, PM2.5 pollution tended to appear in cold months (November to February), whereas O3 pollution was likely to occur in warm months (April to August) due to high-temperature and strong-sunlight conditions as well as the fact that these months are dominated by high-pressure systems. PM2.5 concentrations were high at night and low at noon, which was contrary to the boundary layer height. O3 exhibited strong diurnal variation, with an afternoon maximum and an early-morning minimum, which was related to photochemical reactions during daytime and nitrogen oxide titration at night.
The urban land use of Chengdu was replaced by cropland in the WRF-Chem model to examine the impacts of urban expansion. Urban land use led to an increase in air temperature and the boundary layer height compared with cropland, and it decreased monthly averaged surface PM2.5 concentrations by 10.8 µg m−3 (7.6 %). A higher temperature and boundary layer height increased O3 concentrations via stronger photochemical reactions and better vertical mixing during daytime. During nighttime, dominated by the weakened chemical NOx titration, O3 concentrations also increased. Finally, the monthly averaged MDA8 O3 concentrations increased by 10.6 µg m−3 (6.0 %). In this case, when the Chengdu area was classified as urban land use rather than cropland, the premature mortality from ANACs due to PM2.5 exposure decreased by 171 (95 % CI of 129–200, or about 6.9 %) but those due to O3 increased by 203 (95 % CI of 122–268, or about 9.5 %). Anthropogenic emissions increased the surface PM2.5 significantly, with the monthly average concentration increasing by 23.9 µg m−3 (16.8 %), more than twice the difference caused by urban land use. Owing to the nonlinear sensitivity of O3 to its precursors, O3 concentrations increased at noon but decreased at night. In particular, the monthly average O3 concentrations increased by 1.6 µg m−3 (1.4 %) at 14:00 LST but decreased by 3.0 µg m−3 (3.1 %) at 2:00 LST. As O3 concentrations during the daytime were much higher than those at night, the monthly average MDA8 O3 concentrations still increased by 4.8 µg m−3 (2.7 %). As a consequence, the premature mortality from ANACs due to PM2.5 increased by 388 (95 % CI of 291–456, or about 15.7 %) whereas that due to O3 increased by 87 (95 % CI of 54–112, or about 4.1 %) with anthropogenic emissions in Chengdu.
Our results show that the impacts of urban expansion (about −6.9 % for PM2.5 and about 9.5 % for O3) are of the same order as those induced by emissions growth (about 15.7 % for PM2.5 and about 4.1 % for O3) on air pollutants. This suggests that, although the focus of air quality management is traditionally to regulate emissions, urban planning is an ancillary option and should also be considered in future air pollution strategies.
Air quality monitoring data were acquired from the official NEMC real-time publishing platform (https://air.cnemc.cn:18007/, last access: 5 January 2023; National Environmental Monitoring Centre of China, Zhan and Xie, 2022). Meteorological data were obtained from the University of Wyoming website (http://weather.uwyo.edu/, last access: 5 January 2023; Department of Atmospheric Science, Zhan et al., 2020). The NCEP FNL data were taken from the NCEP (https://doi.org/10.5065/D6M043C6, National Centers for Environmental Prediction, 2000). The MEIC data can be accessed at http://meicmodel.org/ (Li et al., 2017; Zheng et al., 2018). These data can be downloaded for free as long as one agrees to the official instructions.
The supplement related to this article is available online at: https://doi.org/10.5194/acp-23-771-2023-supplement.
CZ and MX had the original idea for the study, designed the research, collected the data and prepared the original draft of the paper. CZ undertook the numerical simulations and carried out the data analysis. MX acquired financial support for the project leading to this publication. HL, BL and ZW collected the data. TW, BZ, ML and SL reviewed the initial draft and checked the language of the original draft.
The contact author has declared that none of the authors has any competing interests.
Publisher's note: Copernicus Publications remains neutral with regard to jurisdictional claims in published maps and institutional affiliations.
The authors are grateful to NEMC for the air quality monitoring data, to NCDC for the meteorological data, to NCEP for global final analysis fields and to Tsinghua University for the MEIC inventories. We acknowledge the High-Performance Computing Center of Nanjing University of Information Science and Technology for their support of this work. The authors also thank the anonymous reviewers for their constructive comments and suggestions.
This work was supported by the National Natural Science Foundation of China (grant nos. 42275102, 42222503 and 42175098), the open research fund of Chongqing Meteorological Bureau (grant no. KFJJ-201607) and the Natural Science Foundation of Jiangsu Province (grant no. BK20211158).
This paper was edited by Thomas Karl and reviewed by two anonymous referees.
Aneja, V. P., Mathur, R., Arya, S. P., Li, Y. X., Murray, G. C., and Manuszak, T. L.: Coupling the vertical distribution of ozone in the atmospheric boundary layer, Environ. Sci. Technol., 34, 2324–2329, https://doi.org/10.1021/es990997+, 2000.
Anenberg, S. C., Horowitz, L. W., Tong, D. Q., and West, J. J.: An estimate of the global burden of anthropogenic ozone and fine particulate matter on premature human mortality using atmospheric modeling, Environ. Health Perspect., 118, 1189–1195, https://doi.org/10.1289/ehp.0901220, 2010.
Baasandorj, M., Hoch, S. W., Bares, R., Lin, J. C., Brown, S. S., Millet, D. B., Martin, R., Kelly, K., Zarzana, K. J., Whiteman, C. D., Dube, W. P., Tonnesen, G., Jaramillo, I. C., and Sohl, J.: Coupling between Chemical and Meteorological Processes under Persistent Cold-Air Pool Conditions: Evolution of Wintertime PM2.5 Pollution Events and N2O5 Observations in Utah's Salt Lake Valley, Environ. Sci. Technol., 51, 5941–5950, https://doi.org/10.1021/acs.est.6b06603, 2017.
Bahreini, R., Ahmadov, R., McKeen, S. A., Vu, K. T., Dingle, J. H., Apel, E. C., Blake, D. R., Blake, N., Campos, T. L., Cantrell, C., Flocke, F., Fried, A., Gilman, J. B., Hills, A. J., Hornbrook, R. S., Huey, G., Kaser, L., Lerner, B. M., Mauldin, R. L., Meinardi, S., Montzka, D. D., Richter, D., Schroeder, J. R., Stell, M., Tanner, D., Walega, J., Weibring, P., and Weinheimer, A.: Sources and characteristics of summertime organic aerosol in the Colorado Front Range: perspective from measurements and WRF-Chem modeling, Atmos. Chem. Phys., 18, 8293–8312, https://doi.org/10.5194/acp-18-8293-2018, 2018.
Baklanov, A., Molina, L. T., and Gauss, M.: Megacities, air quality and climate, Atmos. Environ., 126, 235–249, https://doi.org/10.1016/j.atmosenv.2015.11.059, 2016.
Brauer, M., Freedman, G., Frostad, J., van Donkelaar, A., Martin, R. V., Dentener, F., van Dingenen, R., Estep, K., Amini, H., Apte, J. S., Balakrishnan, K., Barregard, L., Broday, D., Feigin, V., Ghosh, S., Hopke, P. K., Knibbs, L. D., Kokubo, Y., Liu, Y., Ma, S. F., Morawska, L., Sangrador, J. L. T., Shaddick, G., Anderson, H. R., Vos, T., Forouzanfar, M. H., Burnett, R. T., and Cohen, A.: Ambient Air Pollution Exposure Estimation for the Global Burden of Disease 2013, Environ. Sci. Technol., 50, 79–88, https://doi.org/10.1021/acs.est.5b03709, 2016.
Chen, R., Yin, P., Meng, X., Liu, C., Wang, L., Xu, X., Ross, J. A., Tse, L. A., Zhao, Z., Kan, H., and Zhou, M.: Fine Particulate Air Pollution and Daily Mortality. A Nationwide Analysis in 272 Chinese Cities, Am. J. Respir. Crit. Care Med., 196, 73–81, https://doi.org/10.1164/rccm.201609-1862OC, 2017.
Chen, S. H. and Sun, W. Y.: A one-dimensional time dependent cloud model, J. Meteorol. Soc. Jpn., 80, 99–118, https://doi.org/10.2151/jmsj.80.99, 2002.
Dai, X. A., Johnson, B. A., Luo, P. L., Yang, K., Dong, L. X., Wang, Q., Liu, C., Li, N. W., Lu, H., Ma, L., Yang, Z. L., and Yao, Y. Z.: Estimation of Urban Ecosystem Services Value: A Case Study of Chengdu, Southwestern China, Remote Sens., 13, 207, https://doi.org/10.3390/rs13020207, 2021.
Fast, J. D., Gustafson, W. I., Easter, R. C., Zaveri, R. A., Barnard, J. C., Chapman, E. G., Grell, G. A., and Peckham, S. E.: Evolution of ozone, particulates, and aerosol direct radiative forcing in the vicinity of Houston using a fully coupled meteorology-chemistry-aerosol model, J. Geophys. Res.-Atmos., 111, D21305, https://doi.org/10.1029/2005jd006721, 2006.
Grell, G. A. and Devenyi, D.: A generalized approach to parameterizing convection combining ensemble and data assimilation techniques, Geophys. Res. Lett., 29, 38-31–38-34, https://doi.org/10.1029/2002gl015311, 2002.
Grell, G. A., Peckham, S. E., Schmitz, R., McKeen, S. A., Frost, G., Skamarock, W. C., and Eder, B.: Fully coupled “online” chemistry within the WRF model, Atmos. Environ., 39, 6957–6975, https://doi.org/10.1016/j.atmosenv.2005.04.027, 2005.
Guenther, A., Karl, T., Harley, P., Wiedinmyer, C., Palmer, P. I., and Geron, C.: Estimates of global terrestrial isoprene emissions using MEGAN (Model of Emissions of Gases and Aerosols from Nature), Atmos. Chem. Phys., 6, 3181–3210, https://doi.org/10.5194/acp-6-3181-2006, 2006.
Guo, H., Ling, Z. H., Cheung, K., Jiang, F., Wang, D. W., Simpson, I. J., Barletta, B., Meinardi, S., Wang, T. J., Wang, X. M., Saunders, S. M., and Blake, D. R.: Characterization of photochemical pollution at different elevations in mountainous areas in Hong Kong, Atmos. Chem. Phys., 13, 3881–3898, https://doi.org/10.5194/acp-13-3881-2013, 2013.
Holman, C., Harrison, R. M., and Querol, X.: Review of the efficacy of low emission zones to improve urban air quality in European cities, Atmos. Environ., 111, 161–169, https://doi.org/10.1016/j.atmosenv.2015.04.009, 2015.
Hu, J., Li, Y., Zhao, T., Liu, J., Hu, X.-M., Liu, D., Jiang, Y., Xu, J., and Chang, L.: An important mechanism of regional O3 transport for summer smog over the Yangtze River Delta in eastern China, Atmos. Chem. Phys., 18, 16239–16251, https://doi.org/10.5194/acp-18-16239-2018, 2018.
Hu, Y. and Wang, S.: Formation mechanism of a severe air pollution event: A case study in the Sichuan Basin, Southwest China, Atmos. Environ., 246, 118135, https://doi.org/10.1016/j.atmosenv.2020.118135, 2021.
Janjić, Z. I.: The Step-Mountain Eta Coordinate Model – Further Developments of the Convection, Viscous Sublayer, and Turbulence Closure Schemes, Mon. Weather Rev., 122, 927–945, https://doi.org/10.1175/1520-0493(1994)122<0927:Tsmecm>2.0.Co;2, 1994.
Jimenez, P. A. and Dudhia, J.: Improving the Representation of Resolved and Unresolved Topographic Effects on Surface Wind in the WRF Model, J. Appl. Meteorol. Climatol., 51, 300–316, https://doi.org/10.1175/jamc-d-11-084.1, 2012.
Jin, X. M., Fiore, A., Boersma, K. F., De Smedt, I., and Valin, L.: Inferring Changes in Summertime Surface Ozone–NOx–VOC Chemistry over US Urban Areas from Two Decades of Satellite and Ground-Based Observations, Environ. Sci. Technol., 54, 6518–6529, https://doi.org/10.1021/acs.est.9b07785, 2020.
Karl, T., Gohm, A., Rotach, M. W., Ward, H. C., Graus, M., Cede, A., Wohlfahrt, G., Hammerle, A., Haid, M., Tiefengraber, M., Lamprecht, C., Vergeiner, J., Kreuter, A., Wagner, J., and Staudinger, M.: Studying Urban Climate and Air Quality in the Alps: The Innsbruck Atmospheric Observatory, B. Am. Meteorol. Soc., 101, E488–E507, https://doi.org/10.1175/bams-d-19-0270.1, 2019.
Kinney, P. L.: Interactions of Climate Change, Air Pollution, and Human Health, Curr. Environ. Health Rep., 5, 179–186, https://doi.org/10.1007/s40572-018-0188-x, 2018.
Lee, C. S. L., Chou, C. C., Cheung, H. C., Tsai, C. Y., Huang, W. R., Huang, S. H., Chen, M. J., Liao, H. T., Wu, C. F., Tsao, T. M., Tsai, M. J., and Su, T. C.: Seasonal variation of chemical characteristics of fine particulate matter at a high-elevation subtropical forest in East Asia, Environ. Pollut., 246, 668–677, https://doi.org/10.1016/j.envpol.2018.11.033, 2019.
Lelieveld, J., Barlas, C., Giannadaki, D., and Pozzer, A.: Model calculated global, regional and megacity premature mortality due to air pollution, Atmos. Chem. Phys., 13, 7023–7037, https://doi.org/10.5194/acp-13-7023-2013, 2013.
Li, M., Liu, H., Geng, G., Hong, C., Liu, F., Song, Y., Tong, D., Zheng, B., Cui, H., Man, H., Zhang, Q., and He, K.: Anthropogenic emission inventories in China: a review, Nat. Sci. Rev., 4, 834–866, https://doi.org/10.1093/nsr/nwx150, 2017 (data available at: http://meicmodel.org/, last access: 5 January 2023).
Liao, J., Wang, T., Jiang, Z., Zhuang, B., Xie, M., Yin, C., Wang, X., Zhu, J., Fu, Y., and Zhang, Y.: modeling of the impacts of urban expansion on regional climate and air pollutants in Yangtze River Delta, China, Atmos. Environ., 106, 204–214, https://doi.org/10.1016/j.atmosenv.2015.01.059, 2015.
Lin, B. and Zhu, J.: Changes in urban air quality during urbanization in China, J. Clean Prod., 188, 312–321, https://doi.org/10.1016/j.jclepro.2018.03.293, 2018.
Liu, H., Liu, S., Xue, B., Lv, Z., Meng, Z., Yang, X., Xue, T., Yu, Q., and He, K.: Ground-level ozone pollution and its health impacts in China, Atmos. Environ., 173, 223–230, https://doi.org/10.1016/j.atmosenv.2017.11.014, 2018.
Lu, H. X., Lyu, X. P., Cheng, H. R., Ling, Z. H., and Guo, H.: Overview on the spatial-temporal characteristics of the ozone formation regime in China, Environ. Sci.-Process Impacts, 21, 916–929, https://doi.org/10.1039/c9em00098d, 2019.
Luo, Y. L., Shen, J., Chen, A. F., Tao, Q., Li, Q. Q., White, P. J., Li, T. Q., Li, B., Chen, L., Li, H. X., Gao, X. S., Xu, Q., and Wang, C. Q.: Loss of organic carbon in suburban soil upon urbanization of Chengdu megacity, China, Sci. Total Environ., 785, 147209, https://doi.org/10.1016/j.scitotenv.2021.147209, 2021.
Manisalidis, I., Stavropoulou, E., Stavropoulos, A., and Bezirtzoglou, E.: Environmental and Health Impacts of Air Pollution: A Review, Frontiers in Public Health, 8, 14, https://doi.org/10.3389/fpubh.2020.00014, 2020.
Matsui, T., Zhang, S. Q., Lang, S. E., Tao, W. K., Ichoku, C., and Peters-Lidard, C. D.: Impact of radiation frequency, precipitation radiative forcing, and radiation column aggregation on convection-permitting West African monsoon simulations, Clim. Dynam., 55, 193–213, https://doi.org/10.1007/s00382-018-4187-2, 2018.
Mlawer, E. J., Taubman, S. J., Brown, P. D., Iacono, M. J., and Clough, S. A.: Radiative transfer for inhomogeneous atmospheres: RRTM, a validated correlated-k model for the longwave, J. Geophys. Res.-Atmos., 102, 16663–16682, https://doi.org/10.1029/97jd00237, 1997.
Molina, L. T., Madronich, S., Gaffney, J. S., Apel, E., de Foy, B., Fast, J., Ferrare, R., Herndon, S., Jimenez, J. L., Lamb, B., Osornio-Vargas, A. R., Russell, P., Schauer, J. J., Stevens, P. S., Volkamer, R., and Zavala, M.: An overview of the MILAGRO 2006 Campaign: Mexico City emissions and their transport and transformation, Atmos. Chem. Phys., 10, 8697–8760, https://doi.org/10.5194/acp-10-8697-2010, 2010.
National Centers for Environmental Prediction, National Weather Service, NOAA, and U.S. Department of Commerce: NCEP FNL Operational Model Global Tropospheric Analyses, continuing from July 1999, Research Data Archive at the National Center for Atmospheric Research, Computational and Information Systems Laboratory [data set], https://doi.org/10.5065/D6M043C6 (last access: 5 January 2023), 2000 (updated daily).
Ning, G., Wang, S., Yim, S. H. L., Li, J., Hu, Y., Shang, Z., Wang, J., and Wang, J.: Impact of low-pressure systems on winter heavy air pollution in the northwest Sichuan Basin, China, Atmos. Chem. Phys., 18, 13601–13615, https://doi.org/10.5194/acp-18-13601-2018, 2018.
Pautasso, M., Dehnen-Schmutz, K., Holdenrieder, O., Pietravalle, S., Salama, N., Jeger, M. J., Lange, E., and Hehl-Lange, S.: Plant health and global change – some implications for landscape management, Biol. Rev., 85, 729–755, https://doi.org/10.1111/j.1469-185X.2010.00123.x, 2010.
Qian, Y., Chakraborty, T. C., Li, J., Li, D., He, C., Sarangi, C., Chen, F., Yang, X., and Leung, L. R.: Urbanization Impact on Regional Climate and Extreme Weather: Current Understanding, Uncertainties, and Future Research Directions, Adv. Atmos. Sci., 819–860, https://doi.org/10.1007/s00376-021-1371-9, 2022.
Ryu, Y.-H., Baik, J.-J., Kwak, K.-H., Kim, S., and Moon, N.: Impacts of urban land-surface forcing on ozone air quality in the Seoul metropolitan area, Atmos. Chem. Phys., 13, 2177–2194, https://doi.org/10.5194/acp-13-2177-2013, 2013.
Schell, B., Ackermann, I. J., Hass, H., Binkowski, F. S., and Ebel, A.: Modeling the formation of secondary organic aerosol within a comprehensive air quality model system, J. Geophys. Res.-Atmos., 106, 28275–28293, https://doi.org/10.1029/2001jd000384, 2001.
Seto, K. C., Guneralp, B., and Hutyra, L. R.: Global forecasts of urban expansion to 2030 and direct impacts on biodiversity and carbon pools, P. Natl. Acad. Sci. USA, 109, 16083–16088, https://doi.org/10.1073/pnas.1211658109, 2012.
Shu, Z., Liu, Y., Zhao, T., Xia, J., Wang, C., Cao, L., Wang, H., Zhang, L., Zheng, Y., Shen, L., Luo, L., and Li, Y.: Elevated 3D structures of PM2.5 and impact of complex terrain-forcing circulations on heavy haze pollution over Sichuan Basin, China, Atmos. Chem. Phys., 21, 9253–9268, https://doi.org/10.5194/acp-21-9253-2021, 2021.
Song, Y., Wang, X., Maher, B. A., Li, F., Xu, C., Liu, X., Sun, X., and Zhang, Z.: The spatial-temporal characteristics and health impacts of ambient fine particulate matter in China, J. Clean Prod., 112, 1312–1318, https://doi.org/10.1016/j.jclepro.2015.05.006, 2015.
Stockwell, W. R., Middleton, P., Chang, J. S., and Tang, X. Y.: The 2nd Generation Regional Acid Deposition Model Chemical Mechanism for Regional Air-Quality Modeling, J. Geophys. Res.-Atmos., 95, 16343–16367, https://doi.org/10.1029/JD095iD10p16343, 1990.
Tan, Z., Lu, K., Jiang, M., Su, R., Dong, H., Zeng, L., Xie, S., Tan, Q., and Zhang, Y.: Exploring ozone pollution in Chengdu, southwestern China: A case study from radical chemistry to O3-VOC-NOX sensitivity, Sci. Total Environ., 636, 775–786, https://doi.org/10.1016/j.scitotenv.2018.04.286, 2018.
Tang, G. Q., Zhu, X. W., Xin, J. Y., Hu, B., Song, T., Sun, Y., Zhang, J. Q., Wang, L. L., Cheng, M. T., Chao, N., Kong, L. B., Li, X., and Wang, Y. S.: Modelling study of boundary-layer ozone over northern China – Part I: Ozone budget in summer, Atmos. Res., 187, 128–137, https://doi.org/10.1016/j.atmosres.2016.10.017, 2017.
Tewari, M., Chen, F., Wang, W., Dudhia, J., LeMone, M. A., Mitchell, K., Ek, M., Gayno, G., Wegiel, J., and Cuenca, R. H.: Implementation and verification of the unified Noah land surface model in the WRF model, in: 20th conference on weather analysis and forecasting/16th conference on numerical weather prediction, American Meteorological Society, 11–15 January 2004, Seattle, 2004.
United Nations: World Urbanization Prospects: The 2018 Revision, United Nations Department of Economic and Social Affairs, Population Division, New York, 2018.
Wang, H., Liu, Z., Zhang, Y., Yu, Z., and Chen, C.: Impact of different urban canopy models on air quality simulation in Chengdu, southwestern China, Atmos. Environ., 267, 118775, https://doi.org/10.1016/j.atmosenv.2021.118775, 2021.
Wang, H., Liu, Z., Wu, K., Qiu, J., Zhang, Y., Ye, B., and He, M.: Impact of Urbanization on Meteorology and Air Quality in Chengdu, a Basin City of Southwestern China, Frontiers in Ecology and Evolution, 10, 845801, https://doi.org/10.3389/fevo.2022.845801, 2022.
Wang, X., Chen, F., Wu, Z., Zhang, M., Tewari, M., Guenther, A., and Wiedinmyer, C.: Impacts of weather conditions modified by urban expansion on surface ozone: Comparison between the Pearl River Delta and Yangtze River Delta regions, Adv. Atmos. Sci., 26, 962–972, 2009.
Wang, Y., Yang, X., Wu, K., Mei, H., De Smedt, I., Wang, S., Fan, J., Lyu, S., and He, C.: Long-term trends of ozone and precursors from 2013 to 2020 in a megacity (Chengdu), China: Evidence of changing emissions and chemistry, Atmos. Res., 278 106309, https://doi.org/10.1016/j.atmosres.2022.106309, 2022.
Whiteman, C. D.: Mountain meteorology: fundamentals and applications [M], 1st edn., Oxford University Press, ISBN 10: 0195132718, ISBN 13: 9780195132717 2000.
Wu, K., Wang, Y., Qiao, Y., Liu, Y., Wang, S., Yang, X., Wang, H., Lu, Y., Zhang, X., and Lei, Y.: Drivers of 2013–2020 ozone trends in the Sichuan Basin, China: Impacts of meteorology and precursor emission changes, Environ. Pollut., 300, 118914, https://doi.org/10.1016/j.envpol.2022.118914, 2022.
Yang, X., Wu, K., Wang, H., Liu, Y., Gu, S., Lu, Y., Zhang, X., Hu, Y., Ou, Y., Wang, S., and Wang, Z.: Summertime ozone pollution in Sichuan Basin, China: Meteorological conditions, sources and process analysis, Atmos. Environ., 226, 117392, https://doi.org/10.1016/j.atmosenv.2020.117392, 2020.
Yin, P., Chen, R., Wang, L., Meng, X., Liu, C., Niu, Y., Lin, Z., Liu, Y., Liu, J., Qi, J., You, J., Zhou, M., and Kan, H.: Ambient Ozone Pollution and Daily Mortality: A Nationwide Study in 272 Chinese Cities, Environ. Health Perspect., 125, 117006, https://doi.org/10.1289/EHP1849, 2017.
Yu, M., Carmichael, G. R., Zhu, T., and Cheng, Y.: Sensitivity of predicted pollutant levels to urbanization in China, Atmos. Environ., 60, 544–554, https://doi.org/10.1016/j.atmosenv.2012.06.075, 2012.
Zardi, D. and Whiteman, C. D.: Diurnal Mountain Wind Systems, in: Mountain Weather Research and Forecasting: Recent Progress and Current Challenges, edited by: Chow, F. K., De Wekker, S. F. J., and Snyder, B. J., Springer Netherlands, Dordrecht, 35–119, Print ISBN 978-94-007-4097-6, https://doi.org/10.1007/978-94-007-4098-3_2, 2013.
Zhan, C. and Xie, M.: Land use and anthropogenic heat modulate ozone by meteorology: a perspective from the Yangtze River Delta region, Atmos. Chem. Phys., 22, 1351–1371, https://doi.org/10.5194/acp-22-1351-2022, 2022.
Zhan, C., Xie, M., Huang, C., Liu, J., Wang, T., Xu, M., Ma, C., Yu, J., Jiao, Y., Li, M., Li, S., Zhuang, B., Zhao, M., and Nie, D.: Ozone affected by a succession of four landfall typhoons in the Yangtze River Delta, China: major processes and health impacts, Atmos. Chem. Phys., 20, 13781–13799, https://doi.org/10.5194/acp-20-13781-2020, 2020.
Zhan, C., Xie, M., Liu, J., Wang, T., Xu, M., Chen, B., Li, S., Zhuang, B., and Li, M.: Surface Ozone in the Yangtze River Delta, China: A Synthesis of Basic Features, Meteorological Driving Factors, and Health Impacts, J. Geophys. Res.-Atmos., 126, e2020JD033600, https://doi.org/10.1029/2020jd033600, 2021.
Zhan, C.-C., Xie, M., Fang, D.-x., Wang, T.-j., Wu, Z., Lu, H., Li, M.-m., Chen, P.-l., Zhuang, B.-l., Li, S., Zhang, Z.-q., Gao, D., Ren, J.-y., and Zhao, M.: Synoptic weather patterns and their impacts on regional particle pollution in the city cluster of the Sichuan Basin, China, Atmos. Environ., 208, 34–47, https://doi.org/10.1016/j.atmosenv.2019.03.033, 2019.
Zheng, B., Tong, D., Li, M., Liu, F., Hong, C., Geng, G., Li, H., Li, X., Peng, L., Qi, J., Yan, L., Zhang, Y., Zhao, H., Zheng, Y., He, K., and Zhang, Q.: Trends in China's anthropogenic emissions since 2010 as the consequence of clean air actions, Atmos. Chem. Phys., 18, 14095–14111, https://doi.org/10.5194/acp-18-14095-2018, 2018 (data available at: http://meicmodel.org/, last access: 5 January 2023).
Zhu, K. G., Xie, M., Wang, T. J., Cai, J. X., Li, S. B., and Feng, W.: A modeling study on the effect of urban land surface forcing to regional meteorology and air quality over South China, Atmos. Environ., 152, 389–404, https://doi.org/10.1016/j.atmosenv.2016.12.053, 2017.