the Creative Commons Attribution 4.0 License.
the Creative Commons Attribution 4.0 License.
 | 13 Jul 2023
Does prognostic seeding along flight tracks produce the desired effects of cirrus cloud thinning?
David Neubauer
Diego Villanueva
Ulrike Lohmann
To date the climate intervention (CI) proposal of cirrus cloud thinning (CCT) was only assessed in general circulation models (GCMs) using a globally uniform distribution of artificial ice nucleating particles (INPs). In this study, we made the first attempt using the ECHAM–HAM (Hamburg Aerosol Module) GCM to simulate CCT using a fully prognostic cirrus seeding aerosol species. Seeding particles were assumed to be made of bismuth triiodide and were emitted into the atmosphere following aircraft emissions of black carbon (soot). This new approach drastically reduced the number concentration of seeding particles available as INPs in our cirrus ice nucleation sub-model compared to the globally uniform approach. As a result, we found that in order to achieve a significant signal we needed to reduce the assumed radius of emitted seeding particles by an order of magnitude to 0.01 µm and scale the mass emissions of seeding particles by at least a factor of 100 or 1000. This latter scaling factor led to a large net top-of-atmosphere (TOA) warming effect of 5.9 W m−2. This warming effect was a clear response to overseeding with a large concentration of seeding particles (>105 L−1 in the Northern Hemisphere) that was most evident in the tropics. Due to this undesired effect, in a second series of simulations we avoided seeding the tropics by restricting emissions to only the Northern Hemisphere (NH) during winter. We also found a small and insignificant effect, or overseeding, which for the extreme case was reduced compared to the global aircraft emission scenario (2.2 W m−2). Ice crystal radius anomalies were not what we expected, with the largest reduction in size found for the case with a mass scaling factor of 10 instead of the extreme, ×1000, scenario. We attributed this peculiar behavior to the differences in the competition between different seeding particle concentrations and background particles. Finally, we also found that seeding with such large concentrations increased the albedo effect of mixed-phase clouds in the NH due to less efficient cloud droplet consumption, consistent with previous findings from our model. Overall, however, based on this study it is recommended to pause further modeling efforts of CCT unless more observational-based evidence of aerosol–ice-cloud interactions indicates favorable conditions for producing the desired outcome of this CI proposal.
- Article
(10564 KB) - Full-text XML
- BibTeX
- EndNote


Cirrus cloud thinning (CCT) is a climate intervention (CI) proposal with the specific aim to enhance the outgoing flux of terrestrial, longwave (LW) radiation by counteracting the net warming effect of naturally occurring cirrus clouds (Mitchell and Finnegan, 2009; Muri et al., 2014). On average, cirrus clouds have a weak shortwave (SW) albedo effect, allowing most incoming solar radiation to be transmitted to the lower atmosphere and the surface. They are more effective in the longwave (LW) spectrum, absorbing a significant fraction of upwelling radiation from the surface and, due to their cold temperatures, re-emitting it with a considerably lower magnitude, thus creating a LW trapping effect from a top-of-atmosphere (TOA) perspective. Recent observational evidence introduces more nuance in understanding cirrus clouds' specific radiative properties, with in situ observations showing a large local cooling potential for liquid-origin cirrus formed in medium-updraft environments (Krämer et al., 2020). Overall, however, as cirrus clouds consist entirely of ice, their radiative properties are dependent on their dominant ice formation mechanism.
Ice in cirrus forms either by homogeneous or heterogeneous nucleation. The former occurs as the spontaneous and rapid freezing of small aqueous solution droplets (also referred to as liquid aerosols) under the appropriate thermodynamic conditions, which are favorable at temperatures below about 235 K and at high supersaturation with respect to ice (Koop et al., 2000; Ickes et al., 2015). These conditions are closely linked to the magnitude of vertical velocity, which determines the degree of adiabatic cooling in the atmosphere. A direct relationship was found between the updraft velocity and the number of ice particles formed by homogeneous nucleation (Jensen et al., 2016b). As this process is highly dependent on the appropriate conditions, as soon as they are met rapid ice formation can occur. This results in rapid water vapor consumption, which is sparse in the upper troposphere, and as a result limits ice crystal growth. Therefore, the ice crystal population following a spontaneous homogeneous event tends to consist of numerous small particles that produce cirrus with long cloud lifetimes (Krämer et al., 2016, 2020)
Heterogeneous nucleation occurs at lower temperatures and at lower-ice-supersaturated conditions than homogeneous nucleation due to the energetically favorable conditions on the surface of an ice nucleating particle (INP, Kanji et al., 2017). The number of ice crystals resulting from a heterogeneous nucleation event is typically limited by the availability of INPs, which are sparsely populated at typical cirrus temperatures (< 235 K). However, due to this limitation and the fact that nucleation on INPs can occur at low ice supersaturation, heterogeneously formed ice crystals can grow to larger sizes within cirrus because fewer of them compete for the available water vapor.
Both nucleation modes are not mutually exclusive within cirrus clouds, and understanding their complex competition for available water vapor is an area of ongoing research (Kärcher et al., 2022). However, it is understood that heterogeneous nucleation can suppress homogeneous nucleation under appropriate conditions (Lohmann and Kärcher, 2002; Kärcher and Lohmann, 2003; Lohmann et al., 2008; Mitchell and Finnegan, 2009; Kuebbeler et al., 2014; Jensen et al., 2016b, a; Kärcher et al., 2022). For example, a sufficient concentrations of INPs in an ice-supersaturated environment can lead to rapid ice formation and consumption of available water vapor, which counteracts the updraft-fueled ice-supersaturation increase needed for homogeneous nucleation. The effect of INPs on supersaturation was found to be less effective for larger updrafts (Kärcher and Lohmann, 2002; Kärcher et al., 2006; Jensen et al., 2016b). Overall, the ability of heterogeneous nucleation to suppress homogeneous nucleation impacts the ice crystal population, leading to fewer and larger ice crystals. This shift also impacts the radiative properties of cirrus clouds in what is known as the negative Twomey effect (Kärcher and Lohmann, 2003). With fewer and larger ice crystals present as a result of a shift from homogeneous to heterogeneous nucleation, the ice population within cirrus can more readily sediment and reduce cloud lifetimes and therefore their radiative effects (Lohmann et al., 2008). It was also found that as heterogeneous nucleation can occur at warmer temperatures, a shift towards this mode can also be realized as a cirrus cloud shift towards lower altitudes (i.e., warmer temperatures), which by itself results in weaker LW trapping (DeMott et al., 2010). Exploiting this difference between the two ice nucleation modes is the main idea behind CCT. By using efficient artificial INPs in regions where cirrus ice formation is dominated by homogeneous nucleation, the goal is to form ice heterogeneously. The resulting ice crystals then grow rapidly to remove water vapor, a potent greenhouse gas, and sediment out of the clouds, reducing their lifetimes and subsequently their radiative effect.
Numerous modeling studies over the last decade evaluated the efficacy of CCT as a CI strategy and concluded with contrasting results. This is primarily due to the lack of a consistent approach between different modeling groups to simulate the complexities of ice formation in cirrus clouds (Gasparini et al., 2020). Early CCT studies assumed that ice in cirrus formed only by homogeneous nucleation (Storelvmo et al., 2013) and did not include pre-existing ice originating from, for example, convective detrainment (Storelvmo et al., 2013). In this case CCT produced a large cooling effect of nearly −2.0 W m−2 by significantly reducing homogeneous nucleation within cirrus. When heterogeneous nucleation was introduced as an ice formation source, a similar CCT efficacy was found in the CAM5 general circulation model (GCM, Storelvmo and Herger, 2014; Storelvmo et al., 2014). However, Penner et al. (2015) used the same model and included a larger concentration of background INPs, pre-existing ice crystals, and a larger spectrum of updraft velocities and found no significant cooling in response to seeding. Similarly, Gasparini and Lohmann (2016) used the ECHAM–HAM (Hamburg Aerosol Module) GCM and included pre-existing ice particles in their in situ cirrus ice nucleation scheme. They also found no significant cooling response in their simulations that included homogeneous and heterogeneous nucleation as well as vapor deposition onto pre-existing ice crystals. Finally, Tully et al. (2022a) used a newer ice microphysics scheme that abandons heuristic ice size class transfers and also did not find that CCT has a significant cooling potential.
Naturally, based on the findings of previous studies, CCT appears as an infeasible CI strategy on a global scale (Tully et al., 2022a). This is in part due to the spatial availability of seeding particles. A majority of the studies described above used a globally uniform distribution of seeding particles. With highly efficient seeding particles, such an approach can lead to accumulated seeding particle impacts (i.e., overseeding) that can produce large warming effects (Storelvmo et al., 2013; Tully et al., 2022a). Only Storelvmo and Herger (2014) and Storelvmo et al. (2014) examined non-uniform seeding particle distributions based on seasonality. They varied their seeding particle concentrations zonally, with the maximum concentrations in the high latitudes of the winter hemisphere (north or south). In these high-latitude regions during winter, cirrus clouds exert only a positive LW warming effect and a negligible (or zero) SW cooling effect. In addition, polar regions contain fewer background aerosols, making them more suitable for homogeneous nucleation as the dominant cirrus formation mechanism (Rogers et al., 2001; DeMott et al., 2010; Hartmann et al., 2020; Li et al., 2022). Seeding in these regions during this period may optimize CCT efficacy, which was found by both Storelvmo and Herger (2014) and Storelvmo et al. (2014) with a similar CCT cooling effect of around −2.0 W m−2 for their non-uniform seeding simulations as in their globally uniform cases.
The zonally variable approach adopted by Storelvmo and Herger (2014) and Storelvmo et al. (2014) assumes a uniform distribution of seeding particle availability over specific latitude regions. Therefore, it still has the potential to overestimate the impact of seeding particles on cirrus ice nucleation competition. Mitchell and Finnegan (2009) proposed that if CCT were implemented in the real world, a potential delivery mechanism could be to use commercial aircraft, which would have a much less homogeneous spatial extent. Later, Mitchell et al. (2011) also proposed using uncrewed drones for seeding particle delivery, which could significantly enhance public safety but could be more expensive to operate. To date, only Gruber et al. (2019) examined CCT based on vertical seeding particle concentration profiles from aircraft emissions in a higher resolution study in a limited region over the Arctic, using the ICON-ART model (Zängl et al., 2015; Rieger et al., 2015). CCT was most effective in their simulations with no background INPs (i.e., no heterogeneous nucleation), equating to a cooling effect of nearly −7.0 W m−2 over their region. Their CCT simulations became less effective for increasing background INP concentrations. They also note that their simulations with targeted seeding (only seeding grid boxes if homogeneous nucleation would occur in that time step) showed smaller ice crystal number concentration (ICNC) reductions than seeding their entire domain. In these targeted simulations, seeding particles were effective at shutting off homogeneous nucleation in regions with suitable conditions for this ice formation process. When they seeded their entire domain, the seeding particles were injected in areas where the ice supersaturation was too low for homogeneous nucleation, thus inhibiting the development of the conditions required for this process downstream (Gruber et al., 2019).
Gruber et al. (2019) prescribed a homogeneous distribution of aerosols at each vertical level over their limited domain that were not removed by nucleation or sedimentation. This approach also has the potential to overestimate the impact of seeding on cirrus ice nucleation. Introducing prognostic seeding particles can address this issue as it provides the ability to trace their evolution in the atmosphere more accurately. In this study we introduce prognostic seeding particles and examine CCT efficacy based on a spatially heterogeneous distribution following aircraft emissions of black carbon (i.e., soot). We achieve this by extending the ECHAM aerosol module, HAM, by an additional prognostic aerosol species for seeding particles as explained in Sect. 2. We also allow aircraft soot to act as an INP for cirrus ice nucleation by using a new soot parameterization (Sect. 2). Our results on the sensitivity of CCT to regional aircraft emissions and large sources of background INPs (i.e., mineral dust particles) are presented in Sect. 3. Finally, we conclude this study with a summary of our key findings in Sect. 4.
2.1 Model description
We use the ECHAM6.3 atmospheric GCM (Stevens et al., 2013; Neubauer et al., 2014, 2019) coupled to the aerosol model HAM2.3 (Sect. 2.2, Stier et al., 2005; Zhang et al., 2012; Tegen et al., 2019). The model has a horizontal resolution of T63 (1.875∘ × 1.875∘) with 47 vertical levels (L47) up to 0.01 hPa. The model time step is 7.5 min. Monthly mean sea surface temperatures and sea ice coverage are prescribed.
Following Tully et al. (2022a), the default ECHAM two-moment ice microphysics scheme by Lohmann et al. (2007), (2M) was replaced in this study by the new Predicted Particle Properties (P3) ice microphysics scheme (Morrison and Milbrandt, 2015; Dietlicher et al., 2018, 2019). Like the 2M scheme, P3 predicts mass and number mixing ratios of various liquid and ice hydrometers but provides an updated representation of ice microphysics by abandoning unphysical conversion rates between ice hydrometeors of different size classes (Levkov et al., 1992). Instead, ice is included under a single prognostic category that is updated at every time step based on mass-to-size relationships Tully et al. (2022a). This is achieved through a sub-stepping approach for prognostically solving vertical diffusion of in-cloud and precipitating hydrometeors. The P3 scheme is coupled to the new cloud fraction approach by Dietlicher et al. (2019) (D19) that allows for partial grid box coverage of cirrus clouds above ice saturation (Dietlicher et al., 2019; Tully et al., 2022a).
Ice formation and initial growth in cirrus clouds are calculated in a separate cirrus ice nucleation competition sub-model (Kärcher et al., 2006; Kuebbeler et al., 2014; Muench and Lohmann, 2020; Tully et al., 2022a). The scheme follows a water vapor competition approach, whereby the available water vapor during the adiabatic ascent of a theoretical air parcel must compete between deposition onto pre-existing ice crystals, i.e., from convective detrainment or those transported from the mixed-phase regime, and new ice formation by heterogeneous or homogeneous nucleation. At the end of one cycle of the cirrus sub-model, the number of new ice crystals is passed back to the cloud microphysics (P3) scheme. Vertical ascent in our model is represented by the updraft, which is calculated as the sum of the grid mean value and a turbulent component represented by the turbulent kinetic energy (Brinkop and Roeckner, 1995). Note that we do not consider orographic effects on the vertical velocity in our model when using the P3 ice microphysics scheme as discussed in Tully et al. (2022a).
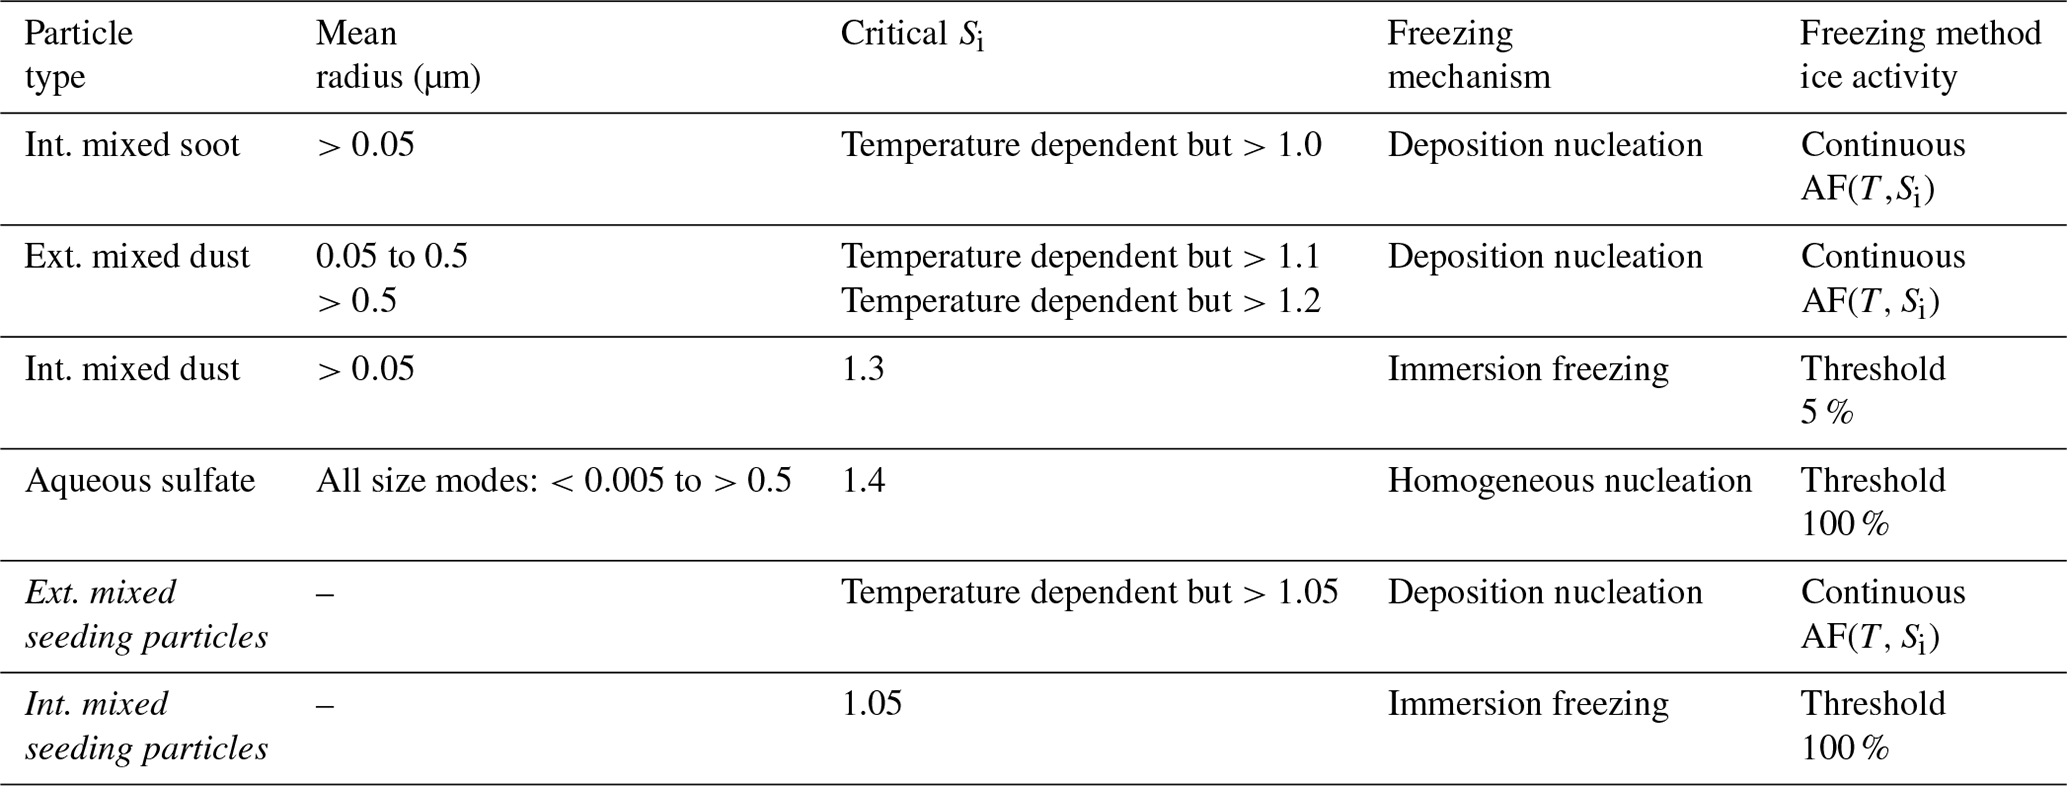
Table 1 was adapted from Tully et al. (2022a) and presents a summary of the aerosol species available for heterogeneous and homogeneous nucleation in our cirrus sub-model. Default processes (i.e., those in the base version of our model) include deposition nucleation onto soluble (internally mixed) soot particles, deposition nucleation onto insoluble (externally mixed) dust particles, immersion freezing of internally mixed dust particles, and homogeneous freezing of liquid sulfate particles. Muench and Lohmann (2020) distinguish between continuous and threshold freezing processes. Continuous processes include deposition nucleation on mineral dust particles based on the activated fraction parameterization by Möhler et al. (2006) and on soot particles based on the cloud-aging parameterization by Lohmann et al. (2020). Freshly emitted externally mixed soot particles must undergo compaction and be coated by at least a mono-layer of sulfate in order to act as INPs in our model (Mahrt et al., 2018, 2020). For the threshold freezing processes, we assume that all particles associated with that mode nucleate ice when the appropriate ice saturation ratio (Si) conditions are met. However, as deduced from laboratory measurements, only 5 % of the available internally mixed mineral dust particles can form ice through immersion freezing (Gasparini and Lohmann, 2016).
Seeding particles made of bismuth triiodide (BiI3) with a density of 5778 kg m−3, following Mitchell and Finnegan (2009), are included as an additional heterogeneous nucleation mode in our cirrus sub-model. The number of seeding particles available for ice nucleation in the cirrus scheme no longer follows a globally uniform approach and instead follows aircraft emissions to emulate a more realistic CI scenario. As this is closely linked to their implementation as a prognostic aerosol species, this is described in more detail in Sect. 2.2. However, as we include internally and externally mixed seeding particles, we assume different ice nucleation behavior for these two particle types (Table 1). For simplicity we assume BiI3 has the same freezing properties of internally and externally mixed mineral dust particles in our model, which follow deposition nucleation and immersion freezing processes, respectively. Following Gasparini and Lohmann (2016) and Tully et al. (2022a), the seeding particle in our model can nucleate ice starting at a much lower critical Si threshold (Si,seed) of 1.05 (Table 1). For externally mixed seeding particles, we follow the active surface site density approach by Ullrich et al. (2017) based on Aerosol Interaction and Dynamics in the Atmosphere (AIDA) cloud chamber experiments.
Table 1Adapted from Tully et al. (2022a). A summary of the different aerosol species available for ice nucleation within the in situ cirrus sub-model. We also present information on the average radius of the particles, the critical ice saturation ratio above which these particles will nucleate ice, the freezing mechanism by which nucleation will occur, and the freezing method within the context of the cirrus scheme following Muench and Lohmann (2020). Under each freezing method we also include the ice activity as a means to define the number of particles in each category that can nucleate ice. Continuous processes are based on the activated fraction (AF) as a function of temperature (T) and Si, whereas for threshold processes all of the available particles (100 %) can nucleate ice unless specified otherwise. “Int. mixed” stands for internally mixed (soluble) aerosol species, and “Ext. mixed” stands for externally mixed (insoluble) species. Particle types (i.e., aerosol species) denoted in italics are included as additional processes relative to the base version of our model.
2.2 Prognostic seeding particles
The atmospheric circulation model, ECHAM, is coupled to the two-moment Hamburg Aerosol Module (HAM) for simulating aerosol microphysics and chemistry (Stier et al., 2005; Zhang et al., 2012; Tegen et al., 2019). We use the latest version, HAM2.3, based on Zhang et al. (2012), with updates detailed by Tegen et al. (2019). The development of HAM allows full coupling of aerosols to the cloud microphysics scheme in order to prognostically track cloud droplet and ice crystal number concentrations (Stier et al., 2005; Lohmann et al., 2007).
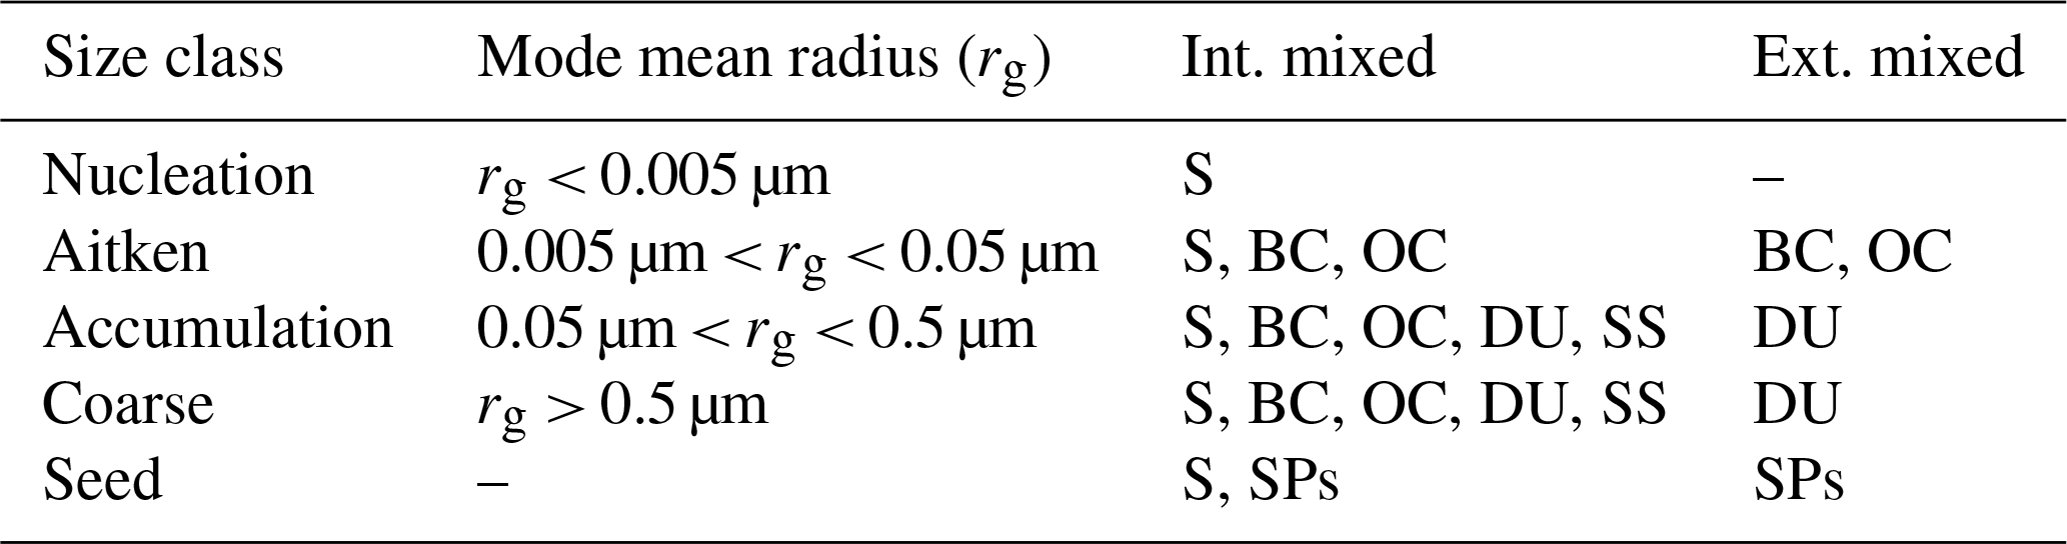
In the base version of HAM, the mass mixing ratios and the number concentrations of the aerosol species, sulfate (S), black carbon (BC), organic carbon (OC), sea salt (SS), and mineral dust (DU), are provided. Aerosol size distributions are described by the seven-mode (M7) aerosol model by Vignati et al. (2004). The scheme represents the population of aerosols following seven log-normal particle size distributions (PSDs) characterized by the number geometric mean radius (rg) of the particles within the mode and their solubility. Table 2 describes the properties of the M7 modes. We extended HAM M7 by two extra modes exclusively for internally and externally mixed seeding particles (SPs) to form HAM M9. The implementation of the prognostic cirrus SPs closely follows the methodology by Gilgen et al. (2018) for fire charcoal emissions.
Table 2Summary of the nine log-normal modes included in HAM M9 organized by the size class, the mode mean radius (rg), and solubility (insoluble or soluble). The aerosol species are denoted as sulfate (S), black carbon (BC), organic carbon (OC), mineral dust (DU), sea salt (SS), and seeding particles (SPs). “Int. mixed” stands for internally mixed (soluble) aerosol species, and “Ext. mixed” stands for externally mixed (insoluble) species. Note the seeding particle mode mean radius is not defined here as we test various emission radii in our model.
Processes in HAM M9 include aerosol emissions, aerosol microphysics, and removal processes. As these processes are described in detail by Vignati et al. (2004), Stier et al. (2005), Zhang et al. (2012), and Tegen et al. (2019), we only provide summaries in this section that are specific to our model setup and to the two extra SP modes.
Aerosol emissions are consistent with the sector-based specification described by Tegen et al. (2019) for anthropogenic (e.g., industry, agriculture, aviation), biogenic, and fire-based sources. Anthropogenic emissions in our model use the latest Community Emissions Data System (CEDS) release for emissions for the year 2008 based on Hoesly et al. (2018) with updates provided by O'Rourke et al. (2021), namely for historic BC and OC emissions. Biogenic emissions of OC (i.e., secondary organic aerosols) and dimethyl sulfide (DMS) follow AeroCom-II monthly mean emissions for the year 2000 (Dentener et al., 2006). Biomass burning (fire) emissions are based on CMIP6 methodology for the year 2008 (van Marle et al., 2017). All aerosol emissions are simulated as mass emissions in our model. Number concentrations of aerosols are obtained by following a mapping procedure that is applied to the mass emissions. The resultant number concentration is determined by the assumed radius of the emitted particle and the density of the substance, which for SPs by default in our model is 0.5 µm and 5778 kg m−3 (for BiI3), respectively. By changing the assumed emitted radius of a particle, one can alter the number concentration of an aerosol species in an inverse relationship as it changes how mass is distributed across the available particles (i.e., larger emitted particles obtain lower number concentrations as individual particles can contain more mass than smaller particles). We also apply scaling factors to the mass emissions that have a direct effect on the particle number concentration.
We assume that SPs originate solely from aviation sources to emulate the proposed delivery mechanism over wide areas (Mitchell and Finnegan, 2009). Their emissions follow the same spatial and temporal distribution as BC CEDS aircraft emissions. Figure 1 presents the annual vertically integrated spatial distribution of seeding particle emissions as an example. To avoid seeding particle emissions in the mixed-phase or liquid regimes, or near the surface, we applied an online temperature filter to exclude seeding particle mass outside of the cirrus regime (T> 238 K). This approach of following flight tracks in cirrus-only conditions is a first step towards addressing the overseeding issue found by previous CCT studies that used a globally uniform seeding particle distribution (Storelvmo et al., 2013; Gasparini and Lohmann, 2016; Tully et al., 2022a). Primary emissions of SPs are assigned to the externally mixed seed mode (Table 2).
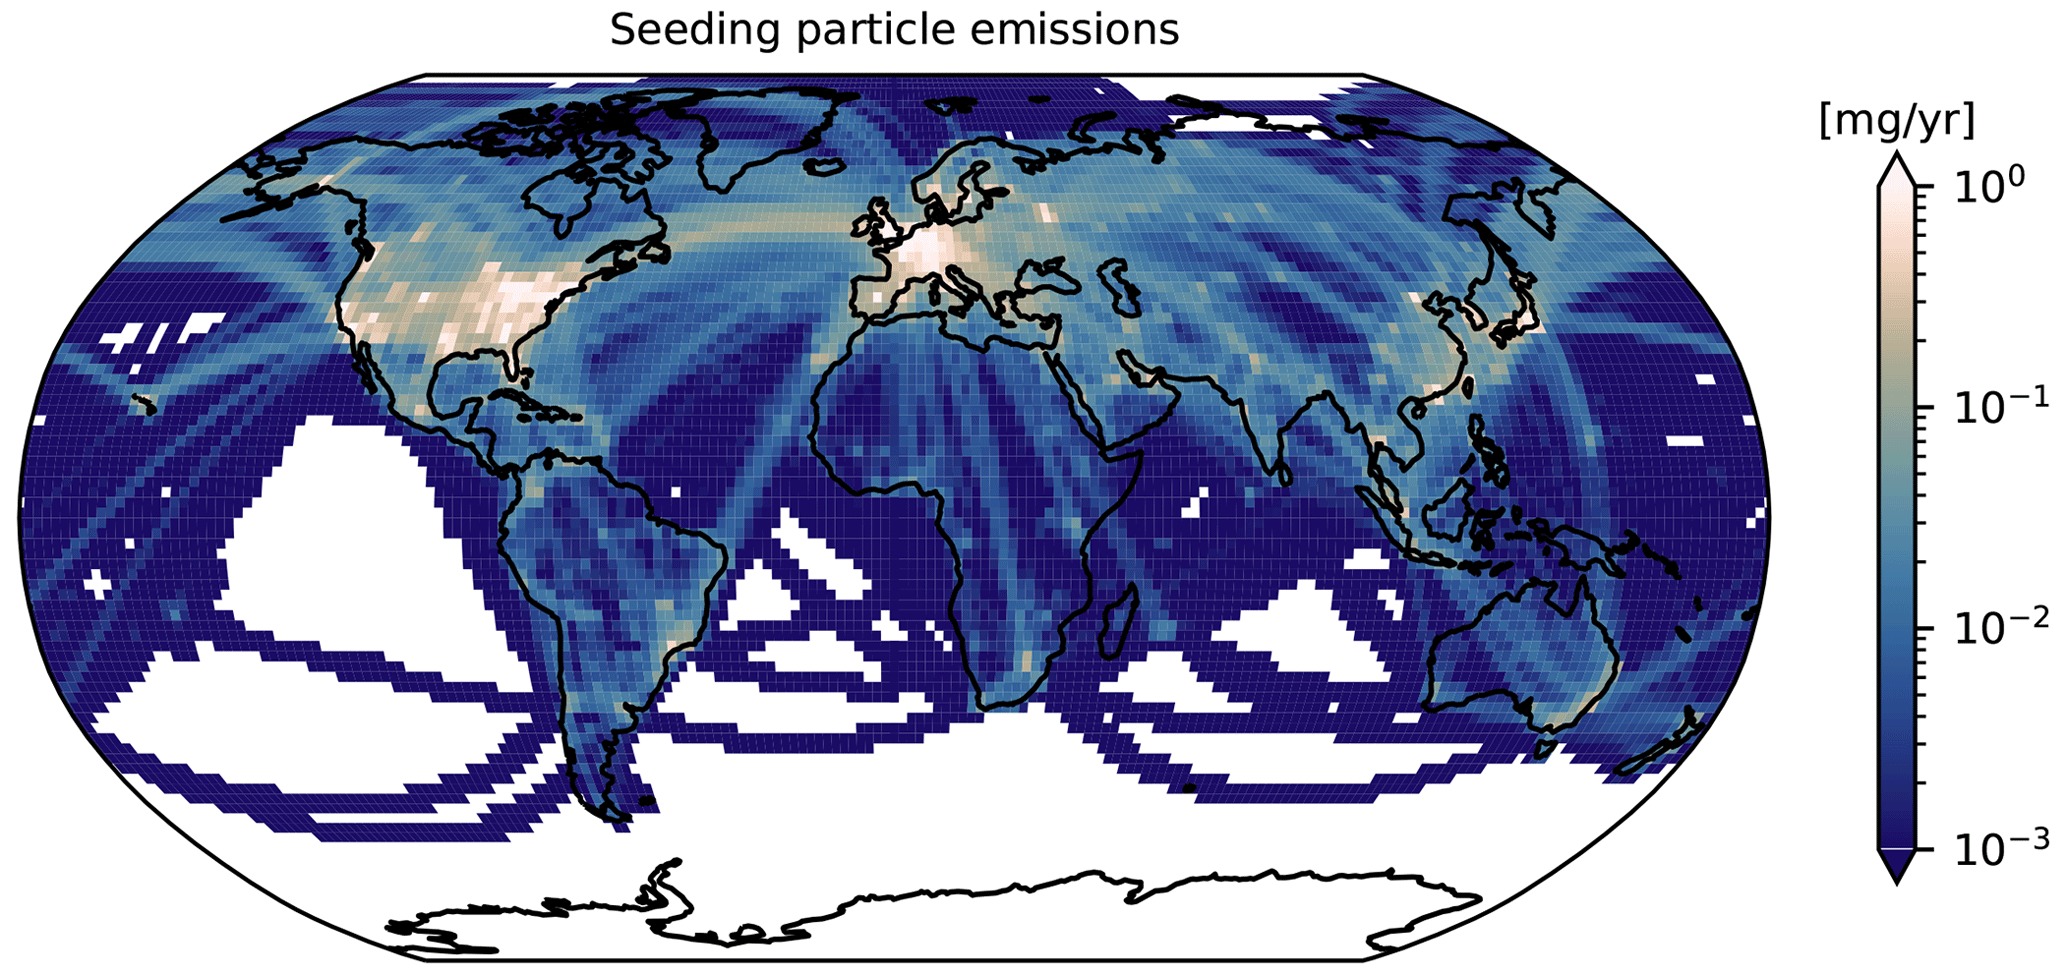
Figure 1Five-year annual mean global distribution of seeding particle mass emissions (in mg yr−1) along aircraft flight routes. The mass emissions of seeding particles match those of aircraft emissions of black carbon in this case.
SPs emitted alongside aircraft exhaust will be in environments surrounded by a mixture of various aerosols, including but not limited to sulfuric acid (H2SO4) and BC (Kärcher et al., 2000; Kärcher, 2018; Durdina et al., 2019; Voigt et al., 2021). Therefore it is likely that freshly emitted SPs will interact with other aerosol particles, similar to the cloud aging of aircraft soot (i.e., BC) by sulfate found by Mahrt et al. (2018, 2020). We exclude interactions between SPs and BC in our model for this study for simplicity; however, we note that this provides an opportunity for future work into the interactions between a realistic seeding particle material and aircraft soot, as well as its effect on the ice nucleation ability of both particles. We restrict interactions with SPs to only sulfurous species, namely sulfate and H2SO4 gas.
Aerosol interactions are handled by the aerosol microphysics scheme, M9 based on M7 (Vignati et al., 2004; Tegen et al., 2019), and includes H2SO4–H2O droplet nucleation (Kazil et al., 2010), coagulation (Schutgens and Stier, 2014), H2SO4 condensation, and aerosol hygroscopic growth. These processes act to redistribute aerosol mass and number between the different modes (Table 2). For SPs in our model, redistribution is restricted to unidirectional transfers between only the externally and internally mixed seed mode, which can occur either by H2SO4 condensation or coagulation with nucleation mode sulfate particles (Table 2). H2SO4 condensation occurs onto all modes in M9, with accommodation coefficients of 1.0 for internally mixed modes and of 0.3 for externally mixed modes (Vignati et al., 2004; Schutgens and Stier, 2014). Coagulation can occur as an intra- or inter-modal process (Vignati et al., 2004; Schutgens and Stier, 2014). For consistency with Vignati et al. (2004) for the externally mixed accumulation and coarse modes, we also exclude intra-modal coagulation of externally mixed SPs. Instead, coagulation can occur between internally mixed nucleation mode sulfate particles and externally mixed SPs. This results in a mass and number transfer to the internally mixed SP mode. Coagulation with internally mixed nucleation mode sulfate particles and internally mixed SPs simply adds mass to the SP mode particles.
Removal processes include sedimentation and dry and wet deposition. Sedimentation of aerosol particles occurs on all model levels and is based on Stokes velocity, which accounts for particle size and density (Seinfeld and Pandis, 1998; Stier et al., 2005; Zhang et al., 2012; Tegen et al., 2019). Only particles in the larger size modes including accumulation, coarse, and seed mode can sediment in our model, consistent with HAM2.3 as presented by Tegen et al. (2019). Dry deposition is based on a deposition flux, considering the surface type, and is calculated from the aerosol concentration, air density, and deposition velocity (Zhang et al., 2012; Tegen et al., 2019). Finally, wet deposition occurs as a scavenging process either via cloud droplet activation or ice crystal nucleation or by hydrometeor collection (impaction). In-cloud scavenging follows the scheme by Croft et al. (2010) that differentiates processes between convective and stratiform clouds, as well as between liquid, mixed-phase, and cirrus clouds (Tegen et al., 2019). Below-cloud scavenging is based on the size-dependent scheme by Croft et al. (2009), where aerosol particles are collected by precipitating hydrometeors (i.e., rain or snow). The scheme by Croft et al. (2010) uses a size-dependent approach that calculates the fraction of the total ice crystal number concentration (ICNC) out of each internally mixed size mode (excluding nucleation), assuming the largest mode (coarse in the default M7 scheme) nucleated ice crystals first. The integration continues through subsequently smaller modes until the fraction of scavenged aerosols is less than unity. The original version of this approach assumed ice crystals originated solely from homogeneous nucleation in cirrus. In the cirrus regime (T< 238 K) we know this assumption no longer holds (Cziczo et al., 2013; Krämer et al., 2016; Gasparini et al., 2018; Froyd et al., 2022). In addition, with updates made to our cirrus sub-model by Muench and Lohmann (2020) and Tully et al. (2022a), plus the availability of a new heterogeneous ice nucleation parameterization (e.g., aircraft soot by Lohmann et al., 2020), using the default nucleation scavenging scheme by Croft et al. (2010) likely underpredicts the amount of aerosol removed via wet deposition.
We updated the in-cloud nucleation scavenging scheme to account for the different sources of ice crystals in cirrus and mixed-phase clouds, including those from homogeneous as well as heterogeneous nucleation. Our new approach for calculating nucleation scavenging accounts for all aerosol size modes (internally and externally mixed) that are used to nucleate ice. The fractions used to determine the number of scavenged aerosols in each mode are no longer based on the total ICNC but rather on the ICNC in each mode that can nucleate ice. To this end, we use the ice number tracers implemented by Dietlicher et al. (2019) and Tully et al. (2022a). We also added two additional tracers to distinguish between ice originating from dust deposition nucleation and dust immersion freezing in the cirrus sub-model. For simplicity in the remainder of this study, we refer to these tracers as ice sources and denote them as cirrus ice sources where applicable.
2.3 Experimental setup
We simulated cirrus seeding using the HAM-M9 model configuration as described above and follow a similar methodology as Tully et al. (2022a). Instead of explicitly defining seeding particle concentrations, using a globally uniform distribution both spatially and temporally, we can alter the number concentration of seeding particles in two ways: (1) defining different sizes for the seeding particle emission radius and (2) scaling the mass emission flux of seeding particles from aircraft. Both of these methods influence the number concentration mapping procedure that is applied to the mass emissions of seeding particles in our model (as detailed previously, Sect. 2.2). In a series of initial tests, we simulated several different seeding particle emission radii: 0.01, 0.02, 0.025, 0.05, 0.1, 0.25, 0.5, 1, 5, 50, and 500 µm. Compared to the globally uniform approach by Gasparini and Lohmann (2016) and Tully et al. (2022a), using global aircraft emissions drastically reduces the number of seeding particles available for ice nucleation in cirrus (Appendix A). As seeding particle number concentrations are indirectly related to the emission radius, the largest number concentration of seeding particles (<100 L−1) corresponded to an emission radius of 0.01 µm. This led to a small and insignificant net TOA anomaly (0.001 ± 0.91 W m−2) as well as small ICNC anomalies relative to the reference case with no seeding particle emissions. For all other simulations with increasing seeding particle emission radii, we found similarly insignificant signals.
For that reason, the results presented in this study use a combination of the two methods to alter seeding particle number concentration. We tested three different seeding particle emission radii (0.01, 0.1, and 1 µm) and also applied a mass emission scaling factor of 1 (i.e the mass emissions were identical to those of aircraft BC), 10, 100, and 1000 for a total of 12 simulations. Figure 2 presents the zonal mean of the seeding particle concentrations (in L−1) that are used as an input variable to our cirrus sub-model for the three different radii and four different mass scaling factors we tested. As noted above, there is an inverse relationship between the size of the emitted particle and their number concentration. The concentration of seeding particles with an emission radius of 1 µm never exceed about 1 L−1. Meanwhile, we find the largest concentration (>105 L−1) for the case with an emission radius of 0.01 µm and a mass scaling by a factor of 1000. Seeding particle concentrations are higher in the Northern Hemisphere (NH) as this coincides with the greatest aircraft emissions (i.e., the heaviest air traffic corridors).
Including such small seeding particles in our model (0.01 µm) is justified based on previous work on the ice nucleation ability of silver iodide (AgI). Xue et al. (2013) formulated a parameterization for glaciogenic cloud seeding with AgI in the Weather Research and Forecasting (WRF) model, using a mean particle diameter of 0.04 µm. They reported that the model could reasonably produce the physical processes of cloud seeding. Geresdi et al. (2020) also investigated cloud seeding in the WRF model with slightly larger AgI with a mean diameter of 0.05 µm and reported that the model also reasonably reproduced the microphysical properties of real clouds. Marcolli et al. (2016) reviewed lab-based experiments of ice nucleation and showed that AgI particles of 20 nm had an increasing ice nucleation efficiency towards cirrus temperatures (238 K). Finally, Kanji et al. (2017) presented new evidence of the ice nucleation ability of small particles such as pollen and fungal spores, which challenges arguments that only large particles are suitable INPs.
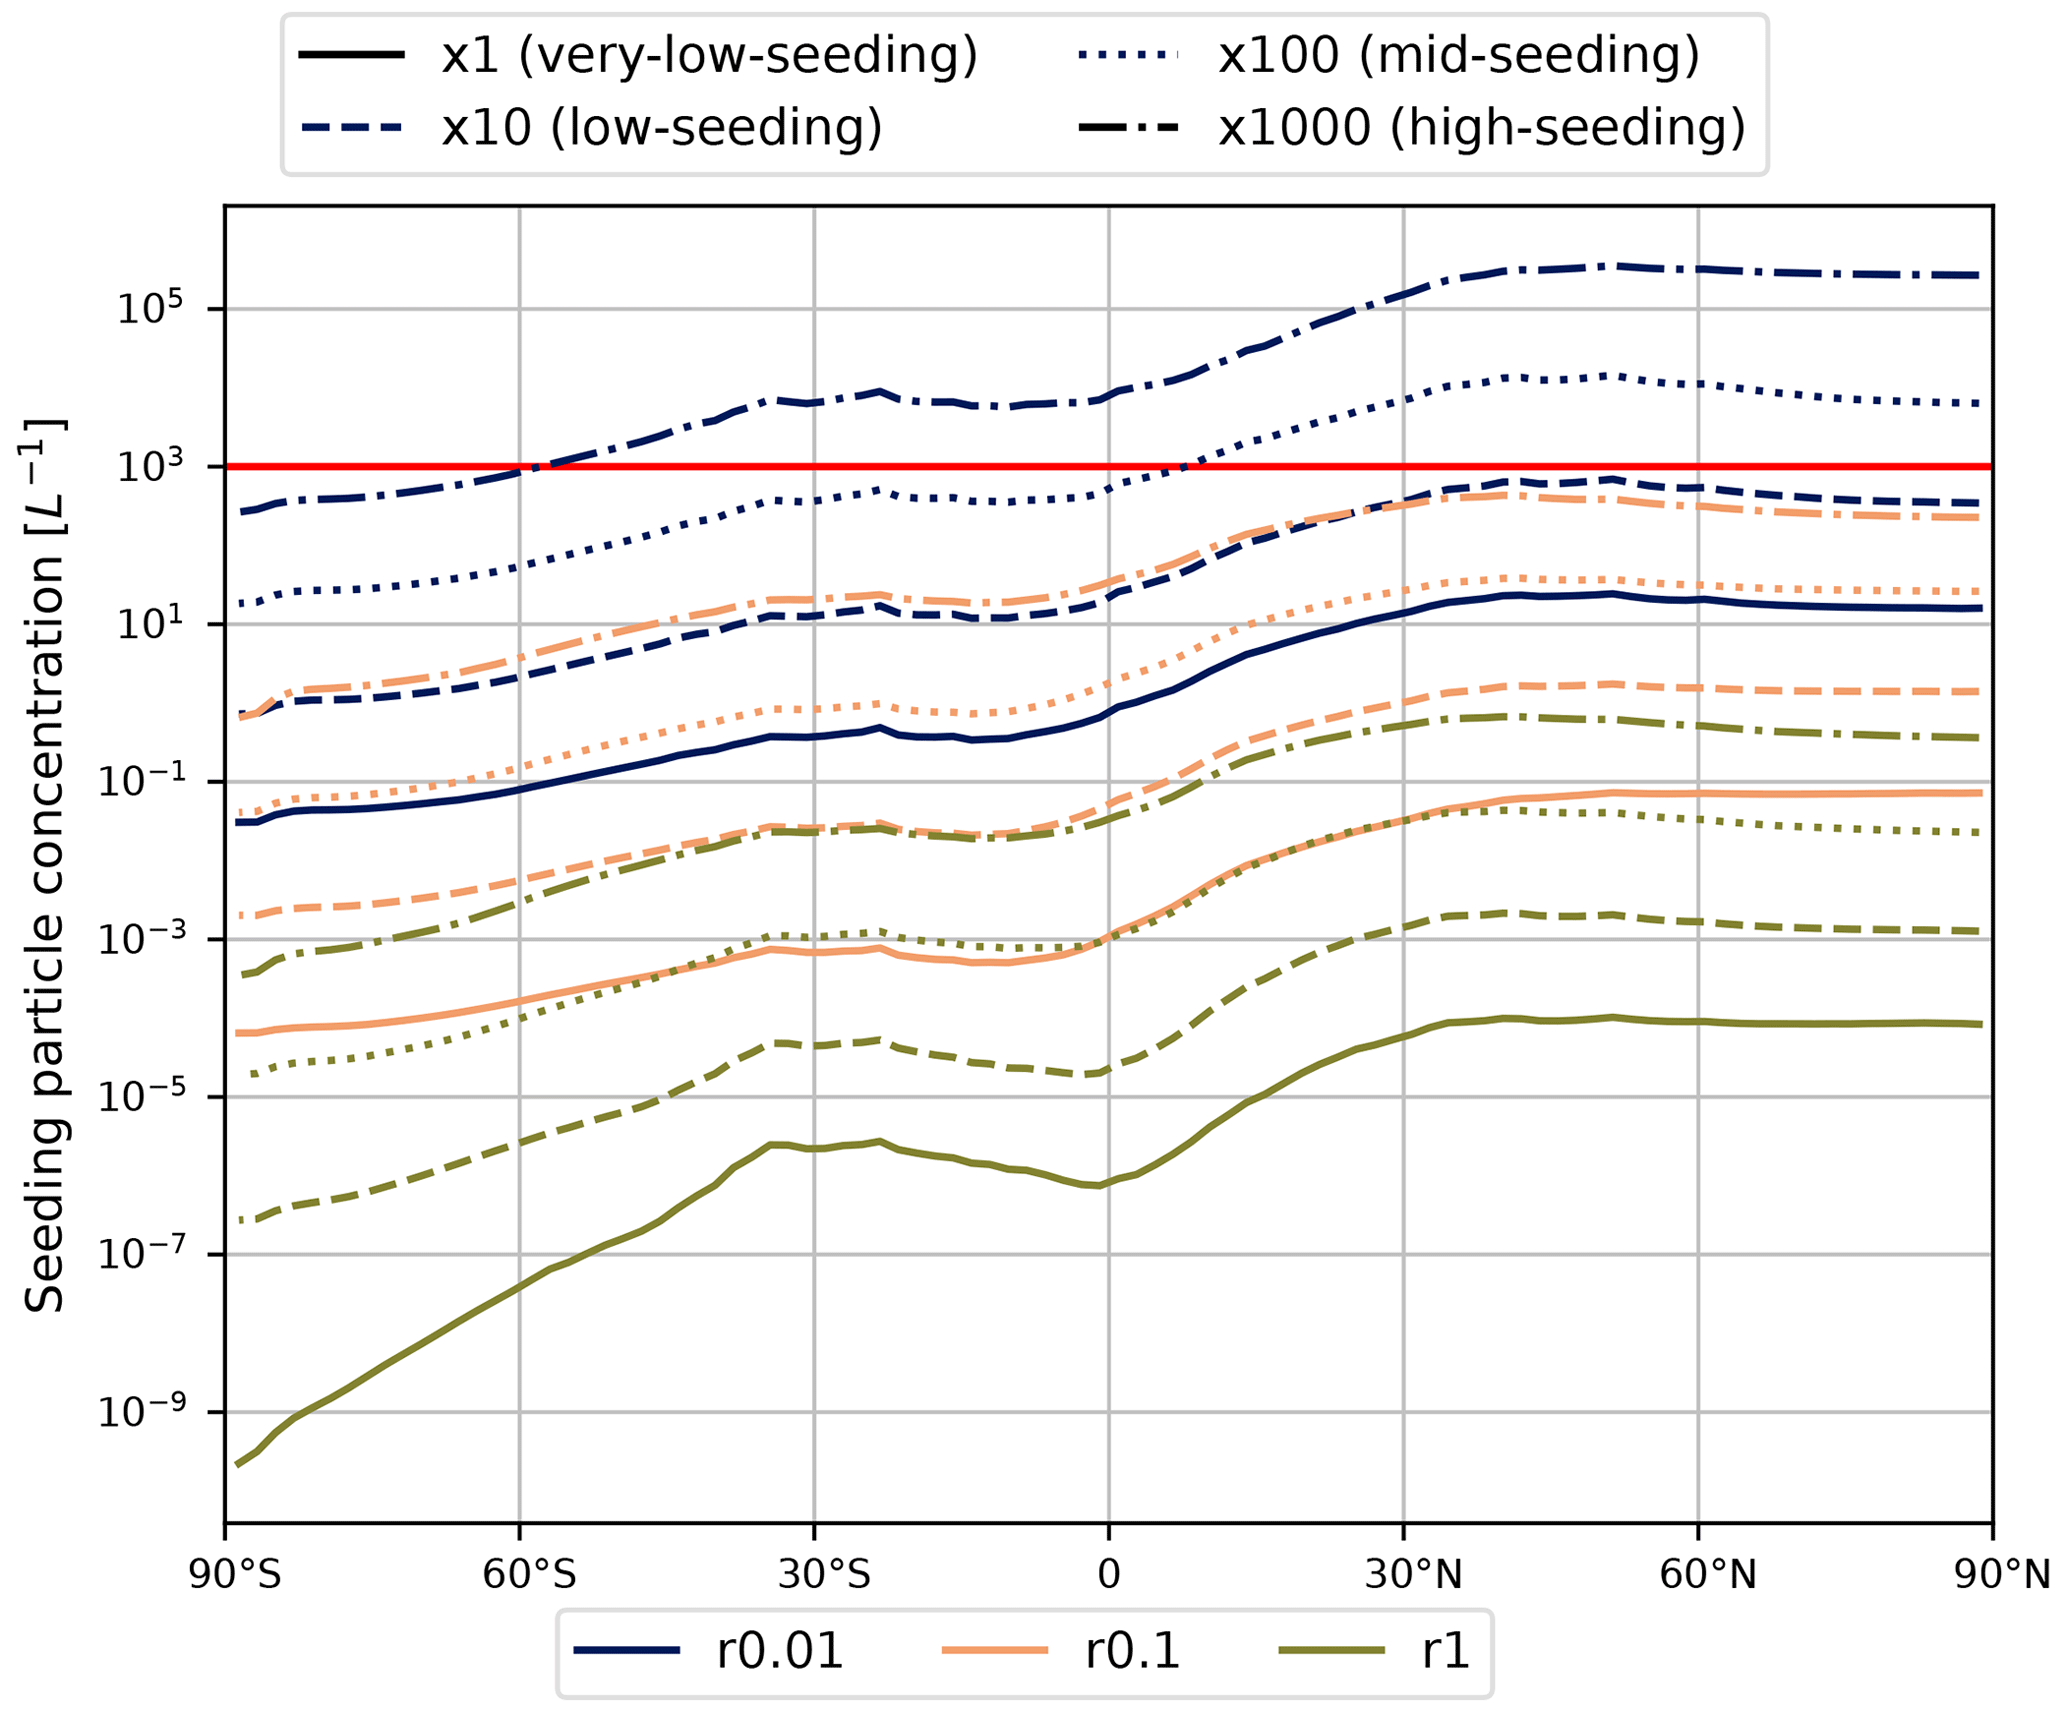
Figure 2Five-year zonal mean seeding particle concentrations (in L−1). Each color represents one of the three emission radii: 0.01 µm (dark blue), 0.1 µm (orange), and 1 µm (olive green). Emission mass scaling factors are represented by the line style – ×1 (solid), ×10 (dashed), ×100 (dotted), and ×1000 (dot-dashed) – and include the qualitative descriptions included in the text. The red line represents the minimum seeding particle concentration below which we find an insignificant TOA radiative anomaly. This also corresponds to our overseeding threshold.
Each simulation was conducted for 5 years between 2006 and 2010, including 3 months of spin-up from 1 October 2005. We follow Tegen et al. (2019) and run nudged simulations that relax modeled prognostic variables, surface pressure, vorticity, and divergence (Jeuken et al., 1996) toward ERA-Interim reanalysis data (Berrisford et al., 2011; Dee et al., 2011). Sea surface temperatures and sea ice coverage are based on observed monthly mean data by Atmospheric Model Intercomparison Project (AMIP) simulations (Hurrell et al., 2008). Aerosol emissions are from the year 2008, following the methodology as described in Sect. 2.2.
Finally, we determine significance using the false discovery rate method by Wilks (2016) that accounts for high spatial correlation between neighboring grid points in independent t tests. Following Tully et al. (2022a) we calculate a 5 % significance.
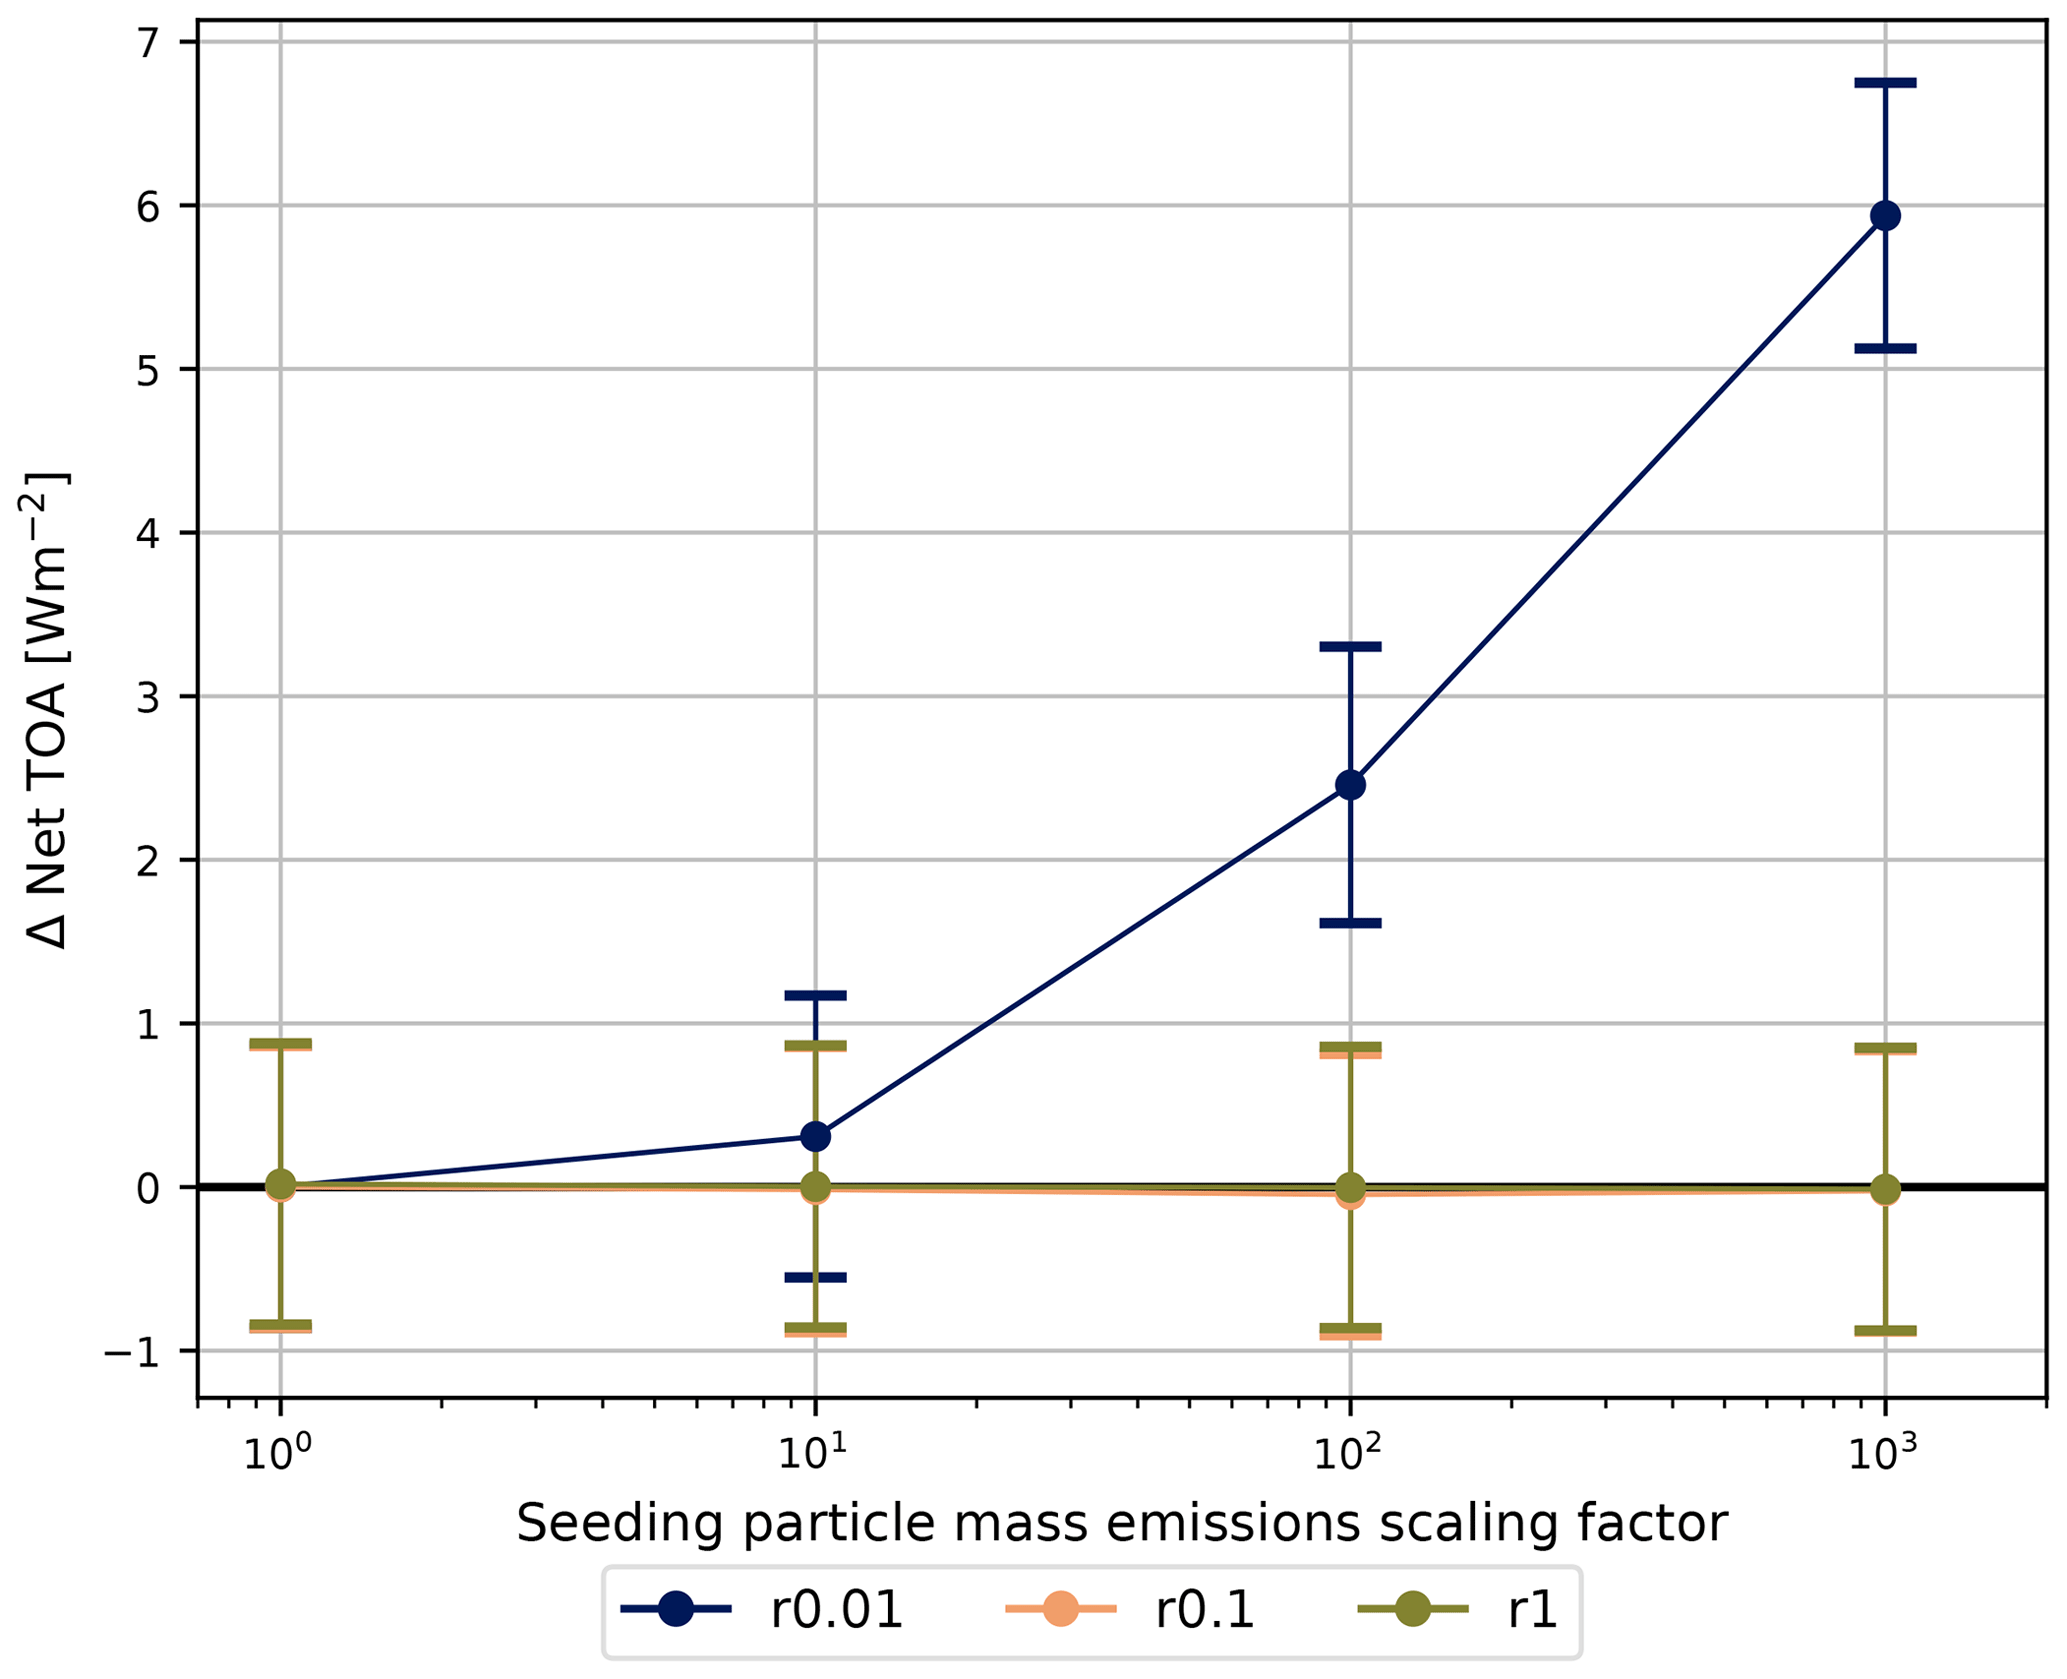
Figure 3Five-year annual global mean net TOA radiative anomalies in watts per square meter (W m−2) for each seeding particle emission mass scaling factor for the scenarios with global aircraft emissions. Each color represents one of the three emission radii: 0.01 µm (dark blue), 0.1 µm (orange), and 1 µm (olive green). The error bars indicate the 95 % confidence interval around the 5-year mean.
3.1 Global aircraft seeding
Figure 3 and Table 3 present the 5-year annual global mean net top-of-atmosphere (TOA) and net cloud radiative effect (CRE) anomalies for each seeding emission radius and mass scaling factor that we tested. The TOA anomaly refers to the total all-sky (Ramanathan, 1987; Wild et al., 2019) radiative effect (i.e., from clouds, aerosols, surface albedo, and changes in atmospheric gases like water vapor), whereas the CRE anomaly refers to the radiative effect of clouds only. The TOA and CRE anomalies scale with the number concentration of seeding particles (Fig. 3 and Table 3). We find the largest positive net TOA anomaly when seeding with the largest average seeding particle number concentration (>105 L−1, Fig. 2) that is associated with the case with a mean emission radius of 0.01 µm (r0.01) and a mass scaling factor of 1000 (high seeding). The large TOA anomalies are driven by a large increase in the LW cloud radiative effect (CRE) by 10.1 W m−2 (Table 3), indicating a significant change in cirrus cloud properties such as cloud fraction and ICNC (Fig. 4). This is partially offset by an increase in the magnitude of the SW CRE that slightly exceeds the total TOA SW anomaly (Table 3). To some extent this could be linked to optically thicker cirrus (Krämer et al., 2020) or optically thicker lower-lying mixed-phase or liquid clouds (Twomey, 1959, 1977; Albrecht, 1989), which is discussed further in Sect. 3.3. This latter point is the opposite of what Gruber et al. (2019) found for mixed-phase clouds, which was a reduction in cloud fraction through enhanced riming of cloud droplets onto the ice crystals that formed on injected seeding particles. The positive TOA anomaly is reduced by over 50 % when reducing the mass scaling to 100 (r0.01 mid-seeding) but is still large and significant. It is also driven by large positive LW CRE anomalies. For all other seeding cases, the net TOA anomaly is uncertain on a 95 % confidence level. Comparing Table 3 to Fig. 2, it appears that in our model in order obtain a significant radiative signal in response to seeding, the average number concentration must exceed 1000 L−1, which occurs for only two cases: r0.01 mid- and high seeding. The response we find is only positive (i.e., warming) when applying seeding particles using global aircraft emissions.
Table 3Five-year global mean net TOA and net CRE radiative balance anomalies in watts per square meter (W m−2), as well as their shortwave (SW) and longwave (LW) components for each of the seeding particle emission radii tested for the global aircraft seeding scenario. Each quantity includes the 95 % confidence interval equating to 2 standard deviations of the mean values of the 5-year data sets. Values in bold denote those that are statistically distinct from zero based on the 95 % confidence level.
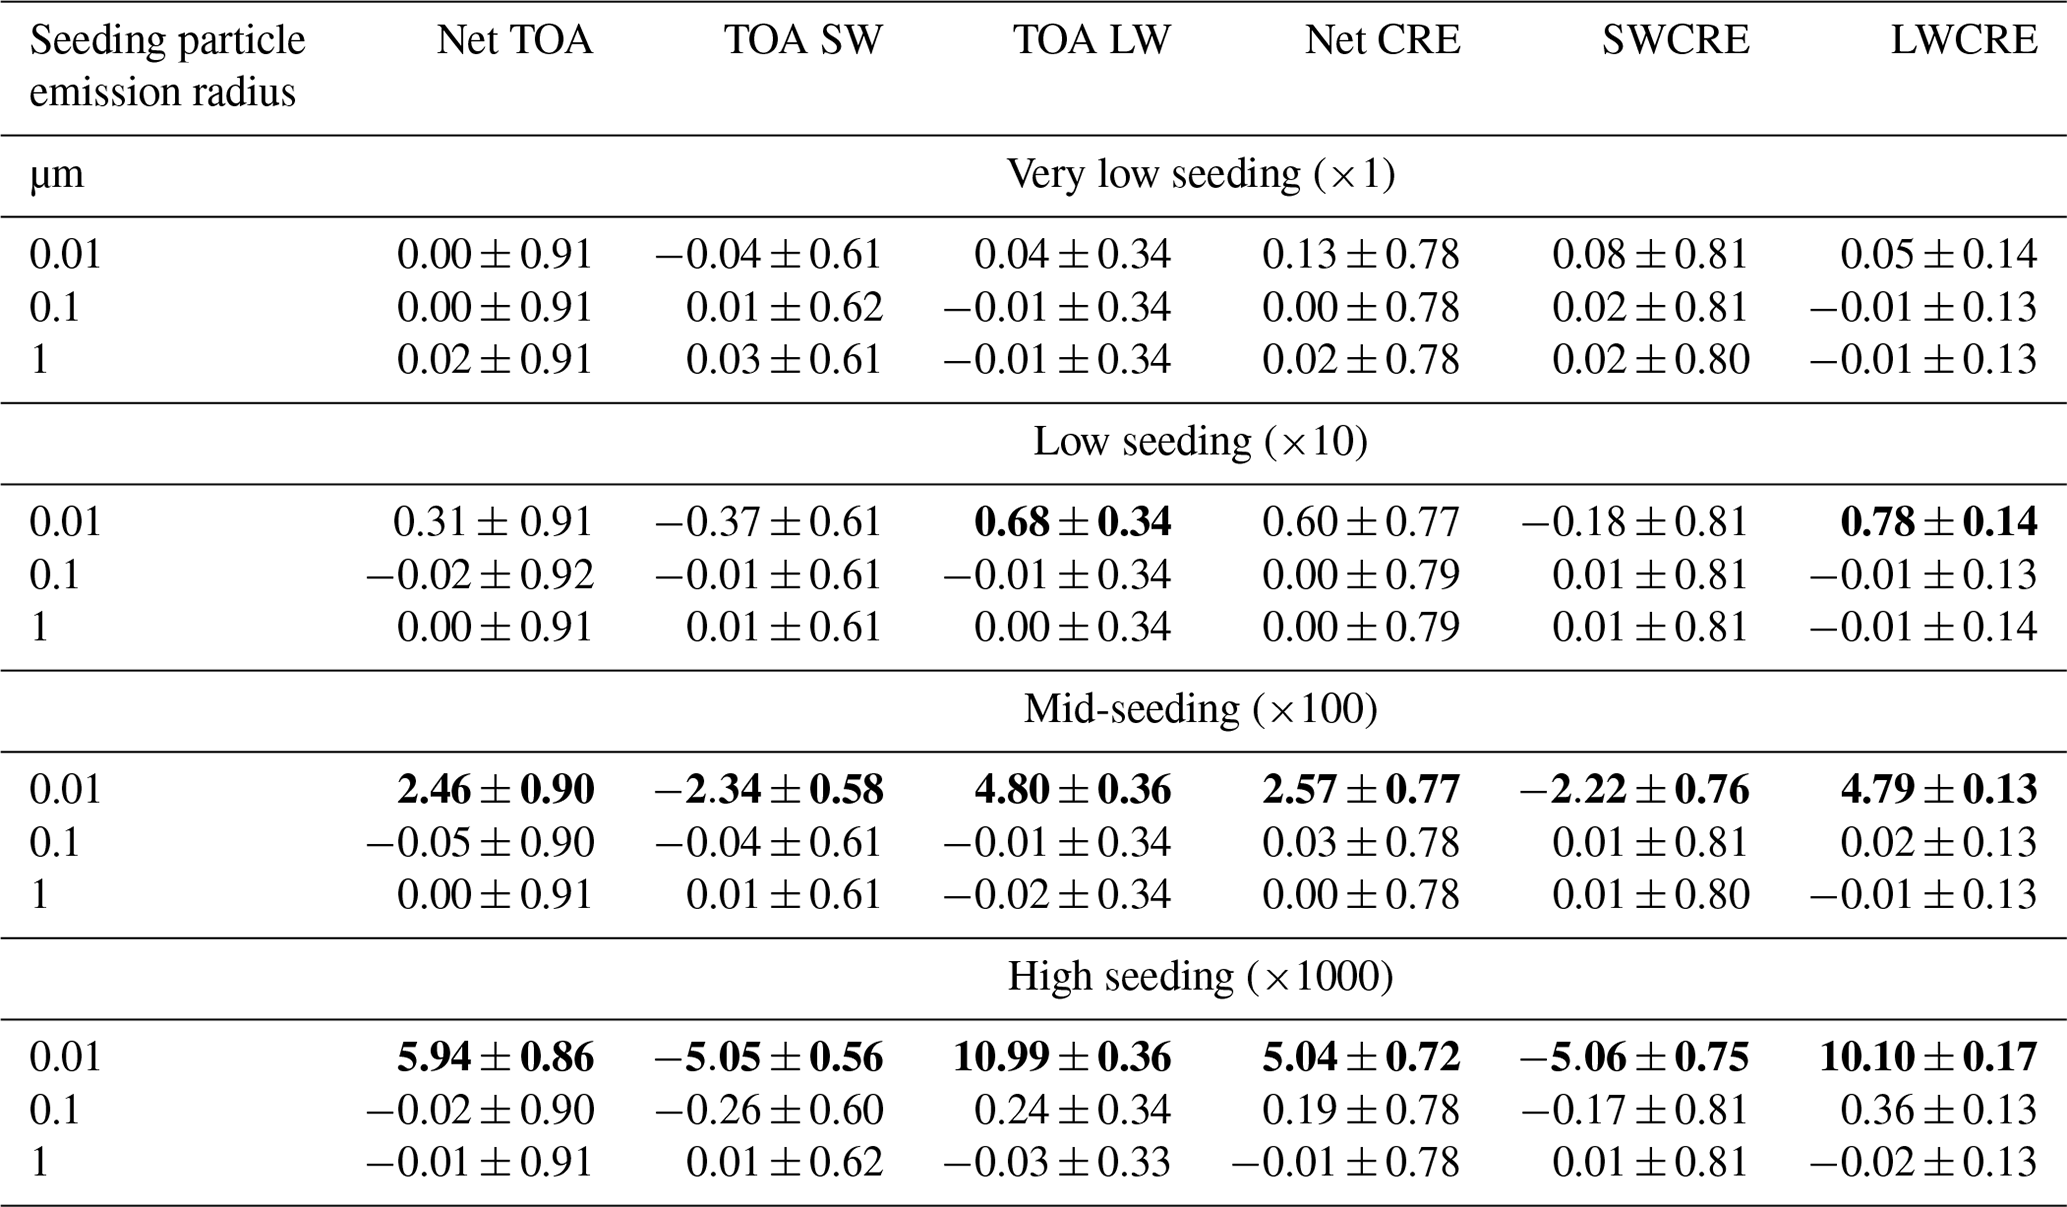
Figure 4 presents 5-year annual zonal mean profiles of cloud fraction, cirrus ice sources, and ice water content (IWC) for our case with no seeding particles (first column) and the anomaly relative to our reference case for the r0.01 high-seeding case (second column). There is a notable dipole structure in the high-level cloud fraction anomaly in response to the high concentration of seeding particles, similar to the findings by Tully et al. (2022a), with cirrus dissipation in the troposphere (between the black and blue-dashed lines in Fig. 4b) and a higher cloud fraction in the lowermost stratosphere. As the black line on each plot in Fig. 4 represents the annual mean tropopause height over the 5 years of our simulations as defined by the World Meteorological Organization (WMO), as well as to account for tropopause height variations, we refer to this region from now on as the upper troposphere and lower stratosphere (UTLS). There are also positive low-level cloud fraction anomalies in the tropics and mid-latitudes of both hemispheres (discussed below). In the troposphere, this cloud fraction behavior is due to a large shift in ice formation mechanisms in cirrus from homogeneous to heterogeneous nucleation (Fig. 4d and f). In this case the cirrus ice source from heterogeneous nucleation (ICNC HET, Fig. 4e) refers to the sum of all background processes, including deposition nucleation onto externally mixed mineral dust, immersion freezing of internally mixed dust, and freezing of internally mixed soot particles. For the seeding cases, deposition nucleation and immersion freezing of externally and internally mixed seeding particles, respectively, are added to the background heterogeneous nucleation processes in Fig. 4f.
A majority of ice in cirrus in our model originates from homogeneous nucleation (ICNC HOM) in the unseeded reference case (Fig. 4c). By adding a large concentration of seeding particles, homogeneous nucleation is almost entirely shut off in most regions and is replaced by a larger number of ice crystals that originate from heterogeneous nucleation in the mid-troposphere and the UTLS (> 1000 L−1 towards the NH high latitudes, Fig. 4d). Ice source anomalies for heterogeneous nucleation show that seeding particles overtake background heterogeneous nucleation processes on mineral dust and soot particles in the troposphere (Appendix B). As noted above, this shift in nucleation mode dominance leads to the noticeable reductions in cloud fractions in the troposphere, which is an artifact of the cloud fraction scheme we use in the model (Tully et al., 2022a). The new cloud fraction scheme by Dietlicher et al. (2019) assumes that cirrus fully cover a grid box if the grid-mean relative humidity (RH) is sufficiently high for aqueous solution droplets to nucleate ice homogeneously according to Koop et al. (2000). The large shift to heterogeneous nucleation in cirrus reduces RH values by nearly 10 % (not shown) in the same areas where we find negative cloud fraction anomalies, thus preventing the sufficiently high RH values needed for homogeneous nucleation and for full grid box coverage of cirrus. This response is in line with the intention of CCT, but the positive cloud fraction anomalies in the UTLS counteract this intended cirrus thinning (discussed below).
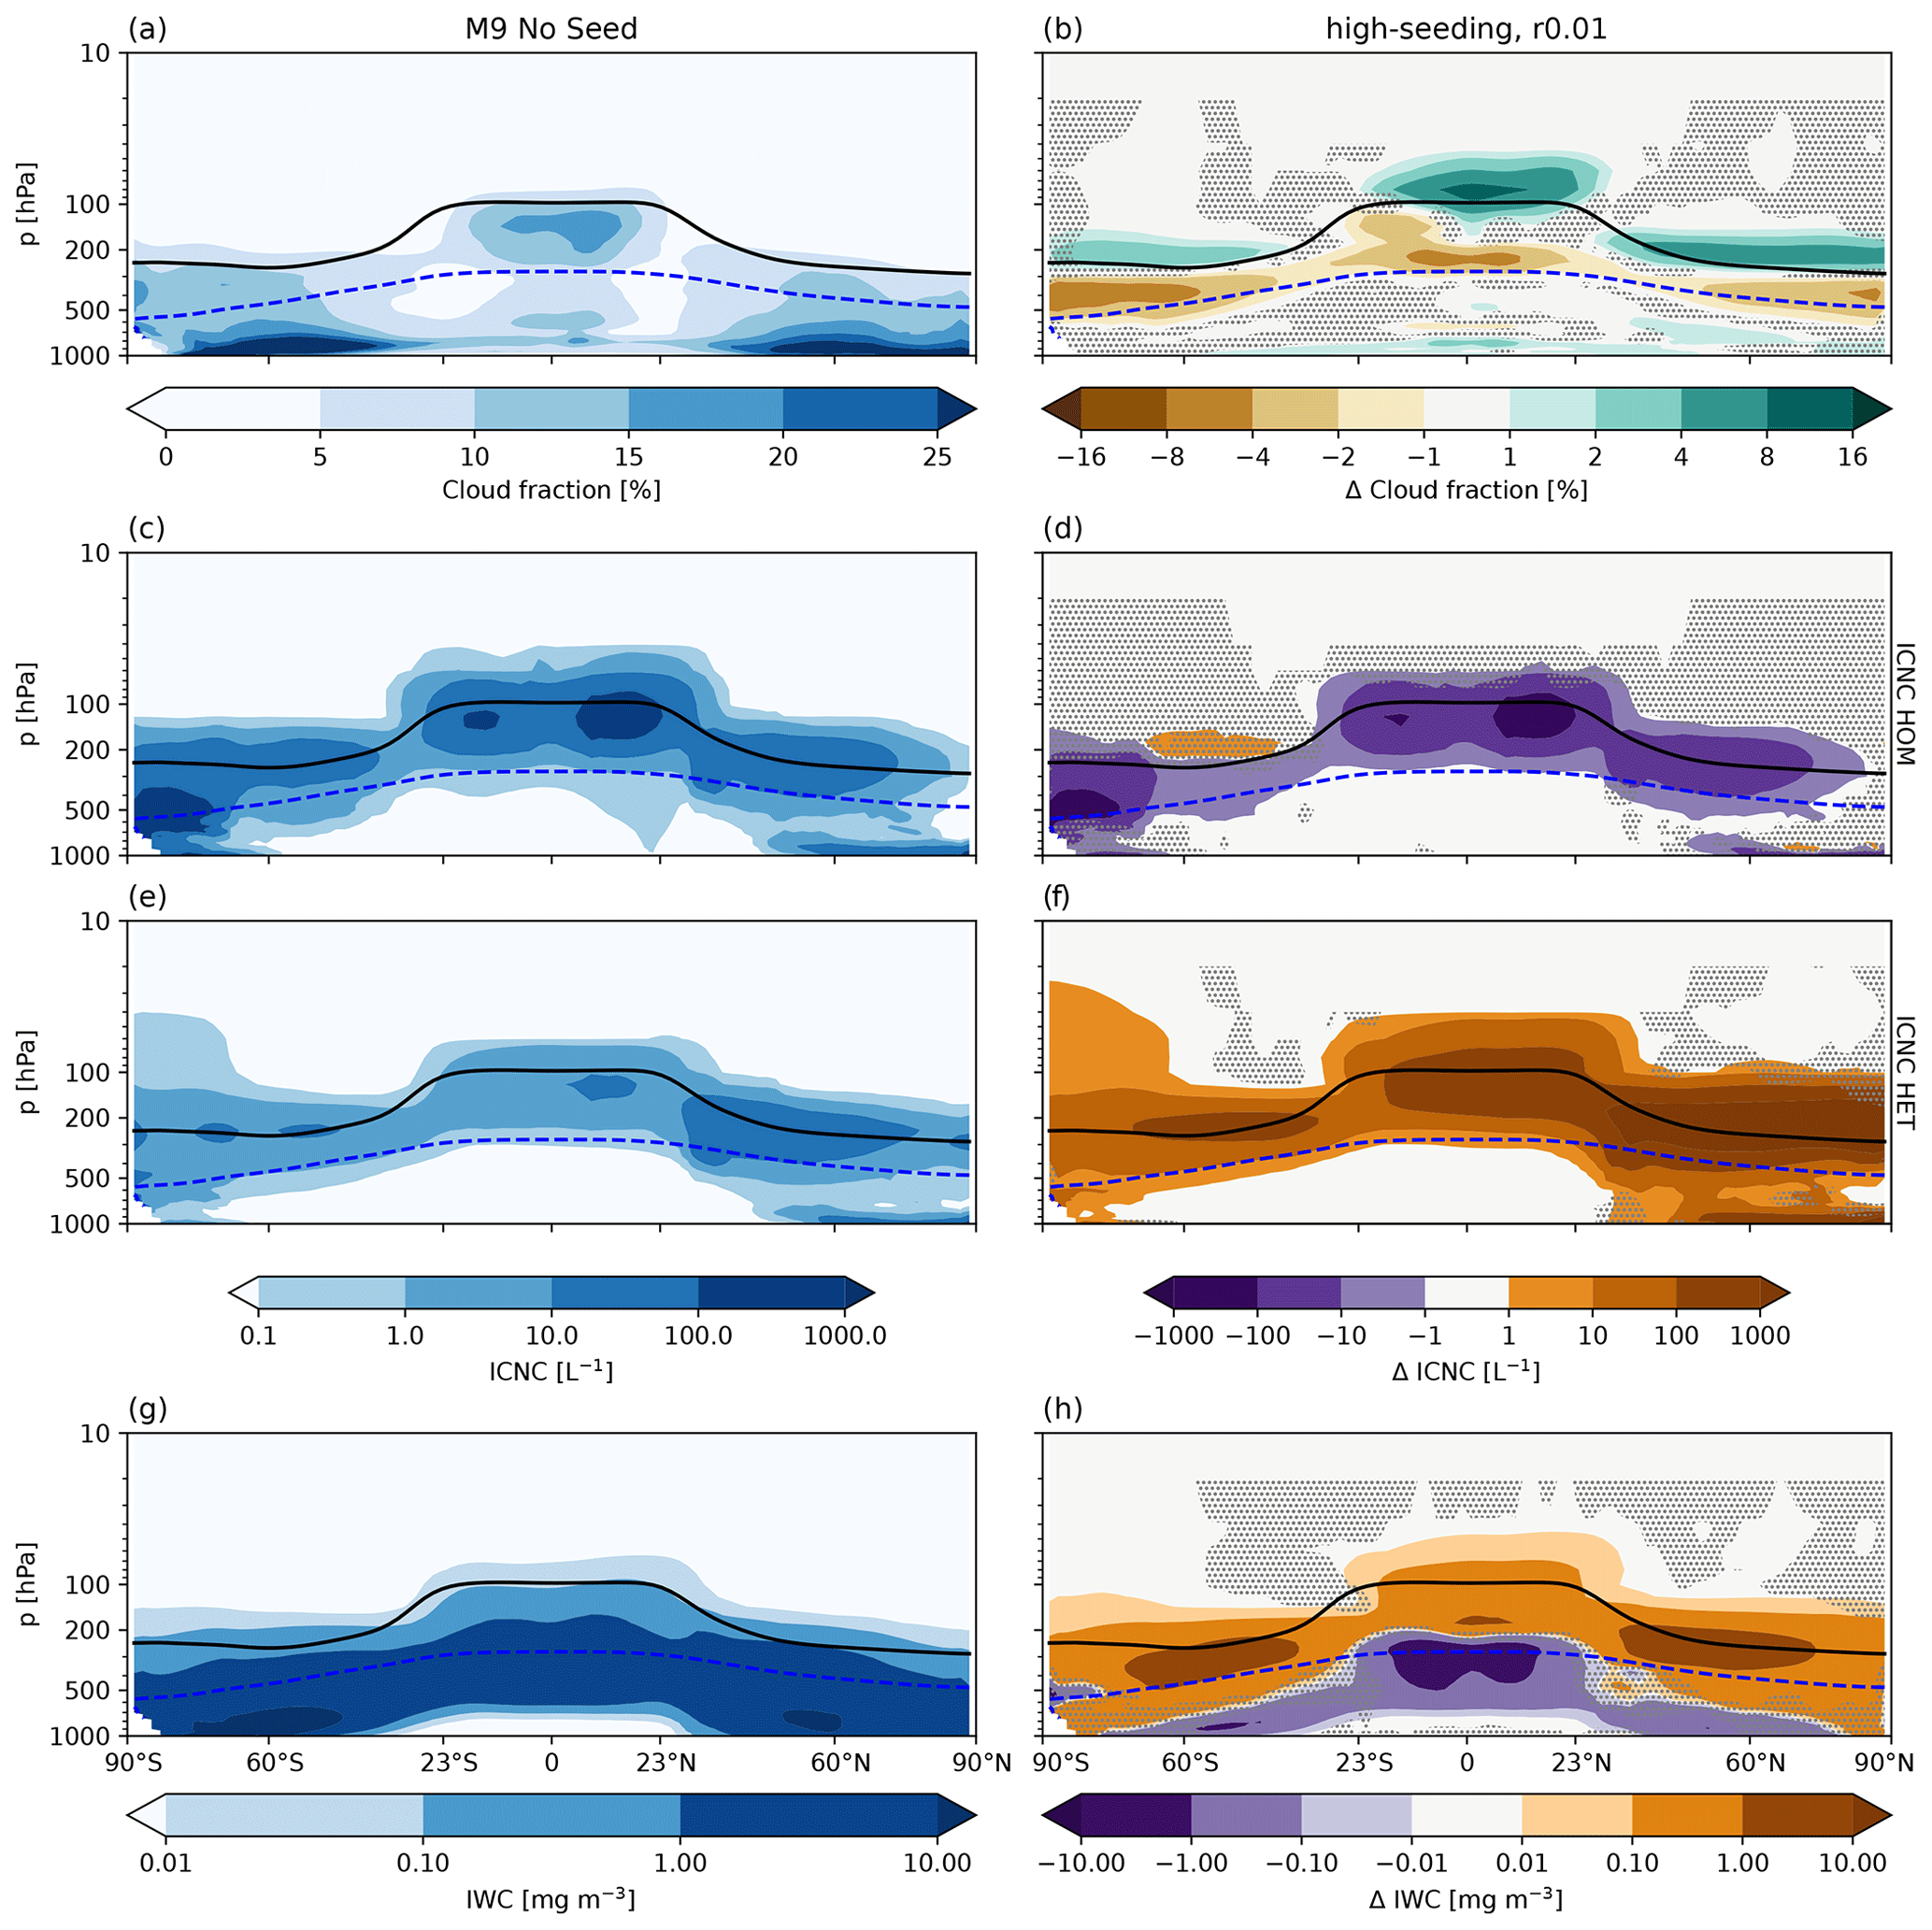
Figure 4Five-year zonal mean (a) cloud fraction in percent (%), in situ cirrus ice sources in per liter (L−1) for ice originating from (c) homogeneous nucleation (ICNC HOM) and (e) heterogeneous nucleation (ICNC HET), and IWC in milligrams per cubic meter (mgm−3) for the unseeded reference case in the first column. The respective anomalies for the seeding case with an emission radius of 0.01 µm and a mass emission scaling factor of 1000 are presented in the second column. ICNC HET refers to the sum of all the heterogeneous nucleation sources in our cirrus scheme, including deposition nucleation onto externally mixed mineral dust, immersion freezing of internally mixed mineral dust and soot particles, and in the case that seeding is active deposition nucleation and immersion freezing of externally and internally mixed seeding particles, respectively. The solid black line represents the 5-year zonal mean WMO-defined tropopause, and the dashed blue line represents the 5-year zonal mean 238 K isotherm. The stippling denotes insignificant data points at the 95 % confidence level according to the independent t test controlled by the false discovery rate method.
3.1.1 Ice crystal sizes
The large injection of seeding particles also results in an extensive positive IWC anomaly in the cirrus regime in the troposphere and in the UTLS (Fig. 4h). Combined with the large increase in ICNC from the shift of homogeneous to heterogeneous nucleation, this indicates a large reduction in the size of ice crystals, which would contribute to positive CRE anomalies through longer cloud lifetimes from reduced ice crystal sedimentation. Vertical mean anomaly profiles of the mean ice crystal effective radius show that this is the case. Ice crystals are reduced in size by nearly 4 µm for our r0.01 high-seeding case between 200 and 300 hPa in the tropics and roughly 300 and 400 hPa in the NH (Fig. 5a and b). While the discussion here will focus on the anomalies for the r0.01 high-seeding case, we find the most notable reduction in ice crystal size for the r0.01 mid-seeding case in the tropics (6 µm) and in the r0.01 low-seeding case (with mass emission scaling factor of 10) in the NH (> 4 µm), which is unexpected and will be discussed further below. We also find that the ice radius anomalies for the r0.1 high-seeding case (emission radius of 0.1 µm) are similar to those for the r0.01 low-seeding case (though slightly weaker in the tropics) as the seeding particle concentrations in these two cases are similar (Fig. 2). For the r0.01 case with no emission scaling (factor of 1), the ice crystal radius anomaly is negligible in the tropics, whereas it shows that ice crystals are reduced in size by nearly 3 µm in the NH. Seeding with an emission radius of 0.1 µm appears to lead to noticeable changes in ice crystal radius for only the high-seeding case in the tropics and the high- and mid-seeding cases in the NH. All other ice radius anomalies for the other tested seeding particle emission radii and mass scaling factors are negligible. Note that Southern Hemisphere (SH) anomalies are not shown due to the relatively low aircraft emissions in this region (Fig. 1).
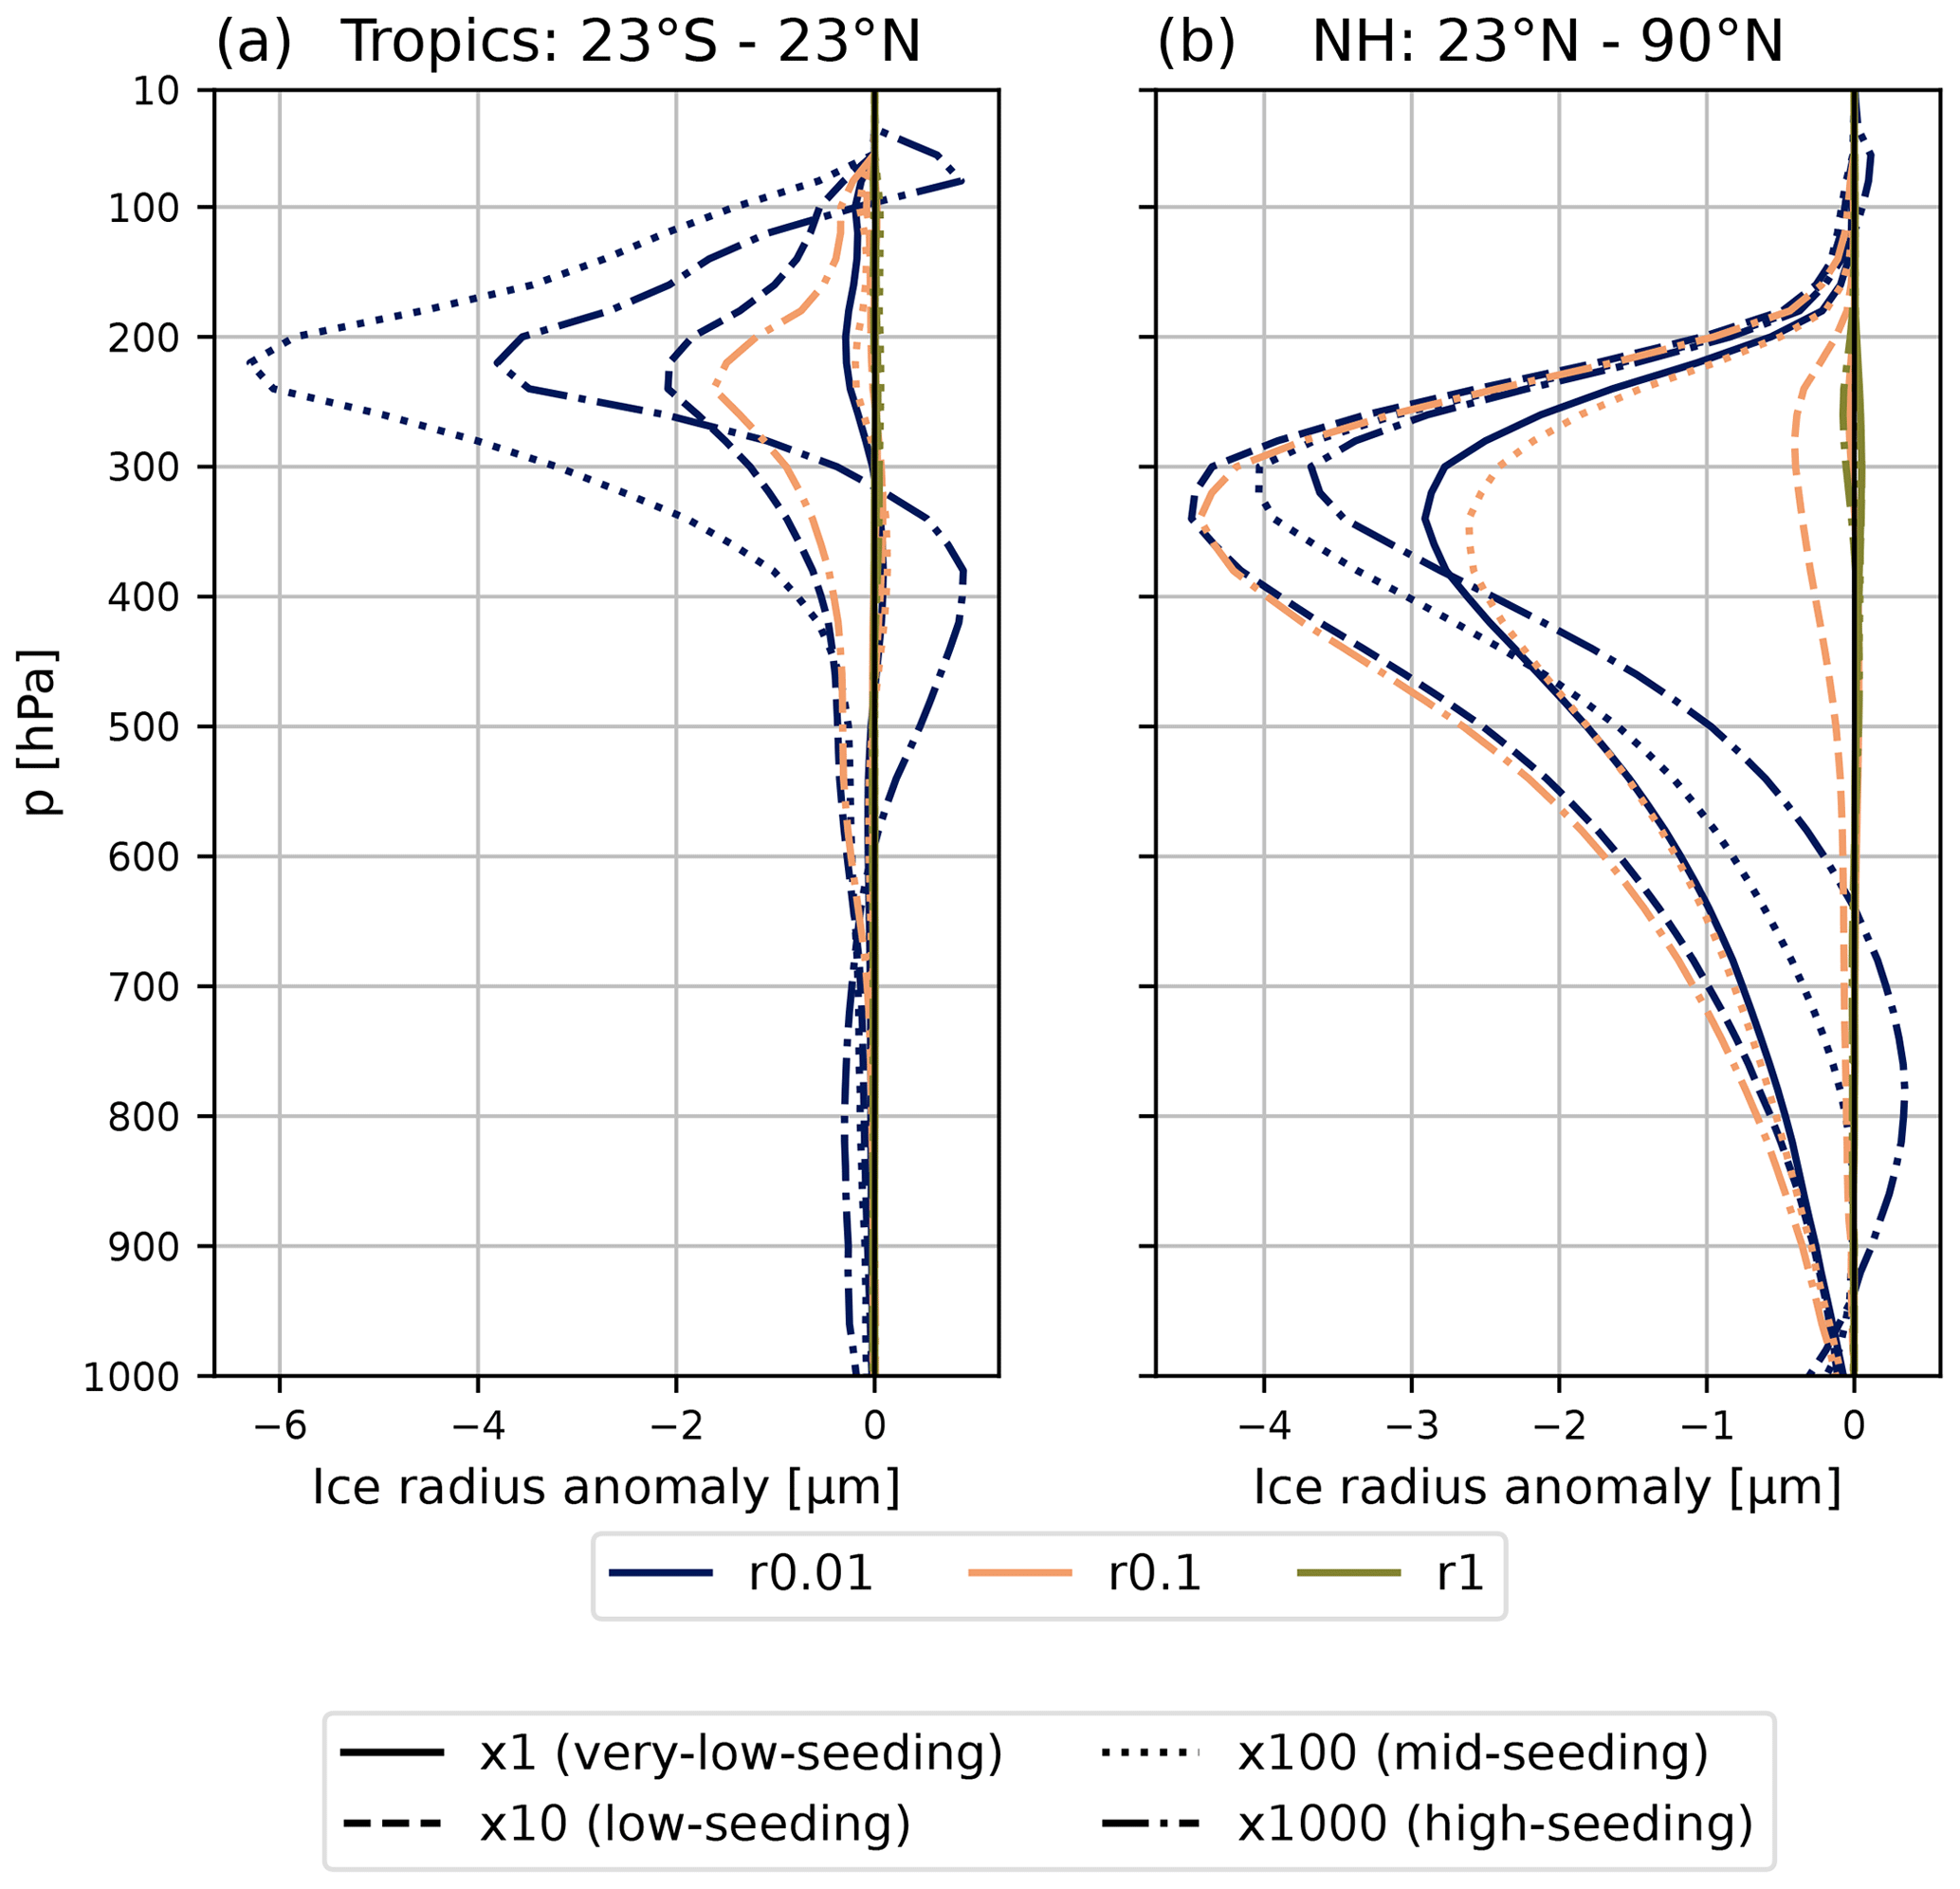
Figure 5Five-year vertical mean ice crystal effective radius anomalies (in µm) for the 12 different global seeding cases tested in the model for (a) the tropics between 30∘ S and 23∘ N and (b) the NH between 23 and 90∘ N. Each color represents one of the three emission radii: 0.01 µm (dark blue), 0.1 µm (orange), and 1 µm (olive green). Emission mass scaling factors are represented by each line style: ×1 (solid), ×10 (dashed), ×100 (dotted), and ×1000 (dot-dashed). Note the different scale of the x axes.
3.1.2 Tropical response
In the tropics, while we find a decrease in ice crystal size at higher levels, there is a small increase in the mean ice crystal radius by almost 1 µm at 400 hPa in the r0.01 high-seeding case. Here the injection of a large concentration of seeding particles that can nucleate ice at relatively low Si (1.05) forms some ice crystals that rapidly grow and sediment. However, the number of these large ice crystals is reduced relative to the unseeded reference case as the IWC at lower levels (p> 300 hPa) decreases by up to −10 mg m−3 (Fig. 4h).
Nevertheless, the main effect we find in the tropics is the formation of a large number of smaller ice crystals that remain aloft. We do find a large heating in this region by more than 5 K (Fig. 6), which is due to a large increase in LW heating (up to about 0.8 K d−1, not shown) from the fewer but optically thicker cirrus clouds in this region. This results in tropospheric stabilization and a decrease in the global mean convective precipitation rate in our model by roughly 0.26 mm d−1. A warmer tropical troposphere also means that a larger amount of water vapor can be transported into the stratosphere. In fact, for this extreme case we found that the specific humidity increases by as much as 10 mg kg−1 in the UTLS. This, combined with the availability of a larger number of seeding particles, contributes to the large positive cloud fraction anomalies in the tropical UTLS of at least 8 % in a region that was previously sparsely populated by cloud (Fig. 4a). This also explains the small positive ice crystal radius anomaly at high altitudes (p< 100 hPa) in the tropics (Fig. 5a).
3.1.3 Northern Hemisphere
Meanwhile, in the NH we find small positive ice crystal radius anomalies in lower levels (p> 600 hPa) for the r0.01 high-seeding case that is consistent with larger ice crystals that sediment more readily. This may be the case in some regions of the NH where we find positive ICNC HET anomalies up to 1000 L−1 at lower levels. This is not reflected in the zonal IWC anomalies at lower levels where we find a reduction of IWC up to 1.0 mg m−3 throughout most of the NH except in the Arctic where it is positive by up to 1.0 mg m−3. However, these low-level IWC signals are insignificant as indicated by the stippling in Fig. 4h. Seeding in this region appears to have two effects. As noted above, ice nucleation by the high concentration of seeding particles is able to overtake background heterogeneous nucleation processes on mineral dust and black carbon particles. On the one hand, this leads to rapid consumption of water vapor by some of the ice crystals that form on the seeding particles followed by rapid growth and a small enhancement of sedimentation. On the other hand, such rapid ice crystal growth does not leave much water vapor for the remaining ice crystals, which impedes their growth. The larger ICNC that formed by heterogeneous nucleation leads to fewer and optically thicker cirrus clouds. This directly influences the large positive LW CRE we find for the r0.01 high-seeding case (Table 3, Figs. 4b and 6).
A couple of factors contribute to the positive cloud fraction anomalies in the UTLS in the NH outside of the tropics (Fig. 4b). In the unseeded reference case, cloud fractions in the UTLS are at most 10 %. Even though there are ice crystals present that originate from both homogeneous and heterogeneous nucleation, their concentrations do not exceed 100 L−1, except in convective outflow regions in the tropics. Like in the troposphere, the majority of ice crystals originate from homogeneous nucleation. These ice crystals also contribute very little to the overall mass of ice in the atmosphere (Fig. 4g). When the large concentration of seeding particles is added in our r0.01 high-seeding simulation, we also find a shift in ice nucleation mechanism to heterogeneous nucleation by more than 1000 L−1, associated with relatively large increases in ice mass by up to 10 mg m−3. Such a large influx of seeding particles in previously sparsely populated regions therefore contributes to new cloud formation. Higher temperatures may prevent high ice supersaturation required for homogeneous nucleation from developing, which also contributes to a larger fraction of heterogeneous nucleation on background mineral dust particles that reaches these levels (Appendix B). This compounds the effect of the high seeding particle concentration. Therefore, the new cirrus formation in this region also contributes to the large positive LW CRE, net CRE, and net TOA anomalies we find for this seeding scenario (Table 3).
3.1.4 Summary of global aircraft seeding
The small positive cloud fraction anomalies at lower altitudes in the tropics and NH likely occur due to diminished ice sedimentation efficiency that reduces mixed-phase processes such as riming (Borys et al., 2003; Waitz et al., 2022) and the Wegener–Bergeron–Findeisen (WBF) process (Wegener, 1911; Bergeron, 1935; Findeisen et al., 2015; Storelvmo and Tan, 2015); thus, fewer cloud droplets are consumed, leading to longer-lived low clouds. In fact, throughout the NH the liquid water content (LWC) of lower lying clouds increases by at most 4 mg m−3 (not shown). In the tropics this could also be linked to tropospheric stabilization that transports less liquid water to higher altitudes.
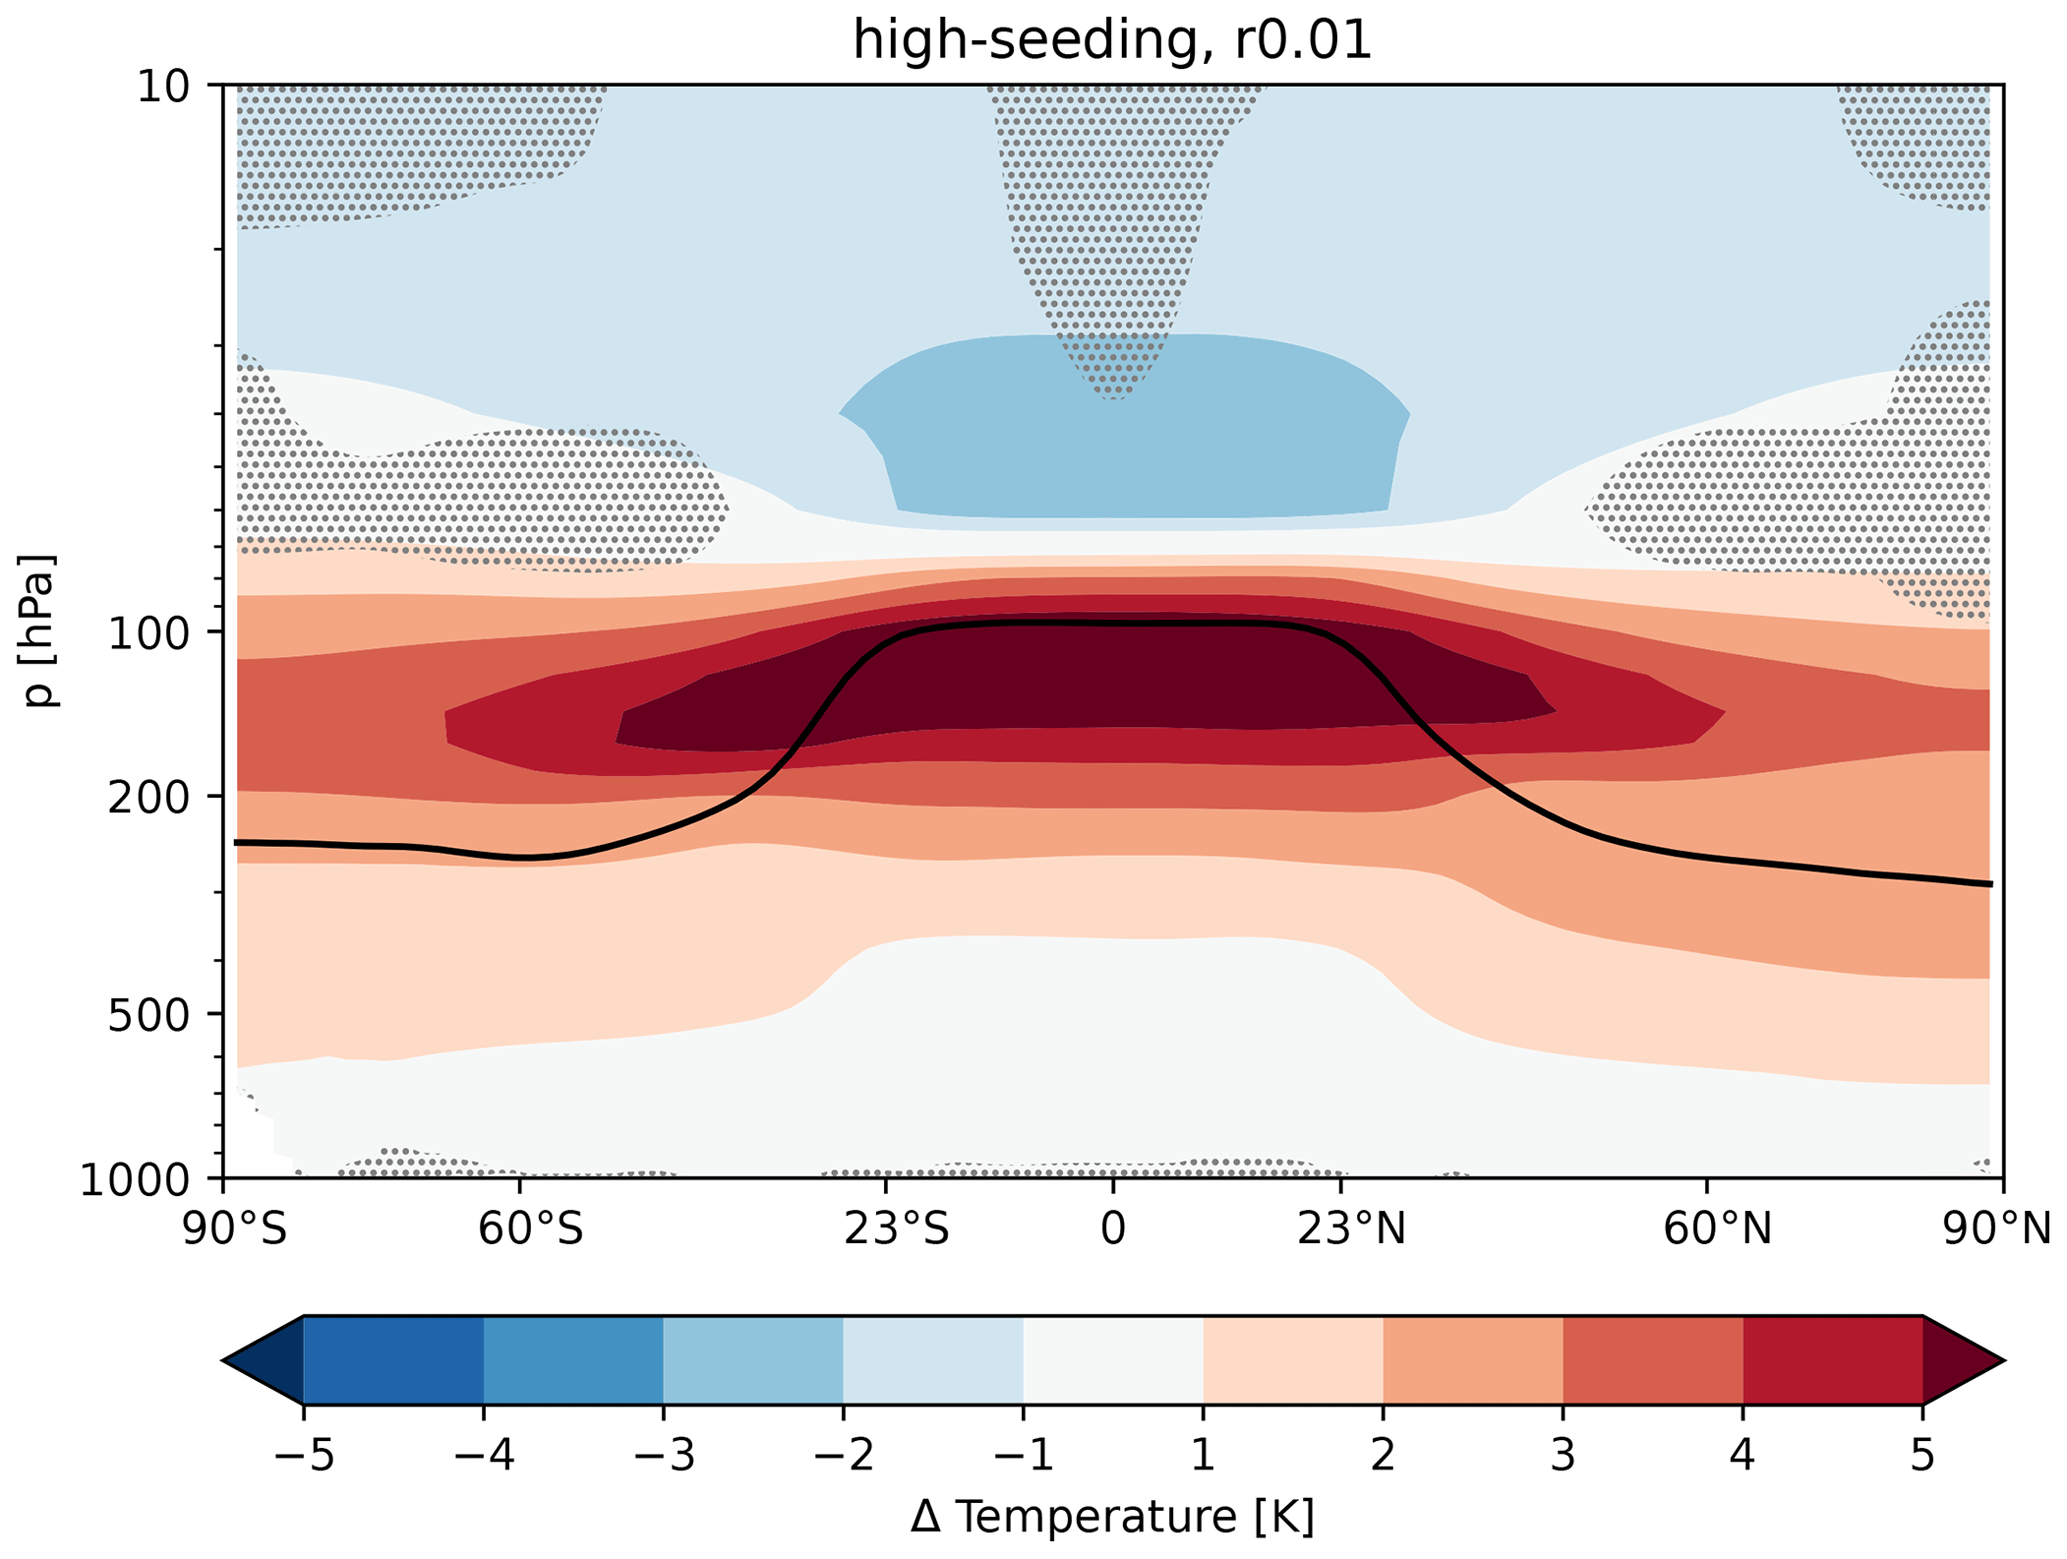
Figure 6Five-year zonal mean temperature anomaly (in K) for the case with seeding particles with a mean emission radius of 0.01 µm and an emission mass scaling factor of 1000. The black line denotes the WMO-defined 5-year annual mean tropopause. The stippling denotes insignificant data points on the 95 % confidence level according to the independent t test controlled by the false discovery rate method.
It is clear that injecting a large number of seeding particles leads to undesirable effects in our model, with fewer but optically thicker clouds in the mid-troposphere and new cloud formation in the UTLS. The former effect is an artifact of our cloud fraction parameterization and could be addressed by using an updated method that accounts for the distinction between in-cloud and cloud-free water vapor (Muench and Lohmann, 2020). What remains uncertain is why we find larger reductions in average ice crystal size when seeding with lower concentrations, which will be examined in more detail in the next section. The main outcome of global aircraft seeding is the large impact on the tropics. Heterogeneous nucleation onto numerous seeding particles in our r0.01 high-seeding case replaces ICNC HOM and leads to tropospheric stabilization, thus reducing convective precipitation. Overall, these effects strengthen the case that cirrus seeding efforts should not target tropical regions (Storelvmo and Herger, 2014; Gasparini et al., 2017).
3.2 Northern Hemisphere-only wintertime seeding
In order to avoid seeding the tropics, we conducted another series of simulations with the same particle sizes and mass scaling factors described previously but with geographically restricted emissions to only the NH between 23 and 90∘ N. We chose 23∘ N as our southernmost boundary for seeding particle emissions as this latitude corresponds to the Tropic of Cancer. However, we restricted seeding particle emissions further by only seeding during NH wintertime (November–February) as this was suggested to optimize cirrus seeding efficacy due to a lack of incident solar radiation during this time period, meaning cirrus clouds exert only a LW warming effect (Storelvmo and Herger, 2014; Storelvmo et al., 2014)
Table 4 presents the 5-year annual global mean net TOA and CRE radiative anomalies as well as their SW and LW components for all 12 NH winter seeding cases. Radiative anomalies for the period between November and February are presented in Appendix C. Compared to global aircraft seeding (Table 3) we find a reduction in the positive TOA anomaly by roughly 63 % when seeding only the NH during winter for the extreme case, r0.01 high seeding, but the response remains large. As before, the TOA response is driven by cloud effects, with the net CRE accounting for roughly 99 % of the net TOA response and even exceeding the net TOA response for the other cases with r0.01 and different mass scaling factors, indicating rapid cloud adjustments for these latter cases. The positive (warming) effects are certain for the r0.01 high- and mid-seeding cases with NH wintertime seeding. There is a lack of certainty in the radiative response on the 95 % level for all other cases. For example, for the r0.01 low-seeding (scaling factor of 10) case, a negative (cooling) response to the lower seeding particle concentration is within the range of uncertainty. In the rest of this section we restrict ourselves to examining the microphysical responses to the r0.01 NH wintertime seeding cases.
Table 4Five-year global mean net TOA and net CRE radiative balance anomalies in watts per square meter (W m−2), as well as their SW and LW components for each of the seeding particle emission radii tested for the NH wintertime seeding scenario. Each quantity includes the 95 % confidence interval equating to 2 standard deviations of the mean values of the 5-year data sets. Values in bold denote those that are statistically distinct from zero based on the 95 % confidence level.
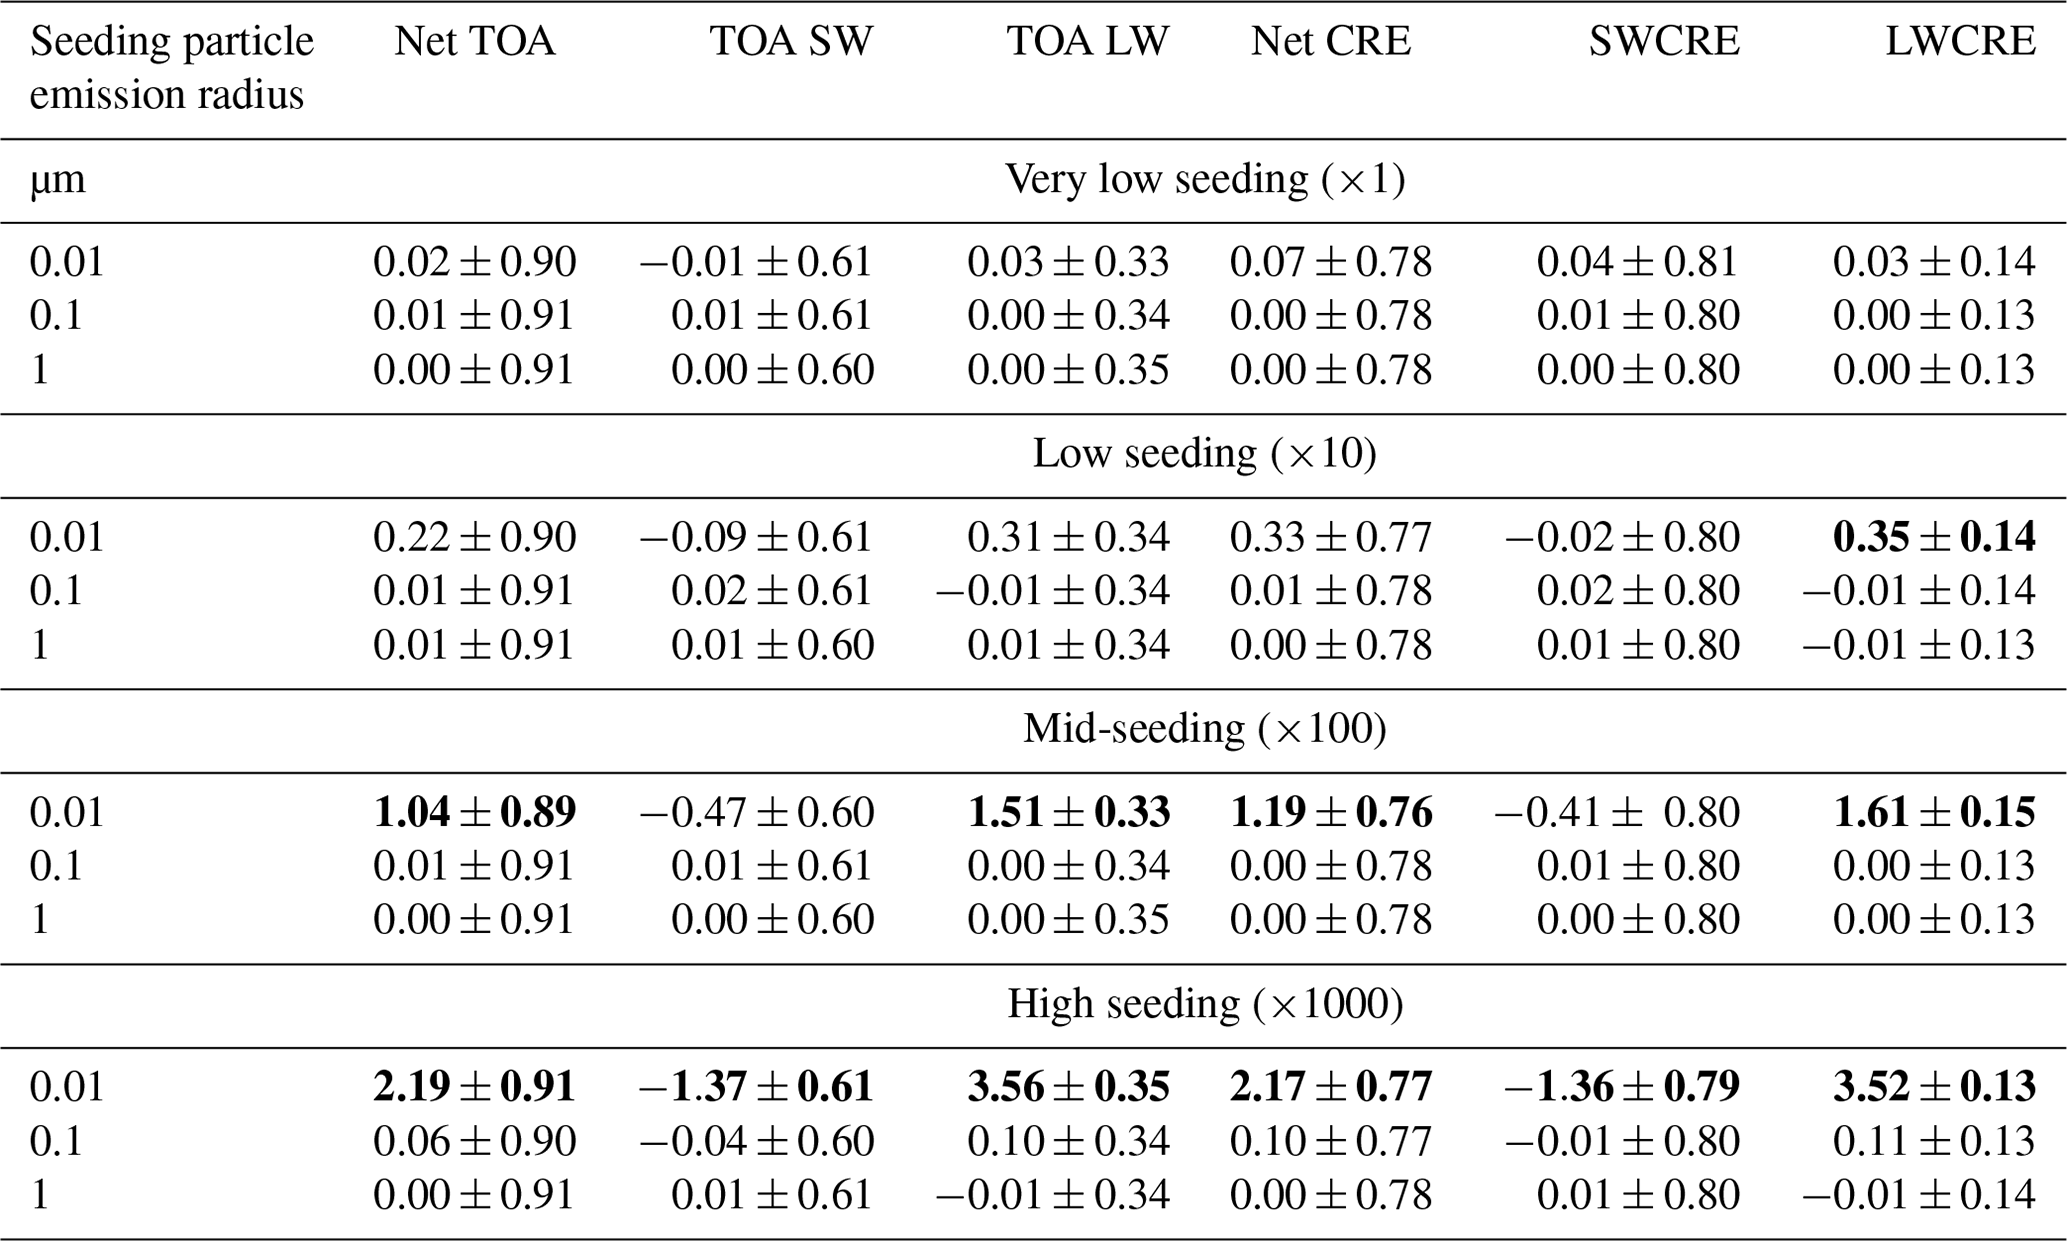
Figure 7 presents the NH wintertime zonal mean anomalies for four different parameters for the r0.01 low-, mid-, and high-seeding cases. Each plot includes the 95 % confidence interval around the mean anomaly for each latitude. Like the TOA radiative anomalies in Table 4, the anomalies of cloud properties scale with the number concentration of seeding particles, which is highest for the ×1000 case. For this extreme case, positive cloud fraction anomalies by at most 10 % contribute to the large positive TOA anomalies (Table 4). This results in a zonal average warming in the NH by about 1 K (not shown). Cloud fraction anomalies are smaller for the other two cases in Fig. 7a. For the low-seeding case it is uncertain whether seeding leads to higher cloud fractions and warmer temperatures, in line with the uncertain TOA radiative anomalies (Table 4).
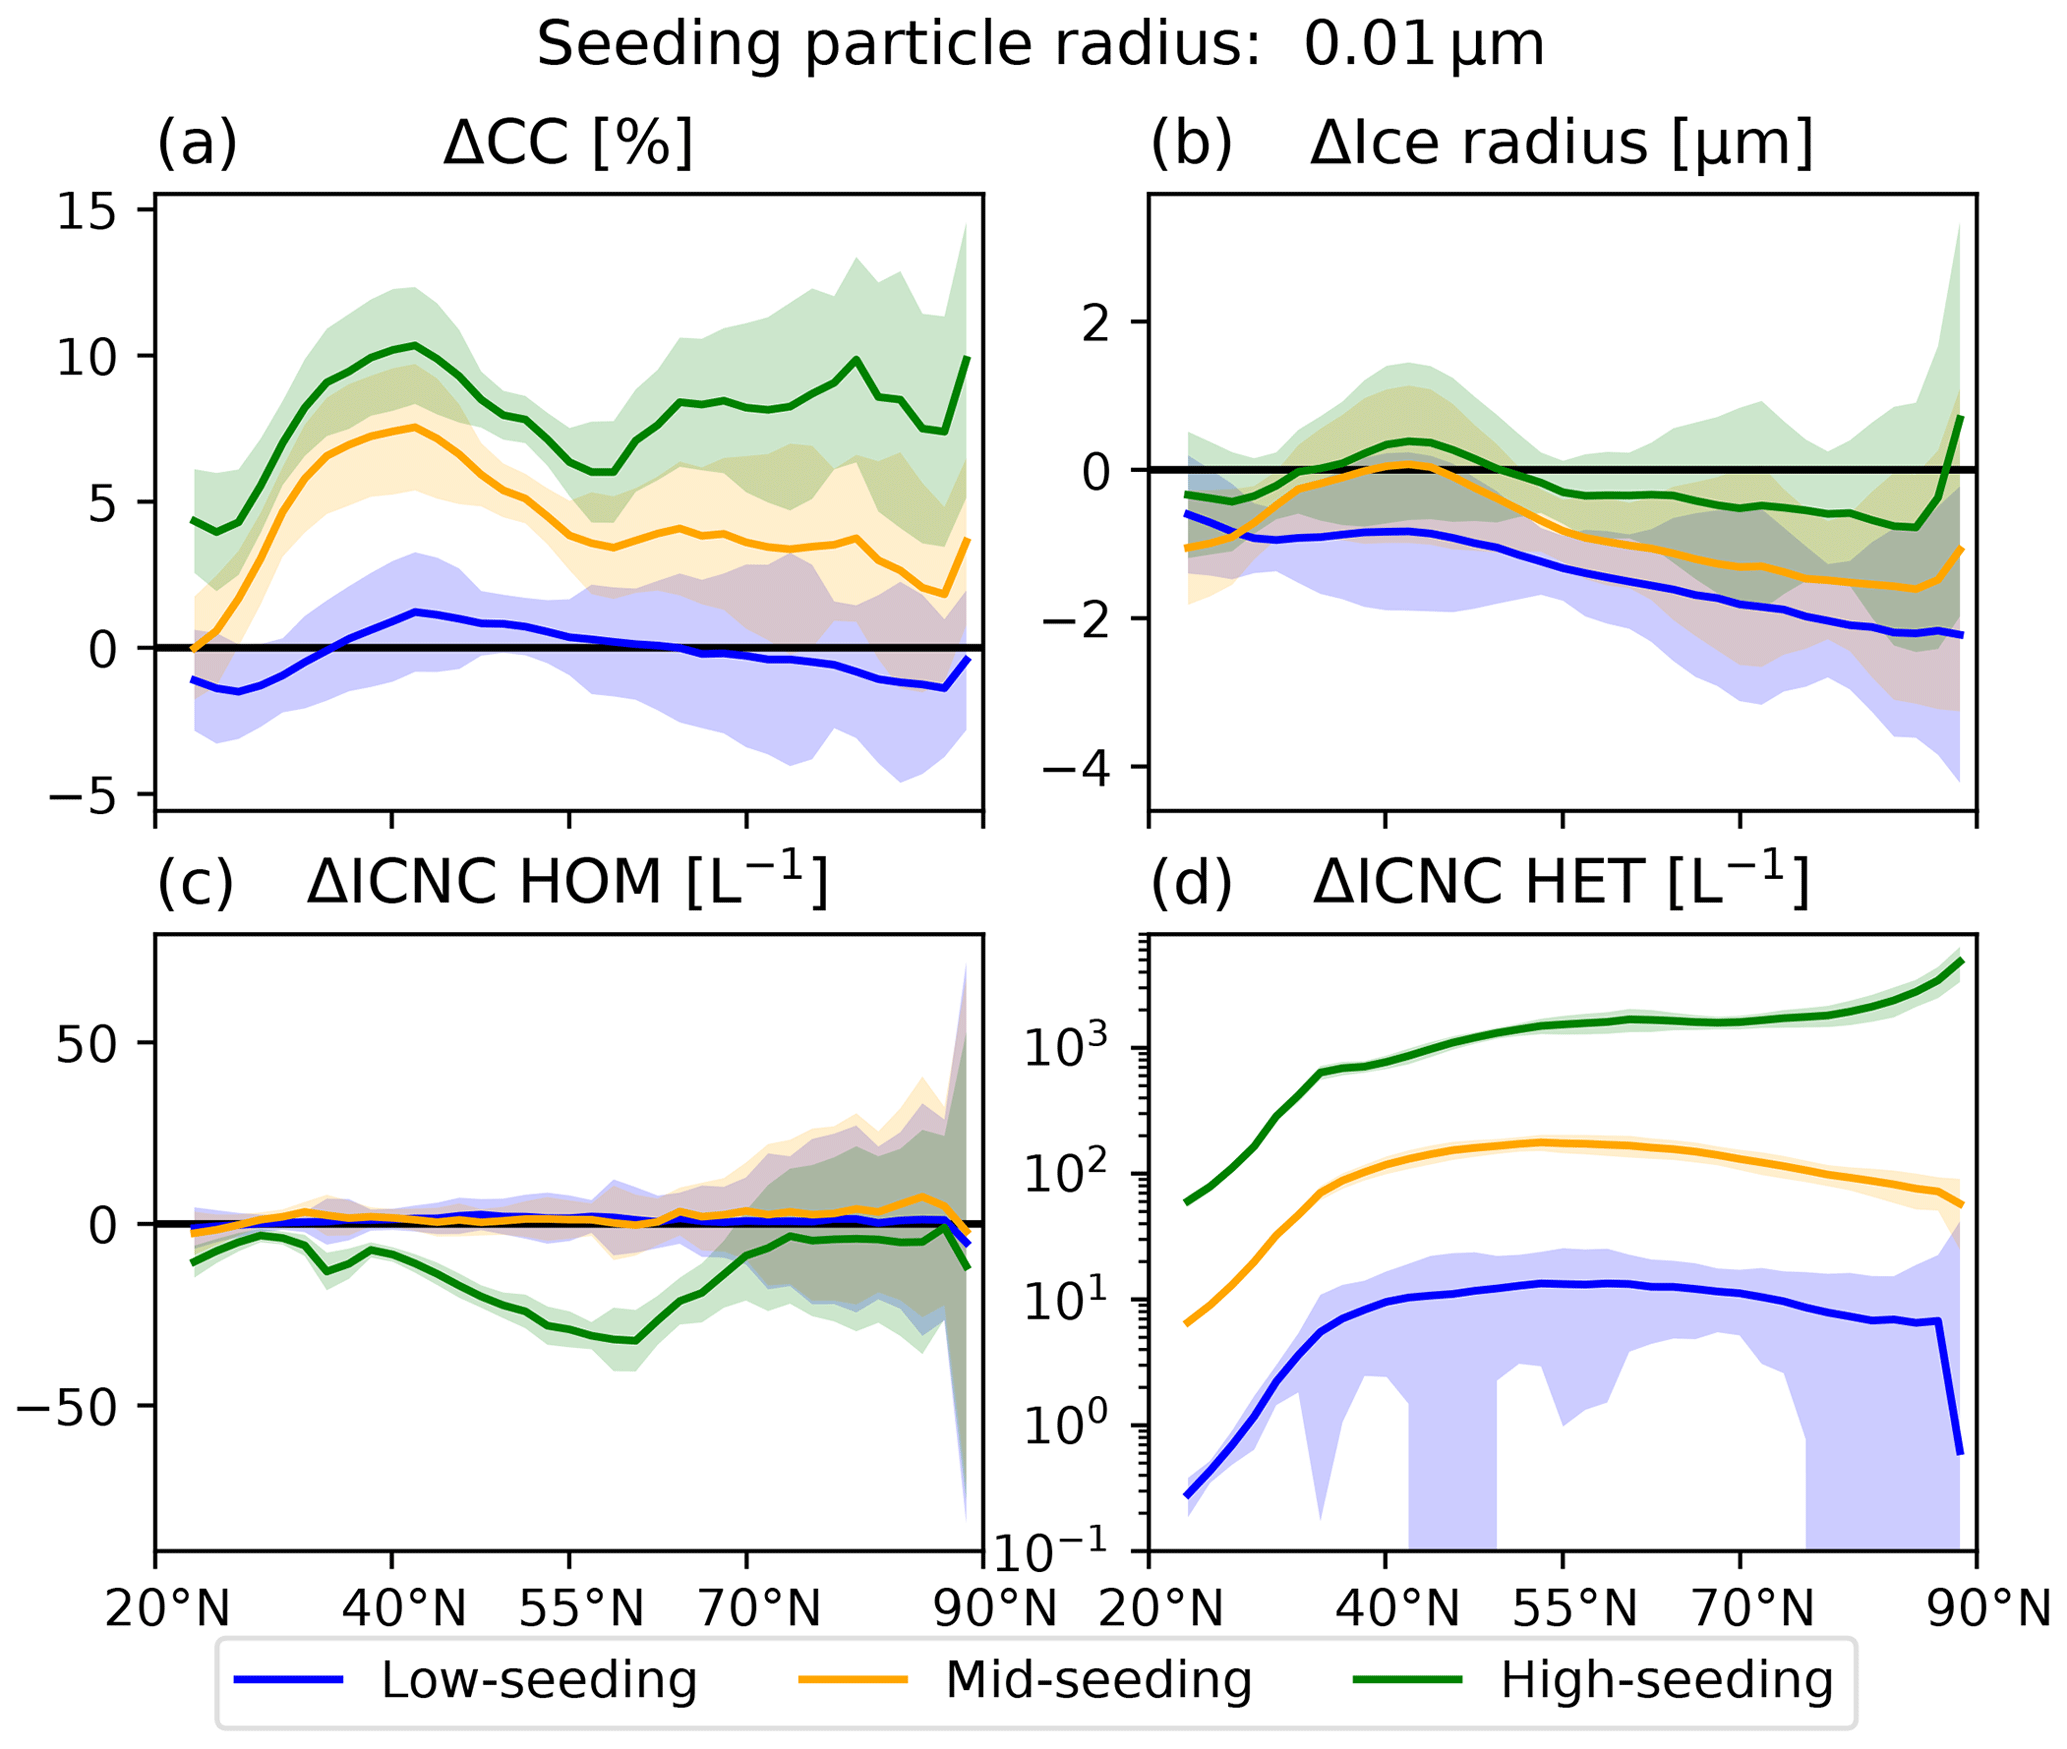
Figure 7Five-year Northern Hemisphere winter zonal mean anomalies for (a) cloud fraction in percent (%), (b) ice crystal radius in micrograms (µm), and the in situ cirrus ice sources in per liter (L−1) for ice originating from (c) homogeneous nucleation and (d) total heterogeneous nucleation as the sum of processes on background mineral dust, soot, and seeding particles. The anomalies are shown for the three seeding cases with particles with a mean emission radius of 0.01 µm with an emission mass scaling factor of 10 (low seeding, blue), 100 (mid-seeding, orange), and 1000 (high seeding, green). The shading denotes the 95 % confidence interval around the mean value at each latitude. Note that the uncertainty for the r0.01 low-seeding ICNC HET in panel (d) is large enough that is extends to values < 0, which cannot be displayed on the y-axis log scale.
The differences in ice property anomalies between the three cases are interesting. Similar to our global aircraft seeding scenarios, the NH wintertime zonal mean ice crystal effective radius anomalies show unexpected behavior, with the largest reduction in zonal average ice crystal radius found for the r0.01 low-seeding case (Fig. 7b). The average ice crystal size for this case is reduced by roughly 2 µm, followed by the mid-seeding case. The ice crystal radius anomaly for the high-seeding case is much smaller, with some regions showing a slight positive signal, but it is highly uncertain. This peculiar response is the opposite of what we would expect and may be explained by the zonal mean anomalies for the cirrus ice sources for homogeneous and heterogeneous nucleation ICNC HOM and ICNC HET (Fig. 7c and d).
We find that in the high-seeding case ICNC HOM is reduced throughout the NH (Fig. 7c), whereas seeding in the other two cases has a relatively negligible and uncertain effect. All cases show positive ICNC HET anomalies. The signal varies by at least 1 order of magnitude for each mass scaling factor (Fig. 7d). This is due to the large differences in concentration of seeding particles available in the cirrus scheme between these three cases. Figure 2 shows that the concentration of seeding particles in the NH decreases from > 105 L−1 for the high-seeding case to < 1000 L−1 for the low-seeding case. Note that while this figure shows zonal mean seeding particle concentrations for the global seeding simulations, with the NH wintertime filtering applied we find that the concentrations for all 12 combinations of seeding particle emission radius and mass emission scaling factor are similar in these regions. Meanwhile, the concentration of liquid sulfate aerosols used for homogeneous nucleation in our cirrus sub-model is around at least 104 L−1 in the NH, similar to the total aerosol concentration used for heterogeneous nucleation in cirrus (i.e., on dust and soot particles, not shown). For the high-seeding case the large concentration of seeding particles forms numerous ice crystals that consume water vapor and prevent the development of large Si required for homogeneous nucleation, whereas for the other two cases it appears that the addition of seeding particles merely adds to the ICNC HET. Ice crystals originating from homogeneous nucleation tend to be small due to large competition for water vapor. Replacing them with heterogeneously nucleated ice crystals that form at much lower Si and have a longer time to grow, as in the high-seeding case, means that the overall effect on ice crystal size should perhaps be an increase. However, as the seeding particles themselves are so small (0.01 µm), combined with their high number concentration, it is likely that they form numerous ice crystals that remain small due to rapid water vapor consumption such that the average ice crystal size remains roughly the same. To investigate this further, Fig. 8 shows the NH wintertime zonal mean cirrus ice sources for the three r0.01 boxlow-, mid-, and high-seeding cases, including ICNC HOM and the source terms for ICNC HET for ice forming on mineral dust, soot, and seeding particles. Consistent with the zonal anomaly in Fig. 7c, homogeneous nucleation is almost entirely replaced by the large injection of seeding particles for the high-seeding case (Fig. 8d and p). It also shows that background heterogeneous nucleation on soot and mineral dust in the troposphere is overtaken by nucleation on the high concentration of seeding particles. At the same time we find additional ice crystals originating from heterogeneous nucleation on background dust particles in the UTLS. Examining SW and LW heating rates in this region (Appendix C) reveals a weak SW heating rate of up to 0.3 K d−1 relative to a stronger LW heating rate of 1.6 K d−1 from the optically thicker cirrus in the tropopause region. In turn this induces a strong LW cloud-top cooling effect (Possner et al., 2017; Eirund et al., 2019) of about −1.2 K d−1 above roughly 200 hPa, which coincides with the area of positive ICNC dust in Fig. 8h. Lower temperatures in the UTLS combined with a higher availability of water vapor in this region, as denoted by a positive specific humidity anomaly around 5 mg kg−1 on average, forms the conditions for ice nucleation on the background mineral dust particles (up to 100 L−1). As the availability of water vapor in this region is sparse relative to the lower-lying atmosphere, combined with the influx of numerous seeding INPs, the ice crystal growth is limited. Thus, in the high-seeding case, the ice crystal size anomaly we find is the result of limited ice growth on the numerous injected seeding particles or on enhanced background mineral dust INP activity, which produces ice that is comparable in size to the reference unseeded case. The small indication of larger ice crystals in Fig. 7b may be in line with some enhanced sedimentation in the high-seeding case, as noted by the positive ICNC anomaly for heterogeneous nucleation on seeding particles at low altitudes in Fig. 8p.
It remains unclear why the two cases with lower concentrations of seeding particles (low and mid-seeding) produce larger reductions in the average size of ice crystals than the high-seeding case (Fig. 7b). The zonal mean cirrus ice source anomalies in Fig. 8 (second and third columns) reveal an interesting effect on ice nucleation competition. We still find a large positive seeding signal up to about 1000 L−1 for the low-seeding case and exceeding 1000 L−1 for the mid-seeding case. There are also noticeable reductions in both homogeneous and heterogeneous nucleation processes in the troposphere for both cases. However, unlike the high-seeding case, we find positive homogeneous nucleation anomalies in the UTLS. We also find positive anomalies for heterogeneous nucleation on mineral dust in this region. Thus, it appears that seeding in these two cases has two different effects that explain the large negative ice crystal radius anomalies we showed in Fig. 7b. In the troposphere, seeding replaces some background heterogeneous processes. Plus, some of the ice crystals formed on the seeding particles grow quickly and sediment (as indicated by the small positive ICNC seed anomaly at low levels in Fig. 8n and o) such that the remaining ice crystal size decreases. As a result, we also find that optically thicker cirrus clouds in these two cases form and exert a stronger LW CRE that warmed the upper troposphere, which for the mid-seeding case exceeded 0.1 K d−1 (not shown). This also induces a slightly stronger LW cloud-top cooling effect of about 0.1 K d−1 in the mid-seeding case that cools the UTLS and increases ice supersaturation. However, as the seeding particle concentrations in these two cases are not as high as in the high-seeding case, the formation of ice onto these particles is insufficient to prevent higher-ice-supersaturated conditions from developing that are appropriate for heterogeneous nucleation on mineral dust particles and homogeneous nucleation. While this signal is somewhat clear for the mid-seeding case, it is unclear for the low-seeding case due to the wide range of the 95 % confidence level. Nevertheless, the limited availability of water vapor in the UTLS limits ice crystal growth. Therefore, relative to the unseeded reference case, the new ice crystals forming in the UTLS in this case are smaller. This behavior also explains the vertical mean ice crystal radius anomalies we found in the global seeding cases in Fig. 5. We present a similar vertical ice crystal anomaly plot for our NH wintertime seeding in Appendix C. While the high-seeding case shows the largest reduction in ice crystal radius around 350 hPa, it is partially compensated for by larger ice particles at lower levels (p> 600 hPa), which is why we find the smallest zonal ice crystal radius anomalies on all levels for this case in Fig. 7b.
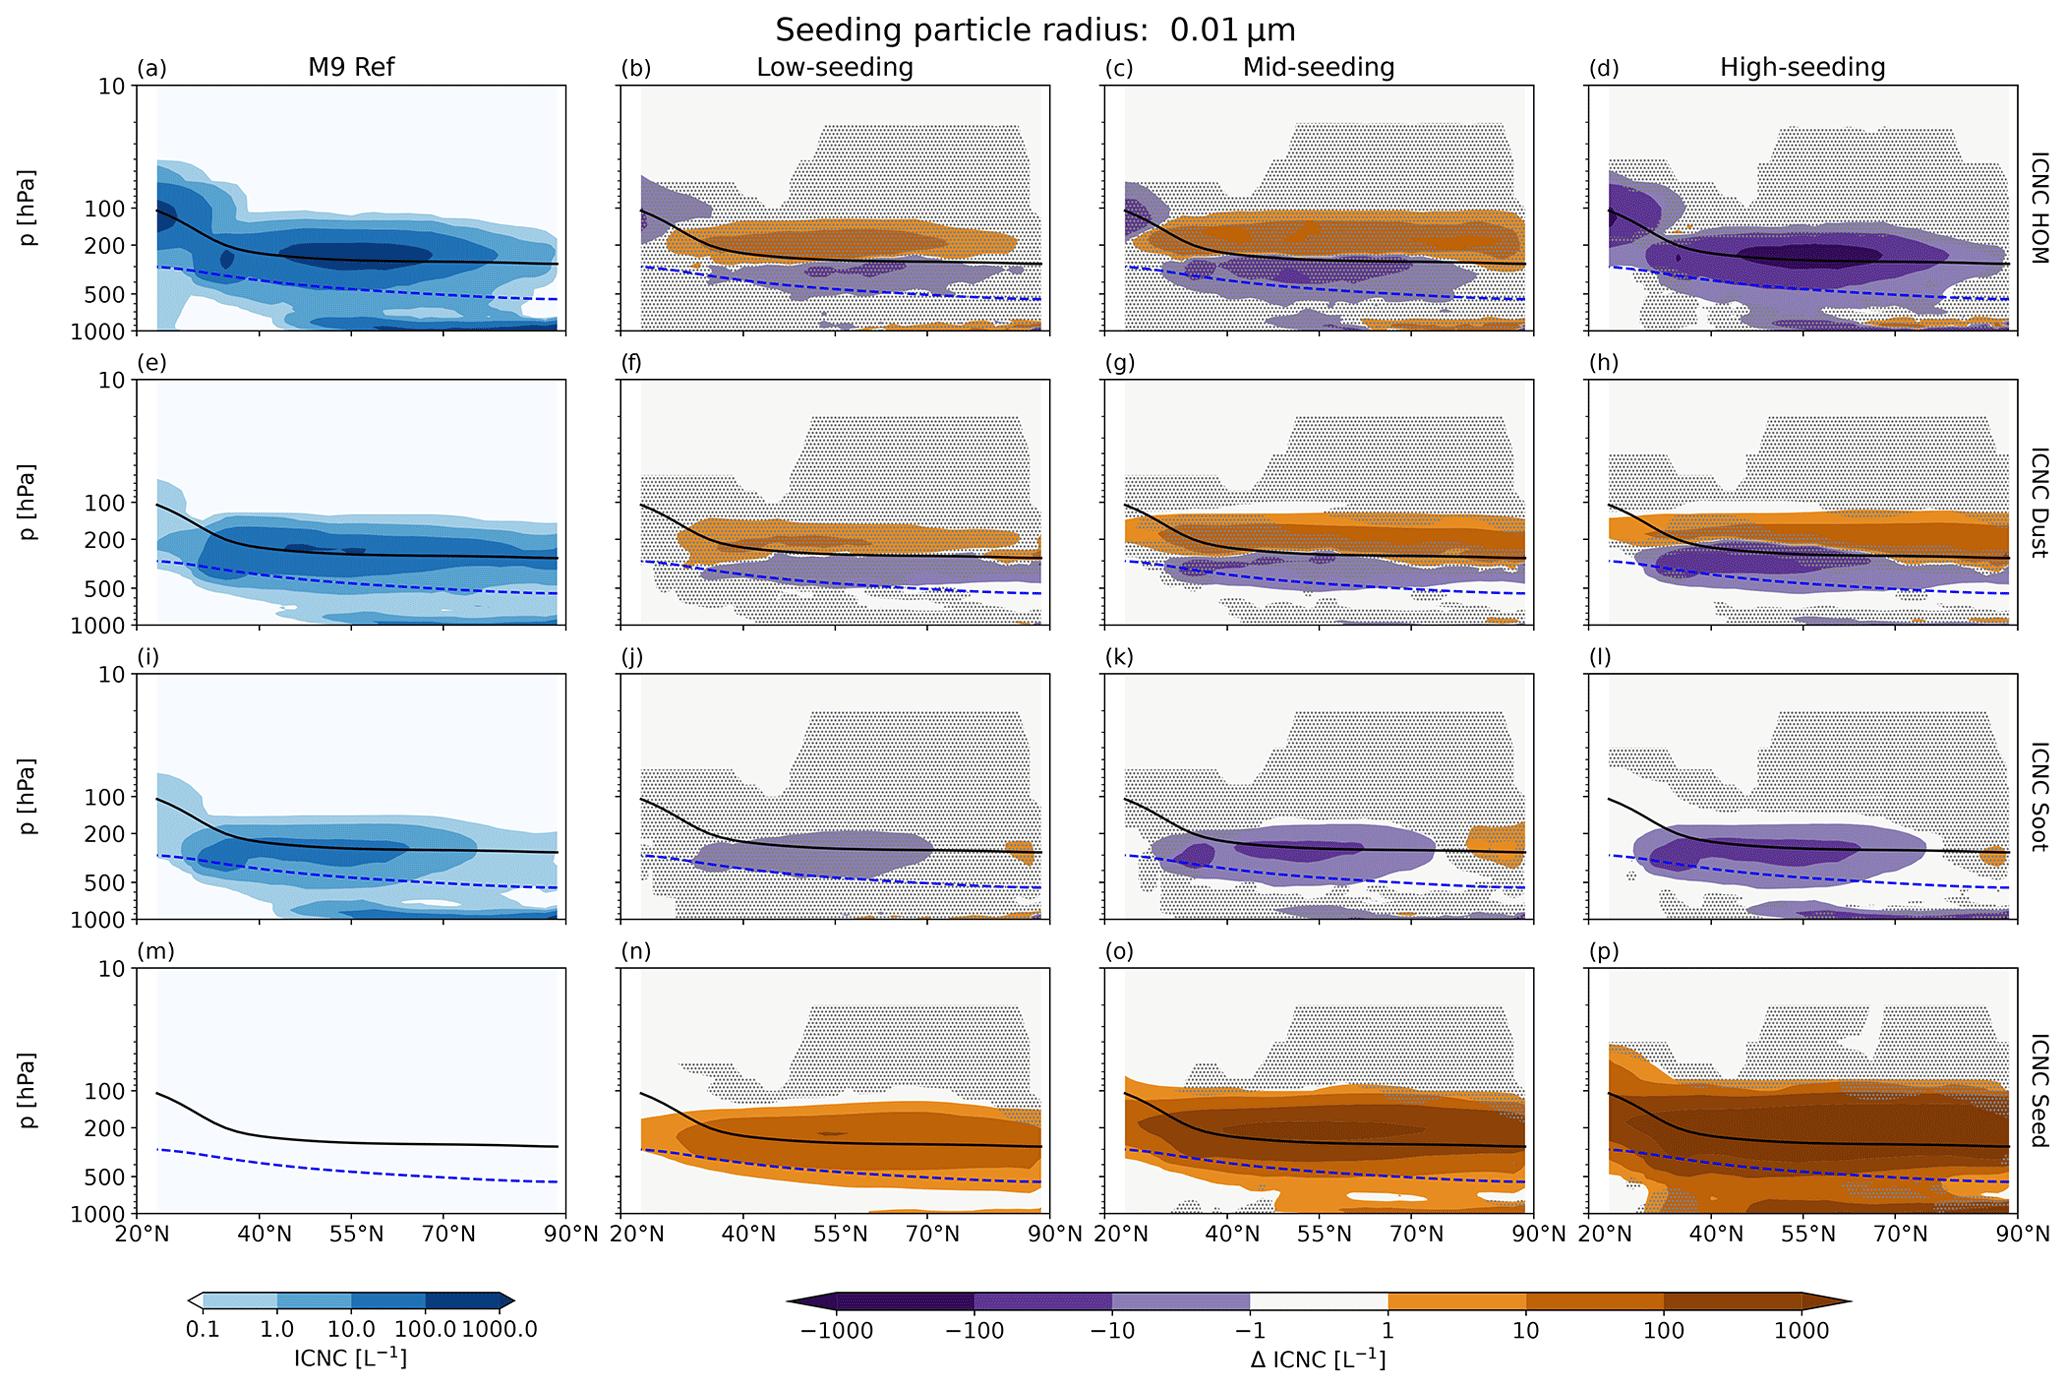
Figure 8Five-year Northern Hemisphere wintertime zonal mean ICNC for in situ sources of cirrus ice in per liter (L−1) for homogeneous nucleation and the sources of heterogeneous nucleation for the unseeded reference case in the first column, as well as the anomalies for seeding with a factor of 10 (low seeding, second column), 100 (mid-seeding, third column), and 1000 (high seeding, fourth column). The first row shows the ICNC from homogeneous nucleation (ICNC HOM). The second, third, and fourth rows each represent the ICNC from heterogeneous nucleation sources for mineral dust (second row, ICNC dust), soot (third row, ICNC soot), and seeding particles (fourth row, ICNC seed). The black line denotes the WMO-defined tropopause, and the blue dashed line is the 238 K temperature contour. The stippling denotes insignificant data points at the 95 % confidence level according to the independent t test controlled by the false discovery rate method.
3.2.1 Summary of Northern Hemisphere-only wintertime seeding
It is clear that injecting highly efficient seeding particles in our model has widespread effects on ice nucleation in cirrus, with a clear overseeding response for the largest number concentration of seeding particles. We also find impacts on lower-lying mixed-phase clouds similar to those found by Tully et al. (2022a). Figure 9 presents the vertical IWC and liquid water content (LWC) anomalies averaged over the NH during November to February for all r0.01 cases with mass emission scaling. We find a large increase in ice mass in the cirrus regime (T< 238 K, Fig. 9a) that scales with the number of injected seeding particles. As shown above, this is the result of new ice crystal formation onto the injected seeding particles, especially for the high-seeding case, which showed ICNC anomalies that exceeded much of the ICNC in the unseeded cirrus. The smaller ice crystals have reduced sedimentation velocities. This is most pronounced in the mid- and high-seeding cases, where we find negative IWC anomalies in the lower mixed-phase regime. However, the ice crystal radius anomalies for these two cases are smaller than the anomaly for the low-seeding case due to an increase in IWC because of less efficient sedimentation.
The very small positive IWC anomaly for the low-seeding case is likely the result of a small number of ice crystals that formed on seeding particles and grew rapidly and then underwent sedimentation to lower levels in the mixed-phase regime. The reduction of IWC in the mixed-phase regime for the other cases results in an increase in the liquid water mass (Fig. 9b) due to less efficient mixed-phase processes such as riming and the WBF process that consume liquid droplets. For the high-seeding case, this increase in LWC in the mixed-phase regime produces a stronger SW CRE of roughly 1.4 W m−2 (i.e., more negative), but this is outweighed by the large increase in the LW CRE in this case (by 3.5 W m−2) in response to overseeding the cirrus regime (Table 4). The results from seeding in the NH during November to February suggest that the seeder–feeder mechanism (e.g., Choularton and Perry, 1986; Robichaud and Austin, 1988; Reinking et al., 2000; Roe, 2005) appears to be an important source of ice in the mixed-phase regime in our model. This is in line with observations of the seeder–feeder process in orographic clouds (Dore et al., 1999; Borys et al., 2003; Purdy et al., 2005; Proske et al., 2021; Ramelli et al., 2021). However, the main finding is that cirrus clouds in our model show high sensitivity to large perturbations of small INPs. Gasparini et al. (2020), who also used ECHAM–HAM, found a lower sensitivity to seeding INP perturbations. They assumed particles had radii of 50 µm and prescribed a concentration of 1 L−1. Using such large particles in our version of the model (with HAM M9, Sect. 2.2) did not produce any significant signal from seeding. In order to achieve any appreciable signal we had to assume much smaller seeding particles, which based on the number concentration mapping from the mass emissions led to much larger concentrations of seeding INPs. Therefore, our new approach introduces a particle size bias that enhances the sensitivity we find from our model to seeding INP perturbations.
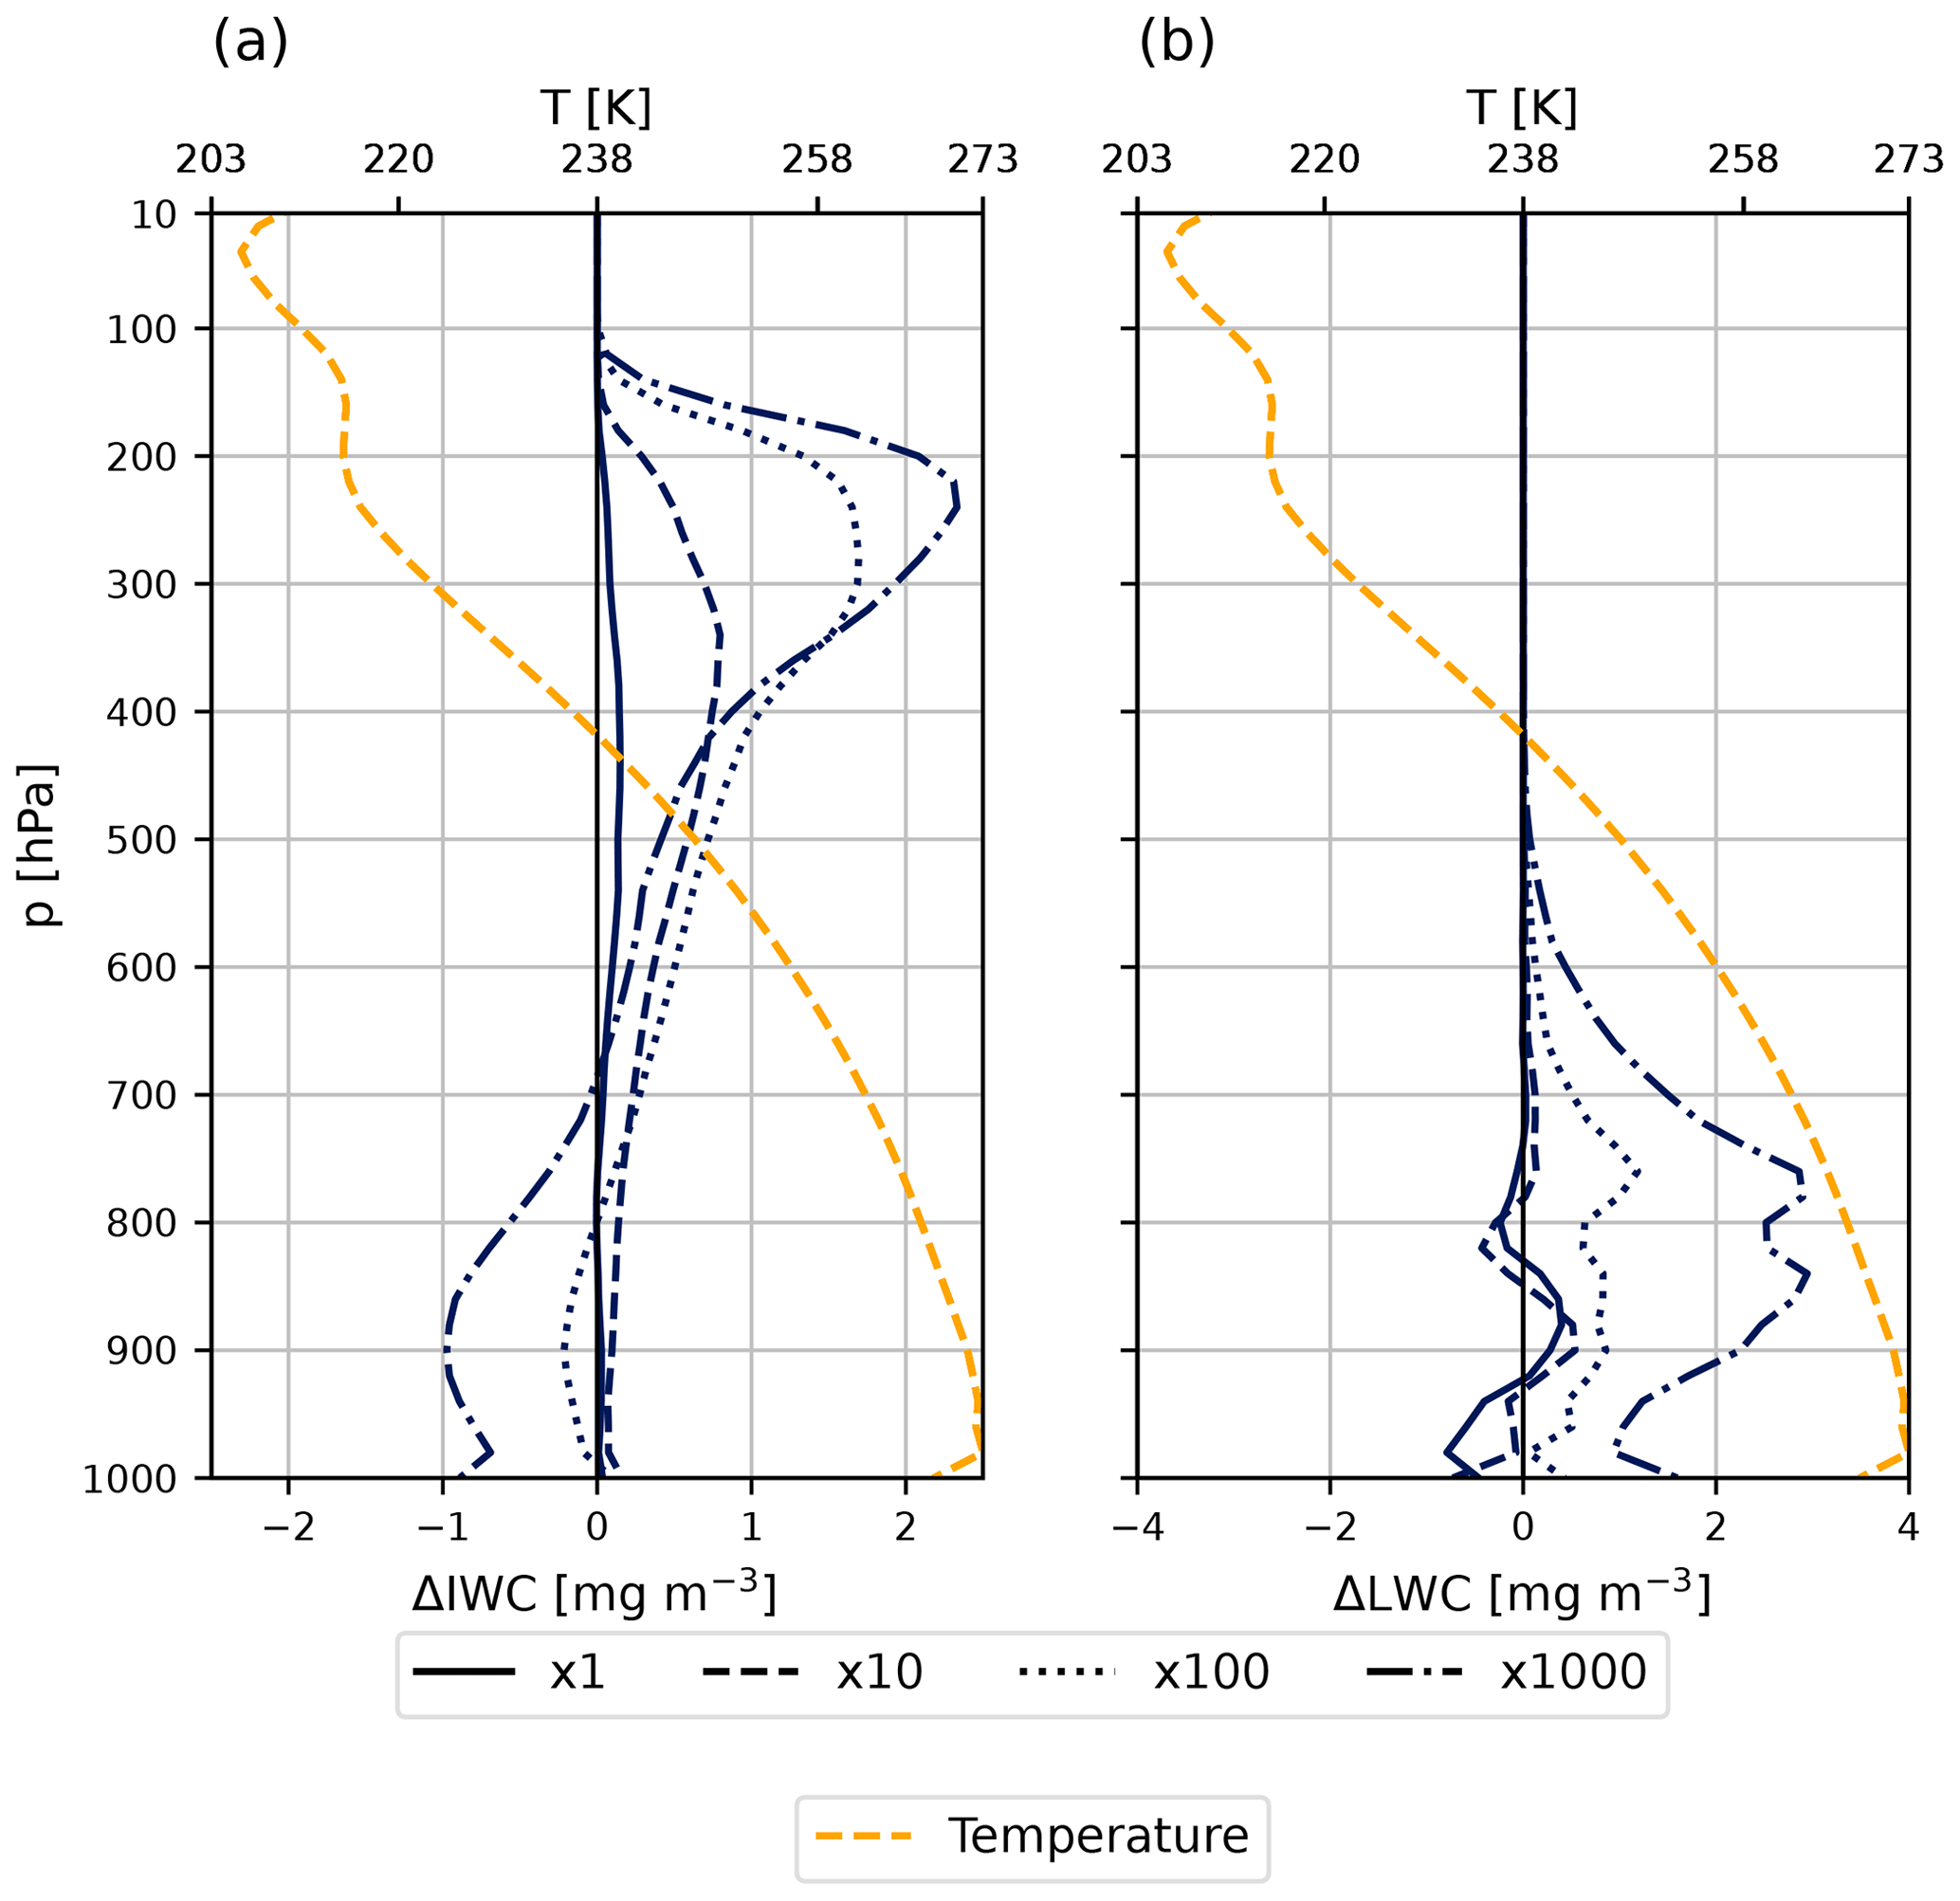
Figure 9Five-year vertical mean IWC (a) and LWC (b) anomalies as a function of pressure for the NH during the period November to February for seeding with an emission radius of 0.01 µm for a mass scaling factor of 1 (solid line), 10 (dashed line), 100 (dotted line), and 1000 (dot-dashed line). The orange dotted line represents the 5-year NH November–February mean vertical profile of temperature centered around the demarcation of the cirrus regime (238 K).
3.3 Discussion
The aim of CCT efforts is to create a switch in the dominant ice formation mechanism in cirrus away from homogeneous nucleation and toward heterogeneous nucleation (Storelvmo et al., 2013). Our results show that we achieve this switch; however, it is significant on the 95 % confidence level only for the r0.01 high-seeding case for both global and NH wintertime seeding scenarios. On top of that, the seeding particle number concentration in this case is so high, >105 L−1, that the number of ice crystals formed on these particles exceeds the ICNC in the reference unseeded case, originating from both homogeneous and heterogeneous nucleation. In fact, by injecting such a large concentration of seeding particles that can initiate ice formation at a relatively low Si of 1.05, we find that heterogeneous nucleation processes on background mineral dust and soot INPs are suppressed. However, we found that this leads to additional ice formation on background particles in the UTLS through radiative feedback mechanisms that contribute to the large warming effect we find from overseeding.The overseeding responses are similar to previous CCT findings using ECHAM–HAM, namely Gasparini and Lohmann (2016) and Tully et al. (2022a). However, these past studies used globally uniform distributions of seeding particles with radii of 0.5 µm and number concentration maxima of 100 L−1. Using the same seeding particle radius following our new prognostic approach resulted in a maximum concentration that just exceeded 10−4 L−1 (Appendix A). The efficacy of seeding with larger particles (radii of 50 µm) was examined by Gasparini et al. (2017) and extended by Gasparini et al. (2020). The earlier study tested several number concentrations of seeding particles, but they found the largest cooling effect of −0.85 W m−2 for a seeding particle concentration of 1 L−1, which was also found by the latter study. Following our new approach, this size of seeding particle corresponded to a number concentration that was several orders of magnitude smaller ( L−1, Appendix A) and produced negligible effects on the TOA radiative balance as well as on cirrus properties.
By assuming smaller seeding particle radii and by scaling the mass emissions, we found seeding particle concentrations around the same order of magnitude to those used by Tully et al. (2022a). For example, the r0.01 low-seeding and r0.1 high-seeding cases showed maximum seeding particle number concentrations between 100 and 1000 L−1, exceeding the maximum concentration of 100 L−1 used by Tully et al. (2022a). While for the r0.01 low-seeding case this led to a small warming of about 0.3 W m−2, for the r0.1 high-seeding case this led to a small cooling of 0.02 W m−2. However, both of these signals are highly uncertain on the 95 % confidence level (Table 3). On the one hand, this means that the chance of producing an overseeding effect by using a more variable spatial and temporal distribution of seeding particles following our new approach is greatly reduced. On the other hand we introduce a bias with this new aircraft seeding approach as we only find a significant signal when we assume the smallest seeding particles (radius =0.01 µm) with large mass emission scaling factors (×100 and ×1000). This means that it is more likely to produce smaller ice crystals with our new seeding approach, which is exactly what we found for all of the r0.01 cases and some of the r0.1 cases (Figs. 5 and 7). It is unclear whether using such small seeding particles is a feasible approach to represent a real-world seeding scenario as larger particles are typically favored as INPs in the atmosphere. While recent research suggests that smaller particles may be ice active (e.g., pollen and fungal spores, Kanji et al., 2017), it is also unclear if this also applies to cirrus conditions.
One clear finding is that we can also confirm that seeding tropical regions is undesired (Storelvmo and Herger, 2014; Storelvmo et al., 2014; Gasparini et al., 2017). In these regions we find that seeding particles are either ineffective at shutting off homogeneous nucleation or are so effective they overtake this process to produce more ice crystals that existed in the unperturbed cirrus. When we restrict seeding particle emissions to the NH wintertime, we also only find either warming from overseeding or small and insignificant effects with lower seeding particle concentrations. This is partly due to background assumptions in our cirrus model pertaining to the role of pre-existing ice crystals. Gasparini et al. (2020) and Tully et al. (2022a) note that the inclusion of vapor deposition onto pre-existing ice crystals makes CCT less effective than models that did not include this process (e.g., Storelvmo et al., 2013; Storelvmo and Herger, 2014; Storelvmo et al., 2014), due to saturation quenching that reduces Si and prevents homogeneous nucleation from occurring as frequently in the unseeded cirrus. Recent in situ measurements suggest that the inclusion of pre-existing ice in our model may be overpredicted. Dekoutsidis et al. (2023) analyzed lidar water vapor measurements to assess the in-cloud relative humidity with respect to ice (RHi) in cirrus. They found that RHi values often reached the homogeneous nucleation limit (140 %) near cloud top, which coincides with the region within a cloud where new ice crystal formation preferentially occurs. After new ice crystals form, they may grow quickly and sediment and not necessarily have a large impact on in-cloud RHi at cloud top. Our model does not include sufficient vertical resolution (roughly 700 m at cirrus levels, Gasparini and Lohmann, 2016) to resolve the vertical humidity structure in cirrus. This represents a motivation for future work that could aid in resolving the role of pre-existing ice in cirrus, which would have large implications on the efficacy of CCT.
Finally, our results also call into question the reliability of CCT to act as a CI strategy. Specifically, the proposed delivery method of seeding material via commercial aircraft is uncertain as based on our results this introduces a particle size bias in order to achieve a significant signal.
In this study, we made the first attempt in a GCM to simulate CCT using a fully prognostic aerosol species specifically for cirrus seeding particles. We achieved this by extending the seven-mode aerosol microphysics model, HAM (Stier et al., 2005; Zhang et al., 2012; Tegen et al., 2019), to include two extra modes to simulate the atmospheric evolution of internally and externally mixed seeding particles made of bismuth triiodide (Mitchell and Finnegan, 2009). Seeding particle emissions were assumed to follow aircraft emissions of black carbon (soot) particles, following the proposed real-world delivery mechanism (Mitchell and Finnegan, 2009). We found that compared to assuming a globally uniform seeding particle distribution, using aircraft emissions drastically reduces the number concentration of seeding particles available as INPs in our cirrus sub-model. However, this requires using much smaller seeding particles with high mass emission scaling in order to achieve a significant signal, which we found always led to overseeding and associated warming.
Aerosol–ice-cloud interactions remain one of the largest uncertainties in the understanding of the climate system (Storelvmo, 2017; Bellouin et al., 2020). This knowledge gap impacts the ability to assess the efficacy of CCT to act as a feasible CI strategy, with widely different responses from different models. There are a number of lines of work that could be addressed in this regard. First, while new evidence suggests that mineral dust is the most prevalent INP species in cirrus globally, with peaks downstream of large source regions (Froyd et al., 2022), it is unclear what role this plays in remote regions like the Arctic. Second, emitting seeding particles from commercial aircraft or from uncrewed drones was proposed as a potential delivery mechanisms in the real world by Mitchell and Finnegan (2009) and Mitchell et al. (2011), respectively. However, aircraft emissions of soot contribute an uncertain effect on cirrus, mostly from uncertainty surrounding the ability of soot to act as an INP (Mahrt et al., 2018, 2020; Lee et al., 2021). In addition, seeding with uncrewed drones could increase the efficiency of potential seeding campaigns by offering dedicated flight paths but could also be very expensive and associated with legal as well as ethical issues. Finally, our results also showed that INP perturbations in the cirrus regime (T< 238 K) had effects on clouds in warmer temperature regimes, namely mixed-phase clouds, which highlighted the importance of the seeder–feeder mechanism in our model. Further work investigating this mechanism under unperturbed scenarios (i.e., without INP injections for CCT) in our model would be useful to understand its importance on mixed-phase processes, including precipitation formation. Overall, however, with such high uncertainty surrounding INP perturbation effects on cirrus, we recommend that more observational evidence is needed on cirrus formation mechanisms and the impact that natural and anthropogenic aerosols have on cirrus properties before further modeling studies proceed with assessing CCT.
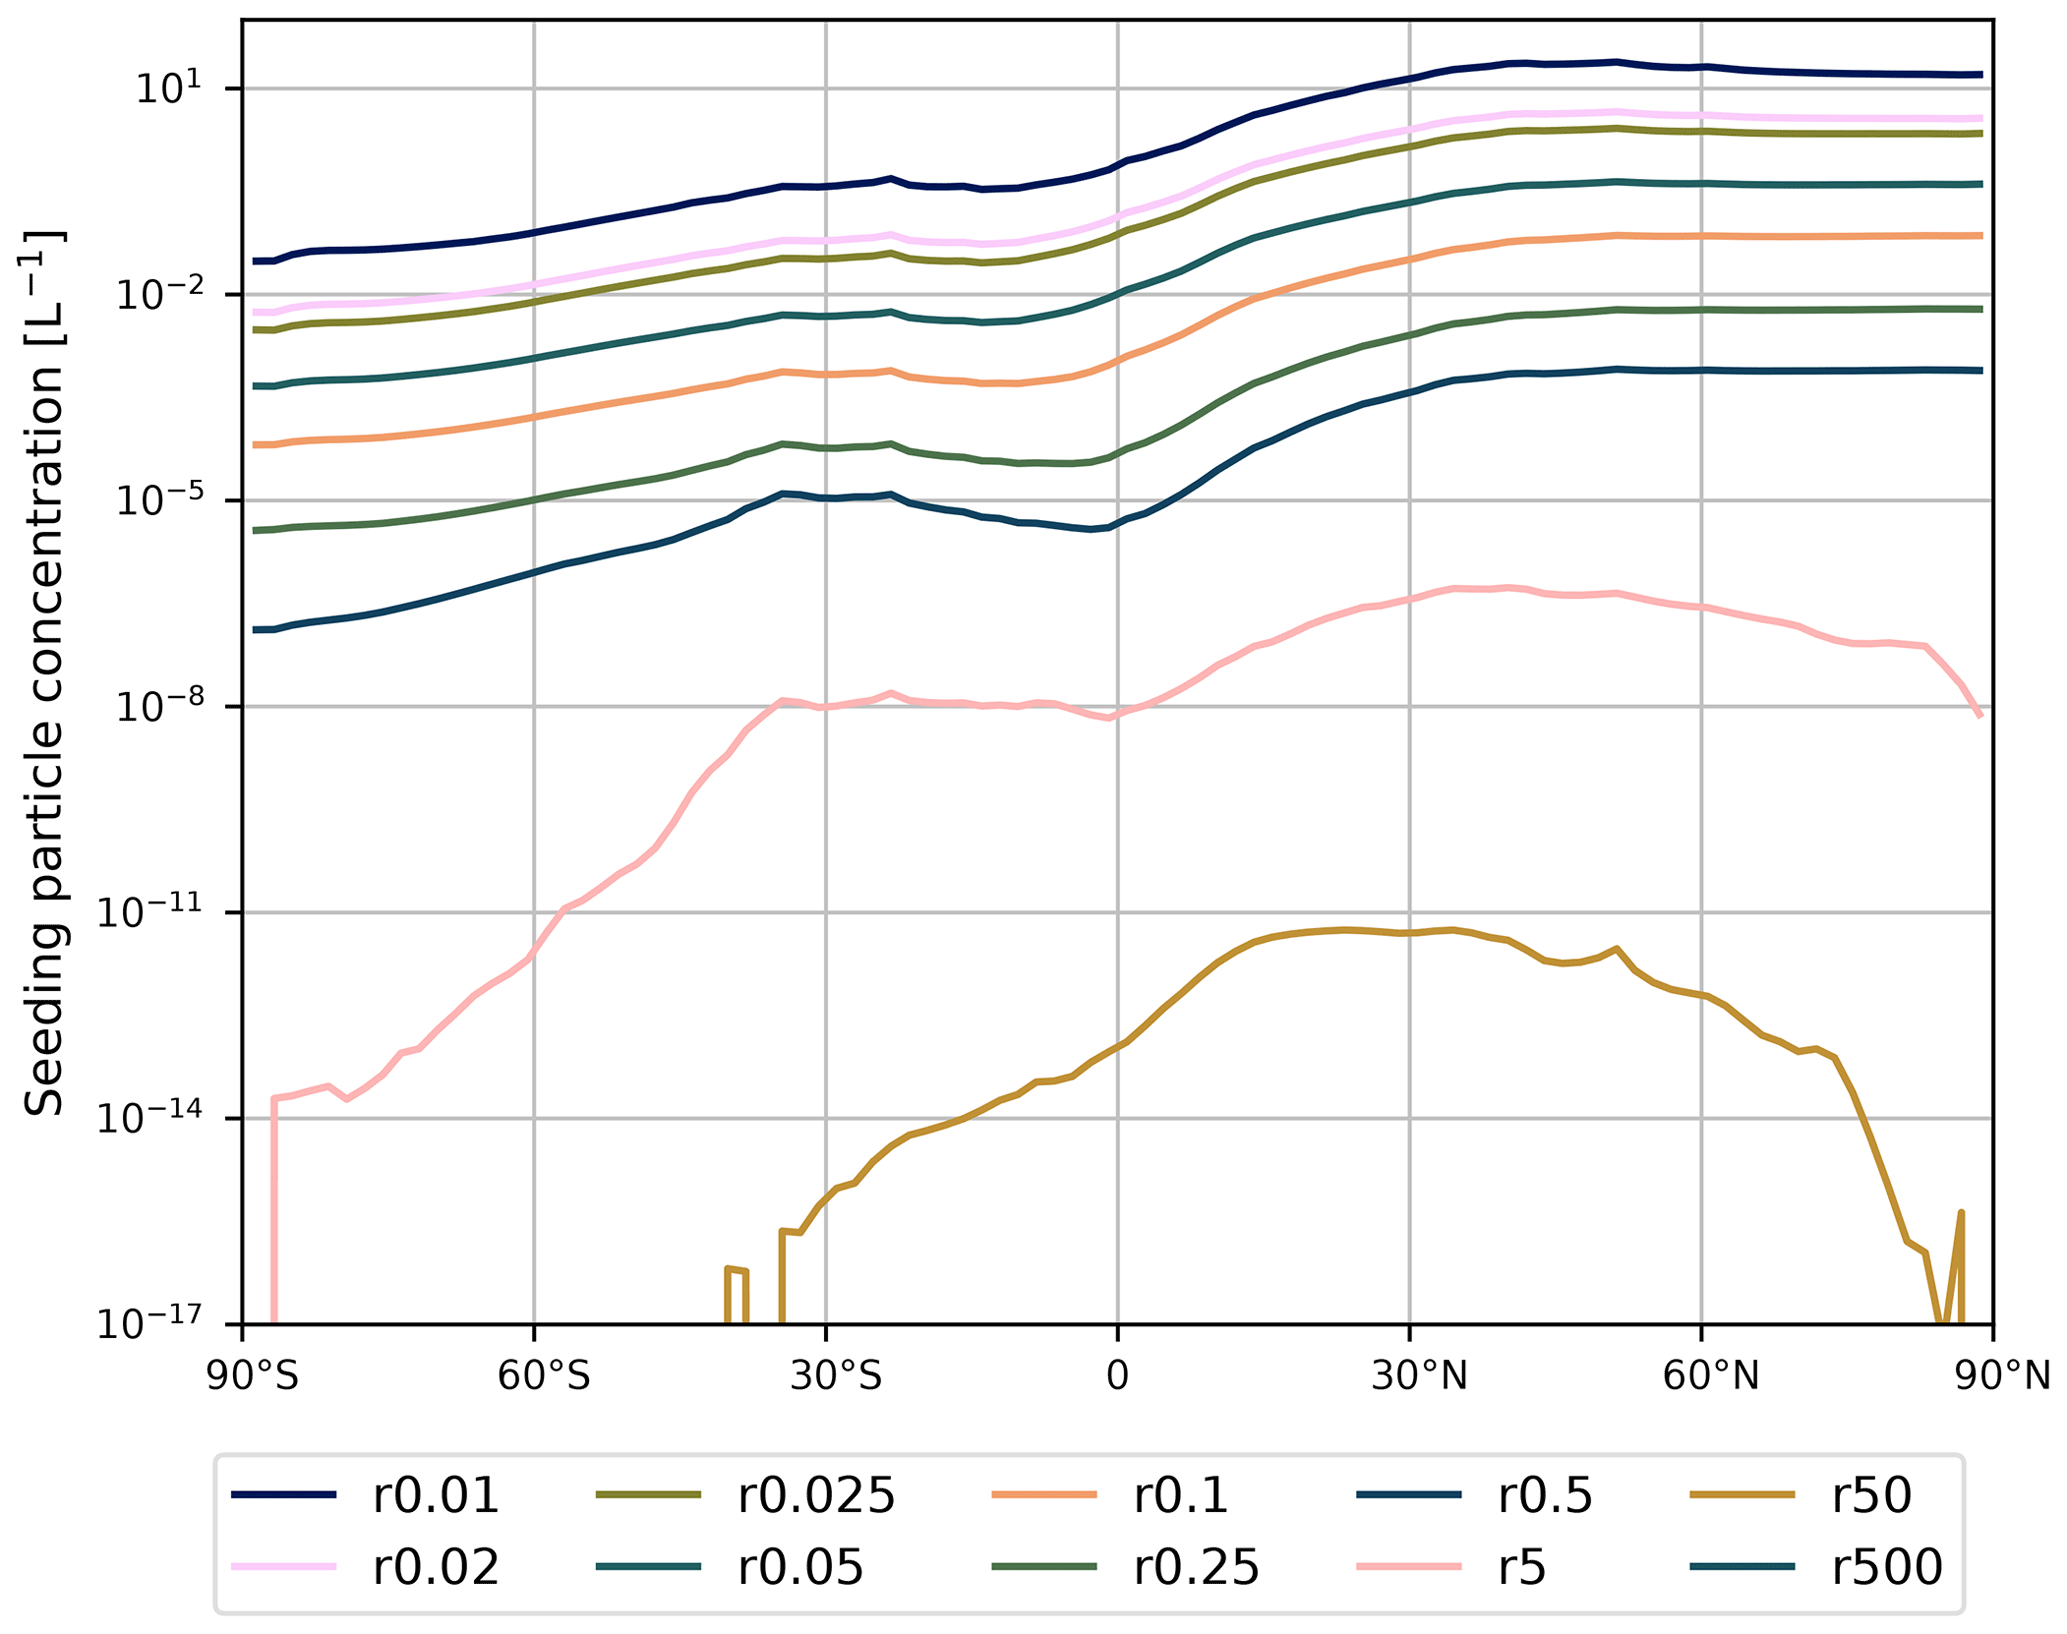
Figure A1Five-year zonal mean seeding particle concentrations (in L−1) for the 10 initial tests conducted for prognostic seeding following aircraft emissions. Each color represents one of the seeding particle radii that we tested: 0.01, 0.02, 0.025, 0.05, 0.1, 0.25, 0.5, 1, 5, 50, and 500 µm. Note that the number concentration of seeding particles for the case with a radius of 500 µm was so low that it does not show on this scale.
Figure B1 presents the 5-year annual zonal mean cirrus ice source anomalies for the sources of heterogeneous nucleation for the extreme r0.01 high-seeding case as described in the main text. The sources of heterogeneous nucleation include background mineral dust (ICNC dust) and soot (ICNC soot) particles, as well as cirrus seeding particles (ICNC seed). In this extreme scenario ice nucleation onto the high concentration of seeding particles not only overtakes homogeneous nucleation, but also that on background INPs as shown by the negative anomalies in Fig. B1b and d. As described in the main text, outside of the tropics this large increase in the number of new ice crystals in the UTLS (above the black line in Fig. B1f) releases latent heat that warms this region and prevents cold temperatures required for homogeneous nucleation. However, this allows heterogeneous nucleation on the small number of background mineral dust particles to also nucleate in this region. Thus, we find positive ICNC dust anomalies in the UTLS outside of the tropics by up to 100 L−1 (Fig. B1b).
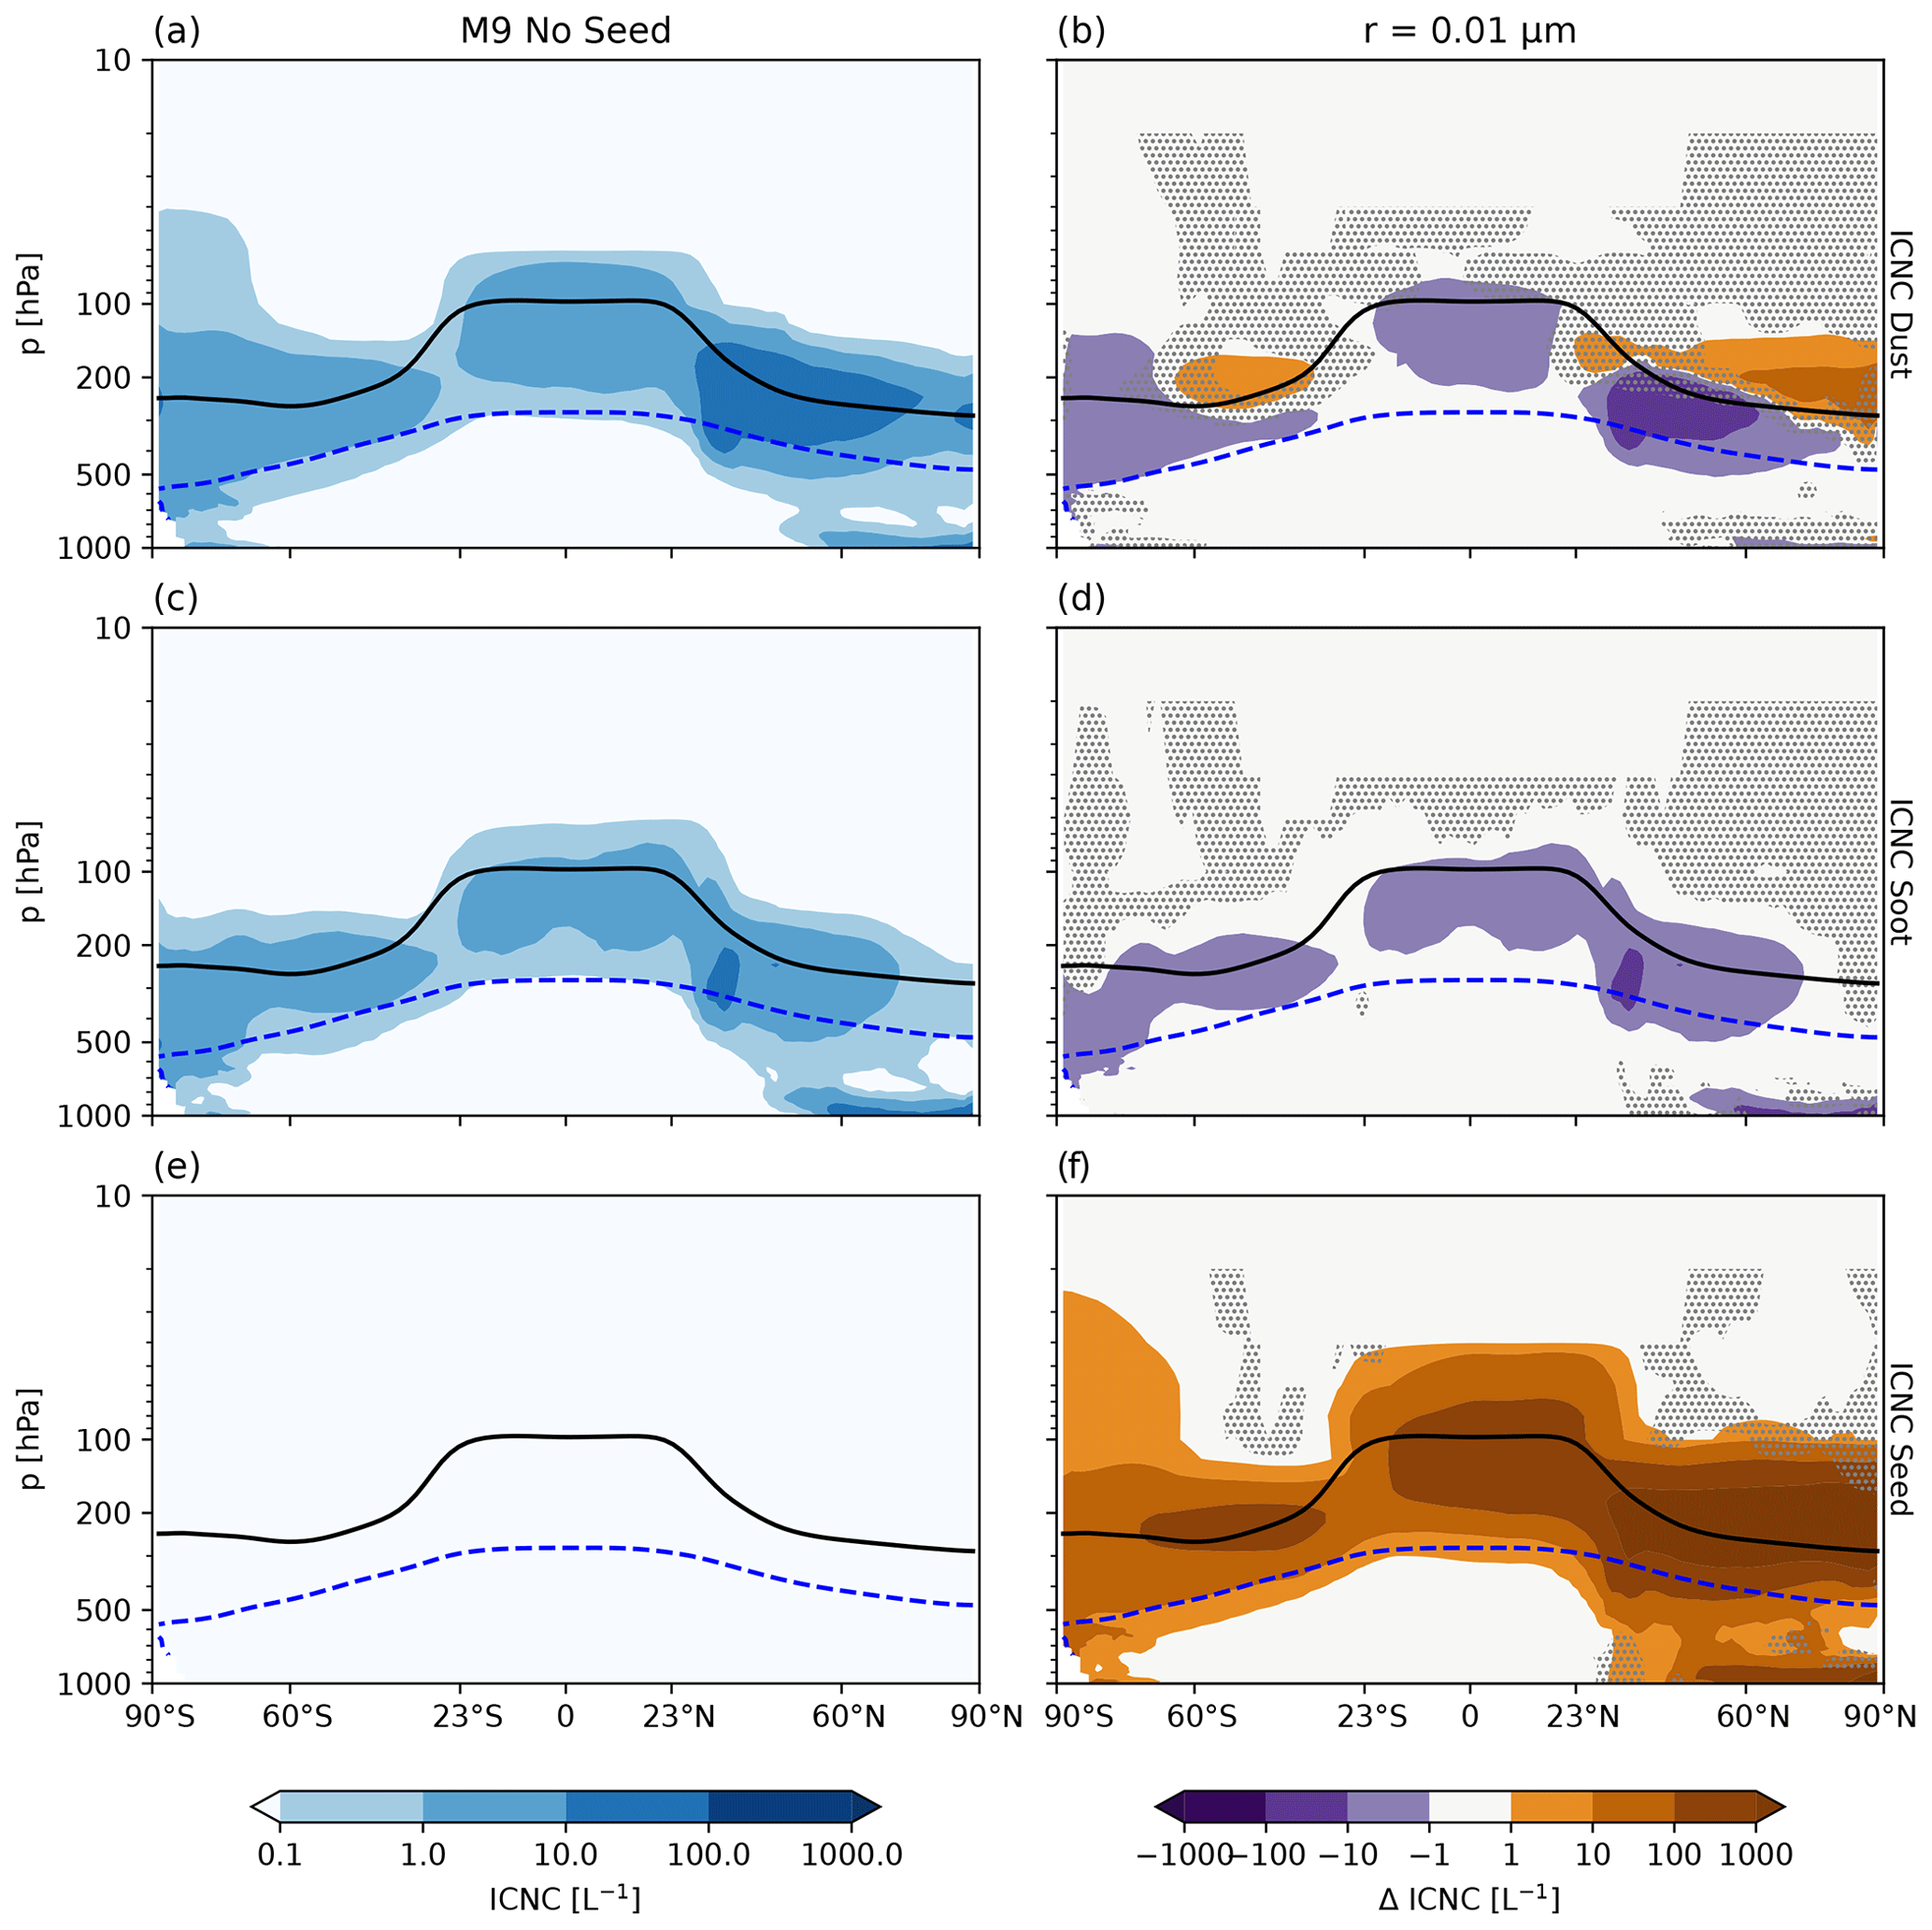
Figure B1Five-year annual zonal mean in situ cirrus heterogeneous nucleation ice sources in per liter (L−1) for the unseeded reference case in the first column and the anomalies for the seeding scenario r0.01 high seeding (emission radius of 0.01 µm and a mass emission scaling factor of 1000) in the second column. Each row represents a heterogeneous nucleation source for mineral dust (first row), soot (second row), and seeding particles (third row). The black line denotes the WMO-defined tropopause, and the blue dashed line is the 238 K temperature contour. The stippling denotes insignificant data points at the 95 % confidence level according to the independent t test controlled by the false discovery rate method.
Table C1Five-year NH mean net TOA and net CRE radiative balance anomalies in watts per square meter (W m−2), as well as their SW and LW components for the period between November and February for each of the seeding particle emission radii tested for the NH wintertime seeding scenario. Each quantity includes the 95 % confidence interval equating to 2 standard deviations of the mean values of the 5-year data set. Values in bold denote those that are statistically distinct from zero based on the 95 % confidence level.
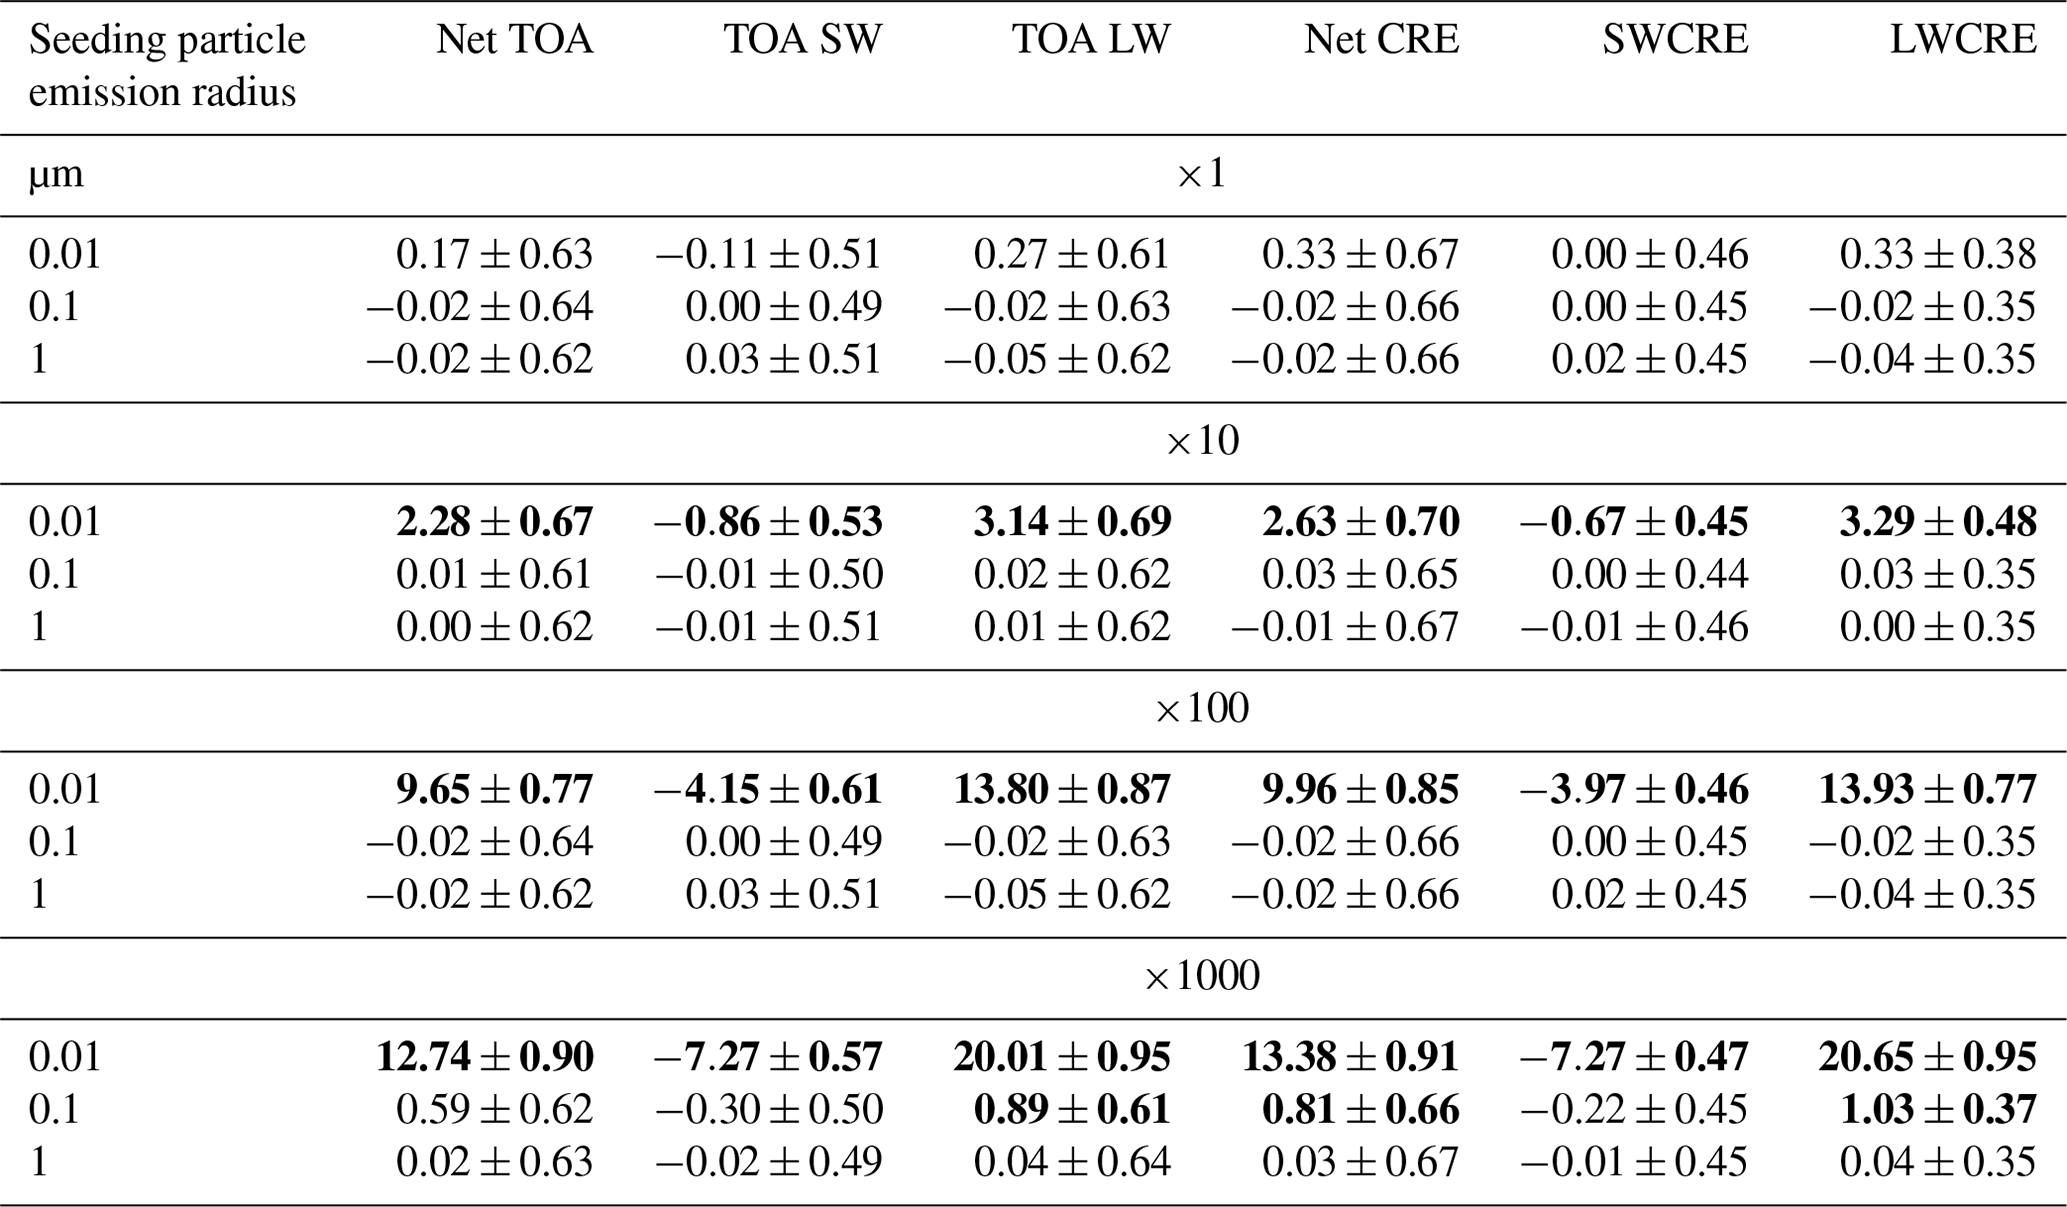
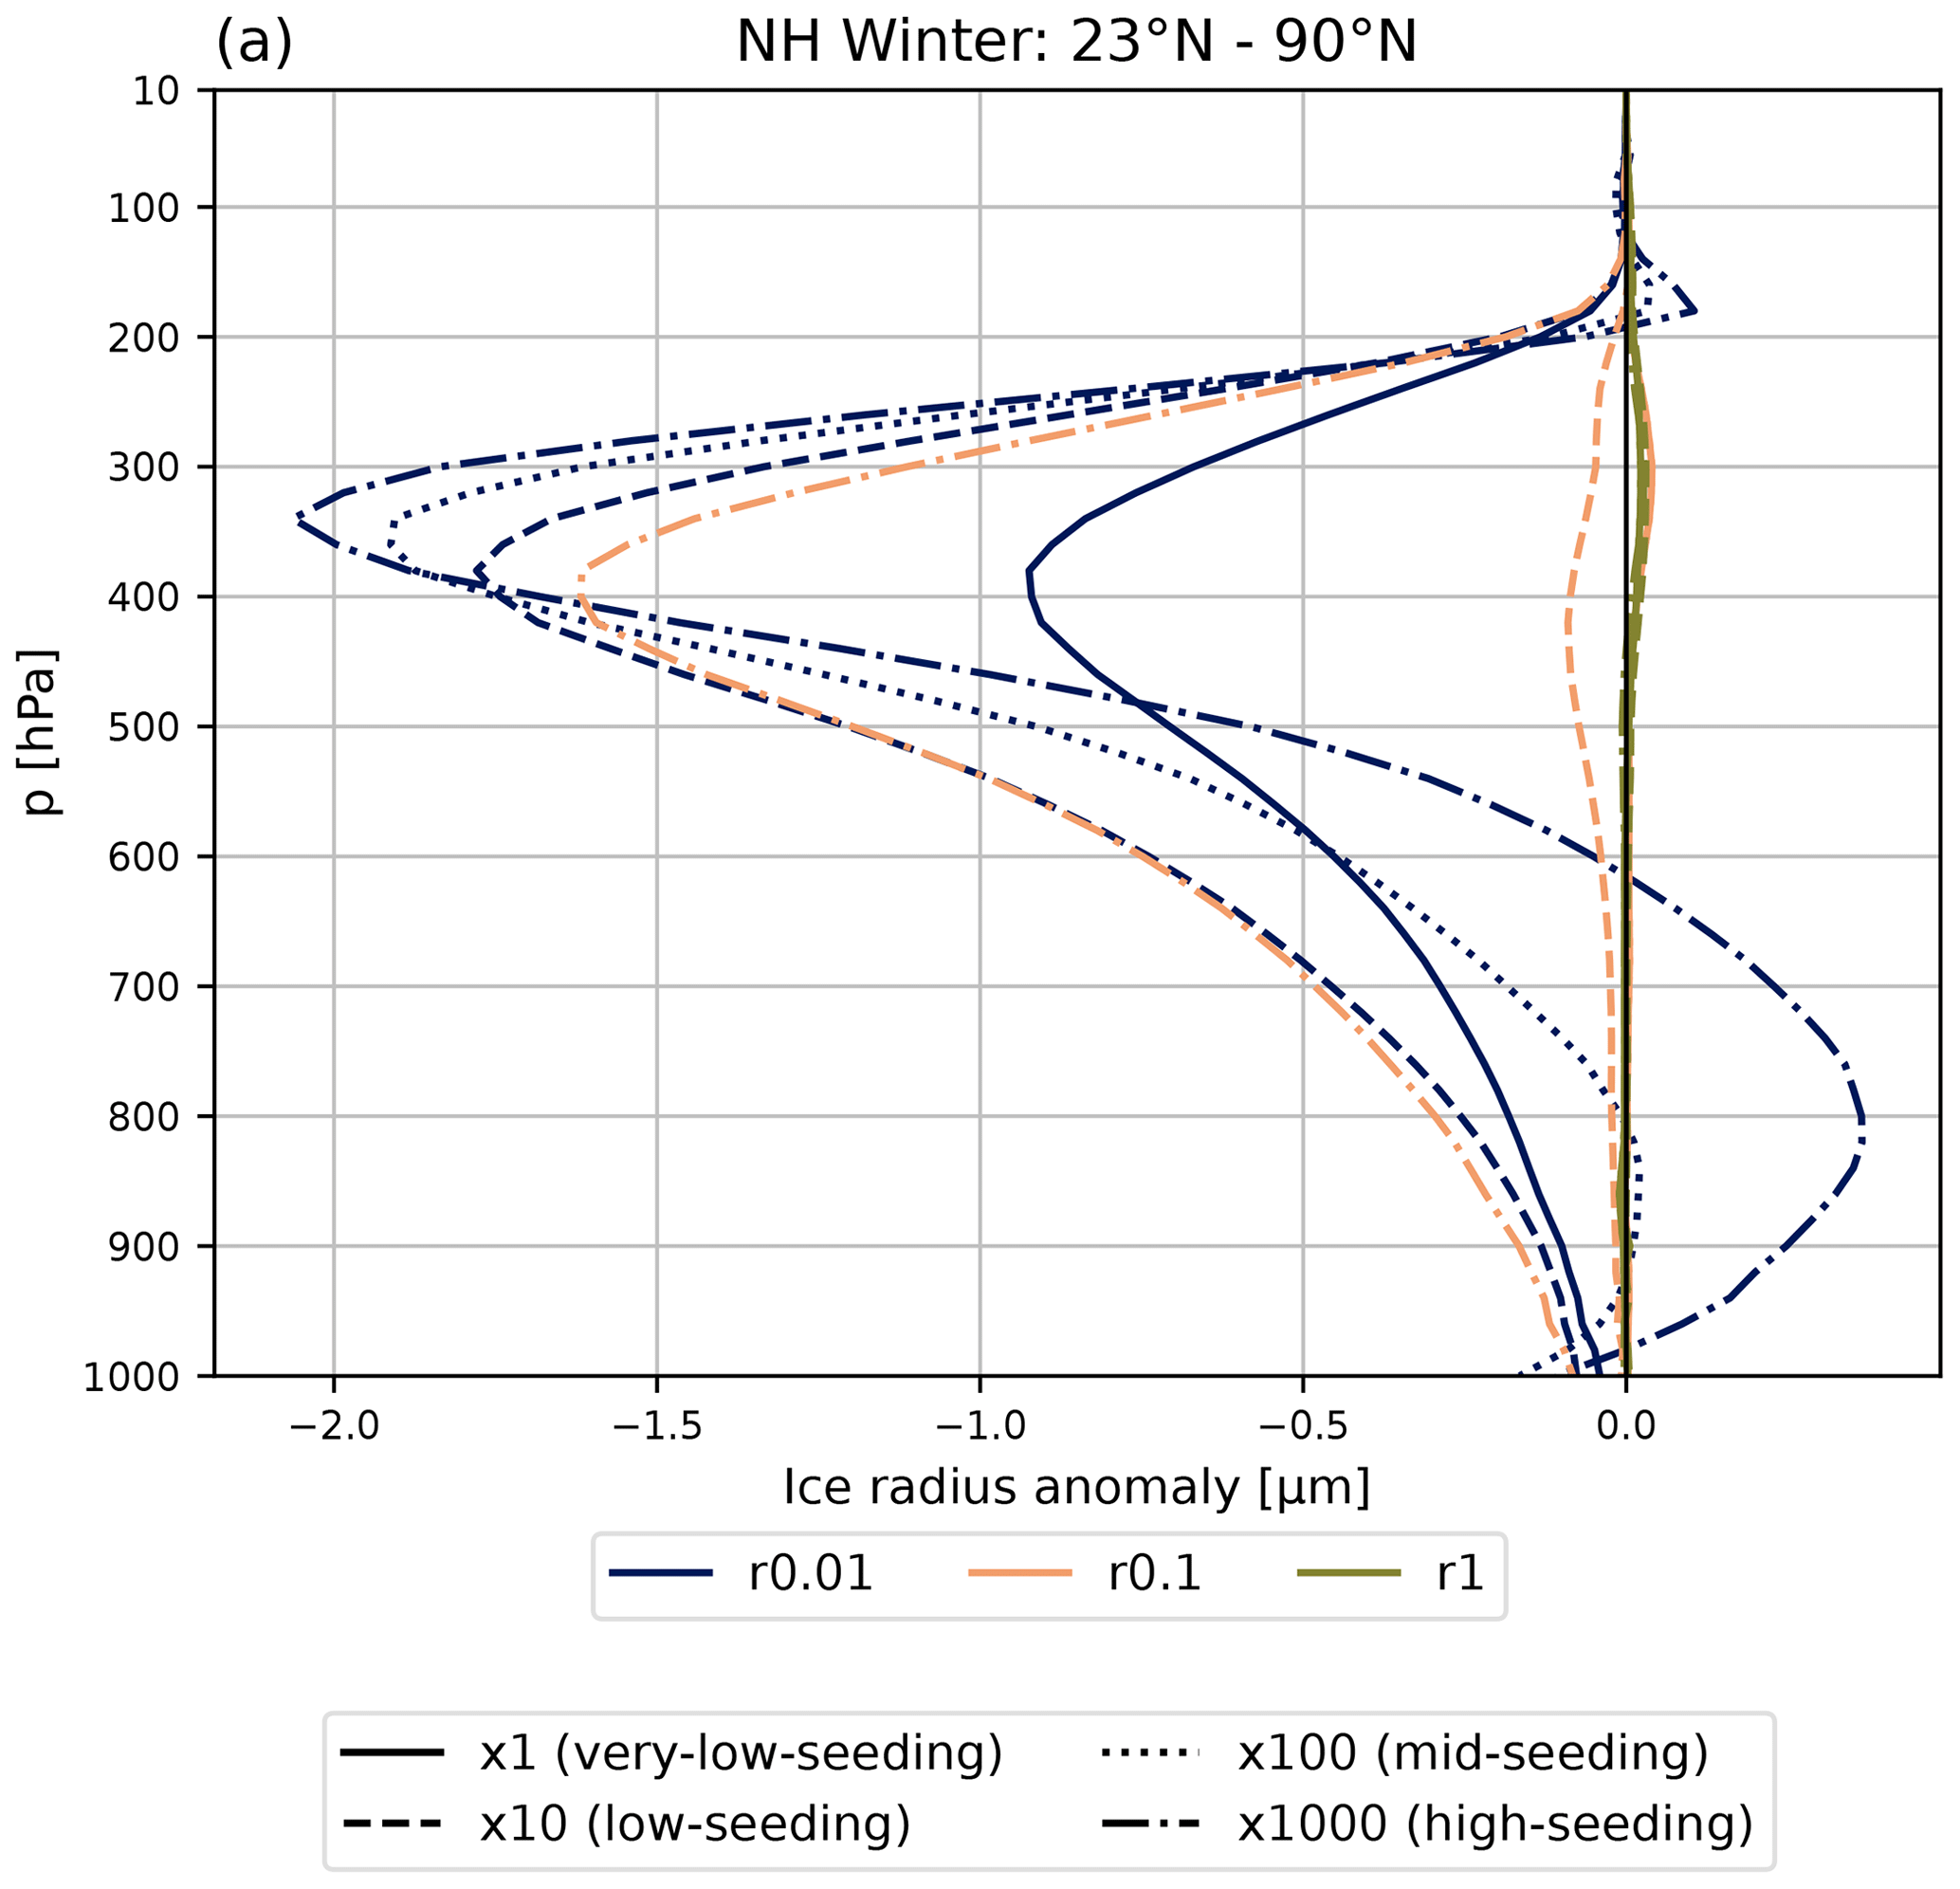
Figure C1Like Fig. 5 in the main text. Five-year global mean ice crystal effective radius anomalies (in µm) for the 12 different global seeding cases tested in the model for the NH during winter between 23 and 90∘ N. Each color represents one of the three emission radii: 0.01 µm (dark blue), 0.1 µm (orange), and 1 µm (olive green). Emission mass scaling factors are represented by each line style: ×1 (solid), ×10 (dashed), ×100 (dotted), and ×1000 (dot-dashed).
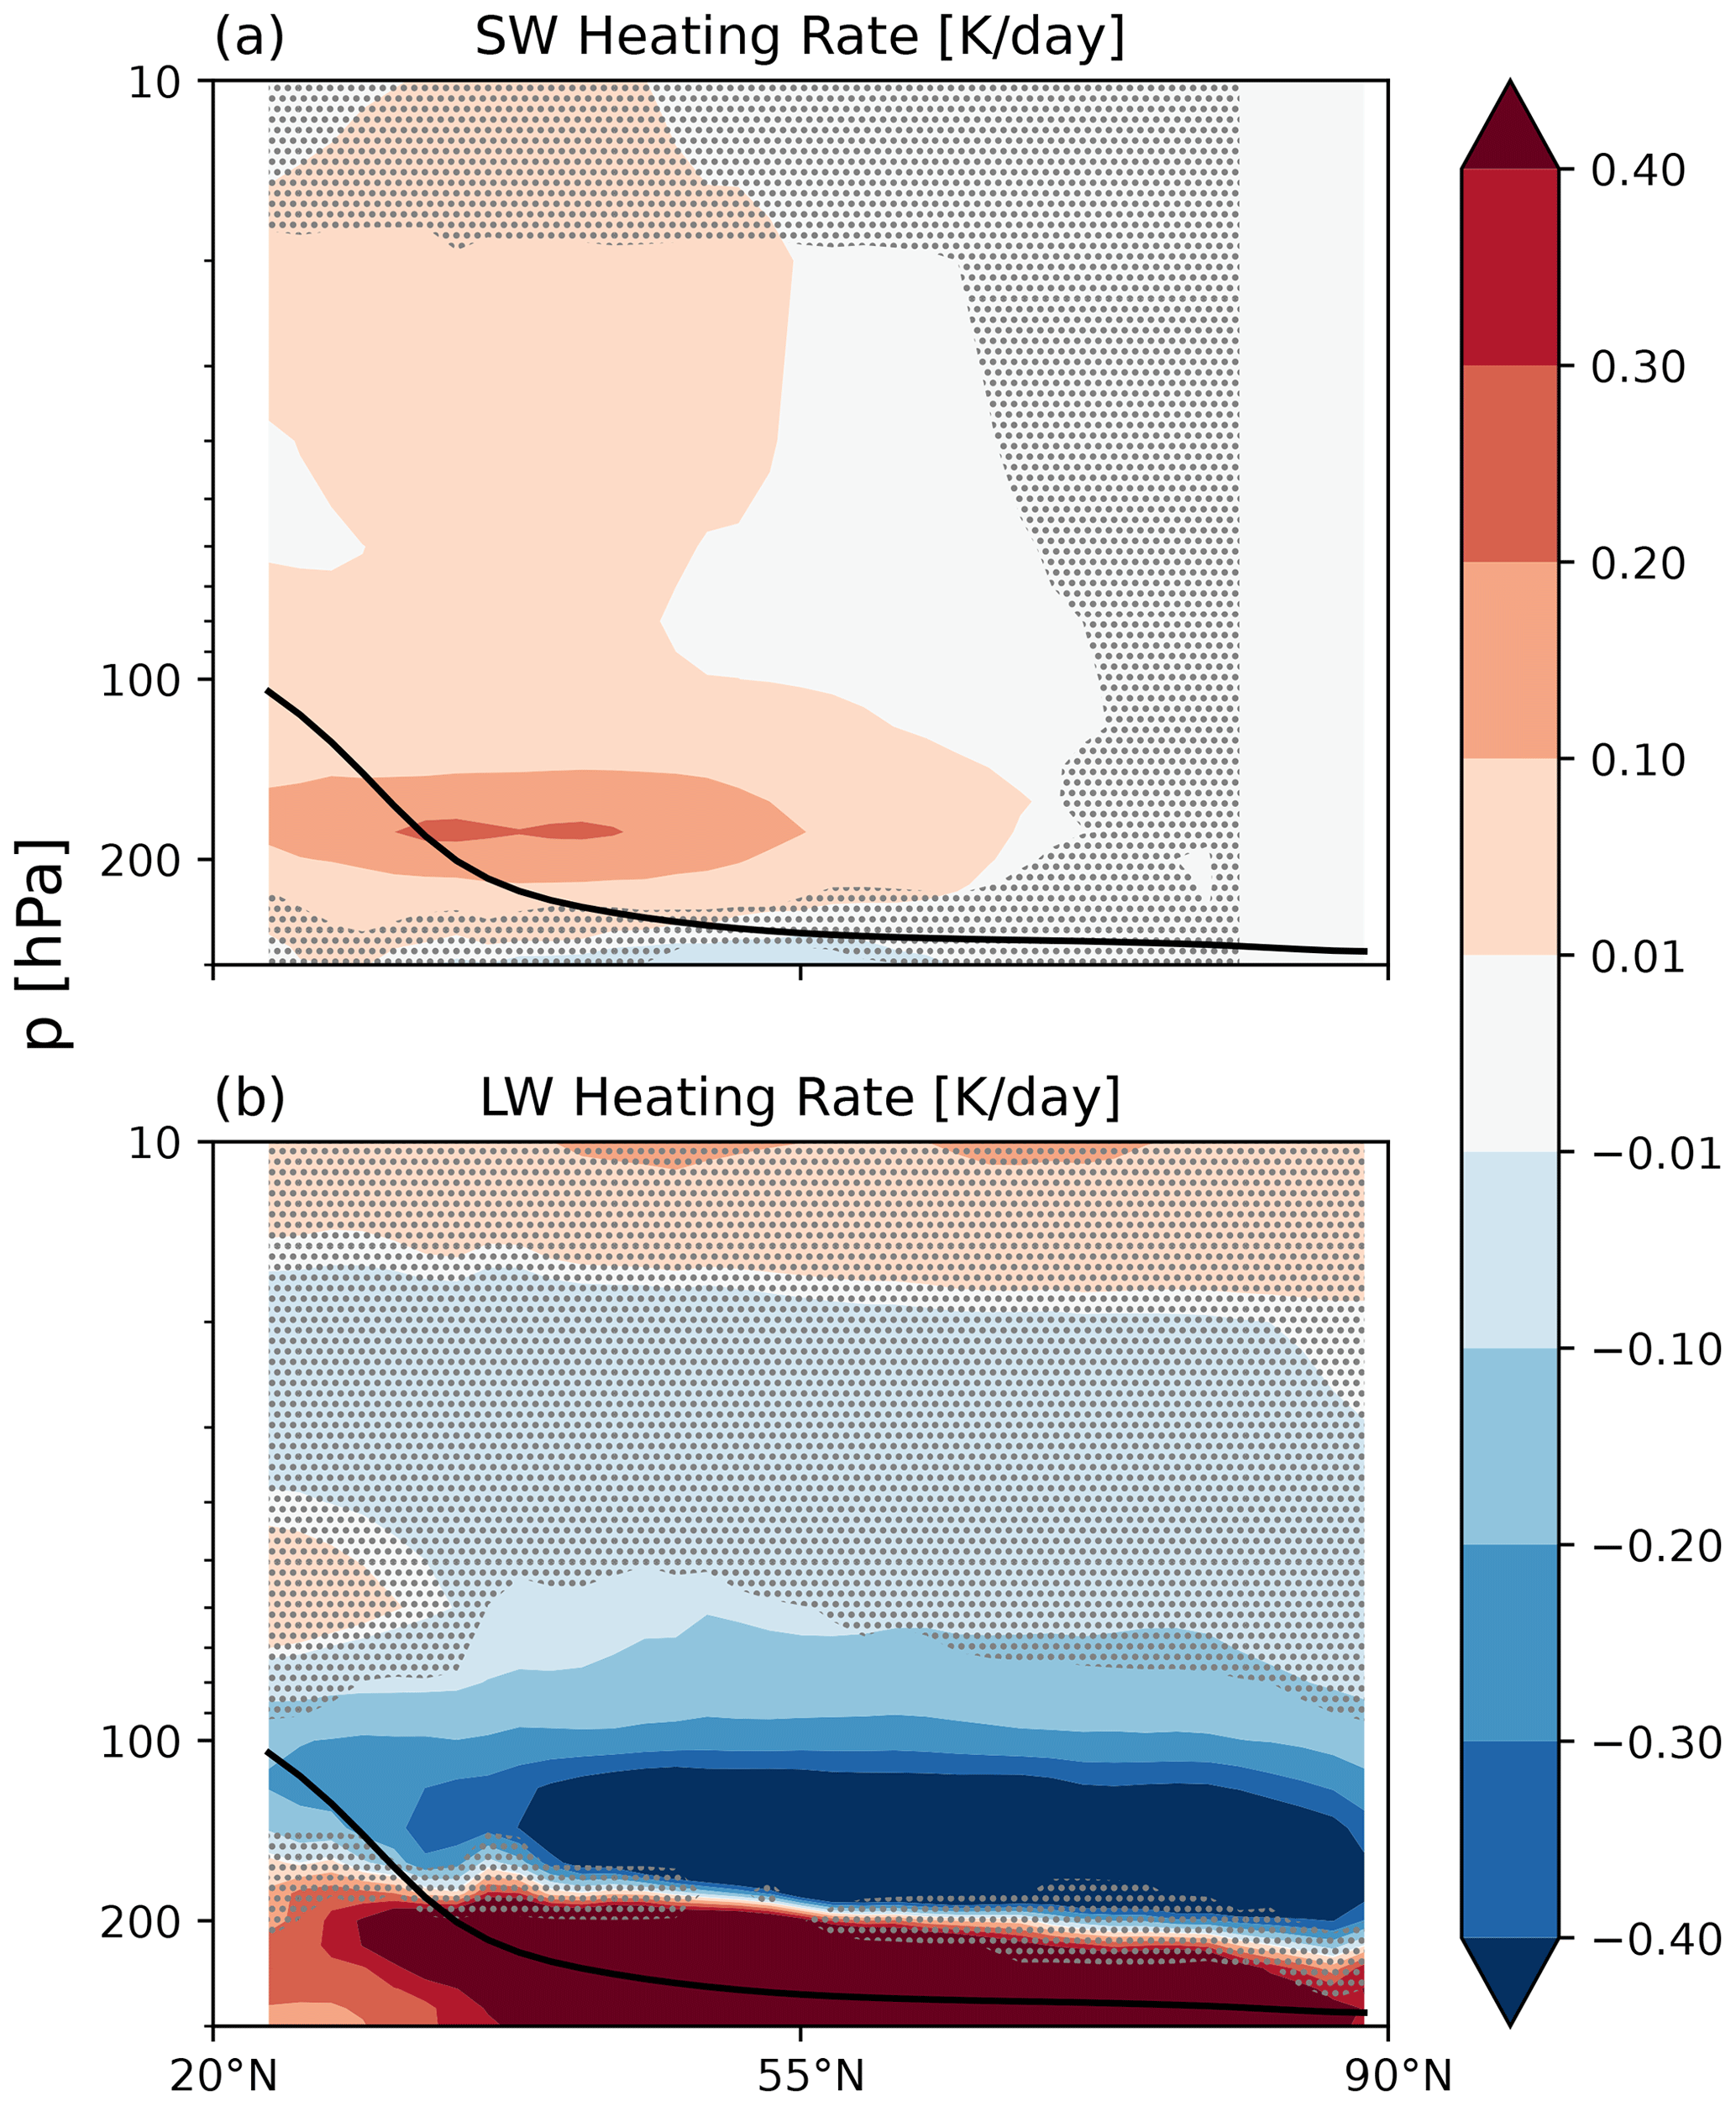
Figure C2Five-year Northern Hemisphere zonal mean SW and LW heating rate anomalies in kelvins per day (K d−1) for the r0.01 high-seeding case (emission radius of 0.01 µm and a mass emission scaling factor of 1000) for the period November to February. The black line denotes the WMO-defined tropopause, and the blue dashed line is the 238 K temperature contour. The stippling denotes insignificant data points at the 95 % confidence level according to the independent t test controlled by the false discovery rate method.
The ECHAM-HAMMOZ model is freely available to the scientific community under the HAMMOZ Software License Agreement, which defines the conditions under which the model can be used (https://redmine.hammoz.ethz.ch/projects/hammoz/wiki/2_How_to_get_the_sources, Ferrachat, 2013). The version of the code used for this study is archived in a Zenodo repository at https://doi.org/10.5281/zenodo.8085946 (Tully et al., 2023). Additional information about the model can be found on the HAMMOZ website (https://redmine.hammoz.ethz.ch/projects/hammoz/wiki/Echam630-ham23-moz10, Ferrachat, 2017). The box model that is based on the ECHAM–HAM code that was used to produce the heterogeneous nucleation-only plots in this paper and other post-processing and analysis scripts are archived on Zenodo (https://doi.org/10.5281/zenodo.7779833, Tully et al., 2022c). The processed GCM output data to produce the relevant plots in this paper are also available on Zenodo ((Tully et al., 2022b), https://doi.org/10.5281/zenodo.7298771).
CT extended the aerosol microphysics model, HAM, to include two prognostic aerosol species for seeding particles. CT, DN, and DV worked together to verify this approach and update the in-cloud scavenging procedure in the wet deposition scheme. CT and UL designed the experiments, and CT ran the model simulations, analyzed the data, including running the post-processing and plotting scripts, and wrote the manuscript with comments from all co-authors. UL and DV helped with the interpretation of the results.
The contact author has declared that none of the authors has any competing interests.
Publisher's note: Copernicus Publications remains neutral with regard to jurisdictional claims in published maps and institutional affiliations.
This project is funded by the European Union under the grant agreement no. 875036 (ACACIA). This work was also supported by a grant from the Swiss National Supercomputing Centre (CSCS) under project ID s1144.
This research has been supported by the European Commission Horizon 2020 Framework Programme (grant no. 875036).
This paper was edited by Xiaohong Liu and reviewed by Martina Krämer and David Mitchell.
Albrecht, B. A.: Aerosols, Cloud Microphysics, and Fractional Cloudiness, Science, 245, 1227–1230, https://doi.org/10.1126/science.245.4923.1227, 1989. a
Bellouin, N., Quaas, J., Gryspeerdt, E., Kinne, S., Stier, P., Watson-Parris, D., Boucher, O., Carslaw, K. S., Christensen, M., Daniau, A.-L., Dufresne, J.-L., Feingold, G., Fiedler, S., Forster, P., Gettelman, A., Haywood, J. M., Lohmann, U., Malavelle, F., Mauritsen, T., McCoy, D. T., Myhre, G., Mülmenstädt, J., Neubauer, D., Possner, A., Rugenstein, M., Sato, Y., Schulz, M., Schwartz, S. E., Sourdeval, O., Storelvmo, T., Toll, V., Winker, D., and Stevens, B.: Bounding Global Aerosol Radiative Forcing of Climate Change, Rev. Geophys., 58, e2019RG000660, https://doi.org/10.1029/2019RG000660, 2020. a
Bergeron, T.: On the physics of clouds and precipitation, Proc. 5th Assembly U.G.G.I., Lisbon, Portugal, 1935, pp. 156–180, https://cir.nii.ac.jp/crid/1573105975504427392 (last access: 8 November 2022), 1935. a
Berrisford, P., Dee, D., Poli, P., Brugge, R., Fielding, M., Fuentes, M., Kållberg, P., Kobayashi, S., Uppala, S., and Simmons, A.: The ERA-Interim archive Version 2.0, p. 23, https://www.ecmwf.int/node/8174 (last access: 8 November 2022), 2011. a
Borys, R. D., Lowenthal, D. H., Cohn, S. A., and Brown, W. O. J.: Mountaintop and radar measurements of anthropogenic aerosol effects on snow growth and snowfall rate, Geophys. Res. Lett., 30, 1538, https://doi.org/10.1029/2002GL016855, 2003. a, b
Brinkop, S. and Roeckner, E.: Sensitivity of a general circulation model to parameterizations of cloud–turbulence interactions in the atmospheric boundary layer, Tellus A, 47, 197–220, https://doi.org/10.1034/j.1600-0870.1995.t01-1-00004.x, 1995. a
Choularton, T. W. and Perry, S. J.: A model of the orographic enhancement of snowfall by the seeder-feeder mechanism, Q. J. Roy. Meteor. Soc., 112, 335–345, https://doi.org/10.1002/qj.49711247204, 1986. a
Croft, B., Lohmann, U., Martin, R. V., Stier, P., Wurzler, S., Feichter, J., Posselt, R., and Ferrachat, S.: Aerosol size-dependent below-cloud scavenging by rain and snow in the ECHAM5-HAM, Atmos. Chem. Phys., 9, 4653–4675, https://doi.org/10.5194/acp-9-4653-2009, 2009. a
Croft, B., Lohmann, U., Martin, R. V., Stier, P., Wurzler, S., Feichter, J., Hoose, C., Heikkilä, U., van Donkelaar, A., and Ferrachat, S.: Influences of in-cloud aerosol scavenging parameterizations on aerosol concentrations and wet deposition in ECHAM5-HAM, Atmos. Chem. Phys., 10, 1511–1543, https://doi.org/10.5194/acp-10-1511-2010, 2010. a, b, c
Cziczo, D. J., Froyd, K. D., Hoose, C., Jensen, E. J., Diao, M., Zondlo, M. A., Smith, J. B., Twohy, C. H., and Murphy, D. M.: Clarifying the Dominant Sources and Mechanisms of Cirrus Cloud Formation, Science, 340, 1320–1324, https://doi.org/10.1126/science.1234145, 2013. a
Dee, D. P., Uppala, S. M., Simmons, A. J., Berrisford, P., Poli, P., Kobayashi, S., Andrae, U., Balmaseda, M. A., Balsamo, G., Bauer, P., Bechtold, P., Beljaars, A. C. M., van de Berg, L., Bidlot, J., Bormann, N., Delsol, C., Dragani, R., Fuentes, M., Geer, A. J., Haimberger, L., Healy, S. B., Hersbach, H., Hólm, E. V., Isaksen, L., Kållberg, P., Köhler, M., Matricardi, M., McNally, A. P., Monge-Sanz, B. M., Morcrette, J.-J., Park, B.-K., Peubey, C., de Rosnay, P., Tavolato, C., Thépaut, J.-N., and Vitart, F.: The ERA-Interim reanalysis: configuration and performance of the data assimilation system, Q. J. Roy. Meteor. Soc., 137, 553–597, https://doi.org/10.1002/qj.828, 2011. a
Dekoutsidis, G., Groß, S., Wirth, M., Krämer, M., and Rolf, C.: Characteristics of supersaturation in midlatitude cirrus clouds and their adjacent cloud-free air, Atmos. Chem. Phys., 23, 3103–3117, https://doi.org/10.5194/acp-23-3103-2023, 2023. a
DeMott, P. J., Prenni, A. J., Liu, X., Kreidenweis, S. M., Petters, M. D., Twohy, C. H., Richardson, M. S., Eidhammer, T., and Rogers, D. C.: Predicting global atmospheric ice nuclei distributions and their impacts on climate, P. Natl. A. Sci., 107, 11217–11222, https://doi.org/10.1073/pnas.0910818107, 2010. a, b
Dentener, F., Kinne, S., Bond, T., Boucher, O., Cofala, J., Generoso, S., Ginoux, P., Gong, S., Hoelzemann, J. J., Ito, A., Marelli, L., Penner, J. E., Putaud, J.-P., Textor, C., Schulz, M., van der Werf, G. R., and Wilson, J.: Emissions of primary aerosol and precursor gases in the years 2000 and 1750 prescribed data-sets for AeroCom, Atmos. Chem. Phys., 6, 4321–4344, https://doi.org/10.5194/acp-6-4321-2006, 2006. a
Dietlicher, R., Neubauer, D., and Lohmann, U.: Prognostic parameterization of cloud ice with a single category in the aerosol-climate model ECHAM(v6.3.0)-HAM(v2.3), Geosci. Model Dev., 11, 1557–1576, https://doi.org/10.5194/gmd-11-1557-2018, 2018. a
Dietlicher, R., Neubauer, D., and Lohmann, U.: Elucidating ice formation pathways in the aerosol–climate model ECHAM6-HAM2, Atmos. Chem. Phys., 19, 9061–9080, https://doi.org/10.5194/acp-19-9061-2019, 2019. a, b, c, d, e
Dore, A., Sobik, M., and Migala, K.: Patterns of precipitation and pollutant deposition in the western Sudete mountains, Poland, Atmos. Environ., 33, 3301–3312, https://doi.org/10.1016/S1352-2310(98)00294-5, 1999. a
Durdina, L., Brem, B. T., Schönenberger, D., Siegerist, F., Anet, J. G., and Rindlisbacher, T.: Nonvolatile Particulate Matter Emissions of a Business Jet Measured at Ground Level and Estimated for Cruising Altitudes, Environ. Sci. Technol., 53, 12865–12872, https://doi.org/10.1021/acs.est.9b02513, 2019. a
Eirund, G. K., Possner, A., and Lohmann, U.: Response of Arctic mixed-phase clouds to aerosol perturbations under different surface forcings, Atmos. Chem. Phys., 19, 9847–9864, https://doi.org/10.5194/acp-19-9847-2019, 2019. a
Ferrachat, S.: ECHAM-HAM GCM License Agreement, https://redmine.hammoz.ethz.ch/projects/hammoz/wiki/2_How_to_get_the_sources (last access: 8 November 2022), 2013. a
Ferrachat, S.: ECHAM-HAM GCM Homepage, https://redmine.hammoz.ethz.ch/projects/hammoz/wiki/Echam630-ham23-moz10 (last access: 8 November 2022), 2017. a
Findeisen, W., Volken, E., Giesche, A. M., and Brönnimann, S.: Colloidal meteorological processes in the formation of precipitation, Meteorol. Z., 24, 443–454, https://doi.org/10.1127/metz/2015/0675, 2015. a
Froyd, K. D., Yu, P., Schill, G. P., Brock, C. A., Kupc, A., Williamson, C. J., Jensen, E. J., Ray, E., Rosenlof, K. H., Bian, H., Darmenov, A. S., Colarco, P. R., Diskin, G. S., Bui, T., and Murphy, D. M.: Dominant role of mineral dust in cirrus cloud formation revealed by global-scale measurements, Nat. Geosci., 15, 177–183, https://doi.org/10.1038/s41561-022-00901-w, 2022. a, b
Gasparini, B. and Lohmann, U.: Why cirrus cloud seeding cannot substantially cool the planet, J. Geophys. Res.-Atmos., 121, 4877–4893, https://doi.org/10.1002/2015JD024666, 2016. a, b, c, d, e, f, g
Gasparini, B., Münch, S., Poncet, L., Feldmann, M., and Lohmann, U.: Is increasing ice crystal sedimentation velocity in geoengineering simulations a good proxy for cirrus cloud seeding?, Atmos. Chem. Phys., 17, 4871–4885, https://doi.org/10.5194/acp-17-4871-2017, 2017. a, b, c
Gasparini, B., Meyer, A., Neubauer, D., Münch, S., and Lohmann, U.: Cirrus Cloud Properties as Seen by the CALIPSO Satellite and ECHAM-HAM Global Climate Model, J. Climate, 31, 1983–2003, https://doi.org/10.1175/JCLI-D-16-0608.1, 2018. a
Gasparini, B., McGraw, Z., Storelvmo, T., and Lohmann, U.: To what extent can cirrus cloud seeding counteract global warming?, Environ. Res. Lett., 15, 054002, https://doi.org/10.1088/1748-9326/ab71a3, 2020. a, b, c, d
Geresdi, I., Xue, L., Sarkadi, N., and Rasmussen, R.: Evaluation of Orographic Cloud Seeding Using a Bin Microphysics Scheme: Three-Dimensional Simulation of Real Cases, J. Appl. Meteorol. Clim., 59, 1537–1555, https://doi.org/10.1175/JAMC-D-19-0278.1, 2020. a
Gilgen, A., Adolf, C., Brugger, S. O., Ickes, L., Schwikowski, M., van Leeuwen, J. F. N., Tinner, W., and Lohmann, U.: Implementing microscopic charcoal particles into a global aerosol–climate model, Atmos. Chem. Phys., 18, 11813–11829, https://doi.org/10.5194/acp-18-11813-2018, 2018. a
Gruber, S., Blahak, U., Haenel, F., Kottmeier, C., Leisner, T., Muskatel, H., Storelvmo, T., and Vogel, B.: A Process Study on Thinning of Arctic Winter Cirrus Clouds With High-Resolution ICON-ART Simulations, J. Geophys. Res.-Atmos, 124, 5860–5888, https://doi.org/10.1029/2018JD029815, 2019. a, b, c, d
Hartmann, M., Adachi, K., Eppers, O., Haas, C., Herber, A., Holzinger, R., Hünerbein, A., Jäkel, E., Jentzsch, C., van Pinxteren, M., Wex, H., Willmes, S., and Stratmann, F.: Wintertime Airborne Measurements of Ice Nucleating Particles in the High Arctic: A Hint to a Marine, Biogenic Source for Ice Nucleating Particles, Geophys. Res. Lett., 47, e2020GL087770, https://doi.org/10.1029/2020GL087770, 2020. a
Hoesly, R. M., Smith, S. J., Feng, L., Klimont, Z., Janssens-Maenhout, G., Pitkanen, T., Seibert, J. J., Vu, L., Andres, R. J., Bolt, R. M., Bond, T. C., Dawidowski, L., Kholod, N., Kurokawa, J.-I., Li, M., Liu, L., Lu, Z., Moura, M. C. P., O'Rourke, P. R., and Zhang, Q.: Historical (1750–2014) anthropogenic emissions of reactive gases and aerosols from the Community Emissions Data System (CEDS), Geosci. Model Dev., 11, 369–408, https://doi.org/10.5194/gmd-11-369-2018, 2018. a
Hurrell, J. W., Hack, J. J., Shea, D., Caron, J. M., and Rosinski, J.: A New Sea Surface Temperature and Sea Ice Boundary Dataset for the Community Atmosphere Model, J. Climate, 21, 5145–5153, https://doi.org/10.1175/2008JCLI2292.1, 2008. a
Ickes, L., Welti, A., Hoose, C., and Lohmann, U.: Classical nucleation theory of homogeneous freezing of water: thermodynamic and kinetic parameters, Phys. Chem. Chem. Phys., 17, 5514–5537, https://doi.org/10.1039/C4CP04184D, 2015. a
Jensen, E. J., Ueyama, R., Pfister, L., Bui, T. V., Alexander, M. J., Podglajen, A., Hertzog, A., Woods, S., Lawson, R. P., Kim, J.-E., and Schoeberl, M. R.: High-frequency gravity waves and homogeneous ice nucleation in tropical tropopause layer cirrus, Geophys. Res. Lett., 43, 6629–6635, https://doi.org/10.1002/2016GL069426, 2016a. a
Jensen, E. J., Ueyama, R., Pfister, L., Bui, T. V., Lawson, R. P., Woods, S., Thornberry, T., Rollins, A. W., Diskin, G. S., DiGangi, J. P., and Avery, M. A.: On the Susceptibility of Cold Tropical Cirrus to Ice Nuclei Abundance, J. Atmos. Sci., 73, 2445–2464, https://doi.org/10.1175/JAS-D-15-0274.1, 2016b. a, b, c
Jeuken, A. B. M., Siegmund, P. C., Heijboer, L. C., Feichter, J., and Bengtsson, L.: On the potential of assimilating meteorological analyses in a global climate model for the purpose of model validation, J. Geophys. Res.-Atmos., 101, 16939–16950, https://doi.org/10.1029/96JD01218, 1996. a
Kanji, Z. A., Ladino, L. A., Wex, H., Boose, Y., Burkert-Kohn, M., Cziczo, D. J., and Krämer, M.: Overview of Ice Nucleating Particles, Meteor. Mon., 58, 1.1–1.33, https://doi.org/10.1175/AMSMONOGRAPHS-D-16-0006.1, 2017. a, b, c
Kazil, J., Stier, P., Zhang, K., Quaas, J., Kinne, S., O'Donnell, D., Rast, S., Esch, M., Ferrachat, S., Lohmann, U., and Feichter, J.: Aerosol nucleation and its role for clouds and Earth's radiative forcing in the aerosol-climate model ECHAM5-HAM, Atmos. Chem. Phys., 10, 10733–10752, https://doi.org/10.5194/acp-10-10733-2010, 2010. a
Koop, T., Luo, B., Tsias, A., and Peter, T.: Water activity as the determinant for homogeneous ice nucleation in aqueous solutions, Nature, 406, 611–614, https://doi.org/10.1038/35020537, 2000. a, b
Krämer, M., Rolf, C., Luebke, A., Afchine, A., Spelten, N., Costa, A., Meyer, J., Zöger, M., Smith, J., Herman, R. L., Buchholz, B., Ebert, V., Baumgardner, D., Borrmann, S., Klingebiel, M., and Avallone, L.: A microphysics guide to cirrus clouds – Part 1: Cirrus types, Atmos. Chem. Phys., 16, 3463–3483, https://doi.org/10.5194/acp-16-3463-2016, 2016. a, b
Krämer, M., Rolf, C., Spelten, N., Afchine, A., Fahey, D., Jensen, E., Khaykin, S., Kuhn, T., Lawson, P., Lykov, A., Pan, L. L., Riese, M., Rollins, A., Stroh, F., Thornberry, T., Wolf, V., Woods, S., Spichtinger, P., Quaas, J., and Sourdeval, O.: A microphysics guide to cirrus – Part 2: Climatologies of clouds and humidity from observations, Atmos. Chem. Phys., 20, 12569–12608, https://doi.org/10.5194/acp-20-12569-2020, 2020. a, b, c
Kuebbeler, M., Lohmann, U., Hendricks, J., and Kärcher, B.: Dust ice nuclei effects on cirrus clouds, Atmos. Chem. Phys., 14, 3027–3046, https://doi.org/10.5194/acp-14-3027-2014, 2014. a, b
Kärcher, B.: Formation and radiative forcing of contrail cirrus, Nat. Commun., 9, 1824, https://doi.org/10.1038/s41467-018-04068-0, 2018. a
Kärcher, B. and Lohmann, U.: A parameterization of cirrus cloud formation: Homogeneous freezing of supercooled aerosols, J. Geophys. Res.-Atmos., 107, AAC 4–1–AAC 4–10, https://doi.org/10.1029/2001JD000470, 2002. a
Kärcher, B. and Lohmann, U.: A parameterization of cirrus cloud formation: Heterogeneous freezing, J. Geophys. Res.-Atmos., 108, 4402, https://doi.org/10.1029/2002JD003220, 2003. a, b
Kärcher, B., Turco, R. P., Yu, F., Danilin, M. Y., Weisenstein, D. K., Miake-Lye, R. C., and Busen, R.: A unified model for ultrafine aircraft particle emissions, J. Geophys. Res.-Atmos., 105, 29379–29386, https://doi.org/10.1029/2000JD900531, 2000. a
Kärcher, B., Hendricks, J., and Lohmann, U.: Physically based parameterization of cirrus cloud formation for use in global atmospheric models, J. Geophys. Res.-Atmos., 111, D01205, https://doi.org/10.1029/2005JD006219, 2006. a, b
Kärcher, B., DeMott, P. J., Jensen, E. J., and Harrington, J. Y.: Studies on the Competition Between Homogeneous and Heterogeneous Ice Nucleation in Cirrus Formation, J. Geophys. Res.-Atmos., 127, e2021JD035805, https://doi.org/10.1029/2021JD035805, 2022. a, b
Lee, D., Fahey, D., Skowron, A., Allen, M., Burkhardt, U., Chen, Q., Doherty, S., Freeman, S., Forster, P., Fuglestvedt, J., Gettelman, A., De León, R., Lim, L., Lund, M., Millar, R., Owen, B., Penner, J., Pitari, G., Prather, M., Sausen, R., and Wilcox, L.: The contribution of global aviation to anthropogenic climate forcing for 2000 to 2018, Atmos. Environ., 244, 117834, https://doi.org/10.1016/j.atmosenv.2020.117834, 2021. a
Levkov, L., Rockel, B., Kapitza, H., and Raschke, E.: 3D mesoscale numerical studies of cirrus and stratus clouds by their time and space evolution, Contributions to Atmospheric Physics, 65, 35–58, 1992. a
Li, G., Wieder, J., Pasquier, J. T., Henneberger, J., and Kanji, Z. A.: Predicting atmospheric background number concentration of ice-nucleating particles in the Arctic, Atmos. Chem. Phys., 22, 14441–14454, https://doi.org/10.5194/acp-22-14441-2022, 2022. a
Lohmann, U. and Kärcher, B.: First interactive simulations of cirrus clouds formed by homogeneous freezing in the ECHAM general circulation model, J. Geophys. Res.-Atmos., 107, AAC 8–1–AAC 8–13, https://doi.org/10.1029/2001JD000767, 2002. a
Lohmann, U., Stier, P., Hoose, C., Ferrachat, S., Kloster, S., Roeckner, E., and Zhang, J.: Cloud microphysics and aerosol indirect effects in the global climate model ECHAM5-HAM, Atmos. Chem. Phys., 7, 3425–3446, https://doi.org/10.5194/acp-7-3425-2007, 2007. a, b
Lohmann, U., Spichtinger, P., Jess, S., Peter, T., and Smit, H.: Cirrus cloud formation and ice supersaturated regions in a global climate model, Environ. Res. Lett., 3, 045022, https://doi.org/10.1088/1748-9326/3/4/045022, 2008. a, b
Lohmann, U., Friebel, F., Kanji, Z., Mahrt, F., Mensah, A., and Neubauer, D.: Future warming exacerbated by aged-soot effect on cloud formation, Nat. Geosci., 13, 674–680, https://doi.org/10.1038/s41561-020-0631-0, 2020. a, b
Mahrt, F., Marcolli, C., David, R. O., Grönquist, P., Barthazy Meier, E. J., Lohmann, U., and Kanji, Z. A.: Ice nucleation abilities of soot particles determined with the Horizontal Ice Nucleation Chamber, Atmos. Chem. Phys., 18, 13363–13392, https://doi.org/10.5194/acp-18-13363-2018, 2018. a, b, c
Mahrt, F., Kilchhofer, K., Marcolli, C., Grönquist, P., David, R. O., Rösch, M., Lohmann, U., and Kanji, Z. A.: The Impact of Cloud Processing on the Ice Nucleation Abilities of Soot Particles at Cirrus Temperatures, J. Geophys. Res.-Atmos., 125, e2019JD030922, https://doi.org/10.1029/2019JD030922, 2020. a, b, c
Marcolli, C., Nagare, B., Welti, A., and Lohmann, U.: Ice nucleation efficiency of AgI: review and new insights, Atmos. Chem. Phys., 16, 8915–8937, https://doi.org/10.5194/acp-16-8915-2016, 2016. a
Mitchell, D. L. and Finnegan, W.: Modification of cirrus clouds to reduce global warming, Environ. Res. Lett., 4, 045102, https://doi.org/10.1088/1748-9326/4/4/045102, 2009. a, b, c, d, e, f, g, h
Mitchell, D. L., Mishra, S., and Lawson, R. P.: Cirrus Clouds and Climate Engineering: New Findings on Ice Nucleation and Theoretical Basis, in: Planet Earth, https://doi.org/10.5772/24664, 2011. a, b
Möhler, O., Field, P. R., Connolly, P., Benz, S., Saathoff, H., Schnaiter, M., Wagner, R., Cotton, R., Krämer, M., Mangold, A., and Heymsfield, A. J.: Efficiency of the deposition mode ice nucleation on mineral dust particles, Atmos. Chem. Phys., 6, 3007–3021, https://doi.org/10.5194/acp-6-3007-2006, 2006. a
Morrison, H. and Milbrandt, J. A.: Parameterization of Cloud Microphysics Based on the Prediction of Bulk Ice Particle Properties. Part I: Scheme Description and Idealized Tests, J. Atmos. Sci., 72, 287–311, https://doi.org/10.1175/JAS-D-14-0065.1, 2015. a
Muench, S. and Lohmann, U.: Developing a Cloud Scheme With Prognostic Cloud Fraction and Two Moment Microphysics for ECHAM-HAM, J. Adv. Model. Earth Sy., 12, e2019MS001824, https://doi.org/10.1029/2019MS001824, 2020. a, b, c, d, e
Muri, H., Kristjánsson, J. E., Storelvmo, T., and Pfeffer, M. A.: The climatic effects of modifying cirrus clouds in a climate engineering framework, J. Geophys. Res.-Atmos., 119, 4174–4191, https://doi.org/10.1002/2013JD021063, 2014. a
Neubauer, D., Lohmann, U., Hoose, C., and Frontoso, M. G.: Impact of the representation of marine stratocumulus clouds on the anthropogenic aerosol effect, Atmos. Chem. Phys., 14, 11997–12022, https://doi.org/10.5194/acp-14-11997-2014, 2014. a
Neubauer, D., Ferrachat, S., Siegenthaler-Le Drian, C., Stier, P., Partridge, D. G., Tegen, I., Bey, I., Stanelle, T., Kokkola, H., and Lohmann, U.: The global aerosol–climate model ECHAM6.3–HAM2.3 – Part 2: Cloud evaluation, aerosol radiative forcing, and climate sensitivity, Geosci. Model Dev., 12, 3609–3639, https://doi.org/10.5194/gmd-12-3609-2019, 2019. a
O'Rourke, P. R., Smith, S. J., Mott, A., Ahsan, H., McDuffie, E. E., Crippa, M., Klimont, Z., McDonald, B., Wang, S., Nicholson, M. B., Feng, L., and Hoesly, R. M.: CEDS v_2021_02_05 Release Emission Data, Zenodo [data set] https://doi.org/10.5281/zenodo.4509372, 2021. a
Penner, J. E., Zhou, C., and Liu, X.: Can cirrus cloud seeding be used for geoengineering?, Geophys. Res. Lett., 42, 8775–8782, https://doi.org/10.1002/2015GL065992, 2015. a
Possner, A., Ekman, A. M. L., and Lohmann, U.: Cloud response and feedback processes in stratiform mixed-phase clouds perturbed by ship exhaust, Geophys. Res. Lett., 44, 1964–1972, https://doi.org/10.1002/2016GL071358, 2017. a
Proske, U., Bessenbacher, V., Dedekind, Z., Lohmann, U., and Neubauer, D.: How frequent is natural cloud seeding from ice cloud layers (< −35 ∘C) over Switzerland?, Atmos. Chem. Phys., 21, 5195–5216, https://doi.org/10.5194/acp-21-5195-2021, 2021. a
Purdy, J. C., Austin, G., Seed, A. W., and Cluckie, I.: Radar evidence of orographic enhancement due to the seeder feeder mechanism, Meteorol. Appl., 12, 199–206, https://doi.org/10.1017/S1350482705001672, 2005. a
Ramanathan, V.: The role of earth radiation budget studies in climate and general circulation research, J. Geophys. Res.-Atmos., 92, 4075–4095, https://doi.org/10.1029/JD092iD04p04075, 1987. a
Ramelli, F., Henneberger, J., David, R. O., Bühl, J., Radenz, M., Seifert, P., Wieder, J., Lauber, A., Pasquier, J. T., Engelmann, R., Mignani, C., Hervo, M., and Lohmann, U.: Microphysical investigation of the seeder and feeder region of an Alpine mixed-phase cloud, Atmos. Chem. Phys., 21, 6681–6706, https://doi.org/10.5194/acp-21-6681-2021, 2021. a
Reinking, R. F., Snider, J. B., and Coen, J. L.: Influences of Storm-Embedded Orographic Gravity Waves on Cloud Liquid Water and Precipitation, J. Appl. Meteorol., 39, 733–759, https://doi.org/10.1175/1520-0450(2000)039<0733:IOSEOG>2.0.CO;2, 2000. a
Rieger, D., Bangert, M., Bischoff-Gauss, I., Förstner, J., Lundgren, K., Reinert, D., Schröter, J., Vogel, H., Zängl, G., Ruhnke, R., and Vogel, B.: ICON–ART 1.0 – a new online-coupled model system from the global to regional scale, Geosci. Model Dev., 8, 1659–1676, https://doi.org/10.5194/gmd-8-1659-2015, 2015. a
Robichaud, A. J. and Austin, G. L.: On the modelling of warm orographic rain by the seeder-feeder mechanism, Q. J. Roy. Meteor. Soc., 114, 967–988, https://doi.org/10.1002/qj.49711448207, 1988. a
Roe, G. H.: OROGRAPHIC PRECIPITATION, Annu. Rev. Earth Pl. Sc., 33, 645–671, https://doi.org/10.1146/annurev.earth.33.092203.122541, 2005. a
Rogers, D. C., DeMott, P. J., and Kreidenweis, S. M.: Airborne measurements of tropospheric ice-nucleating aerosol particles in the Arctic spring, J. Geophys. Res.-Atmos., 106, 15053–15063, https://doi.org/10.1029/2000JD900790, 2001. a
Schutgens, N. A. J. and Stier, P.: A pathway analysis of global aerosol processes, Atmos. Chem. Phys., 14, 11657–11686, https://doi.org/10.5194/acp-14-11657-2014, 2014. a, b, c
Seinfeld, J. and Pandis, S.: Atmospheric Chemistry and Physics: From Air Pollution to Climate Change, Wiley, ISBN 9781119221166, 1998. a
Stevens, B., Giorgetta, M., Esch, M., Mauritsen, T., Crueger, T., Rast, S., Salzmann, M., Schmidt, H., Bader, J., Block, K., Brokopf, R., Fast, I., Kinne, S., Kornblueh, L., Lohmann, U., Pincus, R., Reichler, T., and Roeckner, E.: Atmospheric component of the MPI-M Earth System Model: ECHAM6, J. Adv. Model. Earth Sy., 5, 146–172, https://doi.org/10.1002/jame.20015, 2013. a
Stier, P., Feichter, J., Kinne, S., Kloster, S., Vignati, E., Wilson, J., Ganzeveld, L., Tegen, I., Werner, M., Balkanski, Y., Schulz, M., Boucher, O., Minikin, A., and Petzold, A.: The aerosol-climate model ECHAM5-HAM, Atmos. Chem. Phys., 5, 1125–1156, https://doi.org/10.5194/acp-5-1125-2005, 2005. a, b, c, d, e, f
Storelvmo, T.: Aerosol Effects on Climate via Mixed-Phase and Ice Clouds, Annu. Rev. Earth Pl. Sc., 45, 199–222, https://doi.org/10.1146/annurev-earth-060115-012240, 2017. a
Storelvmo, T. and Herger, N.: Cirrus cloud susceptibility to the injection of ice nuclei in the upper troposphere, J. Geophys. Res.-Atmos., 119, 2375–2389, https://doi.org/10.1002/2013JD020816, 2014. a, b, c, d, e, f, g, h
Storelvmo, T. and Tan, I.: The Wegener-Bergeron-Findeisen process? Its discovery and vital importance for weather and climate, Meteorol. Z., 24, 455–461, https://doi.org/10.1127/metz/2015/0626, 2015. a
Storelvmo, T., Kristjansson, J. E., Muri, H., Pfeffer, M., Barahona, D., and Nenes, A.: Cirrus cloud seeding has potential to cool climate, Geophys. Res. Lett., 40, 178–182, https://doi.org/10.1029/2012GL054201, 2013. a, b, c, d, e, f
Storelvmo, T., Boos, W. R., and Herger, N.: Cirrus cloud seeding: a climate engineering mechanism with reduced side effects?, Philos. T. R. Soc. A, 372, 20140116, https://doi.org/10.1098/rsta.2014.0116, 2014. a, b, c, d, e, f, g
Tegen, I., Neubauer, D., Ferrachat, S., Siegenthaler-Le Drian, C., Bey, I., Schutgens, N., Stier, P., Watson-Parris, D., Stanelle, T., Schmidt, H., Rast, S., Kokkola, H., Schultz, M., Schroeder, S., Daskalakis, N., Barthel, S., Heinold, B., and Lohmann, U.: The global aerosol–climate model ECHAM6.3–HAM2.3 – Part 1: Aerosol evaluation, Geosci. Model Dev., 12, 1643–1677, https://doi.org/10.5194/gmd-12-1643-2019, 2019. a, b, c, d, e, f, g, h, i, j, k, l
Tully, C., Neubauer, D., Omanovic, N., and Lohmann, U.: Cirrus cloud thinning using a more physically based ice microphysics scheme in the ECHAM-HAM general circulation model, Atmos. Chem. Phys., 22, 11455–11484, https://doi.org/10.5194/acp-22-11455-2022, 2022a. a, b, c, d, e, f, g, h, i, j, k, l, m, n, o, p, q, r, s, t, u, v, w, x
Tully, C., Neubauer, D., Villanueva, D., and Lohman, U.: Data for the “Does prognostic seeding along flight tracks produce the desired effects of cirrus cloud thinning?” manuscript, Zenodo [data set], https://doi.org/10.5281/zenodo.7298771, 2022b. a
Tully, C., Neubauer, D., Villanueva, D., and Lohmann, U.: Data analysis and plotting scripts for the “Does prognostic seeding along flight tracks produce the desired effects of cirrus cloud thinning?” manuscript, Zenodo [data set] https://doi.org/10.5281/zenodo.7779833, 2022c. a
Tully, C., Neubauer, D., Villanueva, D., and Lohmann, U.: Software for the “Does prognostic seeding along flight tracks produce the desired effects of cirrus cloud thinning?” manuscript, Zenodo [code], https://doi.org/10.5281/zenodo.8085946, 2023. a
Twomey, S.: The nuclei of natural cloud formation part II: The supersaturation in natural clouds and the variation of cloud droplet concentration, Geofisica Pura e Applicata, 43, 243–249, https://doi.org/10.1007/BF01993560, 1959. a
Twomey, S.: The Influence of Pollution on the Shortwave Albedo of Clouds, J. Atmos. Sci., 34, 1149–1152, https://doi.org/10.1175/1520-0469(1977)034<1149:TIOPOT>2.0.CO;2, 1977. a
Ullrich, R., Hoose, C., Möhler, O., Niemand, M., Wagner, R., Höhler, K., Hiranuma, N., Saathoff, H., and Leisner, T.: A New Ice Nucleation Active Site Parameterization for Desert Dust and Soot, J. Atmos. Sci., 74, 699–717, https://doi.org/10.1175/JAS-D-16-0074.1, 2017. a
van Marle, M. J. E., Kloster, S., Magi, B. I., Marlon, J. R., Daniau, A.-L., Field, R. D., Arneth, A., Forrest, M., Hantson, S., Kehrwald, N. M., Knorr, W., Lasslop, G., Li, F., Mangeon, S., Yue, C., Kaiser, J. W., and van der Werf, G. R.: Historic global biomass burning emissions for CMIP6 (BB4CMIP) based on merging satellite observations with proxies and fire models (1750–2015), Geosci. Model Dev., 10, 3329–3357, https://doi.org/10.5194/gmd-10-3329-2017, 2017. a
Vignati, E., Wilson, J., and Stier, P.: M7: An efficient size-resolved aerosol microphysics module for large-scale aerosol transport models, J. Geophys. Res.-Atmos., 109, D22202, https://doi.org/10.1029/2003JD004485, 2004. a, b, c, d, e, f
Voigt, C., Kleine, J., Sauer, D., Moore, R. H., Bräuer, T., Le Clercq, P., Kaufmann, S., Scheibe, M., Jurkat-Witschas, T., Aigner, M., Bauder, U., Boose, Y., Borrmann, S., Crosbie, E., Diskin, G. S., DiGangi, J., Hahn, V., Heckl, C., Huber, F., Nowak, J. B., Rapp, M., Rauch, B., Robinson, C., Schripp, T., Shook, M., Winstead, E., Ziemba, L., Schlager, H., and Anderson, B. E.: Cleaner burning aviation fuels can reduce contrail cloudiness, Communications Earth & Environment, 2, 114, https://doi.org/10.1038/s43247-021-00174-y, 2021. a
Waitz, F., Schnaiter, M., Leisner, T., and Järvinen, E.: In situ observation of riming in mixed-phase clouds using the PHIPS probe, Atmos. Chem. Phys., 22, 7087–7103, https://doi.org/10.5194/acp-22-7087-2022, 2022. a
Wegener, A.: Thermodynamik der Atmosphäre, J. A. Barth Verlag, TS19: print ISBN 978-3-642-88924-0, online ISBN 978-3-642-90779-1, 1911. a
Wild, M., Hakuba, M. Z., Folini, D., Dörig-Ott, P., Schär, C., Kato, S., and Long, C. N.: The cloud-free global energy balance and inferred cloud radiative effects: an assessment based on direct observations and climate models, Clim. Dynam., 52, 4787–4812, https://doi.org/10.1007/s00382-018-4413-y, 2019. a
Wilks, D. S.: “The Stippling Shows Statistically Significant Grid Points”: How Research Results are Routinely Overstated and Overinterpreted, and What to Do about It, B. Am. Meteorol. Soc., 97, 2263–2273, https://doi.org/10.1175/BAMS-D-15-00267.1, 2016. a
Xue, L., Hashimoto, A., Murakami, M., Rasmussen, R., Tessendorf, S. A., Breed, D., Parkinson, S., Holbrook, P., and Blestrud, D.: Implementation of a Silver Iodide Cloud-Seeding Parameterization in WRF. Part I: Model Description and Idealized 2D Sensitivity Tests, J. Appl. Meteorol. Clim., 52, 1433–1457, https://doi.org/10.1175/JAMC-D-12-0148.1, 2013. a
Zhang, K., O'Donnell, D., Kazil, J., Stier, P., Kinne, S., Lohmann, U., Ferrachat, S., Croft, B., Quaas, J., Wan, H., Rast, S., and Feichter, J.: The global aerosol-climate model ECHAM-HAM, version 2: sensitivity to improvements in process representations, Atmos. Chem. Phys., 12, 8911–8949, https://doi.org/10.5194/acp-12-8911-2012, 2012. a, b, c, d, e, f, g
Zängl, G., Reinert, D., Rípodas, P., and Baldauf, M.: The ICON (ICOsahedral Non-hydrostatic) modelling framework of DWD and MPI-M: Description of the non-hydrostatic dynamical core, Q. J. Roy. Meteor. Soc., 141, 563–579, https://doi.org/10.1002/qj.2378, 2015. a
- Abstract
- Introduction
- Methods
- Results and discussion
- Conclusions
- Appendix A: Initial tests of prognostic seeding following aircraft emissions
- Appendix B: Heterogeneous nucleation sources – global aircraft seeding
- Appendix C: Northern Hemisphere wintertime TOA radiative anomalies, ice crystal radius anomalies, and zonal heating rates
- Code and data availability
- Author contributions
- Competing interests
- Disclaimer
- Acknowledgements
- Financial support
- Review statement
- References