the Creative Commons Attribution 4.0 License.
the Creative Commons Attribution 4.0 License.
 | 13 Jul 2023
Rethinking the role of transport and photochemistry in regional ozone pollution: insights from ozone concentration and mass budgets
Xuesong Wang
Xuhui Cai
Yu Yan
Xipeng Jin
Mihalis Vrekoussis
Maria Kanakidou
Guy P. Brasseur
Jin Shen
Teng Xiao
Limin Zeng
Yuanhang Zhang
Understanding the role of transport and photochemistry is essential to mitigate tropospheric ozone (O3) pollution within a region. In previous studies, the O3 concentration budget has been widely used to determine the contributions of two processes to the variations of O3 concentrations. These studies often conclude that local photochemistry is the main cause of regional O3 pollution; however, they fail to explain why O3 in a targeted region is often primarily derived from O3 and/or its precursors transported from the outside regions, as reported by many studies of O3 source apportionment. Here, we present a method to calculate the hourly contributions of O3-related processes to the variations of not only the mean O3 concentration but also the total O3 mass (the corresponding budgets are noted as the O3 concentration and mass budget, respectively) within the atmospheric boundary layer (ABL) of the concerned region. Based on the modelling results of WRF-CMAQ (Weather Research and Forecasting and Community Multiscale Air Quality), the two O3 budgets were applied to comprehensively understand the effects of transport and photochemistry on the O3 pollution over the Pearl River Delta (PRD) region in China. Quantified results demonstrate the different role of transport and photochemistry when comparing the two O3 budgets: photochemistry drives the rapid increase of O3 concentrations during the day, whereas transport, especially vertical exchange through the ABL top, controls both rapid O3 mass increase in the morning and decrease in the afternoon. The diurnal changes of the transport contributions in the two O3 budgets highlight the influences of the ABL diurnal cycle and regional wind fields on regional O3 pollution. Through high contributions to the O3 mass increase in the morning, transport determines that most O3 in the PRD originates from the global background and emissions outside the region. However, due to the simultaneous rapid increase of ABL volumes, this process only has a relatively limited effect on O3 concentration increase compared to photochemistry, and transport effect on the regional sources of O3 cannot be illustrated by the O3 concentration budget. For future studies targeting O3 and other secondary pollutants with moderately long atmospheric lifetimes (e.g. fine particulate matter and some of its components), insights from both concentration and mass budgets are required to fully understand the role of transport, chemistry and other related processes.
- Article
(3416 KB) - Full-text XML
-
Supplement
(1753 KB) - BibTeX
- EndNote


Since first recognized as a key contributor to the Los Angeles smog, tropospheric ozone (O3) pollution has received considerable attention in many highly populated areas in the world (Fishman et al., 2003; Schultz et al., 2017; Fleming et al., 2018; Fowler et al., 2020). Exposure to O3 threatens crop yields, ecosystems and human health, resulting in increased mortality and economic losses (Mills et al., 2013; Ainsworth, 2017; Zhang et al., 2019). In addition, O3 contributes to global warming not only directly as a greenhouse gas but also indirectly by damaging plants and suppressing land carbon sinks (Sitch et al., 2007; Naik et al., 2021). To address these detrimental effects, efforts have been undertaken to reduce O3 levels in polluted regions. However, since O3 is a secondary pollutant produced in the atmosphere by complex non-linear chemistry, the abatement of O3 pollution is a challenging task.
As a prerequisite to effectively control O3 pollution, firstly, it is imperative to understand the effects of O3-related processes on the abundance of O3 in the atmosphere. High O3 concentrations within a region are often attributed to daytime photochemical production from O3 precursors, i.e. NOx (= NO + NO2) and volatile organic compounds (VOCs), under sunlight. Due to the short lifetime of O3 precursors (several hours for NOx and reactive VOCs; Liu et al., 2016; Seinfeld and Pandis, 2016; Laughner and Cohen, 2019), it is generally believed that O3 photochemistry is mainly linked to the contributions of local emissions in polluted regions. On the other hand, since O3 itself has a moderately long atmospheric lifetime of 20–30 d (Stevenson et al., 2006; Bates and Jacob, 2019), transport processes in the atmosphere, including horizontal transport (mainly advection) and vertical exchange through the top of the atmospheric boundary layer (ABL), may also considerably contribute to regional O3 pollution (Myriokefalitakis et al., 2016). Specifically, through vertical exchange, O3 in the residual layer and/or free atmosphere is entrained into the ABL and involved in the ABL mixing after sunrise, leading to rapidly increasing O3 concentrations near the surface (Kaser et al., 2017; Hu et al., 2018; Zhao et al., 2019). Although O3 produced from local emissions may be transported out and later recirculated back to the region, it is more likely that transported O3 is mainly derived from the emissions of O3 precursors in the upwind regions, continents and even O3 in the stratosphere under the combined effect of meso-, synoptic-, large- and global-scale atmospheric movements (Massagué et al., 2019). If photochemistry has a comparatively large influence on O3, reducing local emissions is an appropriate strategy to alleviate regional O3 pollution; otherwise, it is necessary to focus on emission control in the upwind regions, aiming to reduce transport contributions to O3.
In many studies, the O3 concentration budget was often utilized to quantify the contributions of various transport and chemical processes to the variations of O3 concentrations. The changes in the mean O3 concentration within the ABL () can be expressed as the net contributions of all O3-related processes (Lenschow et al., 1981; Janssen and Pozzer, 2015; Vilà-Guerau de Arellano et al., 2015):
where u, v and w refer to wind speeds in the x, y and z direction, respectively. The right side of Eq. (1) describes the contributions of (1) horizontal transport (advection, the first two terms), (2) vertical exchange through the ABL top (entrainment and detrainment, the third term), and (3) gas-phase chemistry, dry deposition and other processes (the term S(O3) indicates their net contributions). The O3 concentration budget is then derived by integrating these terms over time. It enables the identification of the processes that produce positive or negative tendencies of the O3 concentration and of the processes that are most influential for regional O3 pollution. Reported O3 concentration budgets derived from ground-based measurements (Su et al., 2018; Tan et al., 2018, 2019; Yu et al., 2020), aircraft-based mobile observations (Lenschow et al., 1981; Trousdell et al., 2016, 2019) and Process Analysis (PA) or similar modules in chemical transport models (Hou et al., 2014; Li et al., 2021; Yan et al., 2021) in various regions of the globe often suggest that O3 production through local photochemistry drives the noontime increase of O3 concentration, whereas transport reduces O3 concentration over the same period. Conclusively, photochemistry, rather than transport, plays a main role in O3 pollution.
However, O3 source apportionment is likely to provide different conclusions about the relative importance of transport and photochemistry in affecting O3 pollution. O3 source apportionment is performed to identify the regional and/or sectoral origins of O3, of which the results are also used to support air pollution control (Clappier et al., 2017; Thunis et al., 2019). Here, we only discuss the regional origins of O3, because the contributions of sources outside the region (or emissions within the region, defined as local emissions hereafter) provide information on the influence of transport (or photochemistry) on O3 pollution. Previous publications often conclude that most O3 was not derived from local emissions of O3 precursors but from the global background and emissions outside the targeted regions (Guo et al., 2018; Pay et al., 2019; Liu et al., 2020). The mixing ratios of background O3 in various regions of the world are mostly within the range of 30–50 ppb (Reid et al., 2008, and references therein), which are sufficiently high to ensure that O3 originates mainly from non-local sources in less polluted regions. Since controlling background O3 is challenging, efforts to control O3 pollution in polluted regions with high non-local contributions to O3 should focus on reducing emissions in upwind regions rather than only local areas (Lelieveld et al., 2009; Boian and Andrade, 2012; Massagué et al., 2019). One successful example is the establishment of the “Ozone Transport Region” in the north-eastern United States by the US Environmental Protection Agency, which promotes collaborative emission reductions among states to address inter-state O3 transport (Novel, 1992). The above discussion highlights the importance of transport for regional O3 pollution, since it often plays a more prominent role than local photochemistry. Apparently, this last statement conflicts with the conclusions derived from the O3 concentration budget. Thus, while the O3 concentration budget is useful for understanding O3 pollution, it may not completely illustrate the effects of transport and photochemistry on regional O3 pollution.
In the ABL of the concerned region, the mean O3 concentration and total O3 mass are both conserved, which means that their variations are equal to the net contributions by various O3-related processes including transport and photochemistry. These relationships can be represented by the O3 concentration budget and mass budget, respectively. Unlike the aforementioned O3 concentration budget in Eq. (1), the hourly O3 mass budget, written as
is seldom reported ( is the total O3 mass within the ABL of the region; sx, sy and sz are the areas of the interfaces in the x, y and z direction, respectively; and V is the volume of the ABL column). Due to the varied effects of transport on O3 concentration and mass, the O3 mass budget differs from the O3 concentration budget but is more suitable to explore the influence of transport and photochemistry on the results of O3 source apportionment (more detailed explanations are given in Sect. 2.4). In order to comprehensively understand the role of transport and photochemistry in regional O3 pollution, in the present study, we developed a method to calculate both the O3 concentration and mass budget based on the simulation results from the Weather Research and Forecasting (WRF) and Community Multiscale Air Quality (CMAQ) models and also analysed and compared the results of the two regional-level O3 budgets. The Pearl River Delta (PRD) region, a city cluster located on the south-east coast of China and exposed to severe O3 pollution in summer and autumn (Gao et al., 2018), was selected as the targeted region. The tasks for this study can be summarized as follows.
-
Development of the method to quantify the two O3 budgets.
WRF-CMAQ employs the Process Analysis (PA) module to assess the contributions of O3-related processes to the variations of O3 concentrations within each grid cell. However, to obtain the regional-level O3 concentration and mass budgets, the results of the PA module are not sufficient. One reason is that the contribution of vertical exchange through the ABL top is not specifically quantified in commonly used ABL parameterizations and thus requires additional calculations (Kaser et al., 2017). Additionally, calculations based on the PA results are needed to identify the contributions of other O3-related processes to ABL-mean O3 concentration as well as the results of the O3 mass budget. To address this, we developed a method to quantify the two O3 budgets, of which the details are given in Sect. 2.1–2.3.
-
Analysis and comparison of the results from the two O3 budgets.
Based on the simulations of O3 pollution in the PRD with the model setup introduced in Sect. 2.5, the two O3 budgets were calculated for further analyses and comparisons to reveal the role of transport and photochemistry in regional O3 pollution from a more comprehensive perspective. Relative discussions are presented in Sect. 3.
-
Assessment of the role of transport and photochemistry in determining the regional origins of O3.
The brute force method (BFM; Clappier et al., 2017), a widely used source apportionment method, was combined with the O3 mass budget calculation to determine the contributions of emissions within and outside the PRD as well as background sources to the O3 transported into or produced by photochemistry in the region (methodology described in Sect. 2.6). The results, as discussed in Sect. 4, reveal the impacts of transport and photochemistry in determining the regional origins of O3 in the PRD and explain why the different views on the role of two processes in regional O3 pollution are suggested by the O3 concentration budget and O3 source apportionment studies.
2.1 The PRD grids and O3-related processes in O3 budgets
The two O3 budgets were calculated for the PRD, of which the grids are shown in the lower-left panel of Fig. 1. These grids are set based on the finer modelling domain of WRF-CMAQ (details given in Sect. 2.5) and determined according to the administrative areas of the PRD. The PRD grids with one or several interfaces with the outer regions are defined as the border grids, and they can be further classified as the grids in the north, south, west and east borders based on their locations. Correspondingly, the PRD grids with no interface with the outer regions are defined as the non-border grids.
Figure 1 also displays all O3-related processes considered in the calculation of O3 budgets here. The transport processes include horizontal transport through the four types of borders and vertical exchange through the ABL top. For vertical exchange, its contribution to the O3 concentration budget (the third term on the right side of Eq. 1) is quantified by (Sinclair et al., 2010; Jin et al., 2021)
where H is the ABL height,; is the difference between O3 concentrations above and within the ABL; and uh, vh and wh are the ABL-top wind speeds in the x, y and z direction, respectively. The terms on the right side of Eq. (3) suggest that vertical exchange through the ABL top, or entrainment and detrainment, is attributed to (1) the temporal changes of ABL heights (H) and (2) advection perpendicular to the ABL top and its slope. For the convenience of discussion, hereafter, vertical exchanges due to the above two dynamic processes are marked as ABLex-H and ABLex-A, respectively. The contributions of all transport processes in the O3 budgets were quantified based on meteorological parameters simulated by WRF and O3 concentrations simulated by CMAQ. The basic calculations of the contributions from the above-mentioned transport processes in the O3 mass and concentration budgets are separately introduced in the following two sections.
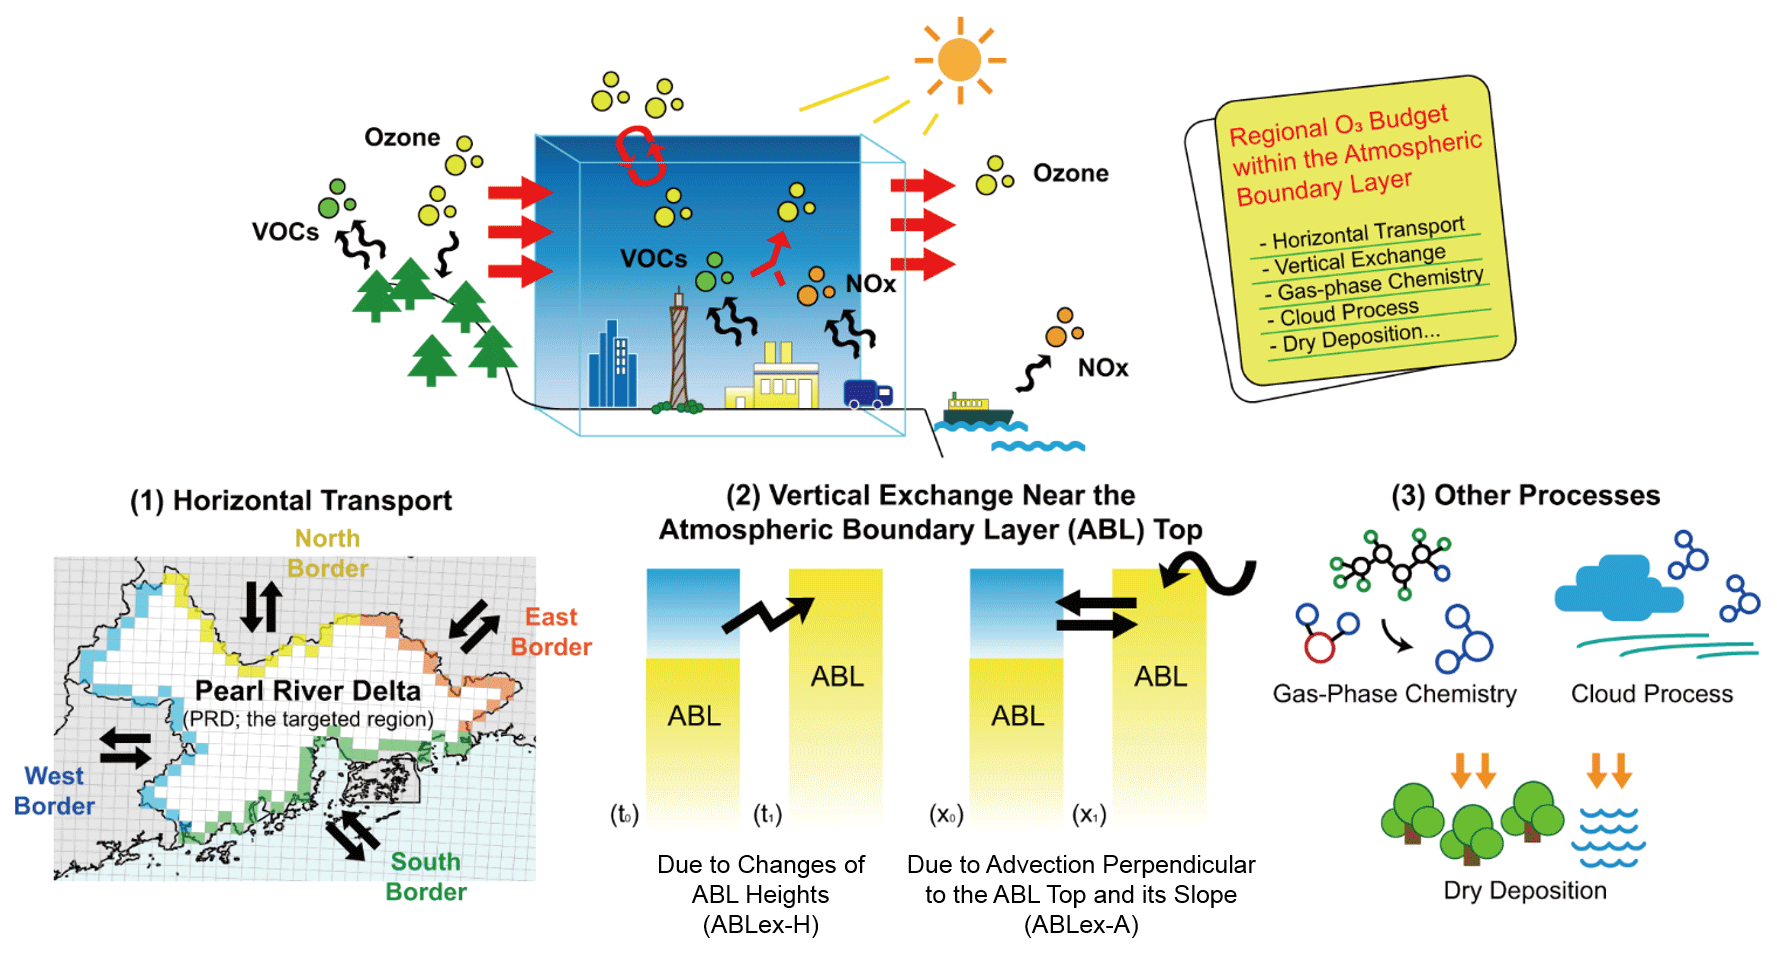
Figure 1Schematic illustration of O3 budgets (the upper panel) and O3-related processes considered (the lower panel): (1) horizontal transport through the north, south, west and east borders of the Pearl River Delta (PRD) (the distributions of the PRD grids are also shown: yellow, green, blue, orange for the north, south, west and east border grids, respectively, and white for the non-border grids); (2) vertical exchange through the atmospheric boundary layer (ABL) top, including the process due to the changes of ABL heights (ABLex-H) and advection perpendicular to the ABL top and its slope (ABLex-A); and (3) other processes, including gas-phase chemistry, cloud process and dry deposition, for this study.
Other processes in the O3 budgets include gas-phase chemistry (including daytime photochemical O3 production, O3 titration by NO and O3 depletion with unsaturated VOCs, etc.), cloud process (including below and in-cloud mixing, aqueous-phase chemistry, and wet deposition; Liu et al., 2011) and dry deposition. The contributions of these processes are all calculated based on the output of the PA module in CMAQ. In a word, their contributions in the O3 mass budget are obtained by summing up the contributions in all grid cells within the ABL of the PRD, and their contributions in the O3 concentration budget are the corresponding contributions to O3 mass divided by the volume of the ABL of the PRD. Since diffusion through the side and top boundaries of the region is expected to have a negligible influence on the variations of both O3 concentration and mass, we did not consider this process in O3 budget calculations.
The calculation process of the two O3 budgets is summarized as follows. Based on multiple output files of WRF and CMAQ, firstly, the contributions of all considered O3-related processes to O3 mass changes and volumes/volume changes linked to these processes within the ABL are calculated in nearly all grids of the modelling domain. We developed the post-processing tool flux_4d_cal to conduct the above calculations. Afterwards, the regional-level O3 mass and concentration budgets are quantified based on the results of the first-step calculations. Particularly, the method described in Sect. 2.3 is applied to estimate the contributions of O3-related processes in the O3 concentration budget. More detailed descriptions of the calculation process can be found in Text S1 in the Supplement.
2.2 Transport contributions in the O3 mass budget
The method by Yang et al. (2012) and Chang et al. (2018) was applied to quantify the contributions of horizontal transport in the O3 mass budget. For instance, the contribution of the advection through the west–east interface of a grid column within the ABL to total O3 mass (Fhtrans) in the column during the time interval dt is calculated as
where L is the width of the grid (equal to the horizontal resolution in the model); dz is the height of vertical layers. For advection through the north–south interface, the calculation is similar to Eq. (4), except for using v instead of u. Fhtrans values through all interfaces between the border grids and the outer region were calculated. Afterwards, they are summed up separately according to the types of borders as the net contributions of horizontal transport through the north, south, west and east borders of the PRD in the O3 mass budget.
Following Sinclair et al. (2010) and Jin et al. (2021), the contribution of vertical exchange through the ABL top to O3 mass (FABLex) during the time interval dt can be expressed as
where is the O3 concentration at the ABL top. The two terms on the right-most side of Eq. (5) separately describe the contributions of ABLex-H and ABLex-A (separately denoted as FABLex-H and FABLex-A). FABLex values in all the grids over the PRD were summed up to derive the net contribution of vertical exchange through the ABL top in the O3 mass budget.
2.3 Transport contributions in the O3 concentration budget
It is difficult to directly apply Eq. (1) in the quantification of transport contributions in the regional-level O3 concentration budget. Therefore, a different approach was applied, which is introduced as follows.
Suppose that an air parcel with a total volume of dV is transported into the ABL of the PRD (its original volume is V). The variation of under the influence of horizontal transport () can be written as
Since ABLex-A is also an advection process, its contribution in the O3 concentration budget () can be quantified using a similar formula as Eq. (6), except for using FABLex-A instead of Fhtrans.
Through ABLex-H, air parcels in the residual layer and/or free atmosphere are merged into the ABL or vice versa. Thus, the variation of under its influence () is expressed as
If the targeted region is small enough, the expressions of and in Eqs. (6) and (7) can be transformed to the corresponding terms in Eq. (1), confirming the applicability of the above calculations (for details, see Text S2). All variables in Eqs. (6) and (7) can be quantified by the post-processing tool flux_4d_cal, making the method feasible and suitable for the afterward calculations of the regional-scale O3 concentration budget.
However, due to the prominent diurnal cycle of ABL, V in Eqs. (6) and (7) may change notably within an hour, leading to bias in the hourly estimations of , and when using V at the start and end of the hour. This problem also applies to the calculation of contributions from other O3-related processes. In order to reduce the potential bias caused by the different selections of V, we designed two calculation paths for the hourly O3 concentration budget (Fig. S1 in the Supplement):
-
O3 mass change → ABL volume change
-
ABL volume change → O3 mass change,
where only O3 mass or ABL volume changes in each calculation step. The contribution of ABLex-H to O3 concentration can be viewed as the net effects of ABL volume change and O3 being transported into/out of the ABL: ABL volume change due to ABL development (collapse) leads to lower (higher) O3 concentration, and O3 transported into (out of) the ABL through ABLex-H leads to O3 increase (decrease). These contributions are quantified separately in the ABL volume and O3 mass change steps. The contributions of horizontal transport, ABLex-A and non-transport processes are quantified only in the O3 mass change step. The contribution of each process to the variation of O3 concentration is calculated using both paths, and the mean value of two results serves as an estimation close to its real contribution in the O3 concentration budget.
2.4 Difference between the two O3 budgets
The difference between the two O3 budgets is linked to the varied effect of transport on O3 mass and concentration. Suppose that the mean O3 concentration in the transported air parcels is . For horizontal transport, its contributions in the O3 mass and concentration budgets can be separately written as
Apparently, Fhtrans is related to the O3 concentrations in the transported air parcels but not to those in the studied region. It indicates the amount of O3 mass transported into or out of the region. Whether it is positive or negative only depends on the direction of transport – O3 being transported into (out of) the region leads to the increase (decrease) of O3 mass, which corresponds to a positive (negative) contribution in the O3 mass budget. In contrast, quantifies how much horizontal transport alters regional-mean O3 concentrations and is linked to the difference between O3 concentrations in the transported air parcels and the studied region (Eq. 9). O3 being transported into (out of) the region does not necessarily result in a higher (lower) O3 concentration. For instance, when clean air parcels with relatively low O3 levels ( <) are transported into the region, they dilute O3 pollution and reduce O3 concentration (). Given that ABLex-A is also an advection process, the above difference also applies to it. For ABLex-H, its contributions in the O3 mass and concentration budgets are expressed as
Similarly, ABL development and collapse lead to the increase and decrease of O3 mass, respectively, but whether they contribute to higher or lower O3 concentration also depends on the difference between O3 concentration in the transported air parcels and that in the region. Based on the above discussion, these transport processes all show different effects on O3 mass and concentration – the effect of transport on the variations of O3 mass is only related to the characteristics of the transported air parcels, namely their volumes and O3 concentrations within (Eqs. 8 and 10), while how transport contributes to the variations of O3 concentration is linked to the difference between O3 concentrations in the transported air parcels and the region (Eqs. 9 and 11).
To properly analyse the impact of transport and photochemistry on the regional origins of O3, it is required to identify the regional origins of the “new O3” into the studied region and the “disappeared O3” out of the studied region contributed by various O3-related processes, rather than how these processes lead to the variations of O3 concentration. Thus, the influence of transport and photochemistry on the results of O3 source apportionment can be explored by the O3 mass budget but not by the O3 concentration budget. By utilizing the BFM source apportionment method in combination with the O3 mass budget calculation, we can identify the regional origins of O3 mass increase and decrease due to transport and photochemistry and explain how these processes determine the results of O3 source apportionment in the PRD.
2.5 Model setup and validation
The O3 concentration and mass budgets within the ABL of the PRD were calculated based on the WRF-CMAQ modelling results by Qu et al. (2021a). The WRF (version 3.2) and CMAQ (version 5.0.2) models were used to simulate the meteorological and pollutant fields, respectively. Two domains with a resolution of 36 and 12 km (denoted as d01 and d02 hereafter) were set up for the one-way nested simulations, and the results in the finer d02, which includes the PRD and most areas in East and Central China (Fig. 2), were used in the calculations of O3 budgets. To represent the contributions of global background to O3, the initial and boundary conditions for the coarse d01 domain were provided from the global model, the Model for Ozone and Related Chemical Tracers, version 4 (MOZART-4) (Emmons et al., 2010). The PRD inventory provided by the Guangdong Environmental Monitoring Centre, the Multi-resolution Emission Inventory for China (MEIC) inventory for the mainland China (Li et al., 2017b; Zheng et al., 2018), the MIX inventory for the Asian regions outside of mainland China (Li et al., 2017a) and biogenic emissions simulated by the Model of Emissions of Gases and Aerosols from Nature (MEGAN; version 2.10) were used in the simulations. SAPRC07 (Carter, 2010) and AERO6 were applied as the gas-phase chemistry mechanism and the aerosol scheme, respectively. The simulations of O3 pollution in the PRD were performed for October 2015 (11 October–10 November 2015) and July 2016 (1–31 July 2016), which serve as the representative months in autumn and summer, respectively. Here, O3 polluted days are defined when the maximum hourly O3 concentrations of the day exceed 200 µg m−3, or the maximum 8 h average O3 concentrations of the day exceed 160 µg m−3 (both are the Grade-II O3 thresholds in the Chinese National Ambient Air Quality Standard) in any municipality of the PRD. According to this definition, there were 16 and 12 O3 polluted days in the 2 months, respectively (more information is given in Table S1 in the Supplement). The mean O3 budgets during these O3 polluted days of the two seasons were separately calculated and discussed in the present study.
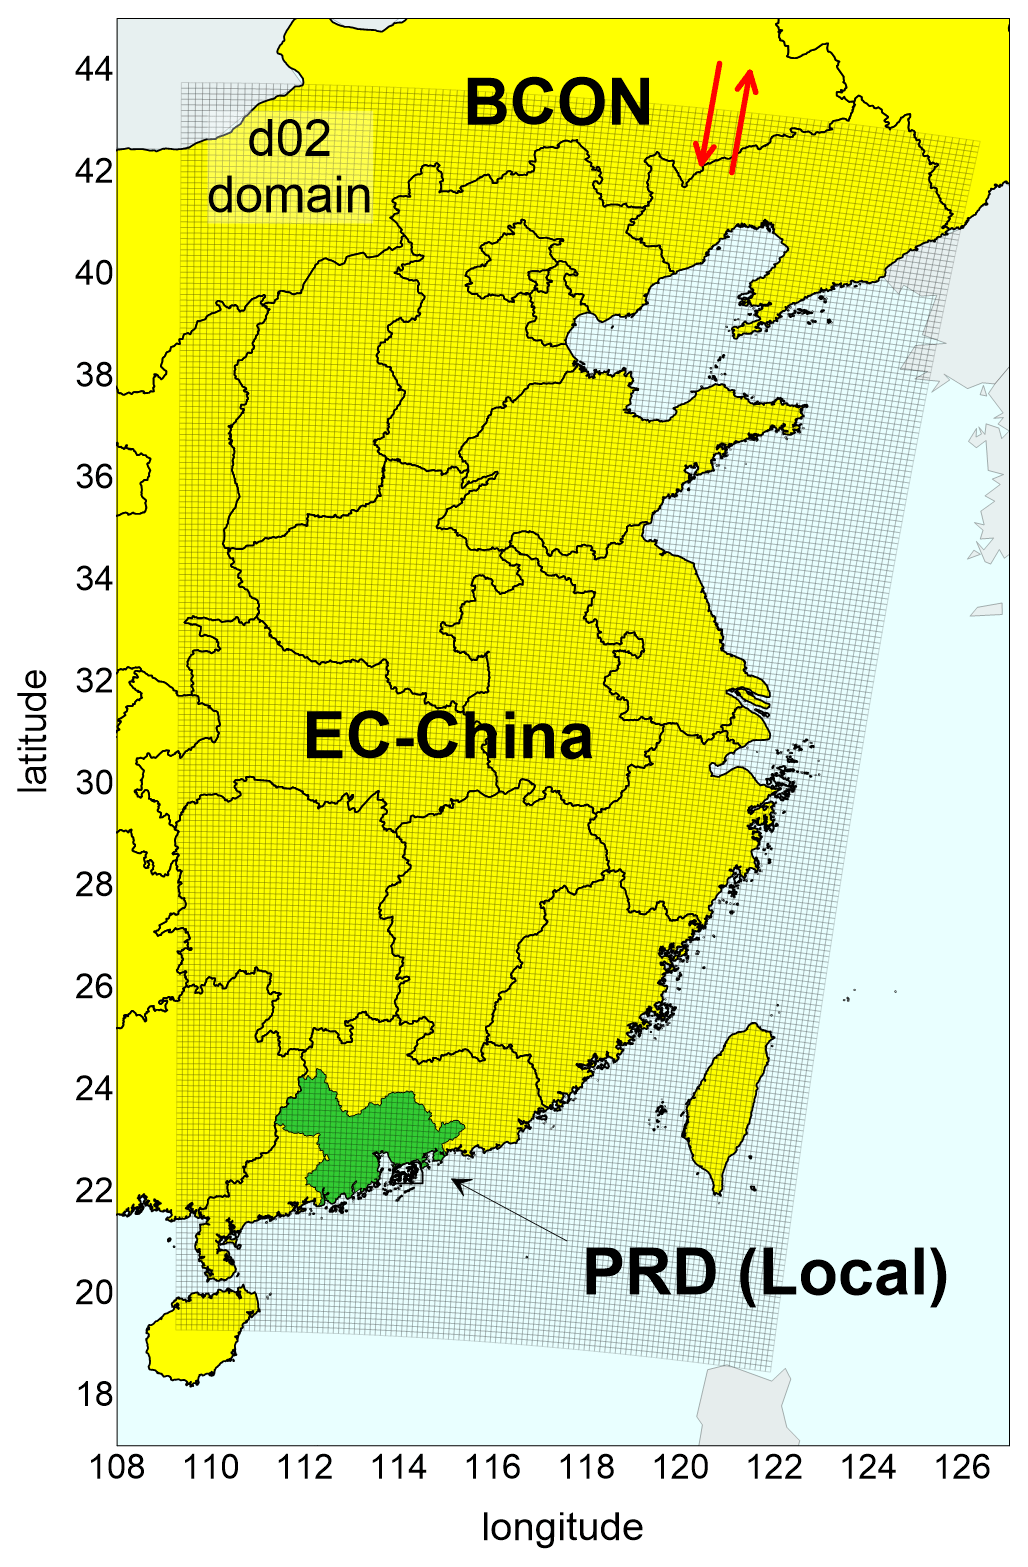
Figure 2The spatial distributions of the d02 modelling domain and source regions. The d02 domain is displayed as the nested areas in the figure. PRD, Pearl River Delta; EC-China, East and Central China; BCON, the boundary conditions of d02 modelling or the contributions of sources outside the d02 domain.
We evaluated the performance of WRF-CMAQ modelling based on multiple observational datasets. The modelling results of meteorological parameters (including temperature, relative humidity and wind speed), O3, NO2 concentrations and the mixing ratios of hydrocarbons have been validated with corresponding observations in the PRD by Qu et al. (2021a). The performance of the model in simulating the above variables was overall satisfying, with low biases and high correlations (for details, see Qu et al., 2021a). In this study, we further compared the modelled ABL height, the vertical profiles of wind speed, direction and O3 mixing ratio in Hong Kong (located in the south PRD) with corresponding observations from the IAGOS (In-service Aircraft for a Global Observing System; Petzold et al., 2015) dataset. The modelled ABL heights showed similar hourly variations during the day as the observational results (R=0.76), with a mean bias of −1.1 m (Fig. S2). The mean biases of wind speeds are within the range of ±1 m s−1 in all considered height ranges (0–1, 1–2, 2–5 km), and the results of the IAGOS and WRF model indicate similar variations of prevailing wind directions in different seasons and height ranges (Fig. S3). Moreover, modelled O3 mixing ratios in October 2015 are overestimated by 6 % and 26 % in the height range of 0–1 and 1–2 km, respectively, and sufficiently illustrate the development, maintenance and dissipation of O3 pollution during the month (Fig. S4). More detailed evaluations on the model performance of these parameters are presented in Text S3. Overall, the model performance is acceptable, indicating that the model can provide reasonable data for the calculations of O3 budgets.
If the calculation methods and assumptions are reasonable, the conservation of O3 concentration and mass budgets, described as
can be achieved (the terms Shtrans, SABLex, Schem, Scloud and Sddep indicate the contributions of horizontal transport, vertical exchange through the ABL top, gas-phase chemistry, cloud process and dry deposition, respectively, in the O3 concentration or mass budgets). Therefore, we used Eq. (8) to examine the validity of O3 budget calculations. Total O3 masses at the start and end of each hour in the model output were directly used to calculate the hourly variations of O3 mass . Besides these two parameters, the volumes of the ABL of the PRD at the start and end of each corresponding hour (calculated using ABL heights in all the PRD grids) are also needed to calculate the hourly variations of O3 concentration . The contributions of various O3-related processes in the O3 concentration and mass budgets were quantified using the method introduced in Sect. 2.1–2.3. As displayed in Fig. 3, hourly variations of O3 concentration/mass and the corresponding net contributions from all O3-related processes show good correlations (R2>0.9), with all fitted lines close to the 1:1 line. Thus, the conservation is overall met for the two O3 budgets in both representative months, allowing for further analyses based on the quantified budgets.
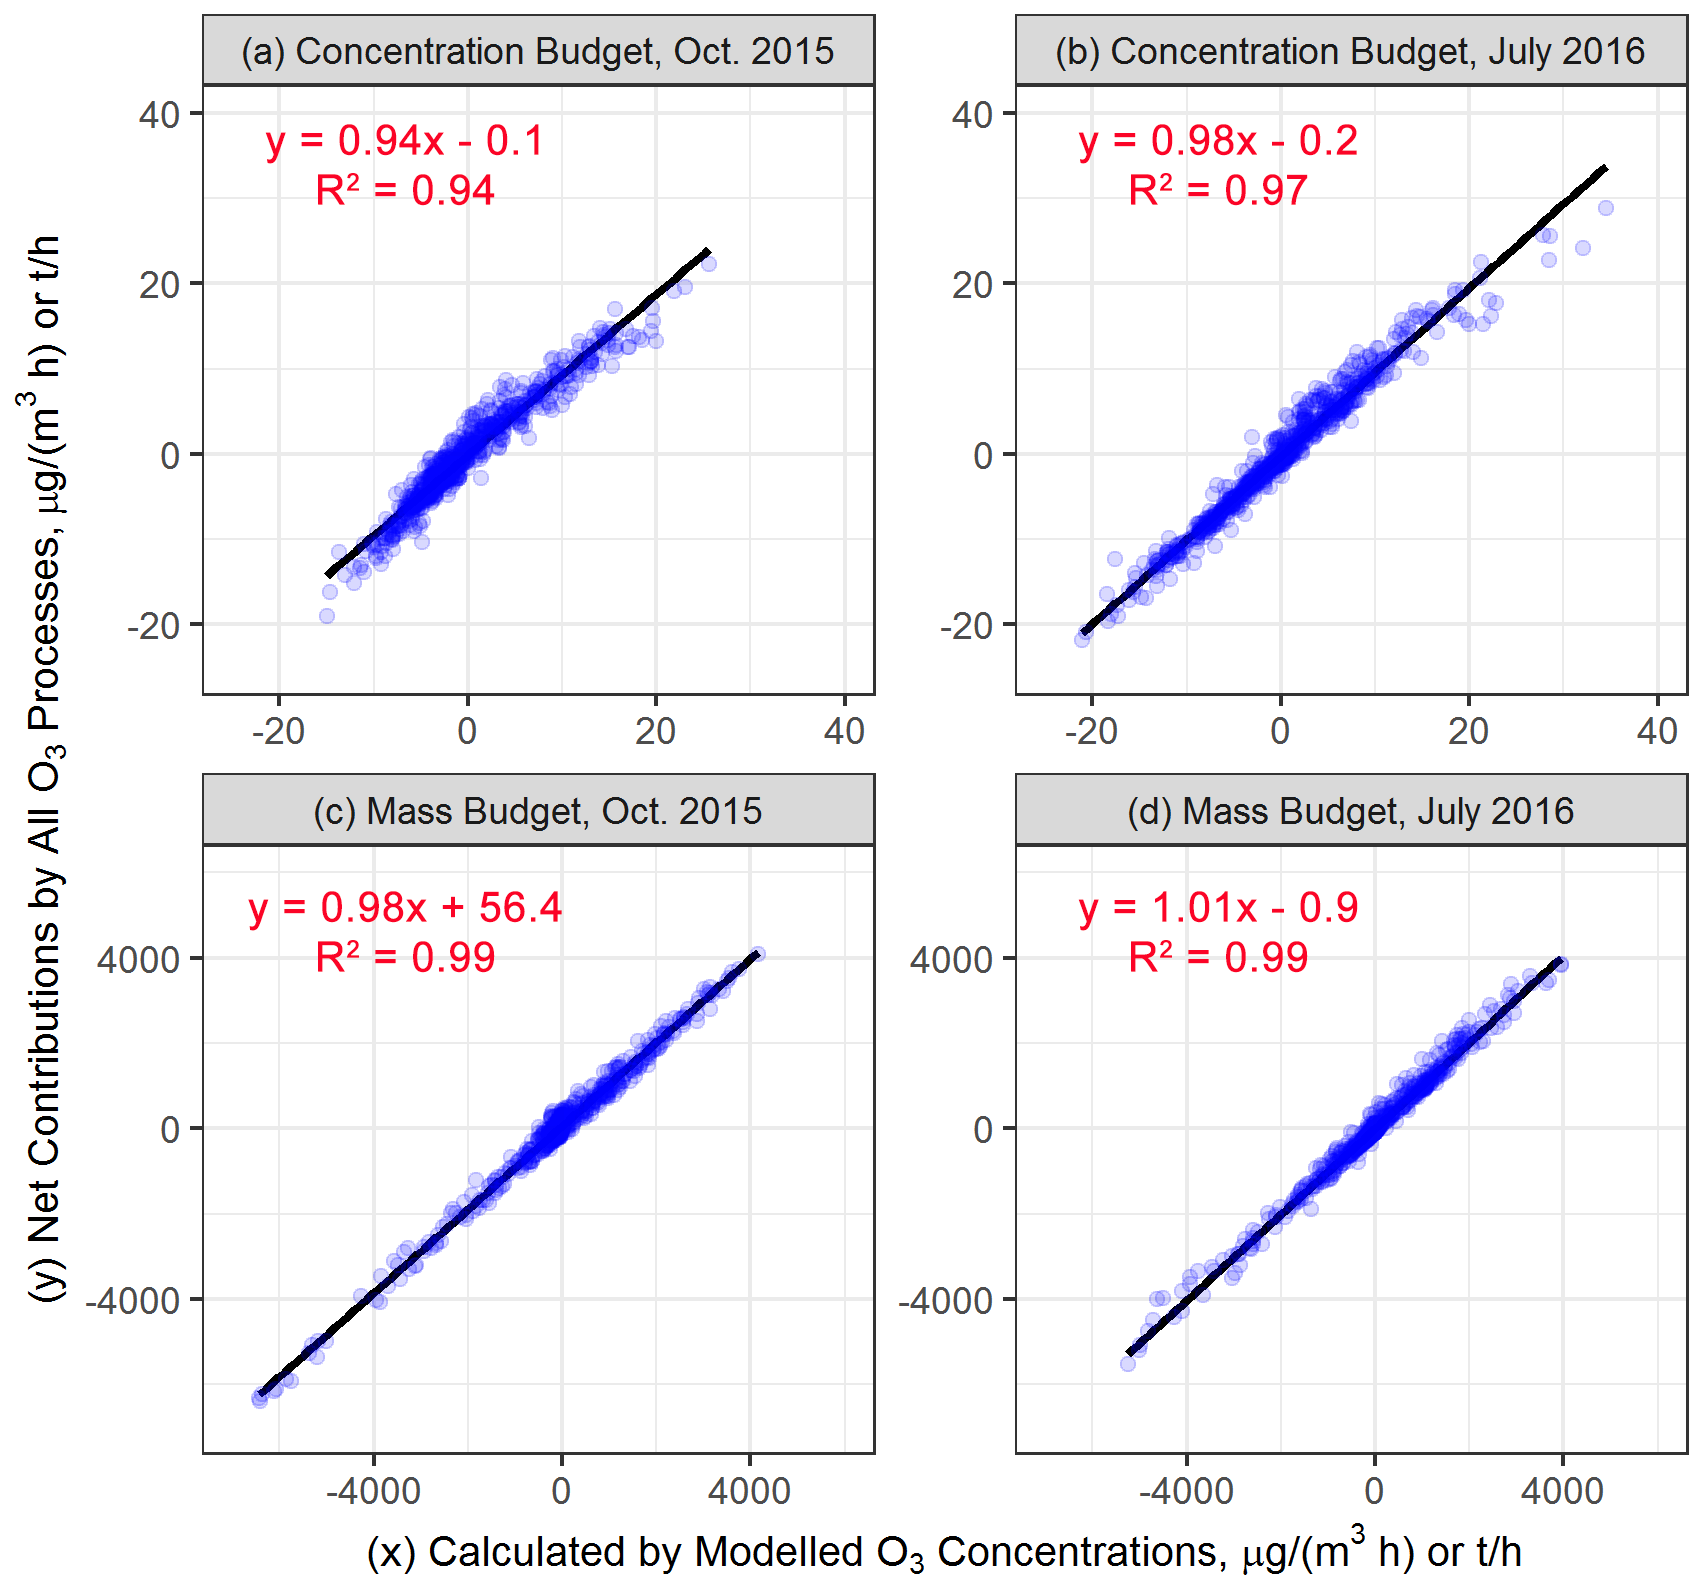
Figure 3The examinations of O3 budget conservation in October 2015 (a, c) and July 2016 (b, d) for the hourly O3 concentration budget (a–b) and mass budget (c–d). The units for the O3 concentration and mass budgets are µg m−3 h−1 and t h−1, respectively. The solid black lines in the plots are the fitted lines.
2.6 Identifying regional origins of O3 mass changes due to transport and photochemistry
The question to be addressed is how O3-related processes determine the regional origins of O3. By combining the O3 mass budget calculations with the BFM source apportionment method, we identified the regional origins of O3 mass changes due to transport and photochemistry (gas-phase chemistry). Here, the interest lies in the contributions of emissions in the PRD (also defined as local emissions), in other regions within the d02 (mainly East and Central China, hereafter denoted as EC-China) and in regions outside the d02 (the boundary conditions (BCON) of d02 modelling, representative of the background sources). The distribution of these source regions is displayed in Fig. 2. Besides the base scenario where all emissions in the d02 were considered in simulations, three sensitivity scenarios were additionally simulated:
-
PRD_zero scenario: all emissions (including anthropogenic and biogenic emissions, the same below) in the PRD are zeroed out;
-
EC-China_zero scenario: all emissions in EC-China are zeroed out;
-
All_zero scenario: all emissions within d02 are shut down.
The hourly contributions of the process i in the O3 mass budget were quantified using the same method outlined in Sect. 2.1–2.2 for the base scenario and three sensitivity scenarios, denoted as fi,base, fi,PRD_zero, fi,EC-China_zero and fi,all_zero, respectively. These parameters enable the determination of the contributions of emissions from the PRD and EC-China as well as the background sources (BCON) to the O3 mass increase and decrease due to various O3-related processes. The contributions of BCON in the O3 mass changes due to the process i (Fi,BCON) can be estimated directly as the contributions of the process i to the O3 mass in the all_zero scenario:
For the contributions of the PRD and EC-China emissions from the process i (separately denoted as Fi,PRD and Fi,EC-China), they can be derived in two ways: (1) by subtracting simulations with zeroed studied emissions from the base case simulation (top-down BFM) and (2) by subtracting simulations without all emissions from simulations accounting only for studied emissions (bottom-up BFM). Due to the non-linear response of O3 to precursor emissions, the results from top-down and bottom-up BFM can notably differ, which leads to the non-additivity of the results (the sum of all contributions is not equal to the concerned metric; here, ). Therefore, we estimated Fi,PRD and Fi,EC-China as the average values of the contributions by using top-down BFM and bottom-up BFM:
It should be noted that to identify the origins of both new O3 into the region and disappeared O3 out of the region, the positive and negative contributions of O3-related processes to the O3 mass in the PRD grids were separately summed up for the base and sensitivity scenarios and quantified using Eqs. (13)–(15).
3.1 O3 concentration budget
The upper panels of Fig. 4 show the mean diurnal changes of the O3 concentration budget within the ABL of the PRD. According to the net contributions from all O3-related processes considered, ABL-mean O3 concentration increased during most hours in the daytime, with the highest rates occurring in the early morning (08:00–10:00 local time (LT) in autumn, 07:00–09:00 LT in summer). The reduction of ABL-mean O3 concentration in the late afternoon and at night was also considerable. Its rate reached the maximum value near the sunset time (∼18:00 LT in autumn, ∼19:00 LT in summer) and gradually decreased throughout the night. The following question is then raised on the suitability of the budget targeting on ABL-mean O3 concentration to explain the variations of O3 concentrations near the ground. To answer this question, we compared the hourly changes of modelled ABL-mean O3 concentration with those of observed and modelled mean near-surface O3 concentrations in 18 sites of the Guangdong-Hong Kong-Macao PRD Regional Air Quality Monitoring Network (distributions shown in Fig. S5). As presented in Fig. S6, these datasets display similar patterns of O3 diurnal changes. Since O3 was well mixed within the ABL (Fig. S4), especially during the daytime when O3 levels are higher than those at night, the budget of ABL-mean O3 concentration can reveal the influences of transport and photochemistry on the variations of overall O3 levels as well as the causes of O3 pollution in the targeted region.
Next, the contributions of various O3-related processes in the O3 concentration budget are discussed as follows.
-
For gas-phase chemistry, Fig. 4 shows that gas-phase chemistry controlled the O3 concentration budget almost exclusively. During the morning hours, which are defined as the period from sunrise (∼06:00 LT in autumn, ∼05:00 LT in summer) to the O3-peak hour (∼14:00 LT), gas-phase chemistry (photochemistry) contributed to, on average, 74 % and 95 % of the O3 concentration increase in autumn and summer, respectively. These contributions are notably higher than the contributions of transport in the same periods (25 % in autumn, 5 % in summer). In the afternoon, gas-phase chemistry was still the main process to maintain high O3 concentrations within the PRD, but its contributions gradually decreased. However, this process led to decreased O3 concentration at night, suggesting the impact of O3 titration by emitted NO and O3 depletion with unsaturated VOCs. It may also be related to the production of particle nitrate through N2O5 hydrolysis (Qu et al., 2021b).
-
For transport, the dominance of gas-phase chemistry in the O3 concentration budget does not mean that the influence of transport on O3 concentration can be neglected all day long. Considerable contributions of transport (mainly by ABLex-H) to O3 concentration increase are found during the 2–3 h after sunrise, with the highest hourly mean contributions reaching ∼40 % and ∼25 % in autumn and summer, respectively. This result indicates the notable influence of air masses, with high O3 concentrations being entrained from residual layers on near-surface O3 pollution. ABLex-A and horizontal transport may contribute to the increase or decrease of ABL-mean O3 concentration, depending on the O3 levels in air parcels transported into and out of the region (further analysis is provided in Sect. 3.3). Overall, these two transport processes had only limited contributions to the variations of O3 concentration.
-
For other processes, dry deposition contributed to a considerable decrease in O3 concentration, especially during daytime, and thus served as an important sink process for near-surface O3. Besides, cloud process was also an important sink process for O3 in summer, which might be related to the convective vertical transport of O3.
In summary, the results of the O3 concentration budget indicate that gas-phase chemistry played a major role in the variations of O3 concentrations in the PRD. In particular, photochemistry led to the rapid formation of O3 pollution during daytime, rather than transport. Our conclusions agree well with those in earlier studies on the O3 concentration budget (Lenschow et al., 1981; Hou et al., 2014; Trousdell et al., 2016, 2019; Su et al., 2018; Tan et al., 2018, 2019; Yu et al., 2020; Li et al., 2021; Yan et al., 2021).
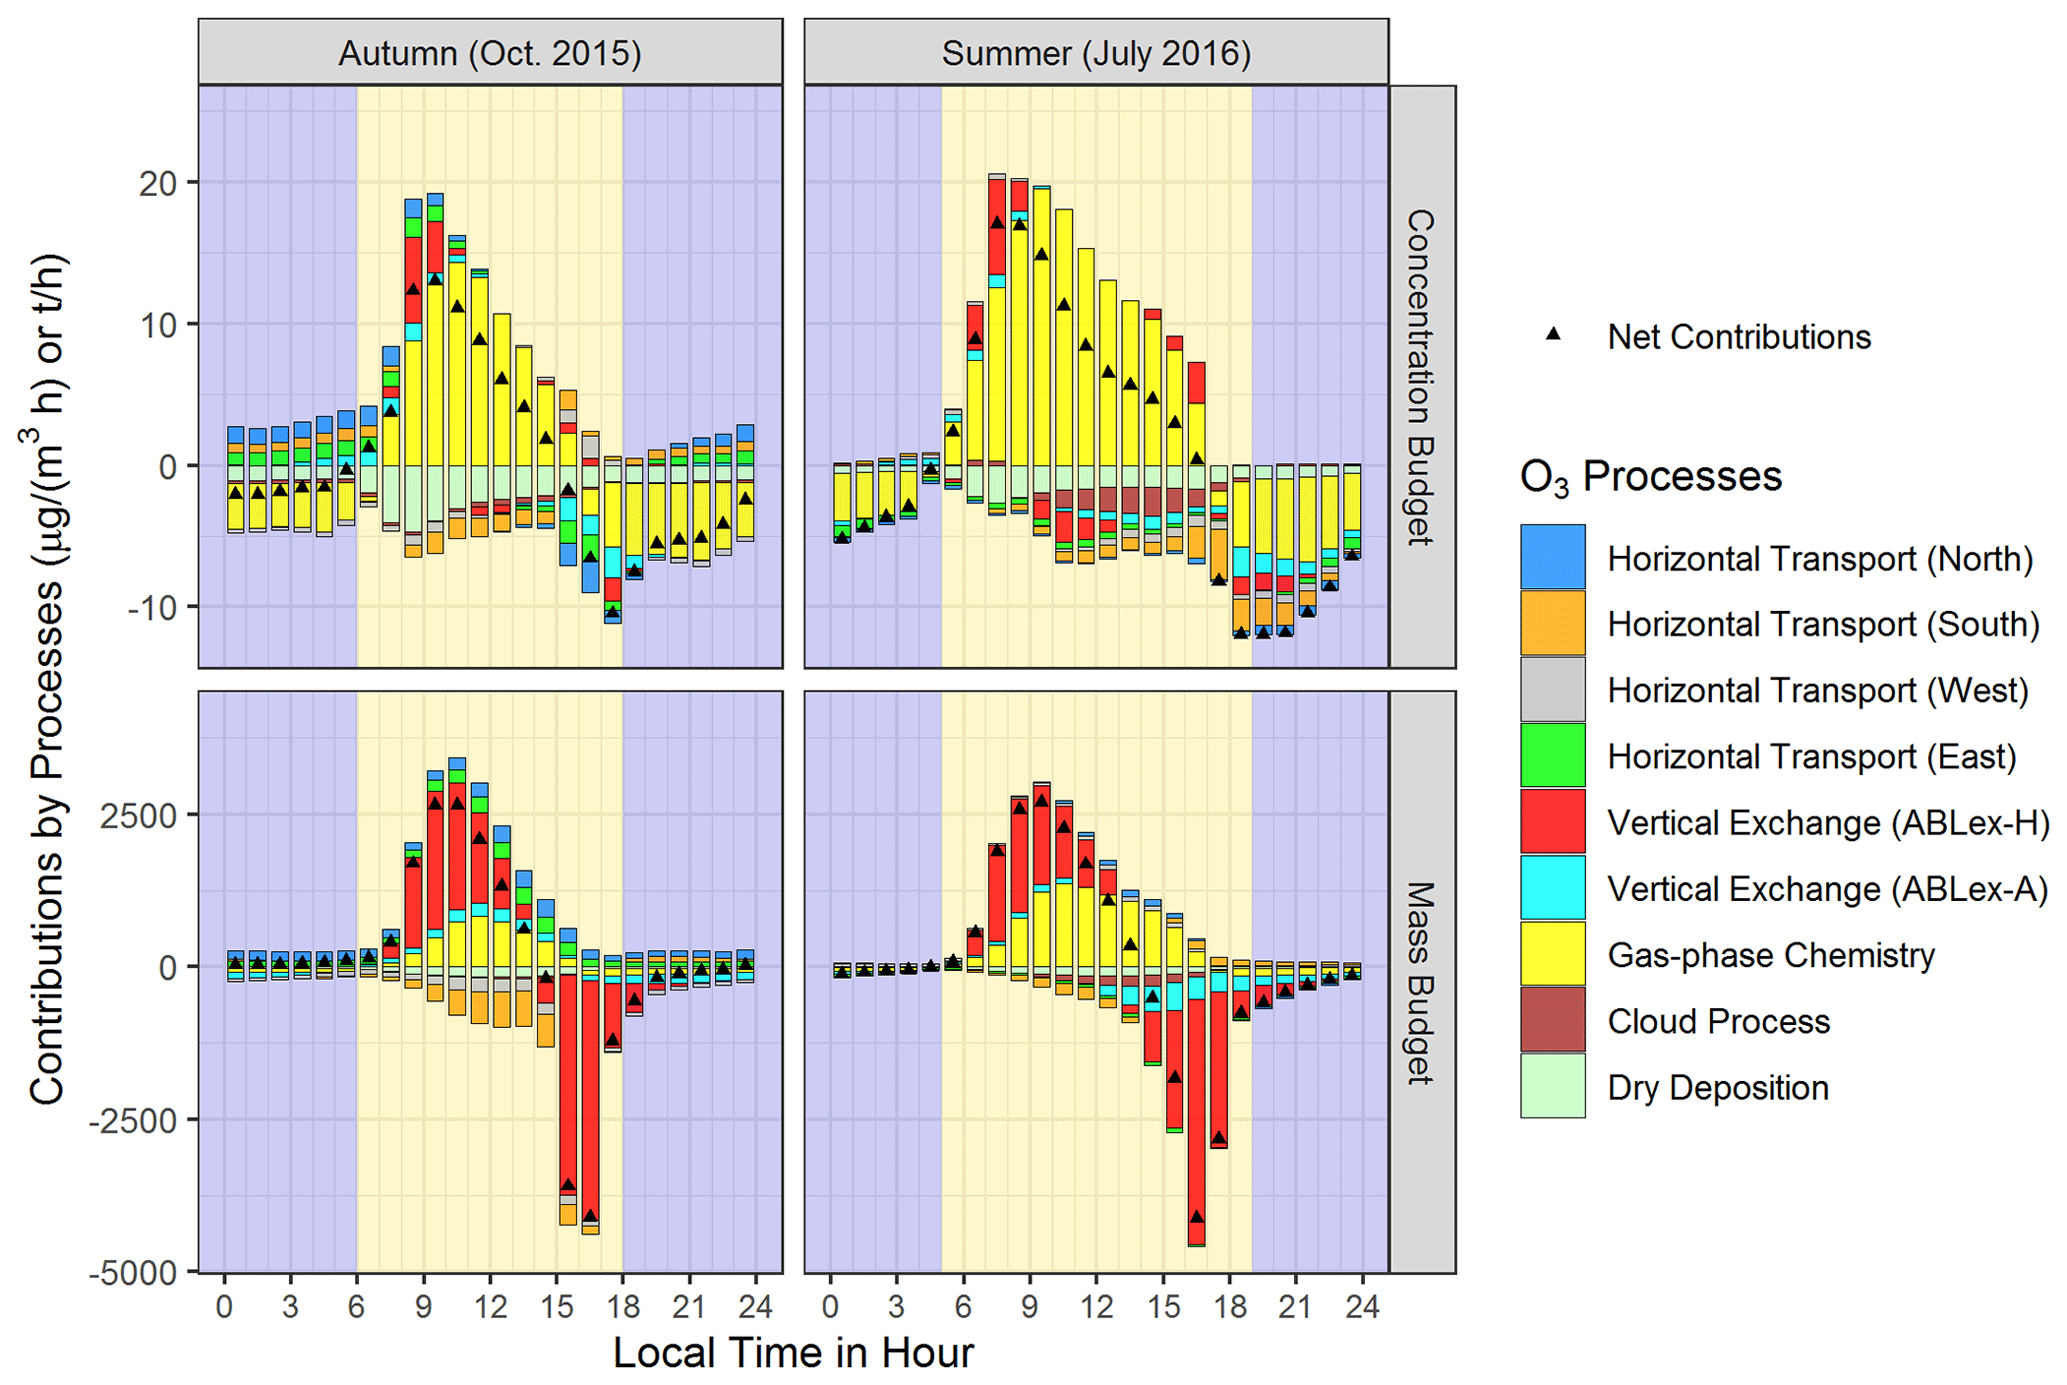
Figure 4Mean diurnal changes of the O3 concentration budget (upper panels) and mass budget (lower panels) on the polluted days of the representative months in autumn (October 2015; left panels) and summer (July 2016; right panels) within the atmospheric boundary layer of the Pearl River Delta. The units for the O3 concentration and mass budgets are µg m−3 h−1 and t h−1, respectively. Backgrounds in yellow and dark blue indicate daytime and nighttime periods, respectively.
3.2 O3 mass budget
The results of the O3 mass budget are displayed in the lower panels of Fig. 4. The total O3 mass within the ABL of the PRD increased during the morning hours, decreased rapidly in the afternoon and slowly at the early night and then remained stable until sunrise in both seasons. The change of total O3 mass agrees well with the ABL diurnal cycle (Lee, 2018) – daytime ABL development (or collapse) and notable O3 mass increase (or decrease) almost occurred simultaneously, and the negligible changes in O3 mass during most hours of the night may be linked to the small variations of stable ABL.
We analysed the contributions of various O3-related processes in the O3 mass budget as well, presented as follows.
-
For transport, unlike the results of the O3 concentration budget, transport plays a prominent role in the O3 mass budget. On average, it contributed 78 % and 53 % to O3 mass increase during the morning hours of autumn and summer, respectively, and over 90 % to O3 mass decrease during the afternoon hours of both seasons (14:00–18:00 LT in autumn and 14:00–19:00 LT in summer). Most O3 was transported into or out of the PRD by vertical exchange through the ABL top, especially ABLex-H, which links the diurnal changes of O3 mass and ABL. That is to say, when the height of the ABL rises (drops) rapidly, a big amount of O3 is transported into (out of) the ABL through the ABLex-H. The contributions of ABLex-A and horizontal transport to O3 mass change were relatively limited. However, they indicate well the characteristics and variations of regional wind fields in the PRD (more details are provided in the next section).
-
For gas-phase chemistry, gas-phase chemistry (photochemistry) also contributed to the increasing O3 mass in the daytime, especially in summer. However, its mean contributions during the morning hours (22 % in autumn, 47 % in summer) were lower than those of transport.
-
For other processes, dry deposition and cloud process both acted as O3 sink processes but with negligible contributions to O3 mass.
Based on the above discussions, transport tends to be more important than photochemistry in the O3 mass budget, which differs from the conclusions of the O3 concentration budget. The main role of transport, especially ABLex-H, in the O3 mass budget suggests the marked impacts of the ABL diurnal cycle on regional O3 pollution. Despite the less notable influence of transport on O3 concentration increase in comparison to that of photochemistry, massive O3 being transported into the ABL of the targeted region during the morning hours nearly determines the regional origins of O3 pollution. Quantified results combining the O3 mass budget and source apportionment are further discussed in Sect. 4.
3.3 Influences of regional wind fields on O3 pollution: more analyses of transport contributions in O3 budgets
As discussed before, the contributions of horizontal transport and ABLex-A were relatively limited in the two O3 budgets. However, they illustrate well the influences of regional wind fields, including the seasonal prevailing winds and local circulations (sea breezes), on O3 pollution in the PRD. Two main findings from the analyses of these transport contributions are presented below.
3.3.1 Transport contributions in autumn: the characteristics of prevailing winds
In the PRD, northerly and easterly winds prevail in autumn (as indicated by the wind roses in Fig. S3). Correspondingly, O3 was transported into the PRD through its north and east borders and out of the PRD through the south and west borders, as indicated by the O3 mass budget (Fig. 4). O3 masses transported out of the PRD were generally higher than those transported into the PRD during daytime. This is attributed to higher O3 concentrations in the downwind regions due to O3 production mostly from local emissions. “Low O3 in, high O3 out” also explains why horizontal transport led to the net decrease of O3 concentration during daytime. At night, O3 was still transported into the region through the north and east borders of the PRD, but these processes contributed to the increase of O3 concentrations. That is to say, with relatively higher O3 concentrations compared to those in the NOx-titrated urban atmosphere, air parcels transported from the upwind outskirts served as the supply to slow down nighttime O3 level decrease in the PRD due to chemistry and deposition.
The daytime contributions of ABLex-A in the O3 mass budget also indicate the effects of prevailing northerly winds. The PRD has mountainous regions in the northern, western and eastern outskirts, as well as urban regions with lower altitudes in the central plain (Fig. S5). As shown in Fig. S7a–b, the positive contributions of ABLex-A through the ABL top (in the z direction) can be found in the mountainous northern PRD, suggesting that northerly winds resulted in the downward transport of O3 along the terrain. Daytime ABL heights in urban regions were, in general, higher than those in the surrounding mountainous regions, which is the other reason why O3 can be transported through the ABL slope (in the x/y direction) near the urban–rural interfaces when northerly wind prevailed (Fig. S7c–d). For the O3 concentration budget, ABLex-A contributed to increased O3 concentration during several hours after sunrise but decreased O3 concentration in the afternoon. This different effect is attributed to different comparison results between ABL and above-ABL-mean O3 concentrations in the two periods (O3 concentration above the ABL is overall higher than that within the ABL in the morning, while the opposite is true for the afternoon; Fig. S4).
3.3.2 Transport contributions in summer: the influence of sea breezes
Although southerly winds normally prevail in summer in the PRD (Fig. S3), on O3 polluted days, air parcels from other directions could also influence the region (Qu et al., 2021a). Thus, the mean contribution of horizontal transport to O3 mass in summer was lower than in autumn. Of particular interest is the variation of the contributions of horizontal transport through the south border of the PRD before and after ∼14:00 LT, as indicated by the results of the O3 mass budget (Fig. 4). Besides, both O3 budgets suggest notable O3 mass and concentration decreases due to ABLex-A in the afternoon. These phenomena are both related to the influence of sea breezes.
Figure 5 shows the near-surface wind roses at 14:00, 16:00 and 18:00 LT of O3 polluted days in July 2016 based on the observational and modelling results in the national meteorological sites within the PRD. At 14:00 LT, the main wind directions were west, south-west and north-west in both datasets. More south and south-east winds occurred in later hours, and they became the prevailing winds at 18:00 LT, suggesting the gradual development of sea breezes in the PRD. Thus, O3 was originally transported out of the PRD through the south border with negative contributions to O3 mass; in the late afternoon, sea breezes reversed the directions of O3 transport, resulting in positive contributions to O3 mass by horizontal transport through the south border (Fig. 4). Moreover, the development of sea breezes is connected to the changes of wind fields not only horizontally but also vertically. Taking the O3 polluted day 24 July 2016 for example, the cross-section of O3 concentrations and wind fields in the PRD at 16:00 LT of the day is shown in Fig. 6 (the cross-section is made along the 113.2∘ E longitude, ranging from 26.0 to 20.0∘ N in latitude). Strong southerly wind and lower O3 concentrations are found in the southern PRD, indicating the influence of sea breezes during that time. Near the interfaces where sea breezes encountered local air parcels (indicated by the drastic increase in O3 concentrations from less than 100 to about 100–150 µg m−3), updrafts occurred, suggesting the formation of a sea breeze front (Ding et al., 2004; You and Fung, 2019). The front promoted the upward transport of O3 from the ABL, or considerable O3 mass decrease due to ABLex-A. Both horizontal transport and ABLex-A led to decreased O3 concentrations, because under the effect of sea breezes, clean air parcels were transported into the region and polluted air parcels were transported out of the region. The influence of sea breezes can also be seen in autumn but was weaker and occurred later than in summer. Besides, in autumn, horizontal transport through the south border of the PRD contributed to the increase of O3 concentration at night, indicating the effects of O3 recirculation from the “O3 pool” in the bay areas to the south of the PRD (Zeren et al., 2019, 2022).
Through the calculations and analyses of transport contributions in the two O3 budgets, the influences of complex transport processes on multiple scales to O3 concentration and mass can be well identified. These results provide a deeper understanding of how transport influences regional O3 pollution in the PRD.
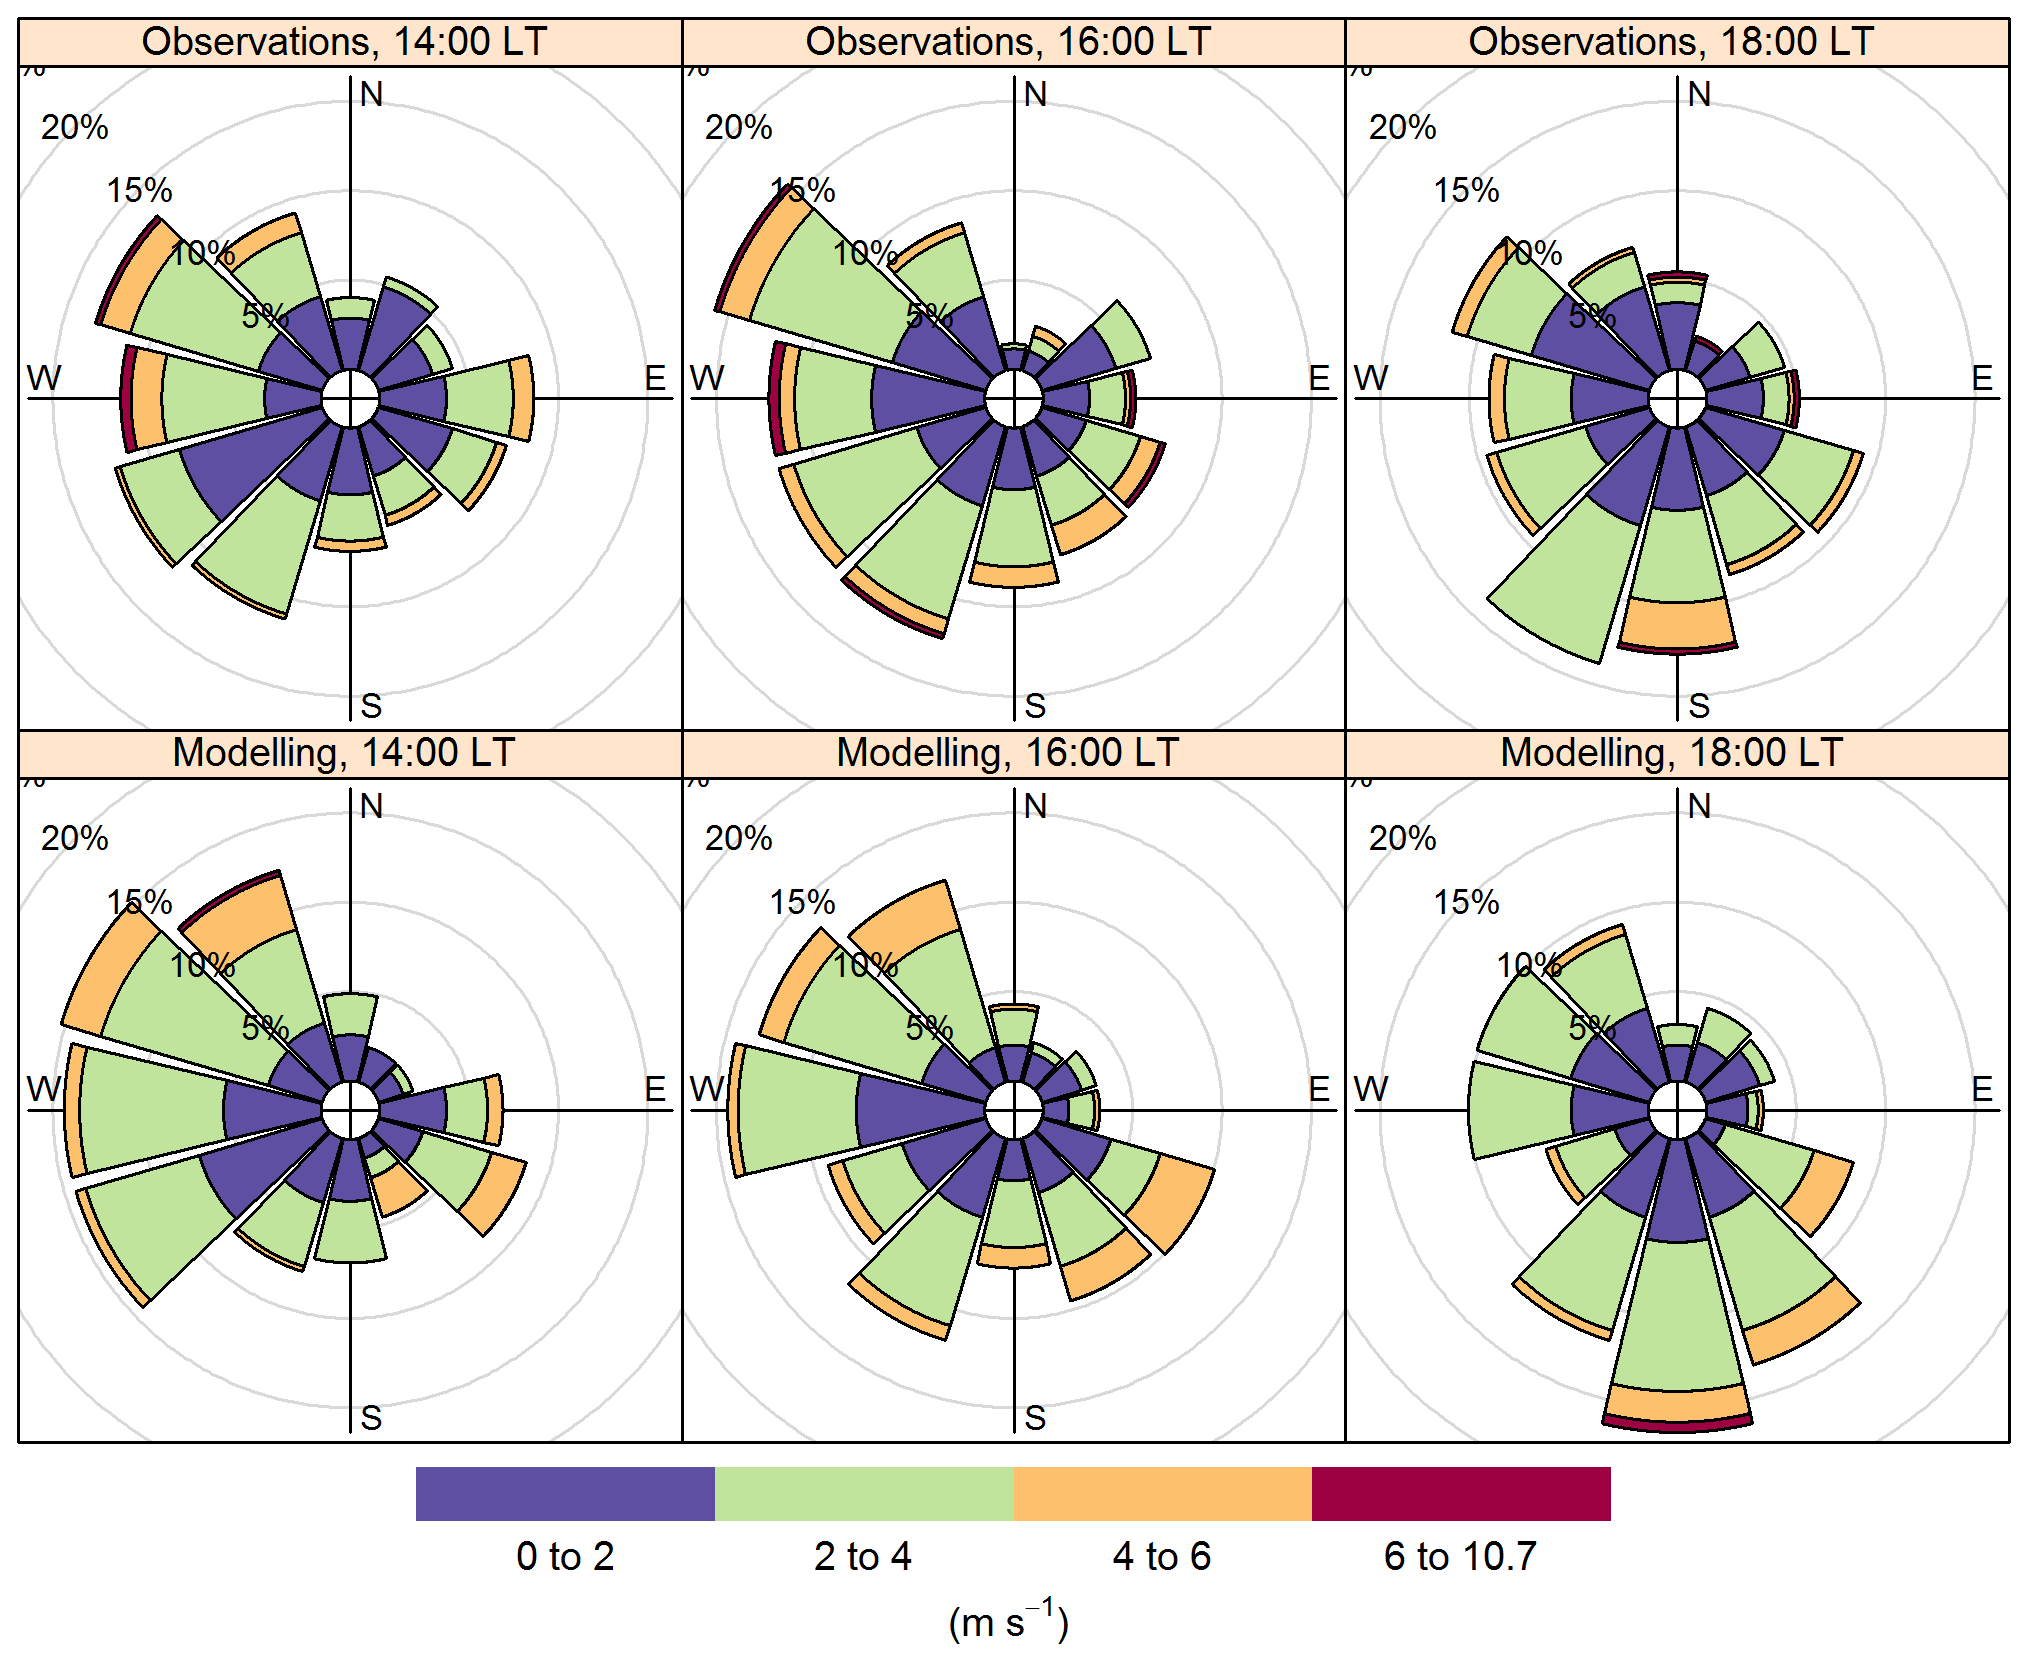
Figure 5Wind roses at 14:00, 16:00 and 18:00 local time (LT) of the O3 polluted days in July 2016 in the Pearl River Delta (PRD). Observational and modelling wind speeds and directions in 29 national meteorological sites within the PRD were used for this figure.
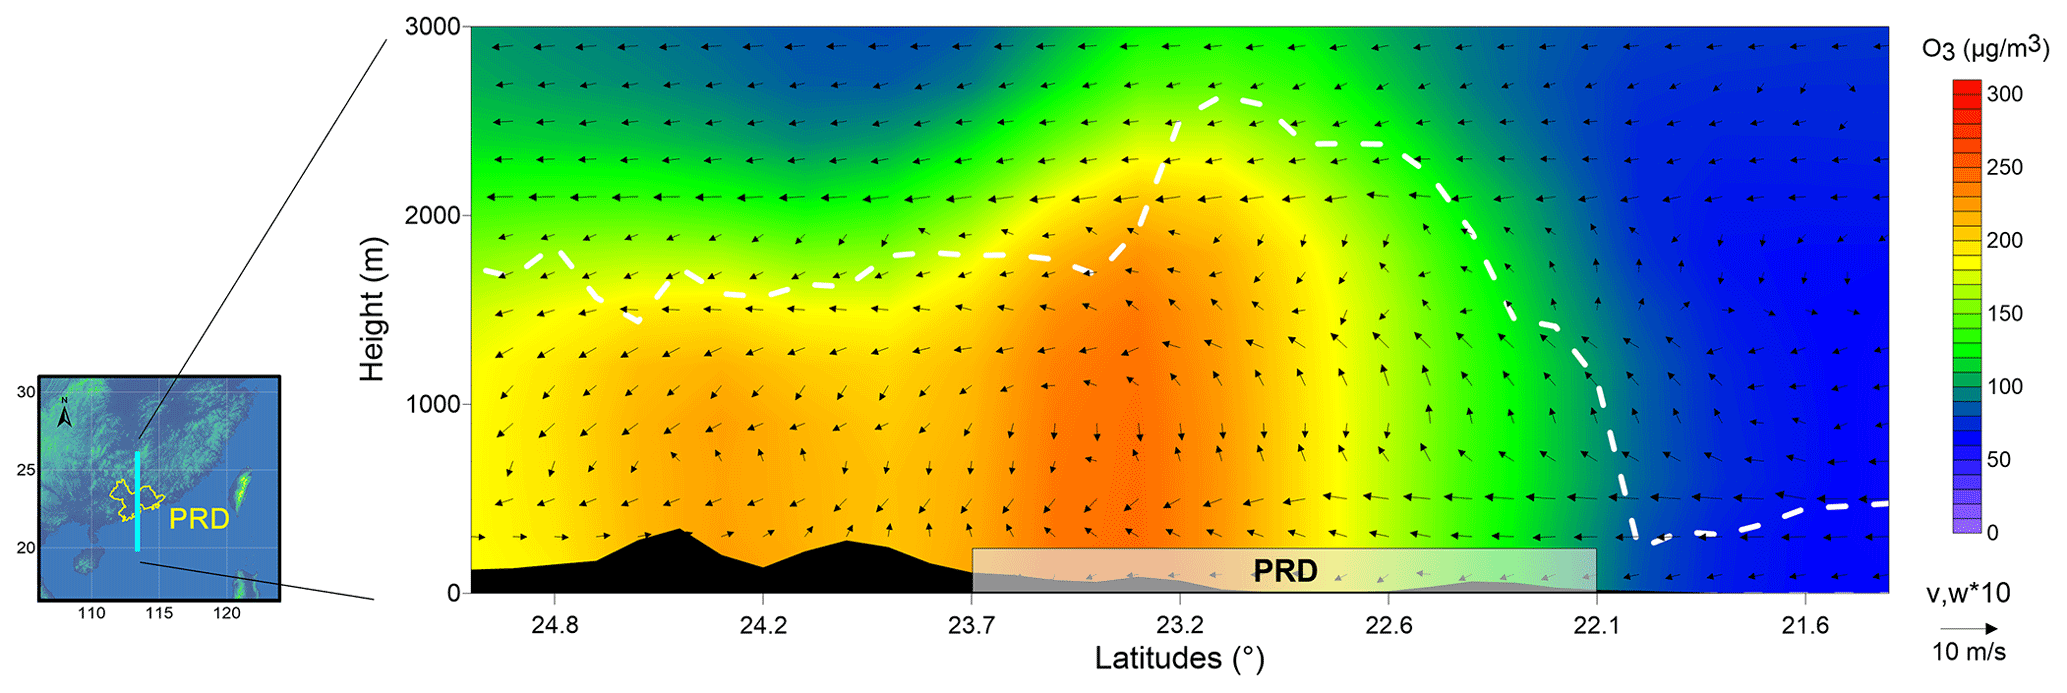
Figure 6Cross-section of O3 concentrations (µg m−3) and wind fields at 16:00 local time on 24 July 2016. The dashed white line indicates the top of the atmospheric boundary layer. PRD, Pearl River Delta.
Based on reported publications (Li et al., 2012, 2013; Yang et al., 2019; Gao et al., 2020), O3 in the PRD is mostly derived from emissions outside the PRD and background O3, rather than local emissions. This is the same for the O3 polluted days in the representative months of autumn and summer in this study, when the contributions of non-local sources account for, on average, 89 % and 65 % of the O3 in the PRD, respectively, in 09:00–17:00 LT (55 % and 32 % contributed by BCON and 34 % and 33 % contributed by EC-China in the 2 months; Qu et al., 2021a). To explain why non-local sources are dominant for O3 in the PRD, by combining O3 mass budget calculation with O3 source apportionment (method introduced in Sect. 2.6), we identified the regional origins of O3 mass changes due to vertical exchange through the ABL top, horizontal transport and gas-phase chemistry (Fig. 7). Here, the contributions of three sources to the O3 mass increase and decrease were both quantified. But further analyses focus on the results related to O3 mass increase, because the origins of O3 in the region are more likely to be influenced by the new O3 transported into and produced within the PRD.
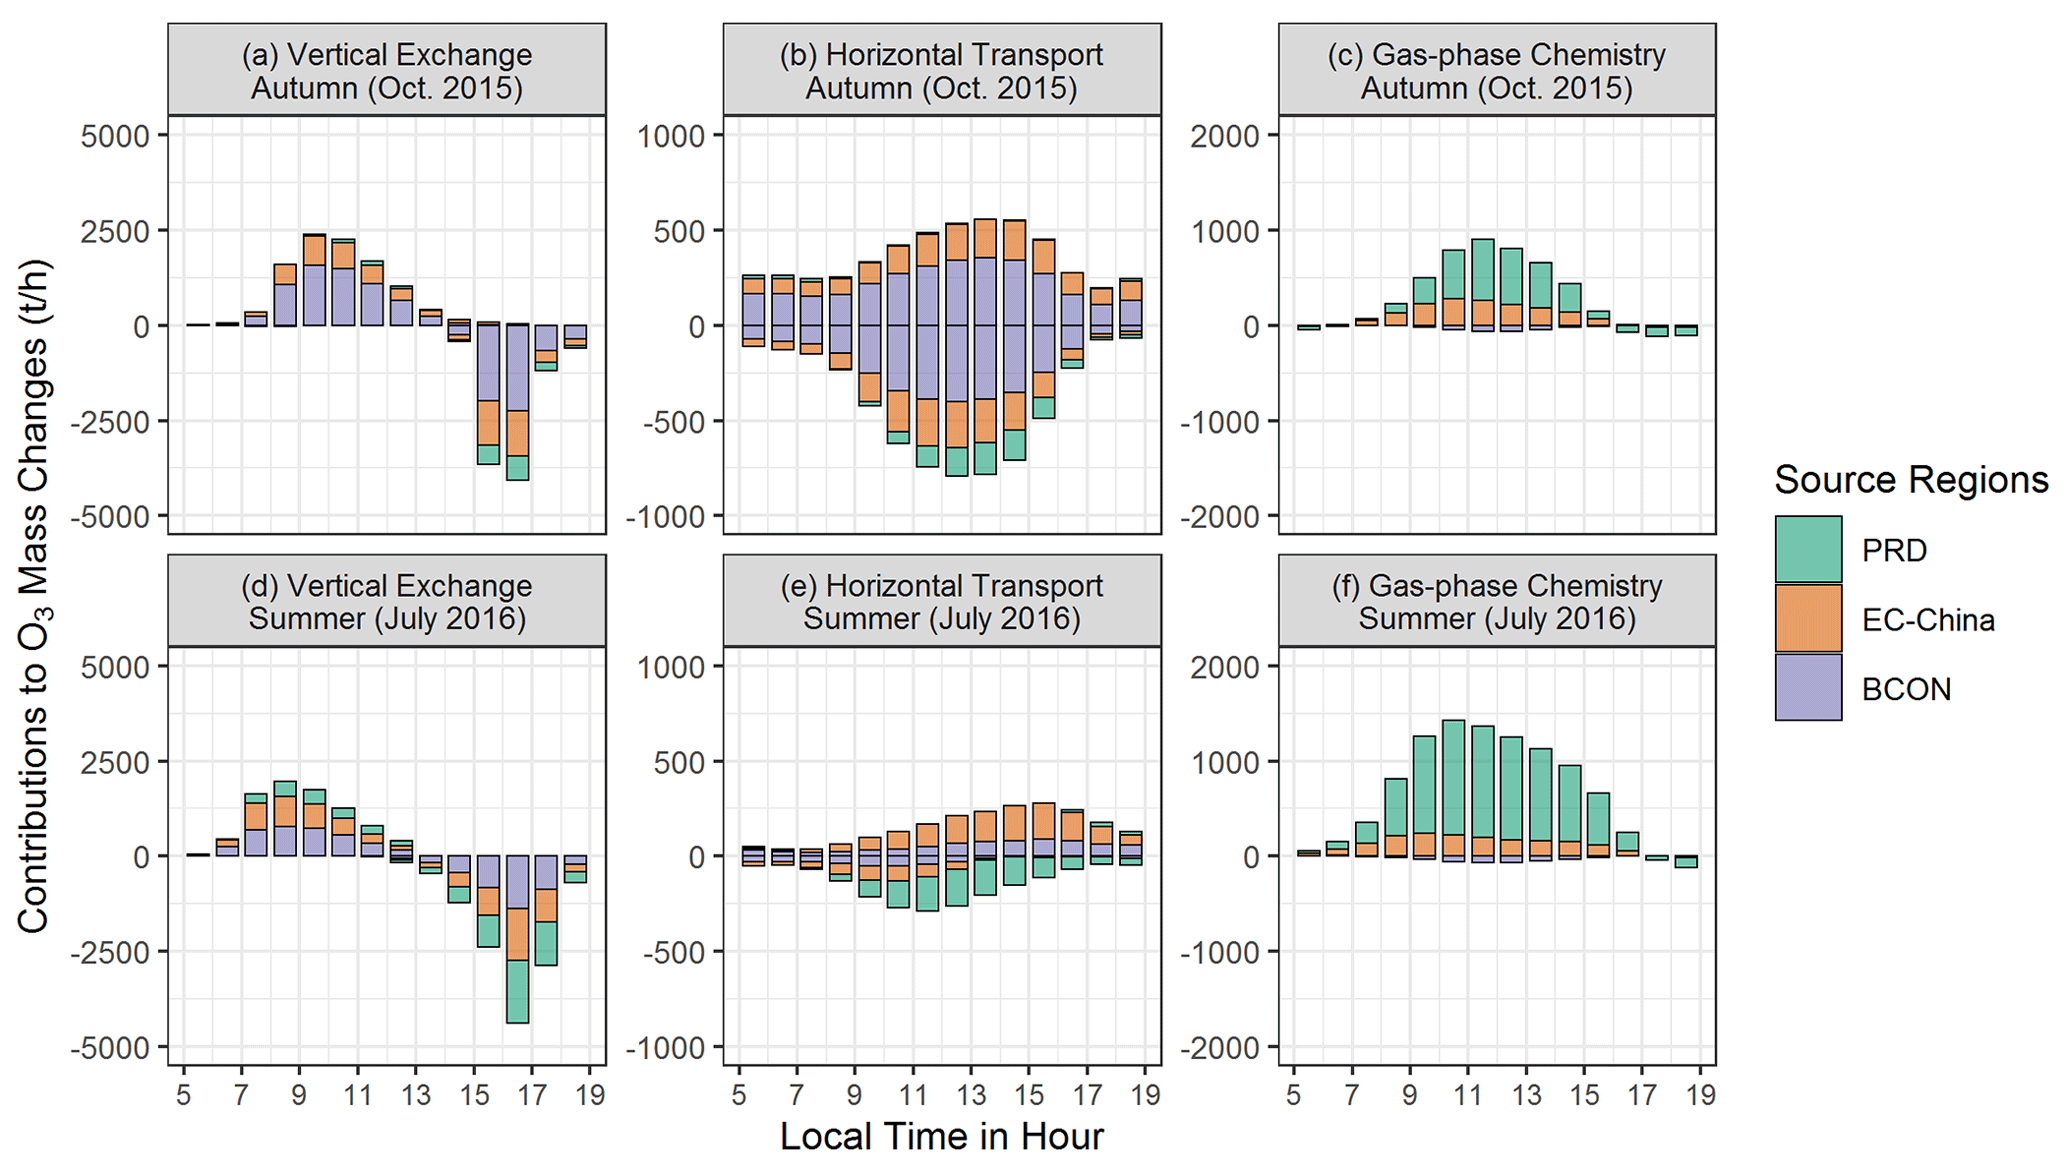
Figure 7The regional origins of hourly O3 mass changes contributed by (a, d) vertical exchange through the ABL top, (b, e) horizontal transport and (c, f) gas-phase chemistry on the polluted days of representative months in autumn (October 2015; a–c) and summer (July 2016; d–f). The results for the time window 05:00–19:00 LT are shown here. PRD, Pearl River Delta; EC-China, East and Central China; BCON, the boundary conditions of d02 modelling or the contribution of sources outside the d02. Note that the scales are different among the three columns.
Through vertical exchange through the ABL top, massive non-local O3 entered into the ABL of the PRD. In the morning-hour O3 mass increase due to this process, BCON and EC-China accounted for 65 % and 31 %, respectively, in autumn. By contrast, local emissions only contributed 4 % to this transported O3 during the same period, suggesting that local O3 was less likely to be recirculated back to the PRD during daytime. In summer, the contribution of local emissions in the O3 mass transported into the region through vertical exchange was higher than in autumn, reaching 20 % during the morning hours. However, non-local sources still dominated the O3 mass increase due to vertical exchange – the morning-hour contributions in percentage of BCON and EC-China were 42 % and 38 %, respectively.
O3 mass increase due to horizontal transport was connected to the contribution of non-local sources as well. In both seasons, O3 transported into the PRD originated almost exclusively from EC-China and BCON.
It is not surprising that most O3 produced through photochemistry (daytime gas-phase chemistry) was related to local emissions, of which the contributions accounted for 66 % and 82 % during the daytime of autumn (06:00–18:00 LT) and summer (05:00–19:00 LT), respectively. The contributions of EC-China emissions to the daytime O3 mass increase reached 34 % and 18 % in the two seasons, respectively, indicating that the influences of non-local O3 precursor import on local O3 photochemistry are also considerable in the PRD.
With the results of the O3 mass budget and the regional origins of O3 mass increase due to transport and photochemistry, the effect of O3-related processes on the origins of O3 can be revealed. Based on the O3 mass budget, the accumulated morning-hour O3 mass increase exceeded 10 000 t for both seasons, which is 6–9 times larger than the original O3 mass in the ABL of the PRD before sunrise (<1500 t). Thus, in the daytime, most O3 in the PRD was the new O3 contributed by transport and photochemistry, and the origins of O3 within the region were nearly determined by those of newly transported and produced O3. By combining the O3 mass budget and O3 source apportionment, we identified the O3 mass increase due to O3-related processes as local (PRD) and non-local (EC-China and BCON) contributions. According to the results discussed before, high contributions of transport in the morning-hour O3 mass increase and the dominance of non-local source contributions in this part of the new O3 ensure that non-local sources contributed to the most O3 in the PRD. Moreover, differences in the contributions of O3-related processes in the O3 mass budget as well as the origins of morning-hour O3 mass increase lead to varied origins of O3 in the region. For instance, when comparing the results of O3 source apportionment in the two seasons, we found that the contributions of non-local sources (local emissions) to O3 were lower (higher) in summer than in autumn. It can be attributed to the combined effects of increased photochemistry contributions (or decreased transport contributions) in the O3 mass increase and reduced non-local source contributions in both transported and chemically produced O3 in summer. Collectively, these changes lead to reduced non-local contributions (or higher local contributions) to O3.
By influencing O3 mass increase and its regional origins, transport and photochemistry determine the results of O3 source apportionment within the region. Specifically, transport (mainly ABLex-H) brings massive non-local O3 into the region in the morning, explaining why most O3 in the PRD is derived from non-local sources. However, accompanied with the simultaneous rapid increase of ABL volumes, this process has a relatively limited contribution to O3 concentration increase in comparison to photochemistry. The O3 concentration budget only concerns the influence of O3-related processes on the variations of O3 concentration; thus, it fails to illustrate the effect of transport on the regional origin of O3. Our results highlight the difference between the O3 concentration and mass budgets, which may result in distinct understandings about the role of transport and photochemistry in regional O3 pollution. To completely illustrate the effects of two O3-related processes on regional O3 pollution, insights from both O3 budgets are required.
To effectively alleviate O3 pollution, it is important to understand the respective role of transport and photochemistry in regional O3 pollution. The O3 concentration budget is widely used to quantify the contributions of these O3-related processes to the variations of O3 concentrations, and it often concludes that photochemistry is the main contributor to the aggravation of O3 pollution. However, it does not explain why most of the O3 is transported from the outside regions as indicated by O3 source apportionment studies. To comprehensively illustrate the effects of transport and photochemistry on regional O3 pollution, based on the modelling results of WRF-CMAQ, this study presents a method to quantify not only the O3 concentration budget but also the O3 mass budget, in which the contributions of O3-related processes (including transport and photochemistry) to the variations of mean O3 concentrations and total O3 mass within the ABL of the PRD are separately identified. The different effects of transport on O3 concentration and mass were considered in the above calculations. The O3 concentration budget in the PRD reveals that gas-phase chemistry, including daytime photochemistry and nighttime O3 titration/depletion, drives the variations of O3 concentration. Particularly, photochemistry contributed 74 % and 95 % to the O3 concentration increase in the morning hours of the autumn and summer months, respectively. In contrast, transport, especially the vertical exchange through the ABL top, is the main process contributing to the O3 mass increase in the morning (78 % and 53 % in autumn and summer, respectively) and decrease in the afternoon (>90 %). The diurnal changes of transport contributions in the two O3 budgets are closely connected to the variations of the ABL and regional wind fields, including the seasonal prevailing winds and local circulations (sea breezes), in the PRD. Massive O3, mostly derived from non-local sources, being transported into the ABL in the morning has a relatively limited influence on the O3 concentration increase (25 % and 5 % in autumn and summer, respectively) compared to photochemistry because of the rapid change of ABL volumes at the same time. However, this process nearly determines the dominance of non-local source contributions for daytime O3 in the PRD. The two O3 budgets show notable differences, but together they provide a more complete overview of the effects of transport and photochemistry on regional O3 pollution.
It should be noted that the conclusions in this study apply not only to O3 but also to other pollutants with moderately long atmospheric lifetimes, including fine particulate matter and some of its components. In theory, transport and chemical transformations are both important processes for these pollutants. However, transport has different effects on the concentration and mass of pollutants on an hourly scale, which is similar to the discussion in Sect. 2.4. Furthermore, besides regional origins, the difference between the two budgets may also contribute to the inconsistency of other characteristics of pollutants, such as the contributions of different reaction pathways and sensitivities to precursor emissions, identified by the concentration budget and mass-based methods. When large quantities of pollutants with different characteristics are transported into the region, the variation of their concentrations is often not perceptible and thus neglected in the concentration budget. However, as indicated by this study, the transport processes are likely to change or even determine the characteristics of pollutants within the region. Therefore, we suggest that attention should be paid to selecting a proper budget type and using correct budget calculation methods in related research. But to fully reveal the effects of transport, chemistry and other related processes on regional pollution, insights from both concentration and mass budgets are necessary.
Uncertainty remains in the calculated O3 budgets, which is partly related to the biases in the modelling results. Therefore, supporting observations are essential for future research. Recent progress in observational techniques (Zhao et al., 2021; Zhou et al., 2023) has enabled three-dimensional measurements of meteorological parameters and O3 concentrations with high spatiotemporal resolution and coverage. These data can be used not only for the model validation of key parameters in budget calculations but also for the comparisons between observation- and modelling-based contributions by various O3-related processes in O3 budgets (Kaser et al., 2017). The comparison of contributions by O3-related processes is indicative of the main uncertainties in O3 pollution modelling and is therefore also important for further model developments.
The present study concluded that transport and gas-phase chemistry play the main role in the O3 mass and concentration budgets, respectively. As a consequence of our assessment, the following is suggested for policy-makers. For areas where non-local emissions notably contribute to O3, emission reduction in the upwind regions can reduce the overall O3 concentrations effectively, which is a crucial step towards the long-term improvement of regional air quality. However, for short-term air pollution control, this strategy is not efficient because emission reduction in upwind regions may need to start days earlier before the polluted periods. In contrast, reducing local emissions is expected to lower the rapid daytime O3 concentration increase efficiently and, thereby, the O3 peak levels in the short term, as highlighted by the O3 concentration budget. The choice of the better strategy to be applied should depend on the specific objectives of O3 control (mean levels vs. peak levels; long term vs. short term), which are set based on a more in-depth understanding of O3 effects on human health, crop yields and ecosystems. More efforts are required to systematically evaluate the effects of different emission reduction strategies on alleviating the detrimental effects of O3.
The source codes of WRF and CMAQ are available at the sites https://doi.org/10.5065/D68S4MVH (Skamarock et al., 2008) and https://doi.org/10.5281/zenodo.1079898 (US EPA Office of Research and Development, 2014), respectively. The FNL meteorological input files were downloaded from the site https://doi.org/10.5065/D6M043C6 (National Centers for Environmental Prediction, National Weather Service, NOAA, and U.S. Department of Commerce, 2000). The MEIC v1.3 anthropogenic emission inventory is available at http://meicmodel.org/?page_id=560 (Li et al., 2017b; Zheng et al., 2018). The source codes of MEGAN can be found at https://bai.ess.uci.edu/megan/data-and-code (Guenther et al., 2012). The IAGOS dataset used in model validation was searched and downloaded from http://iagos-data.fr (Petzold et al. 2015), which includes all profiles measured in flights taking off from and landing in Hong Kong during the 2 representative months. We also provided the initial Fortran code used in ozone budget calculations and hourly O3 concentration and mass budget results in the 2 representative months (the initial data of Fig. 4) at https://doi.org/10.5281/Zenodo.6259253 (Qu et al., 2022).
The supplement related to this article is available online at: https://doi.org/10.5194/acp-23-7653-2023-supplement.
KQ, XW and YZ designed the study. KQ, XW and TX did the simulations using the WRF-CMAQ model. JS, LZ and YZ provided the observational results for model validation. KQ, XW, XC, YY, XJ and YZ developed the post-processing tool flux_4d_cal and conducted and analysed O3 budget results. KQ, XW, MV, MK, GPB and YZ wrote and/or revised this paper, with critical feedback from all other authors.
At least one of the (co-)authors is a member of the editorial board of Atmospheric Chemistry and Physics. The peer-review process was guided by an independent editor, and the authors also have no other competing interests to declare.
Publisher’s note: Copernicus Publications remains neutral with regard to jurisdictional claims in published maps and institutional affiliations.
This research has been supported by the National Key Research and Development Program of China (grant no. 2018YFC0213204), the National Science and Technology Pillar Program of China (grant no. 2014BAC21B01), and the Deutsche Forschungsgemeinschaft co-funded DFG-NSFC Sino-German Air-Changes project (grant no. 448720203).
The article processing charges for this open-access publication were covered by the University of Bremen.
This paper was edited by Andrea Pozzer and reviewed by three anonymous referees.
Ainsworth, E. A.: Understanding and improving global crop response to ozone pollution, Plant J., 90, 886–897, https://doi.org/10.1111/tpj.13298, 2017.
Bates, K. H. and Jacob, D. J.: An expanded definition of the odd oxygen family for tropospheric ozone budgets: Implications for ozone lifetime and stratospheric influence, Geophys. Res. Lett., 47, e2019GL084486, https://doi.org/10.1029/2019GL084486, 2019.
Boian, C. and Andrade, M. D. F.: Characterization of ozone transport among metropolitan regions, Rev. Bras. Meteorol., 27, 229–242, https://doi.org/10.1590/S0102-77862012000200009, 2012.
Carter, W. P. L.: Development of the SAPRC-07 chemical mechanism, Atmos. Environ., 44, 5324–5335, https://doi.org/10.1016/j.atmosenv.2010.01.026, 2010.
Chang, X., Wang, S., Zhao, B., Cai, S., and Hao, J.: Assessment of inter-city transport of particulate matter in the Beijing–Tianjin–Hebei region, Atmos. Chem. Phys., 18, 4843–4858, https://doi.org/10.5194/acp-18-4843-2018, 2018.
Clappier, A., Belis, C. A., Pernigotti, D., and Thunis, P.: Source apportionment and sensitivity analysis: two methodologies with two different purposes, Geosci. Model Dev., 10, 4245–4256, https://doi.org/10.5194/gmd-10-4245-2017, 2017.
Ding, A., Wang, T., Zhao, M., Wang, T. J., and Li, Z. K.: Simulation of sea-land breezes and a discussion of their implications on the transport of air pollution during a multi-day ozone episode in the Pearl River Delta of China, Atmos. Environ., 38, 6737–6750, https://doi.org/10.1016/j.atmosenv.2004.09.017, 2004.
Emmons, L. K., Walters, S., Hess, P. G., Lamarque, J.-F., Pfister, G. G., Fillmore, D., Granier, C., Guenther, A., Kinnison, D., Laepple, T., Orlando, J., Tie, X., Tyndall, G., Wiedinmyer, C., Baughcum, S. L., and Kloster, S.: Description and evaluation of the Model for Ozone and Related chemical Tracers, version 4 (MOZART-4), Geosci. Model Dev., 3, 43–67, https://doi.org/10.5194/gmd-3-43-2010, 2010 (data available at: https://www.acom.ucar.edu/wrf-chem/mozart.shtml, last access: 10 July 2023).
Fishman, J., Wozniak, A. E., and Creilson, J. K.: Global distribution of tropospheric ozone from satellite measurements using the empirically corrected tropospheric ozone residual technique: Identification of the regional aspects of air pollution, Atmos. Chem. Phys., 3, 893–907, https://doi.org/10.5194/acp-3-893-2003, 2003.
Fleming, Z. L., Doherty, R. M., von Schneidemesser, E., Malley, C. S., Cooper, O. R., Pinto, J. P., Colette, A., Xu, X. B., Simpson, D., Schultz, M. G., Lefohn, A. S., Hamad, S., Moolla, R., Solberg, S., and Feng, Z. Z.: Tropospheric ozone assessment report: Present-day ozone distribution and trends relevant to human health, Elementa-Sci. Anthrop., 6, 12, https://doi.org/10.1525/elementa.273, 2018.
Fowler, D., Brimblecombe, P., Burrows, J., Heal, M. R., Grennfelt, P., Stevenson, D. S., Jowett, A., Nemitz, E., Coyle, M., Liu, X., Chang, Y., Fuller, G. W., Sutton, M. A., Klimont, Z., Unsworth, M. H., and Vieno, M.: A chronology of global air quality, Philos. T. R. Soc. A, 378, 20190314, https://doi.org/10.1098/rsta.2019.0314, 2020.
Gao, M., Gao, J., Zhu, B., Kumar, R., Lu, X., Song, S., Zhang, Y., Jia, B., Wang, P., Beig, G., Hu, J., Ying, Q., Zhang, H., Sherman, P., and McElroy, M. B.: Ozone pollution over China and India: seasonality and sources, Atmos. Chem. Phys., 20, 4399–4414, https://doi.org/10.5194/acp-20-4399-2020, 2020.
Gao, X., Deng, X., Tan, H., Wang, C., Wang, N., and Yue, D.: Characteristics and analysis on regional pollution process and circulation weather types over Guangdong Province, Acta Scientiae Circumstantiae, 38, 1708–1716, https://doi.org/10.13671/j.hjkxxb.2017.0473, 2018 (in Chinese).
Guenther, A. B., Jiang, X., Heald, C. L., Sakulyanontvittaya, T., Duhl, T., Emmons, L. K., and Wang, X.: The Model of Emissions of Gases and Aerosols from Nature version 2.1 (MEGAN2.1): an extended and updated framework for modeling biogenic emissions, Geosci. Model Dev., 5, 1471–1492, https://doi.org/10.5194/gmd-5-1471-2012, 2012 (code available at: https://bai.ess.uci.edu/megan/data-and-code, last access: 10 July 2023).
Guo, J. J., Fiore, A. M., Murray, L. T., Jaffe, D. A., Schnell, J. L., Moore, C. T., and Milly, G. P.: Average versus high surface ozone levels over the continental USA: model bias, background influences, and interannual variability, Atmos. Chem. Phys., 18, 12123–12140, https://doi.org/10.5194/acp-18-12123-2018, 2018.
Hou, X., Zhu, B., Kang, H., and Gao, J.: Analysis of seasonal ozone budget and spring ozone latitudinal gradient variation in the boundary layer of the Asia-Pacific region, Atmos. Environ., 94, 734–741, https://doi.org/10.1016/j.atmosenv.2014.06.006, 2014.
Hu, J., Li, Y., Zhao, T., Liu, J., Hu, X.-M., Liu, D., Jiang, Y., Xu, J., and Chang, L.: An important mechanism of regional O3 transport for summer smog over the Yangtze River Delta in eastern China, Atmos. Chem. Phys., 18, 16239–16251, https://doi.org/10.5194/acp-18-16239-2018, 2018.
Janssen, R. H. H. and Pozzer, A.: Description and implementation of a MiXed Layer model (MXL, v1.0) for the dynamics of the atmospheric boundary layer in the Modular Earth Submodel System (MESSy), Geosci. Model Dev., 8, 453–471, https://doi.org/10.5194/gmd-8-453-2015, 2015.
Jin, X., Cai, X., Huang, Q., Wang, X., Song, Y., and Zhu, T.: Atmospheric boundary layer–free troposphere air exchange in the North China Plain and its impact on PM2.5 pollution, J. Geophys. Res.-Atmos., 126, e2021JD034641, https://doi.org/10.1029/2021JD034641, 2021.
Kaser, L., Patton, E. G., Pfister, G. G., Weinheimer, A. J., Montzka, D. D., Flocke, F., Thompson, A. M., Stauffer, R. M., and Halliday, H. S.: The effect of entrainment through atmospheric boundary layer growth on observed and modeled surface ozone in the Colorado Front Range, J. Geophys. Res.-Atmos., 122, 6075–6093, https://doi.org/10.1002/2016JD026245, 2017.
Laughner, J. L. and Cohen, R. C.: Direct observation of changing NOx lifetime in North American cities, Science, 366, 723–727, https://doi.org/10.1126/science.aax6832, 2019.
Lee, X.: Fundamentals of Boundary-Layer Meteorology, Springer Atmospheric Sciences, https://doi.org/10.1007/978-3-319-60853-2, 2018.
Lelieveld, J., Hoor, P., Jöckel, P., Pozzer, A., Hadjinicolaou, P., Cammas, J.-P., and Beirle, S.: Severe ozone air pollution in the Persian Gulf region, Atmos. Chem. Phys., 9, 1393–1406, https://doi.org/10.5194/acp-9-1393-2009, 2009.
Lenschow, D. H., Pearson, R., and Stankov, B. B.: Estimating the ozone budget in the boundary layer by use of aircraft measurements of ozone eddy flux and mean concentration, J. Geophys. Res., 86, 7291–7297, https://doi.org/10.1029/JC086iC08p07291, 1981.
Li, L., Xie, F., Li, J., Gong, K., Xie, X., Qin, Y., Qin, M., and Hu, J.: Diagnostic analysis of regional ozone pollution in Yangtze River Delta, China: A case study in summer 2020, Sci. Total Environ., 812, 151511, https://doi.org/10.1016/j.scitotenv.2021.151511, 2021.
Li, M., Zhang, Q., Kurokawa, J.-I., Woo, J.-H., He, K., Lu, Z., Ohara, T., Song, Y., Streets, D. G., Carmichael, G. R., Cheng, Y., Hong, C., Huo, H., Jiang, X., Kang, S., Liu, F., Su, H., and Zheng, B.: MIX: a mosaic Asian anthropogenic emission inventory under the international collaboration framework of the MICS-Asia and HTAP, Atmos. Chem. Phys., 17, 935–963, https://doi.org/10.5194/acp-17-935-2017, 2017a.
Li, M., Liu, H., Geng, G., Hong, C., Liu, F., Song, Y., Tong, D., Zheng, B., Cui, H., Man, H., Zhang, Q., and He, K.: Anthropogenic emission inventories in China: a review, Natl. Sci. Rev., 4, 834–866, https://doi.org/10.1093/nsr/nwx150, 2017b (data available at: http://meicmodel.org/?page_id=560, last access: 10 July 2023).
Li, Y., Lau, A. K. H., Fung, J. C. H., Zheng, J.Y., Zhong, L. J., and Louie, P. K. K.: Ozone source apportionment (OSAT) to differentiate local regional and super-regional source contributions in the Pearl River Delta region, China, J. Geophys. Res.-Atmos., 117, D15305, https://doi.org/10.1029/2011JD017340, 2012.
Li, Y., Lau, A. K. H., Fung, J. C. H., Ma, H., and Tse, Y.: Systematic evaluation of ozone control policies using an Ozone Source Apportionment method, Atmos. Environ., 76, 136–146, https://doi.org/10.1016/j.atmosenv.2013.02.033, 2013.
Liu, F., Beirle, S., Zhang, Q., Dörner, S., He, K., and Wagner, T.: NOx lifetimes and emissions of cities and power plants in polluted background estimated by satellite observations, Atmos. Chem. Phys., 16, 5283–5298, https://doi.org/10.5194/acp-16-5283-2016, 2016.
Liu, H. L., Zhang, M. G., and Han, X.: A review of surface ozone source apportionment in China, Atmos. Ocean. Sci. Lett., 13, 470–484, https://doi.org/10.1080/16742834.2020.1768025, 2020.
Liu, P., Zhang, Y., Yu, S. C., and Schere, K. L.: Use of a Process Analysis tool for diagnostic study on fine particulate matter predictions in the U.S. Part II: Process Analysis and sensitivity simulations, Atmos. Pollut. Res., 2, 61–71, https://doi.org/10.5094/APR.2011.008, 2011.
Massagué, J., Carnerero, C., Escudero, M., Baldasano, J. M., Alastuey, A., and Querol, X.: 2005–2017 ozone trends and potential benefits of local measures as deduced from air quality measurements in the north of the Barcelona metropolitan area, Atmos. Chem. Phys., 19, 7445–7465, https://doi.org/10.5194/acp-19-7445-2019, 2019.
Mills, G., Wagg, S., and Harmens, H.: Ozone pollution: impacts on ecosystem services and biodiversity (CEH Project no. C04062, C04325), Bangor, UK, NERC/Centre for Ecology & Hydrology, ISBN 9781906698393, 2013.
Myriokefalitakis, S., Daskalakis, N., Fanourgakis, G. S., Voulgarakis, A., Krol, M. C., de Brugh, J. A., and Kanakidou, M.: Ozone and carbon monoxide budgets over the Eastern Mediterranean, Sci. Total Environ., 563, 40–52, https://doi.org/10.1016/j.scitotenv.2016.04.061, 2016.
Naik, V., Szopa, S., Adhikary, B., Artaxo, P., Berntsen, T., Collins, W. D., Fuzzi, S., Gallardo, L., Kiendler Scharr, A., Klimont, Z., Liao, H., Unger, N., and Zanis, P.: Short-Lived Climate Forcers, in: Climate Change 2021: The Physical Science Basis. Contribution of Working Group I to the Sixth Assessment Report of the Intergovernmental Panel on Climate Change, edited by: Masson-Delmotte, V., Zhai, P., Pirani, A., Connors, S. L., Péan, C., Berger, S., Caud, N., Chen, Y., Goldfarb, L., Gomis, M. I., Huang, M., Leitzell, K., Lonnoy, E., Matthews, J. B. R., Maycock, T. K., Waterfield, T., Yelekçi, O., Yu, R., and Zhou, B., Cambridge University Press, Cambridge, United Kingdom and New York, NY, USA, 817–922, https://doi.org/10.1017/9781009157896.008, 2021.
National Centers for Environmental Prediction, National Weather Service, NOAA, and U.S. Department of Commerce: NCEP FNL Operational Model Global Tropospheric Analyses [data set], https://doi.org/10.5065/D6M043C6, 2000.
Novel, D. P.: The OTC challenge: Adding VOC controls in the northeast, J. Air Waste Manage., 42, 1053–1056, https://doi.org/10.1080/10473289.1992.10467050, 1992.
Pay, M. T., Gangoiti, G., Guevara, M., Napelenok, S., Querol, X., Jorba, O., and Pérez García-Pando, C.: Ozone source apportionment during peak summer events over southwestern Europe, Atmos. Chem. Phys., 19, 5467–5494, https://doi.org/10.5194/acp-19-5467-2019, 2019.
Petzold, A., Thouret, V., Gerbig, C., Zahn, A., Brenninkmeijer, C. A. M., Gallagher, M., Hermann, M., Pontaud, M., Ziereis, H., Boulanger, D., Marshall, J., Nédélec, P., Smit, H. G. J., Friess, U., Flaud, J.-M., Wahner, A., Cammas, J.-P., Volz-Thomas, A., and IAGOS TEAM: Global-scale atmosphere monitoring by in-service aircraft–current achievements and future prospects of the European Research Infrastructure IAGOS, Tellus B, 67, 28452, https://doi.org/10.3402/tellusb.v67.28452, 2015 (data available at: http://iagos-data.fr, last access: 10 July 2023).
Qu, K., Wang, X., Yan, Y., Shen, J., Xiao, T., Dong, H., Zeng, L., and Zhang, Y.: A comparative study to reveal the influence of typhoons on the transport, production and accumulation of O3 in the Pearl River Delta, China, Atmos. Chem. Phys., 21, 11593–11612, https://doi.org/10.5194/acp-21-11593-2021, 2021a.
Qu, K., Wang, X., Xiao, T., Shen, J., Lin, T., Chen, D., He, L., Huang, X., Zeng, L., Lu, K., Ou, Y., and Zhang, Y.: Cross-regional transport of PM2.5 nitrate in the Pearl River Delta, China: Contributions and mechanisms, Sci. Total Environ., 753, 142439, https://doi.org/10.1016/j.scitotenv.2020.142439, 2021b.
Qu, K., Wang, X., Cai, X., Zhang, Y., Yan, Y., and Jin, X.: Rethinking the Roles of Transport and Photochemistry in Regional Ozone Pollution: Insights from Ozone Mass and Concentration Budgets, Zenodo [data set], https://doi.org/10.5281/zenodo.6259253, 2022.
Reid, N., Yap, D., and Bloxam, R.: The potential role of background ozone on current and emerging air issues: An overview, Air Qual. Atmos. Hlth., 1, 19–29, https://doi.org/10.1007/s11869-008-0005-z, 2008.
Schultz, M. G., Schröder, S., Lyapina, O., Cooper, O., Galbally, I., Petropavlovskikh, I., Von Schneidemesser, E., Tanimoto, H., Elshorbany, Y., Naja, M., Seguel, R., Dauert, U., Eckhardt, P., Feigenspahn, S., Fiebig, M., Hjellbrekke, A.-G., Hong, Y.-D., Kjeld, P. C., Koide, H., Lear, G., Tarasick, D., Ueno, M., Wallasch, M., Baumgardner, D., Chuang, M.-T., Gillett, R., Lee, M., Molloy, S., Moolla, R., Wang, T., Sharps, K., Adame, J. A., Ancellet, G., Apadula, F., Artaxo, P., Barlasina, M., Bogucka, M., Bonasoni, P., Chang, L., Colomb, A., Cuevas, E., Cupeiro, M., Degorska, A., Ding, A., Fröhlich, M., Frolova, M., Gadhavi, H., Gheusi, F., Gilge, S., Gonzalez, M. Y., Gros, V., Hamad, S. H., Helmig, D., Henriques, D., Hermansen, O., Holla, R., Huber, J., Im, U., Jaffe, D. A., Komala, N., Kubistin, D., Lam, K.-S., Laurila, T., Lee, H., Levy, I., Mazzoleni, C., Mazzoleni, L., McClure-Begley, A., Mohamad, M., Murovic, M., Navarro-Comas, M., Nicodim, F., Parrish, D., Read, K. A., Reid, N., Ries, L., Saxena, P., Schwab, J. J., Scorgie, Y., Senik, I., Simmonds, P., Sinha, V., Skorokhod, A., Spain, G., Spangl, W., Spoor, R., Springston, S. R., Steer, K., Steinbacher, M., Suharguniyawan, E., Torre, P., Trickl, T., Weili, L., Weller, R., Xu, X., Xue, L., and Zhiqiang, M.: Tropospheric ozone assessment report: Database and metrics data of global surface ozone observations, Elementa-Sci. Anthrop., 5, 58, https://doi.org/10.1525/elementa.244, 2017.
Seinfeld, J. H. and Pandis, S. N.: Atmospheric chemistry and physics: from air pollution to climate change, John Wiley & Sons, ISBN 9781119221166, 2016.
Sinclair, V. A., Belcher, S. E., and Gray, S. L.: Synoptic controls on boundary-layer characteristics, Bound.-Lay. Meteorol., 134, 387–409, https://doi.org/10.1007/s10546-009-9455-6, 2010.
Sitch, S., Cox, P. M., Collins, W. J., and Huntingford, C.: Indirect radiative forcing of climate change through ozone effects on the land-carbon sink, Nature, 448, 791–795, https://doi.org/10.1038/nature06059, 2007.
Skamarock, W. C., Klemp, J. B., Dudhia, J., Gill, D. O., Barker, D. M., Duda, M., Huang, X. Y., Wang, W., and Powers, J. G.: A Description of the Advanced Research WRF Version 3, National Center for Atmospheric Research NCAR/TN-475+STR [code], https://doi.org/10.5065/D68S4MVH, 2008.
Stevenson, D. S., Dentener, F. J., Schultz, M. G., Ellingsen, K., van Noije, T. P. C., Wild, O., Zeng, G., Amann, M., Atherton, C. S., Bell, N., Bergmann, D. J., Bey, I., Butler, T., Cofala, J., Collins, W. J., Derwent, R. G., Doherty, R. M., Drevet, J., Eskes, H. J., Fiore, A. M., Gauss, M., Hauglustaine, D. A., Horowitz, L. W., Isaksen, I. S. A., Krol, M. C., Lamarque, J.-F., Lawrence, M. G., Montanaro, V., Müller, J.-F., Pitari, G., Prather, M. J., Pyle, J. A., Rast, S., Rodriguez, J. M., Sanderson, M. G., Savage, N. H., Shindell, D. T., Strahan, S. E., Sudo, K., and Szopa, S.: Multimodel ensemble simulations of present-day and near-future tropospheric ozone, J. Geophys. Res., 111, D08301, https://doi.org/10.1029/2005JD006338, 2006.
Su, R., Lu, K. D., Yu, J. Y., Tan, Z. F., Jiang, M. Q., Li, J., Xie, S. D., Wu, Y. S., Zeng, L. M., Zhai, C. Z., and Zhang, Y. H.: Exploration of the formation mechanism and source attribution of ambient ozone in Chongqing with an observation-based model, Sci. China Earth Sci., 61, 23–32, https://doi.org/10.1007/s11430-017-9104-9, 2018.
Tan, Z., Lu, K., Jiang, M., Su, R., Dong, H., Zeng, L., Xie, S., Tan, Q., and Zhang, Y.: Exploring ozone pollution in Chengdu, southwestern China: A case study from radical chemistry to O3-VOC-NOx sensitivity, Sci. Total Environ., 636, 775–786, https://doi.org/10.1016/j.scitotenv.2018.04.286, 2018.
Tan, Z., Lu, K., Jiang, M., Su, R., Wang, H., Lou, S., Fu, Q., Zhai, C., Tan, Q., Yue, D., Chen, D., Wang, Z., Xie, S., Zeng, L., and Zhang, Y.: Daytime atmospheric oxidation capacity in four Chinese megacities during the photochemically polluted season: a case study based on box model simulation, Atmos. Chem. Phys., 19, 3493–3513, https://doi.org/10.5194/acp-19-3493-2019, 2019.
Thunis, P., Clappier, A., Tarrason, L., Cuvelier, C., Monteiro, A., Pisoni, E., Wesseling, J., Belis, C. A., Pirovano, G., Janssen, S., Guerreiro, C., and Peduzzi, E.: Source apportionment to support air quality planning: Strengths and weaknesses of existing approaches, Environ. Int., 130, 104825, https://doi.org/10.1016/j.envint.2019.05.019, 2019.
Trousdell, J. F., Conley, S. A., Post, A., and Faloona, I. C.: Observing entrainment mixing, photochemical ozone production, and regional methane emissions by aircraft using a simple mixed-layer framework, Atmos. Chem. Phys., 16, 15433–15450, https://doi.org/10.5194/acp-16-15433-2016, 2016.
Trousdell, J. F., Caputi, D., Smoot, J., Conley, S. A., and Faloona, I. C.: Photochemical production of ozone and emissions of NOx and CH4 in the San Joaquin Valley, Atmos. Chem. Phys., 19, 10697–10716, https://doi.org/10.5194/acp-19-10697-2019, 2019.
US EPA Office of Research and Development: CMAQv5.0.2 (5.0.2), Zenodo [code], https://doi.org/10.5281/zenodo.1079898, 2014.
Vilà-Guerau De Arellano, J., van Heerwaarden, C. C., van Stratum, B. J. H., and van den Dries, K.: Atmospheric Boundary Layer: Integrating Air Chemistry and Land Interactions, Cambridge University Press, New York, ISBN 9781316300275, 2015.
Yan, F., Gao, Y., Ma, M., Liu, C., Ji, X., Zhao, F., Yao, X., and Gao, H.: Revealing the modulation of boundary conditions and governing processes on ozone formation over northern China in June 2017, Environ. Pollut., 272, 115999, https://doi.org/10.1016/j.envpol.2020.115999, 2021.
Yang, L., Wang, X., and Chen, Q.: New method for investigating regional interactions of air pollutants (in Chinese), Acta Sci. Circumstantiae, 32, 528–536, https://doi.org/10.13671/j.hjkxxb.2012.03.012, 2012.
Yang, W., Chen, H., Wang, W., Wu, J., Li, J., Wang, Z., Zheng, J., and Chen, D.: Modeling study of ozone source apportionment over the Pearl River Delta in 2015, Environ. Pollut., 253, 393–402, https://doi.org/10.1016/j.envpol.2019.06.091, 2019.
You, C. and Fung, J. C. H.: Characteristics of the sea-breeze circulation in the Pearl River Delta region and its dynamical diagnosis, J. Appl. Meteorol. Climatol., 58, 741–755, https://doi.org/10.1175/JAMC-D-18-0153.1, 2019.
Yu, D., Tan, Z., Lu, K., Ma, X., Li, X., Chen, S., Zhu, B., Lin, L., Li, Y., Qiu, P., Yang, X., Liu, Y., Wang, H., He, L., Huang, X., and Zhang, Y.: An explicit study of local ozone budget and NOx-VOCs sensitivity in Shenzhen China, Atmos. Environ., 224, 117304, https://doi.org/10.1016/j.atmosenv.2020.117304, 2020.
Zeren, Y., Guo, H., Lyu, X., Jiang, F., Wang, Y., Liu, X., Zeng, L., Li, M., and Li, L.: An Ozone “Pool” in South China: Investigations on Atmospheric Dynamics and Photochemical Processes Over the Pearl River Estuary, J. Geophys. Res., 124, 12340–12355, https://doi.org/10.1029/2019jd030833, 2019.
Zeren, Y., Zhou, B., Zheng, Y., Jiang, F., Lyu, X., Xue, L., Wang, H., Liu, X., and Guo, H.: Does Ozone Pollution Share the Same Formation Mechanisms in the Bay Areas of China?, Environ. Sci. Technol., 56, 14326–14337, https://doi.org/10.1021/acs.est.2c05126, 2022.
Zhang, J. J., Wei, Y., and Fang, Z.: Ozone pollution: A major health hazard worldwide, Front. Immunol., 10, 2518, https://doi.org/10.3389/fimmu.2019.02518, 2019.
Zhao, R., Hu, Q., Sun, Z., Wu, Y., Xing, C., Liu, H., and Liu, C.: Review of space and ground integrated remote sensing for air pollutants (in Chinese), Res. Environ. Sci., 34, 28–40, https://doi.org/10.13198/j.issn.1001-6929.2020.11.25, 2021.
Zhao, W., Tang, G., Yu, H., Yang, Y., Wang, Y., Wang, L., An, J., Gao, W., Hu, B., Cheng, M., An, X., Li, X., and Wang, Y.: Evolution of boundary layer ozone in Shijiazhuang, a suburban site on the North China Plain, J. Environ. Sci., 83, 152–160, https://doi.org/10.1016/j.jes.2019.02.016, 2019.
Zheng, B., Tong, D., Li, M., Liu, F., Hong, C., Geng, G., Li, H., Li, X., Peng, L., Qi, J., Yan, L., Zhang, Y., Zhao, H., Zheng, Y., He, K., and Zhang, Q.: Trends in China's anthropogenic emissions since 2010 as the consequence of clean air actions, Atmos. Chem. Phys., 18, 14095–14111, https://doi.org/10.5194/acp-18-14095-2018, 2018 (data available at: http://meicmodel.org/?page_id=560, last access: 10 July 2023).
Zhou, B., Zhang, S., Xue, R., Li, J., and Wang, S.: A review of Space-Air-Ground integrated remote sensing techniques for atmospheric monitoring, J. Environ. Sci., 123, 3–14, https://doi.org/10.1016/j.jes.2021.12.008, 2023.
- Abstract
- Introduction
- Methodology: O3 budget calculations and model setup
- Analyses and comparisons of O3 concentration and mass budget
- Effects of transport and photochemistry on the regional origins of O3
- Conclusion and outlook
- Data availability
- Author contributions
- Competing interests
- Disclaimer
- Financial support
- Review statement
- References
- Supplement