the Creative Commons Attribution 4.0 License.
the Creative Commons Attribution 4.0 License.
 | 17 Jan 2023
Diurnal cycles of cloud cover and its vertical distribution over the Tibetan Plateau revealed by satellite observations, reanalysis datasets, and CMIP6 outputs
Yuxin Zhao
Jiming Li
Lijie Zhang
Cong Deng
Yarong Li
Bida Jian
Jianping Huang
Diurnal variations in cloud cover and cloud vertical distribution are of great importance to Earth–atmosphere system radiative budgets and climate change. However, thus far these topics have received insufficient attention, especially on the Tibetan Plateau (TP). This study focuses on the diurnal variations in total cloud cover, cloud vertical distribution, and cirrus clouds and their relationship to meteorological factors over the TP based on active and passive satellite observations, reanalysis data, and CMIP6 outputs. Our results are consistent with previous studies but provide new insights. The results show that total cloud cover peaks at 06:00–09:00 UTC, especially over the eastern TP, but the spatial and temporal distributions of clouds from different datasets are inconsistent. This could to some extent be attributed to subvisible clouds missed by passive satellites and models. Compared with satellite observations, the amplitudes of the diurnal variations in total cloud cover obtained by the reanalysis and CMIP6 models are obviously smaller. CATS can capture the varying pattern of the vertical distribution of clouds and corresponding height of peak cloud cover at middle and high atmosphere levels, although it underestimates the cloud cover of low-level clouds, especially over the southern TP. Compared with CATS, ERA5 cannot capture the complete diurnal variations in vertical distribution of clouds and MERRA-2 has a poorer performance. We further find that cirrus clouds, which are widespread over the TP, show significant diurnal variations with averaged peak cloud cover over 0.35 at 15:00 UTC. Unlike in the tropics, where thin cirrus (0.03< optical depth <0.3) dominate, opaque cirrus clouds (0.3< optical depth <3) are the dominant cirrus clouds over the TP. The seasonal and regional averaged cloud cover of opaque cirrus reaches a daily maximum of 0.18 at 11:00 UTC, and its diurnal cycle is strong positive correlation with that of 250 hPa relative humidity and 250 hPa vertical velocity. Although subvisible clouds (optical depth <0.03), which have a potential impact on the radiation budget, are the fewest among cirrus clouds over the TP, the seasonal and regional averaged peak cloud cover can reach 0.09 at 22:00 UTC, and their diurnal cycle correlates with that of the 250 hPa relative humidity, 2 m temperature, and 250 hPa vertical velocity. Our results will be helpful to improve the simulation and retrieval of total cloud cover and cloud vertical distribution and further provide an observational constraint for simulations of the diurnal cycle of surface radiation budget and precipitation over the TP region.
- Article
(9465 KB) - Full-text XML
-
Supplement
(887 KB) - BibTeX
- EndNote


The Tibetan Plateau (TP), a heat source for the East Asian monsoon, has received worldwide attention due to its prominent altitude and special topography (Wu et al., 2017). Over the TP, surface heating causes a low-pressure center that can attract warm and moist air convergence from the ocean and then promote convective activity (Wu et al., 2012). The abundant water storage in the atmosphere over the TP and its surrounding regions can be explained by this convective system, and the TP is thus called the “Asian water tower” (Xu et al., 2008). In recent decades, the TP has experienced significant climate warming (Liu and Chen, 2000; Yao et al., 2012), and this warming will continue in the future (Duan and Wu, 2006; Wang et al., 2008). The rapid warming over the TP has caused dramatic changes in the cryosphere, such as glacier retreat, snow cover reduction, permafrost degradation, and expansion of glacier-fed lake areas (Cheng and Wu, 2007; Yao et al., 2007; Rangwala et al., 2010; Zhang et al., 2019). Although some studies have found that rapid warming is possibly linked to increasing surface water vapor or anthropogenic greenhouse gas emissions over the TP (Rangwala et al., 2009; Zhou and Zhang, 2021), growing evidence has verified that variations in cloud properties are also very important in determining the surface energy balance and water cycle of the TP region (Yang et al., 2012; Yan et al., 2016; Pan et al., 2017).
Indeed, cloud cover is the first-order variable impacting downwelling radiation at the surface (Naud et al., 2015), and its long-term changes over the TP and consequential influences have been explored based on satellite observations and reanalysis data (You et al., 2014; Kukulies et al., 2019). For example, based on weather observations at stations across the TP during 1961–2003, Duan and Wu (2006) found a dramatic increase in the low-level cloud amount, which ultimately led to strong nocturnal surface warming. Ma et al. (2021) also pointed out that high cloud cover is the most important influence factor on summer precipitation over the TP, based on the Clouds and Earth's Radiant Energy System (CERES) Edition 4 dataset during 2001–2009. In addition to the long-term change, however, existing studies indicate that clouds over the TP also exhibit obvious diurnal cycles. The observations from ground-based cloud radar at the Motuo National Climate Observatory over the southeastern TP show that the occurrence frequency of clouds is larger (maximum value 73 %) from evening to midnight (i.e., 13:00–18:00 UTC) and reaches a minimum value (53 %) in the morning (04:00 UTC) (Zhou et al., 2021). The diurnal cycle of clouds strongly affects their efficiency in regulating the radiation budget (Yin and Porporato, 2020), and it is also closely related to the diurnal cycle of precipitation (Nesbitt et al., 2008; Zhao et al., 2017). Neglecting the importance of the diurnal cycle of clouds will result in the inaccurate representation of clouds in models and exacerbate inconsistencies between observations and model simulations (Tian et al., 2004). For example, the evaluation of version 2 of the Community Climate System Model (CCSM2) shows that the simulated diurnal variations are still smaller than the observed values even if the model is driven by observational data, and the diurnal cycle of precipitation from simulations is too weak over the oceans (Dai and Trenberth, 2004). Yin and Porporato (2017) found that most general circulation models (GCMs) lack cloud peaks around the afternoon and thus lead to the overestimation of daily mean top-of-atmosphere (TOA) irradiance compared with ECMWF's first atmospheric reanalysis of the 20th Century (ERA-20C). Moreover, the inconsistent amplitudes and phases of the diurnal cycle of the clouds between models results in a large intermodel difference in irradiance, which reaches a maximum of 1.8 Wm−2 over land and 2.1 Wm−2 over the ocean. To date, some observational studies have focused on diurnal variations in cloud cover over the TP based on geostationary satellite data and ground-based observations (Liu et al., 2015; Shang et al., 2018), and some typical features of the diurnal cloud cycle have been described, e.g., amplitude and phase (Song et al., 2017). However, satellites with passive remote sensing instruments (e.g., MODIS) generally fail to detect optically thin clouds with small optical depths (<0.3) (Minnis et al., 2008), which are found in approximately 50 % of global observations (Sun et al., 2011b). These thin cirrus clouds frequently occur near the tropopause of stronger convective regions (e.g., the tropics or the Tibetan Plateau) and have great impacts on the cloud or surface properties retrieved by satellite, Earth–atmosphere system radiation energy budgets, and exchanges between the troposphere and stratosphere (Sassen et al., 2009; Sun et al., 2011a; Sun et al., 2011b; Zou et al., 2020). In addition, the thin cirrus clouds that are undetected by passive sensors also possibly contribute to part of the total cloud cover inconsistency between passive and active satellites (Stanfield et al., 2015). It is therefore of fundamental importance to study these optically thin clouds over the TP in detail, especially the relationship between their diurnal cycle and meteorological factors, to fill in related knowledge gaps in the TP region.
In addition, another important but less concerning issue in the TP region is the cloud vertical distribution, especially its diurnal cycle. The vertical profile of the cloud cover may affect the atmospheric circulation by altering the vertical gradients of the radiative heating/cooling rate and the subsequent atmospheric temperature and is also closely linked to the efficiency of precipitation production (Posselt et al., 2008; Binder et al., 2020). To date, however, too few studies have focused on the diurnal cycle of cloud vertical distribution over the TP because passive sensors onboard geostationary satellites cannot resolve the vertical structure of cloud systems. The Cloud-Aerosol Lidar and Infrared Pathfinder Satellite Observation (CALIPSO) and CloudSat satellites have a vertically resolved ability to document the cloud vertical structure at a global scale (Sassen et al., 2009; Oreopoulos et al., 2017). Although CALIPSO and CloudSat provide considerable valuable information on cloud vertical distribution, especially over areas sensitive to climate change without ground-based observations (Yan et al., 2016; Wang et al., 2021), only instantaneous cloud vertical distributions at two overpass times are possible. As a result, this study attempts to use the measurements from the Cloud-Aerosol Transport System (CATS) (McGill et al., 2015) onboard the International Space Station (ISS) to analyze the diurnal cycle of total cloud cover, vertical distribution, and optically thin cirrus clouds over the TP. As a new space-based lidar, Yorks et al. (2016) have indicated that CATS has similar advantages to the Cloud-Aerosol Lidar with Orthogonal Polarization (CALIOP) onboard CALIPSO for detecting optically thin clouds and cloud vertical distribution. CATS is the only space-based lidar that contains active vertical measurements with a variable local time of overpass between 51∘ S and 51∘ N and that shows sufficient credibility compared to ground-based active instruments and passive and active spaceborne sensors (Noel et al., 2018). This allows us to analyze the diurnal cycle of cloud vertical distribution at regional or near-global scales based on CATS (Dauhut et al., 2020; Wang et al., 2022). In addition to CATS, this study employs cloud cover from other datasets, such as passive satellites (Himawari-8, ISCCP), reanalysis datasets (ERA5, MERRA-2), and climate model (CMIP6) outputs, to perform related comparisons. The paper is organized as follows. The data and methods used in this study are described in Sect. 2. Section 3 includes the comparison of diurnal variations in total cloud cover and cloud vertical structure between different datasets. The correlation between the diurnal cycle of cirrus and meteorological factors is also discussed. Finally, the conclusions and discussion are presented in Sect. 4.
Due to sparse ground-based measurements over the TP, this investigation mainly uses multiple satellite products, reanalysis datasets, and outputs of CMIP6 models to analyze the diurnal cycle of the cloud cover over the TP region (26–40∘ N and 73∘ –105∘ E). In addition, the TP is simply divided into four subregions by the latitude and longitude lines of 33∘ N and 89∘ E, respectively, and the boundary of the TP (Ren and Pan, 2019).
2.1 Cloud-Aerosol Transport System (CATS)
The CATS lidar onboard the ISS is a multiwavelength elastic backscatter lidar that can measure backscattered energy profiles with nearly a three-day repeating cycle over the same locations but at different local times between 51∘ S and 51∘ N (Mcgill et al., 2015). Although CATS cannot monitor the evolution of one cloud system, its special sample mode makes it the only space-based lidar that provides the seasonally averaged diurnal cycle of clouds and their aerosol properties, especially their vertical profiles, at a given location by aggregating observations at different local times of day during various seasons (Noel et al., 2018). CATS employs a similar atmospheric layer detection algorithm to CALIOP to identify the cloud and aerosol layer and retrieve layer properties (i.e., layer height and thickness, optical depth et al.) (Yorks et al., 2016), but unlike CALIOP, CATS uses the attenuated backscatter at 1064 nm instead of 532 nm because the signals at 532 nm are unavailable due to technical issues (Yorks et al., 2016). In addition, the signal-to-noise ratio at 1064 nm is higher at nighttime (Pauly et al., 2019), and the absorbing aerosol layer is more fully captured by 1064 nm (Rajapakshe et al., 2017; Yorks et al., 2021). Recently, some studies have confirmed the good performance of CATS in retrieving cloud and aerosol property profiles, especially the diurnal variations, for scientific investigations (Noel et al., 2018; Yu et al., 2021).
In this investigation, we use the related cloud layer parameters from version 3.01 of CATS level 2 operational (L2O) 5 km layer product (L2O_D/N-M7.2-V3-01_5kmLay) during the entire period of CATS operation (March 2015–October 2017), including the “feature type score”, “layer base altitude”, “layer top altitude”, “percent opacity”, “layer top temperature”, and “feature optical depth”. Here, we use cloudy profiles with a feature type score of 5 or greater to reduce the uncertainty of the layer detection algorithm (Yorks et al., 2016; Noel et al., 2018). In addition, the total cloud cover based on CATS is calculated for a given grid (e.g., 2∘ ×2∘) by dividing the number of cloudy profiles by the total number of profiles in each grid (Li et al., 2011; Noel et al., 2018). The cloud cover at a given height bin has a similar definition to the total cloud cover. But it is worth noting that we also use the parameter “Percent_Opacity_ Fore_FOV” in the CATS layer product to check the opacity of each profile. If it is not opaque, that profile contributes to the number of profiles at all altitude levels. If that profile is opaque, we do not count that profile in the total number of profiles for those altitude levels below the base of the lowest cloud layer detected in that profile. For CATS, a profile is considered opaque if no surface return is detected in all level 1 (L1B) 350 m profiles that make up that L2O 5 km profile.
2.2 International Satellite Cloud Climatology Project (ISCCP)
The ISCCP dataset (Rossow and Schiffer, 1999), which is obtained from both geostationary and polar-orbiting satellite imaging radiometers with common visible and infrared channels, has been widely used to study the diurnal, seasonal, and interannual variations in cloud properties (Naud and Chen, 2010; Norris and Evan, 2015; Rossow et al., 2021). Compared with the previous version of the ISCCP dataset (e.g., ISCCP-D), the newly released ISCCP-H product has many improvements (Young et al., 2018), such as a finer sampling resolution, higher data quality, and expanded record period. To date, the ISCCP-H product can provide the global total cloud cover with a 1∘ × 1∘ spatial resolution every 3 h from July 1983 through June 2017, and it has also been used in some recent studies to analyze the diurnal cycle and long-term variation in regional cloud cover (Lei et al., 2020; Zhang et al., 2020b), in model evaluation (Tselioudis et al., 2021), and in comparison with other satellite cloud products (Karlsson and Devasthale, 2018; Tzallas et al., 2019). In this investigation, we use the “cloud area fraction” parameter from the 3-hourly monthly averaged “ISCCP Basic HGH” dataset from March 2015 to June 2017.
2.3 Himawari-8 geostationary satellite
The Himawari-8 geostationary satellite was launched by the Japan Meteorological Agency on 7 October 2014. The Advanced Himawari Imager (AHI), which is carried by Himawari-8, has 16 bands, including 3 visible bands, 3 near-infrared bands, and 10 other infrared channels. Based on the radiance information of these channels, the AHI can provide good-quality cloud and aerosol products with a spatial resolution from 0.5 to 2 km and a temporal resolution from 2.5 to 10 min (Letu et al., 2018, 2020). Here, the “cloud mask confidence level flag” parameter in the level 2 (L2) operational cloud property products from January 2016 to October 2017 is used in the following analysis. The cloud mask confidence level flag provided by the Himawari-8 classifies each 0.05∘ grid into the following four categories: clear, probably clear, probably cloudy, and cloudy. Similar to previous studies (Shang et al., 2018; Lei et al., 2020), only the “cloudy” pixels are identified as clouds, while the others are classified as clear sky in this study. Finally, the total cloud cover given at each 0.05∘ grid is defined as the ratio of the cloudy sample size to the total sample size every 3 h. In addition, until now only cloud cover from AHI during daytime has been available, and thus we merely consider the period in which there is complete data over the TP, which is from 00:00 to 10:00 UTC.
2.4 Reanalysis datasets
The ERA5 reanalysis dataset from the European Centre for Medium-Range Weather Forecast (ECMWF) contains abundant variables at the surface and on single levels and pressure levels by using 4D-Var data assimilation and model forecasts of the ECMWF Integrated Forecast Systems (IFS) (Urraca et al., 2018; Hersbach et al., 2020). Cloud characteristics from reanalysis data largely depend on atmospheric numerical models and data assimilation schemes. The physical parameterizations in ERA5 that provide the cloud properties in a grid cell are based on the advanced version of the scheme by Tiedtke (1993). In this study, the hourly total cloud cover for a single level and fraction of cloud cover at 37 pressure levels from ERA5 at a 0.25∘ × 0.25∘ resolution are used to compare the diurnal cycle of the cloud cover and its vertical distribution with other datasets. In addition, the hourly 2 m temperature, 10 m wind speed, vertically integrated divergence of moisture flux on single levels and hourly vertical velocity and relative humidity at 250 hPa on the pressure levels are used to discuss the relation between the cloud cover and meteorological parameters.
In addition to ERA5, the cloud cover from version 2 of the Modern-Era Retrospective Analysis for Research and Applications (MERRA-2) (Rienecker et al., 2011), which has a gridded resolution of 0.5∘ × 0.625∘, is also used. MERRA-2 is the latest atmospheric reanalysis produced by NASA's Global Modeling and Assimilation Office (GMAO). The Goddard Earth Observing System (GEOS) atmospheric model (Rienecker, 2008; Molod et al., 2015) and NCEP's grid point statistical interpolation (GSI) analysis scheme (Wu et al., 2002; Kleist et al., 2009) are the key components of version 5.12.4 of the GEOS atmospheric data assimilation system that produce MERRA-2. Specifically, this study uses the hourly total cloud area fraction from the MERRA-2 “tavg1_2d_ rad_Nx” product, which is a time-averaged three-dimensional dataset. The cloud cover for radiation at 42 pressure levels is based on the MERRA-2 “tavg3_3d_rad_Np” product, which is a four-dimensional 3-hourly time-averaged dataset.
2.5 CMIP6 models
Here, we also use the 3-hourly cloud area fraction from 17 CMIP6 models with AMIP simulations that utilize observed sea surface temperatures and sea ice concentrations (Eyring et al., 2016). Assessment of CMIP6's performance with respect to clouds is of wide concern and has achieved variable results (Cherian and Quaas, 2020; Vignesh et al., 2020). Because the temporal coverage of the historical CMIP6 outputs cannot cover the same detection period as CATS, we use the future climate simulations from March 2015 to October 2017. The scenario from Shared Socioeconomic Pathway (SSP)5-8.5 is selected as it is closest to actual emissions. SSP5-8.5 is an upgrade of the RCP8.5 pathway (RCP is short for representative concentration pathway), and SSP5 assumes an energy intensive, fossil-based economy (O'Neill et al., 2016). In addition, it is worth noting that CMIP6 outputs with a lidar simulator (e.g., CATS simulator) are still unavailable for the 3-hourly resolution, and thus this study uses the 3-hourly cloud area fraction from CMIP6 models without a lidar simulator. Due to the discrepancies in the definitions and determination algorithms of cloud cover, direct comparisons between the diurnal cycle of total cloud cover in models and satellite observations possibly result in some uncertainties (Engström et al., 2015). In the subsequent analysis, all model outputs, reanalysis, ISCCP, and Himawari-8 data are uniformly linearly interpolated to the 2∘ × 2∘ grid in Fig. 1 to maintain consistency with the CATS observations.
Table 1 lists the details of the satellite products, reanalysis datasets, and model outputs in this study, including their spatial and temporal resolutions and temporal coverage.
Table 1The temporal coverage and resolution of datasets used in this study. The temporal coverage of all CMIP6 model outputs is from 26 March 2015 to 29 October 2017.

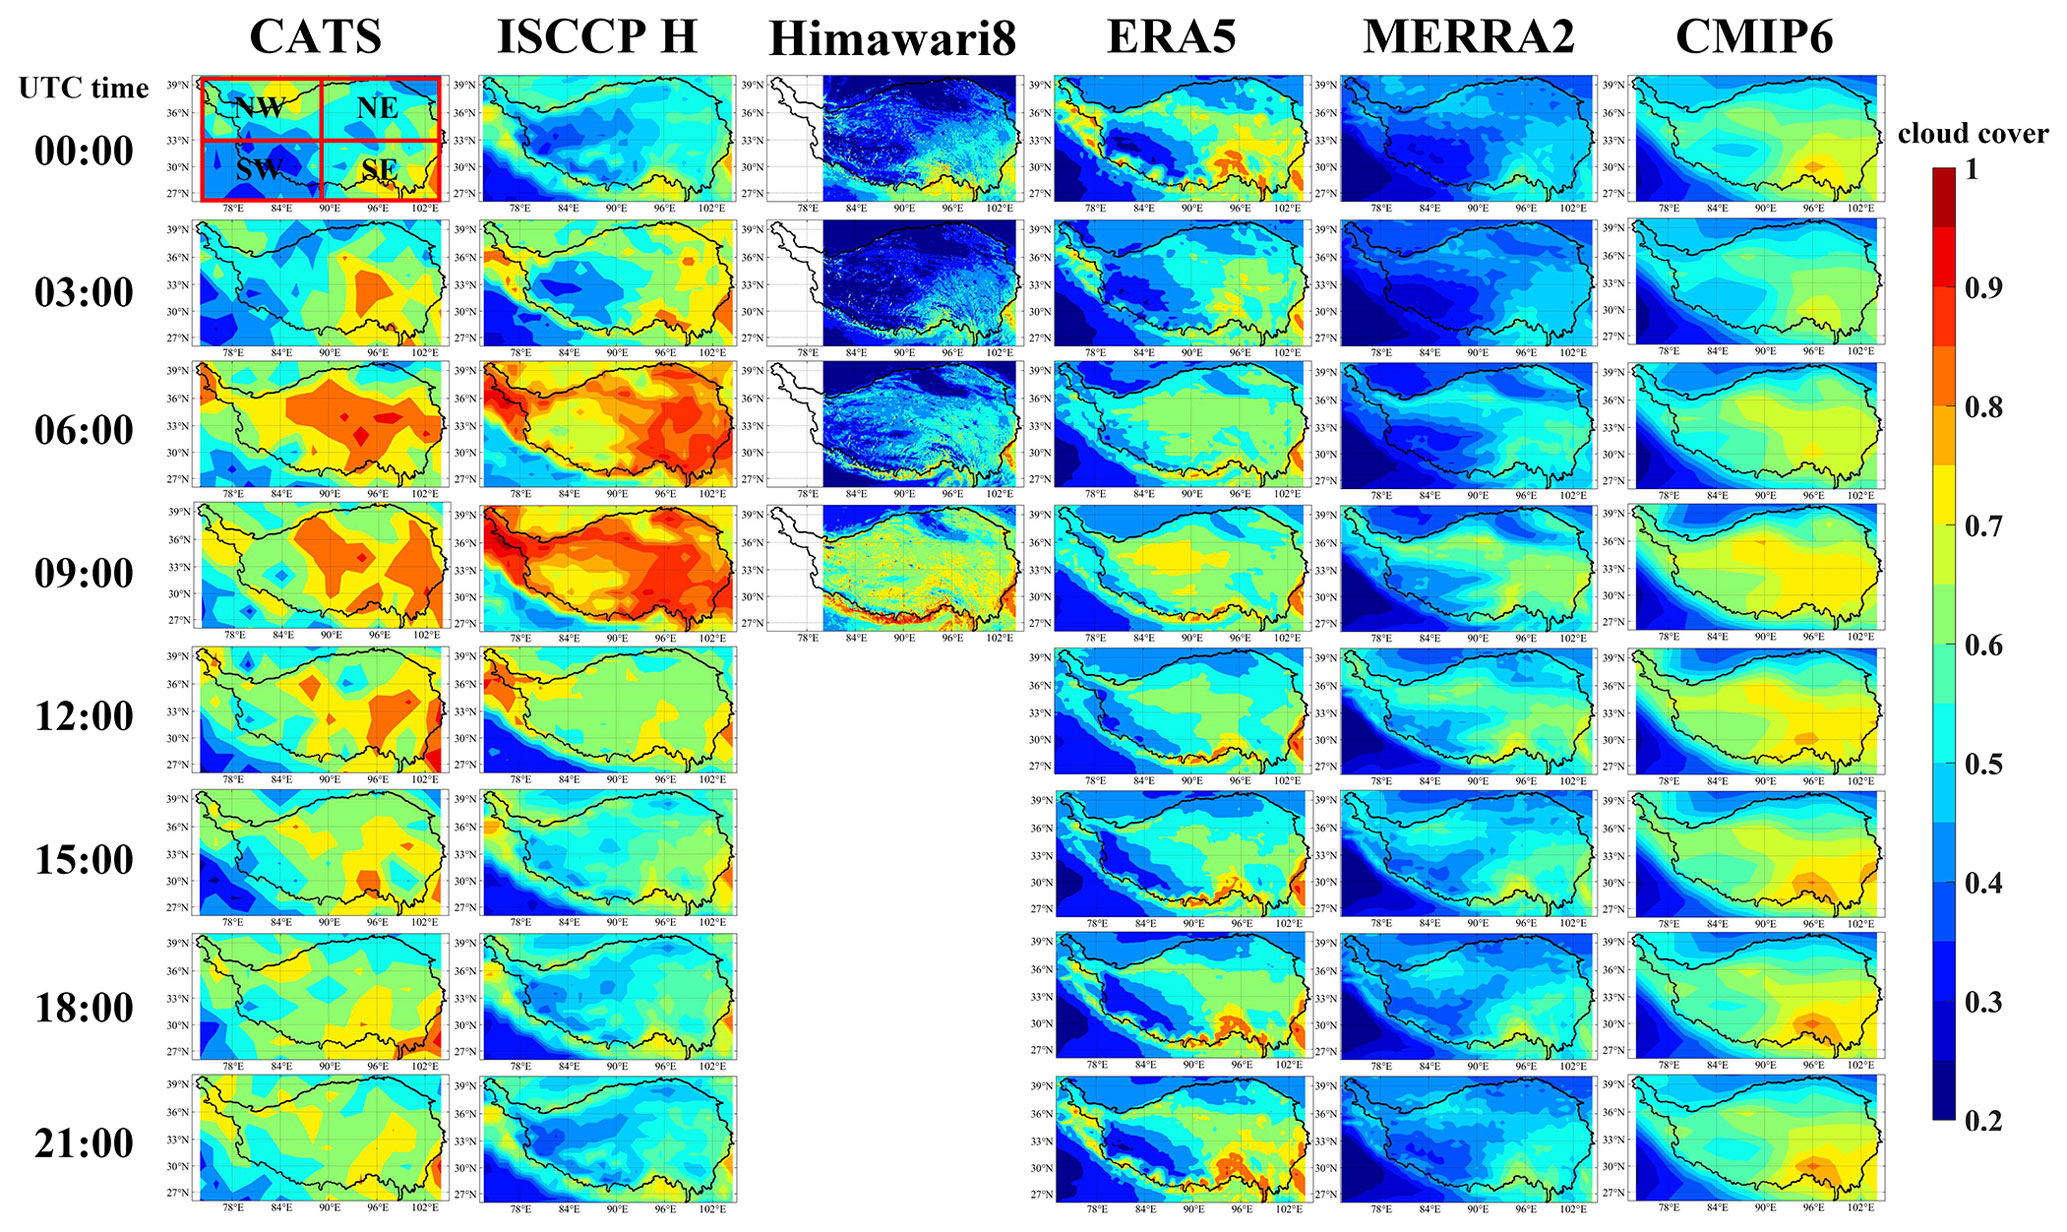
Figure 1The spatial distribution of 3-hourly averaged total cloud cover over the TP based on CATS, ISCCP-H, Himawari-8, ERA5, MERRA-2, and CMIP6 multimodel mean. The different TP regions involved in this study are shown in the upper-left image.
3.1 Comparison of the diurnal variation in total cloud cover from different datasets
The diurnal cycle of cloud properties over the TP shows unique characteristics due to its special topography and large-scale circulation background (Wang et al., 2020). Figure 1 shows the spatial distribution of total cloud cover over the TP for each 3 h mean using active and passive satellite datasets, reanalysis data, and climate model outputs. The statistical results from all datasets in Fig. 1 are aggregated over the entire time period of CATS observation except Himawari-8, of which the dataset over a shorter period than that of CATS is used in our study. Similar to previous studies (Shang et al., 2018; Lei et al., 2020), significant diurnal variations in total cloud cover over the TP are found in almost all datasets. The peak time and amplitude of total cloud cover both exhibit obvious differences among the different datasets due to difference in the sensitivities of detectors, cloud detecting algorithms, or cloud parameterizations. For CATS, clouds have a maximum coverage in the early afternoon (e.g., 06:00 UTC), and cloud cover can reach a daily maximum of 0.8 over the central and eastern TP. However, a daily minimum total cloud cover (mean value about 0.4) over the southwestern TP is found at 00:00 UTC. The diurnal variation in total cloud cover from ISCCP is similar to that of CATS, but ISCCP usually exhibits an obvious smaller total cloud cover during the night (e.g., from 12:00 to 00:00 UTC) than that of CATS. Compared with ISCCP, the higher total cloud cover over the eastern TP (especially at night) detected by CATS might be related to the subvisible or optically thin cirrus clouds (also see Fig. S2b and c), which are more frequent during the night and usually misclassified as clear sky by passive sensors or satellites, such as those of ISCCP, MODIS, and MISR, because their minimum detectable cloud optical thickness is approximately 0.1 to 0.4 (Marchand et al., 2010). Indeed, by comparing the total cloud cover from Aqua/MODIS and CALIOP, Holz et al. (2008) found that the cloud detection results from the MODIS and CALIOP agreed more than 87 % of the time, and their discrepancies were largely associated with the optically thin clouds that were undetected by MODIS but readily observed by CALIOP. From a global mean perspective, the optically thin clouds resulting in the total cloud cover from CALIPSO–CloudSat are approximately 10 % higher than those from the CERES–MODIS (Stanfield et al., 2015). Sun et al. (2011b) also pointed out that if these optically thin clouds were completely mistaken for clear sky, approximately 15 Wm−2 of the heating effect would be missed. The total cloud cover detected by the Himawari-8 satellite is nearly half that of CATS, except at 09:00 UTC. This difference may be partly related to the detection limitation of the Himawari-8 and its strict cloud identification algorithm (Imai and Yoshida, 2016). For the higher spatial resolution Himawari-8 and ERA5 data, the total cloud cover shows a higher value on south-facing slopes, likely caused by the small cumulus growth (Shang et al., 2018). However, this phenomenon is not obvious in other datasets, probably because of the difference in resolution. For reanalysis, the daily amplitudes of the total cloud cover of ERA5 and MERRA-2 are both smaller relative to those of satellite datasets, and the total cloud covers of these two reanalysis datasets are almost lower than the results of CATS throughout the. However, ERA5 shows a higher cloud cover over the Linzhi region of Tibet from 18:00 to 00:00 UTC than those from CATS, ISCCP, and MERRA-2 datasets. It could be that ERA5 overestimates low-level clouds, as will be explained in more detail in Sect. 3.2, which discusses the vertical distribution of clouds. In addition, we find that the total cloud cover between two reanalysis datasets also exhibits considerable differences regardless of the magnitude or peak time of total cloud cover. Generally speaking, total cloud cover from MERRA-2 is lowest among these datasets, except for the Himawari-8 satellite, which has a smaller total cloud cover over the northern TP before 06:00 UTC than that of MERRA-2. Meanwhile, the maximum total cloud cover from MERRA-2 does not exceed 0.6 over all subregions. From a global perspective, Li et al. (2017) indicated that MERRA-2 underestimates total cloud cover nearly everywhere compared with the CERES–MODIS dataset. The diurnal cycle of total cloud cover of the multimodel in CMIP6 (hereafter MEM) shows some similarities with that of ERA5. For example, MEM also simulates the high total cloud cover over the Linzhi region of Tibet during the night and produces a similar daily amplitude of total cloud cover. However, MEM gives larger total cloud cover than the data from reanalysis and Himawari-8. At a given time, MEM also exhibits a similar spatial distribution of total cloud cover to that of CATS, but underestimation from MEM is still very obvious over most of the TP region. Besides reanalysis, the results show that the amplitude of the climate model simulations also differs significantly from the satellite results over the TP. This problem exists on a global scale and induces overestimation of radiation in most climate models (Yin and Porporato, 2017). The comparison of different datasets may of course be biased due to discrepancies in the definitions and determination algorithms of cloud cover, and it may also be limited by the fact that the sampling location of each dataset cannot totally coincide.
Due to the different distributions of temperature, moisture, etc., Fig. 1 clearly shows that the distributions of total cloud cover also exhibit obvious spatial variability at different local times. Here, the TP is simply divided into four subregions along the latitude and longitude lines of 33∘ N and 89∘ E (shown in total cloud cover from CATS at 00:00 UTC in Fig. 1), respectively, and diurnal variations in regional averaged total cloud cover over these subregions are provided in Fig. 2. It is worth noting that this is only a simple and rough zoning method without a detailed matching of dynamic and circulation structures, which could have an impact on the results, but it can also reflect the differences between the monsoon-controlled area and the non-monsoon area on the TP to some extent (Yao et al., 2013). Over the northwestern TP (Fig. 2a), the range of the diurnal total cloud cover detected by CATS is approximately 0.54–0.79, and the peak time is around 06:00 UTC. Compared with CATS, ISCCP exhibits a higher total cloud cover during the daytime (e.g., from 03:00–12:00 UTC) and a later peak time at approximately 09:00 UTC (maximum value around 0.85). After 12:00 UTC, the total cloud cover in ISCCP is obviously less than that of CATS, and its minimum value and daily range are approximately 0.48 and 0.37, respectively. From a regional mean perspective, ERA5 and MERRA-2 have comparable daily amplitude of the total cloud cover to that of MEM, and its values are 0.17, 0.16, and 0.13 for ERA5, MERRA-2, and MEM, respectively. Although reanalysis datasets have similar peak (e.g., around 10:00 UTC) and valley (e.g., 03:00 UTC) times to those of MEM, the diurnal variations in total cloud cover from MERRA-2 and MEM are almost synchronous, and their peak (or valley) values are approximately 0.54 (or 0.38) and 0.64 (or 0.51), respectively. In our study, the Himawari-8, which can detect the total cloud cover of the TP only between 00:00 and 10:00 UTC, shows a comparable significant amplitude (about 0.37) of diurnal cycle of total cloud cover with that of ISCCP and is nearly one and a half times as large as that of CATS (Fig. 2a). Over the northeastern TP (Fig. 2b), the diurnal cycle of total cloud cover from different datasets exhibits a smaller amplitude compared with those over the northwestern TP, and the amplitudes from the reanalysis and MEM are both less than 0.1 and only one-third of those of satellite datasets, especially for ERA5 (amplitude around 0.07). For the southwestern TP, in all of the datasets total cloud cover over this subregion is always the lowest of all subregions (Fig. 2c) and is possibly limited by the moisture flux and the high terrain of the Himalayas. However, the diurnal amplitudes of total cloud cover from all datasets are comparable with those over the northwestern TP. Over this subregion, the lowest total cloud cover is produced by MERRA-2 instead of Himawari-8, and MEM even simulates more cloud cover than CATS at some hours of the night. Similar results are also found over the southeastern TP (Fig. 2d). On average, diurnal amplitude of total cloud cover in most datasets is smaller over the eastern TP than that over the western TP, and ISCCP and MEM produce maximum and minimum diurnal amplitudes, respectively.
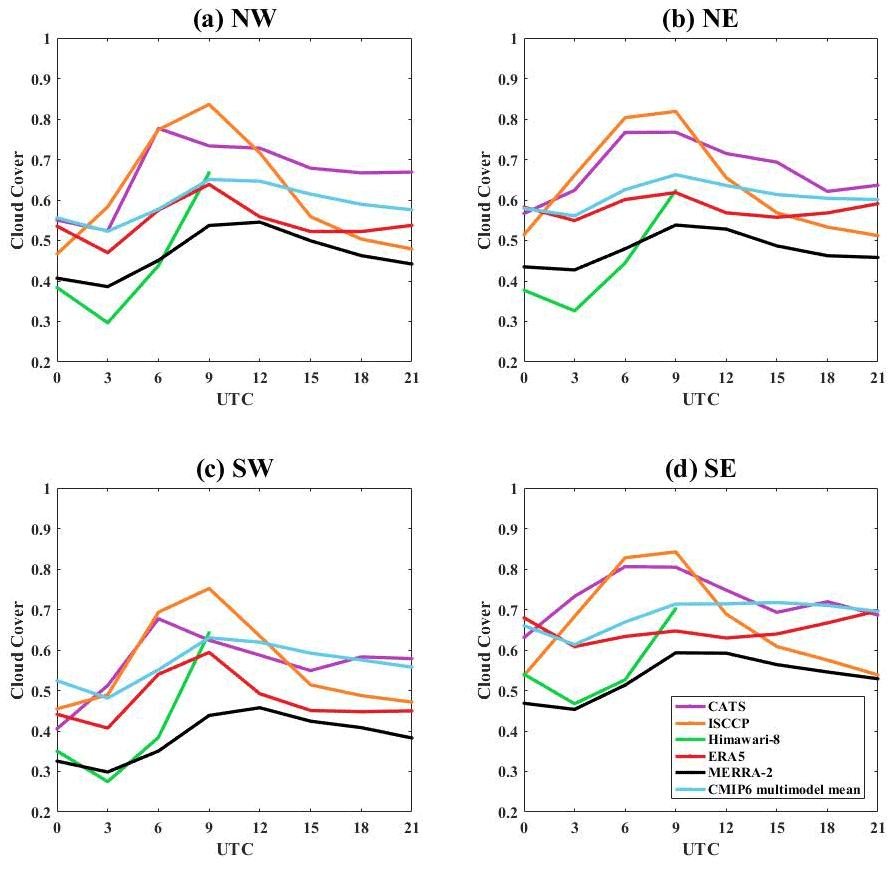
Figure 2The 3-hourly mean total cloud cover in different regions of the TP based on CATS (purple lines), ISCCP-H (orange lines), Himawari-8 (green lines), ERA5 (red lines), MERRA-2 (black lines), and CMIP6 multimodel mean (blue lines). (a) The northwestern TP, (b) the northeastern TP, (c) the southwestern TP, and (d) the southeastern TP. The regions are divided by latitude and longitude lines of 33∘ N and 89∘ E and the boundary of the TP (shown in Fig. 1).
To find out in which regions the diurnal cycle of which datasets are well correlated with CATS, Fig. 3 further shows the spatial distribution of correlation coefficients of diurnal cycle for total cloud cover between CATS and other datasets in a 2×2∘ grid box. As shown in the Fig. 3, ISCCP exhibits the best correlation with CATS, and the correlation coefficient (at 90 % confidence level) is even greater than 0.5 over the most areas (Fig. 3a), especially over the central part of the TP. The diurnal cycle of total cloud cover from the Himawari-8 obviously positive correlates with that of CATS over the most part of the TP, but the correlation is almost insignificant over TP region (Fig. 3b). It may be caused partly by the limited observation hours from Himawari-8. Here it is worth noting that because the cloud cover calculation of CATS needs to ensure that there are enough profiles in each grid, it is difficult to split more sample points by months or seasons for correlation analysis. Therefore, the correlation analysis here can only be used as a reference to some extent. Similar to ISCCP, ERA5 also shows significant positive correlation with the diurnal cycle of total cloud cover of CATS over the central and western parts of the TP (see Fig. 3c), but we also find that ERA5 is the only dataset that exhibits opposite diurnal variation with CATS over the eastern part of the TP, and correlation coefficient (at 90 % confidence level) even reaches −0.9. As stated in Fig. 2, MERRA-2 and MEM show almost synchronous diurnal variations in total cloud cover, resulting in the correlation coefficients of diurnal cycles from them with CATS being very similar, meaning that there is a significant positive correlation coefficient over the northern part of the TP (Fig. 3d and e). Although Fig. 3 indicates that ISCCP exhibits a closer diurnal cycle of total cloud cover to that of CATS over most parts of the TP, the averaged spatial consistency of total cloud cover at all times between ISCCP and CATS is the lowest of those from ERA5, Himawari-8, MERRA-2, and MEM (see Fig. A1 in the Appendix). In summary, the above statistical results show that total cloud cover from multiple sources exhibits considerable regional differences in the phase and magnitude of the diurnal cycle.
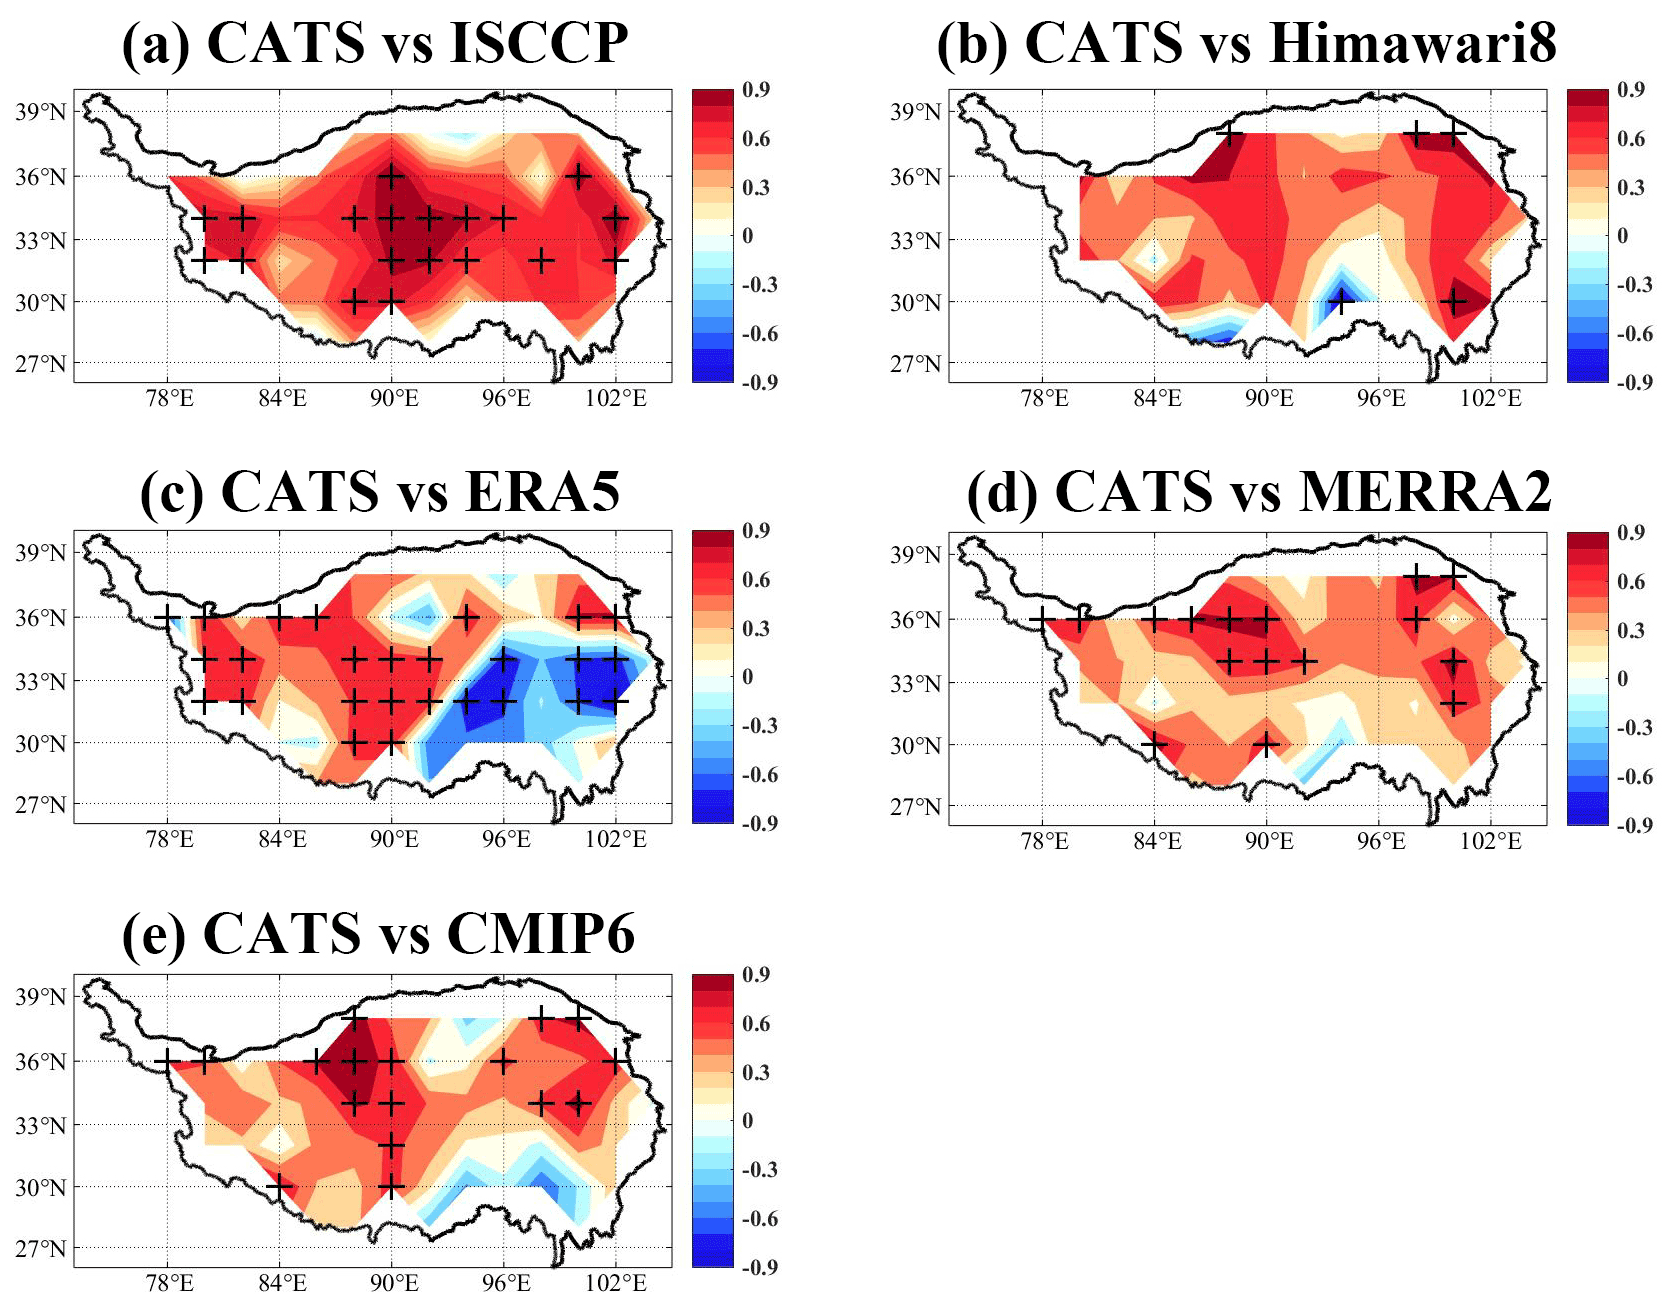
Figure 3The spatial distribution of correlation coefficients of the diurnal cycle for total cloud cover between CATS and other datasets. The grids are marked with “+” if the correlation at these grids passes the significance test by 90 %. Only cloud cover results at 00:00, 03:00, 06:00, and 09:00 UTC are used in the correlation between CATS and Himawari-8, as only daytime cloud cover is available from Himawari-8.
As stated in Sect. 2, the above total cloud cover differences in satellite datasets partly refer to the detection limitations of different sensors. By comparing the total cloud cover estimated from the CloudSat-CALIPSO with ISCCP, Naud and Chen (2010) pointed out that the total cloud cover from ISCCP is underestimated by approximately 18 % over the TP during the night, in part due to the misdetection of low-level clouds at night, which can partly explain the difference between ISCCP and CATS at night in our study. However, optically thin clouds are also important contributors to large differences in cloud cover between ISCCP and CATS, especially during summer, when high-level optically thin clouds occur more often than in the other seasons (Naud and Chen, 2010). In addition, Naud and Chen (2010) also pointed out that cloud property retrieval from ISCCP is more consistent with those from the CloudSat-CALIPSO over high-elevation regions of the TP where multi-layered cloud systems are infrequent. In fact, when the optically thin clouds overlap with other cloud types, the passive satellite will bias the cloud top properties of the underlying clouds (e.g., cloud top temperature or height), but the total cloud cover is almost unaffected. However, if only optically thin clouds are present, ISCCP easily misclassifies them as clear sky. Thus, multi-layered cloud systems are not the main contributors to the total cloud cover differences between ISCCP and CATS. Besides, ISCCP sometimes also overestimates the total cloud cover during daytime compared with CATS. By comparing the spatiotemporal matched total cloud cover from ISCCP, CALIPSO alone, and the combined product from CALIPSO and CloudSat (i.e., 2B-GEOPROF-LIDAR) during daytime, we find that ISCCP still overestimates the total cloud cover over TP compared with those of other space-based lidar and radar (figure not shown). In a similar way, Boudala and Milbrandt (2021) also found that ISCCP has larger cloud cover than that of CALIPSO over midlatitudes (e.g., the European continent). Tzallas et al. (2019) noted that the larger cloud cover of ISCCP in the European continent is linked to the relatively large viewing zenith angle (VZA) of ISCCP. Knapp et al. (2021) also suggested that there is a VZA dependence in the cloud cover of ISCCP. Previous studies have shown that spurious detection or missed detection of clouds is the largest source of systematic errors in ISCCP results. For ISCCP, it is difficult to distinguish between aerosols and thin cirrus clouds, which may lead to spurious cloud detections and thus to an overestimation of clouds (Rossow and Schiffer, 1999). In addition, our study also finds that larger differences exist between ISCCP (or ERA5) and the Himawari-8, especially at 03:00 UTC. Using similar datasets, Lei et al. (2020) showed that ERA5 and ISCCP overestimate approximately 10 % and 20 % of the total cloud cover over the TP, respectively, compared to the Himawari-8. However, our results indicate that ERA5 and ISCCP have more closer cloud cover with that from CATS compared with that of Himawari-8. It means that Himawari-8 should underestimate the total cloud cover than ERA5 and ISCCP before 09:00 UTC at least.
3.2 Comparison of cloud vertical distribution from different datasets
The vertical structure of clouds is closely related to precipitation and cloud radiative effects, which has attracted widespread attention (Wang et al., 2000; Yan et al., 2016; Li et al., 2018). Moreover, the cloud vertical structure is an important factor in studying how climate change influences cloud feedback (Wang et al., 2000; Bodas-Salcedo, 2018). Until recently, information about cloud vertical structure was usually extracted from surface observations, such as radiosonde data, which can provide 4 to 5 decades of records for climate research (Wang and Rossow, 1995). Since the launch of CALIPSO and CloudSat, active satellite data have been widely used in the study of global cloud vertical structures (Oreopoulos et al., 2017). However, the limited observation times each day from the CALIPSO/CloudSat result in an unclear diurnal cycle of cloud vertical distribution over the TP. In a recent study, Noel et al. (2018) first used CATS to analyze the diurnal cycle of cloud profiles over land and oceans between 51∘ S and 51∘ N and found similar vertical distributions of cloud cover between CATS and CALIPSO at a near-global scale. In this section, we compare the cloud vertical distribution of different subregions using CATS, ERA5, and MERRA-2. As a reference, the spatiotemporally matched cloud vertical profiles from CALIPSO alone and the combined product from CALIPSO and CloudSat (i.e., 2B-GEOPROF-LIDAR, marked as CALIPSO & CloudSat in Fig. 4) over the entire observation period of CATS are also used. Here, the calculation of cloud cover at a given height bin is same as that of CATS, removing the profiles that are fully attenuated below opaque layers from the total number of profiles (see the Sect. 2.1)
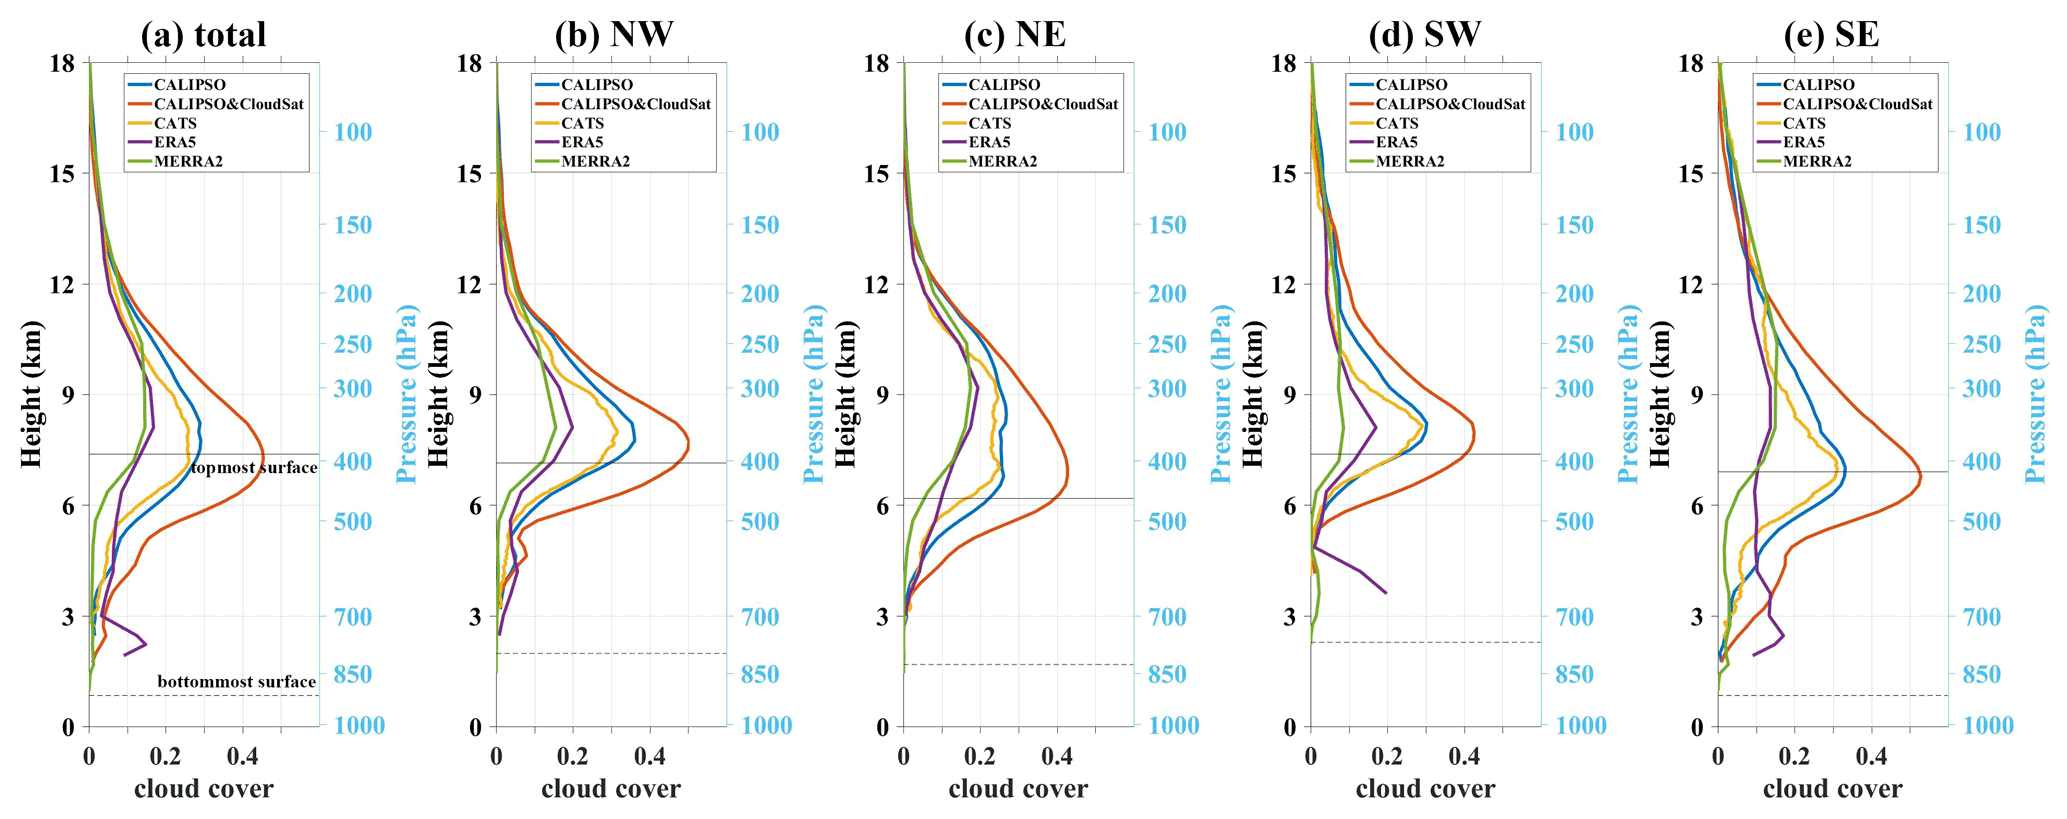
Figure 4The cloud vertical distribution in different regions of the TP based on CALIPSO (blue lines), 2B-GEOPROF-LIDAR (CALIPSO&CloudSat, red lines), CATS (yellow lines), ERA5 (purple lines), and MERRA-2 (green lines) at the hour closest to the CloudSat and CALIPSO daytime overpass time: (a) the whole TP, (b) the northwestern TP, (c) the northeastern TP, (d) the southwestern TP, and (e) the southeastern TP. The regions are divided by latitude and longitude lines of 33∘ N and 89∘ E and the boundary of the TP (shown in Fig. 1). The height here represents the height above the mean sea level. The horizontal solid black lines represent the topmost surface altitude, and the dashed black lines represent the bottommost surface altitude obtained in the CATS digital elevation model.
Figure 4 provides the cloud vertical profiles at the hour closest to the CloudSat and CALIPSO daytime overpass time, and the results during different seasons at this time are given in Fig. S1. In this study, all the altitudes are given as values above the mean sea level. In addition, we also add the topmost and bottommost surface height altitudes of each region in the Fig. 4 based on the digital elevation model (DEM) information in the CATS L2O layer products. From the averaged cloud vertical distribution over the whole TP region (Fig. 4a), CATS, CALIPSO, and CloudSat and CALIPSO exhibit similar peak heights (approximately 7–8 km) of cloud cover, whereas ERA5 and MERRA-2 slightly overestimate the peak height of cloud cover (around 9 km). Similar to Noel et al. (2018), we also find that the cloud vertical profiles from CALIPSO agree well with those from CATS, especially below the peak height over the northwestern and southwestern parts of the TP (Fig. 4b and d). The small negative difference between CATS and CALIPSO possibly comes from the spatiotemporal matching process. Such agreement between CATS and CALIPSO is understandable because CATS employs an atmospheric layer detection algorithm similar to that of CALIOP (Yorks et al., 2016). This means that they also have similar detection limitations; for example, they cannot penetrate optically thick clouds to detect the underlying clouds and thus underestimate cloud cover at low atmosphere levels. The underestimation of low-level clouds by CATS and CALIPSO due to optical extinction from higher clouds can be slightly improved via removing those profiles that are fully attenuated below opaque layers from the total number of profiles. The 2B-GEOPROF-LIDAR combines the advantages of CALIPSO and CloudSat in detecting both optically thin and thick cloud systems and thus can provide a relatively accurate cloud vertical distribution compared to other datasets. Compared with 2B-GEOPROF-LIDAR, however, we find that CATS and CALIPSO datasets still obviously underestimate the cloud cover at middle and low atmosphere levels even if we remove those profiles that are fully attenuated below opaque layers from the total number of profiles, and the bias of cloud cover even reaches 0.2 and 0.15 at 8 and 4 km over the southeastern TP (Fig. 4e), respectively. In particular, the bias between CATS (or CALIPSO) and the 2B-GEOPROF-LIDAR product is more obvious during the spring and summer seasons (Fig. S1). At the middle level of the atmosphere, cloud cover differences between CATS (or CALIPSO) and 2B-GEOPROF-LIDAR may result from altocumulus, altostratus, or deep convective clouds. However, at the low level of the atmosphere, their cloud cover difference mainly comes from the undetected cumulus or stratus clouds in CATS due to lidar signal attenuation, especially over the southeastern part of the TP (Fig. 4e), where surface wind convergence and upwards motion forced by topography tend to promote cumulus clouds (Li and Zhang, 2016).
The peak cloud covers from the reanalysis datasets are obviously lower than those detected by active satellites. Moreover, the peak heights and cloud covers are also different between the reanalysis datasets over the southern part of the TP (Fig. 4d and e). ERA5 has a peak cloud cover (approximately 0.2) at 8 km over the western TP, whereas the peak height exceeds 9 km over the northeastern TP. Figure 4a clearly shows that an important peak cloud cover exists at low atmosphere levels (<4 km) in ERA5 over the whole TP. This peak is particularly obvious over the southern part of the TP (Fig. 4d and e). Over the southwestern TP (Fig. 4d), ERA5 obviously overestimates the cloud cover compared with the 2B-GEOPROF-LIDAR below 4 km, but the other datasets maintain a consistently low cloud cover, especially during the summer and autumn seasons (Fig. S1c and d). One possible cause might be that the very large terrain causes a very large model bias in the vertical cloud distribution of the ERA5 model, which is also found in ERA-Interim (Yin et al., 2015). Although ERA5 and 2B-GEOPROF-LIDAR both exhibit larger cloud cover below 4 km compared with those from other datasets, the cloud cover from ERA5 is still obvious larger than that of 2B-GEOPROF-LIDAR over the southeastern TP (Fig. 4e). In contrast to the cloud cover retrieval by satellites, ERA5 prognosticates a grid box fractional cloud cover by parameterizing cloud formation and evolution processes that consider cumulus updrafts, vertical motions, diabatic cooling, etc. (ECMWF, 2016). By comparing the vertical cloud structure of warm conveyor belts in the ERA5 and CloudSat/CALIPSO datasets, Binder et al. (2020) found that ERA5 represents the frozen hydrometeor distribution well but underestimates the high ice and snow values in the mixed-phase clouds near the melting layer. In addition, they point out that many small and mesoscale structures observed by remote sensing instruments are not captured by ERA5. Similar to total cloud cover, the vertical profile of cloud cover in MERRA-2 is also obviously underestimated, but the height of the peak value is significantly overestimated over the eastern part of the TP (Fig. 4c and e). This phenomenon is also found in the tropics, where MERRA-2 succeeds in representing high-level clouds but dramatically underestimates low- and mid-level clouds compared with CALIPSO/CloudSat (Miao et al., 2019). The poor specification or parameterization of critical relative humidity, which is the humidity threshold for cloud formation in the estimation of cloud cover in MERRA-2, is possibly responsible for the bias (Molod, 2012; Yeo et al., 2022). Finally, these biases will exacerbate the uncertainties in the heating rate profiles of MERRA-2 and ERA5.
3.3 Diurnal cycle of cloud vertical distribution
After realizing the intrinsic uncertainties of different datasets in characterizing the cloud vertical distribution, the diurnal cycles of cloud vertical distribution over different subregions from CATS, ERA5, and MERRA-2 are further compared in Fig. 5. Figure 4 shows a significant underestimation of cloud cover in the ERA5 and MERRA-2 datasets compared with CATS at a given time. In fact, the underestimation is persistent throughout the day (see Fig. 5). Over the northern part of the TP, clouds are distributed in a relatively narrow height range (e.g., from 4 to 14 km) compared to those over the southern part of the TP (e.g., from 4 to 18 km), which may be linked to the deep convective clouds or cirrus clouds over the southern part. Over the northwestern TP, the cloud cover at approximately 8 km reaches its maximum value (approximately 0.3) of the day, which is sustained from 06:00 to 01:00 UTC for CATS. In ERA5, the maximum cloud cover at approximately 8 km is approximately 0.2, and this value is sustained only from 09:00 to 18:00 UTC. Considerable differences in the cloud cover between CATS and ERA5 mainly occur during nighttime. Two points need to be emphasized. First, ERA5 captures clouds above 12 km from 12:00 UTC to 21:00 UTC, which is consistent with CATS. Second, ERA5 also exhibits more low-level clouds below 4 km during the night. This phenomenon is particularly obvious over the southern part of the TP. For example, low-level clouds have a maximum of 0.25 over the southeastern TP and persist from 12:00 UTC to next 03:00 UTC. Recent ground-based cloud vertical structure observations indicate that the cloud base height has an obvious peak at 1.5–3.5 km for the whole day and that the frequency is greater at night in the dry seasons over the southeastern TP (Zhou et al., 2021). The formation of low clouds over the TP is thought to be favored by low air density and strong turbulence (Xu, 2012) and associated with large-scale convergence and planetary boundary layer processes (Li and Zhang, 2016). By using CloudSat–CALIPSO datasets, Kukulies et al. (2019) also pointed out that the stratocumulus and cumulus clouds dominate low-level clouds over the TP, and there are more stratocumulus clouds during the monsoon season (May to September) and more cumulus clouds during the westerly season (October to April). Although we already remove those profiles that are fully attenuated below opaque layers from the total number of profiles, this result still verifies the inability of CATS to detect the vertical structure of low clouds or optically thick clouds, but the persistent low clouds over the southwestern TP in ERA5 may also be problematic (also see Fig. 4d). In addition to low-level clouds, the ERA5 and MERRA-2 models also cannot reproduce the distribution or the magnitude of the diurnal cycle of cloud cover at approximately 8 km over the southern TP. Here, it is worth noting that CATS observes a high cloud cover over the southwestern TP between 11–14 km at approximately 13:00 UTC, mainly due to the total sample number at this hour being obvious less than those of other hours. Thus, this result is not as robust as other times. Compared with ERA5, the MERRA-2 model has a poorer performance in reproducing the diurnal cycle of cloud cover, with larger biases in both the maximum cloud cover and height. Here, it is worth noting that although CATS also obviously underestimates the cloud cover at almost every height compared with the 2B-GEOPROF-LIDAR (see Fig. 4), it can still capture the pattern of the cloud vertical distribution and the corresponding height of the peak cloud cover (see Fig. 4). This means that a qualitative assessment of cloud cover at middle and high atmosphere levels (e.g., peak cloud cover at 8 km) from reanalysis products with CATS observations is still feasible. In addition, the red lines at the top of Fig. 5 represent the diurnal variation in tropopause height, which is obtained from CATS level 2 operational (L2O) 5 km profile products. The original data are provided by MERRA-2 reanalysis data, which is interpolated to the CATS 5 km L2O horizontal resolution (see the CATS L2O profile products quality statements, version 3.00, available online at https://cats.gsfc.nasa.gov/media/docs/CATS_QS_L2O_Profile_3.00.pdf, last access: 8 February 2021). Similar to total cloud cover, we gathered the tropopause height information from all profiles in each subregion and calculated the hourly average over the entire observation period of CATS. Here, the tropopause height is used to find out how many clouds can penetrate the tropopause over the TP, which is a large area with a high altitude. The diurnal variation in the clouds overshooting the tropopause will be explored in Fig. 7.

Figure 5The hourly vertical distribution of cloud cover over different regions of the TP based on CATS, ERA5, MERRA-2. The red lines represent the tropopause height. The first to fourth lines represent the results over the northwestern TP, the northeastern TP, the southwestern TP and the southeastern TP, respectively. The regions are divided by latitude and longitude lines of 33∘ N and 89∘ E (shown in Fig. 1). The grids with total sample number less than 50 are blank.
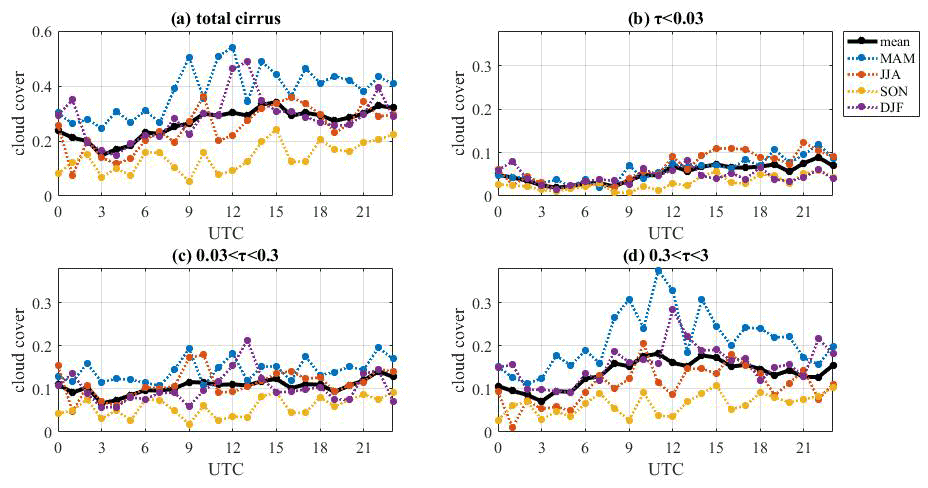
Figure 6The hourly cloud cover of different types of cirrus of different seasons. The black lines represent the results of annual average, the blue lines represent the results of spring, the red lines represent the results of summer, the yellow lines represent the results of autumn, the purple lines represent the results of winter. All seasons here are northern hemisphere seasons. (a) represents the cloud cover of all cirrus. (b) represents the subvisible cirrus (optical thickness less than 0.03). (c) represents the thin cirrus (optical thickness between 0.03 and 0.3). (d) represents the opaque cirrus (optical thickness between 0.3 and 3).
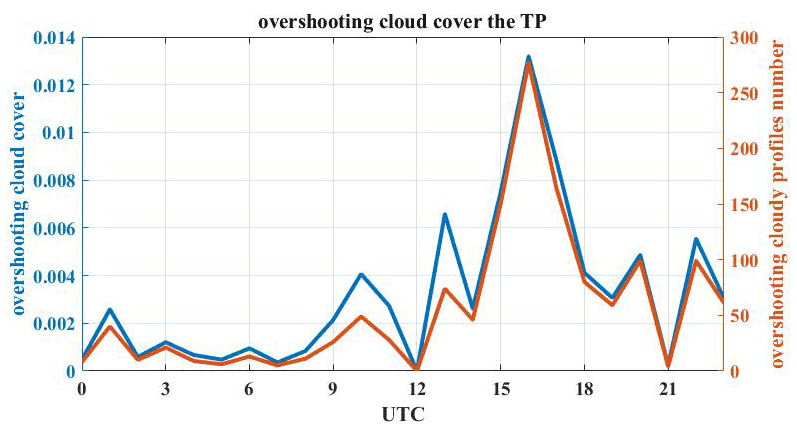
Figure 7The hourly cloud cover of cirrus shooting over tropopause based on CATS over the TP (blue line). The number of overshooting cloudy profiles every hour (red lines).
3.4 Diurnal variations in cirrus and overshooting clouds
Due to the high sensitivity of lidar signals to cirrus clouds, space-based lidar is considered an irreplaceable tool in detecting cirrus clouds and their vertical distribution at a global scale, especially in the upper troposphere and lower stratosphere (Fu et al., 2007; Virts et al., 2010). As an important cloud type, cirrus clouds play an important role in influencing the Earth's radiation budget and accurately calculating the heating rate (Liou, 1986; Hartmann et al., 2001). A recent study suggests that changing the physical properties of cirrus clouds may even counteract global warming. By seeding cirrus clouds with efficient ice-nucleating particles, which may shorten their lifetime and make them more transparent, the increase in global mean surface temperature projected with 1.5× CO2 concentrations is counteracted by 70 % in the CESM–CAM5 model (Gasparini et al., 2020). In addition, cirrus clouds can affect ozone concentrations in the upper troposphere and lower stratosphere (UT/LS) by acting as a potential surface for heterogeneous reactions (Borrmann et al., 1996). Similar to the cirrus classification method of Sassen et al. (2009), this study defines cirrus clouds as clouds whose cloud top temperature is less than −40 ∘C. Based on their optical depth (τ), cirrus clouds may be further divided into three types: subvisible cirrus (τ<0.03), thin cirrus (0.03<τ<0.3), and opaque cirrus (0.3<τ<3) clouds (Sassen and Cho, 1992). Previous studies have investigated the radiative effect of these different cirrus cloud types. For example, Fusina et al. (2007) found that the differences in heating rates between thin cirrus clouds and ice-supersaturated regions can reach up to 15 K d−1 at the meteorological observatory in Lindenberg, Germany. By matching the observations of the CERES, MODIS, and CALIPSO satellites, Sun et al. (2011b) pointed out that cirrus clouds whose optical depth is less than 0.3 have a significant cooling effect on shortwave radiation by increasing the diurnal mean reflected shortwave flux by approximately 2.5 W m−2 and that clouds with an optical depth of 0.1 can have a warming effect of approximately 15 W m−2. In addition, the subvisible cirrus clouds with significant positive radiative forcing have recently received much attention after the establishment of many effective detection methods (Sun et al., 2014, 2015).
Until now, however, few studies have focused on the diurnal cycle of cirrus clouds, especially over the TP region. In the simulation of the life cycle of anvil cirrus clouds, Gasparini et al. (2019) found that adding the diurnal variations in solar radiation would affect the evolution and radiative effects of cirrus. In this section, we further use the observational advantage of CATS to discuss the diurnal cycle of cloud cover of cirrus clouds with different optical depths over the TP region (Fig. S2). In addition, the seasonal variations and diurnal cycle of regional averaged cloud cover for different cirrus types are provided in Fig. 6. Opaque cirrus clouds (Fig. 6d) are found to be the main components of total cirrus clouds (Fig. 6a), and their diurnal cycles are similar. The peak cloud cover of opaque cirrus clouds occurs at 11:00 UTC (peak value is about 0.18), especially over the northeastern TP, where its value can reach 0.24 (see Fig. S2d). Over the southwestern TP, opaque cirrus occurs less frequently than over the central and northeastern parts. After 14:00 UTC, opaque cirrus clouds gradually decrease and have a minimum value of 0.07 at 03:00 UTC (see Fig. 6d). Opaque cirrus clouds usually occur more frequently during the spring season and less frequently during autumn. In addition, their daily range even exceeds 0.2 during spring (Fig. 6d). Compared with other cirrus cloud types, the cloud cover of subvisible cirrus clouds is smallest, and its peak time is obvious later than that of opaque cirrus clouds (Fig. 6b). On average, subvisible cirrus clouds have a maximum regional averaged cloud cover (approximately 0.09) at 22:00 UTC and a minimum value of 0.02 at 04:00 UTC. In contrast with opaque cirrus clouds, among all seasons the cloud cover of subvisible cirrus clouds is the largest in the summer season with the peak at 21:00 UTC. A similar peak value (approximately 0.125) occurs at 22:00 UTC in the spring season (see Fig. 6b). The statistical results above show that subvisible and opaque cirrus clouds over the TP are more frequent during nighttime and daytime, respectively. Based on the limited observations from two overpass times of the CALIPSO and CloudSat satellites, Sassen et al. (2009) also indicated that opaque cirrus clouds are generally found during the daytime, whereas subvisible cirrus clouds are mainly found at night. For thin cirrus clouds, although their diurnal cycle is not as significant as that of the other two kinds of cirrus clouds (Figs. 6c and S2c), the maximum cloud cover at 22:00 UTC and minimum cloud cover at 03:00 UTC are still obvious. Generally, there are more cirrus clouds in spring, and the cloud cover of total cirrus clouds is the smallest in autumn. Moreover, the diurnal cycles of different cirrus cloud types cancel each other out and decrease the amplitude of the diurnal cycle of cirrus clouds, especially at 09:00–23:00 UTC (Fig. 6a). On average, the cirrus cloud cover over the TP is mainly comprised of opaque cirrus clouds, followed by thin cirrus clouds, and subvisible cirrus clouds are the least common. This result is different from those of other regions (e.g., northern South America, equatorial Africa, and the western Pacific) according to Sassen et al. (2009), who found that the thin cirrus category comprises the majority of global cirrus clouds, followed by subvisible cirrus clouds, with opaque cirrus clouds being the least common. These results also reflect the regional difference in different cirrus types, which is possibly linked to several potential cirrus cloud formation mechanisms (e.g., radiative cooling in moist upper-tropospheric layers, convective blow-off, and temperature perturbation caused by convective activity such as gravity waves; Ramaswamy and Detwiler, 1986; Heymsfield et al., 2017; Zhang et al., 2020a).
Previous studies indicate that some clouds can penetrate the tropopause into the stratosphere, especially over the TP, where tropopause folding events can reach 80 % during certain winters (Chen et al., 2011), and these events are always accompanied by overshooting convective systems (Tian et al., 2020). Overshooting clouds driven by convective activity can affect the material exchange between tropospheric and stratospheric signals (Tian et al., 2011). Both water vapor and oxidation of stratospheric methane directly transported from the troposphere contribute to the increase in stratospheric water vapor. On the one hand, increasing stratospheric water vapor exacerbates the greenhouse effect (Forster and Shine, 2002). On the other hand, stratospheric water vapor can be transported to high latitudes by large-scale meridional circulation (e.g., Brewer–Dobson circulation) (Butchart, 2014). In the polar regions, the stratospheric water vapor concentration determines the critical temperature below which heterogeneous reactions on cold aerosols become important (the mechanism driving enhanced ozone depletion) and the temperature of the Arctic vortex itself, thus increasing stratospheric water vapor also enhances polar ozone consumption (Kirk-Davidoff et al., 1999; Luo et al., 2011). In particular, the impact of overshooting convection on stratospheric water vapor depends on the hour timescale (Dauhut et al., 2020). By following the methods of Dauhut et al. (2020), we perform overshooting detection on individual profiles. Because the cloud–aerosol discrimination algorithm cannot be applied to the CATS L2O layer entirely above the tropopause (Pan and Munchak, 2011), we only consider clouds with a base lower than tropopause height and a top higher than tropopause height as overshooting cloud, as outlined by Dauhut et al. (2020). Based on the CATS data, Dauhut et al. (2020) explored the diurnal cycle of tropical overshooting clouds and found that cloud cover has a first peak at 19:00 or 20:00 LT (local time) and a second peak around 00:00 or 01:00 LT. Here, to add the robustness of statistical result, we combine all of the samples in subregions and provide the diurnal cycle of overshooting cloud cover over the whole TP (Fig. 7). For the related regional and seasonal results, see Fig. S3. Over the TP, the averaged cloud cover of overshooting cloud is higher at night and has a maximum value at 16:00 UTC (22:00 LT), and its value is about 0.013 (Fig. 7). The overshooting cloud cover over the TP is smaller than that in the tropics (Dauhut et al., 2020) by an order of magnitude. Sun et al. (2021) also found this difference in magnitude of occurrence frequency of convective overshooting between the TP and tropical and subtropical areas based on the Tropical Rainfall Measuring Mission (TRMM). Besides the 16:00 UTC data, overshooting cloud cover also has large value around 10:00 UTC (16:00 LT), 13:00 UTC (19:00 LT), 20:00 UTC (02:00 LT), and 22:00 UTC (04:00 LT). Multiple peaks in the diurnal cycle are possibly caused by the regional difference of overshooting cloud. For example, peak value at 16:00 UTC is linked with the overshooting cloud over the southern TP (Fig. S3a), especially during the summer (Fig. S3b). The peak value at 13:00 UTC is possibly related to the overshooting cloud over the southeastern and northwestern parts of the TP (Fig. S3a), especially during the winter (Fig. S3b). Here, it is worth noting that the seasonal and regional results in Fig. S3 are not as robust as those in the Fig. 7 due to fewer cloudy samples being available (see Fig. S4). However, even if Fig. 7 reveals the diurnal cycle of overshooting cloud cover over the whole TP to a certain extent, the statistical result is still noisy due to the overshooting cloud sample number only approaching 300 at 16:00 UTC and being less than 100 most of time (see Fig. S5). In addition, the difference in the tropopause altitude from different data sources also possibly induces some uncertainties in our statistical result. For example, by comparing the tropopause height from MERRA-2, ERA5, and COSMIC observation data, Sun et al. (2021) pointed out that the spatial distribution of tropopause height from COSMIC and ERA5 are similar, while the tropopause from MERRA-2 is a little higher than COSMIC. Overall, the differences between the tropopause height from MERRA-2 and ERA5 is within 0.6 km over the TP (Sun et al., 2021). It means that the overestimation in tropopause height from MERRA-2 may cause a small underestimation of overshooting cloud cover over the TP. It is the one of the possible reasons why the overshooting cloud cover over the TP is smaller than that in the tropics by Dauhut et al. (2020), who used ERA5 temperature and pressure profiles to compute the tropical tropopause height.
3.5 Meteorological factors associated with total cloud cover and cirrus clouds
The diurnal variation in cloud cover is closely related to the diurnal variations in meteorological fields, which promote or inhibit cloud formation (Feofilov and Stubenrauch, 2019; Lei et al., 2020). In this section, we further analyze the correlation of the diurnal cycle between the total cloud cover (and cirrus cover) from CATS dataset and related meteorological factors in the ERA5 dataset over the TP. All factors, including total cloud cover and meteorological factors, are standardized using z-score transformation for comparison. Z scores measure the distance of a data point from the mean in terms of the standard deviation. This method is used for the comparison of datasets with different units and retains the shape properties of the original datasets (same skewness and kurtosis). Figure 8 indicates that the total cloud cover, 2 m temperature, and 10 m wind speed almost always peak in the afternoon (approximately 09:00 UTC) regardless of region, although their peaks do not coincide perfectly. Conversely, the vertically integrated divergence of moisture flux reaches its daily lowest value in the afternoon (approximately 09:00–12:00 UTC). Among all factors and regions, the correlation between the total cloud cover and the vertically integrated divergence of moisture flux is the strongest over the northeastern TP (Fig. 8b), with a correlation coefficient of −0.75. The absolute values of the correlation coefficients between the meteorological factors and the total cloud cover all exceed 0.4, and all of them pass the 90 % significance test. The correlation coefficients suggest that the total cloud cover is strongly correlated with the 2 m temperature, 10 m wind speed, and vertically integrated divergence of moisture flux, regardless of region. In fact, the relationship between the diurnal variations in cloud cover and meteorological factors can be explained mainly by the dynamic and thermal processes of cloud formation and involves processes at different levels of the atmosphere (Kuang and Bretherton, 2006). For example, previous studies have indicated that strong wind near the surface facilitates the transport of moist air at low levels, whether it comes from the Indian Ocean in winter or from the surrounding convergence in summer (Yan et al., 2016). Abundant water vapor is beneficial to cloud formation, which also explains the influence of the vertically integrated divergence of moisture flux on cloud cover. In addition, solar warming of the surface powers the lifting of air masses, which can produce a buoyantly unstable layer near the surface and promote cloud formation, especially of convective boundary layer clouds (Angevine et al., 2001). However, we know that these dynamic and thermal processes between clouds and meteorological factors are coupled, which means that meteorological factors are both linked to the formation of clouds and affected by the clouds (Betts et al., 2014). Thus, the correlation analyses above provide only limited insights into the effects of different meteorological parameters on the total cloud cover diurnal cycle, but they cannot be used to prove a robust causal relationship between them.

Figure 8The standardized total cloud cover (black lines) and vertically integrated divergence of moisture flux (kg m−2 s−1) (blue lines), 2 m temperature (K) (red lines), and 10 m wind speed (m s−1) (yellow lines) of the different regions of the TP: (a) the northwestern TP, (b) the northeastern TP, (c) the southwestern TP, and (d) the southeastern TP. The correlation coefficients are indicated in the bottom-right corner. The correlation coefficient in bold indicates that it can pass the 90 % significance test.
The diurnal variations in cloud cover and meteorological factors vary at the lower and upper tropopause and are driven by different mechanisms (Chepfer et al., 2019). Using ground-based remote sensing data, Mace et al. (2006) found that cirrus clouds are more likely to form in the ascending region of the upper troposphere during the cold season, and in summer the formation of cirrus clouds is also always linked to detrainment from deep convection with both vertical motion and humidity anomalies. The detrainment from deep convection accompanied by small-scale condensate mass updrafts can form cirrus clouds (Mace et al., 2006). In addition, midlatitude weather disturbances with gentle ascending motion are associated with the formation of cirrus clouds (Heymsfield, 1977), and the generation of local convective instabilities also promotes cirrus formation (Sassen et al., 1989). Thus, cirrus formation mechanisms include the supersaturating of water vapor caused by the lifting of the air parcel (e.g., large-scale front, small-scale vertical circulations, convective clouds, and gravity waves) or by radiative cooling (Heymsfield et al., 2017). The above formation mechanisms of cirrus clouds are partly linked to related meteorological variables (e.g., 250 hPa relative humidity, 2 m temperature, and 250 hPa vertical velocity). Thus, the relationship between the diurnal variations in regional averaged cirrus clouds and these parameters is explored in Fig. 9. All factors are standardized using z-score transformation as in Fig. 8, and the higher the standardized vertical velocity, the stronger the ascent. The diurnal variation in total cirrus cloud cover is only significantly positive correlated with 250 hPa relative humidity at a 90 % confidence level (correlation coefficient is 0.77, see Fig. 9a). It indicates that the formation of cirrus is closely related to high-level relative humidity, and this diurnal cycle correlation between cirrus and relative humidity is also found in the tropics (Chepfer et al., 2019). Chepfer et al. (2019) found that relative humidity increases by definition as the surface temperature decreases, and they indicated that the joint evolution of relative humidity with cirrus is likely driven by the diurnal variation in surface temperature rather than the change in the amount of water vapor in the atmosphere. Although there is a correlation between cloud cover of cirrus and meteorological factors, the diurnal variations in clouds and these meteorological factors are in fact both influenced by the diurnal variations in solar radiation. It should be noted that the peak times of the cloud cover of different cirrus types are different to some extent, meaning that they may be controlled by different meteorological factors and mechanisms on a diurnal scale. The correlation coefficient between the diurnal variations in subvisible cirrus clouds and 250 hPa relative humidity reaches 0.83 (Fig. 9b), indicating that the formation of subvisible cirrus clouds depends on large relative humidity possibly caused by cooling of water vapor at upper troposphere, especially during nighttime (Sun et al., 2011b). As shown from the spatial distribution of the correlation coefficient (Fig. S6b), in most areas of the TP subvisible cirrus clouds have a positive correlation with relative humidity, with a correlation coefficient greater than 0.3. The diurnal variation in subvisible cirrus is negative correlation with 2 m temperature (Fig. 9b; correlation coefficient is −0.62) and 250 hPa vertical velocity (correlation coefficient is −0.36). Mace et al. (2006) also found that optically thinner cirrus is not uncommon in regions of weak subsidence; meanwhile, thicker and more persistent cirrus are found in large-scale ascent. There is a maximum peak in the cloud cover of thin cirrus clouds at 22:00 UTC and second peak around 15:00 UTC (Fig. 9c), and thin cirrus clouds have a weak positive correlation with relative humidity (correlation coefficient of 0.47). From the small-scale results of each 2∘ grid, thin cirrus clouds have a significant correlation with meteorological factors only in a small portion of grids (Fig. S6c, j and k). For the opaque cirrus cloud, its diurnal variation is positively correlated with the 250 hPa relative humidity and 250 hPa vertical velocity (correlation coefficients of 0.59 and 0.49, respectively) (Fig. 9d). Although the correlation between opaque cirrus and 2 m temperature does not pass the 90 % significance test, they are found to have similar cycles with a 3 h difference in peak time. A few hours lag between continental convection and 2 m temperature peaks is also found over North America (Tian et al., 2005), which can be attributed to a direct thermodynamic response of continental convection to the strong diurnal cycle of 2 m temperature (Wallace, 1975). The above results indicate that, unlike subvisible cirrus, the diurnal cycle of opaque cirrus is synchronous with diurnal variations in atmospheric convective conditions. Indeed, the diurnal cycle of deep convection over the TP obtained by Meteosat-5 data (Devasthale and Fueglistaler, 2010) is similar to that of opaque cirrus in our results, with the peak during 10:00 to 12:00 UTC (Fig. 9d). In addition, ground-based lidar measurements over the TP also show that cirrus with optical thickness above 0.3 are always observed near deep convection (He et al., 2013). The formations of both thick cirrus and deep convection are promoted by high 2 m temperature (Kent et al., 1995; Yang and Slingo, 2001) and strong ascent (Mace et al., 2006; Louf et al., 2019). For cirrus, its formation is promoted by high 2 m temperature through at least two effects (Kent et al., 1995). On the one hand, the equilibrium water vapor mixing ratio increases with temperature based on the Clausius-Clapeyron equation, which contribute to the increase of ice water content directly. On the other hand, the rise in temperature increases convective available potential energy (CAPE), which is required in the transport of ice particles to the upper troposphere to form cirrus. For deep convection, the formation is also associated with atmospheric instability, which increases with 2 m temperature (Yang and Slingo, 2001). However, the lag in the peak of thinner cirrus may be partly because they need time for detrainment from deep convection. The different types of cirrus life cycles are also inferred in Feofilov and Stubenrauch (2019), who show that the cirrus anvil of deep convection dissipates, releasing water vapor and turning to thin cirrus. Based on the above mechanisms, it is not difficult to understand that the peak times of deep convection and opaque cirrus are lagging behind that of the 2 m temperature and that the peak time of subvisible cirrus is lagging behind that of deep convection and opaque cirrus. Finally, the diurnal variation in subvisible cirrus exhibits an obvious negative correlation with 2 m temperature (Fig. 9b). Of course, variation in deep convection is only one of the possible mechanisms to explain the correlation of diurnal cycle of opaque cirrus clouds with 2 m temperature and 250 hPa vertical velocity. One should keep in mind that cirrus formation is also influenced by other mechanisms (e.g., gravity waves); however, they may not show up on the diurnal cycle.
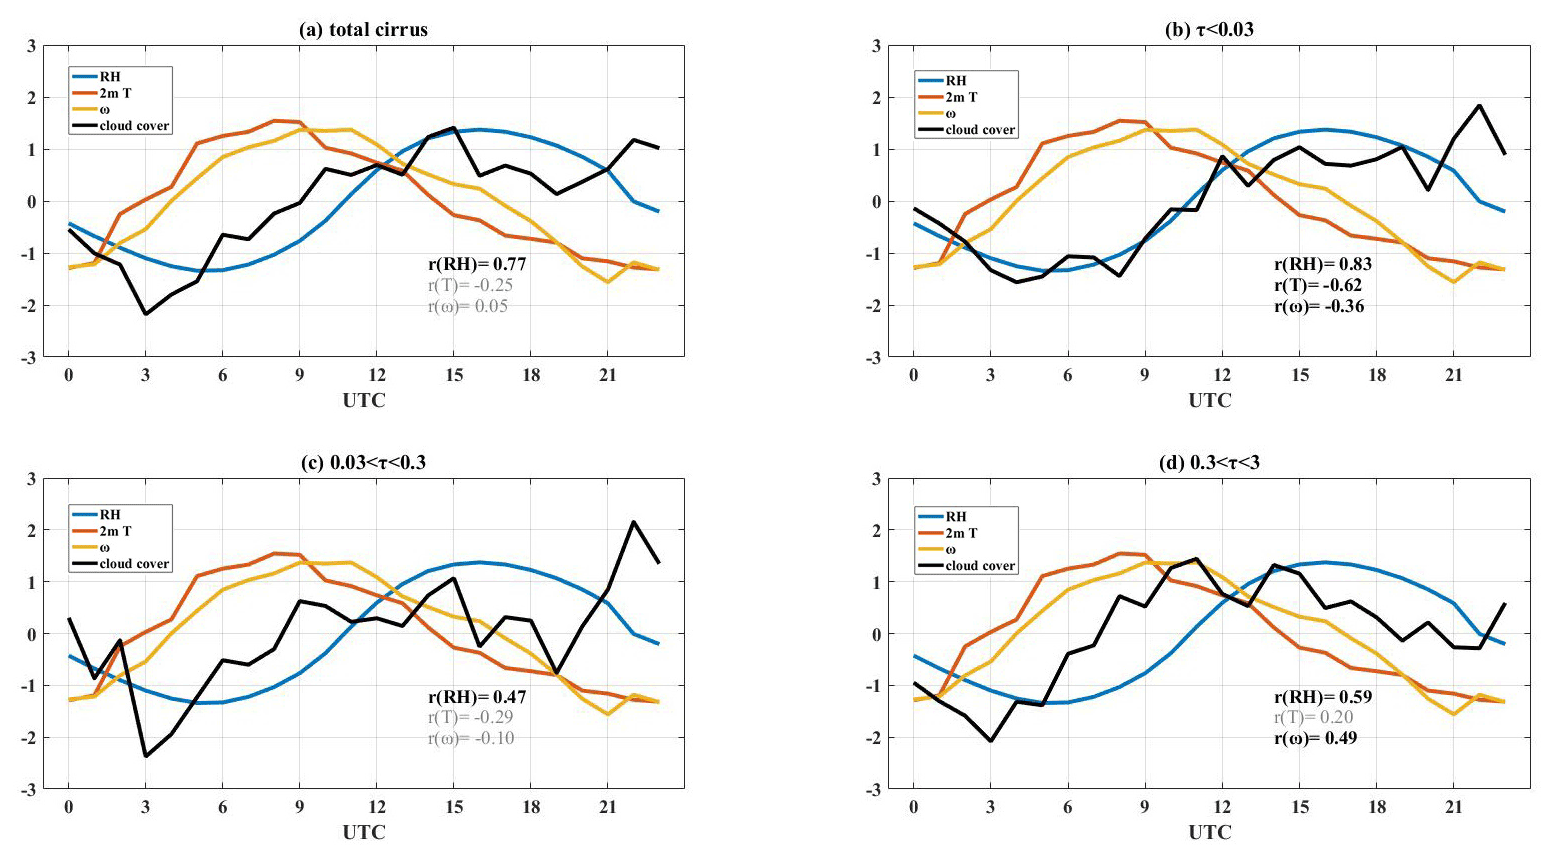
Figure 9The standardized cloud cover of different types of cirrus (black lines), 250 hPa relative humidity (%) (blue lines), 2 m temperature (K) (red lines), and 250 hPa vertical velocity (Pa s−1) (yellow lines) over the TP: (a) all cirrus, (b) subvisible cirrus (optical thickness less than 0.03), (c) thin cirrus (optical thickness between 0.03 and 0.3), (d) opaque cirrus (optical thickness between 0.3 and 3). The correlation coefficients are indicated in the bottom-right corner. Correlation coefficients in bold indicate that it can pass the 90 % significance test.
The TP, also known as the “Asian water tower”, has experienced significant climate changes that are closely linked to clouds. Much of the existing research has focused on long-term changes in cloud properties. However, the diurnal variation in clouds, which plays an important role in the energy budget of the Earth–atmosphere system and climate change, has still received insufficient attention due to observation limitations. As a result, this study explores the diurnal cycle of clouds over the TP based on CATS, ISCCP, Himawari-8, ERA5, MERRA-2, and CMIP6 outputs. Related results will be helpful to improve the simulation and retrieval of total cloud cover and cloud vertical distribution and further provide an observational constraint for simulations of diurnal cycle of surface radiation budget and precipitation over TP region. The main results are as follows.
-
The total cloud cover over the TP peaks at 06:00–09:00 UTC, and clouds are concentrated over the eastern TP. The CATS satellite can capture more clouds at night, as lidar can recognize more of the optically thin cirrus clouds that occur frequently at night than passive detectors. The largest amplitude of diurnal variations is detected by the Himawari-8 and ISCCP, but Himawari-8 significantly underestimates total cloud cover compared with CATS and ISCCP. The diurnal cycle of cloud cover from reanalysis and CMIP6 models does not show changes as dramatic as those from satellite observations.
-
Compared with the cloud vertical distribution detected by CATS, the results from ERA5 and MERRA-2 show significant underestimation of cloud cover at middle and high atmosphere levels. At night, there are more clouds concentrated near the surface over the southern TP according to the reanalysis results, but the CATS lidar has difficulty identifying low clouds under thick clouds. Therefore, CATS cannot obtain complete information on the diurnal variations in cloud vertical distribution over the southeastern TP where low-level clouds are concentrated. However, CATS can still capture the pattern in cloud vertical distribution and the corresponding height of peak cloud cover at middle and high atmosphere levels.
-
The cloud cover of opaque cirrus clouds (0.3<τ<3) dominates other cirrus cloud types over the TP and peaks at 11:00 UTC over the northeastern TP. These cirrus clouds show different characteristics from cirrus clouds in the tropics where thin cirrus clouds dominate (Sassen et al., 2009). More thin cirrus clouds occur at night, especially in the spring. The seasonal average cloud cover of subvisible cirrus clouds (τ<0.03) peaks at 22:00 UTC. In particular, the cloud cover of subvisible cirrus is approximately 0.07 at night (15:00–23:00 UTC), twice as large as during daytime. However, these subvisible cirrus clouds are still difficult to detect during nighttime using passive methods. Over the TP, the average cloud cover of overshooting cloud is higher at night and has a maximum value of about 0.013 at 16:00 UTC, affecting the material exchange between the tropospheric and stratospheric regions.
-
The diurnal variations in the vertically integrated divergence of moisture flux, 2 m temperature and 10 m wind speed show strong correlations with diurnal variations in total cloud cover over the TP. The diurnal cycle of subvisible cirrus clouds has a strong positive correlation with the 250 hPa relative humidity over the whole TP and shows a negative correlation with 2 m temperature and 250 hPa vertical velocity, which indicates that the diurnal variations in cirrus clouds are more dependent on the variations in relative humidity than the variations in other factors. However, the diurnal variations in opaque cirrus clouds obviously correlated with 250 hPa vertical velocity and relative humidity, which shows a connection between the formation of relatively thick cirrus clouds and deep convection. The diurnal cycle of thin cirrus clouds shows a relatively weak correlation with the diurnal cycle of 250 hPa relative humidity.
The comparison of the diurnal cloud cycle between different datasets in this study suggests that large differences exist in these datasets over the TP. Indeed, compared with those of satellites, the amplitudes of cloud diurnal variations obtained by reanalysis and CMIP6 models are too small to affect the simulation of radiation. Of course, it is impossible to completely reconcile cloud covers observed with instruments based on different observation methods. However, the total cloud cover difference between different datasets is possibly caused by following problems: (1) detection sensitivity, as modern passive satellites still have difficulty identifying high-level thin clouds and usually misclassify these clouds as clear sky, (2) cloud parameterization, as some cloud parameterization schemes in climate models and reanalysis data are unreasonable and need to be further improved, or (3) discrepancies in the definitions of cloud cover between observations and models. In addition, the different temporal scales of sampling and the different quantification algorithms of cloud cover may lead to differences between satellite retrievals and model simulations (Engström et al., 2015). In recent years, many studies have contributed to reducing the uncertainty of observed and simulated cloud cover. For example, Sun et al. (2014, 2015) found that using the polarization angle feature of backscattered solar radiation, super thin cirrus clouds with an optical thickness of ∼0.06 can be effectively detected. This offers a new approach for detecting subvisible clouds based on low-cost passive instruments, but this new approach is also only available during the daytime. Over the TP region, our results indicate that subvisible cirrus clouds are more frequent during nighttime. This means that the detection of subvisible cirrus based on the backscattered solar radiation still cannot reduce the uncertainty of observation during nighttime. For the uncertainties in the reanalysis datasets and the other models, the accuracy of model simulations can be improved by optimizing the physical process descriptions in parameterized schemes. The total cloud cover simulation is more realistic and directly links cloud cover to the physical processes of cloud formation (e.g., cumulus convection) instead of achieving cloud cover as a function of relative humidity and the condensate mixing ratio (Ma et al., 2018). In addition, the improvement in cloud overlap parameterization might help to optimize the simulation of cloud cover in multilayer cloud scenarios (Li et al., 2018, 2019). Meanwhile, the ground observations in regional large-scale comprehensive observation experiments greatly help to explore the mechanisms of cloud diurnal variations and to improve the model simulations (Ge et al., 2019; Yang et al., 2021).
In this study, the diurnal cycles of cirrus clouds with different optical depths are explored. Some recent studies have also further discussed the regulatory and formation mechanisms of the diurnal cycle of cirrus clouds. For example, Gasparini et al. (2019) indicated that the diurnal variations in insolation can regulate anvil cirrus evolution and radiative effects. For stratospheric cirrus over the Great Plains and surrounding areas, Zou et al. (2021) found that they are mainly developed by deep convection and gravity wave events. By using the CALIPSO observation and reanalysis dataset, Zhang et al. (2020a) pointed out that large-scale topographic uplift, ice particle production due to temperature fluctuations, and residuals from deep convective anvils contribute to summer cirrus cloud formation over the TP at locations under 9 km, between 9 and 12 km, and above 12 km, respectively. However, these dynamic mechanisms of cirrus formation are complex and cannot be completely described in the diurnal cycle. Thus, although the amount of cirrus cloud cover over the TP is related to meteorological factors from the perspective of microphysics, the present analysis still cannot provide a clear interpretation of which mechanisms drive the diurnal cycles of cirrus clouds of different optical depths. In addition, some previous studies have indicated that diurnal cycles of cloud properties (e.g., cloud droplet size and cloud liquid water path) are related to the variation in aerosol loading in their study periods (Matsui et al., 2006; Ntwali and Chen, 2018), but these studies did not address the impact of meteorological factors on the diurnal cycle of cirrus clouds. By using the 33 months of dust aerosol extinction coefficients and meteorological factors, Wang et al. (2022) showed a robust dependence of diurnal cycle of supercooled water cloud cover on the variation in dust aerosol extinction coefficient instead of other dust load indicators and meteorological parameters. These results demonstrate that aerosol loading can affect the diurnal cycle of cloud cover; however, whether aerosol loading over the TP region is the major driving factor of the diurnal cycle of cirrus clouds is still unclear. Thus, future works should also pay more attention to the impact of aerosol on the diurnal cycle of cirrus cloud over the TP region.
To further quantify the spatial consistency of total cloud cover from passive satellites, reanalyses, and models with CATS observations, a Taylor diagram (Taylor, 2001) is used to provide the standard deviation and centered root-mean-square deviation (RMSD) normalized by the observed values and the spatial correlation coefficients between other datasets and CATS observations (Fig. A1). Here, all datasets are uniformly interpolated into 2∘ by 2∘. The standard deviation and RMSD show the changes in amplitudes and phases of the different datasets, respectively. That is, the closer the standard deviation shown by the points in Fig. A1 is to the red line, the closer the amplitude of the spatial difference is for the total cloud cover of the datasets and CATS. The smaller the RMSD is, the more similar the distribution pattern is to that of CATS. The results show that the correlation coefficient between CMIP6 multimodel mean and CATS is large, with an average of 0.47, but the spatial consistency between certain CMIP6 models (e.g., IPSL-CM6A-LR) and CATS is poor. ISCCP, which is the closest dataset to the regional mean total cloud cover of CATS in Fig. 2, shows a weaker correlation with CATS in spatial distribution every 3 h, with an average of 0.23. The standard deviation in the Himawari-8 is relatively large compared to other datasets from 00:00 to 06:00 UTC, which indicates that the Himawari-8 overestimates the spatial difference when the mean total cloud cover is relatively low. ERA5 has a smaller standard deviation than CATS during 03:00–12:00 UTC. The minimum correlation coefficient between ERA5 and CATS is 0.25 at 09:00 UTC, and the average correlation coefficient is 0.50. Despite the different amplitudes of diurnal variation in total cloud cover between CATS and MERRA-2, their spatial distribution shows high consistency, with the largest average correlation coefficient among all datasets being 0.57. The standard deviation of MERRA-2 is less than that of CATS across the whole day.

Figure A1The Taylor diagram describing spatial consistency of total cloud cover between different datasets and CATS every 3 h. The distance from the origin of the coordinate axis represents the standard deviation for each dataset in spatial distribution. The distance from the red dot labeled “CATS” represents centered root-mean-square deviation (RMSD, purple circle). The time represented by each image is displayed in the upper-right corner, and the time here is local time.
The CATS datasets are downloaded from the NASA Langley Research Center Atmospheric Science Data Center (ASDC) website: https://eosweb.larc.nasa.gov/project/CATS-ISS?level=2 (NASA/LARC/SD/ASDC, 2018a, b, c, d). The ISCCP data are available from the following website: https://www.ncei.noaa.gov/products/international-satellite-cloud-climatology (Rossow et al., 2016). The Himawari-8 data are available from the Japan Aerospace Exploration Agency, Earth Observation Research Center (JAXA/EORC) website: https://www.eorc.jaxa.jp/ptree/ (P-Tree System, 2016). The ERA5 datasets are available from Climate Data Store (CDS) https://doi.org/10.24381/cds.adbb2d47 and https://doi.org/10.24381/cds.bd0915c6 (Hersbach et al., 2018a, b). The MERRA-2 datasets are available from the Global Modeling and Assimilation Office (GMAO) https://doi.org/10.5067/Q9QMY5PBNV1T and https://doi.org/10.5067/3UGE8WQXZAOK (Global Modeling and Assimilation Office, 2015a, b). The CMIP6 outputs are downloaded from the Earth System Grid Federation (ESGF) website: https://esgf-node.llnl.gov/search/cmip6/ (WCRP, 2022). The CALIPSO data are available from https://doi.org/10.5067/CALIOP/CALIPSO/LID_L2_05KMCLAY-STANDARD-V4-20 (NASA/LARC/SD/ASDC, 2018e). The 2B-GEOPROF-LIDAR data are available from https://www.cloudsat.cira.colostate.edu/data-products/2b-geoprof-lidar (CLOUDSAT, 2022).
The supplement related to this article is available online at: https://doi.org/10.5194/acp-23-743-2023-supplement.
YZ and JL organized the paper and performed related analysis. YZ prepared the manuscript with contributions from all co-authors. JL conceptualized the paper and revised the whole manuscript. LZ, CD, and YL downloaded the data used in this study. YH, BJ and JH provided suggestions for this study. All authors contributed to the discussion of the results and reviewed the manuscript.
At least one of the authors is a member of the editorial board of Atmospheric Chemistry and Physics. The peer-review process was guided by an independent editor, and the authors also have no other competing interests to declare.
Publisher's note: Copernicus Publications remains neutral with regard to jurisdictional claims in published maps and institutional affiliations.
We would like to thank the CATS, ISCCP, Himawari-8, ERA5, MERRA-2, and CMIP6 science teams for providing excellent and accessible data products that made this study possible.
This research was jointly supported by the Strategic Priority Research Program of the Chinese Academy of Sciences (XDA2006010301) and the National Science Fund for Excellent Young Scholars (42022037).
This paper was edited by Odran Sourdeval and reviewed by three anonymous referees.
Angevine, W. M., Baltink, H. K., and Bosveld, F. C.: Observations Of The Morning Transition Of The Convective Boundary Layer, Bound.-Layer Meteor., 101, 209–227, https://doi.org/10.1023/A:1019264716195, 2001.
Betts, A. K., Desjardins, R., Worth, D., and Beckage, B.: Climate coupling between temperature, humidity, precipitation, and cloud cover over the Canadian Prairies, J. Geophys. Res.-Atmos., 119, 13305–31326, https://doi.org/10.1002/2014JD022511, 2014.
Binder, H., Boettcher, M., Joos, H., Sprenger, M., and Wernli, H.: Vertical cloud structure of warm conveyor belts – a comparison and evaluation of ERA5 reanalysis, CloudSat and CALIPSO data, Weather Clim. Dynam., 1, 577–595, https://doi.org/10.5194/wcd-1-577-2020, 2020.
Bodas-Salcedo, A.: Cloud Condensate and Radiative Feedbacks at Midlatitudes in an Aquaplanet, Geophys. Res. Lett., 45, 3635–3643, https://doi.org/10.1002/2018GL077217, 2018.
Borrmann, S., Solomon, S., Dye, J. E., and Luo, B.: The potential of cirrus clouds for heterogeneous chlorine activation, Geophys. Res. Lett., 23, 2133–2136, https://doi.org/10.1029/96GL01957, 1996.
Boudala, F. S. and Milbrandt, J. A.: Evaluations of the Climatologies of Three Latest Cloud Satellite Products Based on Passive Sensors (ISCCP-H, Two CERES) against the CALIPSO-GOCCP, Remote Sens., 13, 5150, https://doi.org/10.3390/rs13245150, 2021.
Butchart, N.: The Brewer-Dobson circulation, Rev. Geophys., 52, 157–184, https://doi.org/10.1002/2013RG000448, 2014.
Chen, X. L., Ma, Y. M., Kelder, H., Su, Z., and Yang, K.: On the behaviour of the tropopause folding events over the Tibetan Plateau, Atmos. Chem. Phys., 11, 5113–5122, https://doi.org/10.5194/acp-11-5113-2011, 2011.
Cheng, G. and Wu, T.: Responses of permafrost to climate change and their environmental significance, Qinghai – Tibet Plateau, J. Geophys. Res., 112, F02S03, https://doi.org/10.1029/2006JF000631, 2007.
Chepfer, H., Brogniez, H., and Noel, V.: Diurnal variations of cloud and relative humidity profiles across the tropics, Sci. Rep., 9, 16045, https://doi.org/10.1038/s41598-019-52437-6, 2019.
Cherian, R. and Quaas, J.: Trends in AOD, Clouds, and Cloud Radiative Effects in Satellite Data and CMIP5 and CMIP6 Model Simulations Over Aerosol Source Regions, Geophys. Res. Lett., 47, e2020GL087132, https://doi.org/10.1029/2020GL087132, 2020.
CLOUDSAT: 2B-Geoprof-lidar product, CloudSat Data Processing Center [data set], https://www.cloudsat.cira.colostate.edu/data-products/2b-geoprof-lidar, last access: 17 July 2022.
Dai, A. and Trenberth, K. E.: The Diurnal Cycle and Its Depiction in the Community Climate System Model, J. Climate, 17, 930–951, https://doi.org/10.1175/1520-0442(2004)017<0930:Tdcaid>2.0.Co;2, 2004.
Dauhut, T., Noel, V., and Dion, I.-A.: The diurnal cycle of the clouds extending above the tropical tropopause observed by spaceborne lidar, Atmos. Chem. Phys., 20, 3921–3929, https://doi.org/10.5194/acp-20-3921-2020, 2020.
Devasthale, A. and Fueglistaler, S.: A climatological perspective of deep convection penetrating the TTL during the Indian summer monsoon from the AVHRR and MODIS instruments, Atmos. Chem. Phys., 10, 4573–4582, https://doi.org/10.5194/acp-10-4573-2010, 2010.
Duan, A. and Wu, G.: Change of cloud amount and the climate warming on the Tibetan Plateau, Geophys. Res. Lett., 33, L22704, https://doi.org/10.1029/2006GL027946, 2006.
ECMWF: IFS Documentation CY41R2 – Part IV: Physical Processes, in: IFS Documentation CY41R2, IFS Documentation, 4, ECMWF, https://doi.org/10.21957/tr5rv27xu, 2016.
Engström, A., Bender, F. A.-M., Charlson, R. J., and Wood, R.: The nonlinear relationship between albedo and cloud fraction on near-global, monthly mean scale in observations and in the CMIP5 model ensemble, Geophys. Res. Lett., 42, 9571–9578, https://doi.org/10.1002/2015GL066275, 2015.
Eyring, V., Bony, S., Meehl, G. A., Senior, C. A., Stevens, B., Stouffer, R. J., and Taylor, K. E.: Overview of the Coupled Model Intercomparison Project Phase 6 (CMIP6) experimental design and organization, Geosci. Model Dev., 9, 1937–1958, https://doi.org/10.5194/gmd-9-1937-2016, 2016.
Feofilov, A. G. and Stubenrauch, C. J.: Diurnal variation of high-level clouds from the synergy of AIRS and IASI space-borne infrared sounders, Atmos. Chem. Phys., 19, 13957–13972, https://doi.org/10.5194/acp-19-13957-2019, 2019.
Forster, P. M. d. F. and Shine, K. P.: Assessing the climate impact of trends in stratospheric water vapor, Geophys. Res. Lett., 29, 6, https://doi.org/10.1029/2001GL013909, 2002.
Fu, Q., Hu, Y., and Yang, Q.: Identifying the top of the tropical tropopause layer from vertical mass flux analysis and CALIPSO lidar cloud observations, Geophys. Res. Lett., 34, L14813, https://doi.org/10.1029/2007GL030099, 2007.
Fusina, F., Spichtinger, P., and Lohmann, U.: Impact of ice supersaturated regions and thin cirrus on radiation in the midlatitudes, J. Geophys. Res.-Atmos., 112, D24S14, https://doi.org/10.1029/2007JD008449, 2007.
Gasparini, B., Blossey, P. N., Hartmann, D. L., Lin, G., and Fan, J.: What Drives the Life Cycle of Tropical Anvil Clouds?, J. Adv. Model. Earth Syst., 11, 2586–2605, https://doi.org/10.1029/2019MS001736, 2019.
Gasparini, B., McGraw, Z., Storelvmo, T., and Lohmann, U.: To what extent can cirrus cloud seeding counteract global warming, Environ. Res. Lett., 15, 5, https://doi.org/10.1088/1748-9326/AB71A3, 2020.
Ge, J., Wang, Z., Liu, Y., Su, J., Wang, C., and Dong, Z.: Linkages between mid-latitude cirrus cloud properties and large-scale meteorology at the SACOL site, Clim. Dynam., 53, 5035–5046, https://doi.org/10.1007/s00382-019-04843-9, 2019.
Global Modeling and Assimilation Office (GMAO): MERRA-2 tavg1_2d_rad_Nx: 2d, 1-Hourly, Time-Averaged, Single-Level, Assimilation,Radiation Diagnostics V5.12.4, Greenbelt, MD, USA, Goddard Earth Sciences Data and Information Services Center (GES DISC) [data set], https://doi.org/10.5067/Q9QMY5PBNV1T, 2015a.
Global Modeling and Assimilation Office (GMAO): MERRA-2 tavg3_3d_rad_Np: 3d, 3-Hourly, Time-Averaged, Pressure-Level, Assimilation, Radiation Diagnostics V5.12.4, Greenbelt, MD, USA, Goddard Earth Sciences Data and Information Services Center (GES DISC) [data set], https://doi.org/10.5067/3UGE8WQXZAOK, 2015b.
Hartmann, D. L., Holton, J. R., and Fu, Q.: The heat balance of the tropical tropopause, cirrus, and stratospheric dehydration, Geophys. Res. Lett., 28, 1969–1972, https://doi.org/10.1029/2000GL012833, 2001.
He, Q., Li, C., Ma, J., Wang, H., Shi, G., Liang, Z., Luan, Q., Geng, F., and Zhou, X.: The Properties and Formation of Cirrus Clouds over the Tibetan Plateau Based on Summertime Lidar Measurements, J. Atmos. Sci., 70, 901–915, https://doi.org/10.1175/jas-d-12-0171.1, 2013.
Hersbach, H., Bell, B., Berrisford, P., Biavati, G., Horányi, A., Muñoz Sabater, J., Nicolas, J., Peubey, C., Radu, R., Rozum, I., Schepers, D., Simmons, A., Soci, C., Dee, D., and Thépaut, J-N.: ERA5 hourly data on single levels from 1959 to present, Copernicus Climate Change Service (C3S) Climate Data Store (CDS) [data set], https://doi.org/10.24381/cds.adbb2d47, 2018a.
Hersbach, H., Bell, B., Berrisford, P., Biavati, G., Horányi, A., Muñoz Sabater, J., Nicolas, J., Peubey, C., Radu, R., Rozum, I., Schepers, D., Simmons, A., Soci, C., Dee, D., and Thépaut, J-N.: ERA5 hourly data on pressure levels from 1959 to present, Copernicus Climate Change Service (C3S) Climate Data Store (CDS) [data set], https://doi.org/10.24381/cds.bd0915c6, 2018b.
Hersbach, H., Bell, B., Berrisford, P., Hirahara, S., Horányi, A., Muñoz-Sabater, J., Nicolas, J., Peubey, C., Radu, R., Schepers, D., Simmons, A., Soci, C., Abdalla, S., Abellan, X., Balsamo, G., Bechtold, P., Biavati, G., Bidlot, J., Bonavita, M., De Chiara, G., Dahlgren, P., Dee, D., Diamantakis, M., Dragani, R., Flemming, J., Forbes, R., Fuentes, M., Geer, A., Haimberger, L., Healy, S., Hogan, R. J., Hólm, E., Janisková, M., Keeley, S., Laloyaux, P., Lopez, P., Lupu, C., Radnoti, G., de Rosnay, P., Rozum, I., Vamborg, F., Villaume, S., and Thépaut, J.-N.: The ERA5 global reanalysis, Q. J. Roy. Meteor. Soc., 146, 1999–2049, https://doi.org/10.1002/qj.3803, 2020.
Heymsfield, A. J.: Precipitation Development in Stratiform Ice Clouds: A Microphysical and Dynamical Study, J. Atmos. Sci., 34, 367–381, https://doi.org/10.1175/1520-0469(1977)034<0367:Pdisic>2.0.Co;2, 1977.
Heymsfield, A. J., Krämer, M., Luebke, A., Brown, P., Cziczo, D. J., Franklin, C., Lawson, P., Lohmann, U., McFarquhar, G., Ulanowski, Z., and Van Tricht, K.: Cirrus Clouds, Meteor. Mon., 58, 2.1–2.26, https://doi.org/10.1175/amsmonographs-d-16-0010.1, 2017.
Holz, R. E., Ackerman, S. A., Nagle, F. W., Frey, R., Dutcher, S., Kuehn, R. E., Vaughan, M. A., and Baum, B.: Global Moderate Resolution Imaging Spectroradiometer (MODIS) cloud detection and height evaluation using CALIOP, J. Geophys. Res.-Atmos., 113, D00A19, https://doi.org/10.1029/2008JD009837, 2008.
Imai, T. and Yoshida, R.: Algorithm theoretical basis for Himawari-8 cloud mask product, Meteorological satellite center technical note, 61, 1–17, 2016.
Karlsson, K.-G. and Devasthale, A.: Inter-Comparison and Evaluation of the Four Longest Satellite-Derived Cloud Climate Data Records: CLARA-A2, ESA Cloud CCI V3, ISCCP-HGM, and PATMOS-x, Remote Sens., 10, 1567, https://doi.org/10.3390/rs10101567, 2018.
Kent, G. S., Williams, E. R., Wang, P. H., McCormick, M. P., and Skeens, K. M.: Surface temperature related variations in tropical cirrus cloud as measured by SAGE II., J. Climate, 8, 2577–2594, https://doi.org/10.1175/1520-0442(1995)008<2577:STRVIT>2.0.CO;2, 1995.
Kirk-Davidoff, D. B., Hintsa, E. J., Anderson, J. G., and Keith, D. W.: The effect of climate change on ozone depletion through changes in stratospheric water vapour, Nature, 402, 399–401, https://doi.org/10.1038/46521, 1999.
Kleist, D. T., Parrish, D. F., Derber, J. C., Treadon, R., Wu, W.-S., and Lord, S.: Introduction of the GSI into the NCEPs Global Data Assimilation System, Weather Forecast., 24, 1691–1705, https://doi.org/10.1175/2009waf2222201.1, 2009.
Knapp, K. R., Young, A. H., Semunegus, H., Inamdar, A. K., and Hankins, W.: Adjusting ISCCP Cloud Detection to Increase Consistency of Cloud Amount and Reduce Artifacts, J. Atmos. Ocean. Technol., 38, 155–165, https://doi.org/10.1175/jtech-d-20-0045.1, 2021.
Kuang, Z. and Bretherton, C. S.: A Mass-Flux Scheme View of a High-Resolution Simulation of a Transition from Shallow to Deep Cumulus Convection, J. Atmos. Sci., 63, 1895–1909, https://doi.org/10.1175/jas3723.1, 2006.
Kukulies, J., Chen, D., and Wang, M.: Temporal and spatial variations of convection and precipitation over the Tibetan Plateau based on recent satellite observations. Part I: Cloud climatology derived from CloudSat and CALIPSO, Int. J. Climatol., 39, 5396–5412, 2019.
Lei, Y., Letu, H., Shang, H., and Shi, J.: Cloud cover over the Tibetan Plateau and eastern China: a comparison of ERA5 and ERA-Interim with satellite observations, Clim. Dynam, 54, 2941–2957, https://doi.org/10.1007/s00382-020-05149-x, 2020.
Letu, H., Nagao, T. M., Nakajima, T. Y., Riedi, J., Ishimoto, H., Baran, A. J., Shang, H., Sekiguchi, M., and Kikuchi, M.: Ice cloud properties from Himawari-8/AHI next-generation geostationary satellite: Capability of the AHI to monitor the DC cloud generation process, IEEE T. Geosci. Remote, 57, 3229–3239, 2018.
Letu, H., Yang, K., Nakajima, T. Y., Ishimoto, H., Nagao, T. M., Riedi, J., Baran, A. J., Ma, R., Wang, T., and Shang, H.: High-resolution retrieval of cloud microphysical properties and surface solar radiation using Himawari-8/AHI next-generation geostationary satellite, Remote Sens. Environ., 239, 111583, https://doi.org/10.1016/j.rse.2019.111583, 2020.
Li, J., Yi, Y., Minnis, P., Huang, J., Yan, H., Ma, Y., Wang, W., and Kirk Ayers, J.: Radiative effect differences between multi-layered and single-layer clouds derived from CERES, CALIPSO, and CloudSat data, J. Quant. Spectrosc. Radiat. Transf., 112, 361–375, https://doi.org/10.1016/j.jqsrt.2010.10.006, 2011.
Li, J., Mao, J., and Wang, F.: Comparative study of five current reanalyses in characterizing total cloud fraction and top-of-the-atmosphere cloud radiative effects over the Asian monsoon region, Int. J. Climatol., 37, 5047–5067, https://doi.org/10.1002/joc.5143, 2017.
Li, J., Lv, Q., Jian, B., Zhang, M., Zhao, C., Fu, Q., Kawamoto, K., and Zhang, H.: The impact of atmospheric stability and wind shear on vertical cloud overlap over the Tibetan Plateau, Atmos. Chem. Phys., 18, 7329–7343, https://doi.org/10.5194/acp-18-7329-2018, 2018.
Li, J., Jian, B., Zhao, C., Zhao, Y., Wang, J., and Huang, J.: Atmospheric Instability Dominates the Long-Term Variation of Cloud Vertical Overlap Over the Southern Great Plains Site, J. Geophys. Res.-Atmos., 124, 9691–9701, https://doi.org/10.1029/2019JD030954, 2019.
Li, Y. and Zhang, M.: Cumulus over the Tibetan Plateau in the Summer Based on CloudSat–CALIPSO Data, J. Climate, 29, 1219–1230, https://doi.org/10.1175/jcli-d-15-0492.1, 2016.
Liou, K.-N.: Influence of Cirrus Clouds on Weather and Climate Processes: A Global Perspective, Mon. Weather Rev., 114, 1167–1199, https://doi.org/10.1175/1520-0493(1986)114<1167:Ioccow>2.0.Co;2, 1986.
Liu, X. and Chen, B.: Climatic warming in the Tibetan Plateau during recent decades, Int. J. Climatol., 20, 1729–1742, https://doi.org/10.1002/1097-0088(20001130)20:14<1729::AID-JOC556>3.0.CO;2-Y, 2000.
Liu, L., Zheng, J., Ruan, Z., Cui, Z., Hu, Z., Wu, S., Dai, G., and Wu, Y.: Comprehensive radar observations of clouds and precipitation over the Tibetan Plateau and preliminary analysis of cloud properties, J. Meteorol. Res., 29, 546–561, https://doi.org/10.1007/s13351-015-4208-6, 2015.
Louf, V., Jakob, C., Protat, A., Bergemann, M., and Narsey, S.: The Relationship of Cloud Number and Size With Their Large-Scale Environment in Deep Tropical Convection, Geophys. Res. Lett., 46, 9203–9212, https://doi.org/10.1029/2019GL083964, 2019.
Luo, Y., Zhang, R., Qian, W., Luo, Z., and Hu, X.: Intercomparison of Deep Convection over the Tibetan Plateau–Asian Monsoon Region and Subtropical North America in Boreal Summer Using CloudSat/CALIPSO Data, J. Climate, 24, 2164–2177, https://doi.org/10.1175/2010JCLI4032.1, 2011.
Ma, Z., Liu, Q., Zhao, C., Shen, X., Wang, Y., Jiang, J. H., Li, Z., and Yung, Y.: Application and Evaluation of an Explicit Prognostic Cloud-Cover Scheme in GRAPES Global Forecast System, J. Adv. Model. Earth Syst., 10, 652–667, https://doi.org/10.1002/2017MS001234, 2018.
Ma, Q., You, Q., Ma, Y., Cao, Y., Zhang, J., Niu, M., and Zhang, Y.: Changes in cloud amount over the Tibetan Plateau and impacts of large-scale circulation, Atmos. Res., 249, 105332, https://doi.org/10.1016/j.atmosres.2020.105332, 2021.
Mace, G. G., Benson, S., and Vernon, E.: Cirrus Clouds and the Large-Scale Atmospheric State: Relationships Revealed by Six Years of Ground-Based Data, J. Climate, 19, 3257–3278, https://doi.org/10.1175/jcli3786.1, 2006.
Marchand, R., Ackerman, T., Smyth, M., and Rossow, W. B.: A review of cloud top height and optical depth histograms from MISR, ISCCP, and MODIS, J. Geophys. Res.-Atmos., 115, D16206, https://doi.org/10.1029/2009JD013422, 2010.
Matsui, T., Masunaga, H., Kreidenweis, S. M., Pielke Sr., R. A., Tao, W.-K., Chin, M., and Kaufman, Y. J.: Satellite-based assessment of marine low cloud variability associated with aerosol, atmospheric stability, and the diurnal cycle, J. Geophys. Res.-Atmos., 111, D17204, https://doi.org/10.1029/2005JD006097, 2006.
McGill, M. J., Yorks, J. E., Scott, V. S., Kupchock, A. W., and Selmer, P. A.: The Cloud-Aerosol Transport System (CATS): a technology demonstration on the International Space Station, Proc. Spie, 9612, 34–39, https://doi.org/10.1117/12.2190841, 2015.
Miao, H., Wang, X., Liu, Y., and Wu, G.: An evaluation of cloud vertical structure in three reanalyses against CloudSat/cloud-aerosol lidar and infrared pathfinder satellite observations, Atmos. Sci. Lett., 20, e906, https://doi.org/10.1002/asl.906, 2019.
Minnis, P., Trepte, Q. Z., Sun-Mack, S., Chen, Y., Doelling, D. R., Young, D. F., Spangenberg, D. A., Miller, W. F., Wielicki, B. A., Brown, R. R., Gibson, S. C., and Geier, E. B.: Cloud Detection in Nonpolar Regions for CERES Using TRMM VIRS and Terra and Aqua MODIS Data, IEEE T. Geosci. Remote, 46, 3857–3884, https://doi.org/10.1109/TGRS.2008.2001351, 2008.
Molod, A.: Constraints on the Profiles of Total Water PDF in AGCMs from AIRS and a High-Resolution Model, J. Climate, 25, 8341–8352, https://doi.org/10.1175/jcli-d-11-00412.1, 2012.
Molod, A., Takacs, L., Suarez, M., and Bacmeister, J.: Development of the GEOS-5 atmospheric general circulation model: evolution from MERRA to MERRA2, Geosci. Model Dev., 8, 1339–1356, https://doi.org/10.5194/gmd-8-1339-2015, 2015.
NASA/LARC/SD/ASDC: CATS-ISS Level 2 Operational Night Mode 7.2 Version 3-01 5 km Profile, NASA Langley Atmospheric Science Data Center DAAC [data set], https://doi.org/10.5067/ISS/CATS/L2O_N-M7.2-V3-01_05kmPro, 2018a.
NASA/LARC/SD/ASDC: CATS-ISS Level 2 Operational Night Mode 7.2 Version 3-01 5 km Layer, NASA Langley Atmospheric Science Data Center DAAC [data set], https://doi.org/10.5067/ISS/CATS/L2O_N-M7.2-V3-01_05kmLay, 2018b.
NASA/LARC/SD/ASDC: CATS-ISS Level 2 Operational Day Mode 7.2 Version 3-01 5 km Profile, NASA Langley Atmospheric Science Data Center DAAC [data set], https://doi.org/10.5067/ISS/CATS/L2O_D-M7.2-V3-01_05kmPro, 2018c.
NASA/LARC/SD/ASDC: CATS-ISS Level 2 Operational Day Mode 7.2 Version 3-01 5 km Layer, NASA Langley Atmospheric Science Data Center DAAC [data set], https://doi.org/10.5067/ISS/CATS/L2O_D-M7.2-V3-01_05kmLay, 2018d.
NASA/LARC/SD/ASDC: CALIPSO Lidar Level 2 5 km Cloud Layer, NASA Langley Atmospheric Science Data Center DAAC [data set], V4-20, https://doi.org/10.5067/CALIOP/CALIPSO/LID_L2_05KMCLAY-STANDARD-V4-20, 2018e.
Naud, C. M. and Chen, Y.-H.: Assessment of ISCCP cloudiness over the Tibetan Plateau using CloudSat-CALIPSO, J. Geophys. Res.-Atmos., 115, D10203, https://doi.org/10.1029/2009JD013053, 2010.
Naud, C. M., Rangwala, I., Xu, M., and Miller, J. R.: A Satellite View of the Radiative Impact of Clouds on Surface Downward Fluxes in the Tibetan Plateau, J. Appl. Meteorol. Clim., 54, 479–493, https://doi.org/10.1175/JAMC-D-14-0183.1, 2015.
Nesbitt, S. W., Gochis, D. J., and Lang, T. J.: The Diurnal Cycle of Clouds and Precipitation along the Sierra Madre Occidental Observed during NAME-2004: Implications for Warm Season Precipitation Estimation in Complex Terrain, J. Hydrometeorol., 9, 728–743, https://doi.org/10.1175/2008jhm939.1, 2008.
Noel, V., Chepfer, H., Chiriaco, M., and Yorks, J.: The diurnal cycle of cloud profiles over land and ocean between 51° S and 51° N, seen by the CATS spaceborne lidar from the International Space Station, Atmos. Chem. Phys., 18, 9457–9473, https://doi.org/10.5194/acp-18-9457-2018, 2018.
Norris, J. R. and Evan, A. T.: Empirical Removal of Artifacts from the ISCCP and PATMOS-x Satellite Cloud Records, J. Atmos. Ocean. Tech., 32, 691–702, https://doi.org/10.1175/jtech-d-14-00058.1, 2015.
Ntwali, D. and Chen, H.: Diurnal spatial distributions of aerosol optical and cloud micro-macrophysics properties in Africa based on MODIS observations, Atmos. Environ., 182, 252–262, https://doi.org/10.1016/j.atmosenv.2018.03.054, 2018.
O'Neill, B. C., Tebaldi, C., van Vuuren, D. P., Eyring, V., Friedlingstein, P., Hurtt, G., Knutti, R., Kriegler, E., Lamarque, J.-F., Lowe, J., Meehl, G. A., Moss, R., Riahi, K., and Sanderson, B. M.: The Scenario Model Intercomparison Project (ScenarioMIP) for CMIP6, Geosci. Model Dev., 9, 3461–3482, https://doi.org/10.5194/gmd-9-3461-2016, 2016.
Oreopoulos, L., Cho, N., and Lee, D.: New insights about cloud vertical structure from CloudSat and CALIPSO observations, J. Geophys. Res.-Atmos., 122, 9280–9300, https://doi.org/10.1002/2017JD026629, 2017.
Pan, L. and Munchak, L. A.: Relationship of Cloud Top to the Tropopause and Jet Structure from CALIPSO Data, J. Geophys. Res., 116, D12201, https://doi.org/10.1029/2010JD015462, 2011.
Pan, Z., Mao, F., Gong, W., Min, Q., and Wang, W.: The warming of Tibetan Plateau enhanced by 3D variation of low-level clouds during daytime, Remote Sens. Environ., 198, 363–368, https://doi.org/10.1016/j.rse.2017.06.024, 2017.
Pauly, R. M., Yorks, J. E., Hlavka, D. L., McGill, M. J., Amiridis, V., Palm, S. P., Rodier, S. D., Vaughan, M. A., Selmer, P. A., Kupchock, A. W., Baars, H., and Gialitaki, A.: Cloud-Aerosol Transport System (CATS) 1064 nm calibration and validation, Atmos. Meas. Tech., 12, 6241–6258, https://doi.org/10.5194/amt-12-6241-2019, 2019.
Posselt, D. J., Stephens, G. L., and Miller, M.: CLOUDSAT: Adding a New Dimension to a Classical View of Extratropical Cyclones, B. Am. Meteorol. Soc., 89, 599–610, https://doi.org/10.1175/bams-89-5-599, 2008.
P-Tree System: Himawari-8, Japan Aerospace Exploration Agency/ Earth Observation Research Center (JAXA/EORC) [data set], https://www.eorc.jaxa.jp/ptree/ (last access: 17 April 2021), 2016.
Rajapakshe, C., Zhang, Z., Yorks, J. E., Yu, H., Tan, Q., Meyer, K., Platnick, S., and Winker, D. M.: Seasonally transported aerosol layers over southeast Atlantic are closer to underlying clouds than previously reported, Geophys. Res. Lett., 44, 5818–5825, https://doi.org/10.1002/2017GL073559, 2017.
Ramaswamy, V. and Detwiler, A.: Interdependence of radiation and microphysics in cirrus clouds, J. Atmos. Sci., 43, 2289–2301, https://doi.org/10.1175/1520-0469(1986)043<2289:Iorami>2.0.Co;2, 1986.
Rangwala, I., Miller, J. R., and Xu, M.: Warming in the Tibetan Plateau: Possible influences of the changes in surface water vapor, Geophys. Res. Lett., 36, L06703, https://doi.org/10.1029/2009GL037245, 2009.
Rangwala, I., Miller, J. R., Russell, G. L., and Xu, M.: Using a global climate model to evaluate the influences of water vapor, snow cover and atmospheric aerosol on warming in the Tibetan Plateau during the twenty-first century, Clim. Dynam., 34, 859–872, https://doi.org/10.1007/s00382-009-0564-1, 2010.
Ren, H. and Pan, X.: Integration dataset of Tibet Plateau boundary, National Tibetan Plateau Data Center [data set], https://doi.org/10.11888/Geogra.tpdc.270099, 2019.
Rienecker, M. M., Suarez, M. J., Todling, R., Bacmeister, J., Takacs, L., Liu, H. -C., Gu, W., Sienkiewicz, M., Koster, R. D., Gelaro, R., Stajner, I., and Nielsen, J. E.: The GEOS-5 Data Assimilation System–Documentation of versions 5.0.1, 5.1.0, and 5.2.0, Technical Report Series on Global Modeling and Data Assimilation, NASA Technical Reports 27, 118, https://ntrs.nasa.gov/api/citations/20120011955/downloads/20120011955.pdf (last access: 13 January 2023), 2008.
Rienecker, M. M., Suarez, M. J., Gelaro, R., Todling, R., Bacmeister, J., Liu, E., Bosilovich, M. G., Schubert, S. D., Takacs, L., Kim, G.-K., Bloom, S., Chen, J., Collins, D., Conaty, A., da Silva, A., Gu, W., Joiner, J., Koster, R. D., Lucchesi, R., Molod, A., Owens, T., Pawson, S., Pegion, P., Redder, C. R., Reichle, R., Robertson, F. R., Ruddick, A. G., Sienkiewicz, M., and Woollen, J.: MERRA: NASA's Modern-Era Retrospective Analysis for Research and Applications, J. Climate, 24, 3624–3648, https://doi.org/10.1175/jcli-d-11-00015.1, 2011.
Rossow, W. B. and Schiffer, R. A.: Advances in Understanding Clouds from ISCCP, B. Am. Meteorol. Soc., 80, 2261–2288, https://doi.org/10.1175/1520-0477(1999)080<2261:Aiucfi>2.0.Co;2, 1999.
Rossow, W. B., Walker, A., Golea, V., Knapp, K. R., Young, A., Inamdar A., Hankins, B., and NOAA's Climate Data Record Program: International Satellite Cloud Climatology Project Climate Data Record, H-Series [HGH] NOAA National Centers for Environmental Information [data set], https://doi.org/10.7289/V5QZ281S, 2016.
Rossow, W. B., Knapp, K. R., and Young, A. H.: International Satellite Cloud Climatology Project: Extending the Record, J. Climate, 35, 141–158, https://doi.org/10.1175/jcli-d-21-0157.1, 2021.
Sassen, K. and Cho, B. S.: Subvisual-Thin Cirrus Lidar Dataset for Satellite Verification and Climatological Research, J. Appl. Meteorol. Clim., 31, 1275–1285, https://doi.org/10.1175/1520-0450(1992)031<1275:Stcldf>2.0.Co;2, 1992.
Sassen, K., Starr, D. O. C., and Uttal, T.: Mesoscale and Microscale Structure of Cirrus Clouds: Three Case Studies, J. Atmos. Sci., 46, 371–396, https://doi.org/10.1175/1520-0469(1989)046<0371:Mamsoc>2.0.Co;2, 1989.
Sassen, K., Wang, Z., and Liu, D.: Cirrus clouds and deep convection in the tropics: Insights from CALIPSO and CloudSat, J. Geophys. Res.-Atmos., 114, D00H06, https://doi.org/10.1029/2009JD011916, 2009.
Shang, H., Letu, H., Nakajima, T. Y., Wang, Z., Ma, R., Wang, T., Lei, Y., Ji, D., Li, S., and Shi, J.: Diurnal cycle and seasonal variation of cloud cover over the Tibetan Plateau as determined from Himawari-8 new-generation geostationary satellite data, Sci. Rep., 8, 1105, https://doi.org/10.1038/s41598-018-19431-w, 2018.
Song, X., Zhai, X., Liu, L., and Wu, S.: Lidar and Ceilometer Observations and Comparisons of Atmospheric Cloud Structure at Nagqu of Tibetan Plateau in 2014 Summer, Atmosphere, 8, 9, https://doi.org/10.3390/atmos8010009, 2017.
Stanfield, R. E., Dong, X., Xi, B., Del Genio, A. D., Minnis, P., Doelling, D., and Loeb, N.: Assessment of NASA GISS CMIP5 and Post-CMIP5 Simulated Clouds and TOA Radiation Budgets Using Satellite Observations. Part II: TOA Radiation Budget and CREs, J. Climate, 28, 1842, https://doi.org/10.1175/jcli-d-14-00249.1, 2015.
Sun, N., Fu, Y., Zhong, L., Zhao, C., and Li, R.: The Impact of Convective Overshooting on the Thermal Structure over the Tibetan Plateau in Summer Based on TRMM, COSMIC, Radiosonde, and Reanalysis Data, J. Climate, 34, 8047–8063, https://doi.org/10.1175/jcli-d-20-0849.1, 2021.
Sun, W., Lin, B., Hu, Y., Lukashin, C., Kato, S., and Liu, Z.: On the consistency of CERES longwave flux and AIRS temperature and humidity profiles, J. Geophys. Res.-Atmos., 116, D17101, https://doi.org/10.1029/2011JD016153, 2011a.
Sun, W., Videen, G., Kato, S., Lin, B., Lukashin, C., and Hu, Y.: A study of subvisual clouds and their radiation effect with a synergy of CERES, MODIS, CALIPSO, and AIRS data, J. Geophys. Res.-Atmos., 116, D22207, https://doi.org/10.1029/2011JD016422, 2011b.
Sun, W., Videen, G., and Mishchenko, M. I.: Detecting super-thin clouds with polarized sunlight, Geophys. Res. Lett., 41, 688–693, https://doi.org/10.1002/2013GL058840, 2014.
Sun, W., Baize, R. R., Videen, G., Hu, Y., and Fu, Q.: A method to retrieve super-thin cloud optical depth over ocean background with polarized sunlight, Atmos. Chem. Phys., 15, 11909–11918, https://doi.org/10.5194/acp-15-11909-2015, 2015.
Taylor, K. E.: Summarizing multiple aspects of model performance in a single diagram, J. Geophys. Res.-Atmos., 106, 7183–7192, https://doi.org/10.1029/2000JD900719, 2001.
Tian, B., Soden, B. J., and Wu, X.: Diurnal cycle of convection, clouds, and water vapor in the tropical upper troposphere: Satellites versus a general circulation model, J. Geophys. Res.-Atmos., 109, D10101, https://doi.org/10.1029/2003JD004117, 2004.
Tian, B., Held, I. M., Lau, N.-C., and Soden, B. J.: Diurnal cycle of summertime deep convection over North America: A satellite perspective, J. Geophys. Res.-Atmos., 110, D08108, https://doi.org/10.1029/2004JD005275, 2005.
Tian, H., Xu, X., Chen, H., Huang, R., Zhang, S., and Luo, J.: Analysis of the Anomalous Signals near the Tropopause before the Overshooting Convective System Onset over the Tibetan Plateau, Adv. Meteorol., 2020, 8823446, https://doi.org/10.1155/2020/8823446, 2020.
Tian, W., Tian, H., Dhomse, S., and Feng, W.: A study of upper troposphere and lower stratosphere water vapor above the Tibetan Plateau using AIRS and MLS data, Atmos. Sci. Lett., 12, 233–239, https://doi.org/10.1002/asl.319, 2011.
Tiedtke, M.: Representation of Clouds in Large-Scale Models, Mon. Weather Rev., 121, 3040–3061, https://doi.org/10.1175/1520-0493(1993)121<3040:Rocils>2.0.Co;2, 1993.
Tselioudis, G., Rossow, W. B., Jakob, C., Remillard, J., Tropf, D., and Zhang, Y.: Evaluation of Clouds, Radiation, and Precipitation in CMIP6 Models Using Global Weather States Derived from ISCCP-H Cloud Property Data, J. Climate, 34, 7311–7324, https://doi.org/10.1175/jcli-d-21-0076.1, 2021.
Tzallas, V., Hatzianastassiou, N., Benas, N., Meirink, J. F., Matsoukas, C., Stackhouse, P., and Vardavas, I.: Evaluation of CLARA-A2 and ISCCP-H Cloud Cover Climate Data Records over Europe with ECA&D Ground-Based Measurements, Remote Sens., 11, 212, https://doi.org/10.3390/rs11020212, 2019.
Urraca, R., Huld, T., Gracia-Amillo, A., Martinez-de-Pison, F. J., Kaspar, F., and Sanz-Garcia, A.: Evaluation of global horizontal irradiance estimates from ERA5 and COSMO-REA6 reanalyses using ground and satellite-based data, Sol. Energy, 164, 339–354, https://doi.org/10.1016/j.solener.2018.02.059, 2018.
Vignesh, P. P., Jiang, J. H., Kishore, P., Su, H., Smay, T., Brighton, N., and Velicogna, I.: Assessment of CMIP6 Cloud Fraction and Comparison with Satellite Observations, Earth Space Sci., 7, e2019EA000975, https://doi.org/10.1029/2019EA000975, 2020.
Virts, K. S., Wallace, J. M., Fu, Q., and Ackerman, T. P.: Tropical Tropopause Transition Layer Cirrus as Represented by CALIPSO Lidar Observations, J. Atmos. Sci., 67, 3113–3129, https://doi.org/10.1175/2010jas3412.1, 2010.
Wallace, J. M.: Diurnal Variations in Precipitation and Thunderstorm Frequency over the Conterminous United States, Mon. Weather Rev., 103, 5, 406–419, https://doi.org/10.1175/1520-0493(1975)103<0406:DVIPAT>2.0.CO;2, 1975
Wang, B., Bao, Q., Hoskins, B., Wu, G., and Liu, Y.: Tibetan Plateau warming and precipitation changes in East Asia, Geophys. Res. Lett., 35, L14702, https://doi.org/10.1029/2008GL034330, 2008.
Wang, J. and Rossow, W. B.: Determination of Cloud Vertical Structure from Upper-Air Observations, J. Appl. Meteorol. Clim., 34, 2243–2258, https://doi.org/10.1175/1520-0450(1995)034<2243:Docvsf>2.0.Co;2, 1995.
Wang, J., Rossow, W. B., and Zhang, Y.: Cloud Vertical Structure and Its Variations from a 20-Yr Global Rawinsonde Dataset, J. Climate, 13, 3041–3056, https://doi.org/10.1175/1520-0442(2000)013<3041:Cvsaiv>2.0.Co;2, 2000.
Wang, J., Jian, B., Wang, G., Zhao, Y., Li, Y., Letu, H., Zhang, M., and Li, J.: Climatology of Cloud Phase, Cloud Radiative Effects and Precipitation Properties over the Tibetan Plateau, Remote Sens., 13, 363, https://doi.org/10.3390/rs13030363, 2021.
Wang, Y., Zeng, X., Xu, X., Welty, J., Lenschow, D. H., Zhou, M., and Zhao, Y.: Why Are There More Summer Afternoon Low Clouds Over the Tibetan Plateau Compared to Eastern China?, Geophys. Res. Lett., 47, e2020GL089665, https://doi.org/10.1029/2020GL089665, 2020.
Wang, Y., Li, J., Zhao, Y., Li, Y., Zhao, Y., and Wu, X.: Distinct Diurnal Cycle of Supercooled Water Cloud Fraction Dominated by Dust Extinction Coefficient, Geophys. Res. Lett., 49, e2021GL097006, https://doi.org/10.1029/2021GL097006, 2022.
WCRP: CMIP6, World Climate Research Programme [data set], https://esgf-node.llnl.gov/search/cmip6/, last access: 12 July 2022.
Wu, G., Liu, Y., He, B., Bao, Q., Duan, A., and Jin, F.: Thermal Controls on the Asian Summer Monsoon, Sci. Rep., 2, 404, https://doi.org/10.1038/srep00404, 2012.
Wu, G., He, B., Duan, A., Liu, Y., and Yu, W.: Formation and variation of the atmospheric heat source over the Tibetan Plateau and its climate effects, Adv. Atmos. Sci., 34, 1169–1184, https://doi.org/10.1007/s00376-017-7014-5, 2017.
Wu, W., Purser, R. J., and Parrish, D. F.: Three-dimensional variational analysis with spatially inhomogeneous covariances, Mon. Weather Rev., 130, 2905–2916, https://doi.org/10.1175/1520-0493(2002)130<2905:Tdvaws>2.0.Co;2, 2002.
Xu, X., Lu, C., Shi, X., and Gao, S.: World water tower: An atmospheric perspective, Geophys. Res. Lett., 35, L20815, https://doi.org/10.1029/2008GL035867, 2008.
Xu, X., Shi, X., and Lu, C.: Theory and Application for Warning and Prediction of Disastrous Weather Downstream from the Tibetan Plateau, Novinka Science Publishers, Inc. New York, 2012.
Yan, Y., Liu, Y., and Lu, J.: Cloud vertical structure, precipitation, and cloud radiative effects over Tibetan Plateau and its neighboring regions, J. Geophys. Res.-Atmos., 121, 5864–5877, https://doi.org/10.1002/2015JD024591, 2016.
Yang, G. and Slingo, J.: The Diurnal Cycle in the Tropics, Mon. Weather Rev., 129, 4, 784–801, https://doi.org/10.1175/1520-0493(2001)129<0784:TDCITT>2.0.CO;2, 2001.
Yang, J., Hu, X., Lei, H., Duan, Y., Lv, F., and Zhao, L.: Airborne Observations of Microphysical Characteristics of Stratiform Cloud Over Eastern Side of Taihang Mountains, Chinese J. Atmos. Sci., 45, 88, https://doi.org/10.3878/j.issn.1006-9895.2004.19202, 2021.
Yang, K., Ding, B., Qin, J., Tang, W., Lu, N., and Lin, C.: Can aerosol loading explain the solar dimming over the Tibetan Plateau, Geophys. Res. Lett., 39, L20710, https://doi.org/10.1029/2012GL053733, 2012.
Yao, T., Pu, J., Lu, A., Wang, Y., and Yu, W.: Recent Glacial Retreat and Its Impact on Hydrological Processes on the Tibetan Plateau, China, and Surrounding Regions, Arct. Antarct. Alp. Res., 39, 642–650, https://doi.org/10.1657/1523-0430(07-510)[YAO]2.0.CO;2, 2007.
Yao, T., Thompson, L., Yang, W., Yu, W., Gao, Y., Guo, X., Yang, X., Duan, K., Zhao, H., Xu, B., Pu, J., Lu, A., Xiang, Y., Kattel, D. B., and Joswiak, D.: Different glacier status with atmospheric circulations in Tibetan Plateau and surroundings, Nat. Clim. Chang., 2, 663–667, https://doi.org/10.1038/NCLIMATE1580, 2012.
Yao, T., Masson-Delmotte, V., Gao, J., Yu, W., Yang, X., Risi, C., Sturm, C., Werner, M., Zhao, H., and He, Y.: A review of climatic controls on δ18O in precipitation over the Tibetan Plateau: Observations and simulations, Rev. Geophys., 51, 525–548, 2013.
Yeo, H., Kim, M.-H., Son, S.-W., Jeong, J.-H., Yoon, J.-H., Kim, B.-M., and Kim, S.-W.: Arctic cloud properties and associated radiative effects in the three newer reanalysis datasets (ERA5, MERRA-2, JRA-55): Discrepancies and possible causes, Atmos. Res., 270, 106080, https://doi.org/10.1016/j.atmosres.2022.106080, 2022.
Yin, J. and Porporato, A.: Diurnal cloud cycle biases in climate models, Nat. Commun., 8, 2269, https://doi.org/10.1038/s41467-017-02369-4, 2017.
Yin, J. and Porporato, A.: Radiative effects of daily cycle of cloud frequency in past and future climates, Clim. Dynam., 54, 1625–1637, https://doi.org/10.1007/s00382-019-05077-5, 2020.
Yin, J., Wang, D., Xu, H., and Zhai, G.: An investigation into the three-dimensional cloud structure over East Asia from the CALIPSO-GOCCP Data, Sci. China-Earth Sci., 58, 2236–2248, https://doi.org/10.1007/s11430-015-5205-4, 2015.
Yorks, J. E., McGill, M. J., Palm, S. P., Hlavka, D. L., Selmer, P. A., Nowottnick, E. P., Vaughan, M. A., Rodier, S. D., and Hart, W. D.: An overview of the CATS level 1 processing algorithms and data products, Geophys. Res. Lett., 43, 4632–4639, https://doi.org/10.1002/2016GL068006, 2016.
Yorks, J. E., Selmer, P. A., Kupchock, A., Nowottnick, E. P., Christian, K. E., Rusinek, D., Dacic, N., and McGill, M. J.: Aerosol and Cloud Detection Using Machine Learning Algorithms and Space-Based Lidar Data, Atmosphere, 12, 606, https://doi.org/10.3390/atmos12050606, 2021.
You, Q., Jiao, Y., Lin, H., Min, J., Kang, S., Ren, G., and Meng, X.: Comparison of NCEP/NCAR and ERA-40 total cloud cover with surface observations over the Tibetan Plateau, Int. J. Climatol., 34, 2529–2537, https://doi.org/10.1002/joc.3852, 2014.
Young, A. H., Knapp, K. R., Inamdar, A., Hankins, W., and Rossow, W. B.: The International Satellite Cloud Climatology Project H-Series climate data record product, Earth Syst. Sci. Data, 10, 583–593, https://doi.org/10.5194/essd-10-583-2018, 2018.
Yu, Y., Kalashnikova, O. V., Garay, M. J., Lee, H., Choi, M., Okin, G. S., Yorks, J. E., Campbell, J. R., and Marquis, J.: A global analysis of diurnal variability in dust and dust mixture using CATS observations, Atmos. Chem. Phys., 21, 1427–1447, https://doi.org/10.5194/acp-21-1427-2021, 2021.
Zhang, F., Yu, Q.-R., Mao, J.-L., Dan, C., Wang, Y., He, Q., Cheng, T., Chen, C., Liu, D., and Gao, Y.: Possible mechanisms of summer cirrus clouds over the Tibetan Plateau, Atmos. Chem. Phys., 20, 11799–11808, https://doi.org/10.5194/acp-20-11799-2020, 2020a.
Zhang, G., Chen, W., and Xie, H.: Tibetan Plateau's Lake Level and Volume Changes from NASA's ICESat/ICESat-2 and Landsat Missions, Geophys. Res. Lett., 46, 13107–13118, https://doi.org/10.1029/2019GL085032, 2019.
Zhang, L., Lau, W., Tao, W., and Li, Z.: Large Wildfires in the Western United States Exacerbated by Tropospheric Drying Linked to a Multi-Decadal Trend in the Expansion of the Hadley Circulation, Geophys. Res. Lett., 47, e2020GL087911, https://doi.org/10.1029/2020GL087911, 2020b.
Zhao, W., Marchand, R., and Fu, Q.: The diurnal cycle of clouds and precipitation at the ARM SGP site: Cloud radar observations and simulations from the multiscale modeling framework, J. Geophys. Res.-Atmos., 122, 7519–7536, https://doi.org/10.1002/2016JD026353, 2017.
Zhou, R., Wang, G., and Zhaxi, S.: Cloud vertical structure measurements from a ground-based cloud radar over the southeastern Tibetan Plateau, Atmos. Res., 258, 105629, https://doi.org/10.1016/j.atmosres.2021.105629, 2021.
Zhou, T. J. and Zhang, W. X.: Anthropogenic warming of Tibetan Plateau and constrained future projection, Environ. Res. Lett., 16, 4, https://doi.org/10.1088/1748-9326/abede8, 2021.
Zou, L., Griessbach, S., Hoffmann, L., Gong, B., and Wang, L.: Revisiting global satellite observations of stratospheric cirrus clouds, Atmos. Chem. Phys., 20, 9939–9959, https://doi.org/10.5194/acp-20-9939-2020, 2020.
Zou, L., Hoffmann, L., Griessbach, S., Spang, R., and Wang, L.: Empirical evidence for deep convection being a major source of stratospheric ice clouds over North America, Atmos. Chem. Phys., 21, 10457–10475, https://doi.org/10.5194/acp-21-10457-2021, 2021.
- Abstract
- Introduction
- Data and methods
- Results
- Conclusions and discussion
- Appendix A: The comparison of cloud spatial distribution between different datasets and CATS every 3 h
- Data availability
- Author contributions
- Competing interests
- Disclaimer
- Acknowledgements
- Financial support
- Review statement
- References
- Supplement