the Creative Commons Attribution 4.0 License.
the Creative Commons Attribution 4.0 License.
 | 05 Jul 2023
Western European emission estimates of CFC-11, CFC-12 and CCl4 derived from atmospheric measurements from 2008 to 2021
Alison L. Redington
Alistair J. Manning
Stephan Henne
Francesco Graziosi
Luke M. Western
Jgor Arduini
Anita L. Ganesan
Christina M. Harth
Michela Maione
Jens Mühle
Simon O'Doherty
Joseph Pitt
Stefan Reimann
Matthew Rigby
Peter K. Salameh
Peter G. Simmonds
T. Gerard Spain
Kieran Stanley
Martin K. Vollmer
Ray F. Weiss
Dickon Young
Production and consumption of CFC-11 (trichlorofluoromethane, CCl3F), CFC-12 (dichlorodifluoromethane, CCl2F2) and CCl4 (carbon tetrachloride) are controlled under the regulations of the Montreal Protocol and have been phased out globally since 2010. Only CCl4 is still widely produced as a chemical feedstock. After 2010, emissions of CFC-11 and CFC-12 should therefore mostly originate from existing banks (e.g. from foams, mobile air conditioning units and refrigerators); however evidence has emerged of an increase in global emissions of CFC-11 in the last decade, some of which has not been fully accounted for. The motivation for this work was to assess the emissions of CFC-11, CFC-12 and CCl4 from western Europe. All countries in this region have been subject to the controls of the Montreal Protocol since the late 1980s and, as non-Article 5 Parties, have been prohibited from producing CFCs and CCl4 for dispersive use since 1996. Four different inverse modelling systems are used to estimate emissions of these gases from 2008 to 2021 using data from four atmospheric measurement stations: Mace Head (Ireland), Jungfraujoch (Switzerland), Monte Cimone (Italy) and Tacolneston (UK). The average of the four model studies found that western European emissions of CFC-11, CFC-12 and CCl4 between 2008 and 2021 were declining at 3.5 % yr−1 (2.7 % yr−1–4.8 % yr−1), 7.7 % yr−1 (6.3 % yr−1–8.0 % yr−1) and 4.4 % yr−1 (2.6 % yr−1–6.4 % yr−1), respectively. Even though the emissions were declining throughout the period, the area including northern France, Belgium, the Netherlands and Luxembourg showed consistently elevated emissions of CFC-11 compared with the surrounding regions. Emissions of CFC-12 were slightly elevated in the same region. CCl4 emissions were the highest in the south of France. France had the highest emissions of all three gases over the period 2008–2021. Emissions from western Europe (2008–2021) were on average 2.4 ± 0.4 Gg (CFC-11), 1.3 ± 0.3 Gg (CFC-12) and 0.9 ± 0.2 Gg (CCl4). Our estimated decline in emissions of CFC-11 is consistent with a western European bank release rate of 3.4 % (2.6 %–4.5 %). This study concludes that emissions of CFC-11, CFC-12 and CCl4 have all declined from 2008 to 2021 in western Europe. Therefore, no evidence is found that western European emissions contributed to the unexplained part of the global increase in atmospheric concentrations of CFC-11 observed in the last decade.
- Article
(2388 KB) - Full-text XML
-
Supplement
(3870 KB) - BibTeX
- EndNote


The works published in this journal are distributed under the Creative Commons Attribution 4.0 License. This license does not affect the Crown copyright work, which is re-usable under the Open Government Licence (OGL). The Creative Commons Attribution 4.0 License and the OGL are interoperable and do not conflict with, reduce or limit each other.
© Crown copyright 2023
Trichlorofluoromethane (CFC-11 or CFCl3), dichlorodifluoromethane (CFC-12 or CF2Cl2) and carbon tetrachloride (CCl4) are damaging to the stratospheric ozone layer (Karpechko et al., 2018) and are strong greenhouse gases (IPCC, 2021). Their production and consumption are controlled through the Montreal Protocol on Substances that Deplete the Ozone Layer (MP) and its amendments. For non-Article 5 Parties, including all of the countries in western Europe, the production and consumption of CFC-11 and CFC-12 have been banned since 1996; however Europe phased them out a year early, by 1995. For developing countries (Article 5 Parties), production and consumption of CFC-11 and CFC-12 have been banned since 2010.
CFC-11 was mainly used in aerosol spray cans and as a solvent and an agent for blowing foams into buildings and consumer products; CFC-12 was mainly used in refrigerators, mobile air conditioning units and as a foam-blowing agent. CCl4 was used historically as a solvent and also as a feedstock to produce other chemicals, predominantly CFC-11 and CFC-12. Production and consumption of CCl4 have also been banned under the MP since 1996 for developed countries and since 2010 for developing countries (i.e. Article 5 Parties), with the exception of its use as a chemical feedstock.
Globally, emissions of CFC-11 and CFC-12 have been decreasing as a result of the production and consumption controls imposed by the MP. The CFC that remains in products and equipment is described as a bank, which is characterised as active if the product is still in use or as inactive if the product has been decommissioned. Nearly all the active banks are comprised of foam panels and boardstock in buildings. Nearly all the remaining banks of foams used in refrigerating applications have been decommissioned and either landfilled or destroyed. The European Union requires ozone-depleting blowing agents to be captured and destroyed under the EU Directive 2002/96/EC (EU, 2003). The TEAP (2019) analysis suggests that globally there were an estimated 750 ± 50 Gg of CFC-11 in active foam banks and 700 ± 50 Gg in inactive banks in 2021, though work by Lickley et al. (2020) suggests that they could be substantially larger. The majority of the global CFC-11 bank is in North America and Europe.
Emissions of CCl4 have also been decreasing globally since the 1990s as a result of the MP; however there is a gap between expected emissions and those calculated by inverse modelling techniques and atmospheric measurements, as highlighted in Carpenter et al. (2014) and Liang et al. (2014). The global rate of decrease in the mole fraction of CFC-11 had slowed from 2013 onward (Montzka et al., 2018), and the most likely cause was an increase in emissions of CFC-11 from eastern Asia. This finding was supported by Rigby et al. (2019), who identified emissions in eastern China (7.0 ± 3.0 Gg yr−1 2014–2017) that explained 40 %–60 % of the increased global emissions. In 2019, CFC-11 emissions from eastern China rapidly declined, and they are now similar to before this period of renewed production and use (Park et al., 2021; Montzka et al., 2021). CFC-12 and CCl4 emissions are often associated with production of CFC-11, and emission levels were shown to be higher than expected in eastern China after 2013. They subsequently decreased just before the reduction in CFC-11 (Park et al., 2021). Lunt et al. (2018) reported a lack of decline in CCl4 emissions during the period 2009–2016 in eastern China, also suggesting globally significant CCl4 sources in this region.
Hu et al. (2022) used observational data from two global aircraft surveys to assess the continental-scale contributions to global CFC-11 emissions from 2012 to 2017 to try to understand the additional increase in global CFC-11 not accounted for by the increased emissions found in eastern China (Rigby et al., 2019). They speculated that in addition to eastern mainland China's contribution, emissions likely came from temperate western Asia and tropical Asia.
Fraser et al. (2020) present a comprehensive review of CFC emissions in Australia from 1960 to 2017, where they conclude that Australian emissions since the early 1990s have been declining at the same rate as global emissions – around 10 % yr−1. They found no evidence of renewed emission or consumption of CFCs in Australia. CCl4 emissions in Australia were assessed by Fraser et al. (2014) from 1996 to 2011, where they identified potential local emission sources associated with contaminated soils, toxic waste treatment facilities and chlor-alkali plants. They concluded that currently unaccounted-for emissions in other regions could arise from similar sources.
Hu et al. (2016) reported on continued emissions of CCl4 in the United States (2008–2012), which are nearly 2 orders of magnitude higher than those estimated by the US Environmental Protection Agency inventory for industrial chemical processes.
CFC-11, CFC-12 and CCl4 emissions from Europe have been reported in previous studies. Manning et al. (2003) estimated emissions of CFC-11 and CFC-12 from 1995–2002 for western Europe as 8.9 and 14.3 Gg yr−1, respectively. Keller et al. (2011) used measurements at Mace Head, Jungfraujoch and K-Puszta (Hungary) to estimate emissions of CFC-11 of 2.1 ± 0.4 Gg yr−1 in 2009 from north-western Europe (Ireland, the UK, France, Benelux, Germany and Denmark) and 4.2 ± 1.2 Gg yr−1 in the whole of Europe (excluding Norway, Sweden, Finland and Russia). In the same study, CFC-12 emissions of 1.0 ± 0.4 Gg yr−1 in north-western Europe and 2.2 ± 1.1 Gg yr−1 in the whole of Europe were estimated. Graziosi et al. (2016) reported on European CCl4 emissions over the period 2006 to 2014. They found that France was the main source of emissions. On average European emissions contributed 4.0 % of global emissions for 2006–2012.
Here we use four inverse modelling systems, employing two atmospheric transport models with different meteorological inputs and different inversion approaches to assess CFC-11, CFC-12 and CCl4 emissions from western Europe from 1990 to 2021 and their rates of decline. The modelled domain we define as western Europe comprises Ireland, the UK, France, Belgium, the Netherlands, Luxembourg, Germany, Italy, Switzerland, Austria and Denmark. Use of western Europe throughout this paper refers to our modelled domain. We present spatial distributions of the emission estimates, averaged in time and over the four model systems.
Section 2 describes the atmospheric measurements and inverse frameworks used, Sect. 3 presents the emission estimates and their discussion, and finally concluding remarks are made in Sect. 4.
2.1 Atmospheric measurements
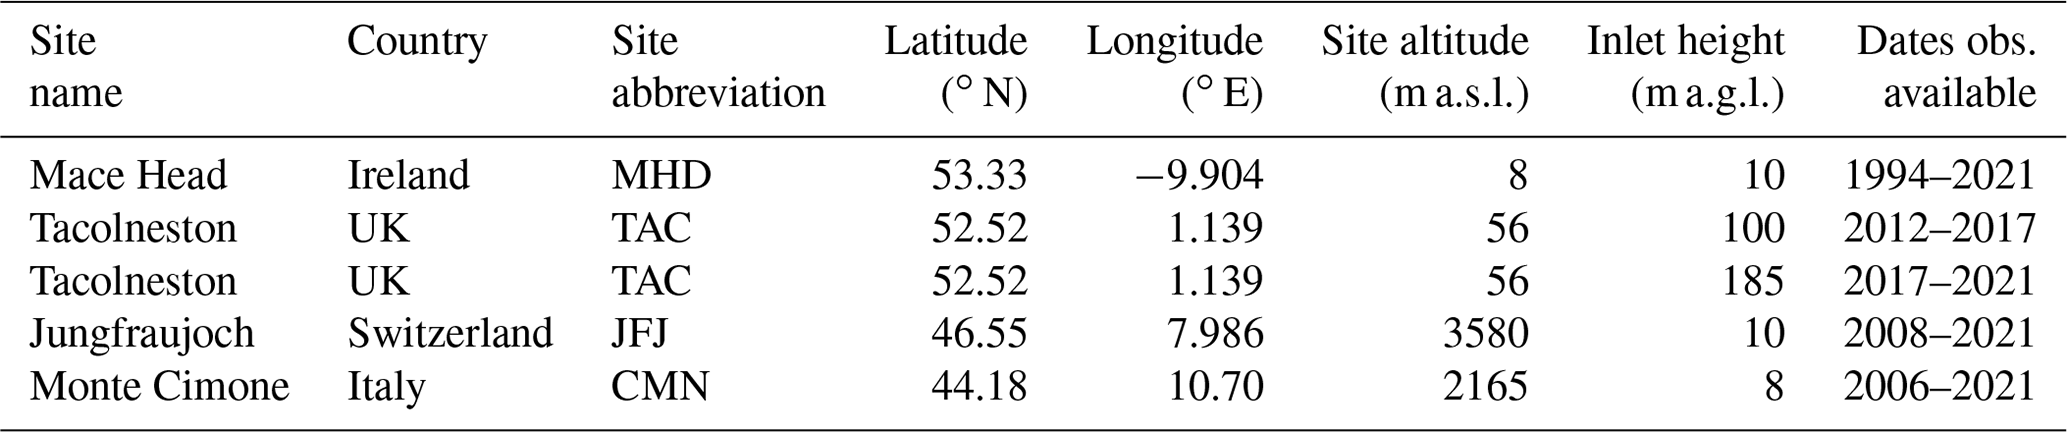
We use the in situ high-frequency observations from four atmospheric monitoring stations which are part of the Advanced Global Atmospheric Gases Experiment (AGAGE) network (Prinn et al., 2018): Mace Head (MHD) on the west coast of Ireland, Jungfraujoch (JFJ) in the Swiss Alps, Monte Cimone (CMN) in the northern Apennine Mountains in Italy and Tacolneston (TAC) in the south-east of the UK (see Table 1). TAC and MHD are also a part of the UK DECC (Deriving Emissions related to Climate Change) network (Stanley et al., 2018). Data from all four stations are routinely inter-compared to ensure good data quality.
Table 1Observation site information. Note the site altitude is given in metres above sea level (m a.s.l.) and inlet height as metres above ground (m a.g.l.).
The measurements at TAC and JFJ were made using Medusa gas chromatograph (GC) mass spectrometer (MS) instruments (Miller et al., 2008). Typically, 2 L samples of ambient air are pre-concentrated on a cold trap, then cryo-distilled and cryo-focussed on a second cold trap held at ∼ −160 ∘C, where the main constituents in air (oxygen, nitrogen, noble gases, carbon dioxide and water) are removed. The sample is then transferred to the GC with subsequent quadrupole MS detection. A sample run typically takes 1 h, and air sample measurements are bracketed by calibration standard measurements to correct for MS drift and to quantify the trace gases in the air samples; thus 2-hourly atmospheric observations are available from these systems. Typical measurement precisions for CFC-11, CFC-12 and CCl4 from these instruments are ∼ 0.22 % (1 SD), ∼ 0.14 % and ∼ 1.11 %, respectively.
The measurements at MHD from 1994 onwards were made with a GC multiple detector (MD) (Simmonds et al., 1995) system. These measurements are made every 20 min and using bracketing standard measurements result in an ambient air sample observation every 40 min. Precision for these measurements (∼ 0.10 %, ∼ 0.08 % and ∼ 0.32 % for CFC-11, CFC-12 and CCl4, respectively) is generally better than that achieved using the Medusa GC–MS system.
Measurements at CMN started in February 2006. The system consists of a commercial thermal desorption–GC–MS system (Markes International Unity2-AirServer2) coupled with a GC–MS (Agilent GC 6850 MS5975C) (Maione et al., 2013) to enrich halocarbons on the adsorbing trap; ambient air samples are collected every second hour and bracketed with working standard runs following the AGAGE–Medusa protocol. The measurement precisions are ∼ 0.40 %, ∼ 0.31 % and ∼ 0.47 % for CFC-11, CFC-12 and CCl4, respectively.
All measurements are based on the Scripps Institution of Oceanography (SIO) primary calibration scales SIO-05. The accuracies of these calibration scales are estimated at 2 %. The calibration scales are propagated to the field instruments using travelling tertiary whole-air standards exchanged between SIO and the field sites (for CMN, calibrated standards are exchanged with MHD). Tertiary standards are used on site for the calibration of quaternary whole-air standards, which are used to bracket the air measurements. This propagation of standards adds a statistically independent uncertainty of 1 %–2 % to the measurements. Overall, the accuracy of the air measurements is ∼ 3 % and includes calibration scale, propagation and reproducibility of the air measurements. For more details see, for example, Vollmer et al. (2016).
2.2 Inversion frameworks
Four different atmospheric inverse modelling systems were employed to estimate emissions of CFC-11, CFC-12 and CCl4 from western Europe. Each system consists of an atmospheric transport model (ATM) and a Bayesian optimisation framework that infers emissions into the atmosphere from the mole fractions observed at the measurement sites. All of the systems have been applied in previous studies and are briefly described here.
Table 2The inversion systems: ATMs, meteorology, geographical domains over which the ATMs are run, number of particles released per hour and the inversion time steps.
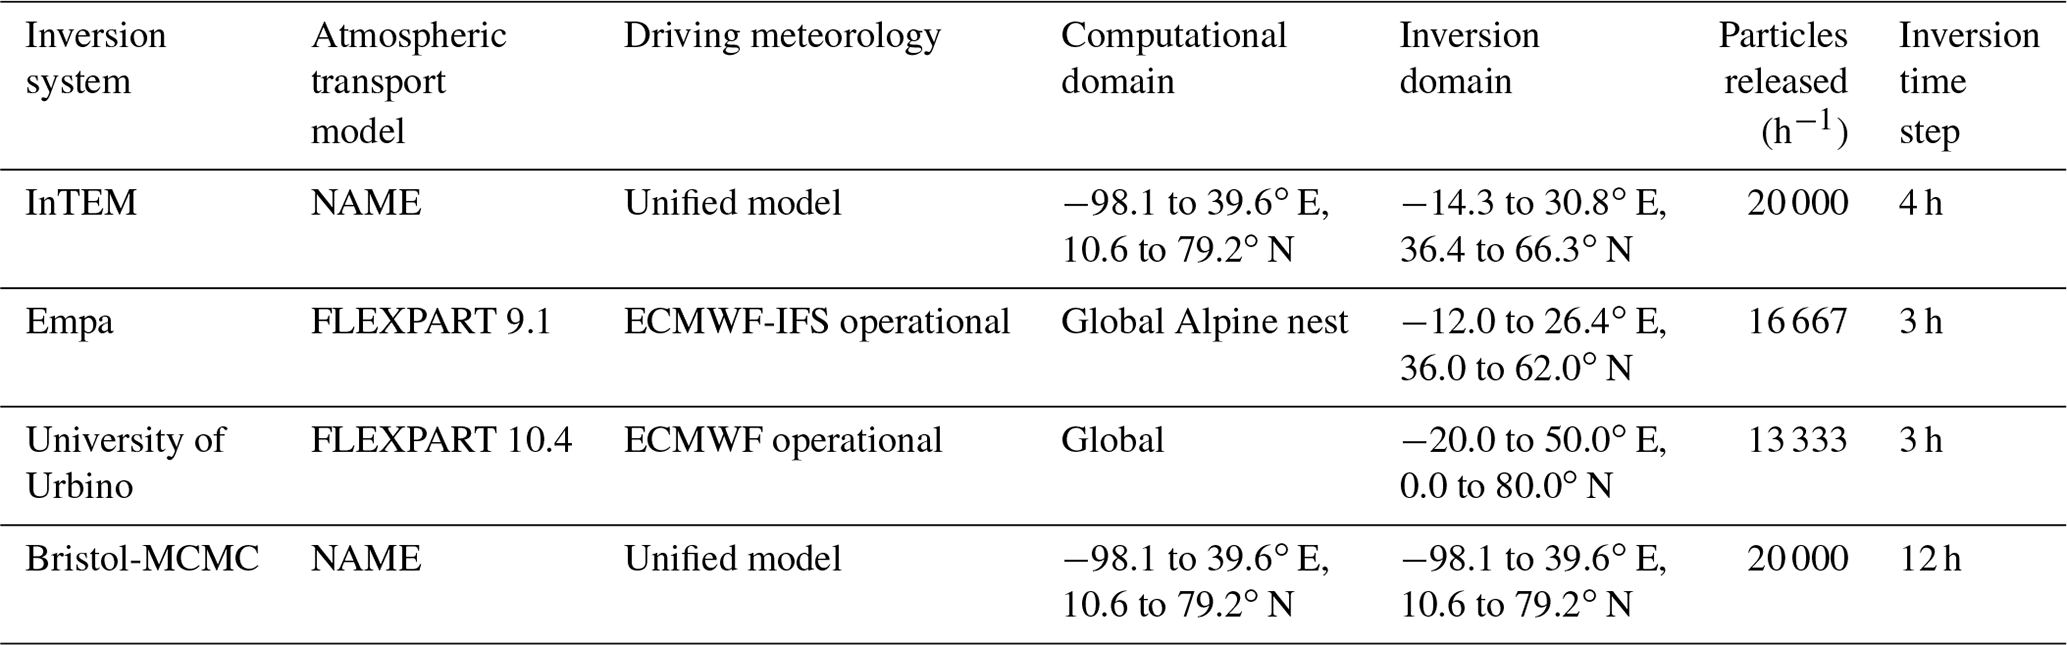
Both of the ATMs used are Lagrangian particle dispersion models (LPDMs) that use three-dimensional modelled meteorology from operational meteorological centres. They were both run backward in time, releasing model particles at the location of the atmospheric observations and thereby calculating source receptor relationships (SRRs; also referred to as source sensitivities), which are required for the inverse estimate of emissions (Seibert and Frank, 2004). The SRRs represent the quantitative link between an emission source at any location in the model domain and the change in mole fraction at a measurement site. As the main sources are expected to be close to the ground, we evaluate the SRRs from near to the ground (for example 0–40 m a.g.l. in NAME) to the sampling location and height. An overview of the ATMs and the release settings used is given in the following sections and Table 2. Two common a priori emission fields were used by each model to test the sensitivity of the inverse results; the first, “flat” uniform emissions across the land area of Europe, and the second, population-weighted emissions over land areas. CFC-11 and CFC-12 were 3.0 kg km−2 yr−1 for the flat land a priori emissions, which resulted in 6.6 kt yr−1 over western Europe. CCl4 was emitted at 1.2 kg km−2 yr−1 for the flat land a priori emissions, which gave 2.6 kt yr−1 over western Europe. The population-weighted a priori emissions used the same totals for western Europe. A common set of quality-controlled observational data (Sect. 2.1), including instrument precision, was compiled from the AGAGE database and shared among all modelling groups. From these observations each modelling team estimated background mole fractions following their method of choice; this enables the calculation of enhancements above the baseline. Individual groups used different temporal aggregations of the observational data to best fit their modelling frameworks.
2.2.1 InTEM
The Inverse Technique for Emission Modelling (InTEM; Arnold et al., 2018; Manning et al., 2021) is used by the UK government to verify its nationally reported greenhouse gas emissions. InTEM uses the Numerical Atmospheric-dispersion Modelling Environment (NAME; Jones et al., 2007) LPDM, which has been used for many similar studies (Manning et al., 2011; Say et al., 2016; Lunt et al., 2018; Fraser et al., 2020; Say et al., 2021; Ganesan et al., 2020; Rigby et al., 2019; Park et al., 2021). NAME is driven by three-dimensional meteorology; the horizontal and vertical resolution of the meteorology has increased over the modelled period (see Manning et al., 2021). The NAME model simulates atmospheric dispersion by the release of thousands of particles into the modelled atmosphere, here, 20 000 particles h−1 from each station (at heights of 10 m a.g.l. for MHD, 100 and 185 m a.g.l. for TAC, 1000 m a.g.l. for JFJ, and 500 m a.g.l. for CMN), and follows the particles backwards in time for 30 d or until they leave the computational domain. InTEM is a Bayesian system that minimises the mismatch between the model and the atmospheric observations given the constraints imposed by the observation and model uncertainties and prior information with its associated uncertainties. The three-dimensional varying background mole fraction and observation station bias are solved-for within the inverse system along with the spatial distribution and magnitude of the emissions. A time-varying prior background mole fraction is derived from the MHD, JFJ and CMN observations as described in Manning et al. (2021). TAC uses the same prior background mole fraction as used at MHD. The prior bias for each station is set to 0 with an uncertainty of 1.2 ppt for CFC-11 and CFC-12 and 0.43 ppt for CCl4 (see Manning et al., 2021). The InTEM inversions used a prior uncertainty of 500 % over western Europe. The observations are averaged into 4 h periods. The uncertainty in the observations is derived from the reported daily observation precision uncertainty and the variability in the observations within a 12 h period. The modelling uncertainty for each 4 h period is the larger of the median pollution (above baseline) events in that year or 10 % of the magnitude of the pollution event.
2.2.2 Empa
The Empa (Swiss Federal Laboratories for Materials Science and Technology) Bayesian inverse modelling framework (Henne et al., 2016) has been used, for example, to estimate methane emissions in Switzerland and halocarbon emissions in Europe (e.g. Brunner et al., 2017; Schoenenberger et al., 2018; Simmonds et al., 2020) and eastern Asia (Rigby et al., 2019; Park et al., 2021).
The system uses source sensitivities as calculated by the LPDM FLEXPART (version 9.1_Empa; Stohl et al., 2005; Pisso et al., 2019; http://www.flexpart.eu, last access: 30 June 2023), driven by operational meteorological analysis fields provided by the ECMWF-IFS model extracted at a global resolution of 1∘ × 1∘ and a higher-resolution nest (0.2∘ × 0.2∘) over the Alpine area. FLEXPART was run in backward mode, releasing 50 000 particles every 3 h at each receptor site and following these 10 d backward in time. For elevated sites, model particles were released at a suitable altitude above model ground that is between the model topography and real site altitude (Keller et al., 2011). Hence, 3000 and 2000 m above sea level were chosen for JFJ and CMN, respectively. SRRs were evaluated from the surface to 100 m above ground.
The Bayesian inversion was carried out to estimate annual mean emissions on an irregularly sized grid covering western Europe. Grid sizes were inversely proportional to SRRs, resulting in generally finer grid resolution close to the observational sites. The employed covariance matrices consider correlated uncertainties in space in the emission a priori and correlated uncertainties in time for the data mismatch. The inversion framework offers different options for choosing uncertainty parameters. Here, we chose a semi-objective approach, setting the total uncertainty of the prior emissions to 100 % for the whole inversion domain with a correlation length scale of 100 km and an iterative approach for estimating the data-mismatch uncertainty from the model-observation residuals assuming a linear relationship between data-mismatch uncertainty and simulated total source sensitivity (Henne et al., 2016). The temporal correlation coefficient of the data-mismatch covariance was estimated from an exponential fit to the auto-correlation function of the model residuals.
Baseline concentrations were estimated for each site using a statistical filter (REBS) on the observations (Ruckstuhl et al., 2012). For each site the baseline was incorporated as a linear interpolation between baseline nodes. Baseline concentrations at the nodes were part of the state vector and optimised along with the emissions. Baseline nodes were spaced 14 d apart. Baseline uncertainties were taken from the REBS filter and assumed to be correlated with a timescale of 30 d.
The appropriate selection of uncertainty parameters was tested by evaluating the reduced χ2 index of the covariance matrices. χ2 values were in the range of 0.85 to 1.15, 0.65 to 0.9 and 0.7 to 0.95 for CFC-11, CFC-12 and CCl4, respectively, indicating a balanced setup.
2.2.3 University of Urbino
The University of Urbino inversion system used here is very similar to that described in Stohl et al. (2009). The inversion system has already been applied to estimate CCl4 emissions and greenhouse gases in the European domain (Graziosi et al., 2016; Simmonds et al., 2020). Like the Empa system, the method is based on transport simulations using the FLEXPART (version 10.4; Pisso et al., 2019) LPDM. However, FLEXPART was run with a different configuration and different input data. Here, FLEXPART was used to simulate the dispersion of 40 000 particles released from each receptor (measurement) site, every 3 h, and followed the particles for 20 d backward in time, calculating source sensitivities from the ground to 100 m above ground. FLEXPART was driven by operational 3-hourly meteorological data from ECMWF at 1∘ × 1∘ latitude and longitude resolution, from 2008 to 2021.
The University of Urbino inversion system is based on the analytical inversion method of Seibert (2001), which was subsequently developed and evaluated by Stohl et al. (2009). In this implementation we use the same mole fraction background filtering method, optimised by the inversion scheme as described in this paper. With the purpose of reducing the number of unknowns in the inversion procedure, a variable-resolution grid is created, having a higher (lower) resolution over areas associated with high (low) sensitivity to the observation sites. Uncertainty in the inversion grid is set to 250 % of prior emission flux in each grid box, for both the flat and population priors. In general, larger uncertainty reduction is associated with areas with larger source sensitivity, and lower uncertainty reduction is associated with lower source sensitivities.
2.2.4 Bristol-MCMC
The Bristol-MCMC inverse system follows Say et al. (2020) and Western et al. (2021) with minor modifications. The sensitivities of the measurements to emissions were derived using NAME driven by meteorology from the Met Office Unified Model global product (Walters et al., 2014), not using the variable UK high-resolution (UKV) component as used in InTEM. The spatial resolution of the global product varied over the period of study (as detailed in Manning et al., 2021) and had a 3-hourly temporal resolution. The total model domain is detailed in Table 2, and sensitivities are output at a horizontal resolution of 0.234∘ (lat) by 0.352∘ (long) degrees.
Uncertainties in a priori emission estimates, the background (i.e. the mole fraction contribution outside the model domain) and model transport are estimated following Say et al. (2020). This uses a Markov chain Monte Carlo (MCMC) algorithm to estimate the joint-posterior distribution (Ganesan et al., 2014), where the reported values are the posterior mean and 68 % the highest posterior density region (see Western et al., 2021). Inference is carried out as a scaling of the a priori emissions and boundary mole fraction, where the latter was taken from the AGAGE 12-box model (Cunnold et al., 1983; Rigby et al., 2013, 2014; Montzka et al., 2021). The boundary mole fractions are inferred using a single value for each month at each model boundary, with an additional bias term (additive offset) between each site for each year to allow for small systematic differences in the modelling and measurements. This bias term is in reference to measurements at Mace Head. The likelihood error contains three components added together in quadrature. The first is the measurement error; second is a term equal to 10 % of the above-background mole fraction; and the third is an additional model error term, which is estimated during inference. The emissions are divided into 199 basis functions, chosen using a quadtree algorithm (Finkel and Bentley, 1974) based on the a priori contribution to the mole fraction.
Prior uncertainty was set using a truncated normal distribution (with a lower bound at 0 to prevent negative emissions) and a standard deviation of 5. The prior distribution for the bias term was normally distributed with a mean of 0 and a standard deviation of 1 ppt. The prior for the model error followed a log-normal distribution with μ=1.5 and σ=0.5, and the boundary condition followed a log-normal distribution with μ=0.004 and σ=0.02.
Estimating the background mole fractions at each measurement station is an integral part of each inversion system. Figure 1 shows example estimates from the InTEM system for CFC-11, CFC-12 and CCl4 at MHD from 1990. The monthly Northern Hemisphere background trend is derived from MHD observations using the UK Met Office background methodology (Manning et al., 2021). The average rate of decline of the Northern Hemisphere mole fractions of CFC-11 at MHD between 2008 and 2021 is 1.7 ppt yr−1, but it has not been uniform as discussed in Montzka et al. (2018). Between 2008 and 2012 at MHD it was 1.9 ppt yr−1, and between 2013 and 2018 it was 1.2 ppt yr−1. The slowdown in the decline has been attributed in part to enhanced emissions of CFC-11 from China (Rigby et al., 2019). The average rates of decline of the Northern Hemisphere mole fractions of CFC-12 and CCl4 at MHD between 2008 and 2021 are 3.2 and 1.0 ppt yr−1, respectively.
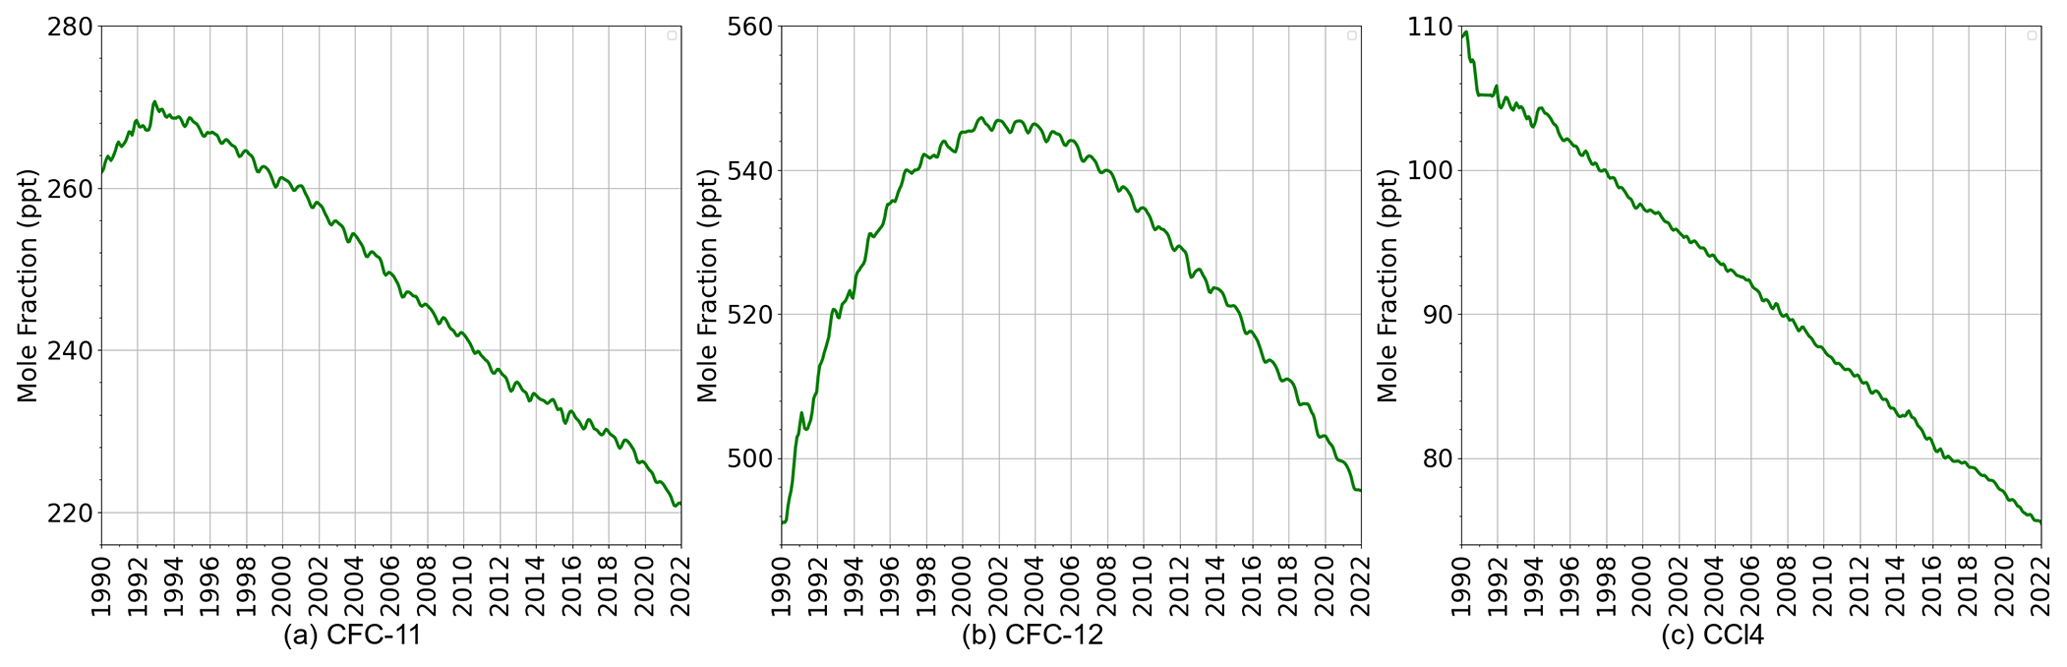
Figure 1Background mole fractions estimated from the observations at Mace Head (Ireland) for (a) CFC-11, (b) CFC-12 and (c) CCl4.
Each inverse modelling system employs a priori background mole fractions estimated using different techniques and adjusts these backgrounds within the inverse systems to produce a posterior background. A comparison of the posterior backgrounds at MHD from the four inverse systems is shown in Fig. S1 in the Supplement. The range of the model offset from the four-model average is generally within ±0.25 ppt for all three gases, with the InTEM model having a positive offset for all three gases, MCMC having mostly positive offsets for CFC-11 and CFC-12 with very little offset for CCl4, Empa having largely negative offsets from the mean for all gases, and Urbino having largely negative offsets from the mean for CFC-11 and CFC-12 but very little offset for CCl4.
Analysis of the MHD observational records for the three gases from 1989 has been undertaken to assess how the number of pollution peaks (i.e. excursions from background) has changed over time. Figure S2 shows the percentage of observations per year greater than the larger of the standard deviations of the InTEM background and twice the instrument precision per year for each gas. The decrease in this percentage over the time period, for all three gases, clearly demonstrates that the emissions of these gases from western Europe have fallen significantly over this period.
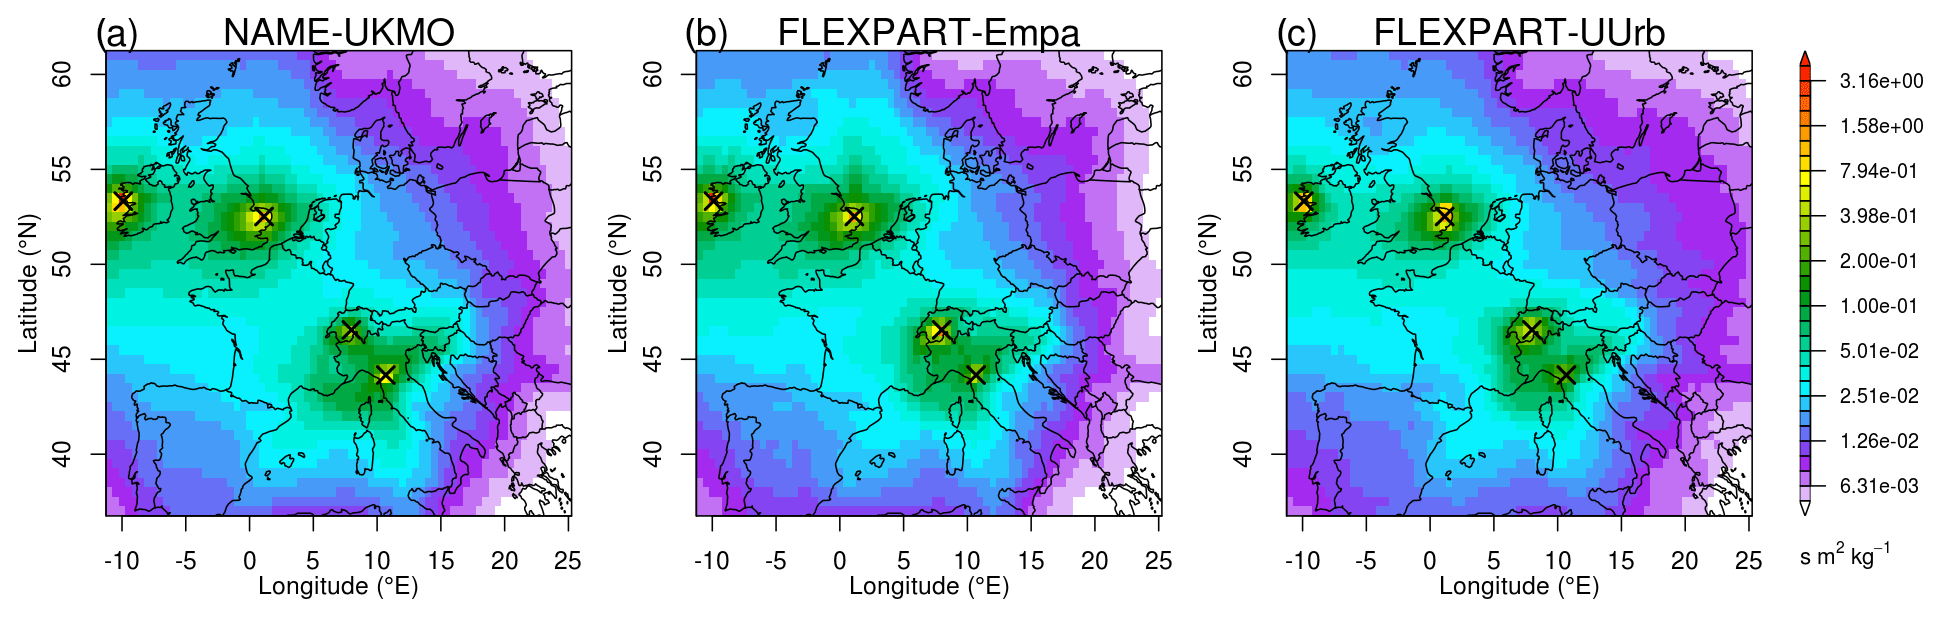
Figure 2Average model sensitivity to European surface emissions at the four observation stations (marked as x) for the period 2017–2021 for three of the atmospheric model configurations. The footprint used by Bristol-MCMC is indistinguishable from panel (a) and is not shown.
The average yearly geographical sensitivities to surface emissions (footprints) at the four observation sites for the different LPDMs for the period 2017–2021 are shown in Fig. 2. Areas of high sensitivity are seen close to the measurement stations, but the footprints show that emissions from countries such as Spain and Poland are unlikely to be significant at the stations and hence are not included in our definition of western Europe.
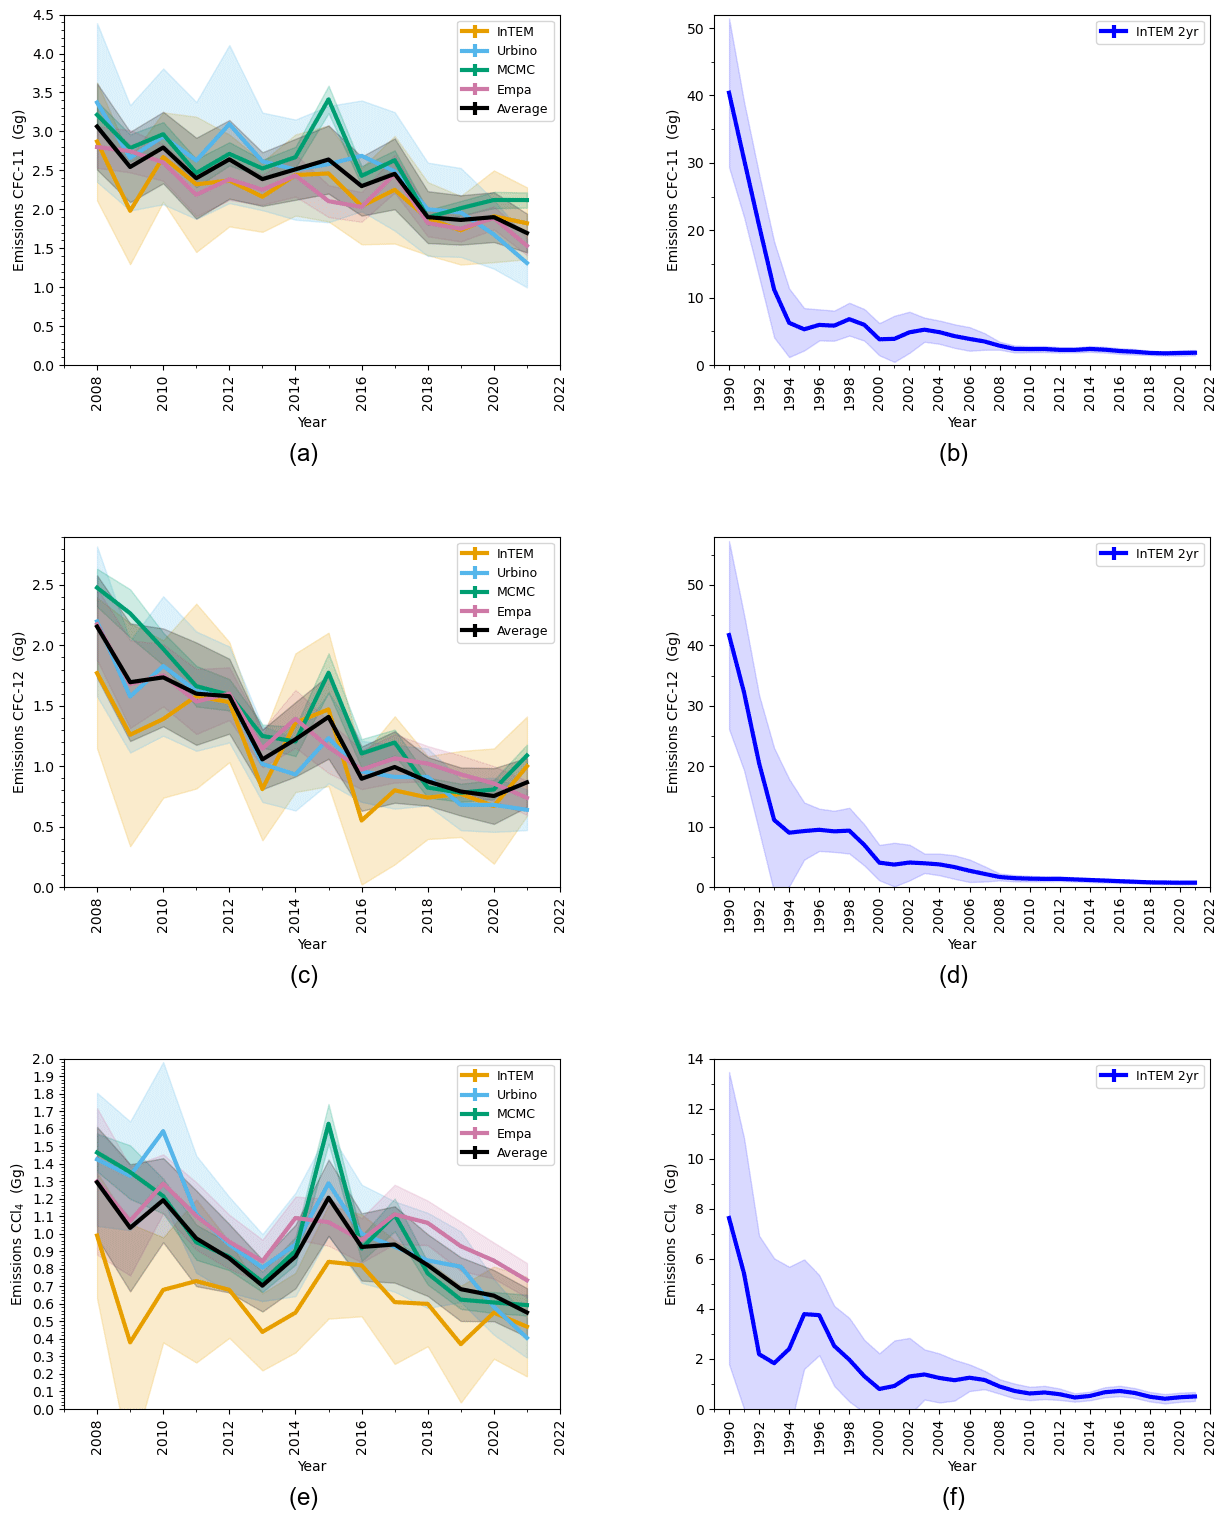
Figure 3Panels (a), (c) and (e) show estimated annual emissions from 2008 to 2021 for the four models, with 1 standard deviation uncertainty (shading), for western Europe, with the average shown in black and uncertainty in the average of the four models shown in grey shading, for CFC-11, CFC-12 and CCl4, respectively. Panels (b), (d) and (f) show the annualised, 2-year InTEM inversion emission estimates from 1990 to 2021 for western Europe, for CFC-11, CFC-12 and CCl4, respectively.
Figure 3 shows the western European emissions (2008–2021) estimated by the four different modelling systems and the average of the four in black, with associated uncertainty estimates for CFC-11, CFC-12 and CCl4 in the left-hand panels, and InTEM-only emission estimates for the three gases from 1990–2021 in the right-hand panels. The western European emission estimate results in Fig. 3, and throughout the paper, are from the flat prior case, with the results from the population prior case shown in the Supplement. From 1990 until 2008, only observations from MHD were available, which greatly limits the ability to estimate emissions over western Europe due to the reduced footprint. To increase the number of observations per inversion, the inversion time period was increased to 2 years, advanced in steps of 1 year. Additional observations were included as they became available (CMN in 2006, JFJ in 2008 and TAC in 2012). The annual emissions shown are the average of the two inversions that include that year, with the exception of 1990 and 2021, which are based on a single 2-year inversion; there are still large uncertainties in the early years, as seen in panels (b), (d) and (f). The results in Fig. 3b and d show that western European emissions of CFC-11 and CFC-12 declined sharply between 1990 and 1994 prior to the phase-out in Europe. Since then there has been a slow decline, likely relating to the gradual release from CFC-11 and CFC-12 banks, which is the amount of each gas held in existing products and buildings and in landfill. The estimated emissions of CCl4 also decreased rapidly from 1990 to 1993 but increased again in 1995–1996 before declining to the current day.
The main focus of the study is the period from 2008 to 2021, when measurement data are available from at least three European sites as shown in Fig. 3a, c and e for CFC-11, CFC-12 and CCl4, respectively. Some year-to-year variability can be seen in the results; however we would caution reading too much into this, as it may be due to errors in the estimates made by the models. Therefore, we focus on the trend over time, of the four model averages, rather than year-to-year variation in this work. Panel (a) shows the estimated CFC-11 emissions from western Europe and the four modelling systems are in good agreement, with InTEM and Empa generally estimating lower values and Urbino and Bristol-MCMC higher values. The model average trend is downwards, from 3.1 ± 0.6 Gg yr−1 in 2008 to 1.7 ± 0.2 Gg yr−1 in 2021, although there is some variability. The average decrease per year is 3.5 % (2.7 %–4.8 %) (gradient of the four model averages compared to the average value; range of the model gradients). Similarly there is an overall downward trend in CFC-12, from 2.2 ± 0.4 Gg yr−1 in 2008 to 0.9 ± 0.2 Gg yr−1 in 2021. Again there is both year-to-year and model-to-model variability, with the InTEM model generally estimating lower than the average values and the Bristol-MCMC model estimating higher than the average values. The average decrease per year is 7.7 % (6.3 %–8.0 %). Panel (e) shows a flatter trend for CCl4, with the InTEM model being more of an outlier with consistently lower estimates compared with the other three. The model average western European emissions are 1.3 ± 0.3 Gg yr−1 in 2008, declining to 0.6 ± 0.1 Gg yr−1 in 2021. The average decrease per year is 4.4 % (2.6 %–6.4 %) for CCl4.
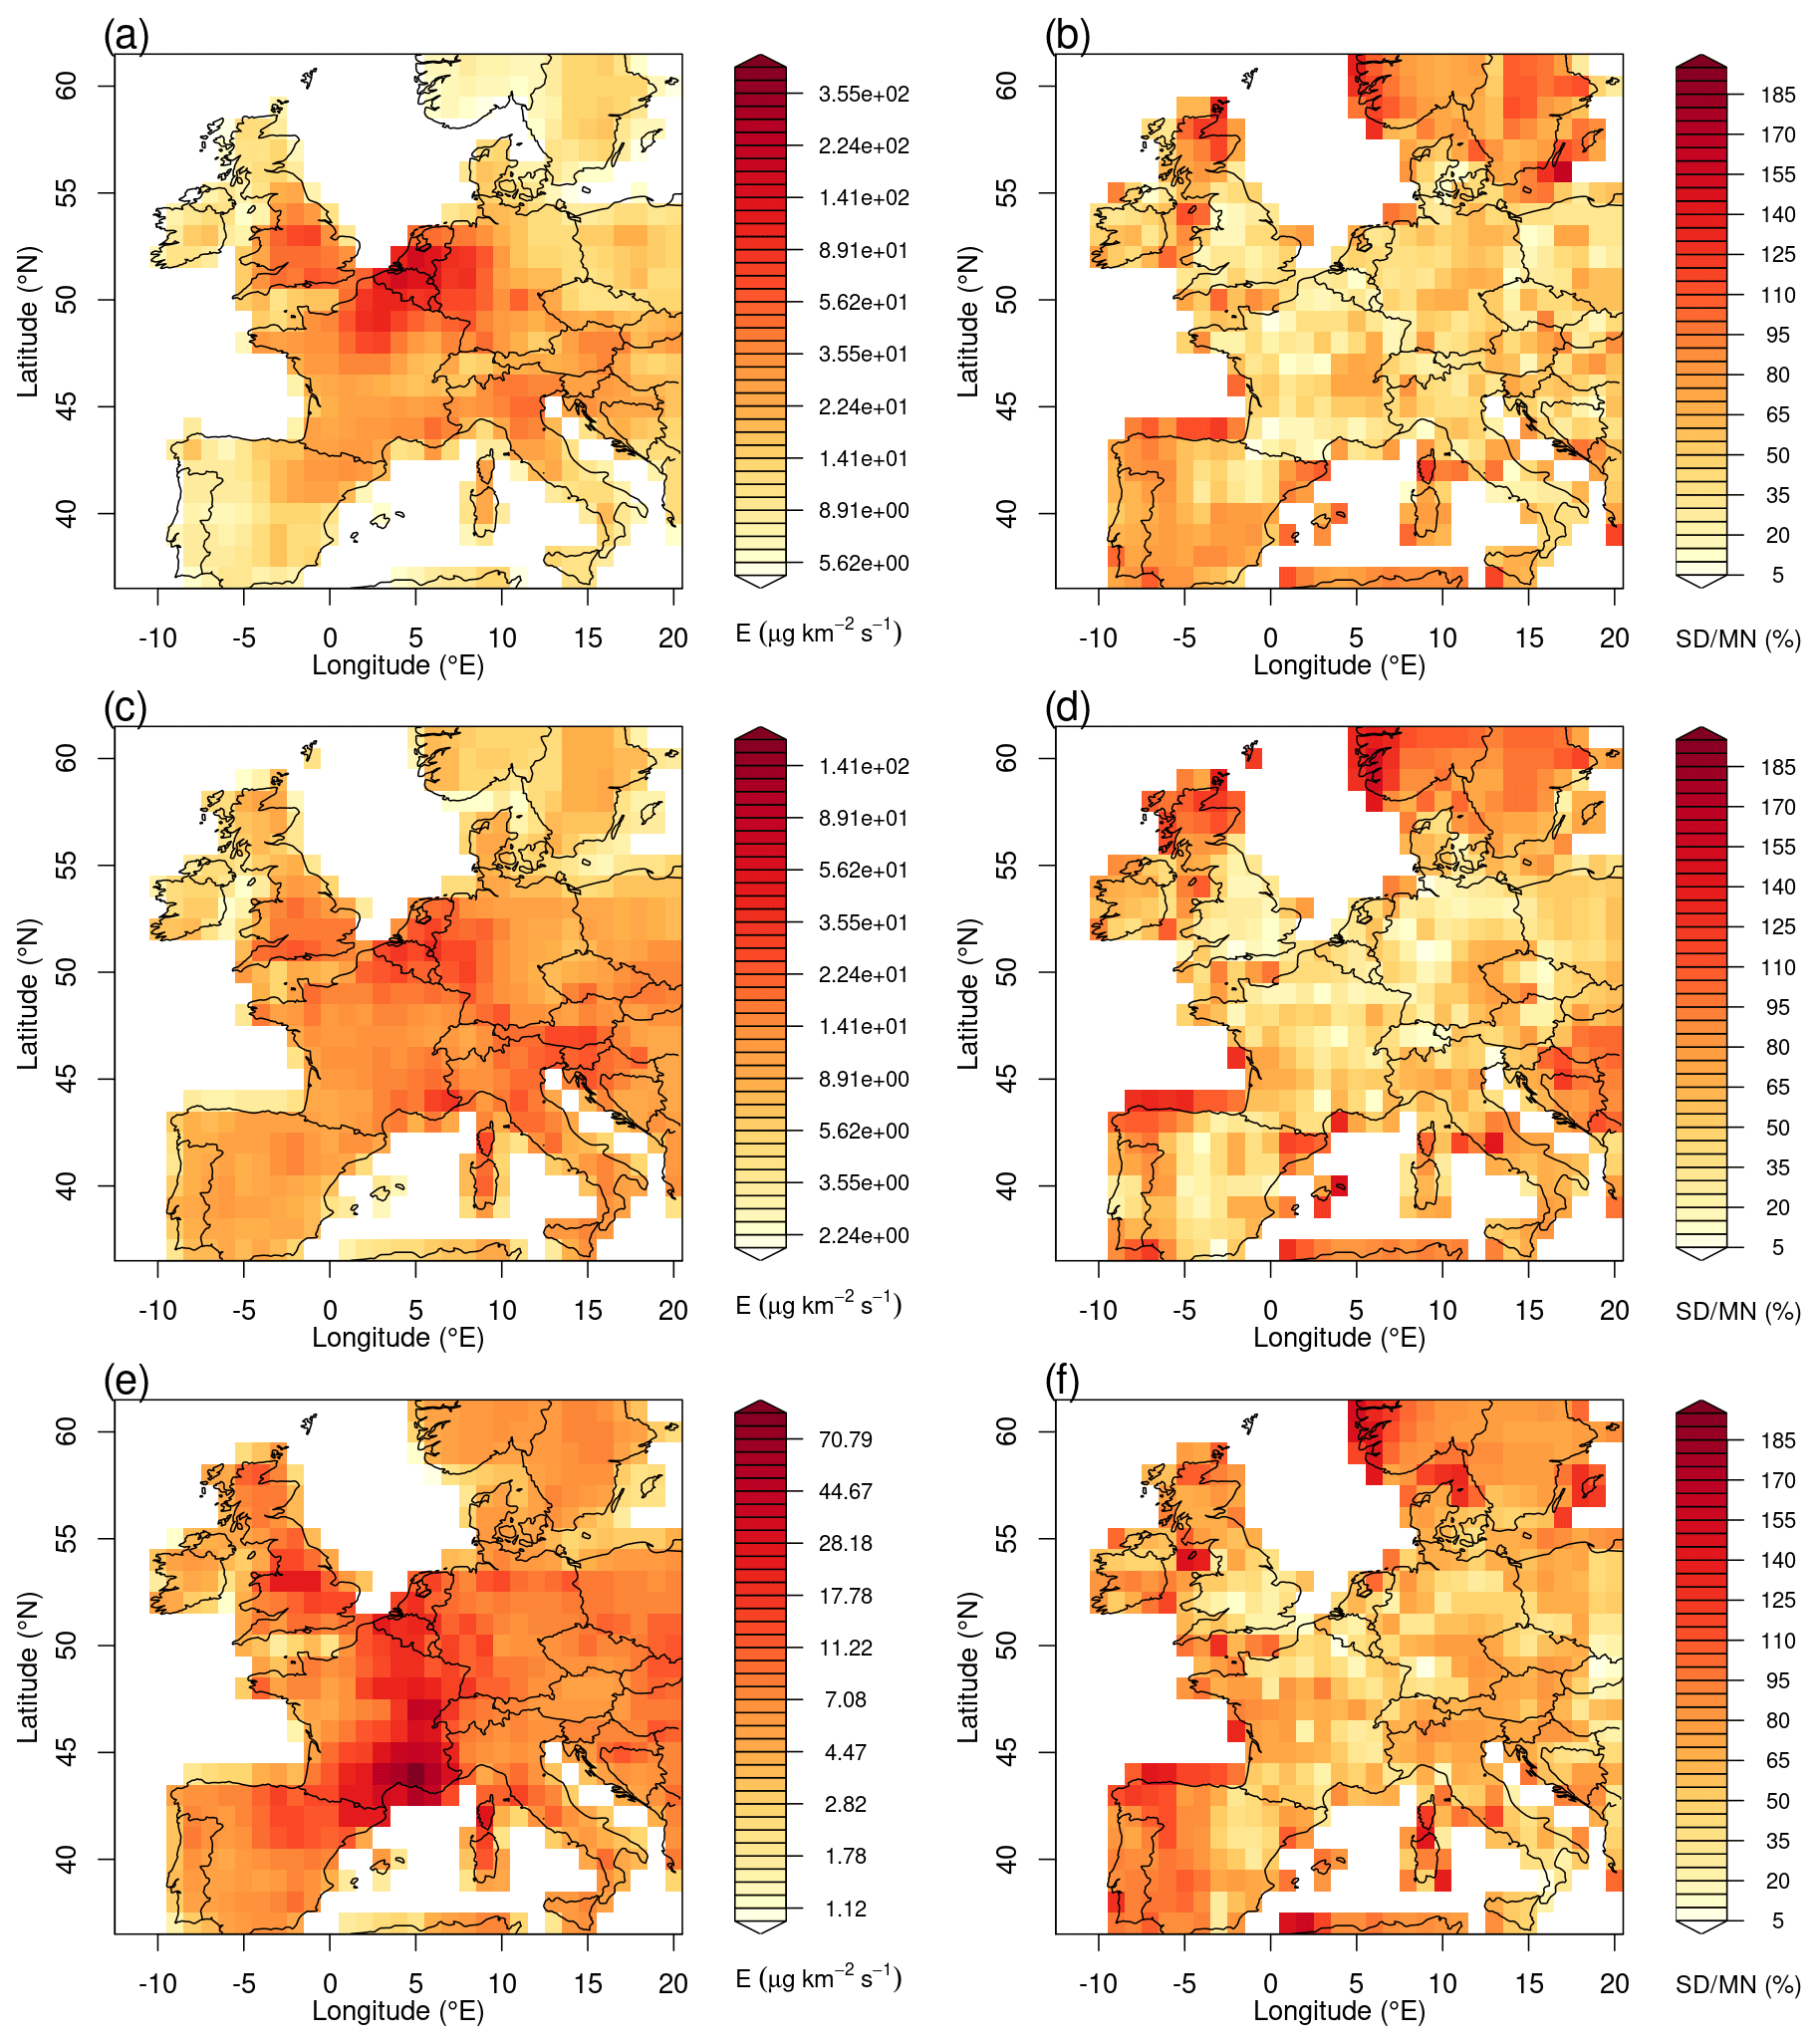
Figure 4Posterior (a) CFC-11, (c) CFC-12 and (e) CCl4 emission distributions averaged over the period 2013 to 2021 and over the four inversion systems using the flat prior. The relative standard deviations of CFC-11, CFC-12 and CCl4 emissions over the four inversion systems are shown in panels (b), (d) and (f).
Figure 4 shows the four model average annual posterior CFC-11, CFC-12 and CCl4 emission distributions (2013 to 2021) estimated using the flat prior distribution. As each inversion system used a different inversion grid, the solutions were re-sampled to a standard grid and averaged. The models are consistent in their emission distribution, as shown quantitatively by the relative standard deviations in panels (b), (d) and (f). The model results for flat and population prior inversions are compared in the Supplement (Figs. S3–S8).
The average emission distribution, Fig. 4a, indicates elevated emissions of CFC-11 over Belgium, the southern Netherlands, northern France and west Germany. A more precise location is not possible given the data sparsity, the precision in the observation network and the uncertainty in the atmospheric modelling. The average emission distribution of CFC-12, Fig. 4c, is largely uniform over land, with slight enhancements in Belgium, the southern Netherlands, west Germany and the far south-east of France. Panel (e) shows the average emission distribution of CCl4, which indicates that the largest emissions are in the south-east of France and some elevated emissions in the east of France, Belgium and the central UK.
We evaluated the models' ability to reproduce the observed concentrations at the four observational sites (2013–2021), focusing on the regional signal (observation minus baseline) only, i.e. the ability of the models to reproduce pollution events with the correct magnitude. Taylor diagrams of this analysis are available in the Supplement (Fig. S9). We observe a large spread in prior model performance with considerable differences across the four model systems. Performance significantly improved in the posterior solutions, and with the different systems much more aligned, no single model stands out. Performance was generally better for the low-altitude sites (MHD and TAC), both in terms of correlation and normalised standard deviation, compared to the high-altitude sites, reflecting the challenges of atmospheric transport simulations in such locations.
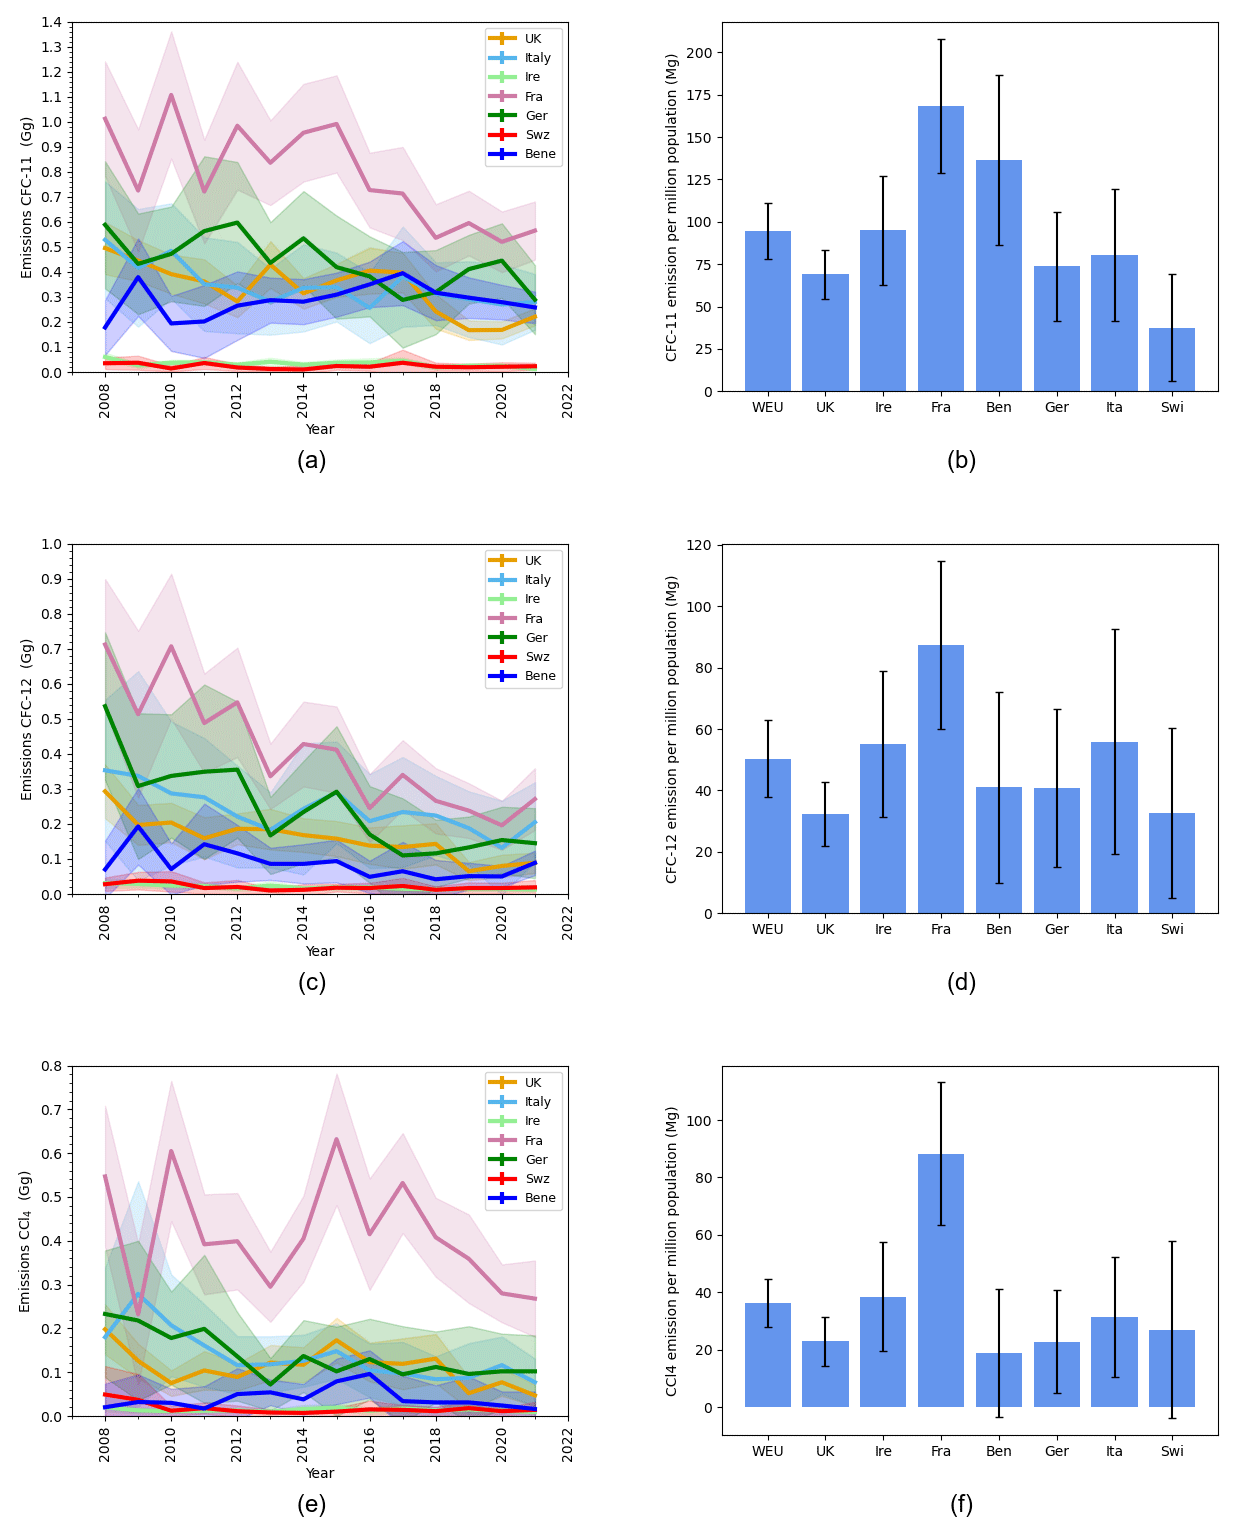
Figure 5Panels (a), (c) and (e) show estimated emissions from 2008 to 2021 of the four model averages by country, with 1 standard deviation uncertainty (shading), for CFC-11, CFC-12 and CCl4, respectively. Panels (b), (d) and (f) show the emission per country and average for western Europe (labelled WEU) in megagrams per year per million population (CIESIN, 2018) over the period 2008–2021, for CFC-11, CFC-12 and CCl4, respectively.
Western Europe has been divided down to country level, and the averages of the four models are shown in Fig. 5. Panels (a), (c) and (e) show emissions per year per country in gigagrams per year. Panels (b), (d) and (f) show population-averaged emissions from 2008 to 2021 in gigagrams per year per million population. Austria and Denmark are included in the western European total but not presented separately due to their large individual emission uncertainties resulting from country size and location with respect to the observation stations. Benelux represents the combined emissions from Belgium, the Netherlands and Luxembourg.
Panel (a) shows that CFC-11 emissions from Ireland and Switzerland are very low (< 0.1 Gg yr−1); emissions from Benelux countries, the UK, Italy, and Germany range from 0.1 to 0.6 Gg yr−1; and France has emissions higher than any other country with more than 0.7 Gg yr−1 until 2018, dropping to 0.5–0.6 Gg yr−1 thereafter. Panel (b) shows that France also has the highest emissions per capita, followed by the Benelux countries.
Figure 5c shows that CFC-12 emissions by country between 2008 and 2021 declined more consistently than CFC-11 emissions. The distribution of emissions between the countries is similar to that seen for CFC-11 in panel (a), except for the Benelux countries, which emitted less than the UK, Italy and Germany, though more than Ireland and Switzerland, whose emissions are relatively low (< 0.05 Gg). France has the greatest estimated emissions but shows a strong decline of 62 % between 2008 and 2021. The decline in CFC-11 in France for the same period was 44 %. Panel (d) shows that France has the highest emission per capita, followed by Italy and Ireland.
Figure 5e shows that the decline in CCl4 emissions split by countries is less clear than the western European decline as shown in Fig. 3e. The dominant emission of CCl4 in the western European region comes from southern France with a sustained decrease from 2017 to 2021, but France's 2021 emissions are still more than double other western European countries' emissions. France's per capita emissions are also clearly the largest (panel f). Unlike CFC-11 and CFC-12, where emissions are mainly from the remaining bank, there is less of a link between CCl4 emissions and population. Emissions of this gas tend to arise from industrial processes, resulting in a very different spatial distribution for CCl4 compared to CFC-11 and CFC-12 (Fig. 4). Fugitive emissions from the chlor-alkali industry are indicated by Graziosi et al. (2016) as potential source regions of CCl4, which fits with the location in the south of France highlighted as the largest source in this study and is in broad agreement the distribution of emissions modelled in Graziosi et al. (2016). Graziosi et al. (2016), however, found 2006–2014 emissions in the Benelux region of a similar magnitude to those in the south of France, whereas this study (2013–2021, Fig. 4e) has found much lower emissions in the Benelux countries. Emissions from this region may have decreased in more recent years, though Fig. 5e only shows a modest decline of CCl4 from 2008 to 2014 for the Benelux countries.
The rate of decline in CCl4 is more complicated due to its permitted use as a chemical feedstock and consequent uncertainty around potential emissions from ongoing industrial processes. CCl4 emissions in this study are decreasing on average by 4.4 % yr−1 (2.6 % yr−1–6.4 % yr−1) across western Europe, which is lower than the average 6.9 % decrease (2006–2014) reported over a larger European domain by Graziosi et al. (2016).
We do not know why the Benelux countries (Belgium, Luxembourg and the Netherlands) and the north-east of France show enhanced CFC-11 emissions (Fig. 4). Possibly, historical banks are higher in this region due to high population density. When the emissions are scaled by population for the different countries (Fig. 5b), the emissions from France and the Benelux countries are similar, 168.3 ± 40.0 and 136.3 ± 50.0 Mg per million people, and much higher than that of the UK, Germany and Italy (69.0 ± 14.5, 73.7 ± 32.0 and 80.4 ± 39.0 Mg per million people, respectively), which are countries with similar-sized populations to France. Ireland's small relative population (approximately 8 % of that of France in 2021) makes the result less comparable. The emission of CFC-11 across western Europe for the period 2008–2021 shown in Fig. 5 equates to an annual emission of 2.4 ± 0.4 Gg for a population of 335 million people (2021), which can be compared with emissions in the USA, with a population of 330 million people, of 5.6 ± 1.2 Gg (Hu et al., 2022), indicating that the USA's per capita emissions are nearly twice those in western Europe (on average) and comparable to those in France.
To understand the spatial distribution of CFC-11 in Europe, it is useful to look at the distribution of the related chemicals, CFC-12 and CCl4 (Fig. 4). The distribution estimated from the average of the four inverse systems shows a slight elevation of CFC-12 emissions in the same area as seen for CFC-11. The estimated emissions of CCl4 do show enhanced emissions from the same region; however the spatial distribution is dominated much more by the elevated emissions in the south-east of France. Together with the estimated western European CFC-11 bank release rate discussed above, the lack of correlation in the spatial distribution of CFC-11 and CCl4 suggests that the CFC-11 emissions are unlikely to be due to fugitive leaks from the chemical industry, as it is reasonable to assume that these compounds would be co-emitted if that were the case. Further research is required to get a better understanding of the geographical spread of CFC-11 use historically, as well as past and present locations for decommissioning and subsequent destruction of CFC-11-containing materials. A more comprehensive set of observations closer to the Benelux countries and northern France geographical region would also potentially shed further light on this region's elevated emissions.
In this study we have estimated the western European emissions of CFC-11, CFC-12 and CCl4 using four different inverse modelling systems and data from four atmospheric measurement sites for the period 2008 to 2021. This has allowed us to look at the spatial distribution of the emissions over this region and to calculate the recent trends in emissions for each of these gases.
In western Europe we found that the average CFC-11 emission over the period 2008–2021 was 2.4 ± 0.4 Gg yr−1, decreasing at a rate of 3.5 % yr−1 (2.7 % yr−1–4.8 % yr−1). CFC-12 emissions were 1.3 ± 0.3 Gg yr−1, decreasing at a rate of 7.7 % yr−1 (6.3 % yr−1–8.0 % yr−1), and CCl4 emissions were 0.9 ± 0.2 Gg yr−1, decreasing at a rate of 4.4 % yr−1 (2.6 % yr−1–6.4 % yr−1). Assuming that all emissions come from banks, we thus estimate bank release rates of 3.4 % (2.6 %–4.5 %) and 7.7 % (6.3 %–8.1 %) for CFC-11 and CFC-12, respectively, consistent with TEAP (2019). We have estimated the 2021 western European bank for each gas to be 55 (41–75) Gg for CFC-11 and 10 (7–12) Gg for CFC-12. We find the highest CFC-11 emissions during the 2013–2021 period in the Benelux countries and the north-east of France, with smaller co-located CFC-12 emissions. The highest CCl4 emissions are found in the south-east of France. This emission area is consistent with known emissions from chlor-alkali plants and previous work by Graziosi et al. (2016). France has the highest emissions per capita for all three gases. Despite the regions of higher emissions of CFC-11 in France and the Benelux countries, as the emissions are reducing at a rate consistent with a decline in the bank, we do not consider this to be indicative of unreported production or consumption. Instead, it is likely a reflection of historic use and population density in these regions. This study concludes that emissions of CFC-11, CFC-12 and CCl4 have all declined from 2008 to 2021 in western Europe. Therefore, no evidence is found that western European emissions contributed to the unexplained part of the global increase in atmospheric concentrations of CFC-11 observed in the last decade.
Atmospheric measurement data from AGAGE stations are available from https://doi.org/10.15485/1909711 (Prinn et al., 2023). Data from the Tacolneston observatory are available from the Centre for Environmental Data Analysis (CEDA) data archive: http://catalogue.ceda.ac.uk/uuid/f5b38d1654d84b03ba79060746541e4f (O'Doherty et al., 2020). NAME and InTEM are available for research use and subject to licence; please contact the corresponding author. The Bristol-MCMC inversion code is available at https://github.com/ACRG-Bristol/acrg (last access: 28 September 2022) and https://doi.org/10.5281/zenodo.6834888 (Rigby et al., 2022).
The supplement related to this article is available online at: https://doi.org/10.5194/acp-23-7383-2023-supplement.
AJM and ALR ran the InTEM inverse model. SH ran the Empa FLEXINVERT system. FG ran the Urbino FLEXINVERT system. LMW ran the Bristol-MCMC system. Measurement data were collected by SO'D, DY, JP, TGS, PGS, MKV, SR, JA, MM, JM, PKS, RFW and KS. CMH produced and maintained the gravimetric SIO-05 calibration scales for these gases. ALR, AJM, SH, FG, LMW, ALG, JM and MR wrote the paper.
The contact author has declared that none of the authors has any competing interests.
Publisher's note: Copernicus Publications remains neutral with regard to jurisdictional claims in published maps and institutional affiliations.
The authors thank the UK Department for Business, Energy and Industrial Strategy (BEIS) (contract number: TRN 1537/06/2018). Alison L. Redington and Alistair J. Manning were supported by the Met Office Hadley Centre Climate Programme funded by BEIS and Defra. The operation and calibration of the global AGAGE measurement network are supported by NASA's Upper Atmosphere Research programme through grants NAG5-12669, NNX07AE89G, NNX11AF17G and NNX16AC98G (to MIT) and NNX07AE87G, NNX07AF09G, NNX11AF15G and NNX11AF16G (to SIO). Financial support for the Jungfraujoch measurements is acknowledged from the Swiss national programme CLIMGAS-CH (Swiss Federal Office for the Environment, FOEN) and from ICOS-CH (Integrated Carbon Observation System Research Infrastructure). Support for the Jungfraujoch station was provided by the International Foundation of the High Altitude Research Stations Jungfraujoch and Gornergrat (HFSJG). The Ottavio Vittori station (CMN) is supported by the National Research Council of Italy. Luke M. Western received funding from the European Union's Horizon 2020 research and innovation programme under the Marie Skłodowska-Curie grant agreement no. 101030750. Matthew Rigby, Anita L. Ganesan and Luke M. Western were partially supported by NERC grants NE/S004211/1 and NE/V002996/1. The authors thank the staff supporting the acquisition of observational data used in this paper, across all sites and years dating back to 1989.
This research has been supported by the UK Department for Business, Energy and Industrial Strategy (BEIS) (contract no. TRN 1537/06/2018), the Met Office Hadley Centre Climate Programme funded by BEIS and Defra, NASA's Upper Atmosphere Research programme (grant nos. NAG5-12669, NNX07AE89G, NNX11AF17G, NNX16AC98G, NNX07AE87G, NNX07AF09G, NNX11AF15G and NNX11AF16G), the Swiss national programme CLIMGAS-CH (Swiss Federal Office for the Environment, FOEN), ICOS-CH (Integrated Carbon Observation System Research Infrastructure), the International Foundation of the High Altitude Research Stations Jungfraujoch and Gornergrat (HFSJG), the National Research Council of Italy, the European Union's Horizon 2020 research and innovation programme (Marie Skłodowska-Curie grant agreement no. 101030750), and NERC (grant nos. NE/S004211/1 and NE/V002996/1).
This paper was edited by Marc von Hobe and reviewed by two anonymous referees.
Arnold, T., Manning, A. J., Kim, J., Li, S., Webster, H., Thomson, D., Mühle, J., Weiss, R. F., Park, S., and O'Doherty, S.: Inverse modelling of CF4 and NF3 emissions in East Asia, Atmos. Chem. Phys., 18, 13305–13320, https://doi.org/10.5194/acp-18-13305-2018, 2018. a
Brunner, D., Arnold, T., Henne, S., Manning, A., Thompson, R. L., Maione, M., O'Doherty, S., and Reimann, S.: Comparison of four inverse modelling systems applied to the estimation of HFC-125, HFC-134a, and SF6 emissions over Europe, Atmos. Chem. Phys., 17, 10651–10674, https://doi.org/10.5194/acp-17-10651-2017, 2017. a
Carpenter, L. J., Reimann, S., Burkholder, J. B., Clerbaux, C., Hall, B. D., Hossaini, R., Laube, J. C., and Yvon-Lewis, S. A.: OzoneDepleting Substances (ODSs) and Other Gases of Interest to the Montreal Protocol, Chap. 1 in Scientific Assessment of Ozone Depletion, Global Ozone Research and Monitoring Project, Report No. 55, World Meteorological Organization, Geneva, Switzerland, ISBN 9789966076014, 2014. a
CIESIN: Gridded Population of the World, Center for International Earth Science Information Network – Columbia University, NASA Socioeconomic Data and Applications Center (SEDAC), Palisades, NY, Gridded Population of the World Revision 11, https://doi.org/10.7927/H4JW8BX5, 2018. a
Cunnold, D. M., Prinn, R. G., Rasmussen, R. A., Simmonds, P. G., Alyea, F. N., Cardelino, C. A., Crawford, A. J., Fraser, P. J., and Rosen, R. D.: The Atmospheric Lifetime Experiment: 3. Lifetime methodology and application to three years of CFC-l3 data, J. Geophys. Res.-Oceans, 88, 8379–8400, https://doi.org/10.1029/JC088iC13p08379, 1983. a
EU: Directive 2002/96/EC of the European Parliament and of the Council of 27 January 2003 on waste electrical and electronic equipment (WEEE), Official Journal of the European Union, L37/24, https://eur-lex.europa.eu/resource.html?uri=cellar:ac89e64f-a4a5-4c13-8d96-1fd1d6bcaa49.0004.02/DOC_1&format=PDF (last access: 3 July 2023), 2003. a
Finkel, R. A. and Bentley, J. L.: Quad trees a data structure for retrieval on composite keys, Acta Inform., 4, 1–9, https://doi.org/10.1007/BF00288933, 1974. a
Fraser, P. J., Dunse, B. L., Manning, A. J., Walsh, S., Wang, R. H. J., Krummel, P. B., Steele, L. P., Porter, L. W., Allison, C., O'Doherty, S., Simmonds, P. G., Mühle, J., Weiss, R. F., and Prinn, R. G.: Australian carbon tetrachloride emissions in a global context, Environ. Chem., 11, 77–88, https://doi.org/10.1071/EN13171, 2014. a
Fraser, P. J., Dunse, B. L., Krummel, P. B., Steele, L. P., Derek, N., Mitrevski, B., Allison, C. E., Loh, Z., Manning, A. J., Redington, A., and Rigby, M.: Australian chlorofluorocarbon (CFC) emissions: 1960–2017, Environ. Chem., 17, 525–544, https://doi.org/10.1071/EN19322, 2020. a, b
Ganesan, A. L., Rigby, M., Zammit-Mangion, A., Manning, A. J., Prinn, R. G., Fraser, P. J., Harth, C. M., Kim, K.-R., Krummel, P. B., Li, S., Mühle, J., O'Doherty, S. J., Park, S., Salameh, P. K., Steele, L. P., and Weiss, R. F.: Characterization of uncertainties in atmospheric trace gas inversions using hierarchical Bayesian methods, Atmos. Chem. Phys., 14, 3855–3864, https://doi.org/10.5194/acp-14-3855-2014, 2014. a
Ganesan, A. L., Manizza, M., Morgan, E. J., Harth, C. M., Kozlova, E., Lueker, T., Manning, A. J., Lunt, M. F., Mühle, J., Lavric, J. V., Heimann, M., Weiss, R. F., and Rigby, M.: Marine Nitrous Oxide Emissions From Three Eastern Boundary Upwelling Systems Inferred From Atmospheric Observations, Geophys. Res. Lett., 47, e2020GL087822, https://doi.org/10.1029/2020GL087822, 2020. a
Graziosi, F., Arduini, J., Bonasoni, P., Furlani, F., Giostra, U., Manning, A. J., McCulloch, A., O'Doherty, S., Simmonds, P. G., Reimann, S., Vollmer, M. K., and Maione, M.: Emissions of carbon tetrachloride from Europe, Atmos. Chem. Phys., 16, 12849–12859, https://doi.org/10.5194/acp-16-12849-2016, 2016. a, b, c, d, e, f, g
Henne, S., Brunner, D., Oney, B., Leuenberger, M., Eugster, W., Bamberger, I., Meinhardt, F., Steinbacher, M., and Emmenegger, L.: Validation of the Swiss methane emission inventory by atmospheric observations and inverse modelling, Atmos. Chem. Phys., 16, 3683–3710, https://doi.org/10.5194/acp-16-3683-2016, 2016. a, b
Hu, L., Montzka, S. A., Miller, B. R., Andrews, A. E., Miller, J. B., Lehman, S. J., Sweeney, C., Miller, S. M., Thoning, K., Siso, C., Atlas, E. L., Blake, D. R., de Gouw, J., Gilman, J. B., Dutton, G., Elkins, J. W., Hall, B., Chen, H., Fischer, M. L., Mountain, M. E., Nehrkorn, T., Biraud, S. C., Moore, F. L., and Tans, P.: Continued emissions of carbon tetrachloride from the United States nearly two decades after its phaseout for dispersive uses, P. Natl. Acad. Sci. USA, 113, 2880–2885, https://doi.org/10.1073/pnas.1522284113, 2016. a
Hu, L., Montzka, S. A., Moore, F., Hintsa, E., Dutton, G., Siso, M. C., Thoning, K., Portmann, R. W., McKain, K., Sweeney, C., Vimont, I., Nance, D., Hall, B., and Wofsy, S.: Continental-scale contributions to the global CFC-11 emission increase between 2012 and 2017, Atmos. Chem. Phys., 22, 2891–2907, https://doi.org/10.5194/acp-22-2891-2022, 2022. a, b
IPCC: Climate Change 2021: The Physical Science Basis. Contribution of Working Group I to the Sixth Assessment Report of the Intergovernmental Panel on Climate Change, edited by: Masson-Delmotte, V., Zhai, P., Pirani, A., Connors, S., Péan, C., Berger, S., Caud, N., Chen, Y., Goldfarb, L., Gomis, M., Huang, M., Leitzell, K., Lonnoy, E., Matthews, J., Maycock, T., Waterfield, T., Yelekçi, O., Yu, R., and Zhou, B., Cambridge University Press, Cambridge, United Kingdom and New York, NY, USA, 239 pp., https://doi.org/10.1017/9781009157896, 2021. a
Jones, A., Thomson, D., Hort, M., and Devenish, B.: The U.K. Met Office's next-generation atmospheric dispersion model, NAME III, in: Air Pollution Modeling and its Application XVII, edited by: Borrego, C. and Norman, A.-L., Proceedings of the 27th NATO/CCMS International Technical Meeting on Air Pollution Modelling and its Application, 25–29 October 2004, Banff Centre, Canada, Springer, 580–589, https://link.springer.com/book/10.1007/978-0-387-68854-1 (last access: 3 July 2023), 2007. a
Karpechko, A. Y., Maycock, A. C. L. A., Abalos, M., Akiyoshi, H., Arblaster, J. M., Garfinkel, C. I., Rosenlof, K. H., and Sigmond, M.: Stratospheric Ozone Changes and Climate, Chap. 5 in Scientific Assessment of Ozone Depletion: 2018,, Global Ozone Research and Monitoring Project Report No. 58, World Meteorological Organization, Geneva, Switzerland, https://ozone.unep.org/sites/default/files/2019-05/SAP-2018-Assessment-report.pdf (last access: 3 July 2023), 2018. a
Keller, C., Hill, M., Vollmer, M., Henne, S., Brunner, D., Reimann, S., O'Doherty, S., Arduini, J., Maione, M., Ferenczi, Z., Haszpra, L., Manning, A., and Peter, T.: European Emissions of Halogenated Greenhouse Gases Inferred from Atmospheric Measurements, Environ. Sci. Technol., 46, 217–225, https://doi.org/10.1021/es202453j, 2011. a, b
Liang, Q., Newman, P. A., Daniel, J. S., Reimann, S., Hall, B. D., Dutton, G., and Kuijpers, L. J. M.: Constraining the carbon tetrachloride (CCl4) budget using its global trend and inter-hemispheric gradient, Geophys. Res. Lett., 41, 5307–5315, https://doi.org/10.1002/2014GL060754, 2014. a
Lickley, M., Solomon, S., Fletcher, S., Velders, G. J. M., Daniel, J., Rigby, M., Montzka, S. A., Kuijpers, L. J. M., and Stone, K.: Quantifying contributions of chlorofluorocarbon banks to emissions and impacts on the ozone layer and climate, Nat. Commun., 11, 2041–1723, https://doi.org/10.1038/s41467-020-15162-7, 2020. a
Lunt, M. F., Park, S., Li, S., Henne, S., Manning, A. J., Ganesan, A. L., Simpson, I. J., Blake, D. R., Liang, Q., O'Doherty, S., Harth, C. M., Mühle, J., Salameh, P. K., Weiss, R. F., Krummel, P. B., Fraser, P. J., Prinn, R. G., Reimann, S., and Rigby, M.: Continued Emissions of the Ozone-Depleting Substance Carbon Tetrachloride From Eastern Asia, Geophys. Res. Lett., 45, 11423–11430, https://doi.org/10.1029/2018GL079500, 2018. a, b
Maione, M., Giostra, U., Arduini, J., Furlani, F., Graziosi, F., Lo Vullo, E., and Bonasoni, P.: Ten years of continuous observations of stratospheric ozone depleting gases at Monte Cimone (Italy): Comments on the effectiveness of the Montreal Protocol from a regional perspective, Sci. Total Environ., 445–446, 155–164, https://doi.org/10.1016/j.scitotenv.2012.12.056, 2013. a
Manning, A. J., Ryall, D. B., Derwent, R. G., Simmonds, P. G., and O'Doherty, S.: Estimating European emissions of ozone-depleting and greenhouse gases using observations and a modeling back-attribution technique, J. Geophys. Res.-Atmos., 108, 4405, https://doi.org/10.1029/2002JD002312, 2003. a
Manning, A. J., O'Doherty, S., Jones, A. R., Simmonds, P. G., and Derwent, R. G.: Estimating UK methane and nitrous oxide emissions from 1990 to 2007 using an inversion modeling approach, J. Geophys. Res.-Atmos., 116, D02305, https://doi.org/10.1029/2010JD014763, 2011. a
Manning, A. J., Redington, A. L., Say, D., O'Doherty, S., Young, D., Simmonds, P. G., Vollmer, M. K., Mühle, J., Arduini, J., Spain, G., Wisher, A., Maione, M., Schuck, T. J., Stanley, K., Reimann, S., Engel, A., Krummel, P. B., Fraser, P. J., Harth, C. M., Salameh, P. K., Weiss, R. F., Gluckman, R., Brown, P. N., Watterson, J. D., and Arnold, T.: Evidence of a recent decline in UK emissions of hydrofluorocarbons determined by the InTEM inverse model and atmospheric measurements, Atmos. Chem. Phys., 21, 12739–12755, https://doi.org/10.5194/acp-21-12739-2021, 2021. a, b, c, d, e, f
Miller, B. R., Weiss, R. F., Salameh, P. K., Tanhua, T., Greally, B. R., Mühle, J., and Simmonds, P. G.: Medusa: A Sample Preconcentration and GC/MS Detector System for in Situ Measurements of Atmospheric Trace Halocarbons, Hydrocarbons, and Sulfur Compounds, Anal. Chem., 80, 1536–1545, https://doi.org/10.1021/ac702084k, 2008. a
Montzka, S. A., Dutton, G. S., Yu, P., Ray, E., Portmann, R. W., Daniel, J. S., Kuijpers, L., Hall, B. D., Mondeel, D., Siso, C., Nance, J. D., Rigby, M., Manning, A. J., Hu, L., Moore, F., Miller, B. R., and Elkins, J. W.: An unexpected and persistent increase in global emissions of ozone-depleting CFC-11, Nature, 557, 413–417, https://doi.org/10.1038/s41586-018-0106-2, 2018. a, b
Montzka, S. A., Dutton, G. S., Portmann, R. W., Chipperfield, M. P., Davis, S., Feng, W., Manning, A. J., Ray, E., Rigby, M., Hall, B. D., Siso, C., Nance, J. D., Krummel, P. B., Mühle, J., Young, D., O'Doherty, S., Salameh, P. K., Harth, C. M., Prinn, R. G., Weiss, R. F., Elkins, J. W., Walter-Terrinoni, H., and Theodoridi, C.: A decline in global CFC-11 emissions during 2018–2019, Nature, 590, 428–432, https://doi.org/10.1038/s41586-021-03260-5, 2021. a, b
O'Doherty, S., Say, D., Stanley, K., Spain, G., Arnold, T., Rennick, C., Young, D., Stavert, A., Grant, A., Ganesan, A., Pitt, J., Wisher, A., Wenger, A., and Garrard, N.: UK DECC (Deriving Emissions linked to Climate Change) Network, Centre for Environmental Data Analysis [data set], http://catalogue.ceda.ac.uk/uuid/f5b38d1654d84b03ba79060746541e4f (last access: 3 July 2023), 2020. a
Park, S., Western, L., Saito, T., Redington, A., Henne, S., Fang, X., Prinn, R., Manning, A., Montzka, S., Fraser, P., Ganesan, A., Harth, C., Kim, J., Krummel, P., Liang, Q., Mühle, J., O'Doherty, S. Park, H., Park, M.-K., Reimann, S., Salameh, P., Weiss, R., and Rigby, M.: A decline in emissions of CFC-11 and related chemicals from eastern China, Nature, 590, 433–437, https://doi.org/10.1038/s41586-021-03277-w, 2021. a, b, c, d
Pisso, I., Sollum, E., Grythe, H., Kristiansen, N. I., Cassiani, M., Eckhardt, S., Arnold, D., Morton, D., Thompson, R. L., Groot Zwaaftink, C. D., Evangeliou, N., Sodemann, H., Haimberger, L., Henne, S., Brunner, D., Burkhart, J. F., Fouilloux, A., Brioude, J., Philipp, A., Seibert, P., and Stohl, A.: The Lagrangian particle dispersion model FLEXPART version 10.4, Geosci. Model Dev., 12, 4955–4997, https://doi.org/10.5194/gmd-12-4955-2019, 2019. a, b
Prinn, R., Weiss, R., Arduini, J., Arnold, T., Fraser, P., Ganesan, A., Gasore, J., Harth, C., Hermansen, O., Kim, J., Krummel, P., Loh, Z., Lunder, C., Maione, M., Manning, A., Miller, B., Mitrevski, B., Mühle, J., O'Doherty, S., Park, S., Reimann, S., Rigby, M., Saito, T., Salameh, P., Schmidt, R., Simmonds, P., Steel, P., Vollmer, M., Wang, H. R., Yao, B., Young, D., and Zhou, L.: The dataset of in-situ measurements of chemically and radiatively important atmospheric gases from the AGAGE and affiliated stations (2022R2), Advanced Global Atmospheric Gases Experiment (AGAGE), ESS-DIVE repository [data set], https://doi.org/10.15485/1909711, 2023. a
Prinn, R. G., Weiss, R. F., Arduini, J., Arnold, T., DeWitt, H. L., Fraser, P. J., Ganesan, A. L., Gasore, J., Harth, C. M., Hermansen, O., Kim, J., Krummel, P. B., Li, S., Loh, Z. M., Lunder, C. R., Maione, M., Manning, A. J., Miller, B. R., Mitrevski, B., Mühle, J., O'Doherty, S., Park, S., Reimann, S., Rigby, M., Saito, T., Salameh, P. K., Schmidt, R., Simmonds, P. G., Steele, L. P., Vollmer, M. K., Wang, R. H., Yao, B., Yokouchi, Y., Young, D., and Zhou, L.: History of chemically and radiatively important atmospheric gases from the Advanced Global Atmospheric Gases Experiment (AGAGE), Earth Syst. Sci. Data, 10, 985–1018, https://doi.org/10.5194/essd-10-985-2018, 2018. a
Rigby, M., Prinn, R. G., O'Doherty, S., Montzka, S. A., McCulloch, A., Harth, C. M., Mühle, J., Salameh, P. K., Weiss, R. F., Young, D., Simmonds, P. G., Hall, B. D., Dutton, G. S., Nance, D., Mondeel, D. J., Elkins, J. W., Krummel, P. B., Steele, L. P., and Fraser, P. J.: Re-evaluation of the lifetimes of the major CFCs and CH3CCl3 using atmospheric trends, Atmos. Chem. Phys., 13, 2691–2702, https://doi.org/10.5194/acp-13-2691-2013, 2013. a
Rigby, M., Prinn, R. G., O'Doherty, S., Miller, B. R., Ivy, D., Mühle, J., Harth, C. M., Salameh, P. K., Arnold, T., Weiss, R. F., Krummel, P. B., Steele, L. P., Fraser, P. J., Young, D., and Simmonds, P. G.: Recent and future trends in synthetic greenhouse gas radiative forcing, Geophys. Res. Lett., 41, 2623–2630, https://doi.org/10.1002/2013GL059099, 2014. a
Rigby, M., Park, S., Saito, T., Western, L. M., Redington, A. L., Fang, X., Henne, S., Manning, A. J., Prinn, R. G., Dutton, G. S., Fraser, P. J., Ganesan, A. L., Hall, B. D., Harth, C. M., Kim, J., Krummel, P. B., Lee, T., Li, S., Liang, Q., Lunt, M. F., Montzka, S. A., Mühle, J., O'Doherty, S., Park, M. K., Reiman, S., Salameh, P. K., Simmonds, P., Tunnicliffe, R. L., Weiss, Y., and Young, D.: Increase in CFC-11 emissions from eastern China based on atmospheric observations, Nature, 569, 546–550, https://doi.org/10.1038/s41586-019-1193-4, 2019. a, b, c, d, e
Rigby, M., Tunnicliffe, R., Western, L., Chawner, H., Ganesan, A., Ramsden, A., Jones, G., Young, D., Ward, R., Stell, A., Nickless-Bristol, A., and Pitt, J.: ACRG-Bristol/acrg: ACRG v0.2.0, Zenodo [code], https://doi.org/10.5281/zenodo.6834888, 2022. a
Ruckstuhl, A. F., Henne, S., Reimann, S., Steinbacher, M., Vollmer, M. K., O'Doherty, S., Buchmann, B., and Hueglin, C.: Robust extraction of baseline signal of atmospheric trace species using local regression, Atmos. Meas. Tech., 5, 2613–2624, https://doi.org/10.5194/amt-5-2613-2012, 2012. a
Say, D., Manning, A. J., O'Doherty, S., Rigby, M., Young, D., and Grant, A.: Re-Evaluation of the UK's HFC-134a Emissions Inventory Based on Atmospheric Observations, Environ. Sci. Technol., 50, 11129–11136, https://doi.org/10.1021/acs.est.6b03630, 2016. a
Say, D., Kuyper, B., Western, L., Khan, M. A. H., Lesch, T., Labuschagne, C., Martin, D., Young, D., Manning, A. J., O'Doherty, S., Rigby, M., Krummel, P. B., Davies-Coleman, M. T., Ganesan, A. L., and Shallcross, D. E.: Emissions and Marine Boundary Layer Concentrations of Unregulated Chlorocarbons Measured at Cape Point, South Africa, Environ. Sci. Technol., 54, 10514–10523, https://doi.org/10.1021/acs.est.0c02057, 2020. a, b
Say, D., Manning, A. J., Western, L. M., Young, D., Wisher, A., Rigby, M., Reimann, S., Vollmer, M. K., Maione, M., Arduini, J., Krummel, P. B., Mühle, J., Harth, C. M., Evans, B., Weiss, R. F., Prinn, R. G., and O'Doherty, S.: Global trends and European emissions of tetrafluoromethane (CF4), hexafluoroethane (C2F6) and octafluoropropane (C3F8), Atmos. Chem. Phys., 21, 2149–2164, https://doi.org/10.5194/acp-21-2149-2021, 2021. a
Schoenenberger, F., Henne, S., Hill, M., Vollmer, M. K., Kouvarakis, G., Mihalopoulos, N., O'Doherty, S., Maione, M., Emmenegger, L., Peter, T., and Reimann, S.: Abundance and sources of atmospheric halocarbons in the Eastern Mediterranean, Atmos. Chem. Phys., 18, 4069–4092, https://doi.org/10.5194/acp-18-4069-2018, 2018. a
Seibert, P.: Inverse modelling with a Lagrangian particle dispersion model: application to point releases over limited time intervals, in: Air Pollution Modelling and its Application, edited by: Schiermeier, F. and Gryning, S. E., Kluwer Academic Publ., 381–390, ISBN 0-306-47460-3, 2001. a
Seibert, P. and Frank, A.: Source-receptor matrix calculation with a Lagrangian particle dispersion model in backward mode, Atmos. Chem. Phys., 4, 51–63, https://doi.org/10.5194/acp-4-51-2004, 2004. a
Simmonds, P. G., O'Doherty, S., Nickless, G., Sturrock, G. A., Swaby, R., Knight, P., Ricketts, J., Woffendin, G., and Smith, R.: Automated Gas Chromatograph/Mass Spectrometer for Routine Atmospheric Field Measurements of the CFC Replacement Compounds, the Hydrofluorocarbons and Hydrochlorofluorocarbons, Anal. Chem., 67, 717–723, https://doi.org/10.1021/ac00100a005, 1995. a
Simmonds, P. G., Rigby, M., Manning, A. J., Park, S., Stanley, K. M., McCulloch, A., Henne, S., Graziosi, F., Maione, M., Arduini, J., Reimann, S., Vollmer, M. K., Mühle, J., O'Doherty, S., Young, D., Krummel, P. B., Fraser, P. J., Weiss, R. F., Salameh, P. K., Harth, C. M., Park, M.-K., Park, H., Arnold, T., Rennick, C., Steele, L. P., Mitrevski, B., Wang, R. H. J., and Prinn, R. G.: The increasing atmospheric burden of the greenhouse gas sulfur hexafluoride (SF6), Atmos. Chem. Phys., 20, 7271–7290, https://doi.org/10.5194/acp-20-7271-2020, 2020. a, b
Stanley, K. M., Grant, A., O'Doherty, S., Young, D., Manning, A. J., Stavert, A. R., Spain, T. G., Salameh, P. K., Harth, C. M., Simmonds, P. G., Sturges, W. T., Oram, D. E., and Derwent, R. G.: Greenhouse gas measurements from a UK network of tall towers: technical description and first results, Atmos. Meas. Tech., 11, 1437–1458, https://doi.org/10.5194/amt-11-1437-2018, 2018. a
Stohl, A., Forster, C., Frank, A., Seibert, P., and Wotawa, G.: Technical note: The Lagrangian particle dispersion model FLEXPART version 6.2, Atmos. Chem. Phys., 5, 2461–2474, https://doi.org/10.5194/acp-5-2461-2005, 2005. a
Stohl, A., Seibert, P., Arduini, J., Eckhardt, S., Fraser, P., Greally, B. R., Lunder, C., Maione, M., Mühle, J., O'Doherty, S., Prinn, R. G., Reimann, S., Saito, T., Schmidbauer, N., Simmonds, P. G., Vollmer, M. K., Weiss, R. F., and Yokouchi, Y.: An analytical inversion method for determining regional and global emissions of greenhouse gases: Sensitivity studies and application to halocarbons, Atmos. Chem. Phys., 9, 1597–1620, https://doi.org/10.5194/acp-9-1597-2009, 2009. a, b
TEAP: Decisions XXX/3 TEAP Task Force Report on Unexpected Emissions of Trichlorofluoromethane (CFC-11), Tech. Rep., United Nations Environment Programme (UNEP), Nairobi, Kenya, ISBN 978-9966-076-78-6, 2019. a, b
Vollmer, M. K., Mühle, J., Trudinger, C. M., Rigby, M., Montzka, S. A., Harth, C. M., Miller, B. R., Henne, S., Krummel, P. B., Hall, B. D., Young, D., Kim, J., Arduini, J., Wenger, A., Yao, B., Reimann, S., O'Doherty, S., Maione, M., Etheridge, D. M., Li, S., Verdonik, D. P., Park, S., Dutton, G., Steele, L. P., Lunder, C. R., Rhee, T. S., Hermansen, O., Schmidbauer, N., Wang, R. H. J., Hill, M., Salameh, P. K., Langenfelds, R. L., Zhou, L., Blunier, T., Schwander, J., Elkins, J. W., Butler, J. H., Simmonds, P. G., Weiss, R. F., Prinn, R. G., and Fraser, P. J.: Atmospheric histories and global emissions of halons H-1211 (CBrClF2), H-1301 (CBrF3), and H-2402 (CBrF2CBrF2), J. Geophys. Res.-Atmos., 121, 3663–3686, https://doi.org/10.1002/2015JD024488, 2016. a
Walters, D. N., Williams, K. D., Boutle, I. A., Bushell, A. C., Edwards, J. M., Field, P. R., Lock, A. P., Morcrette, C. J., Stratton, R. A., Wilkinson, J. M., Willett, M. R., Bellouin, N., Bodas-Salcedo, A., Brooks, M. E., Copsey, D., Earnshaw, P. D., Hardiman, S. C., Harris, C. M., Levine, R. C., MacLachlan, C., Manners, J. C., Martin, G. M., Milton, S. F., Palmer, M. D., Roberts, M. J., Rodríguez, J. M., Tennant, W. J., and Vidale, P. L.: The Met Office Unified Model Global Atmosphere 4.0 and JULES Global Land 4.0 configurations, Geosci. Model Dev., 7, 361–386, https://doi.org/10.5194/gmd-7-361-2014, 2014. a
Western, L. M., Ramsden, A. E., Ganesan, A. L., Boesch, H., Parker, R. J., Scarpelli, T. R., Tunnicliffe, R. L., and Rigby, M.: Estimates of North African Methane Emissions from 2010 to 2017 Using GOSAT Observations, Environ. Sci. Technol. Lett., 8, 626–632, https://doi.org/10.1021/acs.estlett.1c00327, 2021. a, b