the Creative Commons Attribution 4.0 License.
the Creative Commons Attribution 4.0 License.
 | 29 Jun 2023
Insights into the size-resolved dust emission from field measurements in the Moroccan Sahara
Cristina González-Flórez
Martina Klose
Andrés Alastuey
Sylvain Dupont
Jerónimo Escribano
Vicken Etyemezian
Adolfo Gonzalez-Romero
Yue Huang
Konrad Kandler
George Nikolich
Agnesh Panta
Xavier Querol
Cristina Reche
Jesús Yus-Díez
Carlos Pérez García-Pando
The particle size distribution (PSD) of mineral dust has a strong effect on the impacts of dust on climate. However, our understanding of the emitted dust PSD, including its variability and the fraction of super-coarse dust (diameter >10 µm), remains limited. Here, we provide new insights into the size-resolved dust emission process based on a field campaign performed in the Moroccan Sahara in September 2019 in the context of the FRontiers in dust minerAloGical coMposition and its Effects upoN climaTe (FRAGMENT) project. The obtained dust concentration and diffusive flux PSDs show significant dependencies upon the friction velocity (u*), wind direction and type of event (regular events versus haboob events). For instance, the number fraction of sub-micrometre particles increases with u*, along with a large decrease in the mass fraction of super-coarse dust. We identify dry deposition, which is modulated by u* and fetch length, as a potential cause for this PSD variability. Using a resistance model constrained with field observations to estimate the dry deposition flux and thereby also the emitted dust flux, we show that deposition could represent up to ∼90 % of the emission of super-coarse particles (>10 µm) and up to ∼65 % of the emission of particles as small as ∼5 µm in diameter. Importantly, removing the deposition component significantly reduces the variability with u* in the PSD of the emitted dust flux compared with the diffusive flux, particularly for super-coarse dust. The differences between regular and haboob event concentration and diffusive flux PSDs are suspected to result from a smaller and variable dust source fetch during the haboob events, and/or an increased resistance of soil aggregates to fragmentation associated with the observed increase in relative humidity along the haboob outflow. Finally, compared to the invariant emitted dust flux PSD estimated based on brittle fragmentation theory, we obtain a substantially higher proportion of super-micrometre particles in the dust flux. Overall, our results suggest that dry deposition needs to be adequately considered to estimate the emitted PSD, even in studies limited to the fine and coarse size ranges (<10 µm).
- Article
(23724 KB) - Full-text XML
- Companion paper
-
Supplement
(37641 KB) - BibTeX
- EndNote


Mineral dust emitted by wind erosion from arid and semi-arid regions dominates the global aerosol mass load (Textor et al., 2006) and plays a key role in the Earth system by perturbing the energy, water, iron, phosphorous, and carbon cycles (Okin et al., 2004; Bristow et al., 2010; Shao et al., 2011b; Knippertz and Stuut, 2014; Jickells and Moore, 2015). The effects of dust aerosol are controlled by its amount and physico-chemical properties, i.e. particle size distribution (PSD), mineralogy, shape, and mixing state (Tegen and Lacis, 1996; Karanasiou et al., 2012; Huang et al., 2014; Miller et al., 2014).
Despite the progress achieved over the last decades, the size-resolved emitted dust flux and its spatio-temporal variability remain as key uncertainties in the description of the dust life cycle in atmospheric and Earth system models (Kok, 2011a; Evan et al., 2014; Adebiyi and Kok, 2020; Klose et al., 2021). Dust emission is complex: the most efficient release of dust particles is through saltation (Gillette, 1977; Gomes et al., 1990; Shao et al., 1993; Shao, 2008), which is – as with dust emission itself – modulated by soil properties (e.g. soil texture, mineralogical composition, presence and stability of aggregates), surface soil conditions (e.g. moisture, vegetation cover, crust, roughness), and land use (e.g. agriculture, grazing) (Tegen et al., 2002; Pierre et al., 2012; Perlwitz et al., 2015a, b; Klose et al., 2019). Current global quantitative knowledge of many of these factors is poor or nonexistent, which demands certain simplifications in model dust emission schemes.
The emitted dust PSD and its variability has attracted much attention over the last years (Alfaro et al., 1997; Fratini et al., 2007; Sow et al., 2009; Shao et al., 2011a; Kok, 2011a, b; Ishizuka et al., 2014; Khalfallah et al., 2020; Shao et al., 2020; Fernandes et al., 2020; Dupont, 2022). Constraining the PSD at emission is crucial as the residence time of dust particles in the atmosphere is strongly influenced by their size, with coarser particles falling out more quickly due to gravitational settling (Ryder et al., 2013). Dust emission is most efficiently generated by two mechanisms: saltation bombardment, whereby dust is ejected from soil aggregates upon being impacted by saltating particles, and aggregate disintegration, whereby dust is released from saltating soil aggregates (Shao et al., 1993; Alfaro et al., 1997; Shao, 2001). In the particle size range up to ∼10 µm in diameter, some theoretical frameworks predict a higher proportion of emitted fine particles with increasing wind speed during saltation along with dependencies of the PSD on soil properties (Shao et al., 1993; Alfaro et al., 1997; Shao, 2001). In contrast, the emitted PSD is posited to be relatively independent of wind speed and soil properties in another theoretical framework (Kok, 2011b) based on brittle fragmentation theory (BFT). The scarcity of data and the observational uncertainties further hamper robust conclusions about the potential variability of the emitted PSD. It has been argued that observed variations in the emitted PSD may be largely within the systematic errors among the experimental datasets (Kok et al., 2017). There is even more uncertainty in the emission of particles larger than 10 µm, whose contribution to transport and climate is thought to be underestimated (Kok, 2011a; Ryder et al., 2019; Adebiyi and Kok, 2020), due to (1) the lack of field data, (2) the limitations related to the inlets of optical particle counters and other aerosol samplers used for reference measurements, (3) the lower amount of particles (which increases uncertainties), and (4) the potential effect of dry deposition upon the calculated diffusive fluxes (Dupont et al., 2015; Fernandes et al., 2019; Adebiyi et al., 2023).
Most studies relate the diffusive flux PSD obtained at few metres above the surface to the emitted dust flux at the surface, assuming a constant dust flux layer and neglecting gravitational settling and turbulent dry deposition (Dupont et al., 2021). The gravitational settling term is assumed to be small for dust smaller than ∼10 µm (Fratini et al., 2007). The diffusive flux PSD is afterward used directly to constrain or evaluate dust emission schemes, or even to assess to what extent the emitted dust PSD may be affected by atmospheric forcing and soil properties, neglecting the deposition component of the net dust flux at the surface. However, using modelling, Dupont et al. (2015) and Fernandes et al. (2019) have shown the potentially large effect of dry deposition (including losses by turbulent and Brownian motion, and inertial impaction) upon the diffusive flux PSD.
Given the incompleteness of measurements and the apparent contradiction among theories, field observations, and wind tunnel experiments, the European Research Council project entitled FRontiers in dust minerAloGical coMposition and its Effects upoN climaTe (FRAGMENT) has conducted field campaigns in distinct desert dust source regions to better understand the size-resolved dust emission for a range of meteorological and soil conditions. The goal of FRAGMENT is to better understand dust emission, its mineralogical composition, and the effects of dust upon climate, by combining field measurements, laboratory analyses, remote and in situ spectroscopy, theory, and modelling. In this study, we provide new insights into the size-resolved dust emission and its variability using measurements collected during the first FRAGMENT field campaign that took place in the Moroccan Sahara in September 2019, taking advantage of the large number of dust events of varying intensity captured during this one-month measurement period.
The paper is structured as follows. Section 2 describes the field measurement site and the experimental set-up, along with the methodology used for calculating (1) the dynamical parameters characterizing key properties of the near-surface boundary layer, (2) the diffusive dust flux and its uncertainties, (3) the saltation flux, and (4) the sandblasting efficiency. It also describes the dry deposition resistance-based schemes used to further support our analysis of the variability in the dust PSDs and to estimate the emitted dust flux. Section 3 first overviews the atmospheric conditions and dust events measured during the campaign and provides a broad characterization of the saltation and diffusive fluxes, along with the associated sandblasting efficiencies. Then, a variety of aspects related to the dust PSD at emission and its variability are analysed and discussed, including the identification and removal of the anthropogenic aerosol influence, the differences between the concentration and diffusive flux PSDs and their dependencies upon friction velocity (u*) and wind direction, the PSD differences between two major types of events measured, the potential role of different mechanisms in the variability of the PSDs, the estimation of the emitted flux PSDs, and the comparison of our measured PSDs with BFT. Section 4 draws the main conclusions of the study and offers perspectives for future work.
2.1 The FRAGMENT dust field campaign in the Moroccan Sahara
The first FRAGMENT field campaign took place in September 2019 in a small ephemeral lake, locally named “L'Bour”, located in the Lower Drâa Valley of Morocco. L'Bour (29∘49′30′′ N, 5∘52′25′′ W) lies at the edge of the Saharan Desert, ∼15 km west of M'Hamid El Ghizlane, ∼70 km east of Lake Iriki, ∼50 km east of the Erg Chigaga dune field, ∼1.5 km north of the dry Drâa river, ∼30 km north of the Moroccan–Algerian border, and ∼25 km south of the Jbel Hassan Brahim mountain range (840 ) (Fig. 1a, b and c). We chose the location and time period of the campaign based on the analysis of remote sensing data (Ginoux et al., 2010), in situ inspection, and local advice, considering both scientific criteria and logistic aspects such as accessibility.
L'Bour is approximately flat and devoid of vegetation or other obstacles within a radius of ∼1 km around our measurement location. Small sand dune fields surround the lake, and dunes south of the site were accompanied by some vegetation and shrubs during the campaign. The surface of L'Bour consists of a smooth hard crust (hereafter referred to as paved sediment) mostly resulting from drying and aeolian erosion of paleo-sediments (González-Romero et al., 2023). In Fig. S1 in the Supplement, we include a close-up of a small dune and the lake's paved sediment surface, along with their respective PSDs analysed using dry dispersion (minimally dispersed) and wet dispersion (fully dispersed) techniques (González-Romero et al., 2023). The paved sediment PSDs exhibit two prominent modes peaking at ∼100 µm and ∼10 µm. The fully dispersed PSD of the paved sediment shows disaggregation of silt aggregates observed at sand sizes in the minimally dispersed PSD. The sand dune PSDs display a dominant mode ranging between ∼50 and ∼400 µm, peaking at ∼150 µm, and contain only a small fraction of particles smaller than 50 µm. The fully dispersed PSD of the sand dune shows disaggregation of clay aggregates observed at silt sizes in the minimally dispersed PSD. The volume median diameter of sand dune particles (and therefore of the saltators) for minimally and fully dispersed techniques are 132.2 and 137.6 µm, respectively. According to the fully dispersed PSD, the texture of the surface paved sediment is loam (McKee, 1983). During the campaign, we did not observe any substantial change in the paved sediment. We observed some growth of vegetation in nearby areas, particularly to the south, after a flooding event that took place during the night of 6 September. The flooding, which did not affect our site, was caused by a convective storm that produced heavy rain upstream of the Drâa river and whose cold pool outflow generated a strong “haboob” dust storm that passed our site (see Sect. 3.1).
L'Bour is surrounded by other dust sources in all directions, including dunes concentrated in small flat areas and other ephemeral lakes such as Iriki and Erg Smar (Fig. 1c). Therefore, the fetch length (i.e. the distance between the measurement location and the upwind border of the source area Dupont et al., 2021) is not limited to the dimensions of L'Bour. We estimate long fetches of about 60 and 10 km in the western and eastern predominant wind directions, respectively, which are approximately parallel to the Drâa river bed and perpendicular to the alignment of our instruments (Fig. 1d), as described in Sect. 2.2.
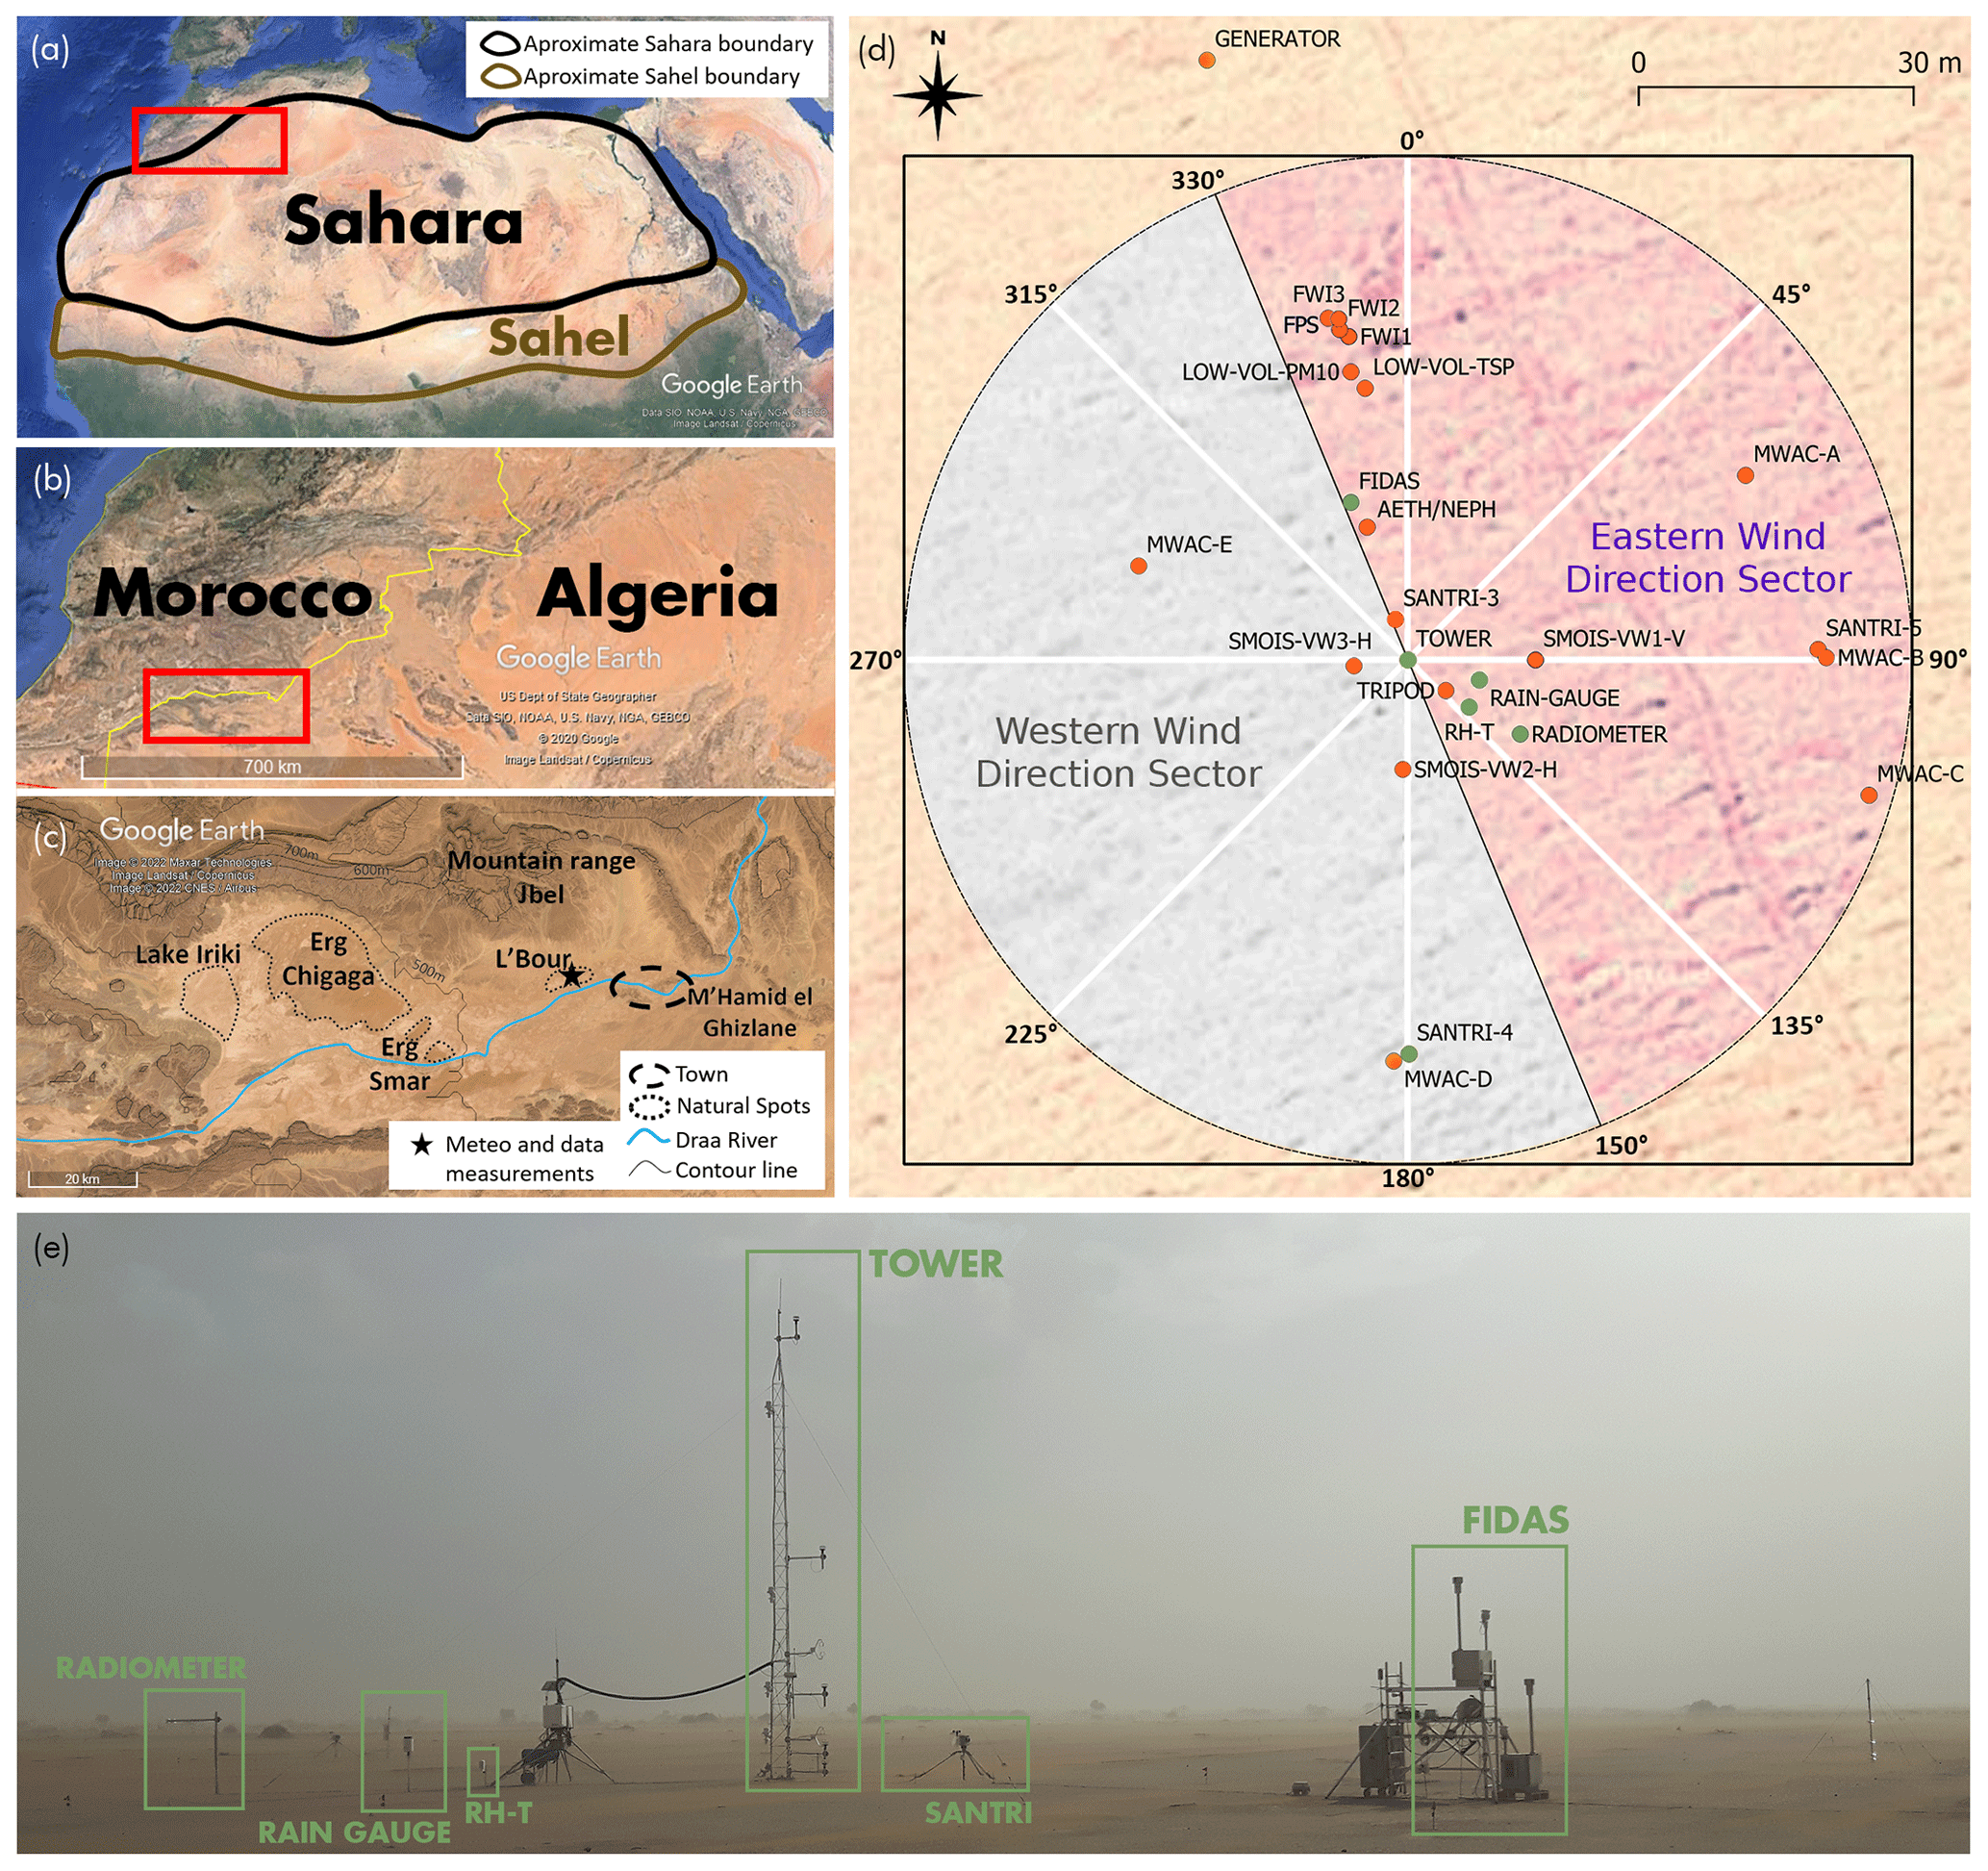
Figure 1(a) Location of the study area in northern Africa. (b) Zoomed-in view over Morocco and Algeria. (c) Zoomed-in view over the Lower Drâa Valley. (d) Experimental set-up in “L'Bour” (Morocco). The diagonal black line is perpendicular to the approximate predominant wind direction estimated based on prior data analysis. Green circles highlight the instruments used for this paper: TOWER (meteorological tower equipped with five 2-D sonic anemometers and four aspirated shield temperature sensors), FIDAS (two Fidas optical particle counters at 1.8 and 3.5 m height, respectively), RAIN GAUGE, RADIOMETER (four-component net radiometer), RH-T (temperature and relative humidity probe at 0.5 m), and SANTRI-4 (size-resolved saltation particle counter). Red circles indicate instruments not used in this study but discussed in companion papers: FWI1, FWI2, and FWI3 (free-wing impactors); FPS (flat-plate deposition sampler); LOW-VOL-PM10 and LOW-VOL-TSP (low-volume samplers); AETH/NEPH (multi-wavelength aethalometer and polar nephelometer); MWAC (modified Wilson and Cook samplers); SMOIS (soil moisture sensors); and TRIPOD (pressure and data loggers). (e) Picture of the main instruments as deployed in the field.
2.2 Field measurements
The site layout is shown in Fig. 1d and e. The alignment of the instruments was informed by prior analyses of nearby automated weather stations maintained by the IMPETUS and FENNEC projects (Schulz and Judex, 2008; Hobby et al., 2013), the enerMENA initiative (Schüler et al., 2016), and ERA5 and ERA-Interim wind reanalysis, which suggested a southwesterly predominant wind direction. To avoid shadowing between instruments as much as possible, instruments were aligned roughly perpendicular to this predominant wind direction. Below we describe only the instruments and measurements used in this paper. Measurements performed during the campaign with other instruments displayed in Fig. 1d are discussed in companion papers (e.g. Panta et al., 2023; Yus-Díez et al., 2023).
2.2.1 Meteorological measurements
At the centre of the experimental site (Fig. 1d) we deployed a 10 m meteorological tower equipped with five 2-D sonic anemometers (Campbell Scientific WINDSONIC4-L) at 0.4, 0.8, 2, 5, and 10 m height and four aspirated shield temperature sensors (Campbell Scientific 43502 fan-aspirated shield with a 43347 RTD temperature probe) at 1, 2, 4, and 8 m height to measure wind and temperature profiles, respectively (Fig. 1e). Wind measurements were recorded every 2 s and temperature every 1 s. We also placed two 3-D sonic anemometers measuring at 50 Hz at 1 and 3 m height that are not used in this paper. All anemometers were oriented toward the north using a magnetic compass. A site-specific correction for magnetic declination using the International Geomagnetic Reference Field (IGFR) model (1590–2024) was applied as a post-processing, which translated into a anticlockwise adjustment of ∼1 ∘ to the measured wind direction respective to the true north. In the vicinity of the tower, we installed a Young tipping bucket rain gauge (Campbell Scientific 52203 unheated Rain Gauge) at 1 m height, a four-component net radiometer (Campbell Scientific NR01-L radiometer) measuring short-wave and long-wave upwelling and downwelling radiative fluxes at 1.5 m, and a temperature and relative humidity probe (Campbell Scientific HC2A-S3) at 0.5 m (Fig. 1e). Pressure was recorded inside the data logger cabinet in a tripod near the tower.
The time series of the measurements described above were inspected in order to detect and remove invalid values. Most of them corresponded to periods of testing at the beginning of the campaign or instrument cleaning and were identified and deleted manually. We averaged all meteorological variables over 15 min intervals, consistent with the time averaging chosen to compute the dynamical parameters characterizing the near-surface boundary layer (see Sect. 2.3.1). This averaging time has been shown to account for all significant turbulent structures carrying momentum flux (Dupont et al., 2018).
2.2.2 Size-resolved dust concentration measurements
At a distance of ∼18 m from the tower, we placed two Fidas 200S (Palas GmbH) optical particle counters (OPCs) on a scaffolding (Fig. 1e) at 1.8 m (referred to as FidasL) and 3.5 m height (FidasU) from which we calculate the diffusive dust flux (see Sect. 2.3.2). We recorded 2 min average number concentrations of suspended dust in 63 diameter size bins of equal logarithmic width between 0.2 and 19.1 µm that were averaged over 15 min for analysis (Sect. 3.1). Afterward, the 15 min concentration PSDs were averaged over u* intervals (Sect. 3.3). Data from the first three bins were not used as they showed an unrealistic abrupt descent of the concentration (border measurement limitations). Therefore, we considered the Fidas to be efficient from the fourth bin (from 0.25 µm). The sampling system of the Fidas operates with a volume flow of 4.8 L min−1 and is equipped with a Sigma-2 sampling head (manufacturer Palas GmbH). The Sigma-2 sampler has been validated by the Association of German Engineers (VDI-2119, 2013) and tested in various studies, concluding that it is a reliable collector for coarse and super-coarse particles (Dietze et al., 2006; Tian et al., 2017; Waza et al., 2019; Rausch et al., 2022). The Sigma-2 head ensures a wind-sheltered, low-turbulence air volume inside the sampler (Tian et al., 2017), but the sampling efficiency as function of wind speed and particle size has not been quantified. However, it has been shown to be largely insensitive to wind intensity at least up to ∼6m s−1 in the PM10 range (Waza et al., 2019). The inlet includes a drying line (Intelligent Aerosol Drying System, IADS, Palas GmbH), connecting the sampling head to the control unit, whose temperature is regulated according to the ambient temperature and humidity, avoiding condensation effects. Moisture compensation is guaranteed through a dynamic adjustment of the IADS temperature up to a maximum heat capacity of 90 W. Unlike most of the meteorological instruments that were connected to a battery, the two Fidas depended exclusively on the generator. Therefore, there were some gaps in the time series associated with generator maintenance periods and some short power outages.
The two Fidas were calibrated in the field at the start of the campaign using monodisperse (non-absorbing) polystyrene latex spheres (PSLs). Therefore, the (default) optical diameters typically used to report the PSDs obtained with OPCs are diameters of PSLs that produce the same scattered light intensity as the measured dust particles. As in the majority of previous studies (e.g. Fratini et al., 2007; Sow et al., 2009; Shao et al., 2011a; Ishizuka et al., 2014; Dupont et al., 2021), we use optical diameters to analyse the PSDs and their variability throughout most of this paper. We also compare these “optical diameter” PSDs with the theoretical framework from Kok (2011a), based on BFT, where the emitted dust PSD is derived by analogy to the fragmentation of brittle materials such as glass spheres constrained by PSD measurements unharmonized in terms of diameter type. Since dust is aspherical and light-absorbing, we additionally provide a synthesis of our results after transforming our optical diameters into dust geometric diameters assuming a more realistic shape and composition. The geometric or volume-equivalent diameter is the diameter type used in dust modelling and it refers to the diameter of a sphere with the same volume as the aspherical particle. In this way, our results can also be compared with an updated version of BFT that accounts more realistically for super-coarse dust emission (Meng et al., 2022) and that was constrained with measured PSDs harmonized to dust geometric diameters assuming tri-axial ellipsoids (Huang et al., 2021).
We transform the default PSL diameters into dust geometric diameters following Huang et al. (2021), which involves calculating the theoretical scattered intensities of the PSLs and the aspherical dust. Following this, the comparison of both scattered intensities allows remapping the PSL into dust geometric diameters if both functions are monotonic with diameter. The calculation of the scattered intensity depends in the first order on the wavelength of the light beam used in the OPC, the scattering angle range of the OPC's light sensor, and the shape and refractive index of the particles, which are specified in Appendix A. Figure S2 compares the obtained geometric diameters with the default optical diameters. Based on our transformation, the optical diameters overestimate the dust diameters between ∼0.5 and ∼13 µm and underestimate them at finer and coarser sizes due to the combined effects of dust refractive index and asphericity.
At the end of the campaign, the two Fidas were placed at the same height (1.8 m) for inter-calibration. Appendix B describes the corrections applied to FidasU in order to remove the systematic concentration differences between both OPCs.
2.2.3 Saltation flux measurements
Time- and size-resolved saltation counts were measured with three SANTRI (Standalone AeoliaN Transport Real-time Instrument) platforms (Etyemezian et al., 2017; Goossens et al., 2018). Two SANTRIs (SANTRI-4 and SANTRI-5 in Fig. 1d) consisted of duplicate optical gate devices (OGDs, Etyemezian et al., 2017) at 5 cm height, single OGDs at 15 and 30 cm heights, and a cup anemometer and wind vane at ∼1.1 m height and measured at 1 s intervals. Saltation counts were recorded in 7 size bins, whose lower and upper diameter limits were calculated from the recorded sensor reference voltage levels. The two bins with the smallest and largest diameters, respectively, were excluded from further analysis due to a large noise level for the former and an absent upper diameter limit for the latter. On average, the remaining size range extended roughly from 85 to 450 µm in diameter. A third SANTRI (SANTRI-3 in Fig. 1d) collected data from two OGDs at multiple kilohertz frequencies but is not analysed here. Due to technical issues with SANTRI-5, results presented here will focus on SANTRI-4 using the front one of the two bottom sensors together with the upper ones.
2.3 Inferred quantities
2.3.1 Dynamical parameters characterizing the near-surface boundary layer
Monin–Obukhov similarity theory (Monin and Obukhov, 1954) allows for describing the vertical profiles of some variables (e.g. wind speed or temperature) as a function of dimensionless groups. In aeolian erosion studies, u* is a key parameter that represents the surface wind shear stress. In this study, u* is calculated from the law of the wall approach, which assumes a logarithmic or pseudo-logarithmic form (for non-neutral atmospheric stability conditions) of the mean wind velocity profile within the surface layer (e.g. Stull, 1988; Kaimal and Finnigan, 1994; Arya, 2001; Foken and Napo, 2008; Shao, 2008)
where denotes the mean horizontal wind speed at height z, κ=0.4 is the von Karman constant, z0 is the aerodynamic roughness length, and , where Φm is the similarity function for momentum, L is the Obukhov length, , and .
Here, we use
with and (Benoit, 1977; Högström, 1988).
The Obukhov length (L) can be derived as follows (Foken and Napo, 2008):
where θr is a reference potential temperature, g=9.81 m s−2 is the gravitational acceleration and is the surface kinematic heat flux. Heat flux ( with air density ρair and specific heat capacity of air at constant pressure cp=1004 ) can be also estimated from the bulk aerodynamic formulation for the sensible heat flux (e.g. Shao, 2008; Klose et al., 2019)
where Tr is the temperature at reference height zr, T0 the soil surface temperature and the bulk aerodynamic resistance between z0 and zr, with ur the wind at reference height and (e.g. Stull, 1988; Arya, 2001) the bulk heat transfer coefficient, where and Φh is the similarity function for sensible heat. Here, we use
, with and (Benoit, 1977; Högström, 1988).
Therefore, , needed for calculating L, can be inferred from Eq. (4). We chose 2 m as the reference height zr because at this height we had both temperature and wind measurements. T0 was obtained from radiometer measurements of surface longwave radiative flux, and ρair was determined from relative humidity and temperature measurements at 0.5 m height and pressure at 1.5 m height by making use of Tetens' formula (Tetens, 1930) and the ideal gas law (e.g. Stull, 1988).
Applying a linear regression based on Eq. (1), we obtain
where m and n are the slope and intercept of the linear regression, respectively. Thus, and . An iterative procedure was performed to deduce u*, z0, and L for every 15 min period. This iterative procedure assumes neutral conditions as a first guess and then corrects for stability using the expressions shown before. As in previous studies, this procedure was applied only when wind increased with height and for wind speeds at 2 m height larger than ∼1 m s−1 (Marticorena et al., 2006; Khalfallah et al., 2020). In addition, results were only considered when the difference between the computed and measured wind profile was less than 10 % and when the resulting dimensionless height was in the range . This is the range for which Monin–Obukhov theory seems to be valid (Kramm et al., 2013). The threshold friction velocity (u*th), i.e. the minimum friction velocity required to initiate movement of soil particles, is inferred from fitting the saltation flux versus wind shear stress τ (see details in Sect. S3).
2.3.2 Size-resolved (flux gradient) diffusive dust flux
We estimate the near-surface vertical diffusive flux, F, using the flux gradient method (Gillette et al., 1972). This approach, by analogy with Fick's law for molecular diffusion, assumes that the diffusive dust flux is proportional to the vertical gradient of the local mean dust concentration, c, where the dust eddy diffusion coefficient, Kd, is the constant of proportionality. Thermal stratification effects are accounted for following the Monin–Obukhov theory (Monin and Obukhov, 1954) through the similarity function for dust Φd, that translates into an adjustment of Kd. This yields
Similar to Eq. (7), the momentum flux can be expressed proportionally to the vertical gradient of the horizontal wind speed u as
where Km is the momentum eddy diffusion coefficient and Φm is the similarity function for momentum. We estimated trajectory crossing effects (Csanady, 1963; Shao et al., 2011a) to be negligible for particle diameters smaller than 20 µm. Therefore, we assumed that Km and Kd were equivalent, the turbulent Schmidt number , and Φm=Φd. If a constant momentum flux layer is also assumed, then . Dividing Eqs. (7) and (8), taking into account these assumptions and substituting from Eq. (1), we obtain the widely used expression proposed in Gillette et al. (1972)
where and are the number concentrations of dust particles with diameter Di measured by the two Fidas at zu=3.5 m and zl=1.8 m in bin i. Note that the FidasU concentrations include the systematic corrections derived from the intercomparison of the two Fidas by the end of the campaign (see Appendix B).
Equation (9) is applied to each of the 63 size intervals of the Fidas using 15 min average concentrations. Thus, the total number and mass diffusive fluxes are obtained by summing over all size bins. The mass flux in each bin is inferred from its respective number flux as
where is the mean logarithmic diameter in bin number i, dmax and dmin are the minimum and maximum particle diameters of bin i, Fn(Di) and Fm(Di) are the 15 min averaged number and mass diffusive fluxes with diameter Di, and ρd is the dust particle density, which we assume to be 2500 kg m−3 (Fratini et al., 2007; Reid et al., 2008; Kaaden et al., 2009; Sow et al., 2009; Kok et al., 2021). All diameters can be either the default optical or the obtained geometric ones.
All calculations are performed using the original size bins of the Fidas (63 bins ranging from 0.2 to 19.1 µm). However, such a high bin resolution leads to substantial noise in the coarse and super-coarse bins of the mass PSDs. Therefore, we integrated the 63-bin PSDs into 16 bins to represent the mass concentration and number and mass diffusive flux PSDs. The size-resolved diffusive flux can exhibit positive and negative values, with the former representing an upward (net emission) flux and the latter a downward (net deposition) flux. Well-developed erosion conditions are normally characterized by positive fluxes. For this reason, when analysing the diffusive flux PSDs we excluded those PSDs containing at least one negative value in all the integrated number or mass bins with Di>0.42 µm, where the anthropogenic aerosol influence is shown to be negligible (see Sect. 3.3.1).
The calculation of the uncertainty of each 15 min size-resolved diffusive flux is described in Appendix C. In Sect. 3.3 we analyse the 15 min diffusive flux PSDs averaged over u* intervals along with their uncertainties. The average total uncertainty for each u* interval is calculated as the square root of the quadratic sum of the standard error and the average diffusive flux uncertainty within each u* interval. The average diffusive flux uncertainty for each u* () is calculated as follows:
where is the uncertainty of each 15 min size-resolved diffusive flux in the u* interval, N is the number of 15 min measurements in the u* interval, i is the size bin, and j is the measurement time index within each u* interval.
2.3.3 Saltation flux and sandblasting efficiency
The total streamwise saltation flux, Q, is defined as the vertical integral of the height-dependent streamwise saltation flux densities derived from the measured saltation counts. Q was calculated as described in Klose et al. (2019), assuming an exponentially decreasing vertical profile of saltation flux density and using least-squares curve fitting for the three measurement heights. Profiles with coefficients of determination R2<0.5 were excluded. Of the remaining profiles, more than 99 % have R2>0.95 and more than 98 % have R2>0.99. Sandblasting efficiency, α, is defined as the ratio of total vertical (diffusive) dust flux to horizontal (saltation) flux in mass, . When calculating α, we excluded the vertical flux measurements in which either the net flux was negative or any of the integrated mass and number bins where Di>0.42 µm was negative.
2.4 Estimation of the size-resolved dry deposition and emitted fluxes
Most studies have traditionally assumed that the diffusive flux PSD obtained a few metres above the surface is equivalent to the emitted dust PSD at the surface, neglecting the gravitational settling and the turbulent dry deposition flux. Considering the schematic shown in Fig. 2, the emitted flux (Femi) can be estimated as the diffusive flux (F) plus the gravitational settling (Fg) at the intermediate level between the two Fidas minus the dry deposition flux at the surface (Fdep):
where vdep is the dry deposition velocity, vg is the gravitational settling velocity, cint is the concentration at the intermediate height between the two Fidas, and Di is the mean logarithmic diameter of each bin i. The gravitational settling velocity is calculated as where Cc is the Cunningham slip correction factor, is the air kinematic viscosity and is the particle-to-air density ratio. Note that this expression assumes a Stokes regime, which is applicable to particles with Di∼10 µm or less.
The dry deposition velocity vdep(Di) can be calculated as the sum of the diffusive dry deposition velocity, vdiff(Di), and vg(Di). We obtain vdiff(Di) for each 15 min period as ) (Junge, 1963; Shao, 2008; Bergametti et al., 2018). vdiff(Di) is positive when downward, so the diffusive flux in integrated size bin resolution F(Di) must be negative. Due to the presence of dust emission, these observation-based estimates of vdep must be restricted to periods when dust emission is negligible, i.e. for .
In the absence of observation-based vdep(Di) during wind erosion conditions (), we use resistance-based dry deposition velocity parameterizations, which are typically used in dust transport models, to estimate vdep(Di) for all u* values. We first evaluate two different parameterizations (Zhang et al., 2001; Fernandes et al., 2019), described in Appendix D, with our observation-based estimates. Given that the parameterizations severely underestimate vdep(Di), we update the parameterization of Zhang et al. (2001) based on Zhang and Shao (2014) (see Appendix D) and tune key parameters and processes within the parameterization to fit the observation-based estimates for . This tuned parameterization is used to estimate the dry deposition flux, which is then used to estimate the emitted dust flux for all u* conditions using Eq. (12).
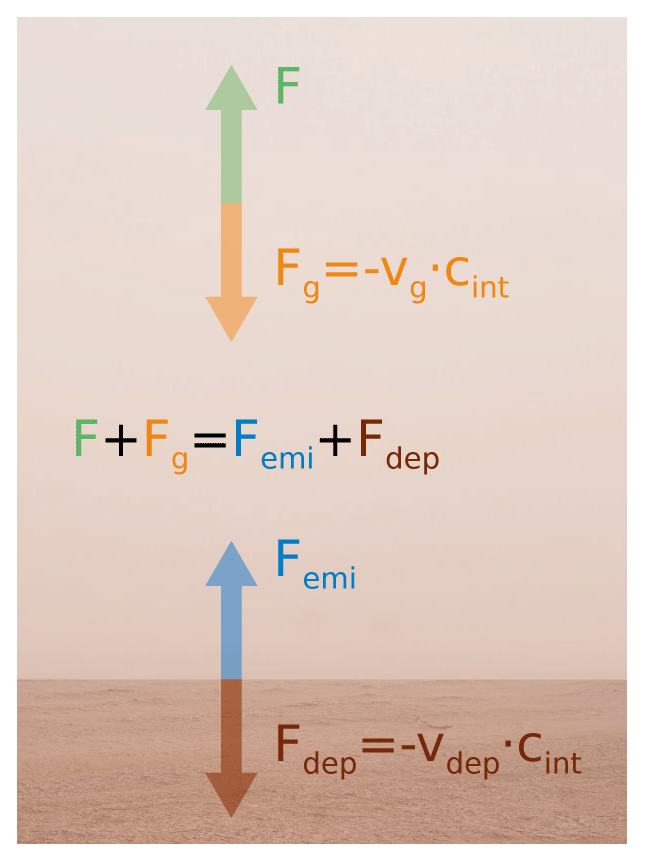
Figure 2Schematic representation of the surface and near-surface fluxes, where F and Fg are the diffusive flux and the gravitational settling flux a few metres above the surface, respectively, and Femi and Fdep are the emitted flux and the dry deposition flux at the surface, respectively.
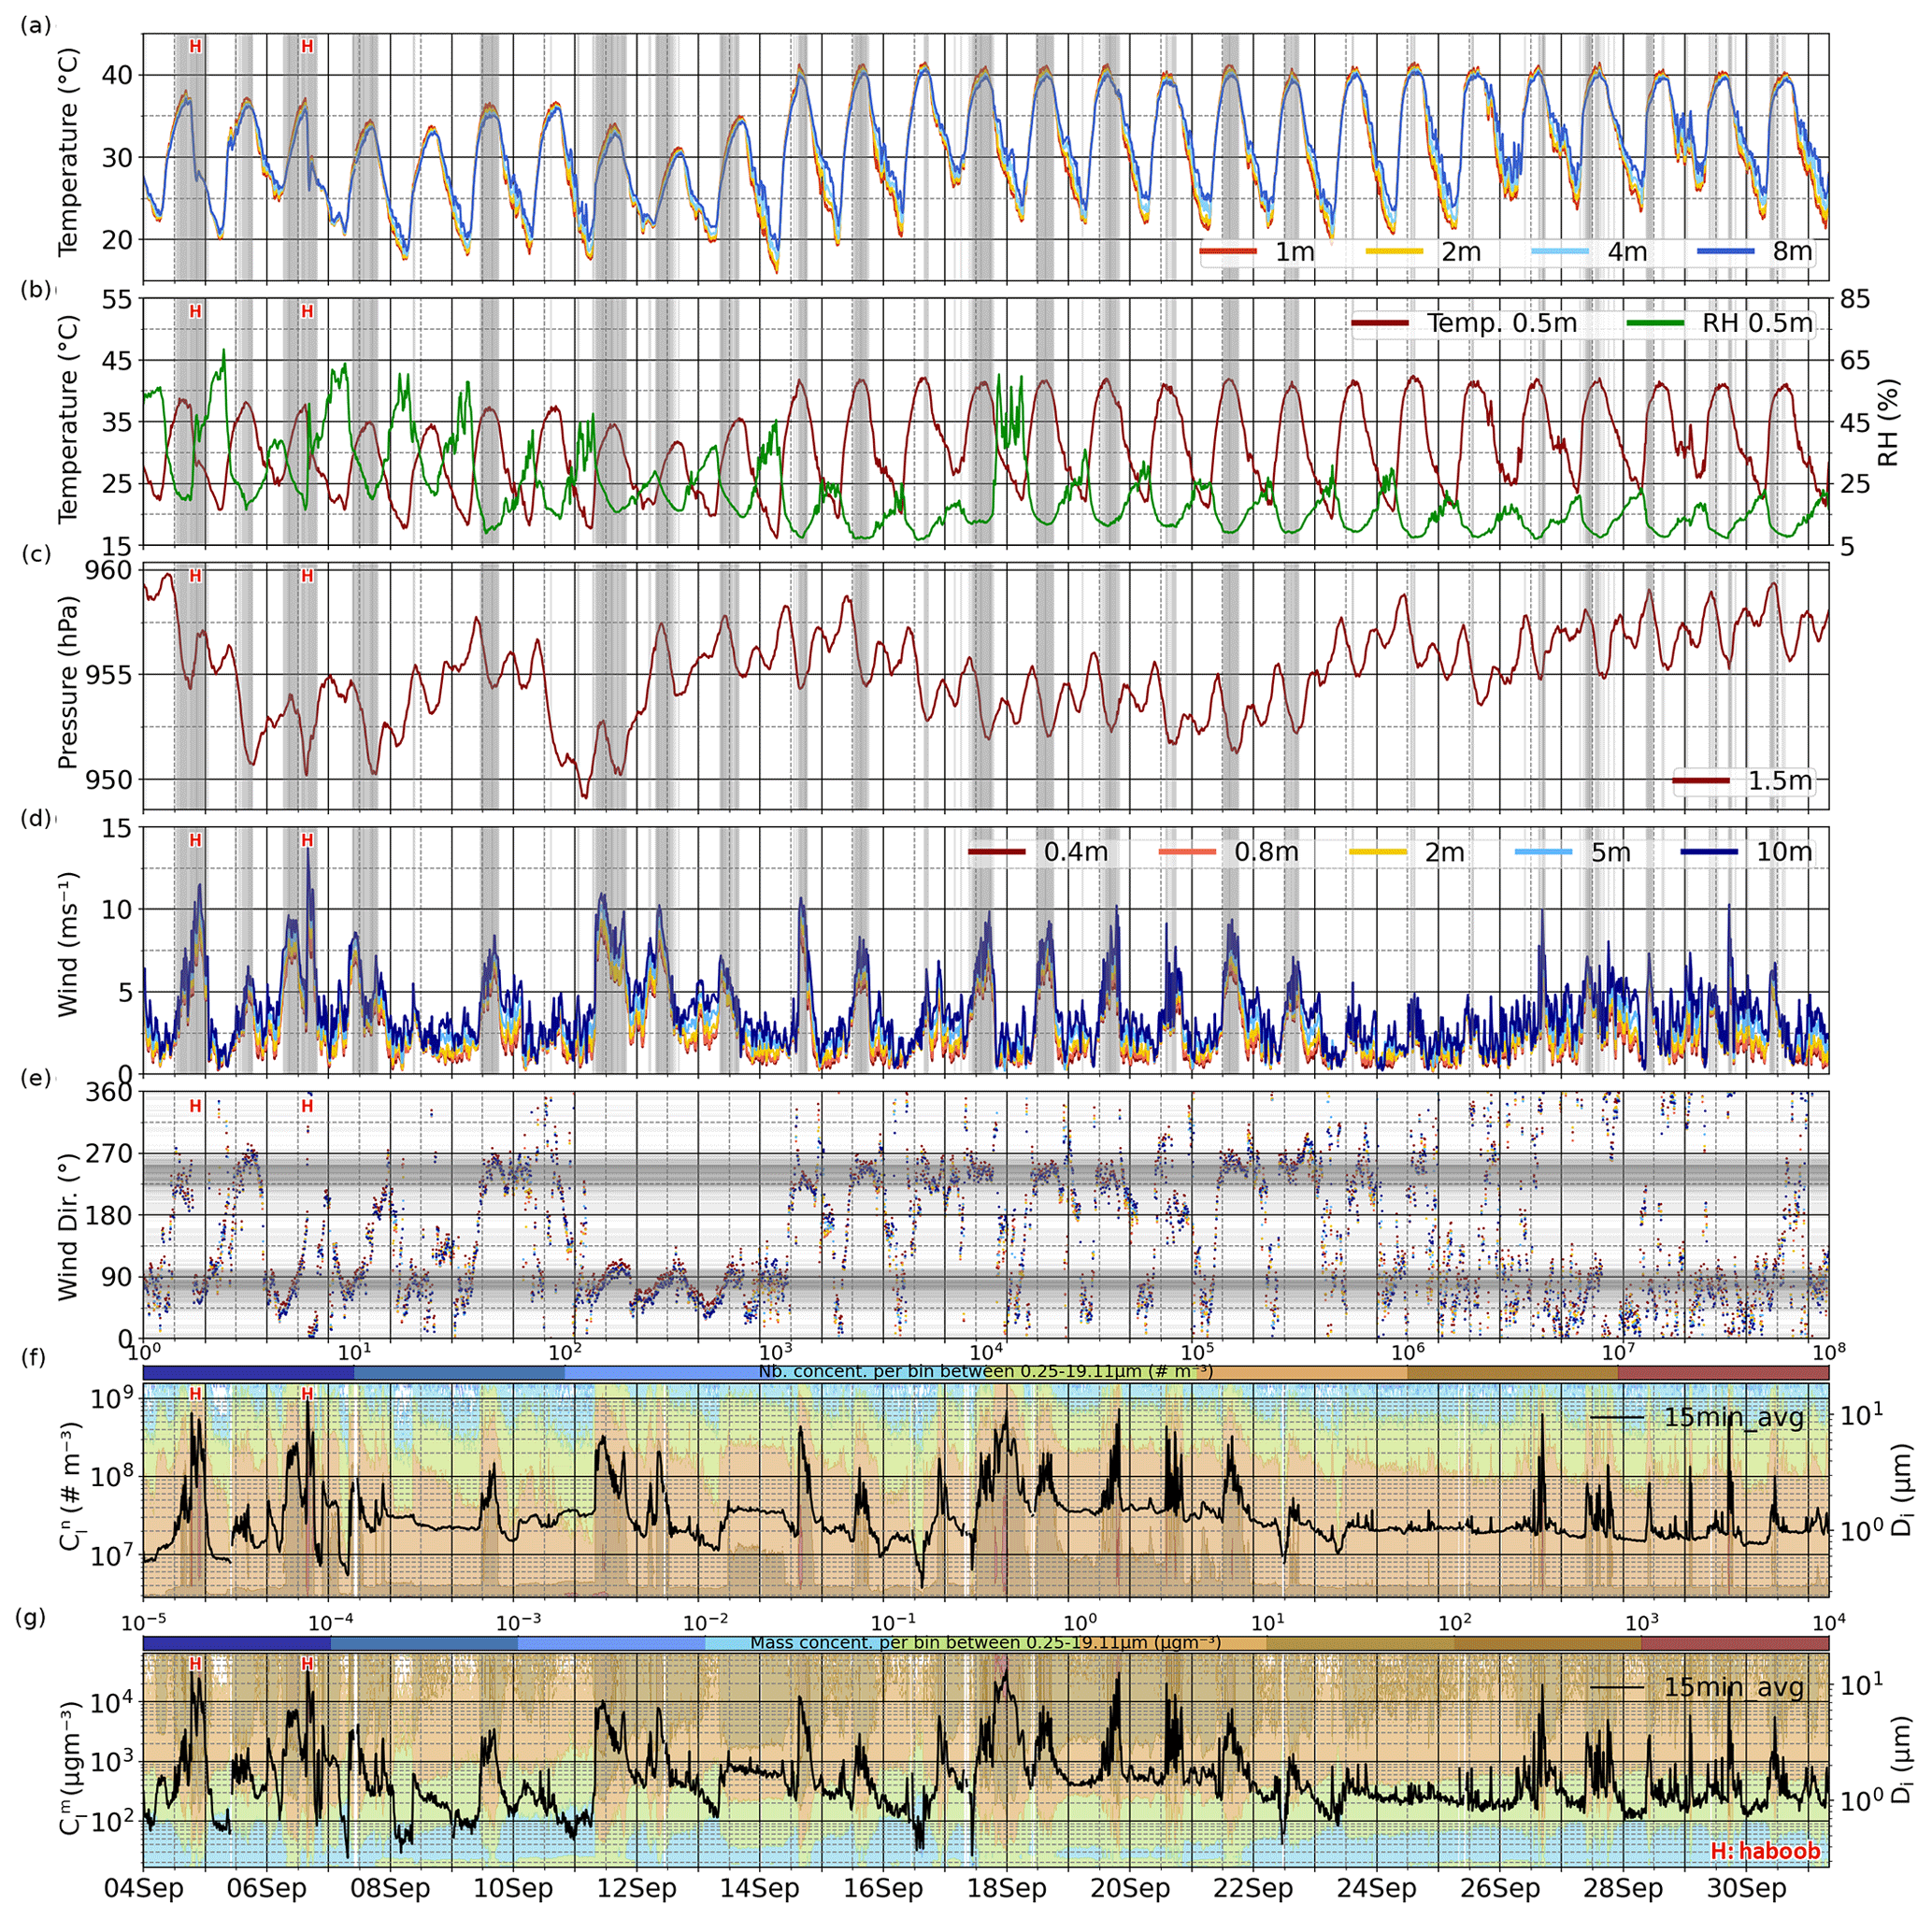
Figure 3Time series (UTC) of 15 min average (a) temperature (∘C) at 1, 2, 4, and 8 m; (b) relative humidity (%) and temperature (∘C) at 0.5 m; (c) pressure (hPa) at 1.5 m; (d) mean wind speed (m s−1) and (e) mean wind direction (∘) at 0.4, 0.8, 2, 5, and 10 m; (f) FidasL (1.8 m) particle concentrations in number (m−3); and (g) in mass (µg m−3). In (f) and (g) the total concentrations are represented as lines (left y axis), whereas size-resolved concentrations are shown as colour contours (right y axis) in the original size bin resolution. Vertical grey lines in (a)–(d) and horizontal grey lines in (e) highlight, respectively, periods and wind directions for which . The time series of u* is depicted in Fig. 4a.
3.1 Overview of the atmospheric conditions and dust events during the campaign
Times series of measured atmospheric conditions and near-surface dust concentrations are displayed in Fig. 3; u* and atmospheric stability, along with saltation and diffusive fluxes, are displayed in Fig. 4. As expected, the diurnal cycles of temperature and relative humidity are anti-correlated (Fig. 3b), and temperature inversions (Fig. 3a), along with atmospheric stability (Fig. 4b), are prevalent during nighttime. Temperature at 2 m ranges from slightly less than 20 ∘C during the night to up to ∼40 ∘C during the day, and surface relative humidity ranges from as low as 6 % during the day to up to ∼65 % during the night. There is a shift after 14 September, with substantial increases in temperature and decreases in relative humidity, with the exception of 17–18 September, when relative humidity appears to be temporarily high.
The diurnal cycles of surface wind (Fig. 3d) and u* (Fig. 4a), along with the associated cycles of saltation and diffusive fluxes (Fig. 4c, d and e) and dust concentration (Fig. 3f and g), are generally associated to the diurnal cycle of solar heating. In the early morning, as the surface starts to warm and releases turbulent sensible heat, the lower atmosphere becomes unstable. As the day evolves, momentum is mixed downward from the stronger winds aloft increasing wind speed and u*, while stability progressively tends towards neutrality (Fig. 4b). Winds are generally channelled through the valley, broadly parallel to the Drâa river, alternating between two opposite and preferential wind directions, centred around 80 and 240 ∘ (Fig. 3e). The distribution of wind direction and u* during the campaign is shown in Fig. S4. We refer to the dust events associated to these recurring diurnal cycles as “regular” events, for which maximum winds at 10 m can reach 15 min average values up to ∼11 m s−1 (Fig. 3d). From 22 to 25 September winds remain relatively calm, and after 25 September diurnal cycles are less marked and dust events are more intermittent and short-lived.
In addition to these regular events, we also captured two strong cold pool outflows (hereafter referred to as “haboob” events) in the evening of 4 September and in the afternoon of 6 September, both marked with a red “H” in Figs. 3 and 4. Cold pool outflows result from density currents created by latent heat exchange of evaporating rain in deep convective downdrafts. The arrival of sharply defined dust walls, caused by the gust fronts at the leading edge of the outflow winds, were not only directly witnessed by the field campaign team but can be also clearly detected in the measurements. As a video supplement we provide a 1 min frequency time-lapse video recorded from the Fidas location during 6 September, which clearly shows the arrival of the haboob in the afternoon. Both haboob events are characterized by the highest 10 m winds recorded during the campaign (15 min averages of ∼11.5 and ∼14 m s−1, respectively) and unusually fast changes in atmospheric conditions with values consistent with previous haboob studies (Miller et al., 2008): sudden increases in wind speed, decreases in 2 m temperature of ∼8–9 ∘C, increases in relative humidity of ∼24 %–32 %, and a rise of ∼2 hPa in surface pressure (Fig. 3c). During these events, precipitation was not detected by our rain gauge, but during the night of 6 September there was water flowing downriver, which caused flooding of large areas in the vicinity of our lake on the next day (not affecting the lake itself), suggesting that heavy showers occurred over the mountain range to the north of our location (Fig. 1c).
Dust concentration (Fig. 3f and g) exhibits peaks of varying intensity about every ∼1–2 d, consistent with the wind speed and u* patterns. Number and mass concentrations were 5×10⁷ m−3 and 1243 µg m−3 on average, respectively, and there were 10 d when the 15 min dust mass concentration exceeded 104 µg m−3. As expected for dust, the number concentration was dominated by fine particles, and the mass concentration was dominated by coarse and super-coarse dust. Dust concentration is generally correlated with saltation (Fig. 4c) and diffusive fluxes (Fig. 4d and e), with the notable exception of an event that extends over the evening of 17 September and the morning of 18 September. During this event, concentrations reached values that are among the highest recorded during the campaign (Fig. 3f and g), although winds were low (Fig. 3d), saltation was absent (Fig. 4c), and diffusive fluxes were negative (note that negative fluxes are not represented in Fig. 4d and e). The latter implies that dust was transported from elsewhere and deposited, but it was not emitted from our site. Given that convective storms were spotted from a distance during that evening and the event was characterized by high relative humidity values (Fig. 3b), we hypothesize that those highly dust-loaded air masses that slowly and persistently reached our site were generated by precedent haboob activity upwind.
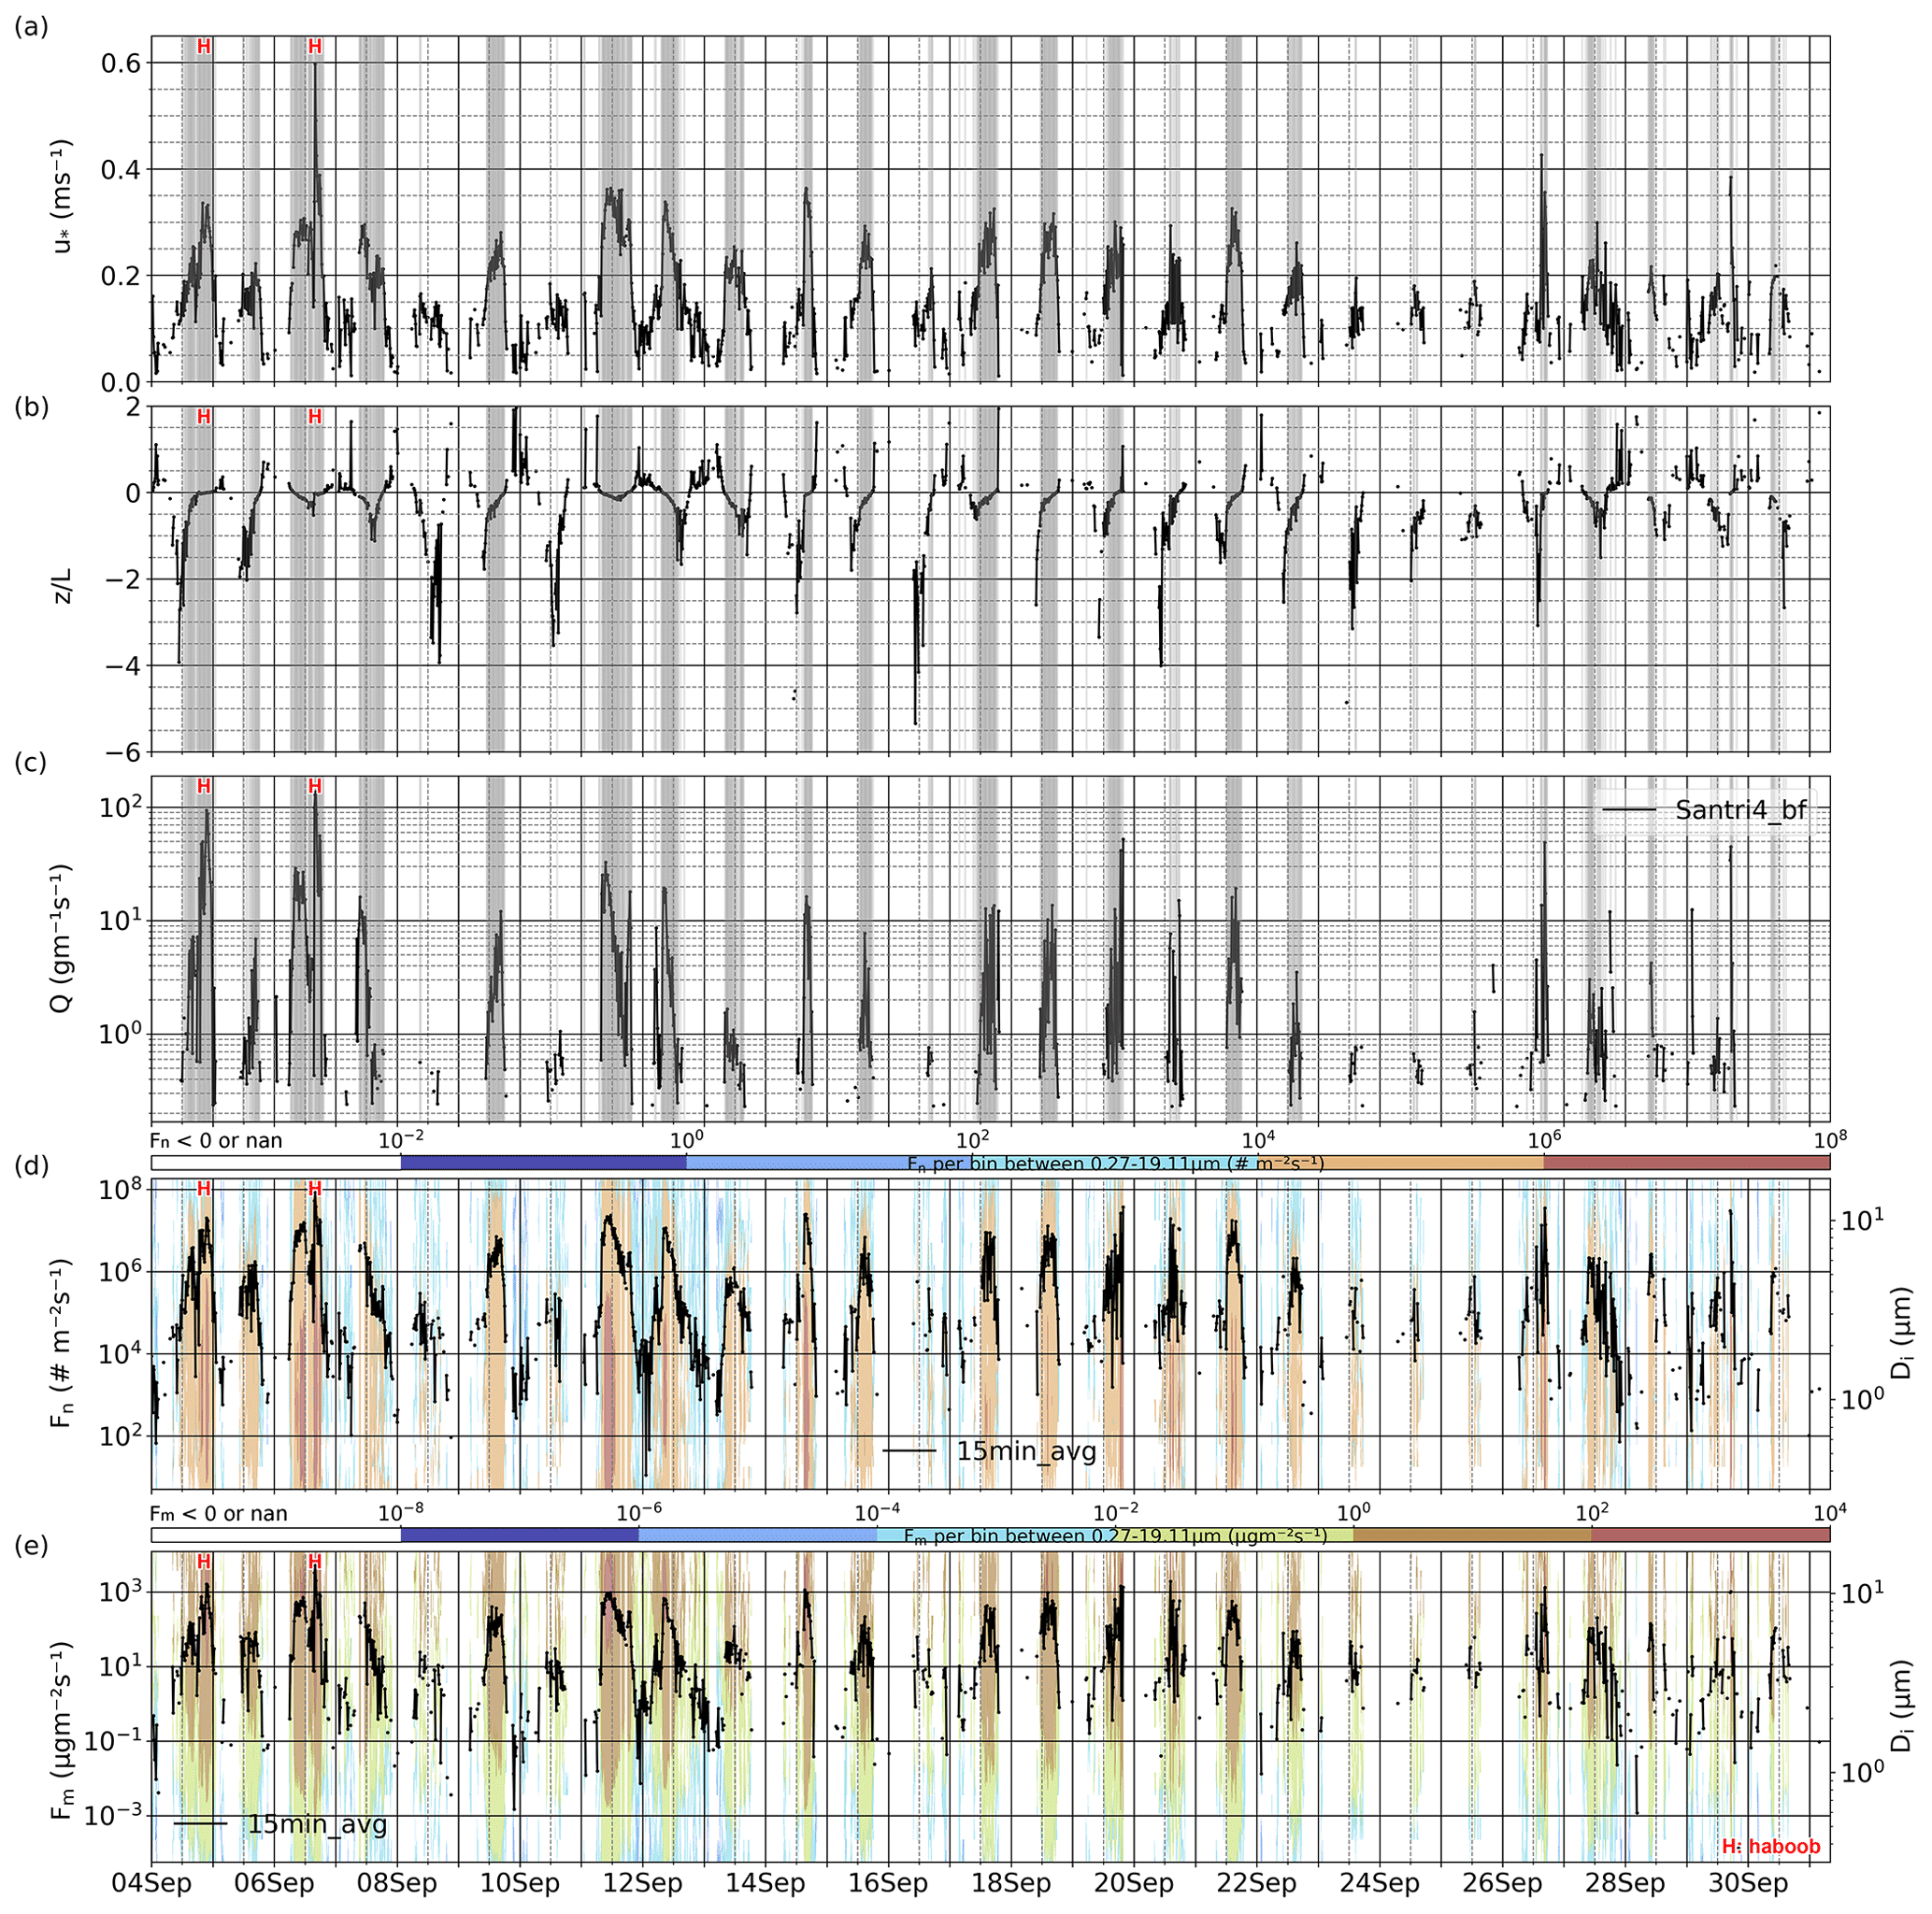
Figure 4Time series (UTC) of 15 min averaged (a) friction velocity u* (m s−1); (b) atmospheric stability represented by , where z is the reference height 2 m; (c) saltation flux (); (d) bulk and size-resolved diffusive flux in number () between 0.27 and 19.11 µm; and (e) bulk and size-resolved diffusive flux in mass () between 0.27 and 19.11 µm. Grey areas in (a)–(c) highlight times with . Data gaps in u*, atmospheric stability, and diffusive fluxes result from limits in the applicability of the law of the wall method. The size-resolved diffusive fluxes are shown in the integrated size bin resolution. Only the bulk and size-resolved diffusive fluxes that are positive are represented.
During the campaign, we also detected the presence of anthropogenic aerosols with diameters below ∼0.4 µm, whose influence is most visible when winds are weak and mass concentrations low (see Fig. S5), consistent with measured optical properties analysed in a companion contribution (Yus-Díez et al., 2023). This is particularly evident between 8 and 10 September, when low wind comes from the east (i.e. from M'Hamid). Such anthropogenic aerosol influence at the lower end of the measured PSD range is further evidenced and discussed in Sect. 3.3.1.
Saltation and diffusive fluxes are highly correlated and occur regularly throughout the campaign, peaking typically between 12:00 and 18:00 UTC in accordance with maximum surface winds and u*. In our case, the threshold friction velocity u*th is 0.16 m s−1 (see Sect. S3), which is reached nearly every day. The u* value shows peaks up to ∼0.4 m s−1 during regular events and reaches up to ∼0.6 m s−1 during the haboob event that occurred on the afternoon of 6 September (Fig. 4a). Wind erosion occurs mostly under unstable or close to neutral atmospheric conditions (Fig. 4b). For , the 15 min average of total vertical diffusive flux in terms of number and mass are on average 3.7×10⁶ and 191 , respectively, reaching maximum values of 8.4×10⁷ and 5116 on 6 September.
3.2 Characterization of saltation and sandblasting efficiency
Figure 5a, b, and c display the diffusive flux, saltation flux, and sandblasting efficiency against u*. We use coincident 15 min data between saltation and diffusive flux, and only when the diffusive flux is positive in all dust size bins with Di>0.4 µm, i.e. we consider the bulk diffusive flux between 0.37 and 19.11 µm (see Sect. 3.3.1 for more details). The points corresponding to the haboobs on 4 and 6 September are depicted with squares and triangles, respectively. Regression curves of the form are also represented for . The 95 % confidence intervals of the parameters of each regression curve are shown in Table S1 in the Supplement. The diffusive flux ranges mostly between ∼101 and ∼103 and the power law exponent b is 3.88 (Fig. 5a). The obtained exponent is within the range shown in Ishizuka et al. (2014) (their Fig. 5), where b varies between approximately 3 and 6 across different datasets gathered from the literature (Gillette, 1977; Nickling, 1983; Nickling and Gillies, 1993; Nickling et al., 1999; Gomes et al., 2003a; Rajot et al., 2003; Sow et al., 2009); this is likely due to differences in soil type and soil surface conditions.
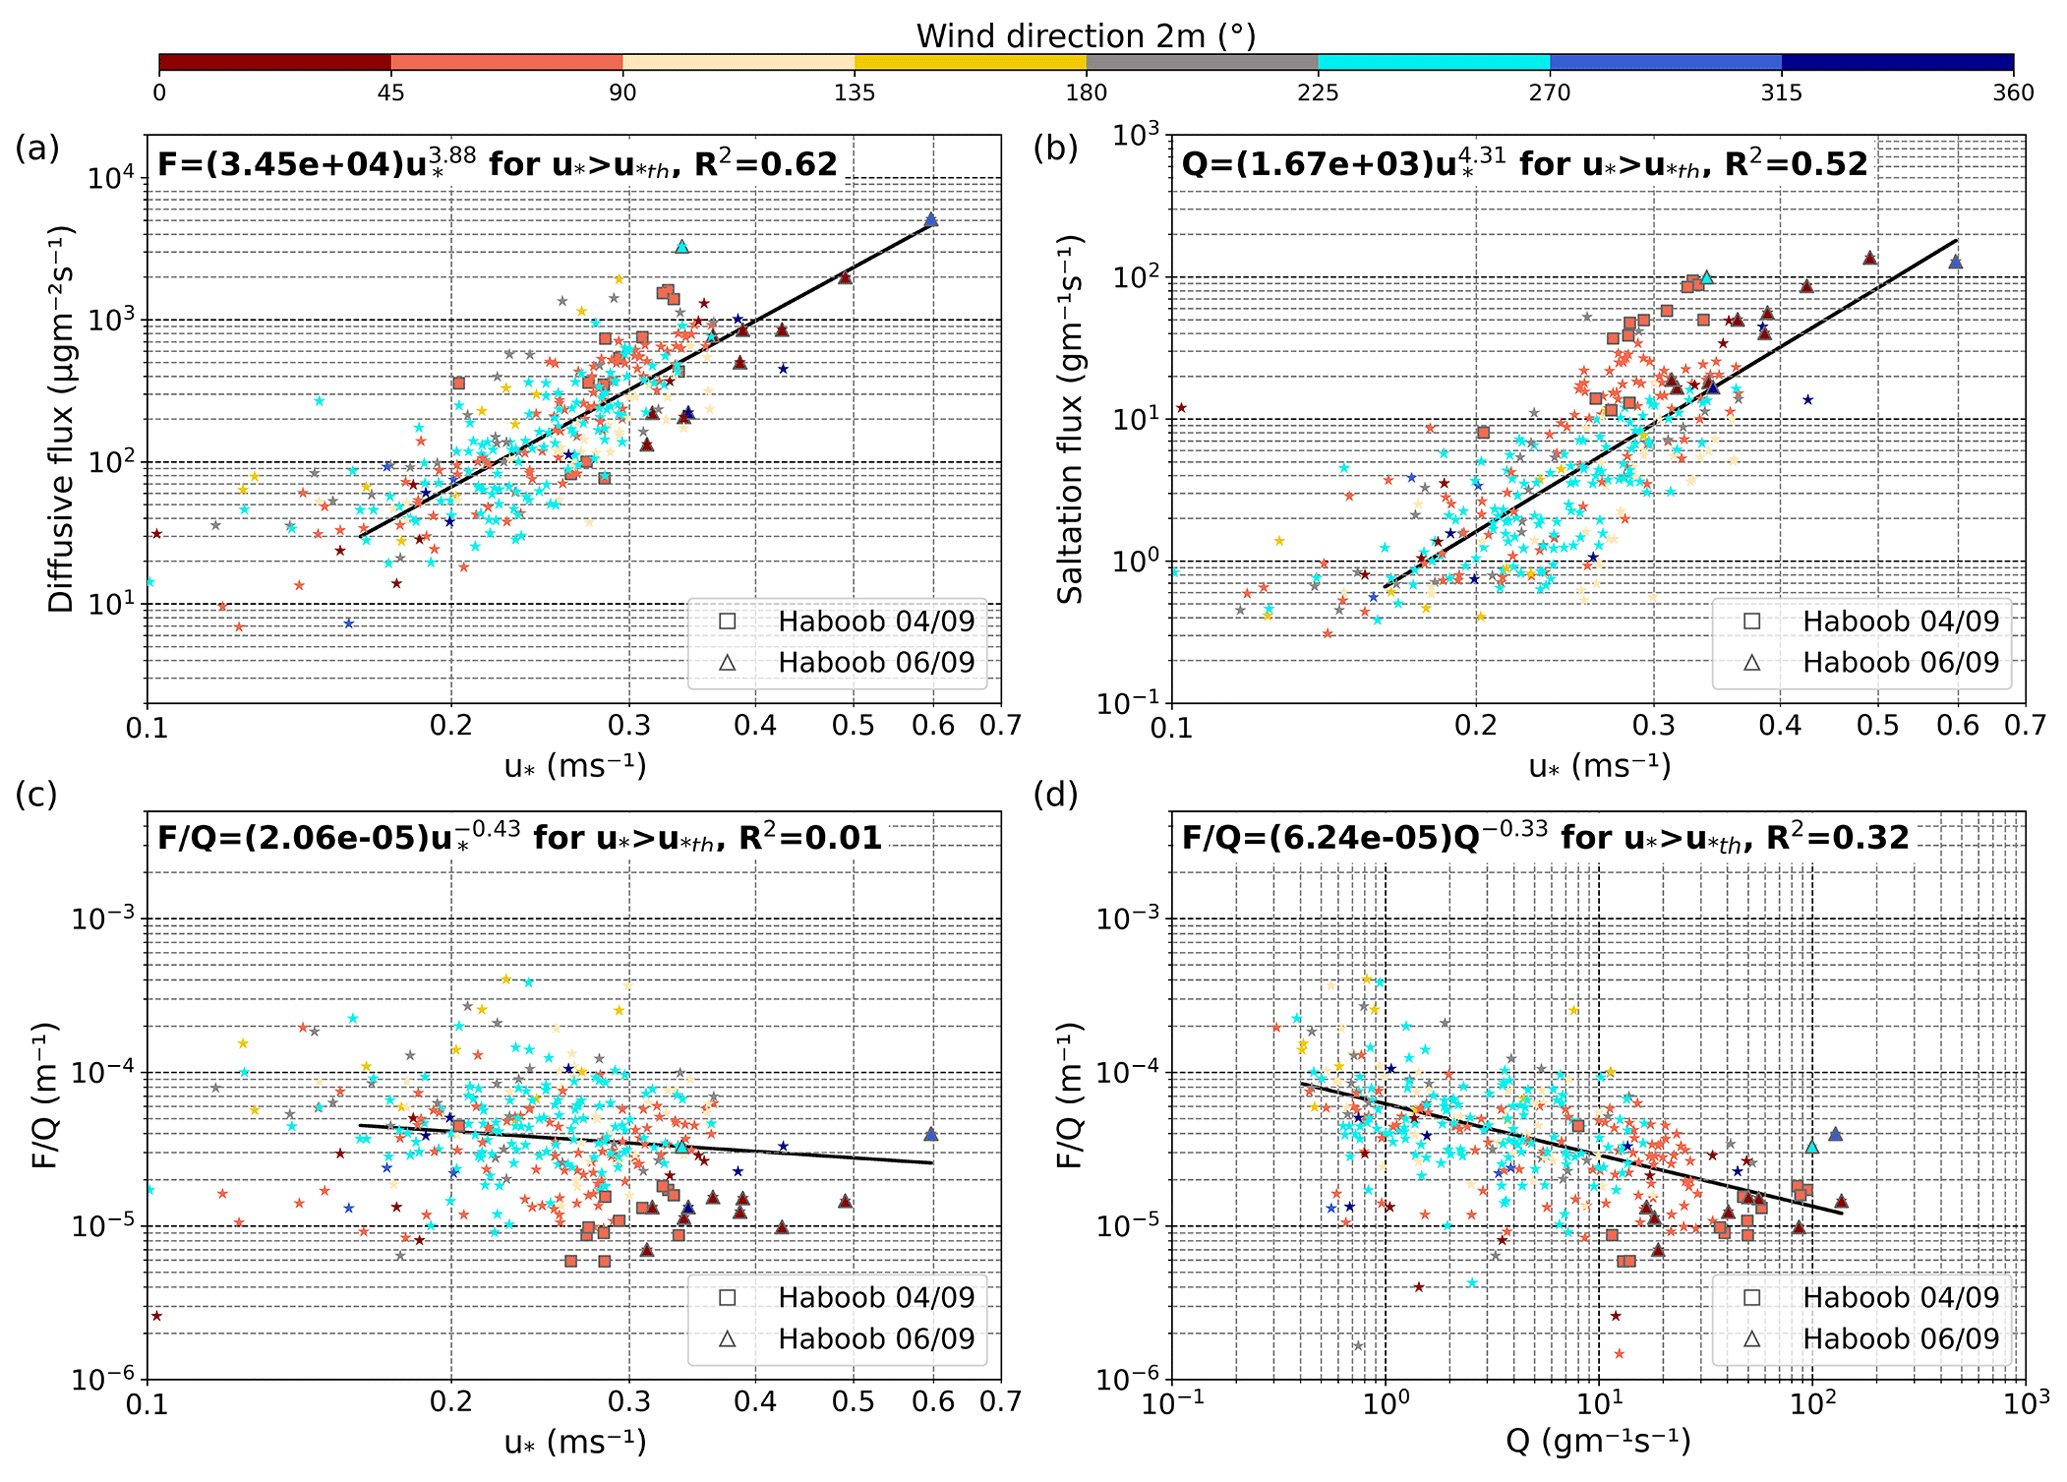
Figure 5(a) Diffusive flux () versus friction velocity u* (m s−1), (b) saltation flux () versus u* (m s−1), (c) sandblasting efficiency (m−1) versus u* (m s−1), and (d) sandblasting efficiency (m−1) versus saltation flux (). Colours represent the wind direction (∘). The points shown in all panels correspond to the 15 min values in which there is a simultaneous net positive diffusive flux and saltation flux, and when the diffusive flux is positive in all size bins with Di>0.4 µm, i.e. we consider the bulk diffusive flux between 0.37 and 19.11 µm. Sandblasting efficiency is defined as the ratio of the vertical and horizontal fluxes in mass. Squares and triangles are used to identify the values corresponding to haboobs on 4 and 6 September, respectively. The lines in (a)–(d) represent the regression curves of the form for . The coefficient of determination (in logarithmic space) of each regression curve is shown in its respective graph, and the 95 % confidence intervals of a and b are reported in Table S1.
The saltation flux ranges between about 10−1 and 102 . The power law exponent b is slightly higher than that obtained for the diffusive flux, i.e. b=4.31 (Fig. 5b). This value is larger than that reported in Gillette (1977) for most soils (b≈3). In comparison with Alfaro et al. (2022) (their Fig. 4), where data of two major dust field campaigns (JADE and WIND-O-V) are re-analysed, we obtain larger saltation fluxes for similar ranges of u*. For –0.45 m s−1, our 15 min saltation fluxes vary between 100 and 102 , while the 1 and 16 min measurements from the JADE and WIND-O-V campaigns, respectively, vary between 10−1 and 101 . Using the same instrument (SANTRI) as in our study, Klose et al. (2019) reported a maximum 1 min saltation flux of almost 101 for m s−1, approximately an order of magnitude smaller than our 15 min maximum values occurring during the haboobs for smaller u*. The large saltation fluxes suggest, despite the hard surface crusting, that the sand supply was such that our site did not experience considerable supply limitation, i.e. that saltation transport was mainly driven by atmospheric momentum and not by particle availability. Comparison of the height-dependent saltation flux obtained with SANTRI4 with that from the co-located MWAC sampler (not shown) confirmed that both are largely consistent, with SANTRI4 tending to record slightly higher fluxes. This is in qualitative agreement with the comparison of saltation measurement devices from Goossens et al. (2018).
The intensity of saltation impacts the aerodynamic roughness length z0 due to momentum absorption by the saltating particles (Owen, 1964; Gillette et al., 1998). In our experimental site z0 ranged mostly between 10−5 and 10−4 m and increased with u*. This increase was also observed in Dupont et al. (2018) and Field and Pelletier (2018), although we obtained roughness lengths about one order of magnitude smaller, consistent with values obtained in other playas (Marticorena et al., 2006). Further details about z0 at our site and its relationship with u* under saltation conditions are shown in Sect. S7.
The sandblasting efficiency ranges between about 10−6 and 10−3 m−1, although most values are concentrated between 10−5 and 10−4 m−1 (Fig. 5c). These results are similar to those obtained in Gomes et al. (2003a) (corresponding to a soil nominally of silt loam texture in Spain), Gomes et al. (2003b) (for a sandy soil with a very low clay and silt content in Niger), and the results of the soils 4 (sandy), 5 (sandy), and 9 (clay) reported in Gillette (1977). However, our values are on the lower end of the range reported in Gillette (1977) and Alfaro et al. (2022), where most sandblasting efficiencies are above 10−4 m−1. The sandblasting efficiency tends to decrease slightly with increasing u* when considering all wind directions, i.e. the exponent of the power law is negative (), but R2 (in logarithmic space) is very small. There is some dependency of the sandblasting efficiency upon wind direction. For example, sandblasting efficiencies are higher under southeasterly winds (135–180 ∘) than under the dominant wind directions (45–90 and 225–270 ∘). The exponent of the power law also changes between predominant wind directions (See Figs. S6 and S7), but the amount of data is rather small and shows significant scatter, and R2 (in logarithmic space) is small. Interestingly, some of the lowest sandblasting efficiency values ( m) are obtained during the haboob events, at least in part due to an enhanced reduction of coarse and super-coarse particles in the diffusive fluxes during the haboob events as discussed in Sect. 3.3.3.
There is a more robust decrease in sandblasting efficiency with increasing saltation fluxes (Fig. 5d), which is also evident in each of the two dominant wind directions (See Figs. S6 and S7). Such decreases in the sandblasting efficiency with increasing u* and saltation flux are also found in Alfaro et al. (2022) using data from the JADE and WIND-O-V field campaigns. To explain this result, Alfaro et al. (2022) suggests that the proportion of emitted fine particles produced by sandblasting should increase with Q due to enhanced aggregate disintegration, which leads to lower sandblasting efficiencies. We discuss in Sect. 3.4 a variety of potential mechanisms to explain the variations in the diffusive flux PSD with u* that contribute to the decrease in sandblasting efficiency with increasing u*.
All in all, our results highlight the prominence of saltation in our site, which produces strong diffusive fluxes despite the relatively low sandblasting efficiencies. These features are consistent with the measured surface sediment properties. On the one side, L'Bour is surrounded by small dunes with a minimally dispersed volume median diameter of 132.2 µm and a considerable amount of saltators below 100 µm (see Fig. S1), which translates into rather optimal saltation conditions. For instance, saltation can be detected even when based on 15 min averages (Fig. 5b). During such situations, saltation is typically intermittent during the 15 min period; hence, instantaneous momentum fluxes can be large enough to enable particle transport. On the other side, the low sandblasting efficiencies are attributed to the paved sediment that constitutes the surface of the ephemeral lake.
3.3 Variability of the dust PSD at emission
In this section, we analyse variations in the dust PSD after identifying and removing any potential anthropogenic aerosol influence. To provide a comprehensive view, we study the number and mass-normalized and non-normalized PSDs of concentration (Figs. 6 and 7) and diffusive flux (Figs. 8 and 9). For dust concentrations, we refer to concentrations from FidasL. The results from FidasU are analogous and provided in Sect. S8. We consider all available measurements covering the full range of u* for concentration PSDs, but we only consider diffusive flux PSDs when m s−1, i.e. well-developed erosion conditions, and when the diffusive flux is positive in all size bins with Di>0.4 µm (this minimum size is taken to avoid any anthropogenic aerosol contamination as discussed in Sect. 3.3.1). Figures 6–9 group the PSDs into u* intervals, types of events (regular versus haboob events), and wind directions (for the sake of simplicity we only show two 180 ∘ wind direction sectors to the east and west of the alignment between the Fidas and the 10 m tower, as shown in Fig. 1d). Our preliminary analysis did not show any effect of atmospheric stability independent of u* upon the PSD, in agreement with Dupont (2022) and in contrast with some recent studies (Khalfallah et al., 2020; Shao et al., 2020), likely due to the small range of stability conditions during our campaign (Sect. 3.1). However, this aspect was not analysed in detail.
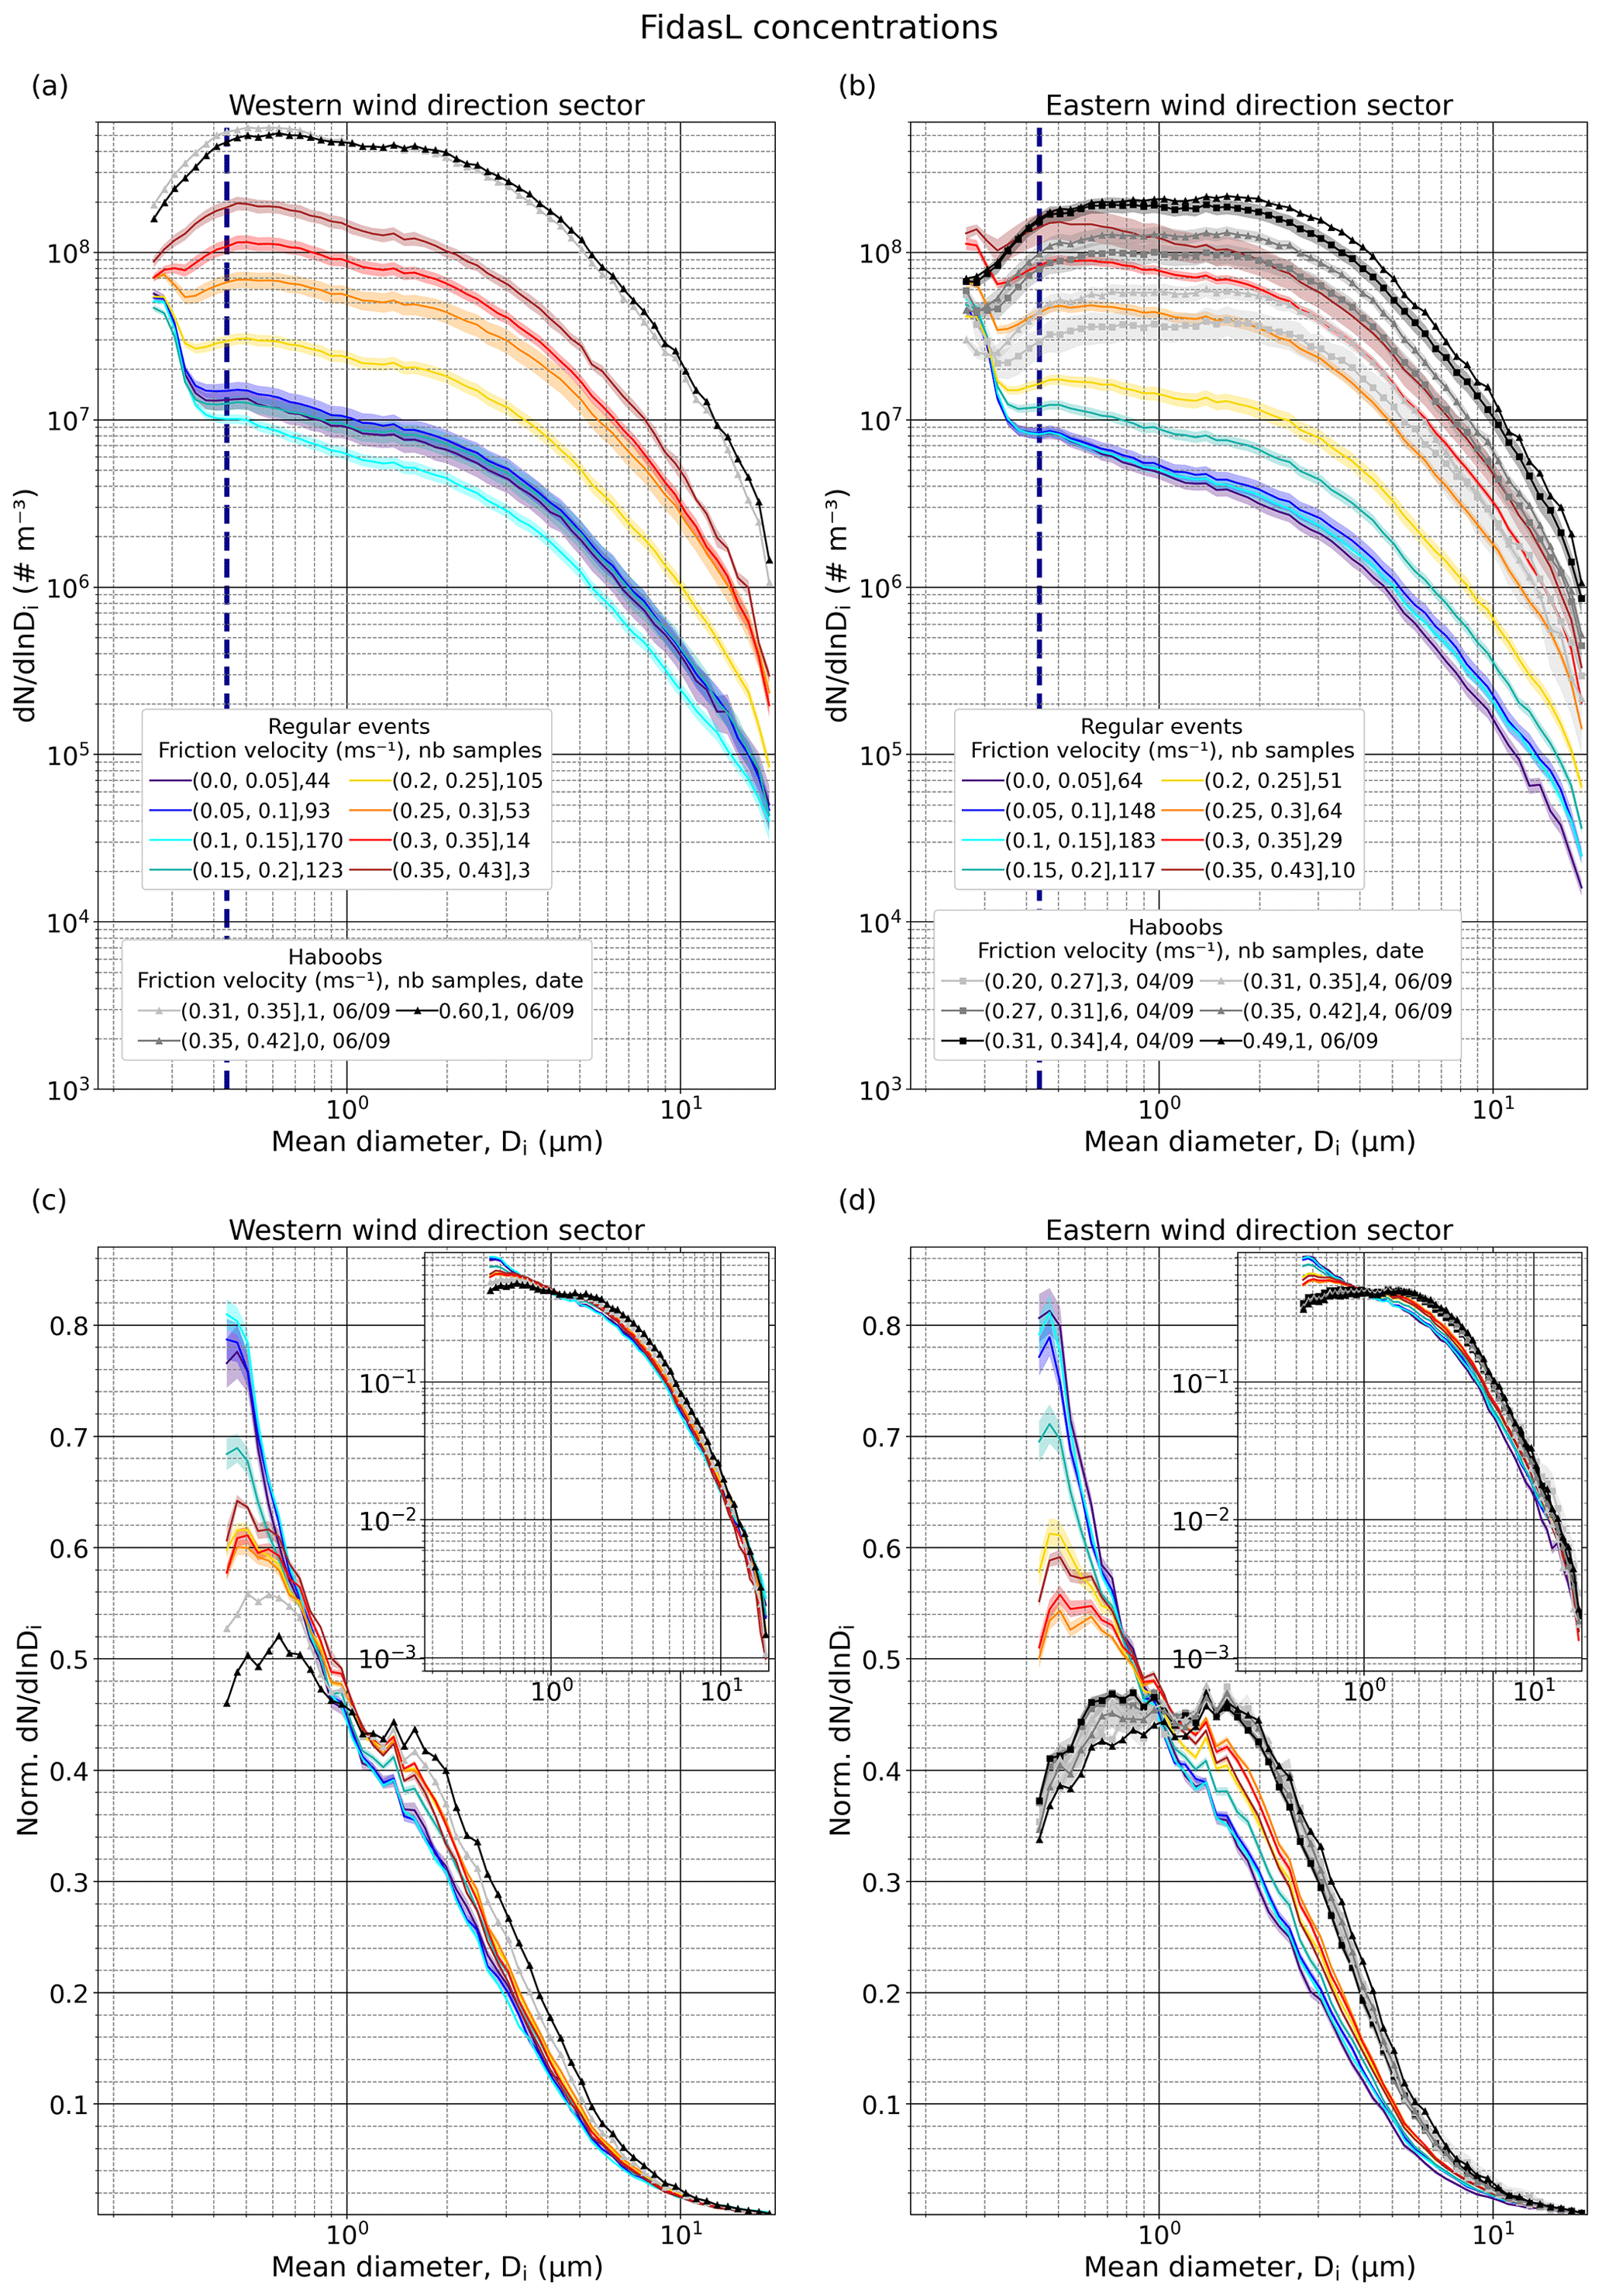
Figure 6Average size-resolved particle number concentration, (m−3), for different u* intervals, types of events (regular or haboob), and wind directions in the range 150–330 ∘ (a) and 330–150 ∘ (b). The number of available 15 min average PSDs in each u* interval is indicated in the legend. Panels (c)–(d) are the same as (a)–(b) but normalized (Norm. ) after removing the anthropogenic mode (normalization from 0.42 to 19.11 µm). The insets show the same data but with logarithmic ordinate axis scaling. Shaded areas around the lines depict the standard error. The shown PSDs were obtained from FidasL. In (a) and (b) the dashed dark blue line marks the end of the anthropogenic mode (Di=0.44 µm). Data are shown using original size bin resolution, but the first 3 bins are not represented as Fidas is only considered efficient from the fourth one onward.
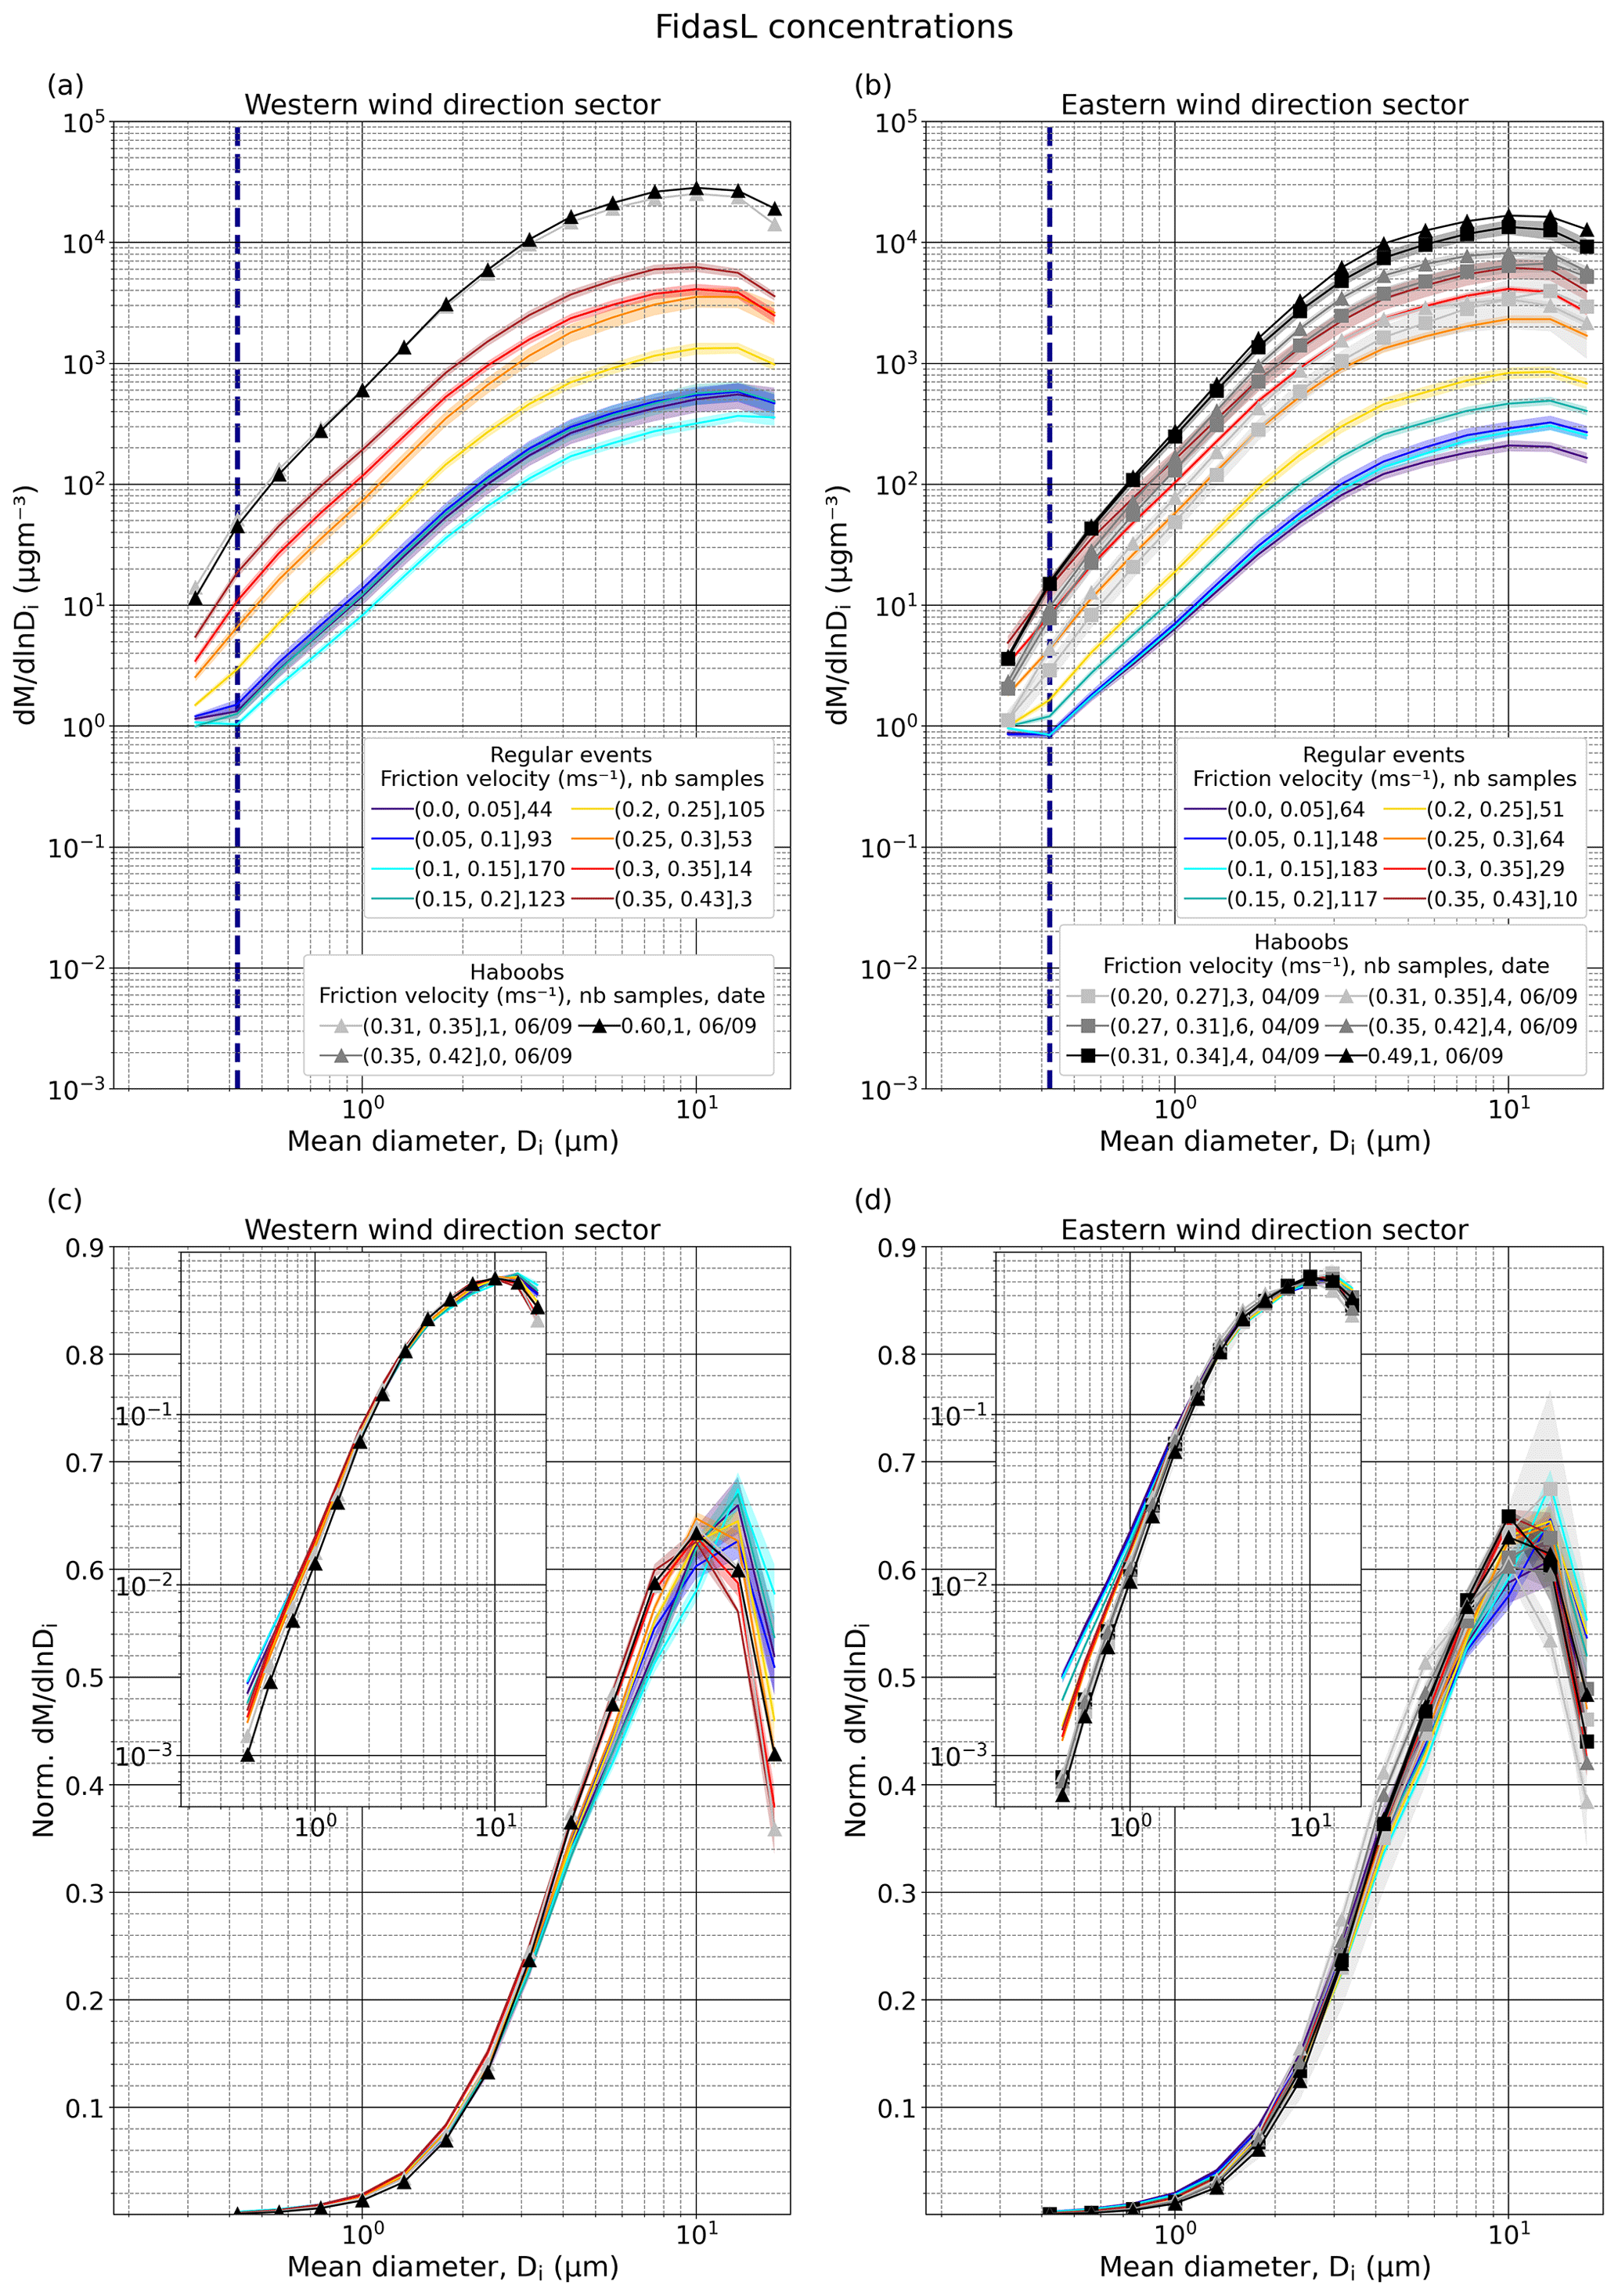
Figure 7Average size-resolved particle mass concentration, (µg m−3), for different u* intervals, types of events (regular or haboob), and wind directions in the range 150–330 (a) and 330–150 ∘ (b). The number of available 15 min average PSDs in each u* interval are indicated in the legend. Panels (c)–(d) are the same as (a)–(b) but normalized (Norm. ) after removing the anthropogenic mode (normalization from 0.37 to 19.11 µm). The insets show the same data but with logarithmic ordinate axis scaling. Shaded areas around the lines depict the standard error. The shown PSDs were obtained from FidasL. In (a) and (b) the dashed dark blue line marks the end of the anthropogenic mode (Di=0.42 µm). In this case, the original size resolution of FidasL has been reduced by integrating 4 consecutive bins, except for the last one that contains 3, resulting in 16 bins. The first integrated bin is not represented as Fidas is considered efficient from the second one onward.
3.3.1 Identification and removal of the anthropogenic aerosol influence
The analysis of the number PSDs shows the influence of non-geogenic (anthropogenic) particles for Di<0.4 µm. The number concentration PSDs show a sharp increase in particles with Di<0.4 µm during regular events that is particularly evident for small u* (Fig. 6a and b). This feature tends to diminish and even disappear with increasing u* in the number concentration PSD, which demonstrates its small dependence upon wind erosion. It also disappears in the number diffusive flux (Fig. 8a and b), which further confirms the transport and not the emission of small anthropogenic particles in our measurement site. This result is further confirmed in companion papers based upon the analysis of airborne samples with electron microscopy (Panta et al., 2023) and measurements of optical properties (Yus-Díez et al., 2023). It is also consistent with the anthropogenic sulfate and carbonaceous particle mode detected at Tinfou (∼50 km northeast of L'Bour, beyond the mountain range and the enclosed desert basin) during the SAMUM field campaign (Kaaden et al., 2009; Kandler et al., 2009).
Compared to regular events, haboob events show markedly less anthropogenic influence (Fig. 6b). We hypothesize this is due to the fresher air masses (carrying less background anthropogenic aerosols) within the cold pool outflows from the convective storms originated in the vicinity of our measurement location.
The analysis of the PSD evolution with u* shows that the influence of anthropogenic aerosol upon the number concentration is negligible for Di>0.4 µm. We note that similar potentially anthropogenic features can be recognized around 0.3 µm in PSDs from other wind erosion studies such as in Sow et al. (2009) (their Fig. 8) and Fratini et al. (2007) (their Fig. 5). In this study, in order to avoid any anthropogenic aerosol contamination (particularly for low u*), our normalized PSDs shown in linear and logarithmic scales in Figs. 6c–d, 7c–d, 8c–d, and 9c–d consider only Di>0.4 µm.
3.3.2 Differences between concentration and diffusive flux PSDs and their dependencies upon u* and wind direction
The non-normalized number (Fig. 6a and b) and mass concentration PSDs (Fig. 7a and b) show the expected strong scaling of concentration with u* for all size bins, where the number is dominated by fine dust and the mass by coarse and super-coarse dust. For equivalent u* intervals, concentrations are higher when the wind comes from the western sector. The normalized number PSDs (Fig. 6c and d) further depict how the shape of the concentration PSD depends upon u* and wind direction. Overall, there is a relative decrease in sub-micrometre dust particles and a relative increase in super-micrometre particles, especially around 1.5–2 µm, with increasing u*, from calm (purplish and blueish lines) to well-developed erosion conditions (yellow, orange, and reddish lines). However, it can be observed that for m s−1 during regular events (orange, red, and dark red lines) the fraction of sub-micrometre particles slightly increases with increasing u*, which is even more evident for the eastern sector. Also for these cases (orange, red, and dark red lines), the number fraction of sub-micrometre particles is higher when winds come from the western sector (maxima at 0.6–0.7) than from the eastern sector (maxima at 0.5–0.6).
The normalized mass concentration PSDs (Fig. 7c and d) provide further insights into the dependencies of the concentration PSD upon u*. During regular events, the mass fraction of coarse particles with Di∼ (4–10) µm tends to increase and that of super-coarse particles with Di>10 µm tends to decrease as u* increases. The peak of the mass PSD, which appears in the super-coarse fraction, tends to shift towards smaller diameters as u* increases. These features are broadly similar for both wind direction sectors.
Figures 8 and 9 depict the diffusive flux PSDs in terms of number and mass, respectively. The PSDs in these figures include the uncertainty (adding both the standard error and the average random uncertainty derived in Appendix C) for each u* range. For the sake of figure clarity, the uncertainty is shown only for regular events. In Sect. S9 we provide similar figures including only the uncertainties for each u* range associated with the haboob events (Figs. S13 and S14). We also provide the diffusive flux PSDs with uncertainties only accounting for standard errors (Figs. S15 and S16). Figure S30 shows the number and mass fractions of the diffusive flux integrated over four size ranges (, , and Di>10 µm) for the different u* intervals, types of events (regular or haboob), and the two wind direction sectors. The diffusive flux PSDs show consistent but more marked dependencies upon u* and wind direction in comparison to the concentration PSDs for well-developed erosion conditions. During regular events, the proportion of sub-micrometre particles is lower and increases with u* more strongly in the diffusive flux than in the concentration for both wind sectors (Figs. 8c and d versus 6c and d). The opposite is observed for super-micrometre particles. The differences between, for instance, the u* intervals (0.30–0.35] and (0.15–0.20] m s−1 for the two smallest size bins (0.37–0.49 and 0.49–0.65 µm) and the two wind sectors are statistically significant (p value <0.05; see Sect. S13 for details on the tests of significance). The u* interval (0.35–0.43] m s−1 was not used due to the small number of samples, especially in the western sector. After integration (Fig. S30a and b) the sub-micrometre number fractions when u* is in the (0.30–0.35] m s−1 interval are ∼15 % and ∼13 % higher for the western and eastern sectors, respectively, than when u* is in the (0.15–0.20] m s−1 interval. However, these differences are not statistically significant at a significance level of 0.05 (p values are 0.11 and 0.07 for the western and eastern sectors, respectively). The sub-micrometre fraction of diffusive flux is also more enhanced when the winds come from the western sector than from the eastern sector. The differences between wind sectors, for instance, for the two smallest size bins and when u* is in the (0.25–0.30] m s−1 interval (this u* interval was chosen as we had similar number of samples in both wind sectors) are statistically significant (p value <0.05). Yet again, while the sub-micrometre fraction of diffusive flux is ∼6 % higher in the western sector than in the eastern sector (Fig. S30a and b), this difference is not statistically significant for a significance level of 0.05 (p value =0.2358).
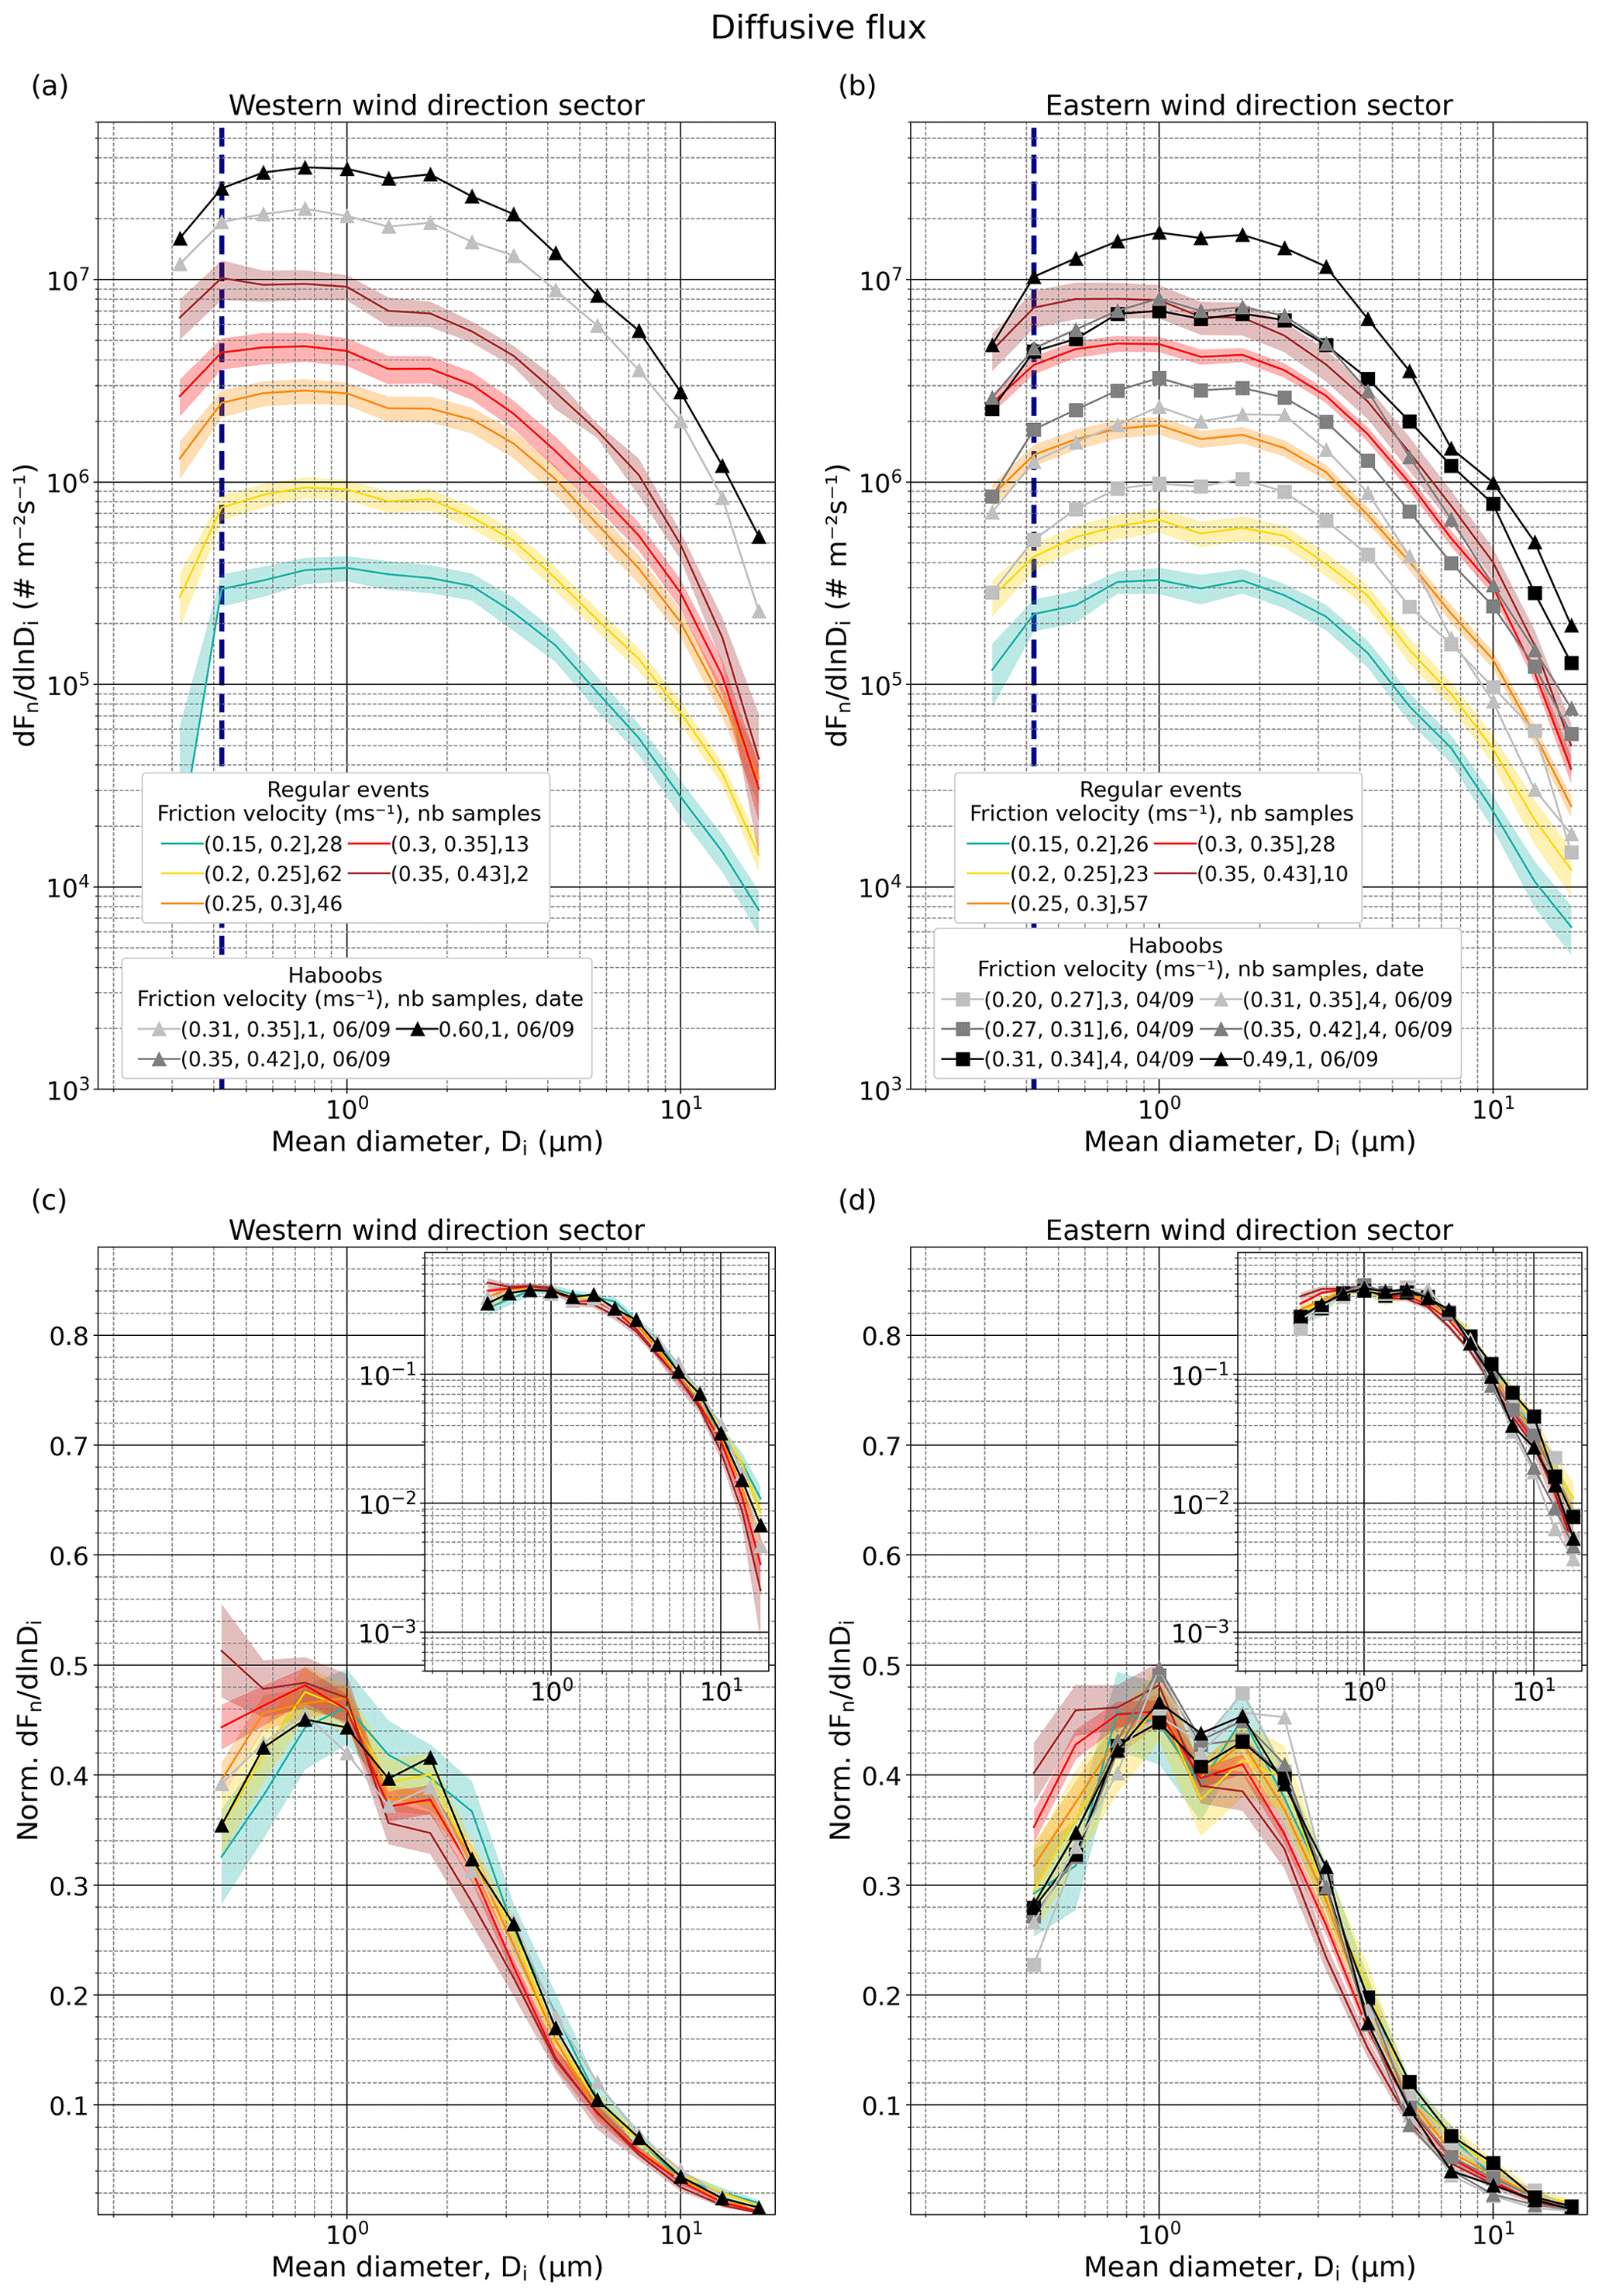
Figure 8Average size-resolved number diffusive flux, (), for different u* intervals, types of events (regular or haboob), and wind directions in the range 150–330 (a) and 330–150 ∘ (b). The number of available 15 min average PSDs in each u* interval are indicated in the legend. Only the samples where diffusive flux is positive in all the diameter bins above the anthropogenic mode (as discussed in Sect. 3.3.1) have been selected. Panels (c)–(d) are the same as (a)–(b) but normalized (Norm. ) after removing the anthropogenic mode (normalization from 0.37 to 19.11 µm). The insets show the same data but with logarithmic ordinate axis scaling. Shaded areas around the lines of the regular event PSDs depict the combination of random uncertainty and standard error. In (a) and (b) the dashed dark blue line marks the end of the anthropogenic mode (Di= 0.42 µm). In this case, the original size resolution of FidasL has been reduced by integrating 4 consecutive bins, except for the last one that contains 3, resulting in 16 bins. The first integrated bin is not represented as Fidas is considered efficient from the second one onward. Results are shown only for well-developed erosion conditions ( m s−1).
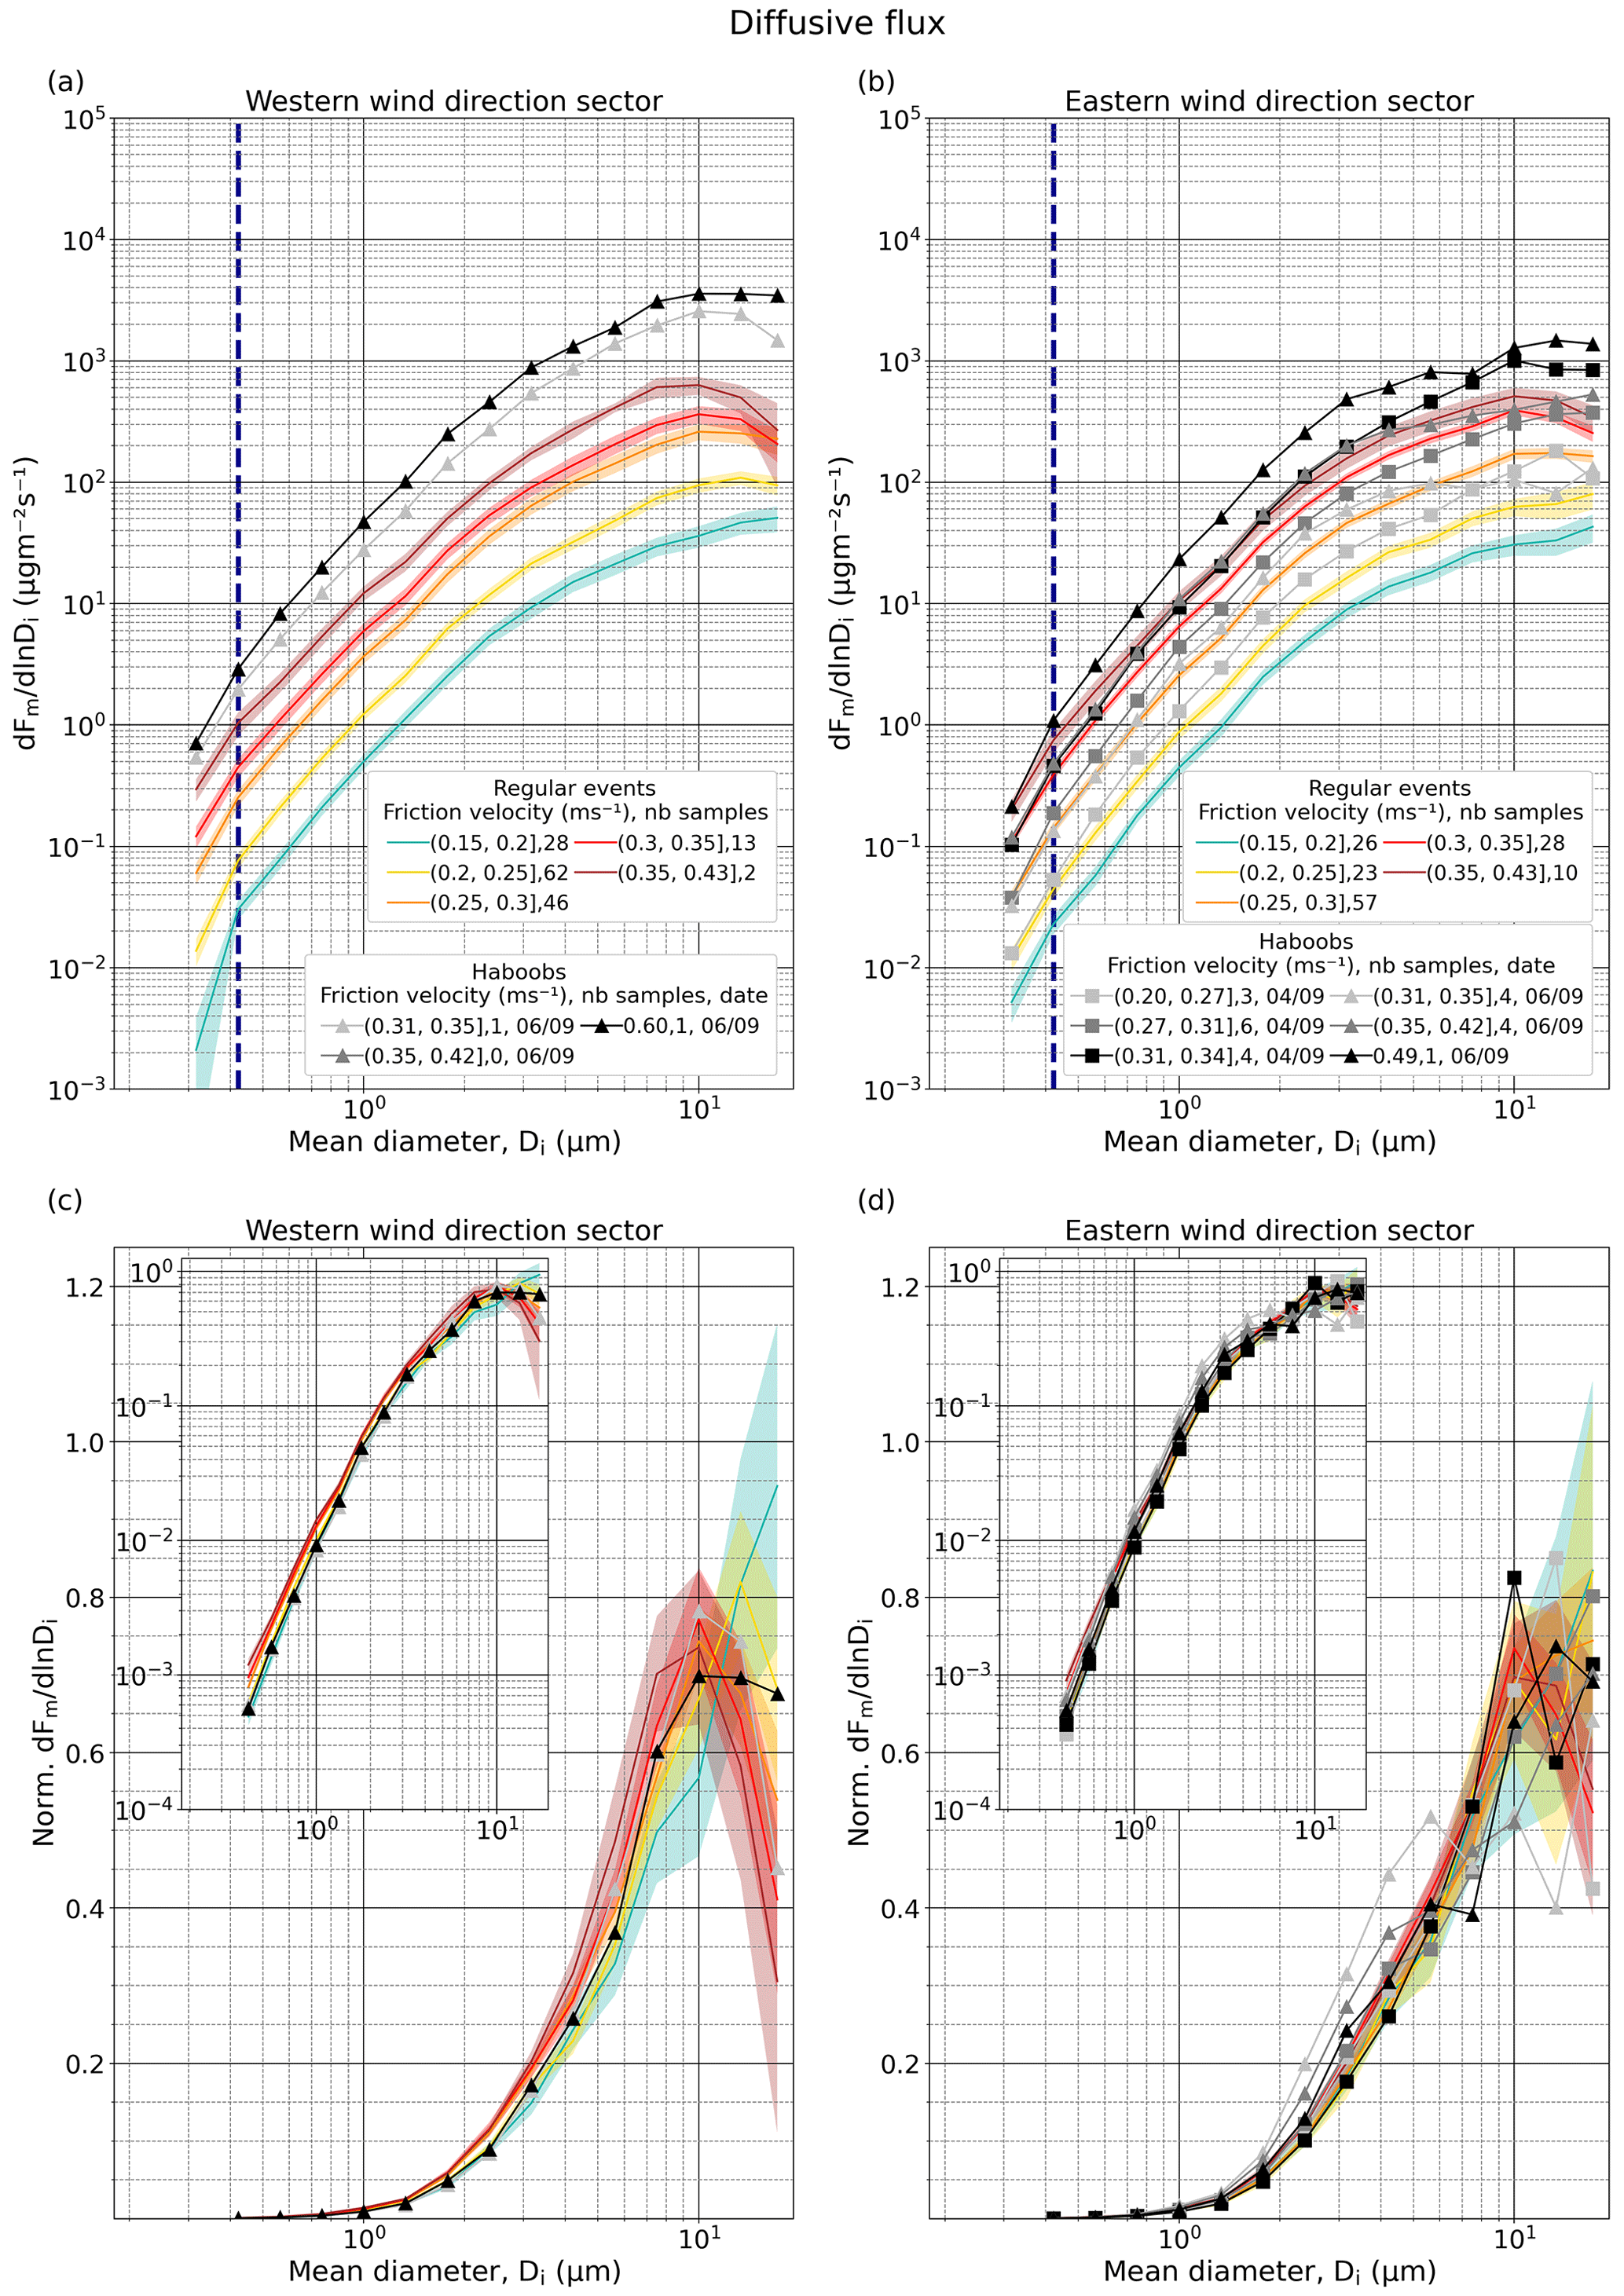
Figure 9Average size-resolved mass diffusive flux, (), for different u* intervals, types of events (regular or haboob) and wind directions in the range 150–330 (a) and 330–150 ∘ (b). The number of available 15 min average PSDs in each u* class are indicated in the legend. Only the samples where diffusive flux is positive in all the diameter bins above the anthropogenic mode (as discussed in Sect. 3.3.1) have been selected. Panels (c)–(d) are the same as (a)–(b) but normalized (Norm. ) after removing the anthropogenic mode (normalization from 0.37 to 19.11 µm). The insets show the same data but with logarithmic ordinate axis scaling. Shaded areas around the lines of the regular event PSDs illustrate the combination of random uncertainty and standard error. In (a) and (b) the dashed dark blue line marks the end of the anthropogenic mode (Di=0.42 µm). In this case, the original size resolution of FidasL has been reduced by integrating 4 consecutive bins, except for the last one that contains 3, resulting in 16 bins. The first integrated bin is not represented as Fidas is considered efficient from the second one onward. Results are shown only for well-developed erosion conditions ( m s−1).
Likewise, the diffusive flux PSDs show more marked variations in coarse and super-coarse particles with increasing u* compared to the corresponding concentration PSDs, a feature that can be better recognized in terms of mass (Fig. 9). During regular events, as u* increases, there is a strong decrease in the super-coarse mass fraction and an increase in the coarse mass fraction (Figs. 9c, d and S30c and d). Also, as in the case of concentration, there is a shift in the mass diffusive flux PSD towards lower mass median diameters with increasing u*. For the regular events, the uncertainties in the normalized PSDs can partly overlap between contiguous u* intervals. However, both the largest size bin (Fig. 9c and d) and the super-coarse mass fraction (Di>10 µm) (Fig. S30c and d) show statistically significant differences. For instance, the differences between the u* intervals (0.30–0.35] and (0.15–0.20] m s−1 are statistically significant (p value <0.05) for both wind sectors.
In summary, the dependencies of diffusive flux PSDs with u* and wind direction are consistent with those from concentration for well-developed wind erosion conditions. However, there are relevant differences among them that preclude the use of near-surface concentration as a proxy for the diffusive flux or the emitted dust PSD.
3.3.3 PSD differences between regular and haboob events
The PSDs obtained during the haboob events differ substantially from the PSDs obtained during the regular events even for equivalent u* values and wind direction. When winds come from the eastern sector, the haboob number concentration PSDs (Fig. 6b and d) show peaks between 1 and 2 µm (in stark contrast to the 0.5–0.6 µm peak for equivalent u* during regular events), and the negative slope between 0.4 and 2 µm becomes even positive. In terms of diffusive flux, there is also a clear increase in the super-micrometre number fraction and a decrease in the sub-micrometre number fraction compared to the regular PSDs (Fig. 8d). The coarse and super-coarse dust fractions with Di>5 µm in the diffusive mass flux PSDs during the haboob events show more variability than during the regular events (Fig. 9d). In some cases we observe a more pronounced decrease in the super-coarse mass fraction and an increase in the coarse fraction in comparison with the regular events.
When winds come from the western sector, the haboob number concentration PSDs also tend to show an increase in the super-micrometre fraction, especially between 1 and 2 µm (Fig. 6a and c), although in this case the maximum fraction of particles still peaks below 1 µm (Fig. 6c). This last feature is consistent with the regular PSDs in that direction showing a more enhanced sub-micrometre influence.
In contrast to the regular PSDs, we do not detect an increase in sub-micrometre particles with increasing u* in the haboob normalized number diffusive flux PSDs in either wind direction (Fig. 8c and d). The normalized PSDs associated with the haboob u* intervals are characterized by larger uncertainties, particularly with increasing particle size, than the PSDs associated with the regular events (see Figs. S13 and S14), which is largely due to the smaller number of haboob measurements in each u* interval.
3.4 What explains the observed PSD variations? Potential roles of dry deposition and fetch length, aggregate disintegration, and haboob gust front
In the previous section we have seen how and to what extent the concentration and diffusive flux PSDs depend upon u*, wind direction, and type of event (regular versus haboob). Here, we discuss the potential mechanisms that may explain these PSD variations, which include the effect of dry deposition modulated by the fetch length, aggregate disintegration during wind erosion, and the impact of the haboob gust front.
The proportion of sub-micrometre particles decreases in the concentration PSD between calm (purplish and blueish lines) and well-developed erosion conditions (yellow, orange and red lines) (Fig. 6c and d). When u* is low, i.e. in the absence of local emission, the PSDs represent background conditions and therefore present a smaller fraction of super-micrometre particles due to their shorter lifetime. As u* increases, the concentration becomes increasingly dominated by freshly emitted dust, reducing the influence of the background dust and hence enhancing the proportion of super-micrometre dust. However, during regular dust events, the proportion of sub-micrometre particles increases and that of super-micrometre particles decreases in the diffusive flux PSD as u* increases (Fig. 8c and d). This is also observed, although to a lesser extent, in the concentration PSDs for well-developed erosion conditions when m s−1 (Fig. 6c and d). This could be compatible with two different mechanisms or the combination thereof. On the one side, it could be due to a reduction in super-micrometre particles by dry deposition, which increases with u* (Dupont et al., 2015). On the other side, the relative enhancement of sub-micrometre particles may be the result of more aggregate disintegration with increasing u* (Alfaro et al., 1997; Shao, 2001). We examine these two hypotheses more thoroughly below.
The potentially large effect of dry deposition upon the diffusive flux PSDs has been recently suggested based on numerical experiments (Dupont et al., 2015; Fernandes et al., 2019). More specifically, these studies clearly illustrated the key roles of the dust fetch length and u* in this process. The dust fetch is defined as the uninterrupted upwind area generating dust emissions. This differs from the flux footprint, which is the upwind area that contributes substantially to the concentration at the measurement location (Schuepp et al., 1990), and which is here much smaller than the dust fetch, a couple of hundred metres versus several kilometres, respectively. For a given surface and uniform u* along the fetch, the deposition of dust particles, which is size dependent, slowly increases with the fetch as the concentration of dust is enhanced. This way, a longer fetch results in a higher enrichment of the diffusive dust flux in small particles (Fernandes et al., 2019). Additionally, for a given fetch, an increasing u* can substantially modify the diffusive flux PSD by enhancing the deposition of super-micrometre particles through impaction, i.e. the direct collision of particles to a surface resulting from their inertia, and hence reducing the fraction of these particles. Our observations suggest a major role of dry deposition in shaping the variations in the concentration and diffusive flux PSDs. On the one side, for equivalent u* intervals during regular events, there are in general higher total number and mass concentrations for the western sector (Figs. 6a and 7a versus 6b and 7b, respectively), consistent with the longer fetch in that direction (60 km versus 10 km in the western and eastern sectors, respectively, as described in Sect. 2.1). Furthermore, in the normalized number concentration and diffusive flux PSDs we observe a higher proportion of sub-micrometre particles in the western sector compared to the eastern sector (Figs. 6c and 8c versus 6d and 8d). On the other side, during regular events when u* increases, the mass fraction of super-coarse particles (Di>10 µm) decreases and that of fine and coarse particles (Di<10 µm) increases, both in the concentration and the diffusive flux PSDs (Figs. 7c, d, 9c and d). This effect is more visible when winds come from the western sector, which has a longer fetch. Our hypothesis is further confirmed when applying the tuned resistance-based dry deposition velocity parameterization described in Sect. 2.4 and Appendix D, whose results are discussed in detail in Sect. 3.5.
Parallel to the effect of deposition, at least part of the enhancement in sub-micrometre particles with u* could be attributed to an increased aggregate disintegration. However, while this explanation can hold for regular events, there is no detectable increase in the proportion of sub-micrometre particles with increasing u* in the haboob events in either direction. In addition, the proportion of sub-micrometre particles during the haboob events is lower than during regular events although the former are associated with equivalent or higher u* values (Fig. 6c and d). This further favours the prevalence of the fetch-deposition mechanism over any potential enhanced aggregate disintegration with u*.
It is indeed quite remarkable that haboob events tend to show a much higher proportion of super-micrometre particles, especially for Di∼(1–5) µm, and a lower proportion of sub-micrometre particles than the regular events for equivalent or higher u* intervals in the normalized number concentration PSDs (Fig. 6c and d). In terms of normalized number diffusive flux PSDs (Fig. 8c and d), haboob events are similar to the regular events for the u* interval (0.15–0.2] m s−1, although coarse and super-coarse dust mass fractions with Di>3 µm during the haboob events show much more variability than during the regular events (Fig. 9d). To try to explain these features we revisit the formation process of a haboob. A convective storm or thunderstorm is formed when there is vertical transport of heat and moisture in the atmosphere (convection) that produces updrafts. As the convective storm matures, besides updrafts there are also downdrafts caused by evaporative cooling. When these downdrafts are very strong and hit the ground in a dust source area, large amounts of sand and dust are lifted into the air and can spread several kilometres wide horizontally, producing a wall of dust and strong wind gusts, a phenomenon known as a “haboob”. Therefore, a haboob is formed from the outflow of a convective storm. We hypothesize that the location where the downdraft of the thunderstorm hits the surface represents a new beginning of the dust fetch, which would be closer to our experimental site than the original start. Following the argument given to explain the differences in PSDs between western and eastern sectors, this shorter “effective” fetch could at least partially explain the relative reduction in sub-micrometre particles and the increase in super-micrometre particles. At the same time, despite the overall increase in the fraction of super-micrometre particles, dry deposition visibly more strongly affects the fractions of coarse particles (Di>3 µm) and super-coarse particles (Di>10 µm) in the diffusive flux PSDs during the haboob events than during the regular events (Fig. 8b and b). This is because the dry deposition flux scales with the concentration, and during the haboobs the concentration of the super-micrometre particles is substantially higher (Fig. 3f and g). In addition, a haboob is not a static phenomenon and its gust front, where u* and dust emission are maximized, moves towards and away from our measurement site. Therefore, there is non-uniformity of u* and dust emission across the fetch, which may explain the higher variability in the haboob PSDs. Finally, higher air humidity along the haboob outflow and its potential effect upon the soil bonding forces cannot be discarded. During the haboob events, the relative humidity at our site increased substantially, from 15 %–25 % to ∼50 % (Fig. 3b). Although our near-surface soil moisture measurements (2–3 cm deep) (not shown) did not register any associated increase, it has been argued that wet bonding forces in the soil surface, which are dominated by adsorption in arid regions, increase with relative humidity within approximately the observed variation range (Ravi et al., 2006). This mechanism would be consistent with the smaller proportion of sub-micrometre particles due to an increased resistance of soil aggregates to disintegration with increasing relative humidity as suspected in Dupont (2022).
3.5 Evaluation of the estimated dry deposition and emitted fluxes
If the deposition process causes the variability observed in the diffusive flux PSD, the emitted dust PSD should have a higher coarse and super-coarse fraction while showing less variability than the diffusive flux PSD. To test this hypothesis, we calculate the emitted dust flux, which requires estimating the dry deposition flux (see Eq. 12) for the same 15 min samples used in Figs. 8 and 9. Figure 10a and b display for different u* intervals the median dry deposition velocities vdep (solid lines) obtained by applying the parameterizations described in Appendix D of Fernandes et al. (2019) (referred to as F19) and Zhang et al. (2001) (referred to as Z01), respectively, for which field measurements have been used. In both cases vdep increases strongly with particle size from Di∼1.5 µm due to gravitational settling. At the same time, vdep scales with u*, which is more noticeable in F19 for coarse particles in the size range µm (Fig. 10a). In Z01 the scaling of coarse particles with u* is much more subtle than for particles with Di<2.5 µm (Fig. 10b). The stars in purple, blue, and cyan represent the observation-based vdep for the first three intervals of u*. The two parameterizations predict vdep reasonably well for m s−1 and µm but strongly underestimate it for the u* intervals (0.05–0.10] and (0.10–0.15] m s−1. For instance, for the u* interval (0.10–0.15] m s−1 F19 and Z01 underestimate the observed vdep (cyan star) by a factor of ∼3 for particles with Di=17.15 µm. Note that our observation-based estimates are broadly consistent with measurements reported by Bergametti et al. (2018), corresponding to an intense dust deposition event occurred in June 2006 in Niger (see Fig. S17).
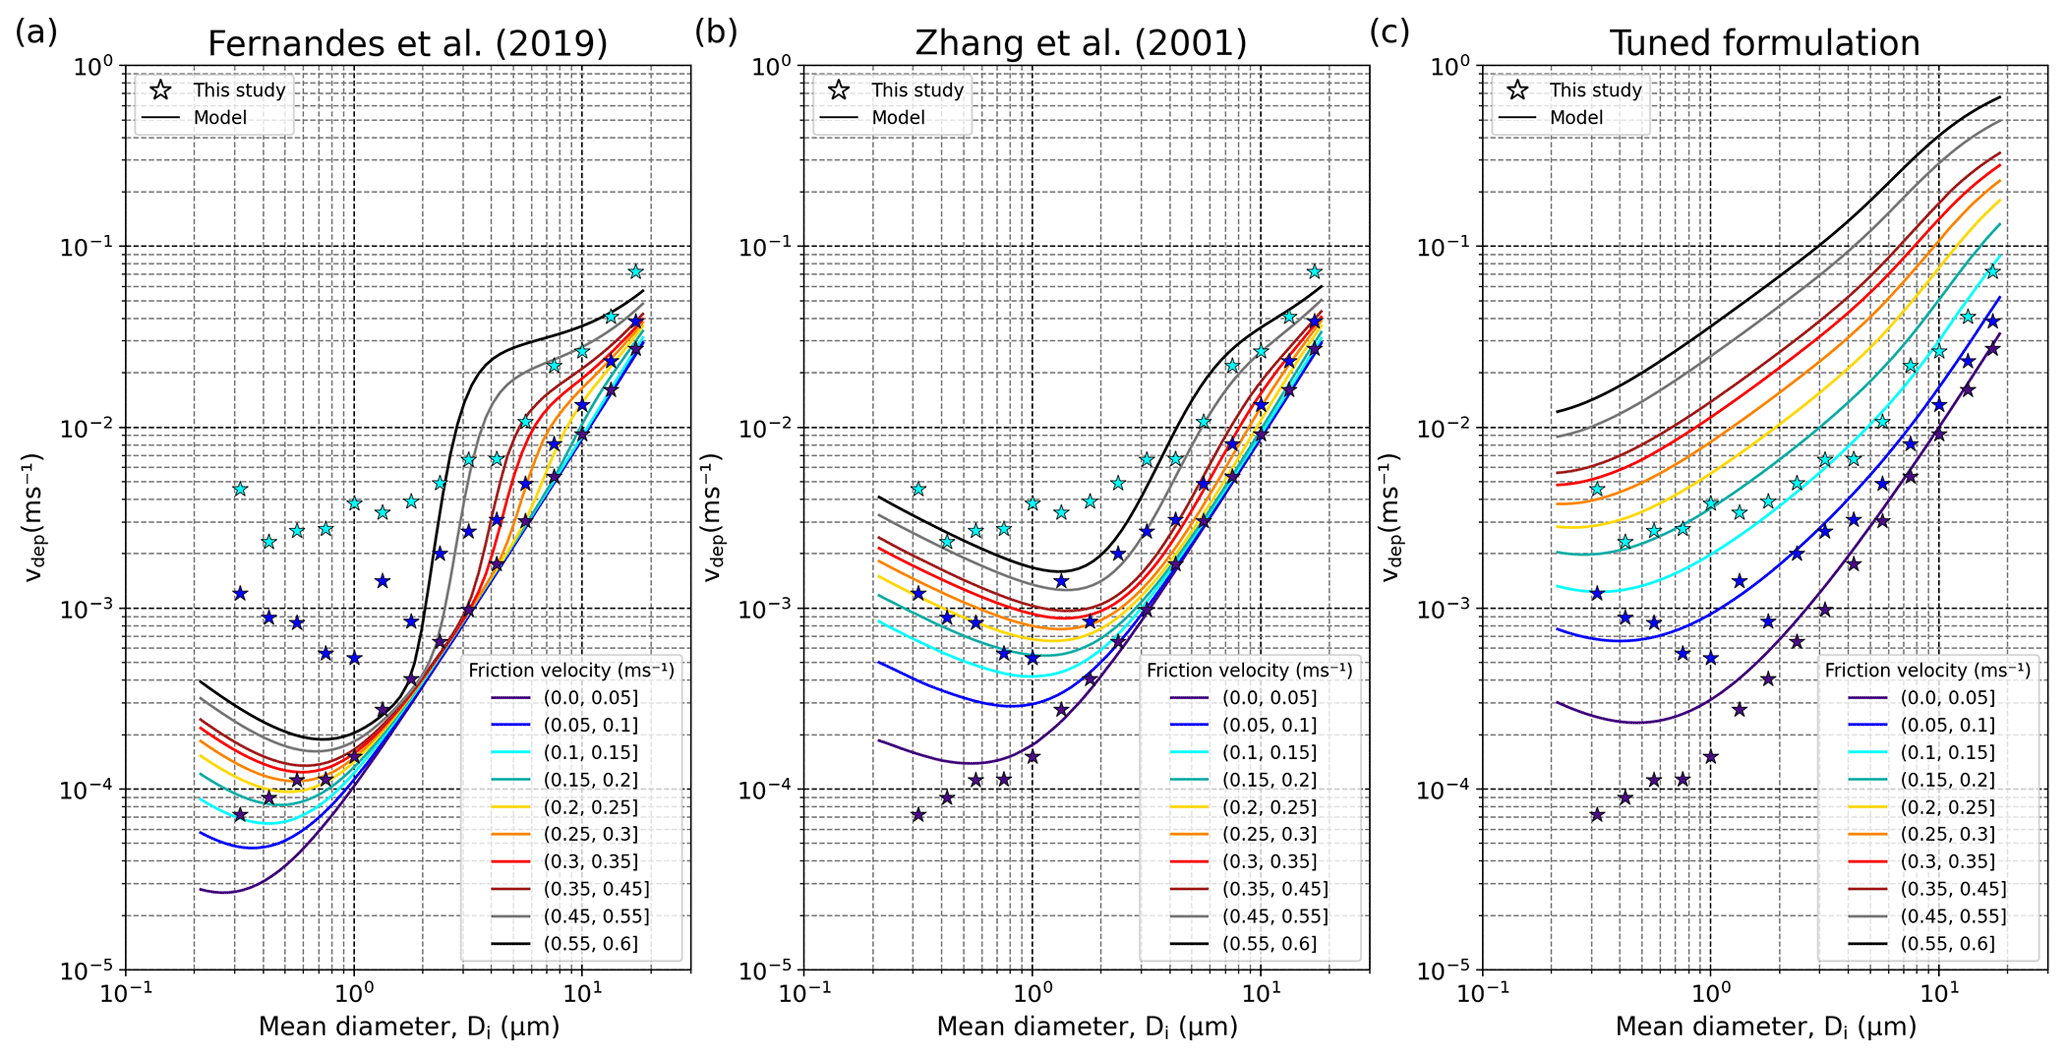
Figure 10Median size-resolved dry deposition velocities vdep (m s−1) obtained applying (a) F19, (b) Z01, and (c) tuned parameterization and using field measurements for different u* intervals (solid lines). The stars correspond to the median of the observation-based vdep for the u* intervals (0–0.05] m s−1 (purple), (0.05–0.10] m s−1 (blue), and (0.10–0.15] m s−1 (cyan).
Given the systematic underestimation of the parameterized vdep applying F19 and Z01, we updated and tuned Z01 vdep parameterization to best fit the observation-based estimates as described in Appendix D. The more suitable configuration was achieved for B1=0.02, dc=0.0009 m and Ain=15 (Fig. 10c). We note the low value required for the scaling factor of the aerodynamic resistance B1 (see more details in Appendix D and Sect. S10). The resulting size-resolved number and mass dry deposition fluxes obtained using Z01, F19 and the tuned parameterization are provided in Sect. S11.
Figure 11 shows the estimated size-resolved emitted dust mass flux calculated from Eq. (12) applying the vdep estimated with the tuned parameterization (results in number and from the other two schemes are shown in Sect. S12). The normalized emitted flux PSDs clearly show less variability as a function of u*, along with a lower shift towards finer dust and a lower reduction of super-coarse particles with increasing u* (Figs. 11c, d, S25c and d), in comparison to the normalized diffusive flux PSDs (Figs. 8c, d, 9c and d). These features can be better appreciated by integrating the fractions over four size ranges in Fig. S31, which is analogous to Fig. S30 but for the estimated emitted flux. The increase in the number fraction for µm with increasing u* (comparison between the u* intervals (0.15–0.20] and (0.30–0.35] m s−1) during regular events is reduced by ∼41 % and ∼28 % for the western and eastern sectors, respectively, in the estimated emitted dust flux in comparison with the diffusive flux (Figs. S31a and b versus S30a and b). However, the remaining difference between u* intervals is still statistically significant (p value <0.05) when individually considering the two smallest size bins (0.37–0.49 and 0.49–0.65 µm) for both wind sectors (Fig. 8c and d). The increase in the mass fraction for µm and the decrease for Di>10 µm with increasing u* (comparison between the u* intervals (0.15–0.20] and (0.30–0.35] m s−1) during regular events are also both reduced up to ∼13 % and ∼18 %, respectively, in the estimated emitted flux (Figs. S31c and d versus S30c and d). Despite the much lower decrease in super-coarse particles with increasing u* (Figs. 11c and d versus 8c and d), the differences between the u* intervals (0.15–0.20] and (0.30–0.35] m s−1 are still statistically significant (p value <0.05) for both wind sectors considering both the whole mass fraction Di>10 µm (Fig. S31c and d) and only the last integrated size bin (Fig. 11c and d). Similar trends are observed for the haboob on 4 September, while those for the haboob on 6 September seem to be the opposite, consistent with the higher variability in the haboob PSDs reported in Sect. 3.3.3.
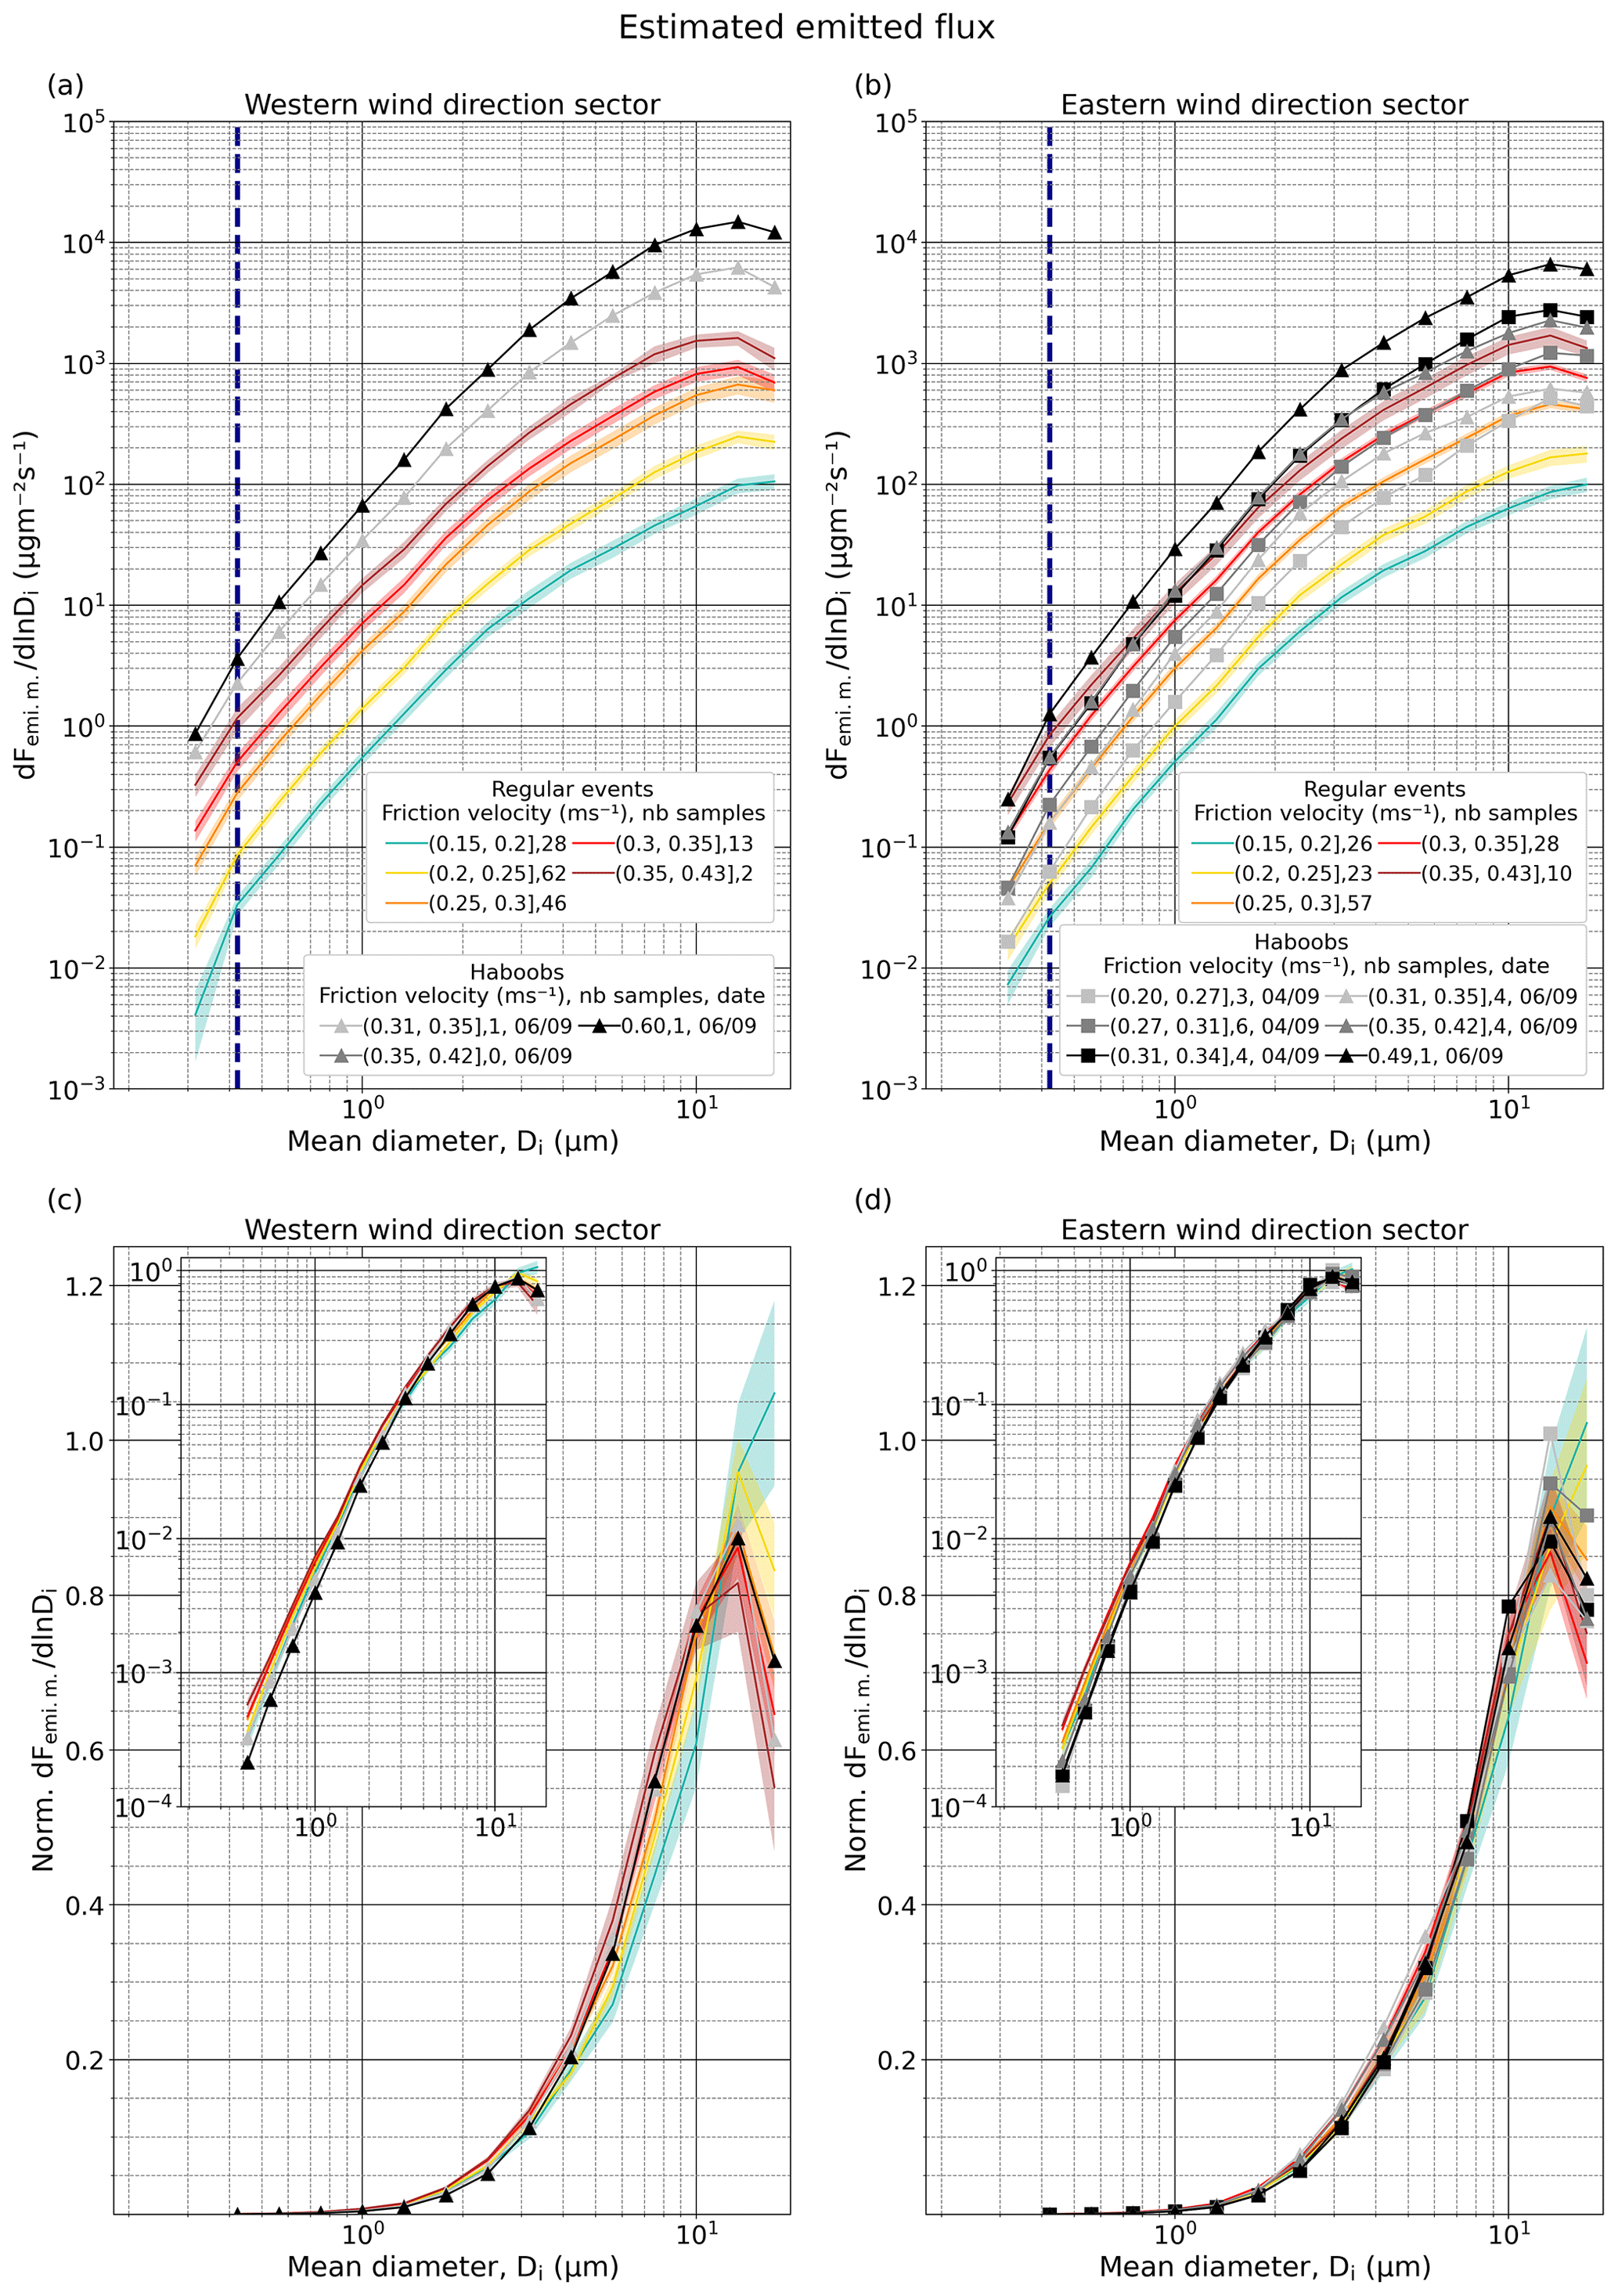
Figure 11Average size-resolved mass estimated emitted flux, (), for different u* intervals, types of events (regular or haboob) and wind directions in the range 150–330 (a) and 330–150∘ (b). The number of available 15 min average PSDs in each u* class are indicated in the legend. Only the samples where diffusive flux is positive in all the diameter bins above the anthropogenic mode (as discussed in Sect. 3.3.1) have been selected. Panels (c)–(d) are the same as (a)–(b) but normalized (Norm. ) after removing the anthropogenic mode (normalization from 0.37 to 19.11 µm). The insets show the same data but with logarithmic ordinate axis scaling. Shaded areas around the lines of the regular event PSDs illustrate the combination of random uncertainty and standard error. In (a) and (b) the dashed dark blue line marks the end of the anthropogenic mode (Di=0.42 µm). In this case, the original size resolution of FidasL has been reduced by integrating 4 consecutive bins, except for the last one that contains 3, resulting in 16 bins. The first integrated bin is not represented as Fidas is considered efficient from the second one onward. Results are shown only for well-developed erosion conditions ( m s−1).
Table 1 shows the mean and standard deviation of the number and mass percentages for the four size ranges in the diffusive and emitted fluxes during regular events for each wind sector, calculated from the average values of each u* interval shown in Figs. S30 and S31. For both wind sectors, the mean number percentage in the particle size range µm is reduced by ∼9 % in the estimated emitted flux compared to the diffusive flux, at the expense of both an increase of ∼23 % and >100 % for the size ranges and Di>10 µm, respectively. Mean mass percentages are reduced in the emitted flux compared to the diffusive flux for all size ranges except for Di>10 µm, where it increases by ∼29 %, for both wind sectors.
Table 1Mean and standard deviation (SD) of the number and mass percentages for the four size ranges in the diffusive and emitted fluxes during regular events for each wind sector, calculated from the average values of each u* interval shown in Figs. S30 and S31. The average of each u* interval contributes equally to the mean, and the standard deviation is a measure of the variability across u* interval averages. For the estimated emitted flux we used the vdep from the tuned parameterization.
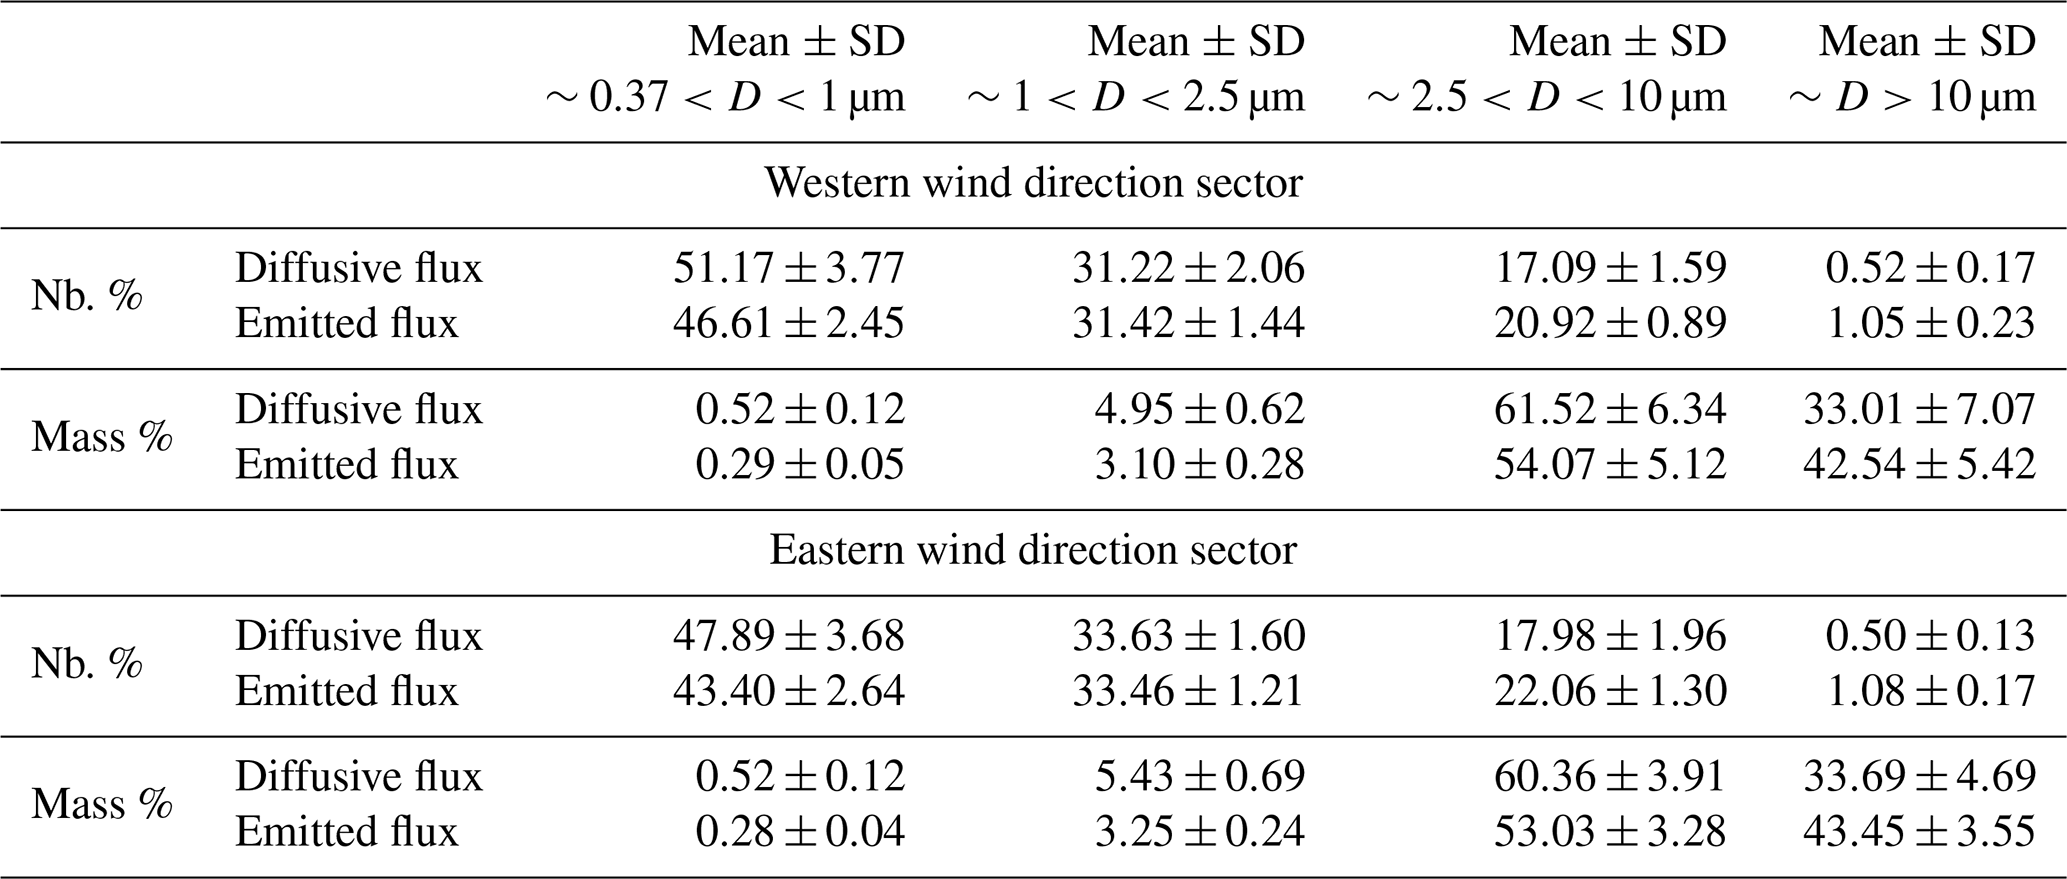
Our results show the potential importance of dry deposition as clearly depicted in Fig. S32, which displays the size-resolved ratio of the estimated dry deposition flux to the emitted flux determined using the tuned vdep parameterization. During regular events, we estimate dry deposition to represent up to ∼80 % of the emission for super-coarse particles between 55 % and 60 % for particles with Di∼10 µm and between 30 % and 45 % for particles with Di∼5 µm. During the haboob events these fractions are generally higher and more variable under similar u* intervals, reaching up to ∼90 % for super-coarse particles, up to 80 % for particles with Di∼10 µm, and between 50 % and 65 % for particles with Di∼5 µm.
3.6 Comparison with brittle fragmentation theory
In this section we sidestep wind direction differences and compare the obtained normalized concentration, diffusive flux, and estimated emitted flux PSDs with the emitted PSDs formulated in Kok (2011a) (Fig. 12) and Meng et al. (2022) (Fig. 13), both based on BFT. The former depends on the fully dispersed PSD and the latter on both the fully dispersed and aggregated soil PSDs. Here, our comparison focuses on the simplified parameterization proposed for modelling, which assumes a constant soil PSD and thus an invariant emitted PSD given the lack of spatially resolved soil PSDs.
For the sake of clarity, in Figs. 12 and 13 only two haboob PSDs are represented, corresponding to the two highest values of u* reached during the haboob events. While our number concentration PSD is close to the PSD derived from the Kok (2011a) parameterization (dashed pink line), particularly during regular events, our measurements show a substantially higher proportion of super-micrometre particles in the diffusive flux and the estimated emitted flux PSDs (Fig. 12a, c and e). In terms of mass, the super-coarse fraction is much higher in our PSDs (Fig. 12b, d and f), especially in the estimated emitted flux. Consequently, the fine and coarse mass fractions are smaller in our measurements.
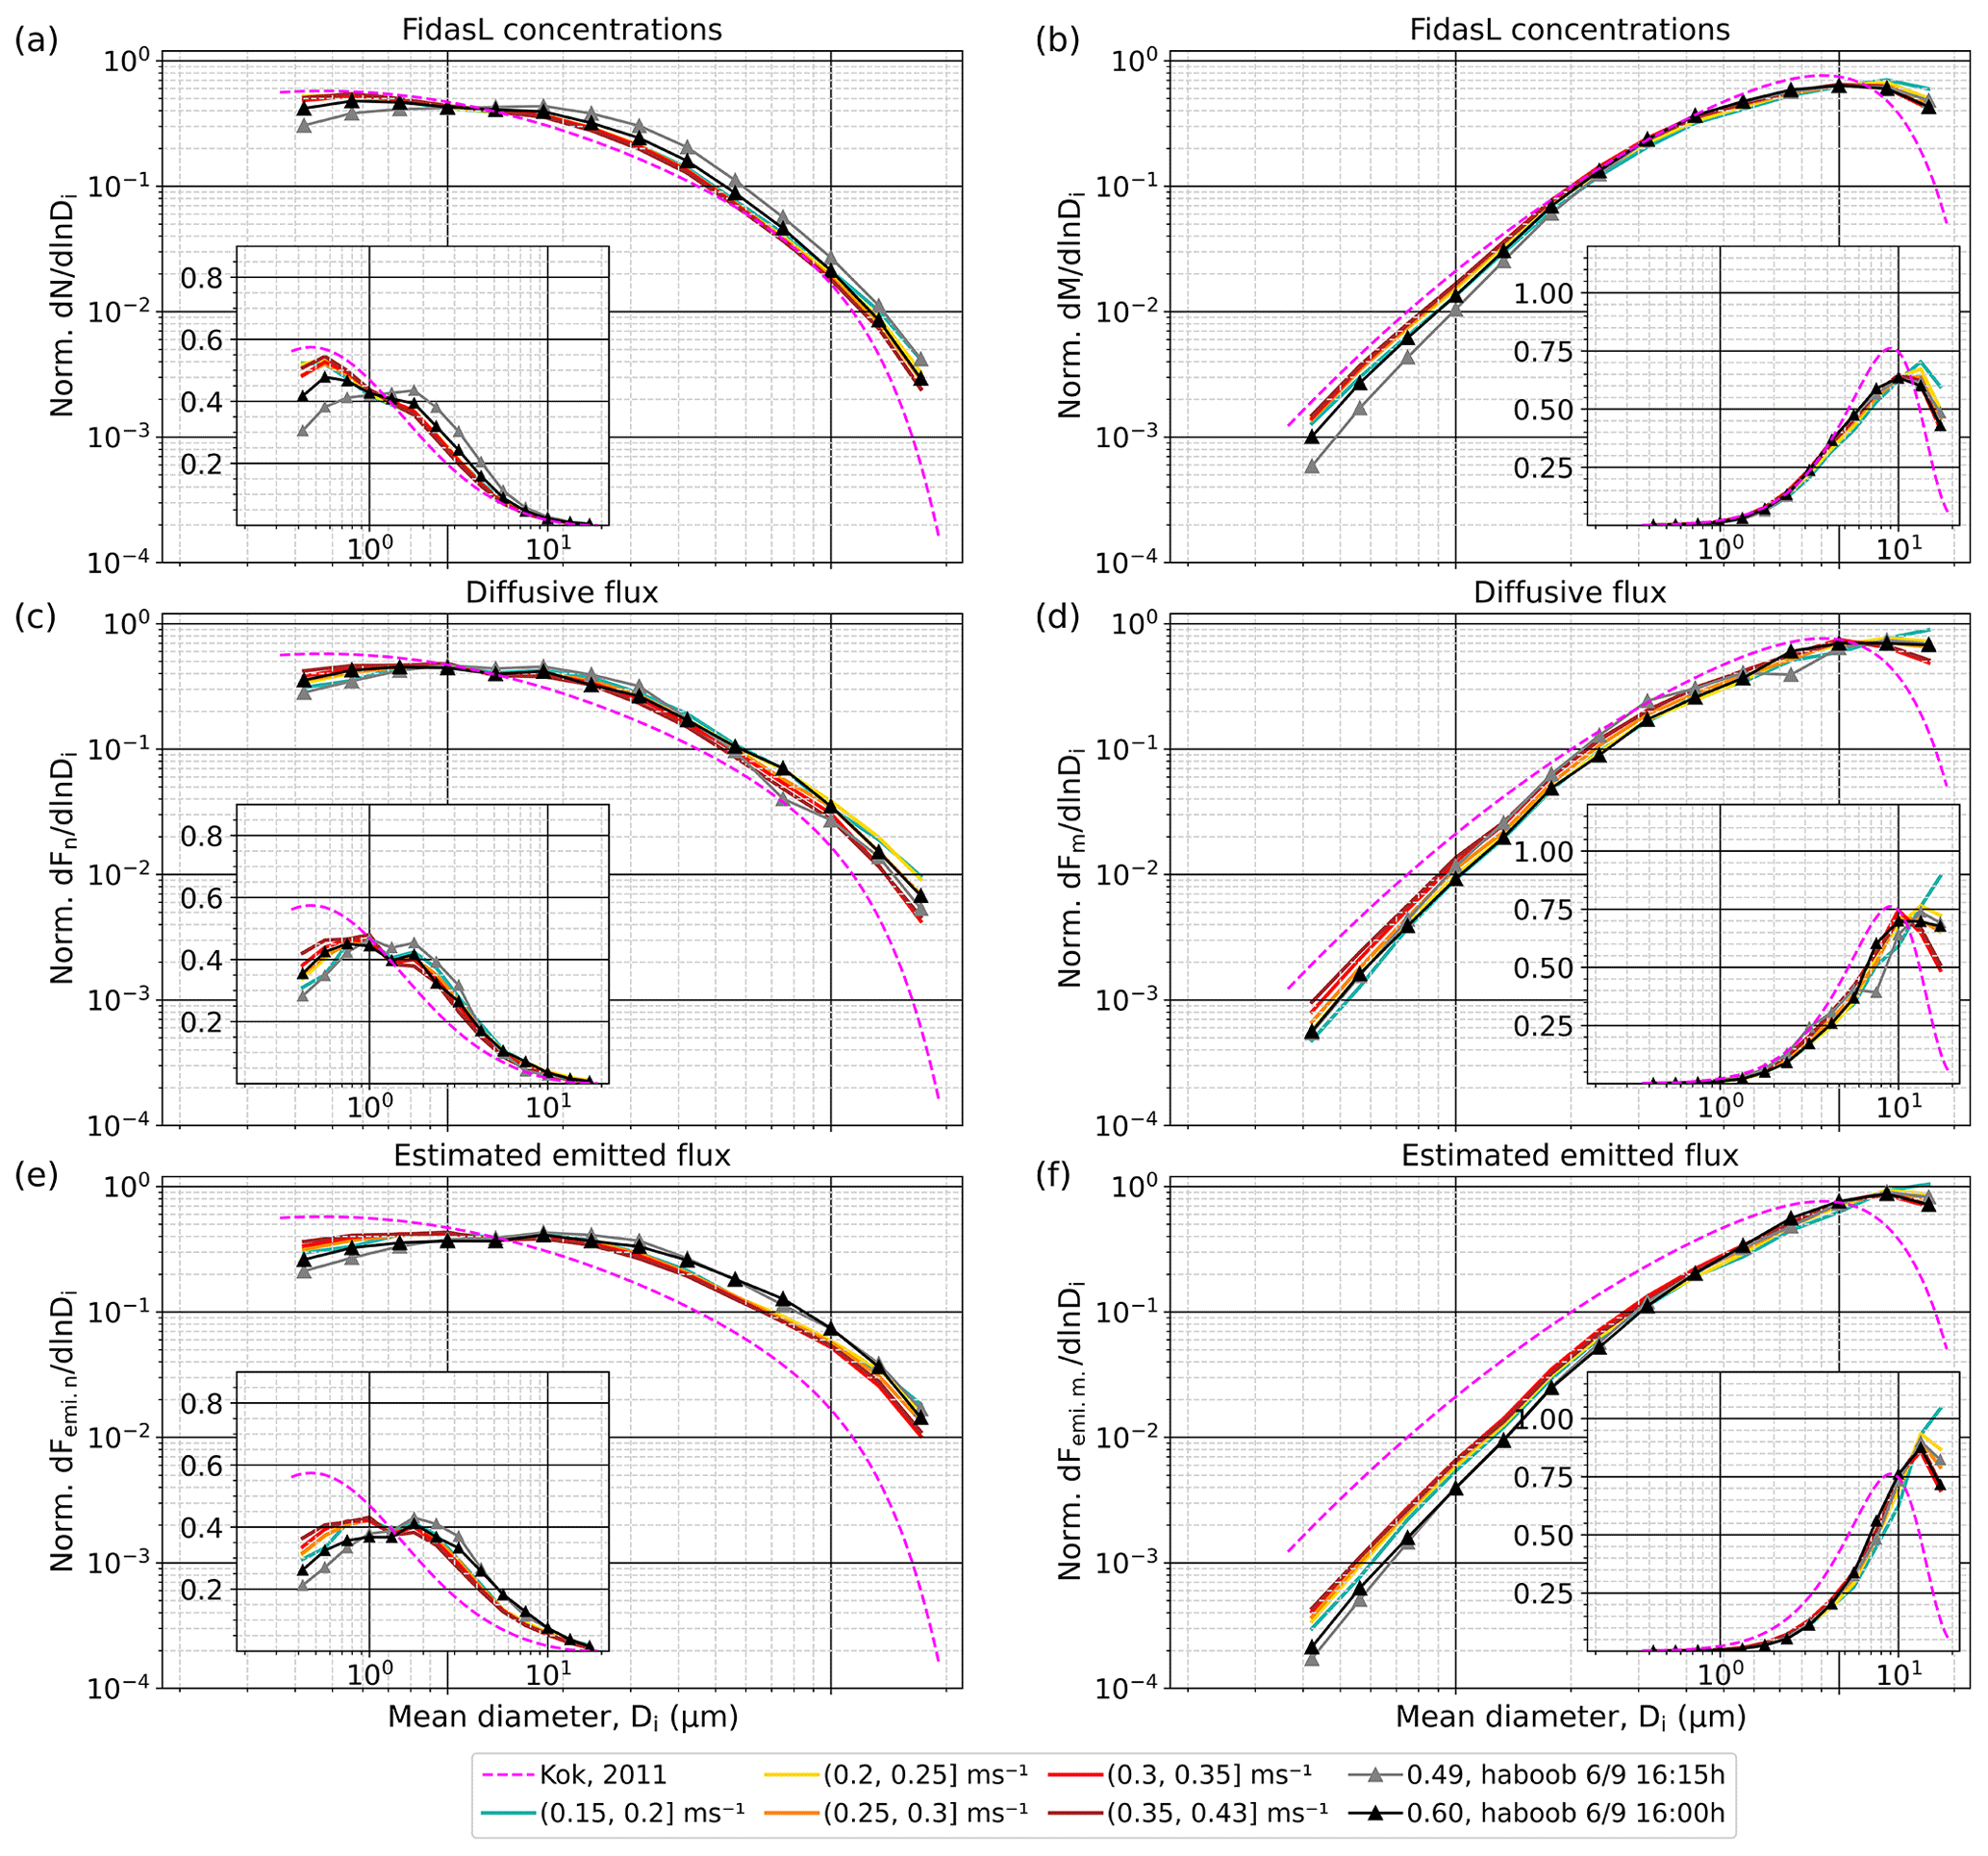
Figure 12Averaged normalized PSDs considering PSL latex spheres with a refractive index of 1.59+0i removing the anthropogenic mode (normalization from 0.37 to 19.11 µm) for well-developed erosion conditions during regular events and for two PSDs during haboob events for FidasL (a–b), for diffusive flux (c–d), and for estimated emitted flux using the vdep from the tuned parameterization (e–f). Panels (a, c, e) show PSDs in terms of number, and panels (b, d, f) show PSDs in terms of mass. The insets show the same data, but the scale of the ordinate is linear. Dashed pink lines represent the invariant Kok (2011a) size distribution. The original size resolution of FidasL has been reduced by integrating 4 consecutive bins, except for the last one that contains 3, resulting in 16 bins. The first integrated bin is not represented as Fidas is considered efficient from the second one onward.
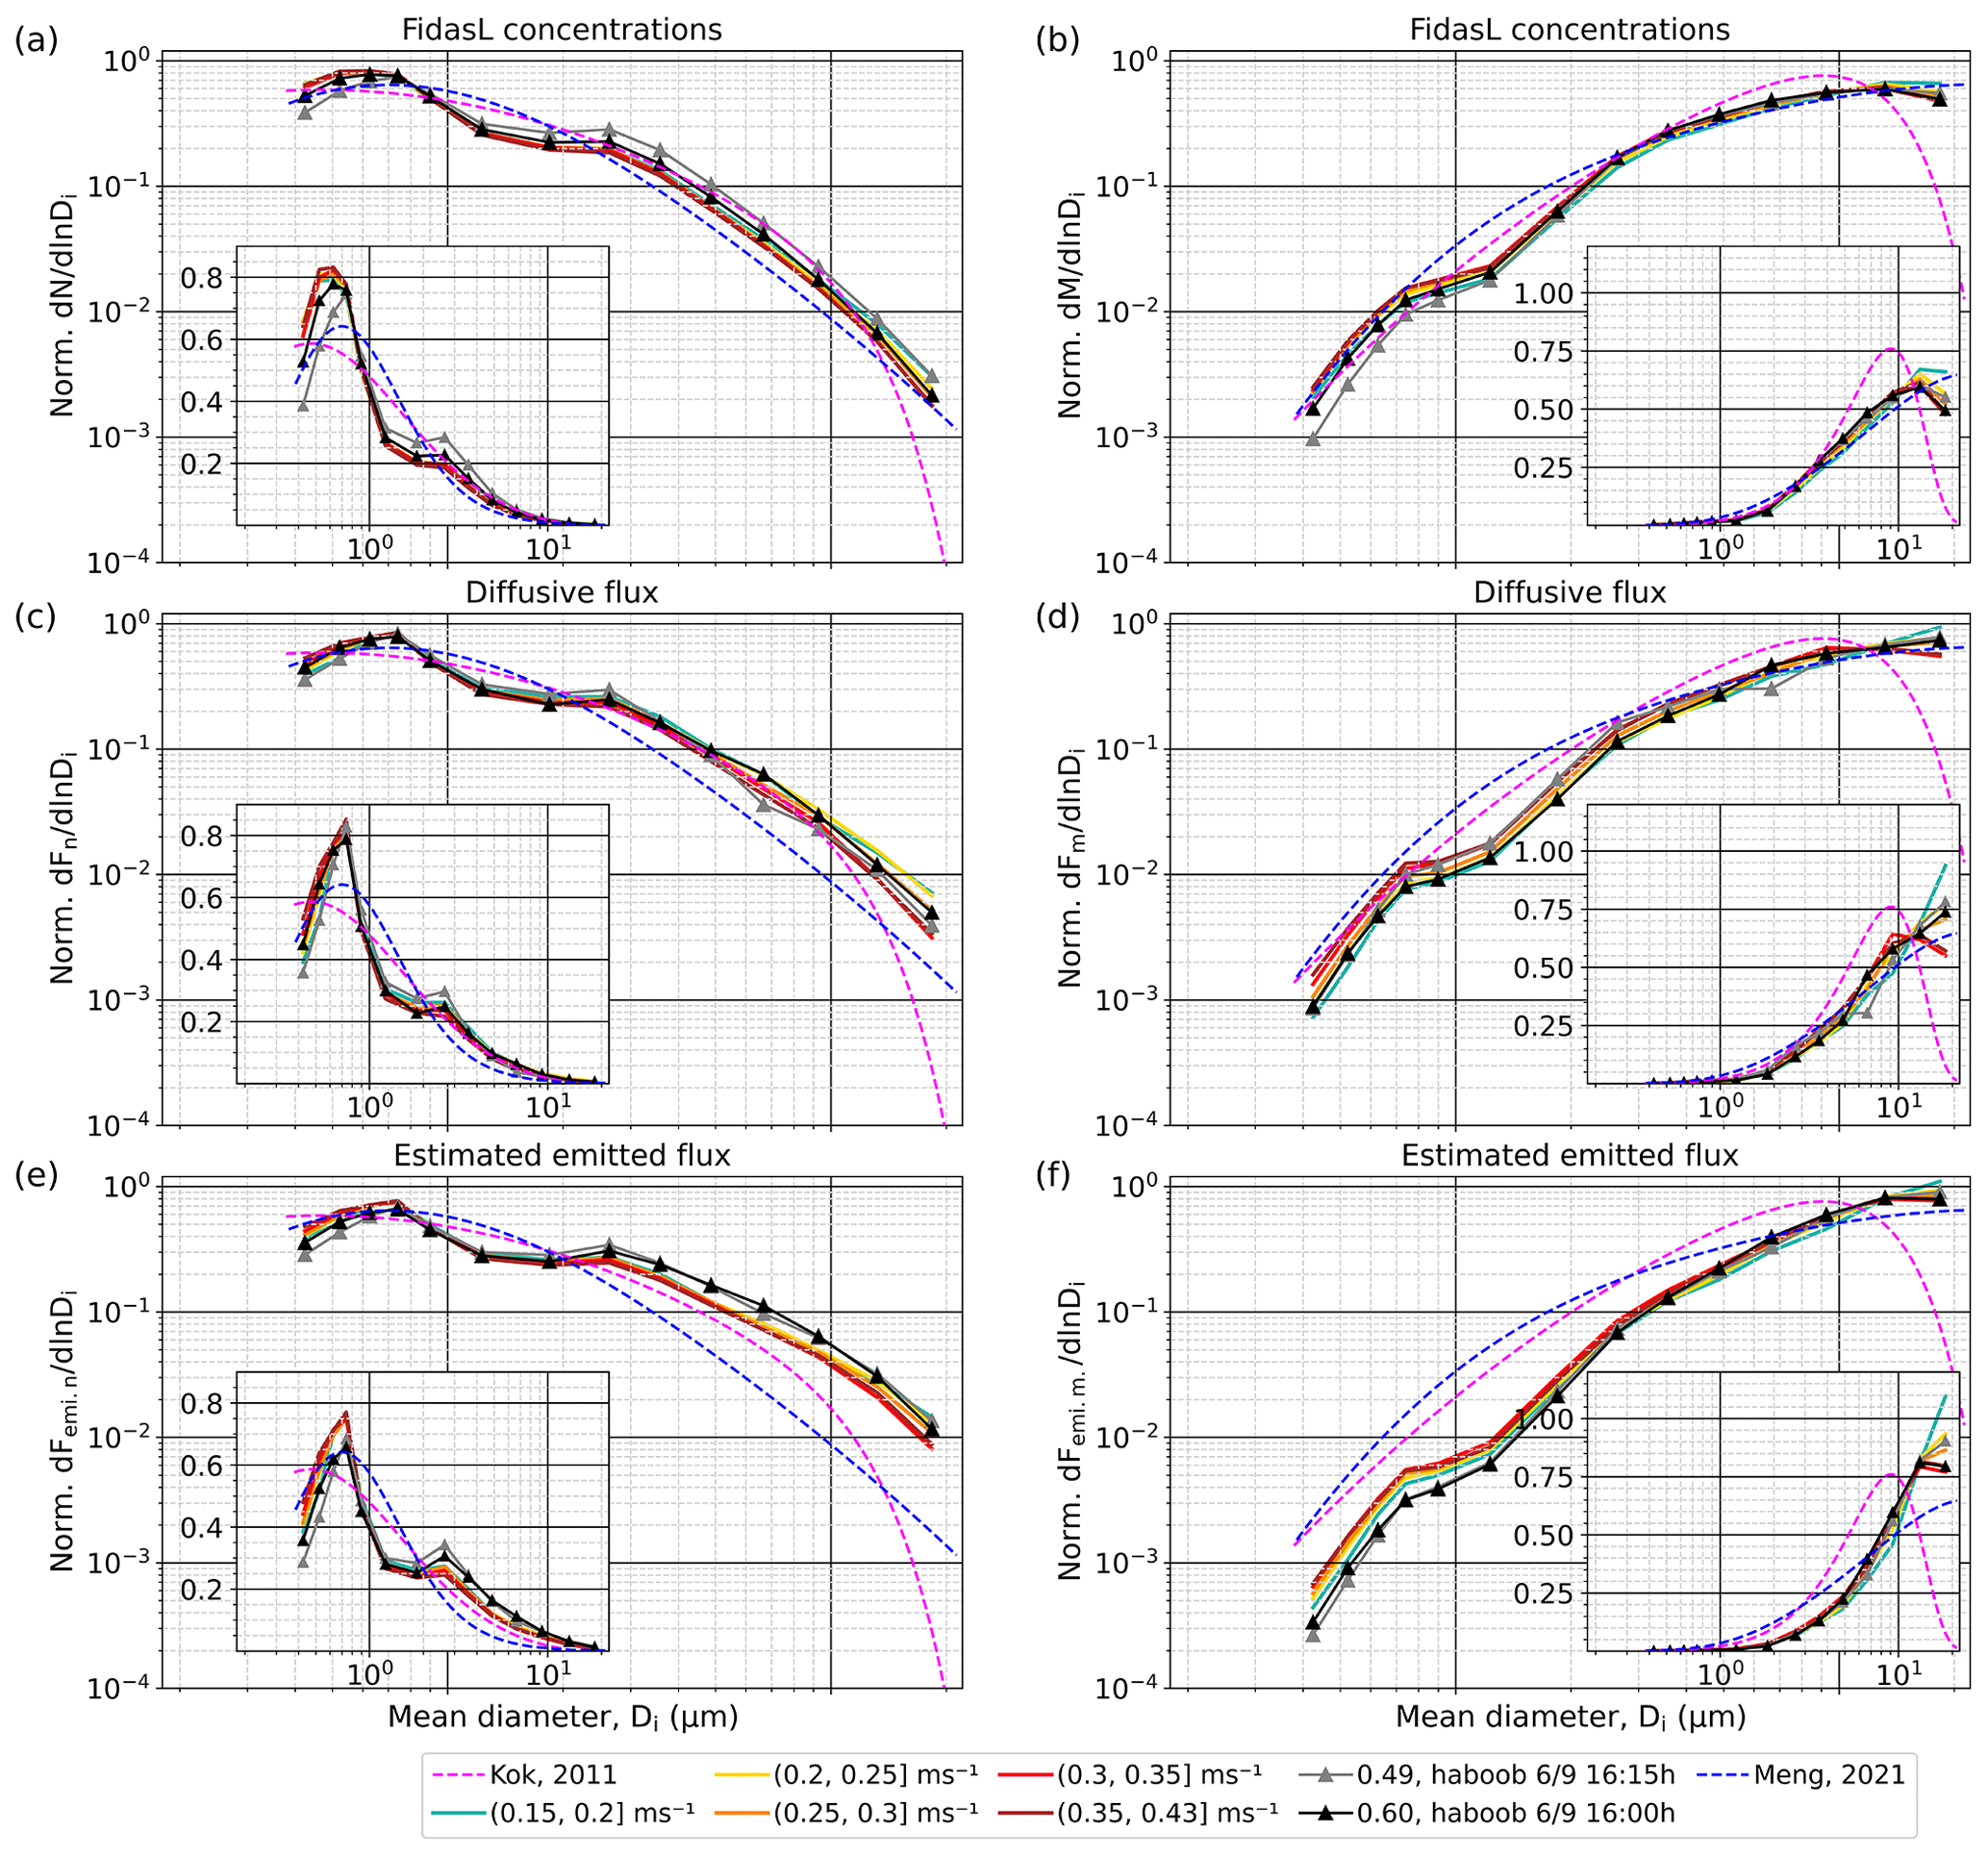
Figure 13Averaged normalized PSDs considering tri-axial ellipsoids of 1.49+0.0015i removing the anthropogenic mode (normalization from 0.37 to 19.11 µm) for well-developed erosion conditions during regular events and for two PSDs during haboob events for FidasL (a–b), for diffusive flux (c–d), and for estimated emitted flux using the vdep from the tuned parameterization (e–f). Panels (a, c, e) show PSDs in terms of number, and panels (b, d, f) show PSDs in terms of mass. The insets show the same data, but the scale of the ordinate is linear. Dashed pink lines represent the invariant Kok (2011a) size distribution. Dashed blue lines represent Meng et al. (2022) data. The original size resolution of FidasL has been reduced by integrating 4 consecutive bins, except for the last one that contains 3, resulting in 16 bins. The first integrated bin is not represented as Fidas is considered efficient from the second one onward.
While the measured PSDs shown in Fig. 12 assume that dust particles are PSL latex spheres with a refractive index of 1.59+0i, results shown in Fig. 13 consider a more realistic representation of the shape and composition of the measured dust particles, i.e. it assumes tri-axial ellipsoids and a refractive index of 1.49+0.0015i. Furthermore, these transformed PSDs are compared with the updated BFT parameterization (Meng et al., 2022) (dashed blue line), which accounts for super-coarse dust and is constrained with measured PSDs harmonized to geometric diameters assuming dust is a tri-axial ellipsoid (Huang et al., 2021). The proportion of particles with and µm is higher and that of particles with and with µm is lower in the updated parameterization than in the original one (dashed blue versus dashed pink lines in Fig. 13a, c, and e). In terms of mass, the proportion of particles with and µm is higher and that of particles with µm is lower in the updated parameterization than in the original one (dashed blue versus dashed pink lines in Fig. 13b, d and f).
Table 2Mean and standard deviation of the number and mass percentages for the four size ranges in the diffusive and emitted fluxes during regular events for each wind sector, assuming tri-axial ellipsoids. The average of each u* interval contributes equally to the mean, and the standard deviation is a measure of the variability across u* interval averages. For the estimated emitted flux we used the vdep from the tuned parameterization.
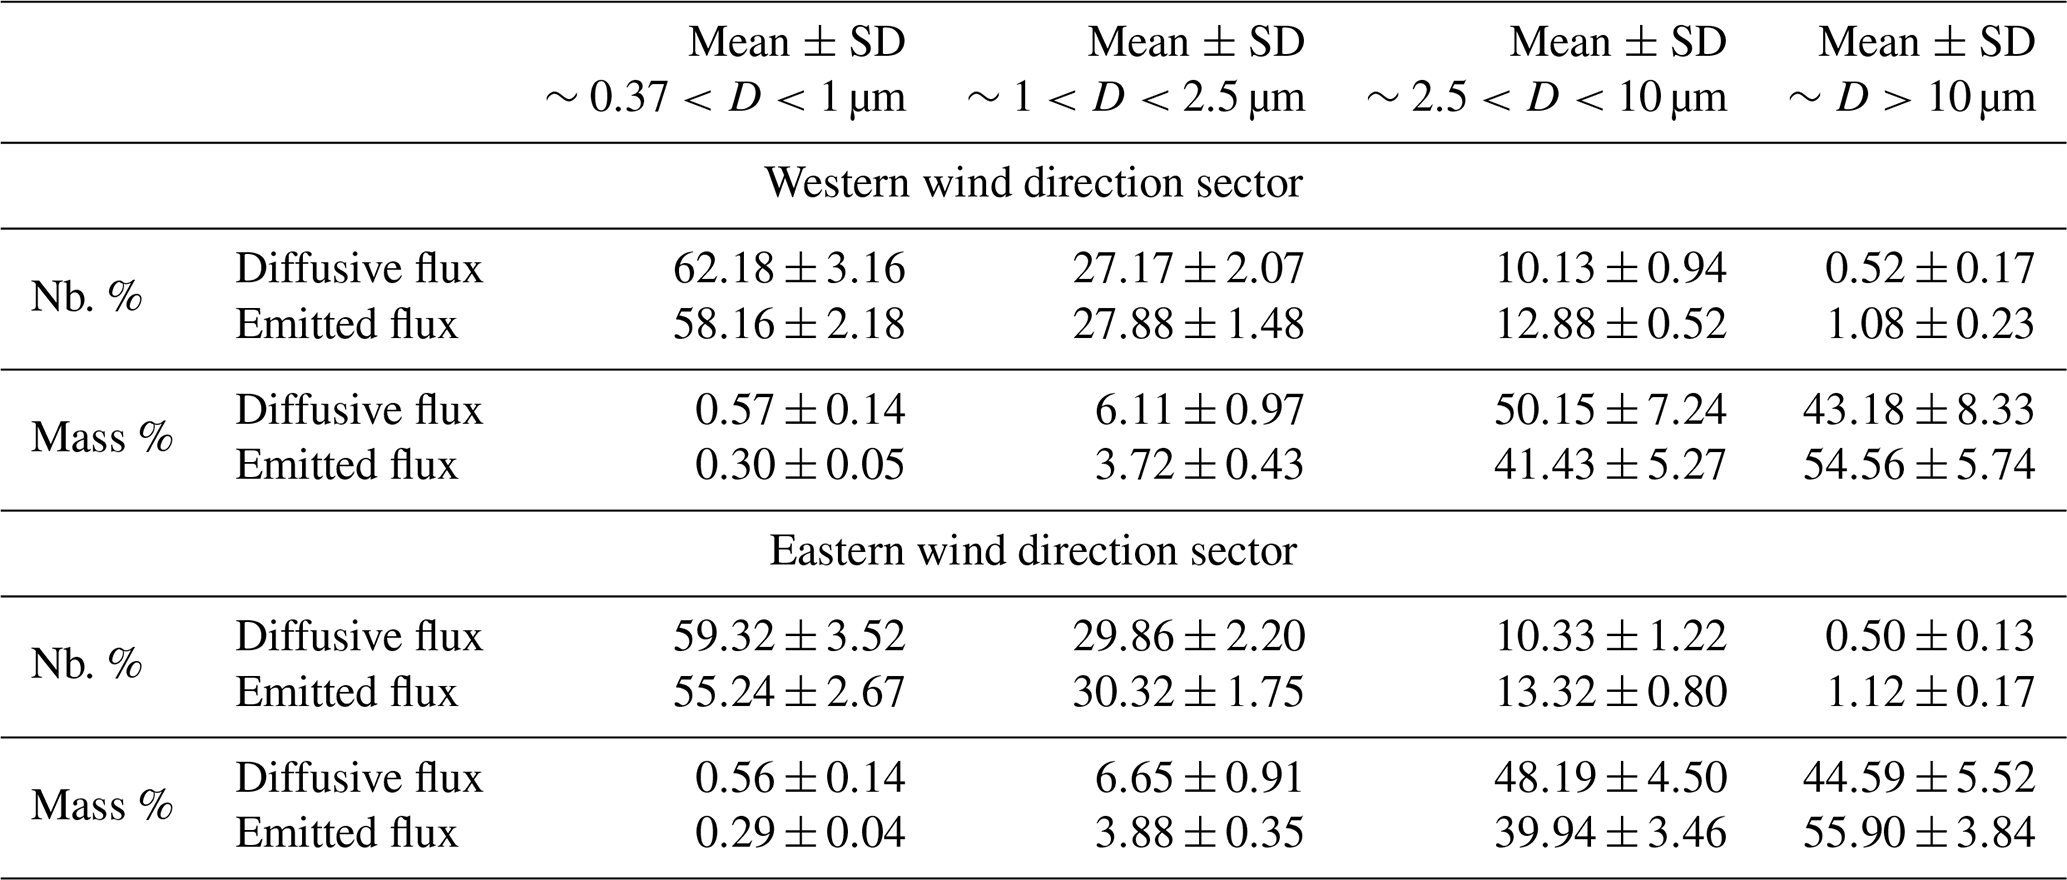
Our converted PSDs show substantial differences with respect to the Meng et al. (2022) parameterization. Firstly, our number concentration (Fig. 13a), diffusive flux (Fig. 13c) and estimated emitted PSDs (Fig. 13e) have a higher proportion of particles with µm. Conversely, our PSDs show a lower proportion of particles with Di∼(0.8–2) µm and a higher proportion of particles with µm. The latter is more pronounced in the case of the diffusive flux PSD, and especially in the estimated emitted PSD. Secondly, the mass concentration PSD (Fig. 13b) show from relatively similar to lower fractions of particles with µm. The lower fractions are particularly noticeable in the range of particles with Di∼(0.8–2.5) µm. Conversely, the fractions are relatively similar to higher for particles with µm. Furthermore, depending on the type of event and u*, there is a higher or lower fraction of dust particles with µm. Thirdly, the mass diffusive and estimated emitted flux PSDs (Fig. 13d and f, respectively) display a similar pattern to the mass concentration PSD (Fig. 13b). However, they exhibit higher fractions of coarse dust (with –8) µm) and generally super-coarse dust. Additionally, they show lower fractions of dust with –8) µm and a substantial reduction in the range Di∼(0.8–2.5) µm, especially in the estimated emitted flux PSD.
Table 2 is analogous to Table 1 but considering tri-axial ellipsoids. The trends in the mean number and mass fractions of the diffusive and estimated emitted fluxes are similar to those described when using the original diameters in Sect. 3.5. However, the mean number fractions for µm are ∼22 %–24 % and ∼25 %–27 % higher for the diffusive and the estimated emitted flux, respectively, than when assuming PSL latex spheres. At the same time, the mean number fractions µm are ∼41 %–43 % and ∼38 %–40 % lower for the diffusive and the estimated emitted flux, respectively. In terms of mass, the most remarkable when considering tri-axial ellipsoids is the increase of ∼31 %–33 % and ∼28 %–29 % in the fraction Di>10 µm of the diffusive and estimated emitted flux, respectively.
This study contributes to the advancement of our understanding of the emitted dust PSD and its variability based on the analysis and interpretation of intensive measurements performed during the FRAGMENT field campaign in the Moroccan Sahara in September 2019. Our measurements were performed in an ephemeral lake located in the Lower Drâa Valley of Morocco surrounded by small sand dune fields. Saltation and dust emission occurred regularly, generally following the diurnal cycles of surface winds associated to solar heating. In addition to these “regular events”, we also identified two “haboob events”. Our site was characterized by relatively low sandblasting efficiencies in comparison to some previous studies, which we attribute to the paved sediment that constitutes the surface of the ephemeral lake. Despite the low sandblasting efficiencies, diffusive and saltation fluxes were relatively high due to frequent and intense saltation. The sandblasting efficiency decreased with increasing saltation flux and u*, which we partly attribute to the observed reduction in the mass fraction of super-coarse particles in the diffusive flux with increasing u*.
We have thoroughly analysed the concentration and diffusive flux PSDs in terms of number and mass, observing robust dependencies upon u*, wind direction, and type of event (regular versus haboob). Our analysis shows differences between the concentration and diffusive flux PSDs and highlights the potential major role of dry deposition in shaping the PSD variations in both cases, modulated by the wind-direction-dependent fetch length and u*. Our results support the hypothesis that the shift towards a finer diffusive flux PSD with increasing u* is to a large extent due to an increase in the dry deposition flux of coarse and super-coarse dust with u*. As far as we know, this is the first time that the effect of dry deposition upon the diffusive fluxes is identified experimentally, supporting results from numerical simulations in recent studies (Dupont et al., 2015; Fernandes et al., 2019). The influence of dry deposition can invalidate the common assumption that the diffusive flux PSD is equivalent to the emitted dust PSD, particularly when including the super-coarse size range, and has consequences for the evaluation of dust emission schemes and their implementation in dust transport models. Our estimation of the emitted dust flux based on the diffusive flux and an estimated dry deposition flux suggests that the emitted dust PSD is coarser and its variability is smaller than that of the diffusive flux PSD.
Our estimation of the emitted flux must be taken with caution, as in the absence of observation-based dry deposition velocities for all u* conditions, we had to use a resistance-based parameterization tuned with observation-based dry deposition velocities below the threshold of dust emission. Furthermore, given the large uncertainties associated with resistance-based parameterizations it cannot be discarded that our tuned parameterization partly overestimates the dry deposition velocity, thereby indirectly accounting for sampling inefficiencies of the inlet, which may affect coarse and super-coarse particles for high wind velocities. Although the Sigma-2 inlet has been designed to be efficient for coarse particles, we currently ignore its sensitivity upon u*. Theoretically quantifying the efficiency of the Sigma-2 inlet is difficult due to its relatively complex geometry. Future work may experimentally quantify its sampling efficiency as a function of particle size and wind.
In our location, we estimate dry deposition to represent an important portion of dust emission, up to ∼90 % for super-coarse particles, up to 80 % for 10 µm particles, and up to 65 % for particles as small as 5 µm in diameter during the haboob events. This shows that dry deposition needs to be properly accounted for, even in studies limited to the fine and coarse size ranges. Our results further imply that at least part of the variability among the diffusive flux PSDs obtained in different locations and that are used to constrain emitted dust PSD theories (e.g. Meng et al., 2022) may be due to the effect of dry deposition modulated by differences in fetch length and u* regime.
While we mainly attributed the reduction in super-micrometre particles with u* to the effect of dry deposition, we cannot fully discard that enhanced aggregate disintegration (Alfaro et al., 1997; Shao, 2001) plays an additional role in enhancing the sub-micrometre number fraction, although in the case of the haboob events there was no detectable increase in the proportion of sub-micrometre particles with increasing u*. We find clear differences in the haboob PSDs with respect to the regular PSDs, in particular a lower proportion of sub-micrometre particles for equivalent or higher u* intervals, which could be explained by a shorter “effective” fetch associated to the haboob. Also, we find more dry deposition and variability in the coarse and super-coarse dust mass fractions with diameters >3 µm during the haboobs. We suggest that this feature could be related to the effect of the moving haboob dust front, where u* and dust emission are maximized, around our measurement site (which is equivalent to a variable fetch). Our explanation is largely hypothetical and remains to be verified with targeted numerical experiments. We suggest that another mechanism consistent with the smaller proportion of sub-micrometre particles would be an increased resistance of soil aggregates to fragmentation with the observed increase in relative humidity along the haboob outflow.
We finally compared our PSDs with the invariant PSDs derived from the parameterization of Kok (2011a), based on BFT, and the recently updated scheme that accounts for super-coarse dust emission and uses measurements harmonized in terms of geometric diameter (Meng et al., 2022). We obtain a substantially higher proportion of super-micrometre particles in the diffusive and in particular in the estimated emitted flux PSDs in comparison with the Kok (2011a) PSDs. Our comparison with the Meng et al. (2022) parameterization is performed after transforming the standard optical diameter PSDs into geometric diameter PSDs, where we account for a more realistic index of refraction and shape of the dust particles. Despite the inclusion of super-coarse dust in the updated BFT, our PSDs show a higher proportion of particles above ∼2 µm and a higher mass fraction of super-coarse particles both in the diffusive flux and estimated emitted PSDs. It is important to emphasize that this diameter transformation can be very sensitive to shape, refractive index, and wavelength (or spectrum) of the light beam. However, a detailed analysis of this sensitivity was beyond the scope of this study. Future studies may attempt at evaluating BFT using the specific fully dispersed and aggregated soil PSDs measured in our location.
As discussed in Sect. 2.2.2, the transformation of the default PSL diameters into dust geometric diameters requires calculating the scattered intensities of the PSLs and the aspherical dust from the following variables:
Wavelength of the light beam and scattering angle. The Fidas determines the number and size of particles using a poly-chromatic unpolarized LED light source. Each particle that moves through the measurement volume generates a scattered light impulse that is detected at an angle of 90±5∘. Unfortunately, neither the characteristics of the polychromatic light beam of the Fidas nor the spectral sensitivity of the sensor were provided by the manufacturer. However, the manufacturer provided a software that allowed us to convert the obtained PSDs with PSLs to PSDs of spherical particles assuming 16 different refractive indices. We used this information, the information on the scattering angle, and the Lorenz–Mie code used in Escribano et al. (2019) to infer a light spectrum that can best reproduce the software conversions between spherical aerosol types. Our optimization problem was constrained to fit a sum of Gaussian spectra over the wavelength domain. The resulting single-Gaussian optimal spectrum has a centre wavelength of 389 nm and a standard deviation of 77 nm. We have therefore used this spectrum to convert the optical PSL diameters to dust geometric diameters. The obtained spectrum is consistent with the apparent bluish LED light of the Fidas.
Shape. The sideward scattered intensity depends on particle shape. Since PSLs are spherical, we obtained their single-scattering properties based on Lorenz–Mie theory. For dust, we assume dust particles are tri-axial ellipsoids because extensive measurements have found that dust particles are three-dimensionally aspherical (Huang et al., 2021). To quantify dust asphericity, we used an aspect ratio (AR) of 1.46, which is the median AR of the more than 300 000 individual dust particles collected during our campaign and analysed in the laboratory using scanning electron microscopy (SEM) coupled with energy-dispersive X-ray spectrometry (EDX) (Panta et al., 2023). We did not perform measurements of the height-to-width ratio (HWR), so we assume HWR =0.45, which is the closest value to the global median of 0.4 obtained in Huang et al. (2021). We combined the AR and HWR with the database of shape-resolved single-scattering properties of ellipsoidal dust particles (Meng et al., 2010), following Huang et al. (2021).
Refractive index. Our preliminary analyses of the optical properties (Yus-Díez et al., 2023) and mineralogical composition (González-Romero et al., 2023) suggest imaginary parts of the refractive index between 0.0015 and 0.002, consistent with chamber-based re-suspension estimates using Moroccan soil samples in Di Biagio et al. (2019). Here, we use a value of 0.0015 for the imaginary part, and we assume a value of 1.49 for the real part as obtained in Di Biagio et al. (2019) with their Moroccan samples.
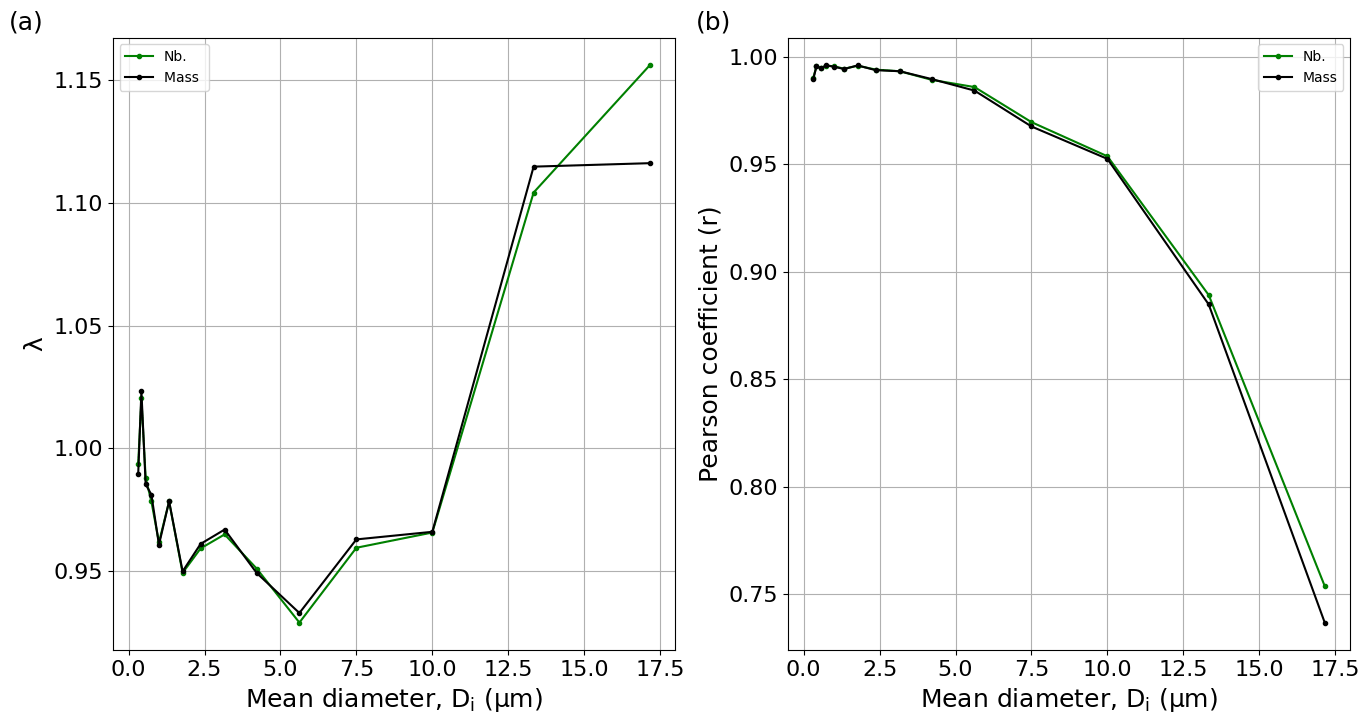
Figure B1(a) Systematic correction parameter λi and (b) Pearson coefficient r for each integrated size bin i. Green (black) lines depict these variables in terms of number (mass) of particles.
By the end of the campaign, the two Fidas were intercompared bin by bin (in the original size bin resolution) at the same height (1.8 m) from 1 October at 10:15 UTC to 2 October at 08:00 UTC. The goal of the intercomparison was to (1) obtain a correction factor per bin that removes the systematic differences between sensors, and (2) estimate the (random) uncertainty in the size-resolved diffusive flux (see Appendix C). The intercomparison period was affected by a regular event from ∼14:00 to 17:00 UTC reaching maximum 15 min number and mass concentrations of m−3 and ∼2700 µg m−3, respectively, which are very far from the maximum 15 min dust number and mass concentrations of m−3 and ∼44 700 µg m−3, respectively, measured during the campaign.
We consider the FidasL as the reference device and therefore we correct the systematic deviation of the FidasU. The systematic correction parameter λi for each bin i shown in Fig. B1a is calculated as the slope of the regression between the concentration of the two Fidas during the intercomparison period:
where is the concentration from FidasL and is the uncorrected concentration from FidasU with diameter Di during the intercomparison period. If λi>1 the concentration of FidasU is lower and if λi<1 the concentration FidasL is higher. Figure B1a shows λi in the integrated size bin resolution both in terms of number (green line) and mass (black line) concentrations. Note that number concentrations were transformed to mass concentrations in the original size bin resolution before obtaining the integrated size bin concentrations used to calculate these λi. As shown in Fig. B1b, the Pearson correlation coefficient r was above 0.95 for all bins, except for the two coarsest ones where it decays to ∼0.88 and ∼0.75, respectively.
The corrected FidasU concentration (cu) during the campaign was then obtained by simply scaling the uncorrected concentration over the whole campaign with λi:
Similarly, the corrected FidasU concentration () during the intercomparison period is
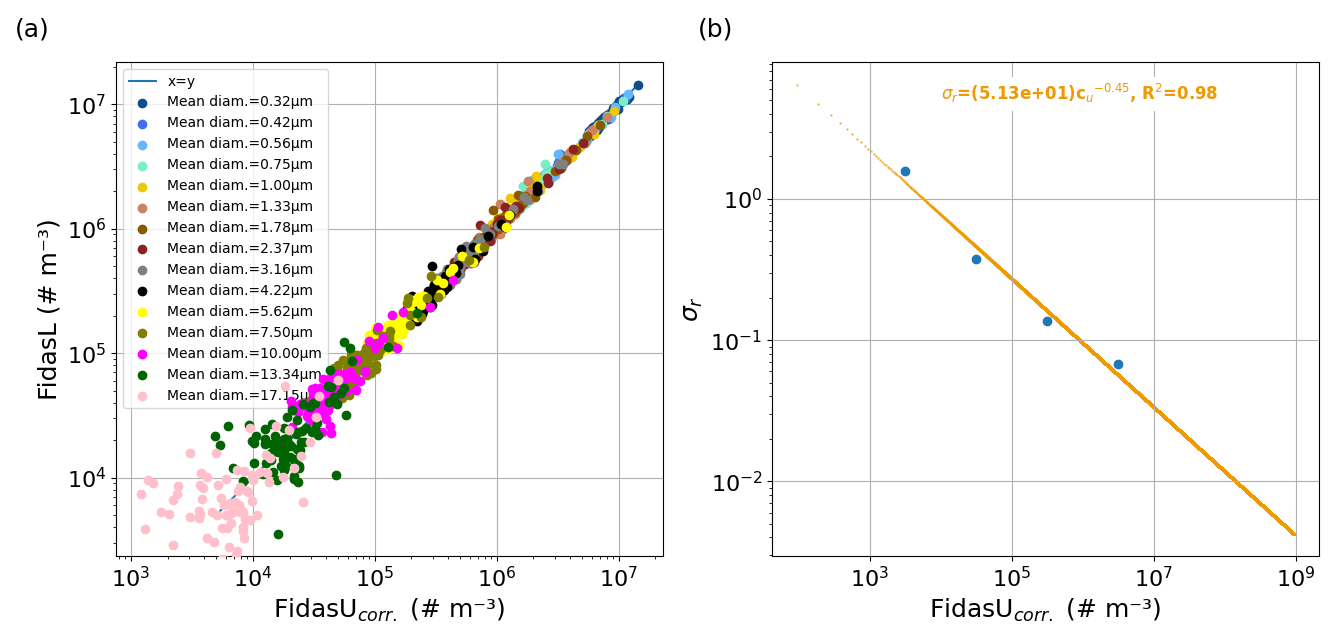
Figure C1(a) FidasL versus FidasU (after systematic correction) number concentrations (m−3) during the intercomparison period. Concentrations in each bin are represented with different colours. (b) σr versus corrected FidasU number concentrations (m−3) during the intercomparison period. The line in (b) represents the regression curve of the form .
There are three main sources of uncertainty in the size-resolved diffusive flux calculated with the flux gradient method (Eq. 9) (Dupont et al., 2021): (1) u*, (2) the difference between FidasU and FidasL concentrations, and (3) the difference in stability between the two levels. We neglect the uncertainties on u* and stability because they are size-independent and small compared to the size-resolved concentration uncertainties (Dupont et al., 2018), and our main interest is the PSD. We take the FidasL as the reference device, and thus the uncertainty in the diffusive flux only depends on the uncertainty of the FidasU concentration with respect to the FidasL concentration , where σ represents the standard deviation:
Figure C1a displays the number concentrations measured by the FidasU after the systematic correction (see Appendix B) versus the FidasL concentrations in each bin during the intercomparison period. We observe a clear relative increase in the scatter as the number concentration decreases both for each bin and across bins. In other words, the relative uncertainty of the number concentration is strongly dependent upon the number concentration, which is orders of magnitude smaller for large particles than for fine particles. Based on this, we can express the relative uncertainty σr as follows:
where is the FidasU number concentration in any size bin and a and b are constants that can be obtained by fitting the data as described below. Being able to express the uncertainty as a function of the number concentration independent of size is key to avoid overestimating the uncertainty of the diffusive flux because the concentrations measured during the campaign were generally much higher than the ones measured during the intercomparison period (see Appendix B).
In order to fit Eq. (C2), we first calculate the ratio of the FidasL to the corrected FidasU number concentrations for each bin i and time step j (every 15 min) during the intercomparison period:
where and are the FidasL and corrected FidasU number concentrations. We then calculate the standard deviation of these ratios σrk within k number concentration intervals as follows:
where are the ratios within each k interval, is the average ratio within each interval k, and N is the number of samples in each interval k. We select four k intervals with the following number concentration ranges: 103–104, 104–105, 105–106, and 106–107 m−3, covering the range of most of the points during the intercomparison period (Fig. C1a).
The σrk values associated with each of the four intervals are displayed in Fig. C1b as a function of , which is taken as the geometric mean within each interval. Using these values we fit σr, and we obtain a=51.3 and with R2=0.98 (Fig. C1b).
Finally, the uncertainty of the FidasU number concentration for each bin i and time step j during the campaign is calculated as follows:
and the uncertainty of the FidasU mass concentration is then calculated as follows:
where is the corrected mass concentration of FidasU in each bin i and time step j during the campaign; is the mean logarithmic diameter in bin number i; dmax and dmin are the minimum and maximum particle diameters of bin i, respectively; and ρd is the dust particle density, which we assume to be 2500 kg m3.
Dry deposition in dust transport models is typically determined by a combination of dry deposition velocities and particle size distributions. According to Huneeus et al. (2011), these estimates are subject to large uncertainties, typically reported as a factor of 3 but possibly even larger. Multiple physical processes are involved in the dry deposition of dust particles, with gravitational settling, turbulent diffusion, and surface collection being the most prominent ones. The majority of models employ resistance-based parameterizations, which combine gravitational settling velocity (vg) with different types of resistances that counteract the deposition, including aerodynamic resistance (Ra), and surface collection resistance (Rs). The way in which the different deposition processes and their combinations are represented can significantly vary among different parameterizations. In addition, most current dry deposition schemes used in transport models are calibrated with deposition data collected in wind tunnel experiments. Therefore, these parameterizations are affected by large uncertainties. In this study we tested two dry deposition velocity parameterizations: (1) the parameterization used in Fernandes et al. (2019) (referred to as F19) and (2) the scheme proposed in Zhang et al. (2001) (referred to as Z01).
The dry deposition velocity in F19 is parameterized as follows:
where represents the turbulent transfer close to the surface, zint is the intermediate height between the two Fidas, and z0 the aerodynamic roughness length as derived in Sect. 2.3.1. The surface or quasi-laminar resistance accounts for losses by Brownian motion and inertial impaction; is the Schmidt number, and the Stokes number for smooth surfaces, where is the Brownian diffusivity, κ is the Boltzmann constant, T is the air temperature at 1 m height, Cc is the Cunningham slip correction factor, and is the air kinematic viscosity. The settling velocity vg(Di) is calculated for each size bin as , where is the particle-to-air density ratio.
The dry deposition velocity in Z01 is parameterized as follows:
where in this case , with Ψh being the similarity function for sensible heat (defined in Sect. 2.3.1), and , where ϵ0 is an empirical constant set to 3; EB, EIM, EIN are, respectively, the collection efficiency from Brownian diffusion, the impaction, and the interception; and R1 is the correction factor representing the fraction of particles that stick to the surface. In this scheme some parameters are ascribed to different land use categories. For this study, we select the values recommended for the “desert” (land use category 8) category. The efficiency from Brownian diffusion is a function of the Schmidt number, and the constant γ is set to 0.54. The impaction , where α is set to 50. Desert bare surfaces in this parameterization are considered totally smooth surfaces, and hence the interception EIN is set to 0 and in our case we assumed R1=1.
These parameterizations clearly underestimate our observationally-based estimates of vdep (see Sect. 3.5). Therefore, we searched for a better model representation. To that end, we incorporated some aspects of the newest scheme proposed by Zhang and Shao (2014) into the Zhang et al. (2001) scheme. While sharing some similarities, the parameterization from Zhang and Shao (2014) does not consider desert bare surfaces as totally smooth surfaces, allowing the interception of dust particles by micro-roughness elements. The dry deposition velocity from our tuned parameterization is calculated as follows:
where Ra and Rs are defined as in Eq. (D2). The differences in the tuned parameterization with respect to Eq. (D2) are as follows: (1) Ra is multiplied by a correction factor B1>0; (2) in the impaction term EIM, the constant α is now set to 0.6; (3) we now use the form of the Stokes number for vegetated surfaces (Slinn, 1982) , where dc is the diameter of the roughness elements; and (4) the interception is now , where the term Ainu* is an empirical parameter that accounts for the effect of micro-roughness characteristics (Zhang and Shao, 2014).
The parameterization can reasonably fit our observation-based estimates by adjusting the values of B1, dc, and Ain.
Data are available in the Zenodo data repository at https://doi.org/10.5281/zenodo.7956203 (González-Flórez et al., 2023).
We provide a 1 min frequency time-lapse video recorded from the Fidas location during 6 September that clearly shows the arrival of a haboob in the afternoon (https://doi.org/10.5446/62130, FRAGMENT team, 2022).
The supplement related to this article is available online at: https://doi.org/10.5194/acp-23-7177-2023-supplement.
CGF processed the meteorological and OPCs datasets, analysed the results, created all the figures and drafted the manuscript. CPG-P and MK supervised the work with contributions by SD. CPG-P proposed and designed the measurement campaign with contributions from XQ, MK, AA, KK, SD, and VE. CGF, AGR, MK, KK, AP, XQ, CR, JYD, AA, and CPG-P implemented the field campaign. VE and GN provided the SANTRIs and corresponding scientific and technical support. MK calculated the saltation flux. AGR and XQ performed the soil analysis. JE provided the conversions between optical and geometric diameters in collaboration with YH. All authors provided feedback on the structure and/or the content of the final manuscript. CPG-P re-edited the manuscript.
At least one of the (co-)authors is a member of the editorial board of Atmospheric Chemistry and Physics. The peer-review process was guided by an independent editor, and the authors also have no other competing interests to declare.
Publisher’s note: Copernicus Publications remains neutral with regard to jurisdictional claims in published maps and institutional affiliations.
This article is part of the special issue “Dust aerosol measurements, modelling and multidisciplinary effects (AMT/ACP inter-journal SI)”. It is not associated with a conference.
We acknowledge the EMIT project, which is supported by the NASA Earth Venture Instrument program, under the Earth Science Division of the Science Mission Directorate. We thank Paul Ginoux for providing high-resolution global dust source maps, which were very helpful for the identification of the FRAGMENT experimental sites. We thank Joaquim Cebolla-Alemany for his help in editing some of the figures. We thank María Gonçalves Ageitos for her support in the statistical significance analysis. We thank Santiago Beguería from the National Scientific Council of Spain for facilitating a field site in Zaragoza, Spain, to test our instrumentation and field procedures prior to the campaign in Morocco. We thank Kamal Taj Eddine from Cady Ayyad University, Marrakesh, Morocco, for his invaluable support and suggestions in the preparation of the field campaign. We thank Houssine Dakhamat and the crew of Hotel Chez le Pacha in M'hamid el Ghizlane for their local support during the campaign. We thank Andrés Carrillo and Agnès Sauleda for their support with the Fidas before, during, and after the campaign. We thank Campbell Scientific in Barcelona for their support with the meteorological instruments. We thank PALAS for their help with some technical issues with the Fidas.
We thank Yaping Shao and Jasper Kok for their valuable comments during the revision process.
The field campaign and its associated research, including this work, was primarily funded by the European Research Council under the Horizon 2020 research and innovation programme through the ERC Consolidator Grant FRAGMENT (grant agreement no. 773051) and the AXA Research Fund through the AXA Chair on Sand and Dust Storms at BSC. Cristina González-Flórez was supported by a PhD fellowship from the Agència de Gestió d'Ajuts Universitaris i de Recerca (AGAUR) grant no. 2020-FI-B 00678. Martina Klose received funding through the Helmholtz Association's Initiative and Networking Fund (grant agreement no. VH-NG-1533). Konrad Kandler was funded by the Deutsche Forschungsgemeinschaft (DFG, German Research Foundation) grant nos. 264907654, 416816480. Yue Huang acknowledges financial support from the Columbia University Earth Institute Postdoctoral Research Fellowship. The SANTRI instruments used in this study were constructed under a grant (no. EAR-1124609) from the US National Science Foundation.
This paper was edited by Stelios Kazadzis and reviewed by Jasper Kok and Yaping Shao.
Adebiyi, A., Kok, J., Murray, B., Ryder, C., Stuut, J.-B., Kahn, R., Knippertz, P., Formenti, P., Mahowald, N., Pérez García-Pando, C., Klose, M., Ansmann, A., Samset, B., Ito, A., Balkanski, Y., Di Biagio, C., Romanias, M., Huang, Y., and Meng, J.: A review of coarse mineral dust in the Earth system, Aeolian Res., 60, 100849, https://doi.org/10.1016/j.aeolia.2022.100849, 2023. a
Adebiyi, A. A. and Kok, J. F.: Climate models miss most of the coarse dust in the atmosphere, Science Advances, 6, 1–10, https://doi.org/10.1126/sciadv.aaz9507, 2020. a, b
Alfaro, S., Bouet, C., Khalfallah, B., Shao, Y., Ishizuka, M., Labiadh, M., Marticorena, B., Laurent, B., and Rajot, J.-L.: Unraveling the Roles of Saltation Bombardment and Atmospheric Instability on Magnitude and Size Distribution of Dust Emission Fluxes: Lessons From the JADE and WIND-O-V Experiments, J. Geophys. Res.-Atmos., 127, e2021JD035983, https://doi.org/10.1029/2021JD035983, 2022. a, b, c, d
Alfaro, S. C., Gaudichet, A., Gomes, L., and Maillé, M.: Modeling the size distribution of a soil aerosol produced by sandblasting, J. Geophys. Res., 102, 11239–11249, https://doi.org/10.1029/97JD00403, 1997. a, b, c, d, e
Arya, P. S.: Introduction to micrometeorology, Academic Press, San Diego, 2 Edn., https://doi.org/10.1256/0035900021643665, 2001. a, b
Benoit, R.: On the integral of the surface layer profile-gradient functions, J. Appl. Meteorol., 16, 859–860, https://doi.org/10.1175/1520-0450(1977)016<0859:OTIOTS>2.0.CO;2, 1977. a, b
Bergametti, G., Marticorena, B., Rajot, J.-L., Foret, G., Alfaro, S., and Laurent, B.: Size-resolved dry deposition velocities of dust particles: in situ measurements and parameterizations testing, J. Geophys. Res.-Atmos., 123, 11–080, https://doi.org/10.1029/2018JD028964, 2018. a, b
Bristow, C. S., Hudson-Edwards, K. A., and Chappell, A.: Fertilizing the Amazon and equatorial Atlantic with West African dust, Geophys. Res. Lett., 37, 3–7, https://doi.org/10.1029/2010GL043486, 2010. a
Businger, J. A., Wyngaard, J. C., Izumi, Y., and Bradley, E. F.: Flux-profile relationships in the atmospheric surface layer, J. Atmos. Sci., 28, 181–189, https://doi.org/10.1175/1520-0469(1971)028<0181:FPRITA>2.0.CO;2, 1971.
Csanady, G.: Turbulent diffusion of heavy particles in the atmosphere, J. Atmos. Sci., 20, 201–208, https://doi.org/10.1175/1520-0469(1963)020<0201:TDOHPI>2.0.CO;2, 1963. a
Di Biagio, C., Formenti, P., Balkanski, Y., Caponi, L., Cazaunau, M., Pangui, E., Journet, E., Nowak, S., Andreae, M. O., Kandler, K., Saeed, T., Piketh, S., Seibert, D., Williams, E., and Doussin, J.-F.: Complex refractive indices and single-scattering albedo of global dust aerosols in the shortwave spectrum and relationship to size and iron content, Atmos. Chem. Phys., 19, 15503–15531, https://doi.org/10.5194/acp-19-15503-2019, 2019. a, b
Dietze, V., Fricker, M., Goltzsche, M., and Schultz, E.: Air quality measurement in German health resorts-Part 1: Methodology and verification, Gefahrst. Reinhalt. L., 66, 45–53, 2006. a
Dupont, S.: On the influence of thermal stratification on emitted dust flux, J. Geophys. Res.-Atmos., 127, e2022JD037364, https://doi.org/10.1029/2022JD037364, 2022. a, b, c
Dupont, S., Alfaro, S., Bergametti, G., and Marticorena, B.: Near-surface dust flux enrichment in small particles during erosion events, Geophys. Res. Lett., 42, 1992–2000, https://doi.org/10.1002/2015GL063116, 2015. a, b, c, d, e
Dupont, S., Rajot, J.-L., Labiadh, M., Bergametti, G., Alfaro, S., Bouet, C., Fernandes, R., Khalfallah, B., Lamaud, E., Marticorena, B., et al.: Aerodynamic parameters over an eroding bare surface: reconciliation of the law of the wall and eddy covariance determinations, J. Geophys. Res.-Atmos., 123, 4490–4508, https://doi.org/10.1029/2017JD027984, 2018. a, b, c
Dupont, S., Rajot, J.-L., Lamaud, E., Bergametti, G., Labiadh, M., Khalfallah, B., Bouet, C., Marticorena, B., and Fernandes, R.: Comparison between eddy-covariance and flux-gradient size-resolved dust fluxes during wind erosion events, J. Geophys. Res.-Atmos., 126, e2021JD034735, https://doi.org/10.1029/2021JD034735, 2021. a, b, c, d
Escribano, J., Bozzo, A., Dubuisson, P., Flemming, J., Hogan, R. J., C.-Labonnote, L., and Boucher, O.: A benchmark for testing the accuracy and computational cost of shortwave top-of-atmosphere reflectance calculations in clear-sky aerosol-laden atmospheres, Geosci. Model Dev., 12, 805–827, https://doi.org/10.5194/gmd-12-805-2019, 2019. a
Etyemezian, V., Nikolich, G., Nickling, W., King, J. S., and Gillies, J. A.: Analysis of an optical gate device for measuring aeolian sand movement, Aeolian Res., 24, 65–79, https://doi.org/10.1016/j.aeolia.2016.11.005, 2017. a, b
Evan, A. T., Flamant, C., Fiedler, S., and Doherty, O.: An analysis of aeolian dust in climate models, Geophys. Res. Lett., 41, 5996–6001, https://doi.org/10.1002/2014GL060545, 2014. a
Fernandes, R., Dupont, S., and Lamaud, E.: Investigating the role of deposition on the size distribution of near-surface dust flux during erosion events, Aeolian Res., 37, 32–43, https://doi.org/10.1016/j.aeolia.2019.02.002, 2019. a, b, c, d, e, f, g, h
Fernandes, R., Dupont, S., and Lamaud, E.: Origins of turbulent transport dissimilarity between dust and momentum in semiarid regions, J. Geophys. Res.-Atmos., 125, e2019JD031247, https://doi.org/10.1029/2019JD031247, 2020. a
Field, J. and Pelletier, J.: Controls on the aerodynamic roughness length and the grain-size dependence of aeolian sediment transport, Earth Surf. Proc. Land., 43, 2616–2626, https://doi.org/10.1002/esp.4420, 2018. a
Foken, T. and Napo, C.: Micrometeorology, Springer, Heidelberg, 2 Edn., https://doi.org/10.1177/0309133310369438, 2008. a, b
FRAGMENT team: Timelapse 6 sept 2019 l'bour, [video], https://doi.org/10.5446/62130, 2023 a
Fratini, G., Ciccioli, P., Febo, A., Forgione, A., and Valentini, R.: Size-segregated fluxes of mineral dust from a desert area of northern China by eddy covariance, Atmos. Chem. Phys., 7, 2839–2854, https://doi.org/10.5194/acp-7-2839-2007, 2007. a, b, c, d, e
Gillette, D. A.: Fine particulate emissions due to wind erosion, T. ASAE, 20, 890–897, https://doi.org/10.13031/2013.35670, 1977. a, b, c, d, e
Gillette, D. A., Blifford Jr., I. H., and Fenster, C. R.: Measurements of aerosol size distributions and vertical fluxes of aerosols on land subject to wind erosion, J. Appl. Meteorol., 11, 977–987, https://doi.org/10.1175/1520-0450(1972)011<0977:MOASDA>2.0.CO;2, 1972. a, b
Gillette, D. A., Marticorena, B., and Bergametti, G.: Change in the aerodynamic roughness height by saltating grains: Experimental assessment, test of theory, and operational parameterization, J. Geophys. Res.-Atmos., 103, 6203–6209, https://doi.org/10.1029/98JD00207, 1998. a
Ginoux, P., Garbuzov, D., and Hsu, N. C.: Identification of anthropogenic and natural dust sources using Moderate Resolution Imaging Spectroradiometer (MODIS) Deep Blue level 2 data, J. Geophys. Res.-Atmos., 115, D05204, https://doi.org/10.1029/2009JD012398, 2010. a
Gomes, L., Bergametti, G., Coude-Gaussen, G., and Rognon, P.: Submicron desert dusts: a sandblasting process, J. Geophys. Res., 95, 13927–13935, https://doi.org/10.1029/jd095id09p13927, 1990. a
Gomes, L., Arrúe, J. L., López, M. V., Sterk, G., Richard, D., Gracia, R., Sabre, M., Gaudichet, A., and Frangi, J. P.: Wind erosion in a semiarid agricultural area of Spain: The WELSONS project, Catena, 52, 235–256, https://doi.org/10.1016/S0341-8162(03)00016-X, 2003a. a, b
Gomes, L., Rajot, J. L., Alfaro, S. C., and Gaudichet, A.: Validation of a dust production model from measurements performed in semi-arid agricultural areas of Spain and Niger, Catena, 52, 257–271, https://doi.org/10.1016/S0341-8162(03)00017-1, 2003b. a
González-Flórez, C., Klose, M., Alastuey, A., Dupont, S., Escribano, J., Etyemezian, V., González-Romero, A., Huang, Y., Kandler, K., Nikolich, G., Panta, A., Querol, X., Reche, C., Yús-Díez, J., and Pérez García-Pando, C.: Data presented in González-Flórez et al. 2023 “Insights into the size-resolved dust emission from field measurements in the Moroccan Sahara”, Atmos. Chem. Phys. (Version 1), Zenodo [data set], https://doi.org/10.5281/zenodo.7956203, 2023. a
González-Romero, A., González-Florez, C., Panta, A., Yus-Díez, J., Reche, C., Córdoba, P., Alastuey, A., Kandler, K., Klose, M., Baldo, C., Clark, R. N., Shi, Z. B., Querol, X., and García-Pando, C. P.: Variability in grain size, mineralogy, and mode of occurrence of Fe in surface sediments of preferential dust-source inland drainage basins: The case of the Lower Drâa Valley, S Morocco, EGUsphere [preprint], https://doi.org/10.5194/egusphere-2023-1120, 2023. a, b, c
Goossens, D., Nolet, C., Etyemezian, V., Duarte-Campos, L., Bakker, G., and Riksen, M.: Field testing, comparison, and discussion of five aeolian sand transport measuring devices operating on different measuring principles, Aeolian Res., 32, 1–13, https://doi.org/10.1016/j.aeolia.2018.01.001, 2018. a, b
Hobby, M., Gascoyne, M., Marsham, J. H., Bart, M., Allen, C., Engelstaedter, S., Fadel, D. M., Gandega, A., Lane, R., McQuaid, J. B., Ouchene, B., Ouladichir, A., Parker, D. J., Rosenberg, P., Ferroudj, M. S., Saci, A., Seddik, F., Todd, M., Walker, D., and Washington, R.: The fennec automatic weather station (AWS) network: Monitoring the Saharan climate system, J. Atmos. Ocean. Tech., 30, 709–724, https://doi.org/10.1175/JTECH-D-12-00037.1, 2013. a
Högström, U.: Non-dimensional wind and temperature profiles in the atmospheric surface layer: A re-evaluation, Bound. Lay. Meteorol., 42, 55–78, https://doi.org/10.1007/BF00119875, 1988. a, b
Huang, J., Wang, T., Wang, W., Li, Z., and Yan, H.: Climate effects of dust aerosols over East Asian arid and semiarid regions, J. Geophys. Res., 119, 11–398, https://doi.org/10.1002/2014JD021796, 2014. a
Huang, Y., Adebiyi, A. A., Formenti, P., and Kok, J. F.: Linking the different diameter types of aspherical desert dust indicates that models underestimate coarse dust emission, Geophys. Res. Lett., 48, e2020GL092054, https://doi.org/10.1029/2020GL092054, 2021. a, b, c, d, e, f
Huneeus, N., Schulz, M., Balkanski, Y., Griesfeller, J., Prospero, J., Kinne, S., Bauer, S., Boucher, O., Chin, M., Dentener, F., Diehl, T., Easter, R., Fillmore, D., Ghan, S., Ginoux, P., Grini, A., Horowitz, L., Koch, D., Krol, M. C., Landing, W., Liu, X., Mahowald, N., Miller, R., Morcrette, J.-J., Myhre, G., Penner, J., Perlwitz, J., Stier, P., Takemura, T., and Zender, C. S.: Global dust model intercomparison in AeroCom phase I, Atmos. Chem. Phys., 11, 7781–7816, https://doi.org/10.5194/acp-11-7781-2011, 2011. a
Ishizuka, M., Mikami, M., Leys, J. F., Shao, Y., Yamada, Y., and Heidenreich, S.: Power law relation between size-resolved vertical dust flux and friction velocity measured in a fallow wheat field, Aeolian Res., 12, 87–99, https://doi.org/10.1016/j.aeolia.2013.11.002, 2014. a, b, c
Jickells, T. and Moore, C. M.: The Importance of Atmospheric Deposition for Ocean Productivity, Annu. Rev. Ecol. Evol. S., 46, 481–501, https://doi.org/10.1146/annurev-ecolsys-112414-054118, 2015. a
Junge, C. E.: Air Chemistry and Radioactivity, Academic Press, https://doi.org/10.1002/qj.49709038422, 1963. a
Kaaden, N., Massling, A., Schladitz, A., Müller, T., Kandler, K., Schütz, L., Weinzierl, B., Petzold, A., Tesche, M., Leinert, S., Deutscher, C., Ebert, M., Weinbruch, S., and Wiedensohler, A.: State of mixing, shape factor, number size distribution, and hygroscopic growth of the Saharan anthropogenic and mineral dust aerosol at Tinfou, Morocco, Tellus B, 61, 51–63, https://doi.org/10.1111/j.1600-0889.2008.00388.x, 2009. a, b
Kaimal, J. C. and Finnigan, J. J.: Atmospheric boundary layer flows: their structure and measurement, Oxford University Press, https://doi.org/10.1093/oso/9780195062397.001.0001, 1994. a
Kandler, K., Schütz, L., Deutscher, C., Ebert, M., Hofmann, H., Jäckel, S., Jaenicke, R., Knippertz, P., Lieke, K., Massling, A., et al.: Size distribution, mass concentration, chemical and mineralogical composition and derived optical parameters of the boundary layer aerosol at Tinfou, Morocco, during SAMUM 2006, Tellus B, 61, 32–50, https://doi.org/10.1111/j.1600-0889.2008.00385.x, 2009. a
Karanasiou, A., Moreno, N., Moreno, T., Viana, M., de Leeuw, F., and Querol, X.: Health effects from Sahara dust episodes in Europe: literature review and research gaps, Environ. Int., 47, 107–114, https://doi.org/10.1016/j.envint.2012.06.012, 2012. a
Khalfallah, B., Bouet, C., Labiadh, M. T., Alfaro, S. C., Bergametti, G., Marticorena, B., Lafon, S., Chevaillier, S., Féron, A., Hease, P., Henry des Tureaux, T., Sekrafi, S., Zapf, P., and Rajot, J. L.: Influence of Atmospheric Stability on the Size Distribution of the Vertical Dust Flux Measured in Eroding Conditions Over a Flat Bare Sandy Field, J. Geophys. Res.-Atmos., 125, e2019JD031185, https://doi.org/10.1029/2019JD031185, 2020. a, b, c
Klose, M., Gill, T. E., Etyemezian, V., Nikolich, G., Ghodsi Zadeh, Z., Webb, N. P., and Van Pelt, R. S.: Dust emission from crusted surfaces: Insights from field measurements and modelling, Aeolian Res., 40, 1–14, https://doi.org/10.1016/j.aeolia.2019.05.001, 2019. a, b, c, d
Klose, M., Jorba, O., Gonçalves Ageitos, M., Escribano, J., Dawson, M. L., Obiso, V., Di Tomaso, E., Basart, S., Montané Pinto, G., Macchia, F., Ginoux, P., Guerschman, J., Prigent, C., Huang, Y., Kok, J. F., Miller, R. L., and Pérez García-Pando, C.: Mineral dust cycle in the Multiscale Online Nonhydrostatic AtmospheRe CHemistry model (MONARCH) Version 2.0, Geosci. Model Dev., 14, 6403–6444, https://doi.org/10.5194/gmd-14-6403-2021, 2021. a
Knippertz, P. and Stuut, J.-B.: Mineral Dust, A Key Player in the Earth System, Springer, Dordrecht Heidelberg New York London, https://doi.org/10.1007/978-94-017-8978-3, 2014. a
Kok, J. F.: A scaling theory for the size distribution of emitted dust aerosols suggests climate models underestimate the size of the global dust cycle, Earth, Atmospheric, and Planetary Sciences, 108, 1016–1021, https://doi.org/10.1073/pnas.1014798108, 2011a. a, b, c, d, e, f, g, h, i, j
Kok, J. F.: Does the size distribution of mineral dust aerosols depend on the wind speed at emission?, Atmos. Chem. Phys., 11, 10149–10156, https://doi.org/10.5194/acp-11-10149-2011, 2011b. a, b
Kok, J. F., Ridley, D. A., Zhou, Q., Miller, R. L., Zhao, C., Heald, C. L., Ward, D. S., Albani, S., and Haustein, K.: Smaller desert dust cooling effect estimated from analysis of dust size and abundance, Nat. Geosci., 10, 274–278, 2017. a
Kok, J. F., Adebiyi, A. A., Albani, S., Balkanski, Y., Checa-Garcia, R., Chin, M., Colarco, P. R., Hamilton, D. S., Huang, Y., Ito, A., Klose, M., Leung, D. M., Li, L., Mahowald, N. M., Miller, R. L., Obiso, V., Pérez García-Pando, C., Rocha-Lima, A., Wan, J. S., and Whicker, C. A.: Improved representation of the global dust cycle using observational constraints on dust properties and abundance, Atmos. Chem. Phys., 21, 8127–8167, https://doi.org/10.5194/acp-21-8127-2021, 2021. a
Kramm, G., Amaya, D. J., Foken, T., et al.: Hans A. Panofsky's Integral Similarity Function–At Fifty, Atmospheric and Climate Sciences, 3, 581–594, https://doi.org/10.4236/acs.2013.34061, 2013. a
Marticorena, B., Kardous, M., Bergametti, G., Callot, Y., Chazette, P., Khatteli, H., Le Hégarat-Mascle, S., Maillé, M., Rajot, J.-L., Vidal-Madjar, D., and Zribi, M.: Surface and aerodynamic roughness in arid and semiarid areas and their relation to radar backscatter coefficient, J. Geophys. Res., 111, 1–26, https://doi.org/10.1029/2006JF000462, 2006. a, b
McKee, E. D.: Eolian sand bodies of the world, Developments in Sedimentology, 38, 1–25, https://doi.org/10.1016/S0070-4571(08)70785-4, 1983. a
Meng, J., Huang, Y., Leung, D. M., Li, L., Adebiyi, A. A., Ryder, C. L., Mahowald, N. M., and Kok, J. F.: Improved Parameterization for the Size Distribution of Emitted Dust Aerosols Reduces Model Underestimation of Super Coarse Dust, Geophys. Res. Lett., 49, e2021GL097287, https://doi.org/10.1029/2021GL097287, 2022. a, b, c, d, e, f, g, h
Meng, Z., Yang, P., Kattawar, G. W., Bi, L., Liou, K., and Laszlo, I.: Single-scattering properties of tri-axial ellipsoidal mineral dust aerosols: A database for application to radiative transfer calculations, J. Aerosol Sci., 41, 501–512, https://doi.org/10.1016/j.jaerosci.2010.02.008, 2010. a
Miller, R. L., Knippertz, P., Pérez García-Pando, C., Perlwitz, J. P., and Tegen, I.: Impact of dust radiative forcing upon climate, in: Mineral dust, 327–357, Springer, https://doi.org/10.1007/978-94-017-8978-3, 2014. a
Miller, S. D., Kuciauskas, A. P., Liu, M., Ji, Q., Reid, J. S., Breed, D. W., Walker, A. L., and Mandoos, A. A.: Haboob dust storms of the southern Arabian Peninsula, J. Geophys. Res.-Atmos., 113, D01202, https://doi.org/10.1029/2007JD008550, 2008. a
Monin, A. S. and Obukhov, A. M.: Basis laws of turbulent mixing in the ground layer of the atmosphere, Tr. Akad. Nauk SSSR Geophiz., 24, 163–187, 1954. a, b
Nickling, W.: Grain-size characteristics of sediment transported during dust storms, J. Sediment. Res., 53, 1011–1024, https://doi.org/10.1306/212F830A-2B24-11D7-8648000102C1865D, 1983. a
Nickling, W. and Gillies, J.: Dust emission and transport in Mali, West Africa, Sedimentology, 40, 859–868, https://doi.org/10.1111/j.1365-3091.1993.tb01365.x, 1993. a
Nickling, W. G., McTainsh, G. H., and Leys, J. F.: Dust emission from the Channel Country of western Queensland, Australia, Z. Geomorphol., 116, 1–17, 1999. a
Okin, G. S., Mahowald, N., Chadwick, O. A., and Artaxo, P.: Impact of desert dust on the biogeochemistry of phosphorus in terrestrial ecosystems, Global Biogeochem. Cy., 18, GB2005, https://doi.org/10.1029/2003GB002145, 2004. a
Owen, R. P.: Saltation of uniform grains in air, J. Fluid Mech., 20, 225–242, https://doi.org/10.1017/S0022112064001173, 1964. a
Panta, A., Kandler, K., Alastuey, A., González-Flórez, C., González-Romero, A., Klose, M., Querol, X., Reche, C., Yus-Díez, J., and Pérez García-Pando, C.: Insights into the single-particle composition, size, mixing state, and aspect ratio of freshly emitted mineral dust from field measurements in the Moroccan Sahara using electron microscopy, Atmos. Chem. Phys., 23, 3861–3885, https://doi.org/10.5194/acp-23-3861-2023, 2023. a, b, c
Perlwitz, J. P., Pérez García-Pando, C., and Miller, R. L.: Predicting the mineral composition of dust aerosols – Part 2: Model evaluation and identification of key processes with observations, Atmos. Chem. Phys., 15, 11629–11652, https://doi.org/10.5194/acp-15-11629-2015, 2015a. a
Perlwitz, J. P., Pérez García-Pando, C., and Miller, R. L.: Predicting the mineral composition of dust aerosols – Part 1: Representing key processes, Atmos. Chem. Phys., 15, 11593–11627, https://doi.org/10.5194/acp-15-11593-2015, 2015b. a
Pierre, C., Bergametti, G., Marticorena, B., Mougin, E., Bouet, C., and Schmechtig, C.: Impact of vegetation and soil moisture seasonal dynamics on dust emissions over the Sahel, J. Geophys. Res.-Atmos., 117, 1–21, https://doi.org/10.1029/2011JD016950, 2012. a
Rajot, J., Alfaro, S., Gomes, L., and Gaudichet, A.: Soil crusting on sandy soils and its influence on wind erosion, Catena, 53, 1–16, https://doi.org/10.1016/S0341-8162(02)00201-1, 2003. a
Rausch, J., Jaramillo-Vogel, D., Perseguers, S., Schnidrig, N., Grobéty, B., and Yajan, P.: Automated identification and quantification of tire wear particles (TWP) in airborne dust: SEM/EDX single particle analysis coupled to a machine learning classifier, Sci. Total Environ., 803, 149832, https://doi.org/10.1016/j.scitotenv.2021.149832, 2022. a
Ravi, S., Zobeck, T. M., Over, T. M., Okin, G. S., and D'Odorico, P.: On the effect of moisture bonding forces in air-dry soils on threshold friction velocity of wind erosion, Sedimentology, 53, 597–609, https://doi.org/10.1111/j.1365-3091.2006.00775.x, 2006. a
Reid, J. S., Reid, E. A., Walker, A., Piketh, S., Cliff, S., Al Mandoos, A., Tsay, S.-C., and Eck, T. F.: Dynamics of southwest Asian dust particle size characteristics with implications for global dust research, J. Geophys. Res.-Atmos., 113, D14212, https://doi.org/10.1029/2007JD009752, 2008. a
Ryder, C. L., Highwood, E. J., Lai, T. M., Sodemann, H., and Marsham, J. H.: Impact of atmospheric transport on the evolution of microphysical and optical properties of Saharan dust, J. Geophys. Res.-Atmos., 40, 2433–2438, https://doi.org/10.1002/grl.50482, 2013. a
Ryder, C. L., Highwood, E. J., Walser, A., Seibert, P., Philipp, A., and Weinzierl, B.: Coarse and giant particles are ubiquitous in Saharan dust export regions and are radiatively significant over the Sahara, Atmos. Chem. Phys., 19, 15353–15376, https://doi.org/10.5194/acp-19-15353-2019, 2019. a
Schuepp, P., Leclerc, M., MacPherson, J., and Desjardins, R.: Footprint prediction of scalar fluxes from analytical solutions of the diffusion equation, Bound.-Lay. Meteorol., 50, 355–373, https://doi.org/10.1007/BF00120530, 1990. a
Schüler, D., Wilbert, S., Geuder, N., Affolter, R., Wolfertstetter, F., Prahl, C., Röger, M., Schroedter-Homscheidt, M., Abdellatif, G., Guizani, A. A., Balghouthi, M., Khalil, A., Mezrhab, A., Al-Salaymeh, A., Yassaa, N., Chellali, F., Draou, D., Blanc, P., Dubranna, J., and Sabry, O. M.: The enerMENA meteorological network – Solar radiation measurements in the MENA region, AIP Conf. Proc., 1734, 150008, https://doi.org/10.1063/1.4949240, 2016. a
Schulz, O. and Judex, M.: IMPETUS Atlas Marocco: Results 2000 – 2007, 3 Edn., Department of Geography, University of Bonn, Germany (english version), 78 pp., hdl:10013/epic.42484.d003, 2008. a
Shao, Y.: A model for mineral dust emission, J. Geophys. Res.-Atmos., 106, 20239–20254, https://doi.org/10.1029/2001JD900171, 2001. a, b, c, d
Shao, Y.: Physics and Modelling of Wind Erosion, Springer-Verlag, Berlin, 2 Edn., https://doi.org/10.1007/978-1-4020-8895-7, 2008. a, b, c, d
Shao, Y., Raupach, M., and Findlater, P.: Effect of saltation bombardment on the entrainment of dust by wind, J. Geophys. Res.-Atmos., 98, 12719–12726, https://doi.org/10.1029/93JD00396, 1993. a, b, c
Shao, Y., Ishizuka, M., Mikami, M., and Leys, J. F.: Parameterization of size-resolved dust emission and validation with measurements, J. Geophys. Res.-Atmos., 116, D08203,, https://doi.org/10.1029/2010JD014527, 2011a. a, b, c
Shao, Y., Wyrwoll, K.-H., Chappell, A., Huang, J., Lin, Z., McTainsh, G. H., Mikami, M., Tanaka, T. Y., Wang, X., and Yoon, S.: Dust cycle: An emerging core theme in Earth system science, Aeolian Res., 2, 181–204, https://doi.org/10.1016/j.aeolia.2011.02.001, 2011b. a
Shao, Y., Zhang, J., Ishizuka, M., Mikami, M., Leys, J., and Huang, N.: Dependency of particle size distribution at dust emission on friction velocity and atmospheric boundary-layer stability, Atmos. Chem. Phys., 20, 12939–12953, https://doi.org/10.5194/acp-20-12939-2020, 2020. a, b
Slinn, W.: Predictions for particle deposition to vegetative canopies, Atmos. Environ., 16, 1785–1794, 1982. a
Sow, M., Alfaro, S. C., Rajot, J. L., and Marticorena, B.: Size resolved dust emission fluxes measured in Niger during 3 dust storms of the AMMA experiment, Atmos. Chem. Phys., 9, 3881–3891, https://doi.org/10.5194/acp-9-3881-2009, 2009. a, b, c, d, e
Stull, R. B.: An Introduction to Boundary Layer Meteorology, Kluwer Academic Publishers, Norwell, https://doi.org/10.1007/978-94-009-3027-8, 1988. a, b, c
Tegen, I. and Lacis, A. A.: Modeling of particle size distribution and its influence on the radiative properties of mineral dust aerosol, J. Geophys. Res.-Atmos., 101, 19237–19244, https://doi.org/10.1029/95JD03610, 1996. a
Tegen, I., Harrison, S. P., Kohfeld, K., Prentice, I. C., Coe, M., and Heimann, M.: Impact of vegetation and preferential source areas on global dust aerosol: Results from a model study, J. Geophys. Res.-Atmos., 107, 4576, https://doi.org/10.1029/2001JD000963, 2002. a
Tetens, O.: Uber einige meteorologische Begriffe, Z. Geophys., 6, 297–309, 1930. a
Textor, C., Schulz, M., Guibert, S., Kinne, S., Balkanski, Y., Bauer, S., Berntsen, T., Berglen, T., Boucher, O., Chin, M., Dentener, F., Diehl, T., Easter, R., Feichter, H., Fillmore, D., Ghan, S., Ginoux, P., Gong, S., Grini, A., Hendricks, J., Horowitz, L., Huang, P., Isaksen, I., Iversen, I., Kloster, S., Koch, D., Kirkevåg, A., Kristjansson, J. E., Krol, M., Lauer, A., Lamarque, J. F., Liu, X., Montanaro, V., Myhre, G., Penner, J., Pitari, G., Reddy, S., Seland, Ø., Stier, P., Takemura, T., and Tie, X.: Analysis and quantification of the diversities of aerosol life cycles within AeroCom, Atmos. Chem. Phys., 6, 1777–1813, https://doi.org/10.5194/acp-6-1777-2006, 2006. a
Tian, Z., Kaminski, U., Sauer, J., Maschowski, C., Stille, P., Cen, K., Gieré, R., Sommer, F., Dietze, V., and Baum, A.: Coarse-Particle Passive-Sampler Measurements and Single-Particle Analysis by Transmitted Light Microscopy at Highly Frequented Motorways, Aerosol Air Qual. Res., 17, 1939–1953, https://doi.org/10.4209/aaqr.2017.02.0064, 2017. a, b
VDI-2119: Ambient air measurements—sampling of atmospheric particles >2.5 μm on an acceptor surface using the Sigma-2 passive sampler, VDI guideline, Beuth Verlag., 1–62, 2013. a
Waza, A., Schneiders, K., May, J., Rodríguez, S., Epple, B., and Kandler, K.: Field comparison of dry deposition samplers for collection of atmospheric mineral dust: results from single-particle characterization, Atmos. Meas. Tech., 12, 6647–6665, https://doi.org/10.5194/amt-12-6647-2019, 2019. a, b
Yus-Díez, J., Pandolfi, M., Alastuey, A., González-Flórez, C., Escribano, J., González-Romero, A., Ivančič, M., Rigler, M., Klose, M., Kandler, K., Panta, A., Querol, X., Reche, C., and Pérez García-Pando, C.: Quantifying variations in multi-wavelength optical properties of freshly-emitted Saharan dust from the Lower Drâa Valley, Moroccan Sahara, in preparation, 2023. a, b, c, d
Zhang, J. and Shao, Y.: A new parameterization of particle dry deposition over rough surfaces, Atmos. Chem. Phys., 14, 12429–12440, https://doi.org/10.5194/acp-14-12429-2014, 2014 a, b, c, d
Zhang, L., Gong, S., Padro, J., and Barrie, L.: A size-segregated particle dry deposition scheme for an atmospheric aerosol module, Atmos. Environ., 35, 549–560, 2001. a, b, c, d, e
- Abstract
- Introduction
- Data and methods
- Results and discussion
- Conclusions
- Appendix A: Transformation of the default PSL diameters into dust geometric diameters
- Appendix B: Fidas systematic correction
- Appendix C: Uncertainty in the size-resolved diffusive flux
- Appendix D: Parameterizations for dry deposition velocity
- Data availability
- Video supplement
- Author contributions
- Competing interests
- Disclaimer
- Special issue statement
- Acknowledgements
- Financial support
- Review statement
- References
- Supplement