the Creative Commons Attribution 4.0 License.
the Creative Commons Attribution 4.0 License.
 | 31 Mar 2023
Insights into the single-particle composition, size, mixing state, and aspect ratio of freshly emitted mineral dust from field measurements in the Moroccan Sahara using electron microscopy
Konrad Kandler
Andres Alastuey
Cristina González-Flórez
Adolfo González-Romero
Martina Klose
Xavier Querol
Cristina Reche
Jesús Yus-Díez
Carlos Pérez García-Pando
The chemical and morphological properties of mineral dust aerosols emitted by wind erosion from arid and semi-arid regions influence climate, ocean, and land ecosystems; air quality; and multiple socio-economic sectors. However, there is an incomplete understanding of the emitted dust particle size distribution (PSD) in terms of its constituent minerals that typically result from the fragmentation of soil aggregates during wind erosion. The emitted dust PSD affects the duration of particle transport and thus each mineral's global distribution, along with its specific effect upon climate. This lack of understanding is largely due to the scarcity of relevant in situ measurements in dust sources. To advance our understanding of the physicochemical properties of the emitted dust PSD, we present insights into the elemental composition and morphology of individual dust particles collected during the FRontiers in dust minerAloGical coMposition and its Effects upoN climaTe (FRAGMENT) field campaign in the Moroccan Sahara in September 2019. We analyzed more than 300 000 freshly emitted individual particles by performing offline analysis in the laboratory using scanning electron microscopy (SEM) coupled with energy-dispersive X-ray spectrometry (EDX). Eight major particle-type classes were identified with clay minerals making up the majority of the analyzed particles both by number and mass, followed by quartz, whereas carbonates and feldspar contributed to a lesser extent. We provide an exhaustive analysis of the PSD and potential mixing state of different particle types, focusing largely on iron-rich (Fe oxide-hydroxides) and feldspar particles, which are key to the effects of dust upon radiation and clouds, respectively. Nearly pure or externally mixed Fe oxide-hydroxides are present mostly in diameters smaller than 2 µm, with the highest fraction below 1 µm at about 3.75 % abundance by mass. Fe oxide-hydroxides tend to be increasingly internally mixed with other minerals, especially clays, as particle size increases; i.e., the volume fraction of Fe oxide-hydroxides in aggregates decreases with particle size. Pure (externally mixed) feldspar represented 3.2 % of all the particles by mass, of which we estimated about a 10th to be K-feldspar. The externally mixed total feldspar and K-feldspar abundances are relatively invariant with particle size, in contrast to the increasing abundance of feldspar-like (internally mixed) aggregates with particle size with mass fractions ranging from 5 % to 18 %. We also found that overall the median aspect ratio is rather constant across particle size and mineral groups, although we obtain slightly higher aspect ratios for internally mixed particles. The detailed information on the composition of freshly emitted individual dust particles and quantitative analysis of their mixing state presented here can be used to constrain climate models including mineral species in their representation of the dust cycle.
- Article
(7116 KB) - Full-text XML
- Companion paper
-
Supplement
(4710 KB) - BibTeX
- EndNote


Mineral dust, as one of the most important natural aerosols in the atmosphere, is a key player in influencing the global climate system (Shao et al., 2011). It is the most abundant aerosol type in terms of mass (Choobari et al., 2014; Textor et al., 2006), with an estimated emission flux between 3400 and 8900 Tg yr−1 for particles smaller than 20 µm geometric diameter (Kok et al., 2021b). In particular, northern Africa is responsible for an estimated 50 % of global windblown mineral dust emissions (Engelstaedter et al., 2006; Kok et al., 2021a). Dust directly affects the Earth's radiative budget via scattering and absorption of radiation (Sokolik et al., 2001; Pérez et al., 2006; Strong et al., 2018) and indirectly by influencing cloud development on a microphysical level by acting as cloud condensation nuclei and ice nuclei (Zimmermann et al., 2008; Kumar et al., 2011; Hoose and Möhler, 2012; Froyd et al., 2022), and thus it impacts cloud optical properties and radiation. Once uplifted over the source areas, dust can travel thousands of kilometers away from these areas and can act as a carrier for micronutrients, such as iron and phosphorous, to the ocean (Jickells et al., 2005; Schulz et al., 2012; Rodríguez et al., 2021; Myriokefalitakis et al., 2022) and the Amazon rainforest (Yu et al., 2015), with implications for biogeochemical cycles and ocean uptake of atmospheric carbon dioxide by promoting phytoplankton growth (Mahowald et al., 2009). Additionally, dust can be deposited on snow or ice, thereby reducing snow and ice reflectance (surface darkening) and consequently changing the climate and water cycle by accelerating snow melting (Painter et al., 2010; Sarangi et al., 2020). Dust can also interact with air pollutants by acting as a catalyst and providing a surface for heterogeneous reactions (Cwiertny et al., 2008; Ndour et al., 2008). Finally, dust might negatively impact human health (Querol et al., 2019; Pérez García-Pando et al., 2014; Giannadaki et al., 2014), induce a decrease in solar energy yield by dust deposition to solar panels (Piedra and Moosmüller, 2017), and negatively impact aircraft operations due to reduced visibility (Middleton, 2017; Monteiro et al., 2022). Most of these processes rely not only on the total mass of dust but also on its microphysical properties and mineral composition (Mahowald et al., 2014).
The physicochemical properties of mineral dust aerosols, including their particle size distribution (PSD), composition, mixing state, and shape determine their impact on climate and atmospheric chemistry (Formenti et al., 2011). The emitted PSD, spanning from a few nanometers to hundreds of micrometers, is critical in constraining the dust atmospheric lifetime, as coarser particles tend to deposit faster due to gravity, albeit less than previously thought (van der Does et al., 2018; Adebiyi and Kok, 2020; Adebiyi et al., 2023). The chemical and mineralogical composition is another key factor to consider; for example, the absorption properties and ice nucleation ability of dust depend upon its mineralogy, mainly upon the presence of iron oxides (Li et al., 2021) and K-feldspar (Atkinson et al., 2013; Kiselev et al., 2017; Welti et al., 2019; Yun et al., 2020), respectively. The mixing or aggregation state of the different dust minerals is also important in determining the behavior of dust in the atmosphere in terms of its reactivity, chemical processing, optical properties, ice nucleation ability, and dust deposition (Fitzgerald et al., 2015; Kandler et al., 2018). For example, dust is more optically absorbing when iron oxides are internally mixed with other minerals than when they are externally mixed (Sokolik and Toon, 1999). The feldspar fraction in desert soils also varies considerably. In parts of northern Africa (southern Algeria, northern Mauritania, and northern Niger) it can reach ∼ 12 % to 20 %, whereas in the western Sahel the feldspar fraction is less than 2 % (Nickovic et al., 2012; Perlwitz et al., 2015a). In addition, the ice nucleation property of mineral dust depends not only on the source composition but also on the feldspar PSD, which among other aspects, dictates its lifetime in the atmosphere. Moreover, the ice-nucleating properties of K-feldspar vary significantly despite having a comparable crystal structure and composition, leading to a variety of ice nucleation abilities (Harrison et al., 2016). K-feldspar also dominates the number of ice nuclei in both the internally mixed and externally mixed cases (Atkinson et al., 2013). Particle shape influences the dust single-scattering properties (Lindqvist et al., 2014; Nousiainen and Kandler, 2015; Saito and Yang, 2021). Accurate quantification of dust shape is important for calculating the dust impact on radiative forcing (Ito et al., 2021) and the terminal velocity of dust particles (Ginoux, 2003; Huang et al., 2020), albeit with high uncertainties for both of these effects (Nousiainen et al., 2011). Mineral dust also contributes significantly to the atmospheric aerosol mass loadings, which are retrieved from satellite measurements and ground-based lidar measurements applying algorithms that use particle shape as one of the input parameters (Dubovik et al., 2006; Gliß et al., 2021). The importance of realistic size equivalence and shape of spheroidal Saharan dust particles on optical properties and the radiative effect was studied in Otto et al. (2011) with data gathered during SAMUM-1 in Morocco. Furthermore, scanning electron microscopy (SEM) was used to characterize the mineralogical composition and shape of mineral dust particles collected during the SAMUM campaign over Morocco in 2006 (Lindqvist et al., 2014). They found great variation between the scattering properties of spheres, spheroids, and mineral dust particles characterized by SEM (Lindqvist et al., 2014). Moreover, for non-symmetrical particles, a preferential orientation in the atmosphere is observed where a shape-dependent settling behavior comes into effect (Li and Osada, 2007). There is also a shape-dependent separation of mineral dust into layers of different altitudes during cross-Atlantic transport of Saharan dust, which strongly points to a shape-preferential settling of particles (Yang et al., 2013). In addition, dust nonsphericity could enhance the snow albedo reduction by up to 20 % relative to spherical dust (Shi et al., 2022). As the shape of dust particles is highly aspherical (Huang et al., 2020), this can further influence their optical properties (Ito et al., 2021; Otto et al., 2009; Mishchenko et al., 1997; Nousiainen and Kandler, 2015; Klose et al., 2021). Finally, the dust lifetime in the atmosphere is also affected by particle shape and density (which depends on mineralogy), with more spherical and denser particles being deposited more quickly (Huang et al., 2020; Mallios et al., 2020). Other potentially important aspects that have been largely unexplored are the potential interdependencies among particle size, composition, mixing state, and shape. For example, while it is well known that composition is size dependent (Kandler et al., 2009, 2011; Ryder et al., 2018; Liu et al., 2018), very little is known about the potential dependencies of shape and mixing state upon both particle composition and size.
Models that include spatiotemporal variations in mineralogical composition of windblown dust are relatively new (Perlwitz et al., 2015a, b; Scanza et al., 2015) and currently use rather crude soil mineralogy maps (Claquin et al., 1999; Nickovic et al., 2012; Journet et al., 2014) as a lower boundary condition. Soil mineralogy maps are based on massive extrapolation from a limited amount of soil mineralogical analyses, ancillary information on soil texture and color, and several additional assumptions. This limited knowledge, together with our incomplete understanding and the scarcity of measurements of the emitted dust physicochemical properties and their relationship with the PSD and composition of the parent soil, precludes accurate model assessment of the effects of dust upon climate (Perlwitz et al., 2015a; Pérez García-Pando et al., 2016; Li et al., 2021). However, despite their importance, very few ground-based, in situ measurement studies to characterize the particle composition and microphysical properties exist. This is mainly due to the difficulty in dust sampling at source areas, as source areas are often remote harsh environments. Also, frequent dust storms result in high particulate concentrations and filter overload, which pose a challenge when these samples are analyzed by automated SEM.
In this contribution, we investigate the size, morphology, elemental (and mineralogical) composition, and mixing state of freshly emitted individual dust particles based on samples collected during a major wind erosion and dust emission field campaign in the Moroccan Sahara within the framework of the FRontiers in dust minerAloGical coMposition and its Effects upoN climate (FRAGMENT) project. Three different instruments were used to sample mineral dust for the measurement of chemical and physical properties of individual dust particles by SEM coupled with an energy-dispersive X-ray analyzer (EDX). Our detailed chemical and physical speciation represent a first step towards advancing our knowledge of the emitted PSD of individual dust minerals, and this will ultimately help in understanding the relationship between the size-resolved composition of the emitted dust and that of the parent soil. Such knowledge is needed to better constrain climate models that consider mineralogical variations in their representation of the dust cycle (Perlwitz et al., 2015a; Scanza et al., 2015; Li et al., 2021). This is timely given the prospect of global soil mineralogy retrievals using high-quality spaceborne hyperspectral measurements (Green et al., 2020).
2.1 Measurement site
In situ aerosol sampling was conducted in a small study area in southeastern Morocco during the FRAGMENT wind erosion and dust emission field campaign between 3 September and 1 October 2019. A suite of meteorological and aerosol instruments was deployed as depicted in Fig. 1 to measure key meteorological and aerosol quantities. Below we describe only the instruments and measurements used in this contribution. Measurements performed during the campaign with other instruments displayed in Fig. 1b are discussed in companion papers (González-Flórez et al., 2022; Yus-Díez et al., 2023). The study area, locally known as L'Bour (29∘49′30′′ N, 5∘52′25′′ W ≈ 500 m a.s.l.), is a small ephemeral lake located in the lower Drâa valley of Morocco and lies at the edge of the Sahara approximately 15 km to the west of the small village of M'Hamid El Ghizlane. The region is characterized by high aerosol optical depth (Ginoux et al., 2012). The location was chosen primarily based on its dust emission potential and logistical feasibility. L'Bour is approximately flat and devoid of vegetation or other obstacles within a radius of ∼ 1 km and is surrounded by small sand dune fields. The surface consists of a smooth hard crust (paved sediment) mostly resulting from drying and eolian erosion of paleo-sediments, as analyzed in detail in a companion paper (González-Romero et al., 2023). Under favorable weather conditions, dust is frequently emitted from this source area (González-Flórez et al., 2022). PSDs of the paved sediment were analyzed using dry dispersion (minimally dispersed) and wet dispersion (fully dispersed) techniques and displayed two prominent modes at ∼ 100 and ∼ 10 µm (González-Romero et al., 2023). According to the fully dispersed PSD, the texture of the surface paved sediment is loam (Valentin and Bresson, 1992).
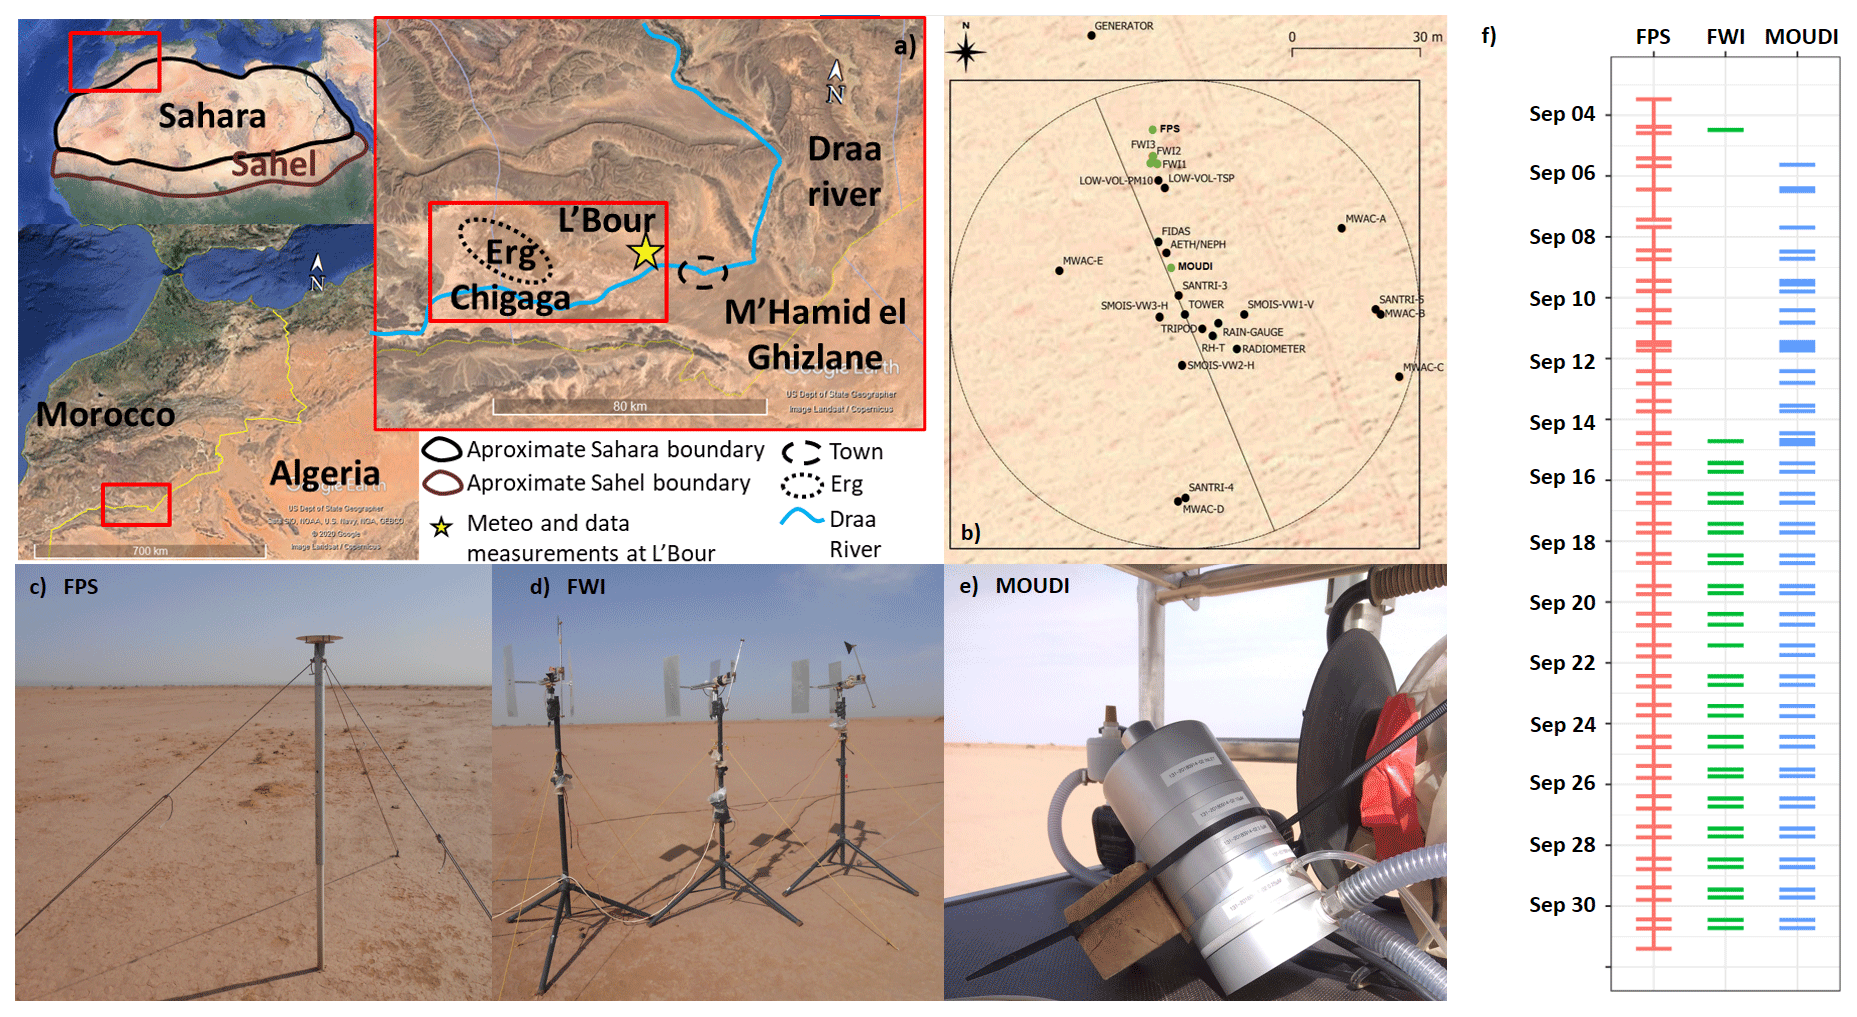
Figure 1(a) Northwestern Africa showing the area of operation of the FRAGMENT campaign. The main location of L'Bour is shown by a star and is located close to the Drâa river basin. (b) Schematic representation of different instruments used in the campaign, with green dots highlighting those instruments used for single particle analysis. (c) Flat-plate deposition sampler (FPS). (d) Free-wing impactor (FWI). (e) Cascade impactor (micro-orifice uniform deposit impactor, MOUDI). (f) Sampling schedule of particle collection using different techniques. The horizontal bar represents the start and end of the sampling time. Note that due to very short sampling time for FWI and MOUDI, the two bars (start and end) appear as one. Panel (a) was created using Google Earth (US Dept of State Geographer, Data SIO, NOAA, US Navy, NGA, GEBCO, © 2020 Google, Image Landsat/Copernicus).
2.2 Sampling techniques
Particles were collected near ground level (∼ 1.5 m) using three different sampling techniques, namely using a flat-plate sampler (FPS), a free-wing impactor (FWI), and a micro-orifice uniform deposit impactor (MOUDI, MSP Corp. Model 110), all of which are briefly described in the section below. A detailed description and methodology of sampling techniques have both been provided in previous publications (Kandler et al., 2018; Waza et al., 2019). All aerosol samples were collected on pure carbon adhesive substrates (Spectro Tabs, Plano GmbH, Wetzlar, Germany) mounted on standard SEM aluminum stubs. Pure carbon substrate was chosen because of its excellent smooth surface resulting in a clear image-analytical separation of particles and background (Ebert et al., 1997). All adhesive samples were stored in standard SEM storage boxes (Ted Pella Inc., Redding, CA, USA) in dry conditions at room temperature. Substrates in the MOUDI and FWI were collected twice daily with a typical sampling duration of a few minutes to avoid overloading the substrate for individual particle analysis. For the flat-plate sampler, the average exposure time was half a day.
2.2.1 Free-wing impactor (FWI)
A free-rotating wing impactor (Kandler et al., 2009, 2018; Waza et al., 2019) was used to collect particles larger than ∼ 3 µm (projected diameter). The FWI has a sticky carbon substrate as an impaction surface and is attached to a rotating arm that moves through the air; particles deposit on the moving plate due to their inertia. The rotating arm is moved at a constant speed by a stepper motor, which is fixed on a wind vane, aligning the FWI to the wind direction. The substrate itself is oriented perpendicular to the air stream vector (resulting from wind and rotation speeds) by a small wind vane attached to the rotating arm. The particle size cutoff is determined by the impaction parameter, i.e., by rotation speed, wind speed, and sample substrate geometry.
2.2.2 Flat-plate sampler (FPS)
The flat-plate sampler used in this work is based on the original flat-plate sampler used in Ott and Peters (2008). It consists of two round brass plates (top-plate diameter of 203 mm, bottom-plate diameter of 127 mm, thickness of 1 mm each) mounted with a distance of 16 mm separating them. The plates protect the substrate from precipitation and reduce the effects of wind speed by reducing the smallest turbulence via the distance between the parallel plates. In this setup, larger particles (> 1 mm) cannot enter the sampling stub surface at low wind speed (Ott and Peters, 2008). The main controls for particle deposition on the substrate are diffusion, gravity settling, and turbulent inertial forces.
2.2.3 Cascade impactor (MOUDI)
Sampling was conducted using a five-stage micro-orifice uniform deposit impactor (MOUDI, MSP Corp., MN, USA) with a 100 L min−1 flow rate. The impactor has stages available with a 50 % cut-point aerodynamic diameter (Da) of 10, 2.5, 1.0, and 0.25 µm. Particles were collected on 25 mm sticky carbon substrates attached to the 75 mm impaction plate using a double-sided adhesive. The sampling time was chosen to provide optimum particle loading for single-particle analysis, which was usually limited to a few minutes. The short sampling time resulted in fewer particle collections in the first two stages, and therefore only the third and fourth stages were selected for detailed analysis.
Particle bounce can be an issue with an inertial impactor such as the MOUDI and occurs when particles impact on the collection substrate but are not retained. Studies have shown that particle bounce reduces at the relative humidity of > 70 % depending on the mineralogical properties of particles (Bateman et al., 2014; Fang et al., 1991; Vasiliou et al., 1999). During the measurement campaign, the relative humidity was usually below 60 % with a maximum of 71 % (see Fig. A1). Therefore, particle bounce can occur, which could lead to biases in the particles collected. Additionally, the shattering and asphericity of dust particles can further induce bias in collected particles.
2.3 Scanning electron microscopy (SEM)
Size, morphology, and elemental composition of a large number of individual particles were investigated by SEM as has been done in previous studies (Kandler et al., 2007; Chou et al., 2008; Engelbrecht et al., 2009b; Jish Prakash et al., 2016; Engelbrecht et al., 2017; Ryder et al., 2018; Kandler et al., 2020). About 64 000 (FWI), 100 000 (FPS), and 176 000 (MOUDI) individual particles were analyzed with a scanning electron microscope (FEI ESEM Quanta 400 FEG instrument, Eindhoven, The Netherlands) equipped with an X-Max 150 energy-dispersive X-ray spectroscopy (EDX) silicon drift X-ray detector (Oxford, Oxfordshire, UK) controlled by AZtec 4.4 Oxford software. The AZtecFeature software expansion was used to obtain particle data from thousands of particles in an efficient way. All of the samples were analyzed in high-vacuum conditions without any pretreatment. Backscattered electron (BSE) imagery was used for particle detection, as dust particles are composed of elements with atomic numbers greater than carbon and are therefore visible as detectable bright spots in the BSE image. An acceleration voltage of 12.5 kV, beam current of 18 nA, “spot size 5.0” (beam diameter of ∼ 3 nm), and working distance of approximately 10 mm were used to produce the optimum number of input counts by the EDX detector. The scanning resolution was tuned to particle size. For MOUDI and FPS, 160 nm per pixel was used to identify particles with minimum size of 0.5 µm projected area diameter, and for FWI 360 nm per pixel was used to identify particles larger than 2.5 µm in projected area diameter. Chemistry information is derived by EDX. The internal ZAF correction (Z being atomic number, A being absorption, and F being fluorescence, accounting for matrix-dependent efficiencies) of the detector and software system – based on inter-peak background radiation absorption measurements for correction – was used for obtaining quantitative results. The SEM-EDX results are normalized to 100 %, including those of the elements C, N, O, Na, Mg, Al, Si, P, S, Cl, K, Ca, Ti, V, Cr, Mn, Fe, F, Zn, and Pb. The detection limits of each element are determined based on 2σ of the peak intensity and calculated with the AZtec software. A final sorting step is done to remove particles with low X-ray counts due to shading effects.
2.4 Particle morphology determination
2.4.1 Projected-area and volume-equivalent diameters
In the present study, the image analysis integrated into the SEM-EDX software AZtec is used to determine the size of particles as a projected area diameter. Projected area diameter, dp, is the diameter of a circle having the same area as the dust particle projected in a two-dimensional image and is calculated as follows:
where A is the area covered by the particle on the sample substrate.
Following Ott and Peters (2008), the volume-equivalent diameter (sphere with the same volume as an irregularly shaped particle) also called the geometric diameter, dv, is estimated from the projected area diameter via volumetric shape factor expressed by particle projected area and perimeter (P) as follows:
All particle diameters (d) presented here are converted from projected area-equivalent diameter to volume-equivalent (geometric) diameter (unless stated otherwise). The reason for this conversion is that geometric diameter is used in global aerosol models to quantify dust size (Mahowald et al., 2014) and optical properties depend on the particle volume.
2.4.2 Aspect ratio
The two-dimensional (2D) shape of individual dust particles is presented here as aspect ratio (AR) and was calculated by the image analysis integrated into the SEM-EDX software AZtec. The AZtec software manual defines AR as the ratio of the major to the minor axis of the elliptical fit on the projected particle area. Symmetrical features, such as spheres or cubes, have an AR that is approximately 1 whereas features that have shapes like ovals or needles have an AR that is greater than 1. A critical shortcoming of 2D imaging is that it can yield different shapes of 3D particles depending on their orientations on the sampling substrate (Huang et al., 2020).
2.5 Number deposition rate calculation
The number deposition rate (NDR) is calculated from deposited particle numbers per area and individual particle size. First, a window correction (cw) was applied (Kandler et al., 2009) to the particle deposition rate as
where wx and wy are the dimensions of the analysis rectangle.
The NDR is then calculated as
where A is the total analyzed area, t is the sample collection time, and i is the index of the particle.
2.5.1 Determining the size distributions from free-wing impactor measurements
Obtaining the atmospheric PSD from FWI requires consideration of window correction and the collection efficiency dependence on the impaction speed and geometry. These corrections are applied to every individual particle as a function of its size and composition to get the overall collection efficiency (ce) (for detailed formalism, see Sect. S4). The atmospheric concentration (C) is then computed from the deposition rate and velocity as
where A is the total analyzed area, v is the impaction velocity, t is the sample collection time, and i is the index of the particle.
2.5.2 Determining the size distributions from the flat-plate sampler and cascade impactor measurements
Obtaining atmospheric concentrations from the NDR requires the use of different deposition velocity models for the flat-plate sampler. There are a variety of models to estimate particle deposition speed based on a set of assumptions and neglected factors (Noll et al., 2001; Aluko and Noll, 2006; Piskunov, 2009; Petroff and Zhang, 2010). However, none of these models fitted the observed deposition velocities, which appeared to be rather uniform in Waza et al. (2019). Therefore, for the present work, a constant deposition velocity for the size range of interest was assumed, and the PSD were normalized by fitting the number (N) size distribution to the power law dN d log and dividing all measurements by the fitted proportionality constant c (Kok, 2011). For the MOUDI samples, atmospheric concentrations cannot be determined with the analytic approach used in this work because the size of the impaction spot cannot be retrieved with high accuracy to get the total number of particles deposited at each spot. Therefore, the same approach as FPS is applied to the MOUDI samples to get the PSD. In addition, direct comparison is often difficult among different instruments due to the different nature of particle collection from each technique (Chou et al., 2008; Price et al., 2018).
2.6 Particle classification and composition
SEM-EDX measures the elemental composition of individual dust particles. Some minerals have well-defined compositions and can therefore be readily identified (e.g., gypsum, quartz, calcite). Others, e.g., clay minerals, are variable in nature, so their identification is more ambiguous. Moreover, dust particles are commonly found in the form of internal mixtures or aggregates rather than in their pure mineral forms, and therefore the method used in this study identifies the major mineral type in each particle. As there is no standardization that is suitable for characterization of mineral dust aerosols using SEM, different approaches have been developed, ranging from a simple scheme (Kandler et al., 2007, 2009) to more complex ones (Kandler et al., 2011, 2018). In comparing different desert aerosols (Kandler et al., 2020), plausible differences related to geology and weather conditions were observed; however, various biases also exist between different techniques (Marsden et al., 2019).
Particle classification in this study is supported by the analysis of dust and soil samples for the major mineral composition from X-ray diffraction (XRD) measurements reported in a companion paper (González-Romero et al., 2023). Furthermore, to assess artifacts, a few clean blank samples taken during the campaign were scanned, and certain particle types could be identified as contaminants and are thus discarded from the analysis. The contaminants detected consisted of pure iron (apparently already from the manufacturing process) and F + Si. The contaminants were mostly rare compared to the abundance of dust particles.
Based on the single-particle composition quantification, an elemental index for the element X is defined as the atomic ratio of the concentration of the element considered and the sum of the concentrations of the elements quantified (Kandler et al., 2007, 2018)
where the element symbols represent the relative contribution (in atom percentage) measured for each particle. Note that the given method was not applied to quantify the percentage of C, N, and O due to their high uncertainty and substrate contributions. The method used to analyze particles collected on substrates follows our previous work (Kandler et al., 2018), and therefore the approach is only described briefly here. Classification was done using a set of rules, which use the elemental index and additional elemental ratios and are defined by the dominance of one or more specific elements or their ratios (e.g., Al, Si, Ca, Fe, Al Si). Particle classes are named for their most prevalent chemical component(s), which may contain terms for mineral phases to simplify the naming (e.g., gypsum, quartz). The mineral labels were assigned from the best match to the measured elemental concentrations. There was no actual phase identification of individual particles (e.g., by transmission electron microscopy) carried out. Therefore, all the particle classes are termed “-like” to express the similarity in chemical fingerprints. Details of the classification procedure are given in Sect. S1.
2.7 Ancillary data
Aerosol PSDs of suspended mineral dust were also obtained by using an optical particle counter (OPC, FIDAS 200, Palas GmbH, Germany). The measurement range of FIDAS was 0.2–19 µm with a time resolution of 2 min and a flow of 4.80 L min−1. Data acquisition was performed by a data logger, averaging measurements over 2 min. In addition, meteorological data were acquired with a time resolution of 1 s. Air temperature and relative humidity were measured by HC2A-S3 sensor (Campbell Scientific), and wind speed and wind direction were recorded by a two-dimensional sonic anemometer (Campbell Scientific WINDSONIC4-L) during the sampling period at approximately 0.4, 0.8, 2, 5, and 10 m height facing north above ground level (see Fig. A1). The average OPC concentration PSD is used here for comparison purposes. The default optical diameters were transformed into dust geometric diameters assuming dust asphericity and aspect ratios obtained with SEM aspherical dust. The details are described in a companion paper (González-Flórez et al., 2022) that thoroughly analyzes the emitted flux PSD and its variability.
2.8 Statistical analysis
The uncertainty in the counting statistics for various particle groups was determined by generating confidence intervals assuming binomial distribution; i.e., for a relative number abundance of a particular particle group r, the two-sided 95 % confidence interval is approximated (Hartung et al., 2012).
3.1 Observed particle types
Typical chemical compositions of a set of minerals and boundary rules were used to define particle groups (see Sect. S1). Based on set classification rules, particles were assigned to different types. Each of these particle types is discussed further in Sect. S2. Figure 2 and Table S3 show the average elemental composition of these groups. However, it is important to treat this classification scheme with caution as each particle can be composed of different minerals, which can in part have variable or ambiguous compositions. As a result the groups used do not uniquely identify a mineral but instead show the most probable mineral matching a particle composition. This is reflected in the suffix “-like” being used in the group nomenclature. As there are other potential identification approaches, with their own associated advantages and limitations, the full data set generated and used in this study is provided for future studies.
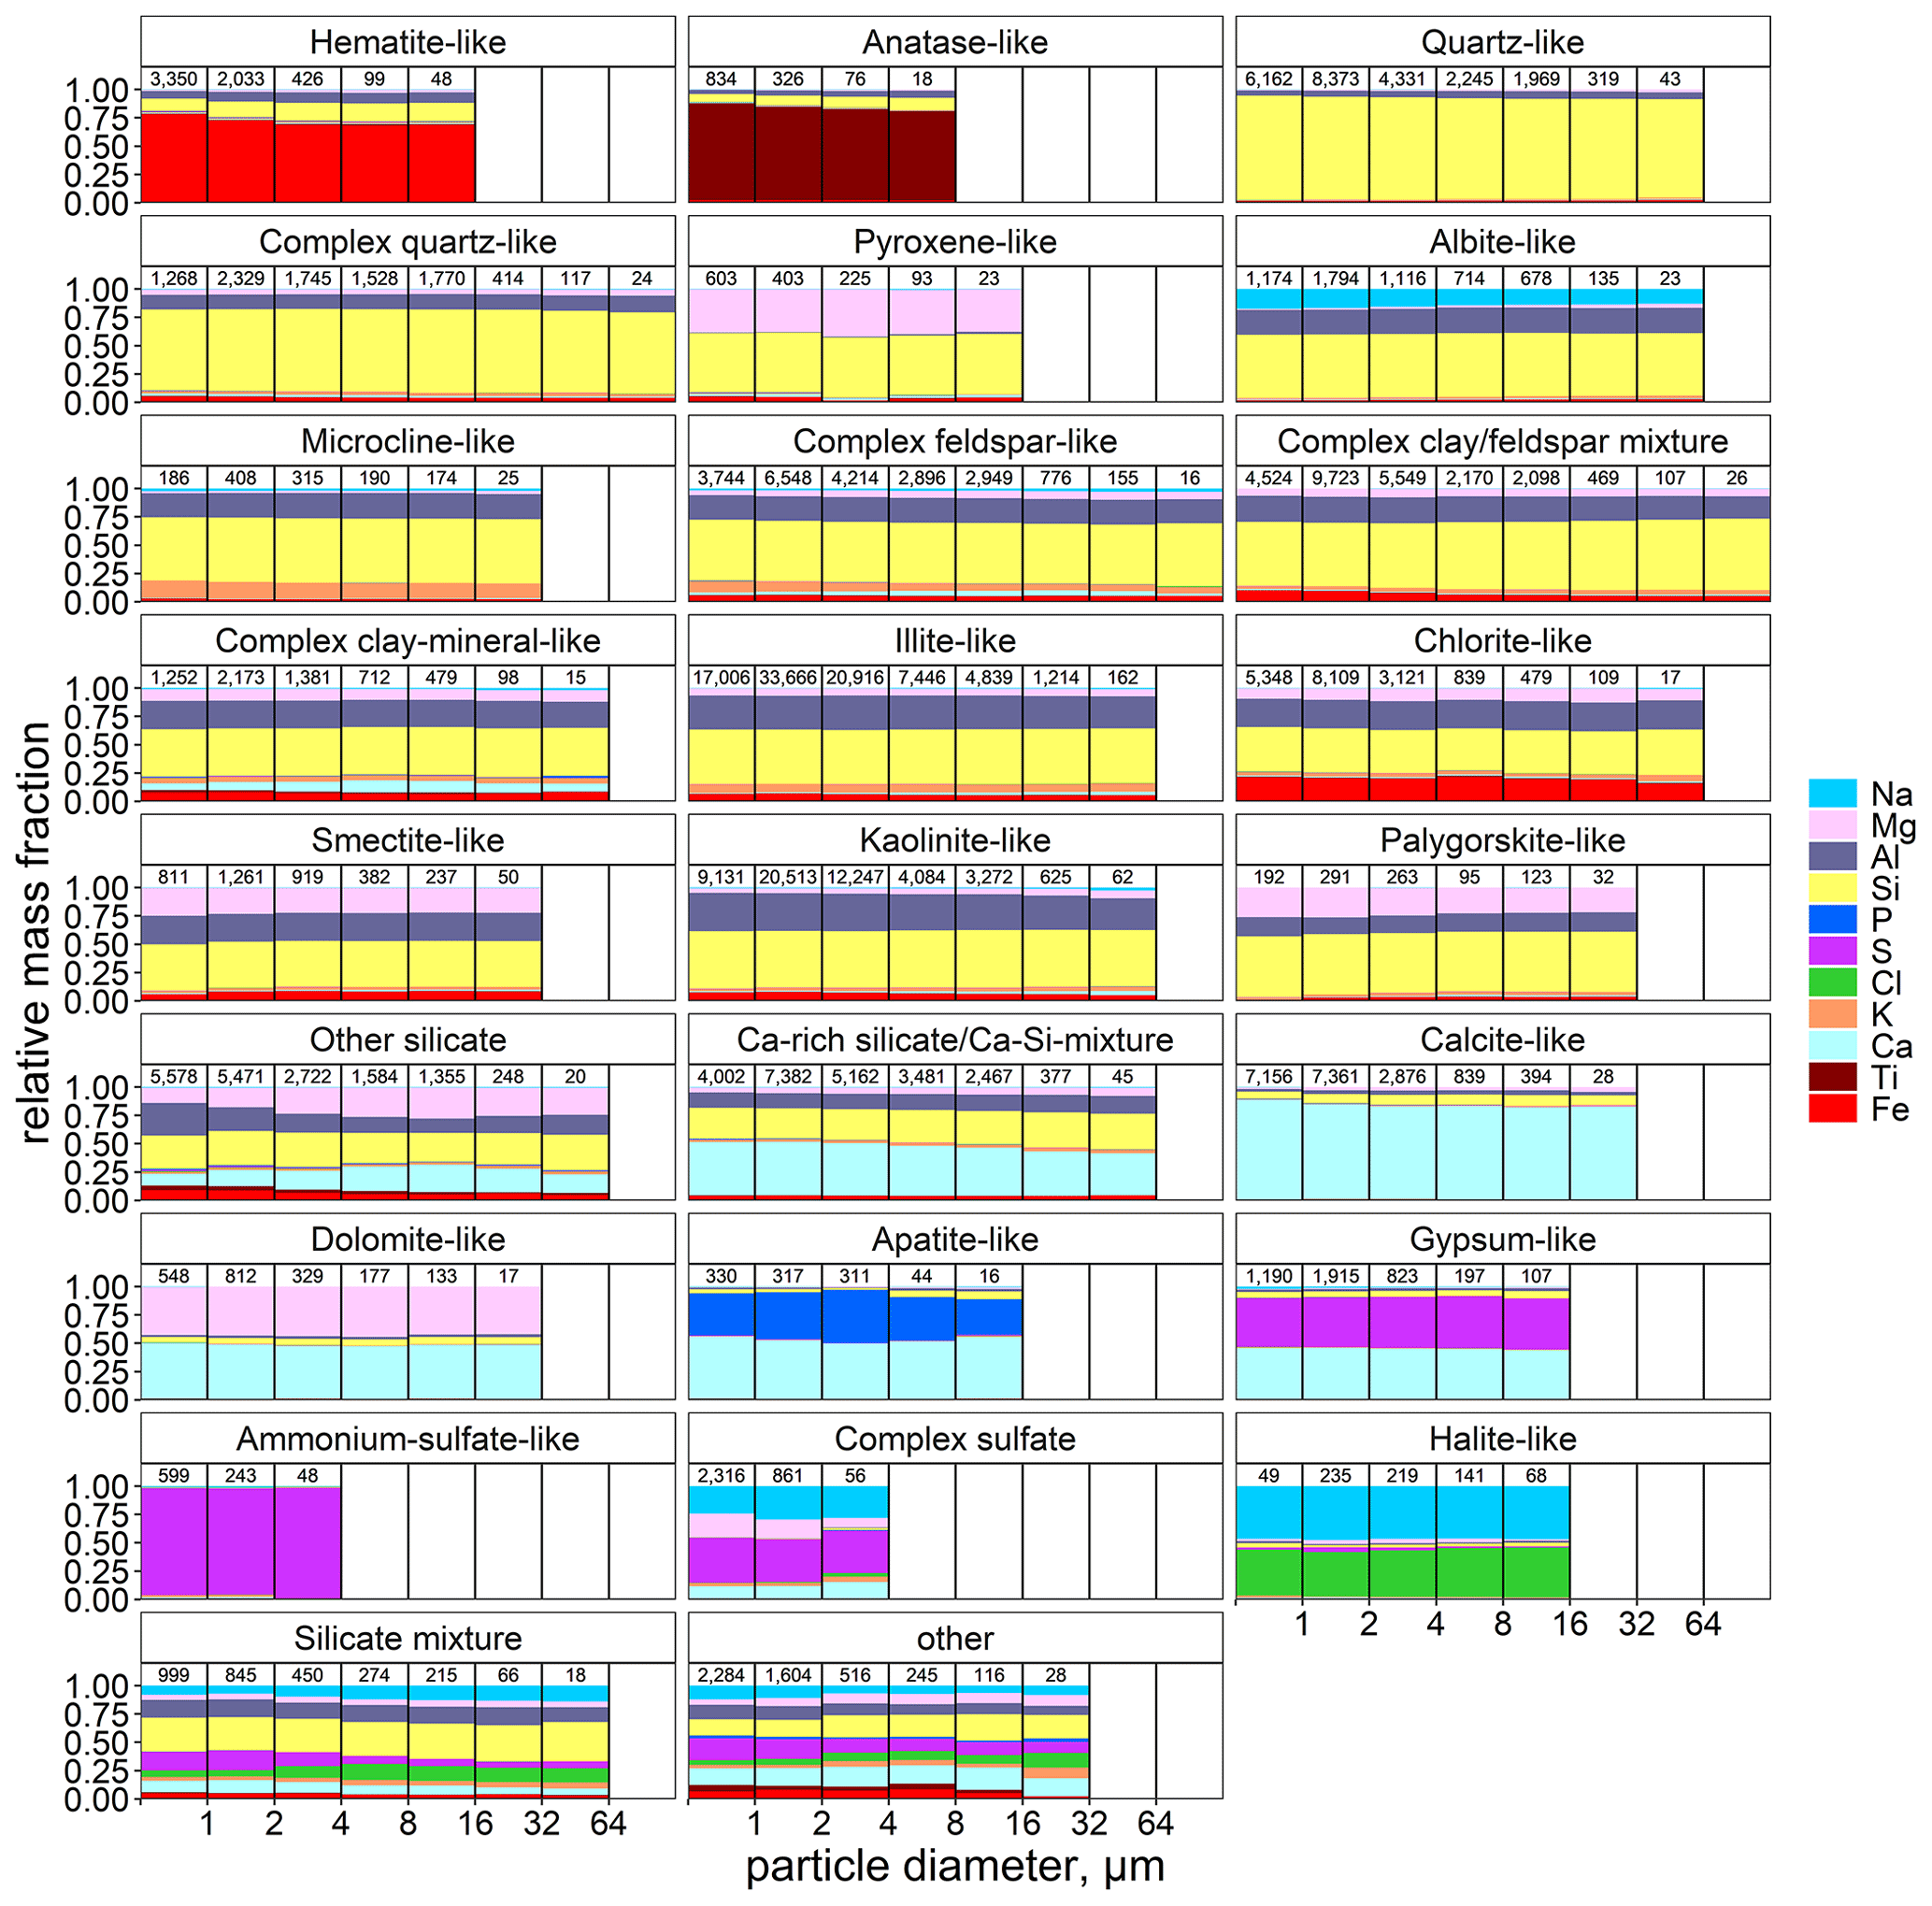
Figure 2Average elemental composition as a function of particle size for different particle groups. The legend shows element index for each respective element. The numbers on top represent total particle counts in the given size bin. Abundance bars are not shown for size bins with fewer than 10 particles.
3.2 Comparison of PSD of different techniques for particle collection
Figure 3a presents normalized PSD obtained by FPS, MOUDI, and OPC as described in Sect. 2.5.2. The normalization allows us to easily compare the shape of the PSD obtained with the different techniques, i.e., the relative contribution of particles of different sizes. The PSD obtained by the FPS shows good agreement with that obtained from the OPC. The PSD of the measured volume equivalent diameter is towards the higher end of the cutoff aerodynamic diameter expected on individual MOUDI stages. In stage 3, the mode is at around 3 µm (nominal cut point 2.5 µm) and for stage 4 the mode is at 1 µm (nominal cut point 1 µm). Figure 3b shows the PSD obtained by the FWI and is compared with the PSD from the OPC. A clear discrepancy is observed between FWI and OPC that is larger than the statistical uncertainties. Here, the FWI substantially underestimates particles < 10 µm. The collection efficiency of the FWI is 50 % for 11 µm aerodynamic diameter particles (Kandler et al., 2018) and therefore for fine mode particles the efficiency correction function can result in unrealistic values. For diameters > 10 µm, the shape of the PSD is similar to that of the OPC but the observed concentrations are still an order of magnitude smaller. The discrepancy may be linked to one or more of the following potential sources of uncertainty: a poorly defined efficiency curve for the FWI and/or particle density estimation from SEM to calculate volume equivalent diameter for efficiency correction. In this contribution, the shape (and not absolute concentration) of the PSD is relevant and is quite similar among the different measurement techniques used and OPC. It therefore provides confidence in the size-resolved elemental composition derived by SEM.
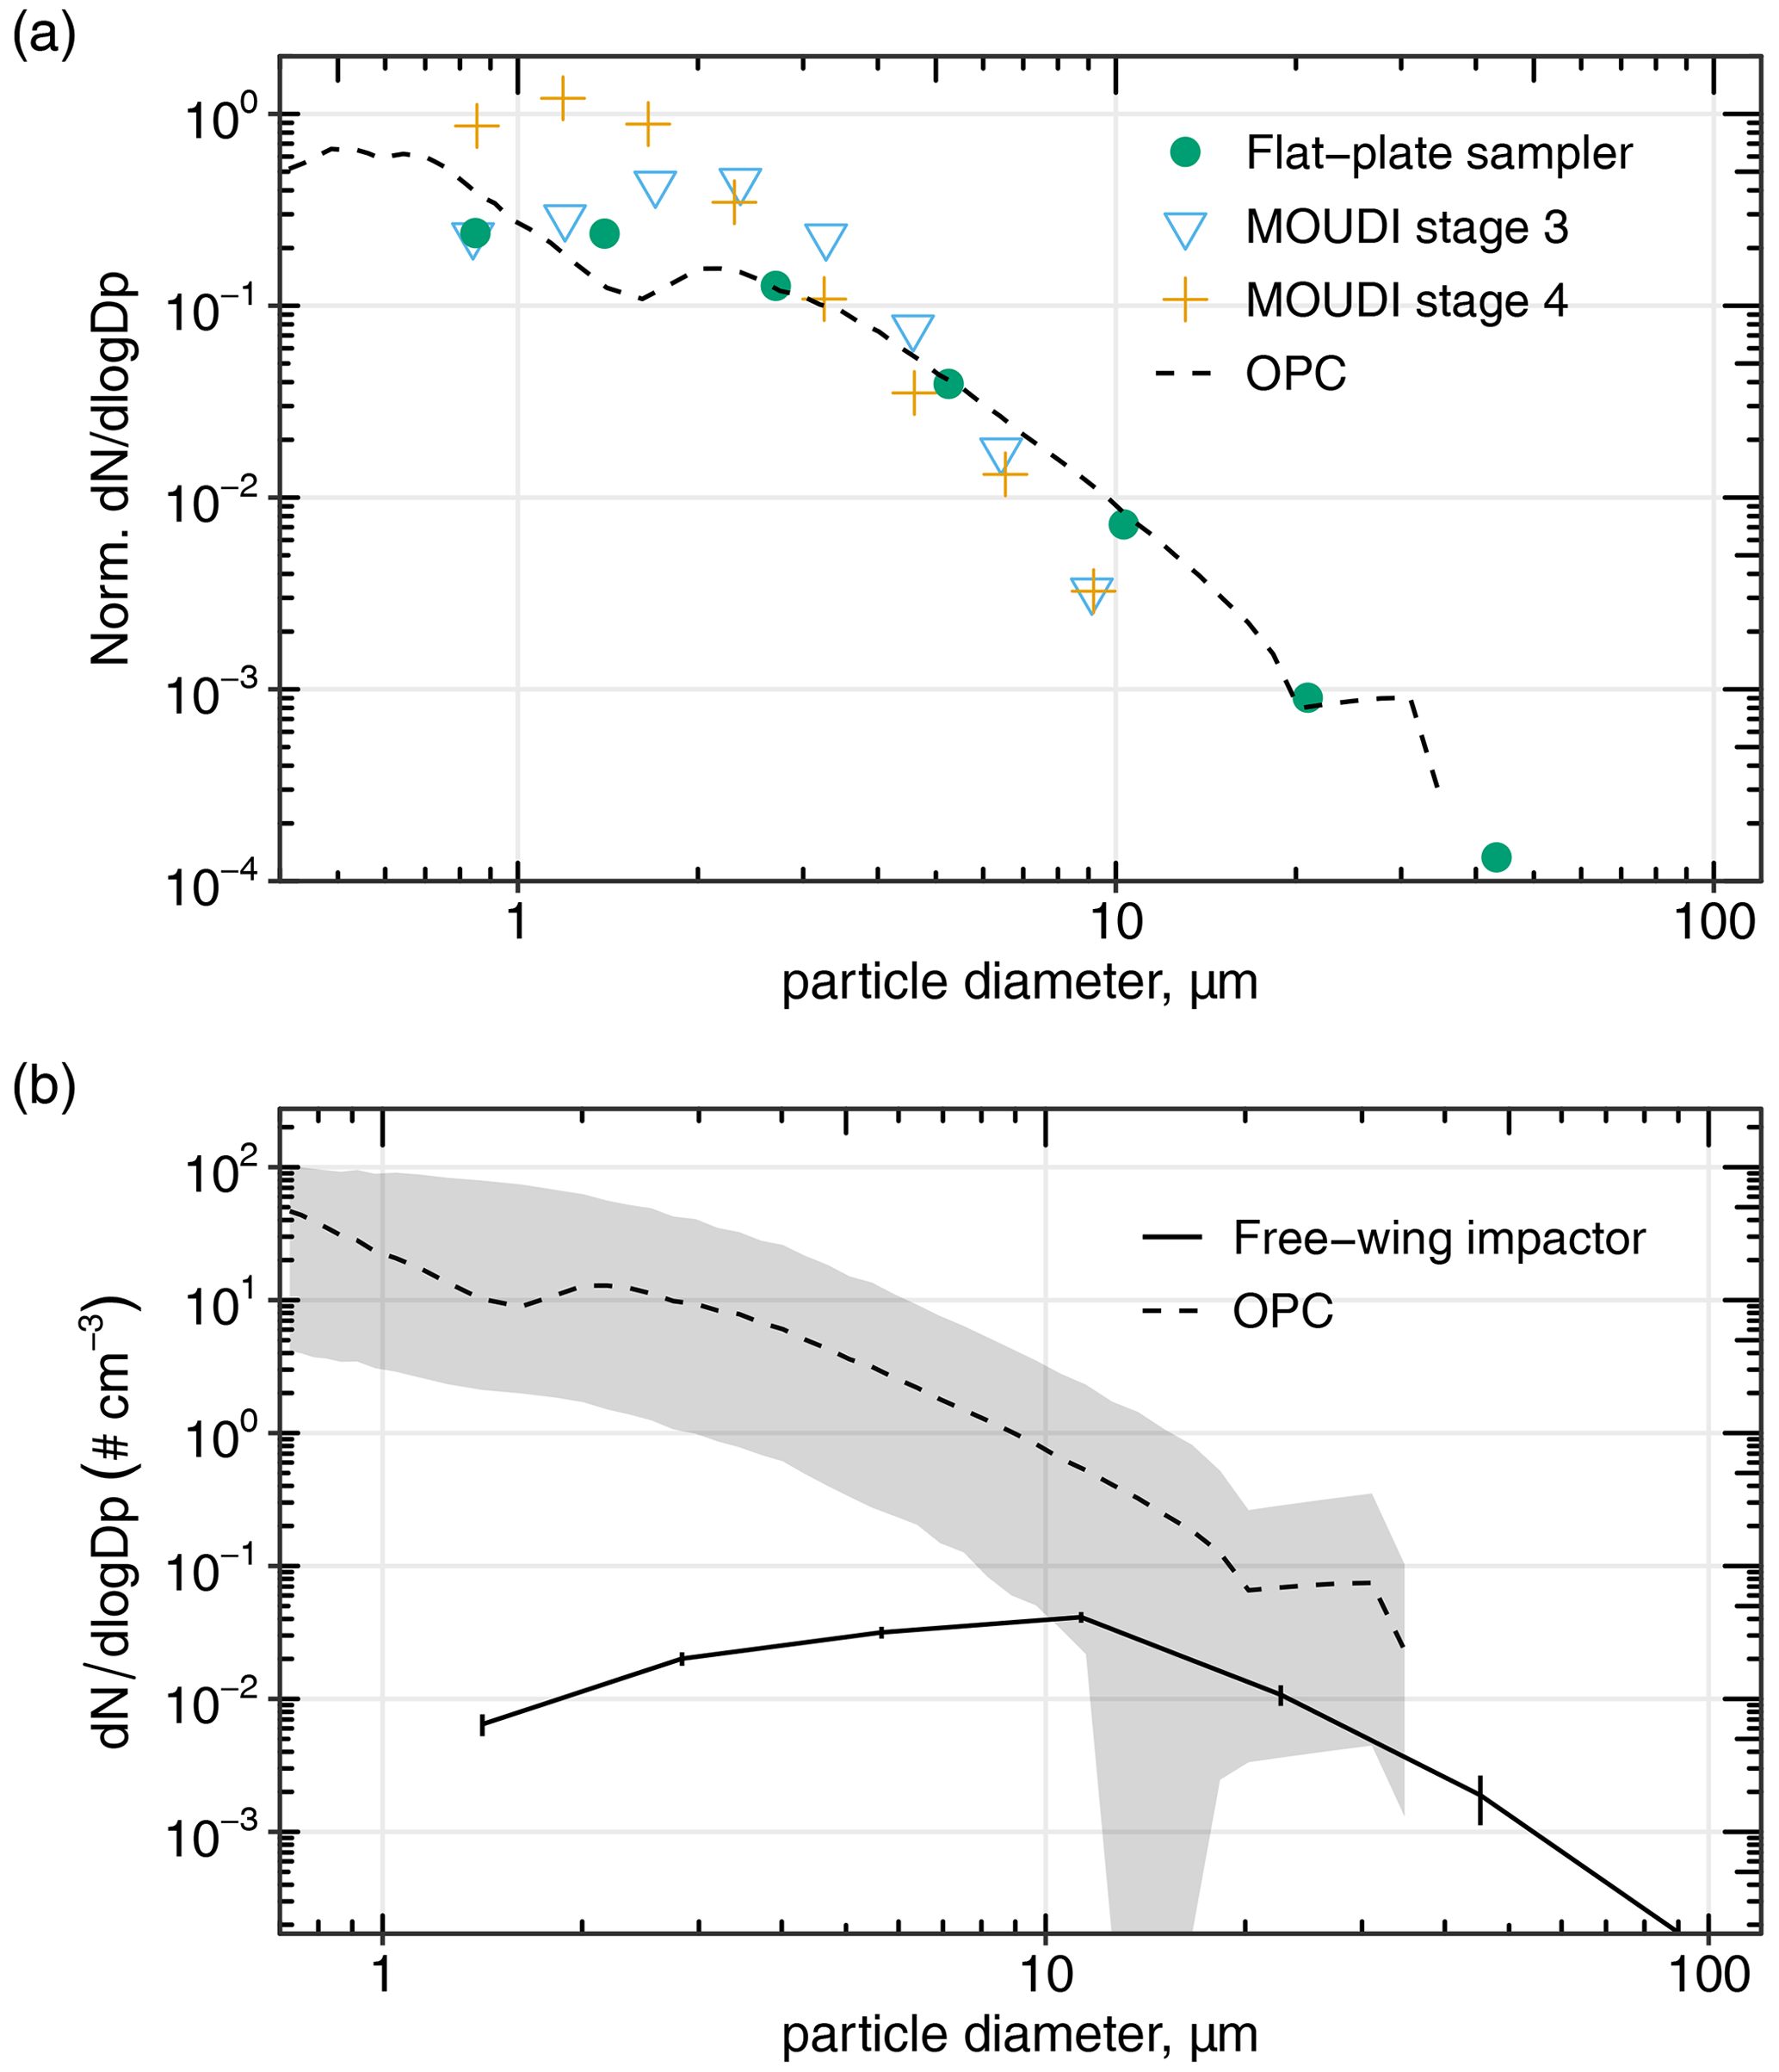
Figure 3(a) Normalized particle size distribution obtained by different sampling techniques averaged over the entire campaign period. (b) Comparison of the atmospheric particle size distribution between FWI and OPC. The bold line is for FWI, with the error bar showing the Poisson counting error, the dashed line indicates the field campaign mean size distribution from OPC, and the shaded region shows the 95th and 5th percentiles. Note that the collection efficiency of the FWI drops significantly below ∼ 15 µm diameter.
3.3 Particle composition
The dependence of composition on size is shown in Fig. 4 and Table 1 for aerosol samples collected with three different sampling techniques. Since the composition of the aerosol particles in each sample does not exhibit a large sample-to-sample variability (see Figs. S2, S3, and S4 for individual samples), all of the dust sample compositions were merged for further comparison. Furthermore, the collection efficiency by size is less relevant to the fractional contribution of each mineral type per size, and therefore integrating all the techniques together improves the statistics for each size with a higher number of particles analyzed.
Table 1Size-resolved mass fraction (%) of particles in each particle class (number fraction in parentheses).
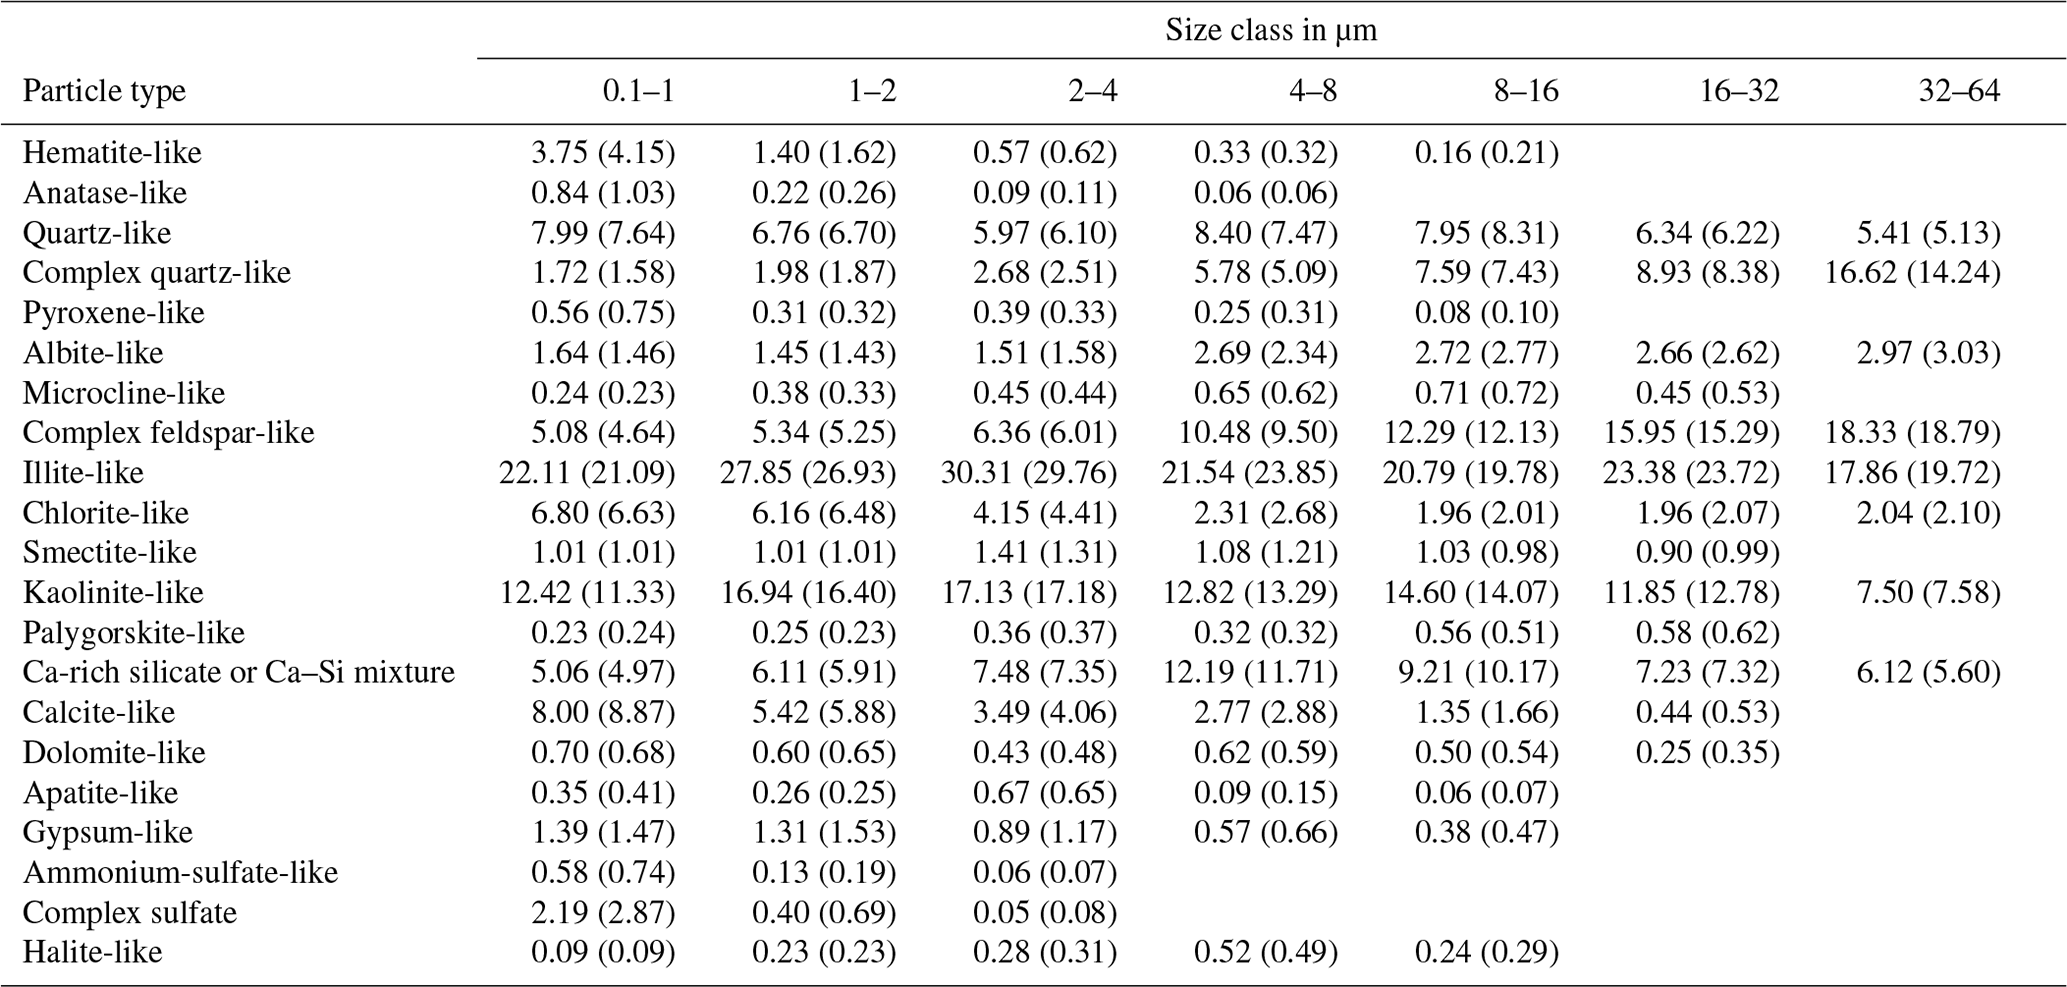
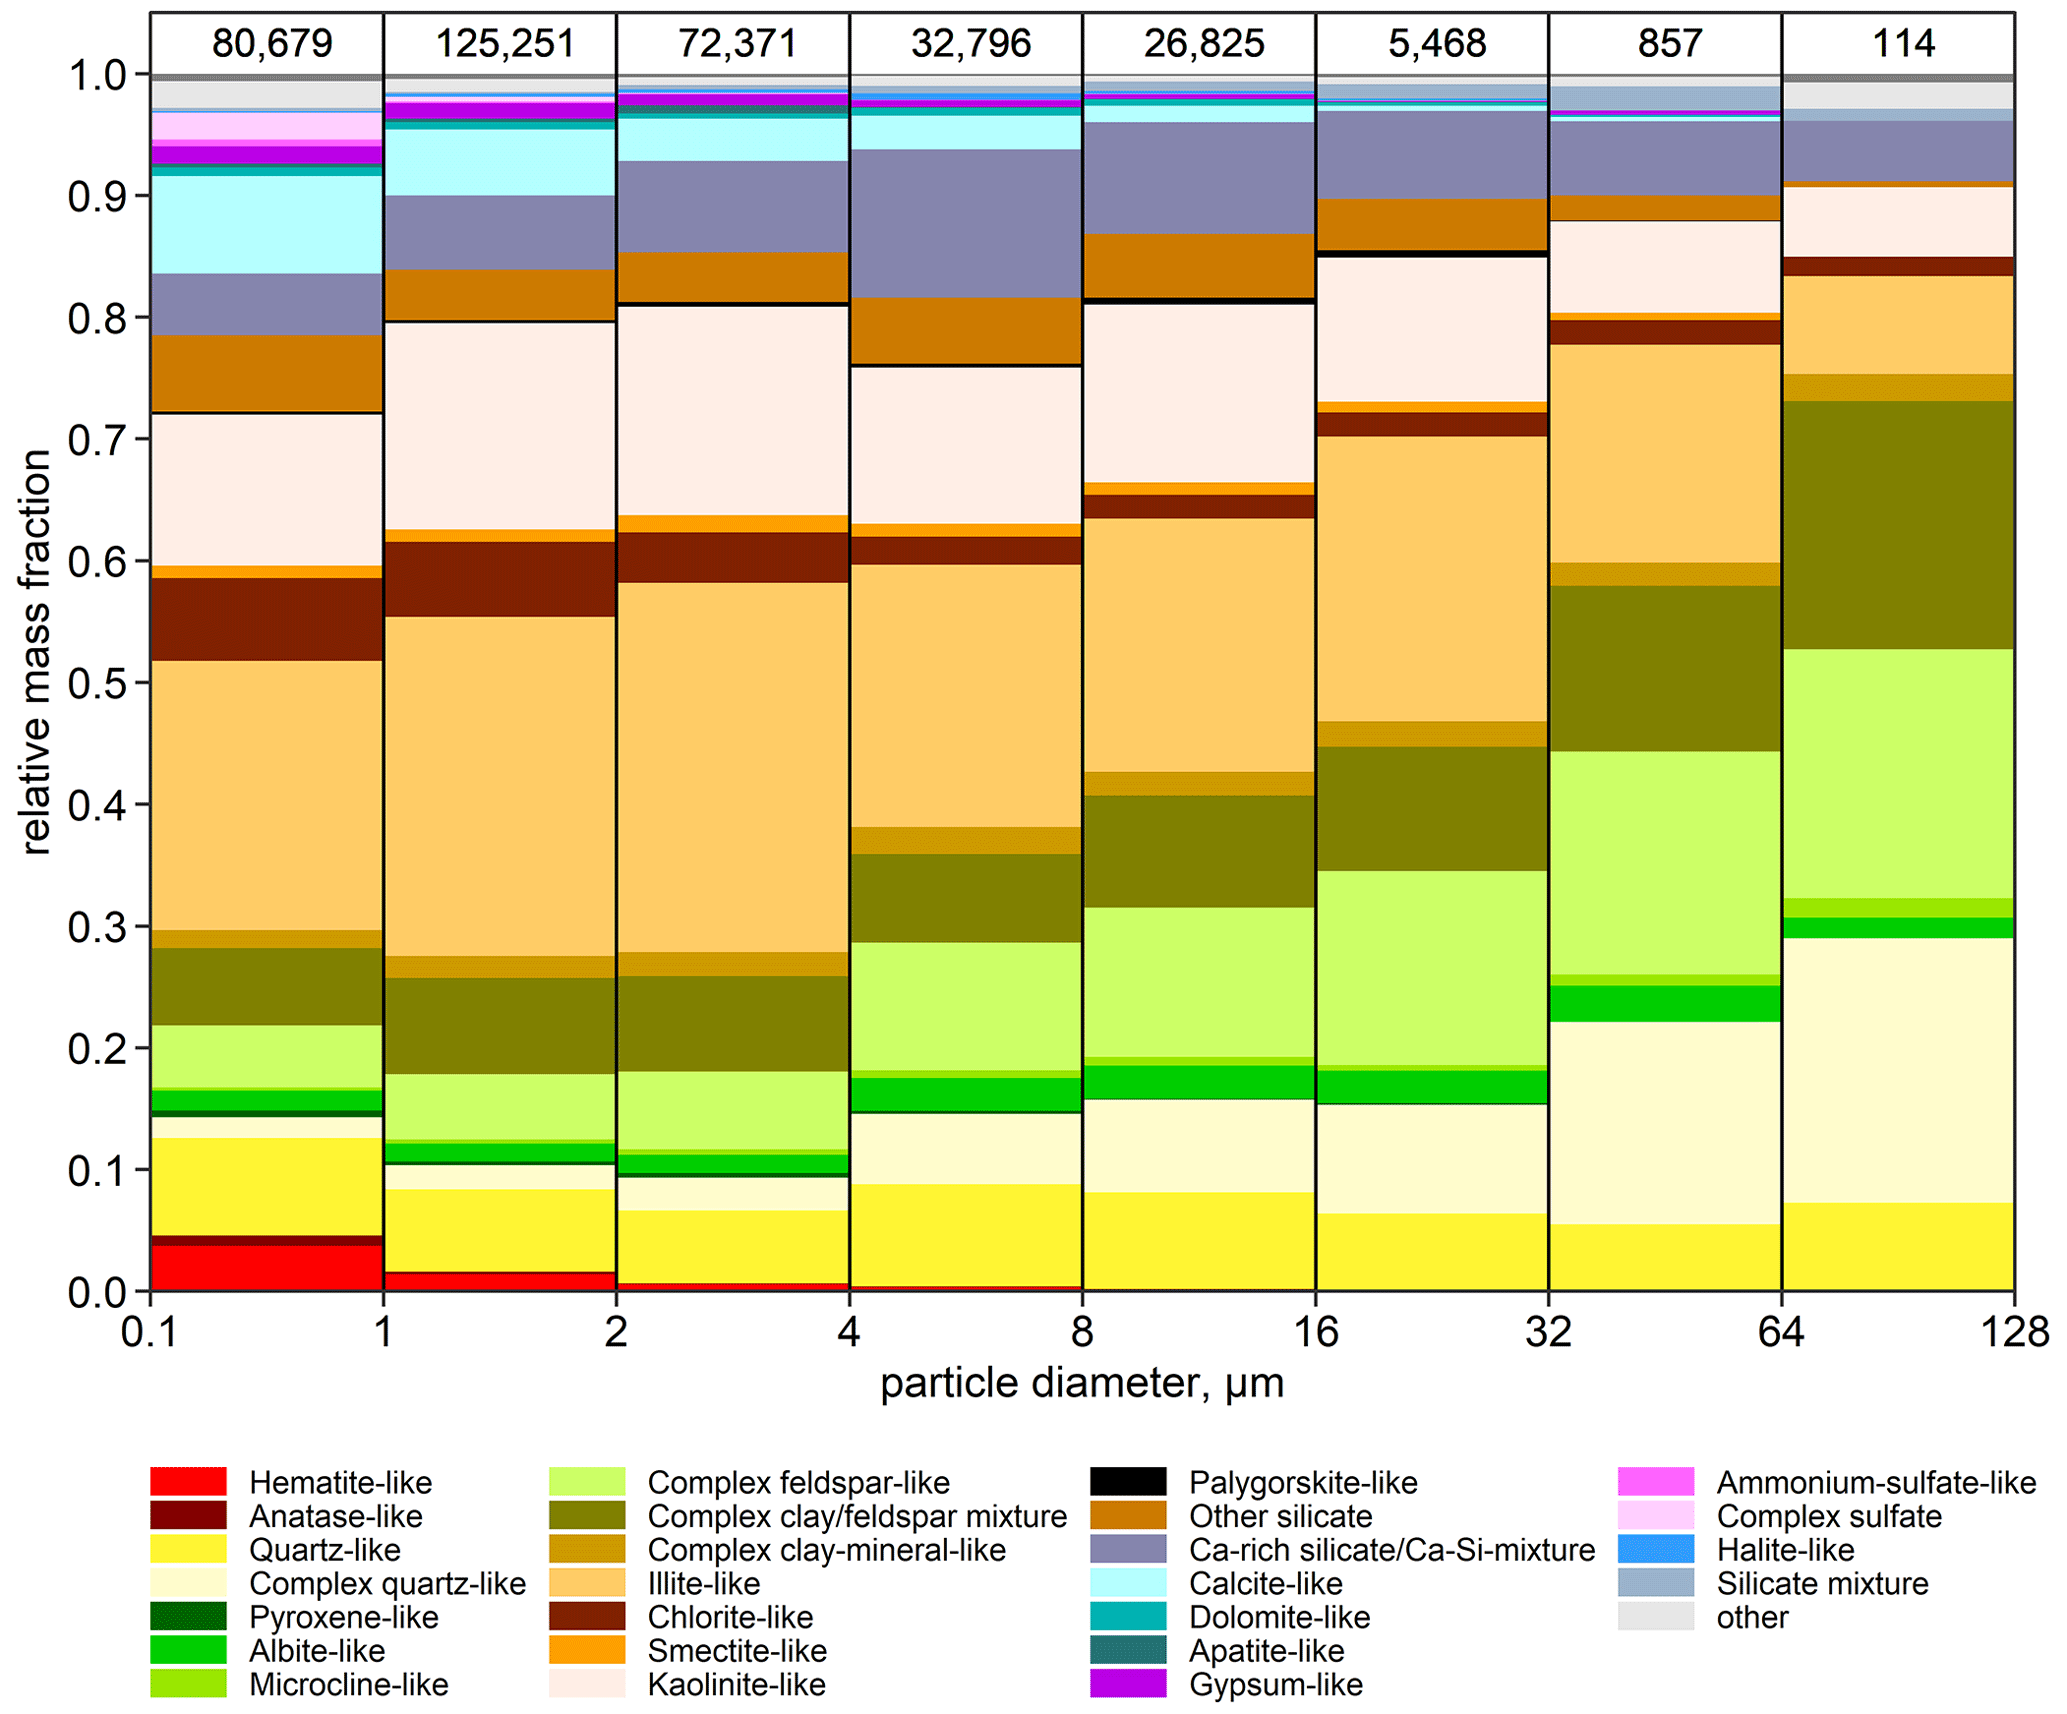
Figure 4Average size-resolved mass abundance of different particle groups. The numbers on top represent total particle counts in the given size bin.
A clear trend is seen among the different particle groups based on their size. Clay minerals are the most abundant and are present across all size ranges. Quartz-like particles are found in each size class with almost similar mass abundance (around 5 %–8 %), whereas the mass fraction for complex quartz-like particles grows with particle size from 2 % in dv < 1 µm to 22 % in dv > 64 µm. This suggests that as particle size increases, quartz particles get internally mixed with elements like Al and Fe, forming complex aggregates. Likewise, a similar trend is observed for feldspar particles where complex feldspar-like particles increase with particle size as a result of the inclusion of other elements creating a complex mixture. This observation is consistent with Engelbrecht et al. (2016, 2017), who found larger particles to be generally present as aggregates and coatings on other mineral particles. A detailed discussion on feldspar particles is addressed further in Sect. 3.3.4. Fe-rich particles are present in low quantities, and their contribution decreases with particle size. As they are highly relevant in controlling spectral shortwave refractive index (Engelbrecht et al., 2016; Caponi et al., 2017; Di Biagio et al., 2019), they are further discussed in detail in Sect. 3.3.3. Furthermore, iron is detected across all the size classes and present in most of the particle groups. This could have further implications for the absorption as absorption increases with particle size, which could be further enhanced because of the iron content. Similarly, the proportion of Ca-rich particles (calcite, dolomite, gypsum, apatite) are mainly confined to particles smaller than 4 µm. The Ca–Si mixture is slightly enhanced at dv > 4 µm, which could be due to the availability of more silicates to form aggregates with calcite, and the depletion of illite-like particles could also partly form aggregates with calcite as well. Sulfate-like particles are mainly present in the smallest size bin of < 1 µm. These are most probably anthropogenic or secondary aerosol as corroborated with measurements of optical properties (Yus-Díez et al., 2023) and PSD (González-Flórez et al., 2022).
Studies on individual particle analysis of mineral dust by SEM and EDX have provided insights into the compositional variability, size, and morphological characteristics of dust particles from different regions. Kandler et al. (2009) presents the composition of Saharan mineral dust collected during the SAMUM campaign from in situ measurements at Tinfou, Morocco, in May–June 2006, thus providing an ideal comparison to our findings. On average, their particle composition between 0.5 and 50 µm diameter is also primarily aluminosilicates with a smaller contribution of quartz and calcium-rich particles. However, one finding of note from Kandler et al. (2009) is the observation of quartz fraction to increase with particle size, mainly for particles larger than 20 µm in diameter. Although our results reveal that quartz-like and complex-quartz-like fractions increase with particle size, these are not the dominant components as reported in Kandler et al. (2009). Marsden et al. (2019) present the mineralogy and mixing state of particles smaller than 2.5 µm in laboratory-suspended northern African dust using SEM. They found a dominance of clay minerals in the size < 2.5 µm, which is similar to the observations reported in the current study. Scheuvens et al. (2011) observed compositional homogeneity of dust over southern Morocco, consistent with our results, indicating dust at source regions to not usually be affected by anthropogenic components. Additionally, compositional and morphological homogeneity was also reported by Chou et al. (2008) for dust samples taken over Niger. Nevertheless, our study shows distinct compositional signatures of prominent source area (e.g., occurrence of apatite-like particles, elevated Ca-rich content). For the Middle East, Jish Prakash et al. (2016) reported relative mass abundance of 45 %–75 % clay minerals, 5 %–54 % feldspar, and 0.1 %–10.2 % quartz as main components, while calcite, dolomite, gypsum, and iron oxides were the minor constituents of individual dust particles in the size range 0.5–38 µm. This is quite similar to our results if the “complex” part of the quartz and feldspar fraction, together with its “mineral-like” component, is considered one fraction, suggesting a similarity between Arabian and Saharan dust. A separate study from Engelbrecht et al. (2009a) found quartz and feldspars to be the dominant particle type in Kuwait, while calcite and dolomite were major components in the dust particles from the UAE and Iraq. This is quite different to the mineralogy in our study and could be due to the different chemical weathering regime and the composition of the parent sediments. In Asia, Jeong (2008) reported mineralogical properties of Asian dust to mainly consist of clay aggregates (48 %), quartz (22 %), plagioclase (11 %), calcite (6 %), and K-feldspar (5 %). The mineral composition of Asian dust therefore has a higher K-feldspar content compared to our findings in Morocco, while illite is observed in both the Asian dust and our study as a major clay mineral.
3.3.1 Particle abundances using different techniques
Figure 5 shows the compositional information for dust samples obtained using three different collection techniques. These techniques have different collection efficiencies, target size ranges, and sampling intervals. The goal was to get a representative number of particles across a wide size distribution, which is usually the case for mineral dust. However, the collection of particles larger than a few micrometers is relatively difficult due to the poor collection efficiency of many instruments. Therefore, in this work an inlet-free impactor, i.e., FWI, was used to sample particles with dv > 3 µm, whereas FPS and MOUDI were used primarily for particles with dv < 3 µm. The non-parallel sampling time of the sampling techniques during the present field campaign could not be avoided as FWI and MOUDI operate actively while the FPS operates passively. The active samplers have a much higher collection velocity. This requires short sampling time for the two active samplers. On the contrary, the passive sampler (i.e., FPS) require a much longer sampling time. Using the same collection time would result in either under-loading of the passive samplers or overloading of the active samplers.
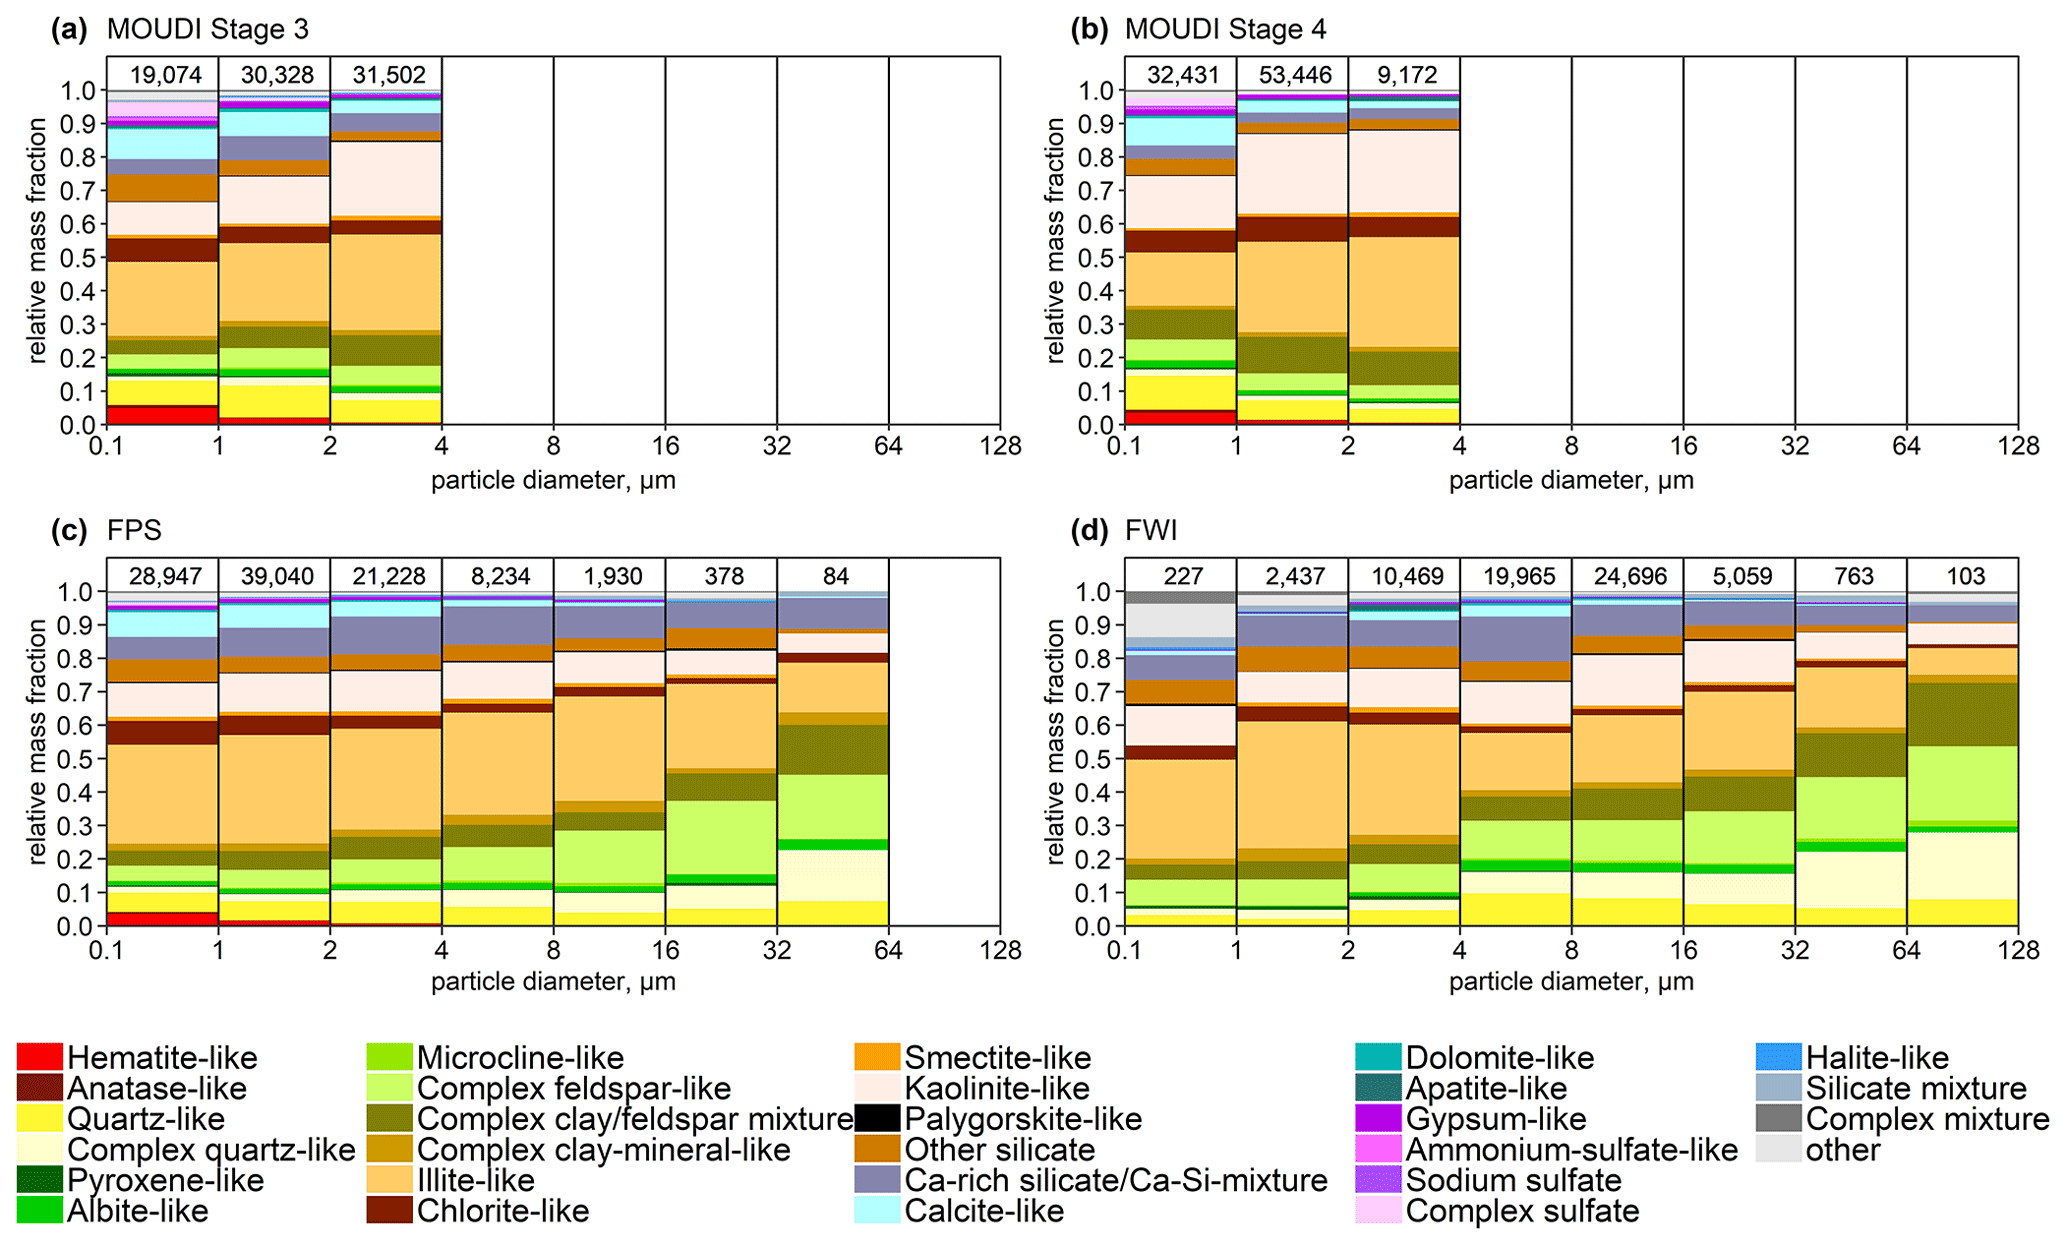
Figure 5Average size-resolved mass abundance of different particle groups using different sampling techniques collected over the campaign period. The numbers on top represent total particle counts in the given size bin. Abundance bars are not shown for size bins with fewer than 30 particles.
In the MOUDI sample, most of the collected particles (> 97 %) were dv < 5 µm. In stage 3, 56 % of the collected particles were within the specified stage size range; the size of half of the remaining particles was below the lower cutoff and that of the other half was above the upper cutoff. The major constituents were illite-like particles, kaolinite-like particles, quartz-like particles, Ca–silicate mixture, complex clay–feldspar mixture, and calcite-like particles with feldspar-like particles, quartz-like particles, hematite-like particles, and sulfates as minor constituents. A similar trend was also observed in stage 4 of MOUDI except for an enhanced abundance of kaolinite-like and complex clay particles. In the FPS samples, the number of collected particles in the size range 0.1 < dv < 5 µm is quite comparable to stage 3 of MOUDI. For particles with dv > 5 µm, the composition changes only slightly by increasing quartz-like particles and decreasing calcite-like particles. In the FWI samples, more than 70 % of particles were dv > 5 µm. The number abundance of feldspar-like particles, quartz-like particles, complex feldspar-like particles, and complex clay–feldspar mixture particles increases with increasing particle size, while the number abundance of clay-like particles tends to decrease. In contrast, calcite-like particles, gypsum-like particles, and sulfates are virtually absent in samples from FWI in dv < 3 µm, which is the size range where they are typically observed. However, the number of particles analyzed in the given size is significantly less compared to FPS or MOUDI. Note that it was not possible to perform sampling with FWI and MOUDI under the highest dust concentrations due to the high concentrations and consequentially extremely short sampling times that would have been necessary.
Differences in abundance for some of the classes among the different techniques might be due to the way that particles reach the substrate. In MOUDI and FWI, particles are impacted on the substrate, whereas in FPS particles are deposited by gravitational settling and turbulent diffusion. One hypothesis for such difference is that in the MOUDI the high impaction speed experienced by particle aggregates on the top stages may break some of them into smaller ones and get carried away along the air streams onto the lower stages. Such a hypothesis is consistent with the enhancement of clay-like aggregates in MOUDI. Other observed differences between the sampling techniques could be related to the non-parallel sampling times. MOUDI and FWI samples represent a few minutes compared to the usually half-day exposure time for FPS. However, as variations in the composition are fairly similar for all of our analyzed samples, the latter is most likely not a major aspect.
3.3.2 Temporal variability
Figure 6 displays time series of number abundances in three size ranges for the different particle groups observed in deposition samplers. While the dependence of particle size distribution on sample mineralogy is quite strong, the temporal variation in the major particle groups does not show significant variability. This behavior is to be expected as sampling was done in the source region, and the average daily composition is relatively constant.
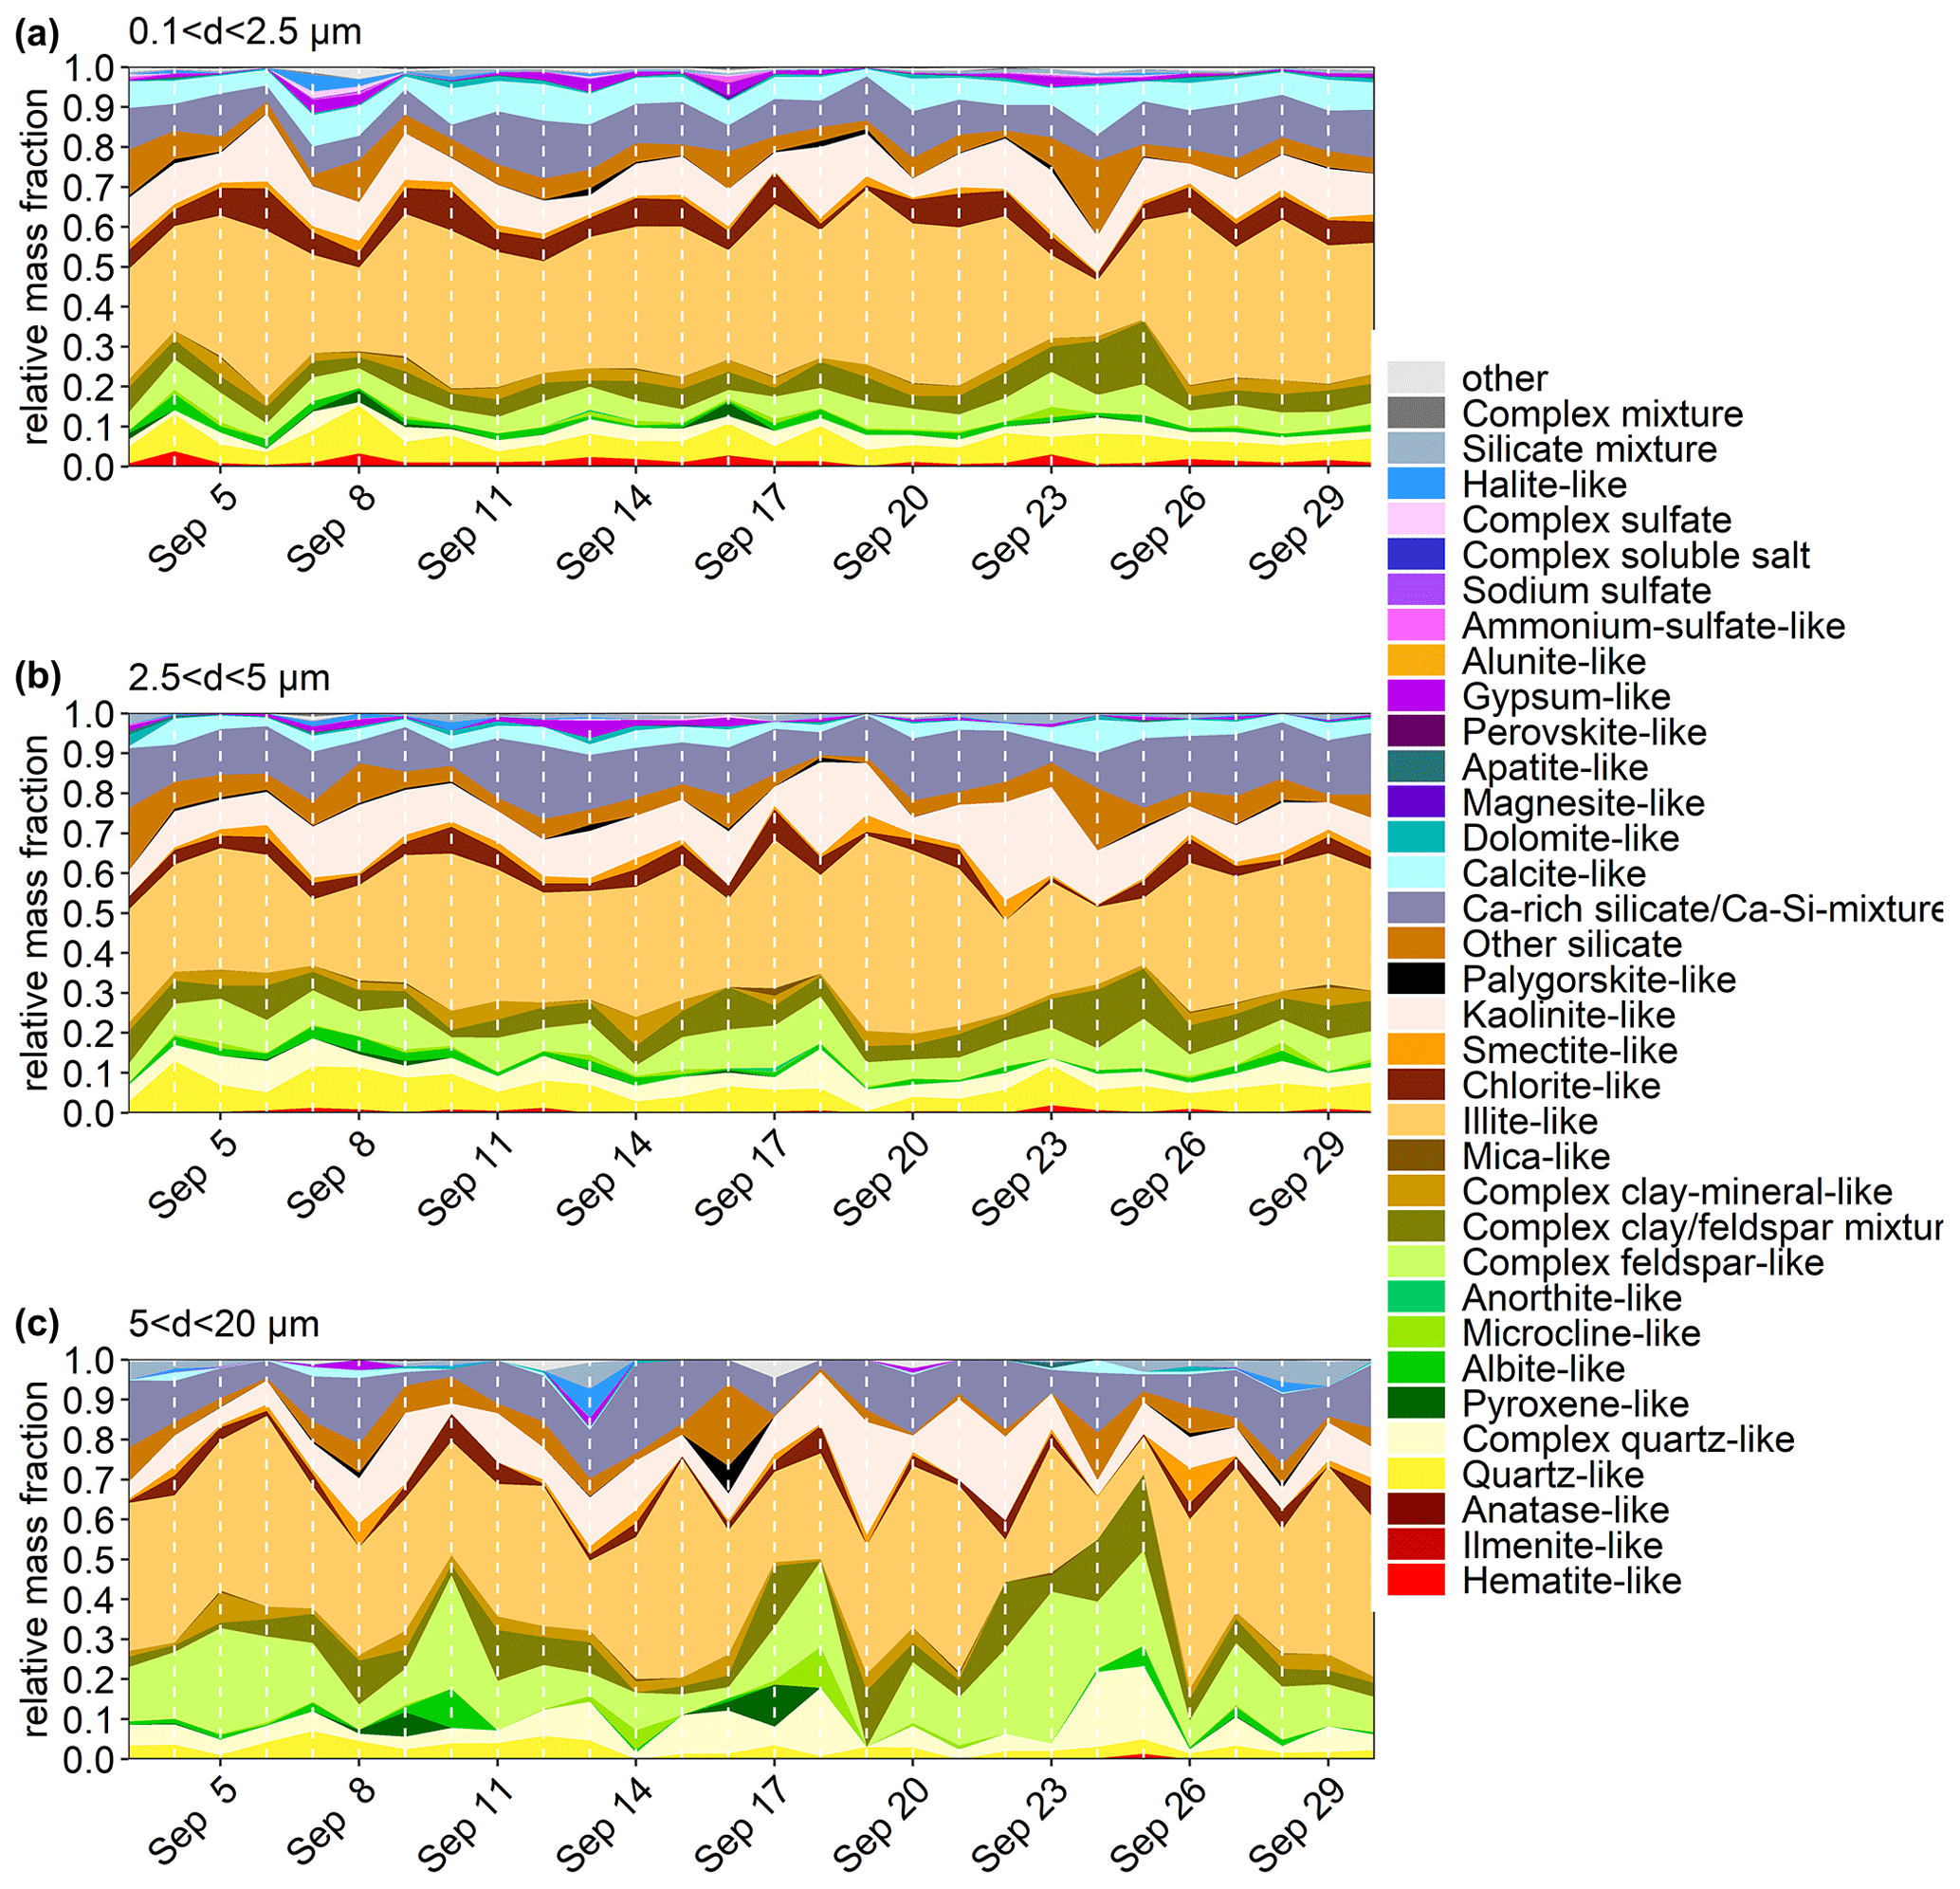
Figure 6Time series of chemical composition for particles of (a) 0.1 < d < 2.5 µm, (b) 2.5 < d < 5 µm, and (c) 5 < d < 20 µm at L'Bour.
Nevertheless, looking at specific samples we can observe distinct compositional differences. Figure 7 shows chemical composition for four different situations. Secondary sulfates were dominant in particles with dv < 2 µm in samples collected during 8–10 September when the wind came from the east (i.e., M'Hamid), suggesting an anthropogenic origin that is further corroborated with measurements of optical properties (Yus-Díez et al., 2023) and PSD (González-Flórez et al., 2022). This was also observed for small particles in the SAMUM campaign in Tinfou, Morocco (Kaaden et al., 2009). Apatite-like particles were almost non-existent in our samples except on some specific days (20 and 23 September). They were identified by the presence of Ca and P. Furthermore, manual inspection of the particles showed it to be not beam sensitive, with no Cl and F signals detected. Even though hydroxyapatite [Ca5OH(PO4)3] is not commonly found in the Morocco phosphate deposits, the absence of Cl and F suggests it to be hydroxyapatite originating from a distinct geogenic source. Most of these particles were confined to the size dv 2–4 µm. In these particles, phosphorus is attached to the crystal lattice, which is one of the important dust-derived nutrients for marine and terrestrial ecosystems controlling phytoplankton productivity and carbon uptake (Stockdale et al., 2016). The sampling day of 24 September is characterized by elevated Ca-rich particles, making it the most calcium-rich day and were present mainly in dv < 1 µm. Here it was present in 30 % of samples compared to the average of 5 %. This observation could be due to advection from a prominent dust source. Furthermore, the iron-rich particle is also quite pronounced on this day, indicating a special source imprint.
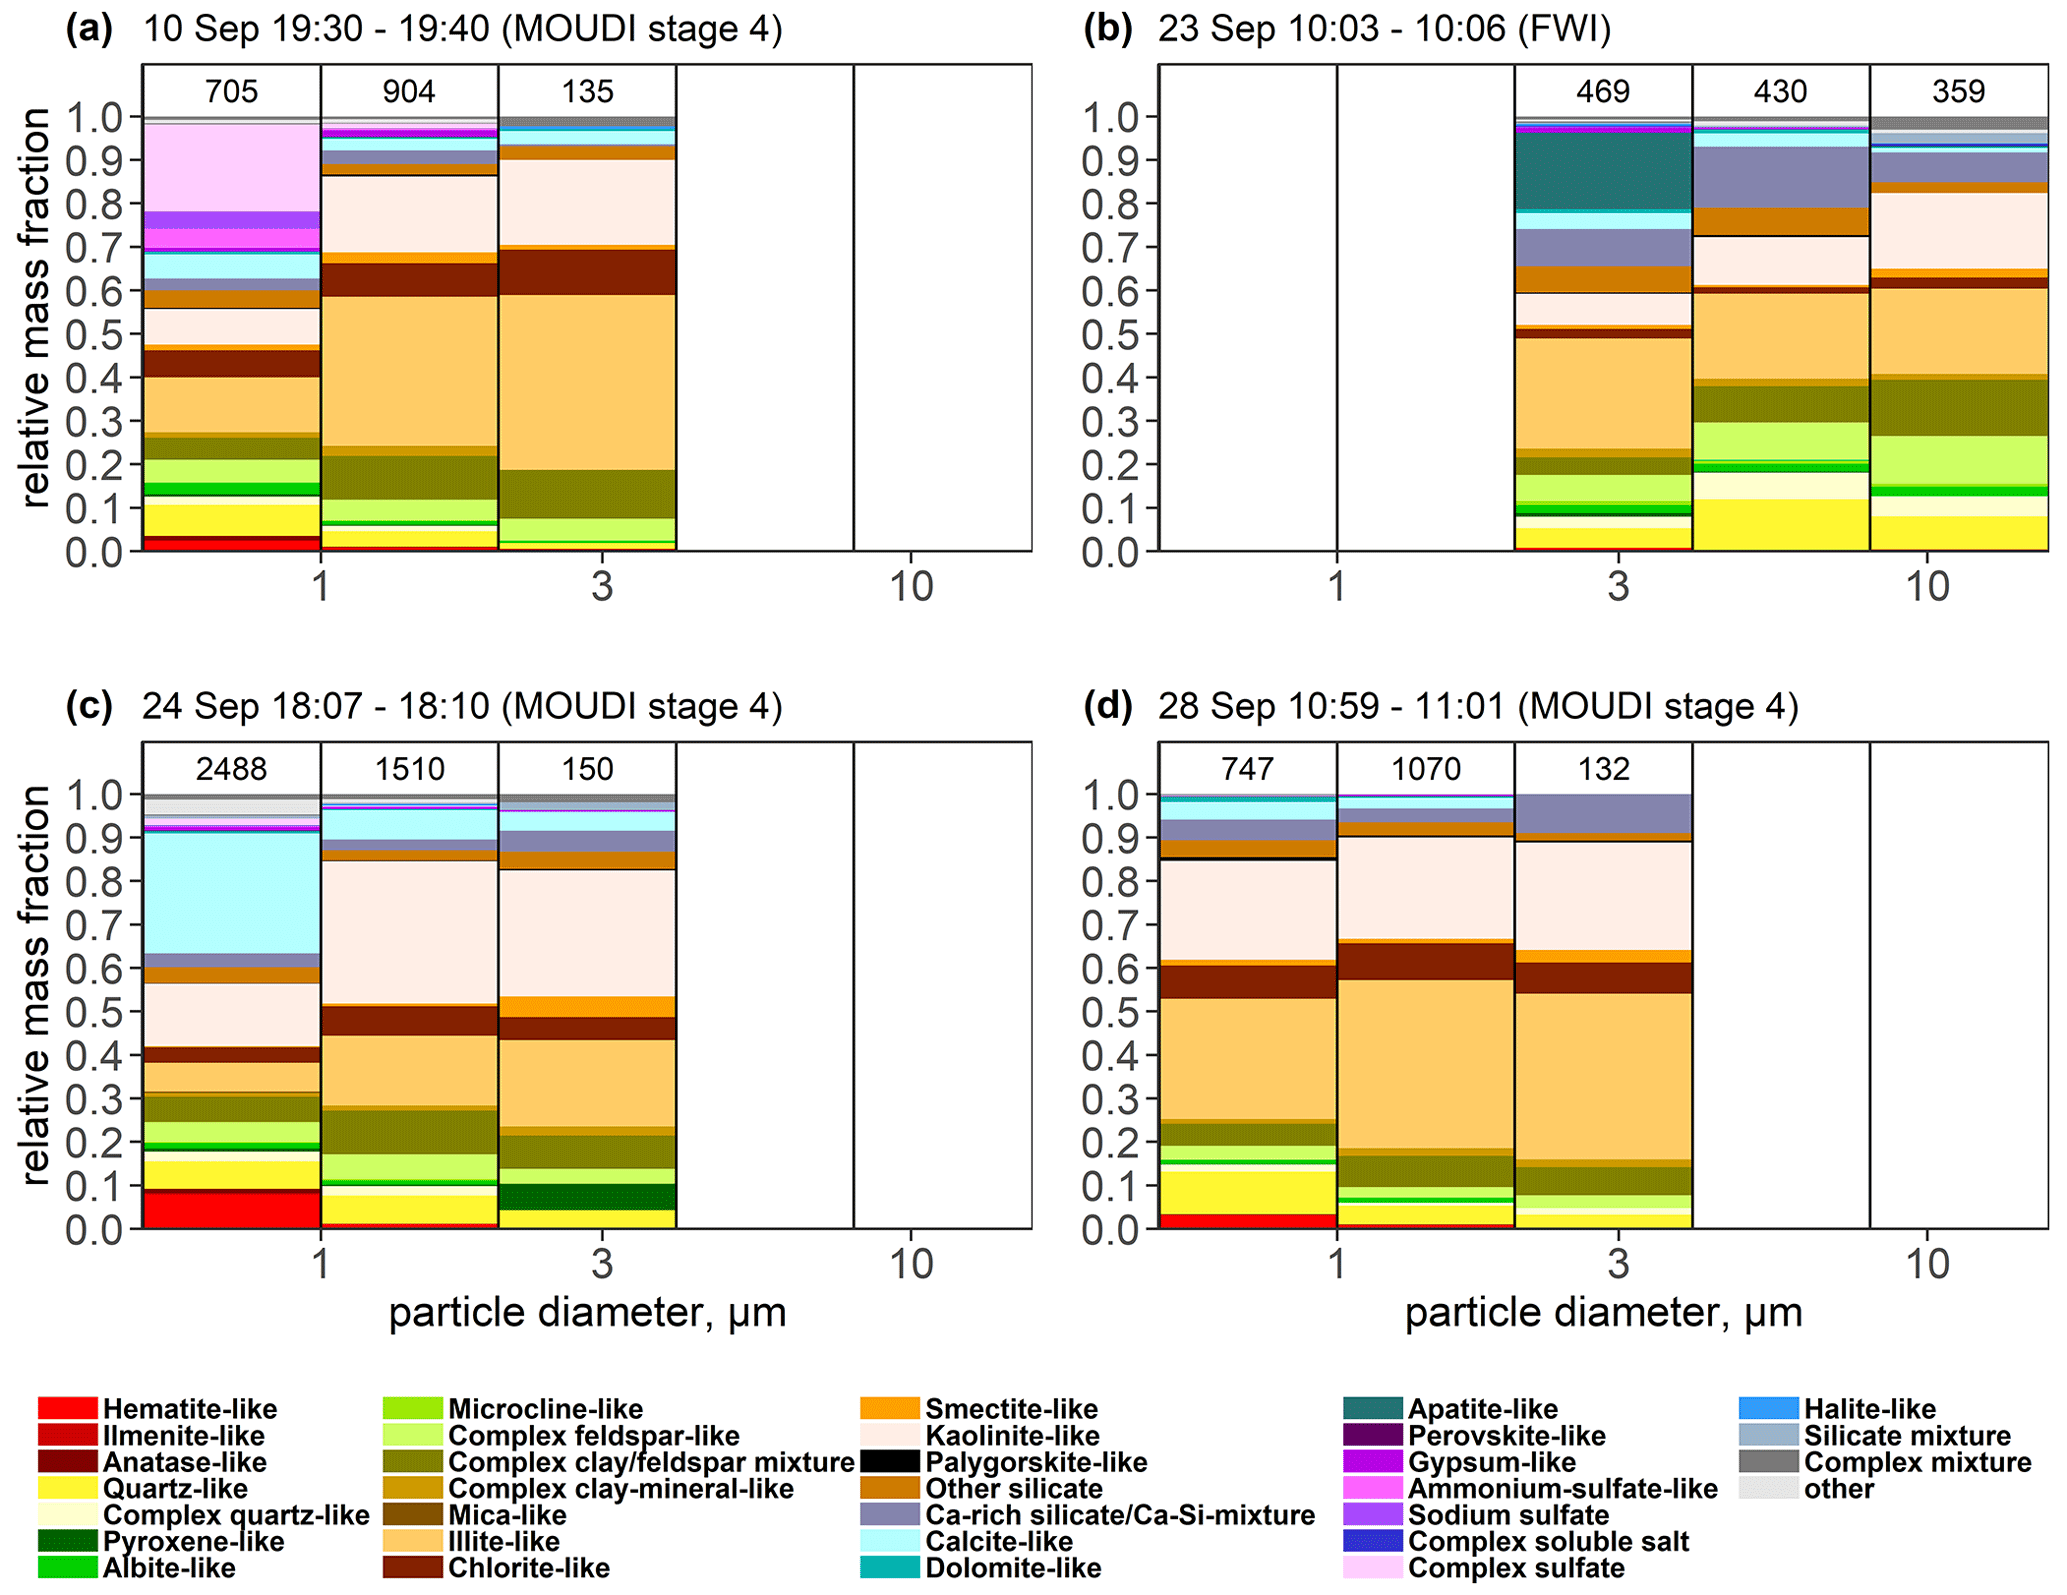
Figure 7Phase compositions of size bins for samples collected under specific meteorological conditions at specific times and on certain days: (a) sulfate episode, (b) apatite particles, (c) Ca-rich episode, and (d) typical average composition. The total number of analyzed particles is given for each size class, but those with fewer than 30 particles are not shown.
3.3.3 Iron distribution
Clay minerals and Fe oxide-hydroxides such as hematite, goethite, and magnetite, contain Fe, which is a key ingredient to numerous climatic, environmental, and biological processes affected by dust (Schulz et al., 2012). Fe in minerals can be broadly classified into structural Fe, which is typically found in the crystal lattice of clay minerals, and Fe in the form of oxide or hydroxide particles (mainly hematite and goethite) (Kandler et al., 2009; Scheuvens et al., 2011). The amount of free Fe oxide-hydroxides, along with their size and aggregation or mixing state (internal vs. external mixing) with other minerals, determines the degree of absorption of solar radiation by dust (Sokolik and Toon, 1999; Moosmüller et al., 2012; Zhang et al., 2015; Di Biagio et al., 2019) and the potential Fe solubility (Baker and Jickells, 2006; Marcotte et al., 2020) of the deposited dust that fertilizes the ocean. In addition, it has been suggested that ocean primary productivity depends not only on the dissolved Fe but also on suspended solid Fe particles and their mineralogical components (Hettiarachchi et al., 2021). Furthermore, dust absorptive properties vary in different source regions mainly due to variations in the Fe oxide fractions (Lafon et al., 2006). While SEM cannot distinguish between structural and free Fe, by providing the total Fe content on a particle-by-particle basis, it can provide some useful clues on the mixing state of Fe oxide-hydroxides.
To understand the Fe content and to some extent the mixing state, along with the type of particles that Fe is associated with, Fig. 8a shows the relative abundance of particles classified into nine categories according to their Fe content as a function of particle size, and Fig. 8b further displays the relative abundances of particles for each of the nine Fe categories and particle size ranges according to three Al Si ratio categories. The Al Si ratio is chosen because it has little measurement uncertainty and varies significantly for different mineral groups, as discussed in Sect. S2.9. High Al Si ratios indicate dominance of structural Fe-containing clay minerals, like illite, smectite, and chlorite, which also tend to be internally mixed with Fe oxide-hydroxides (Kandler et al., 2011). Low Al Si ratios tend to be associated with quartz-like particles.
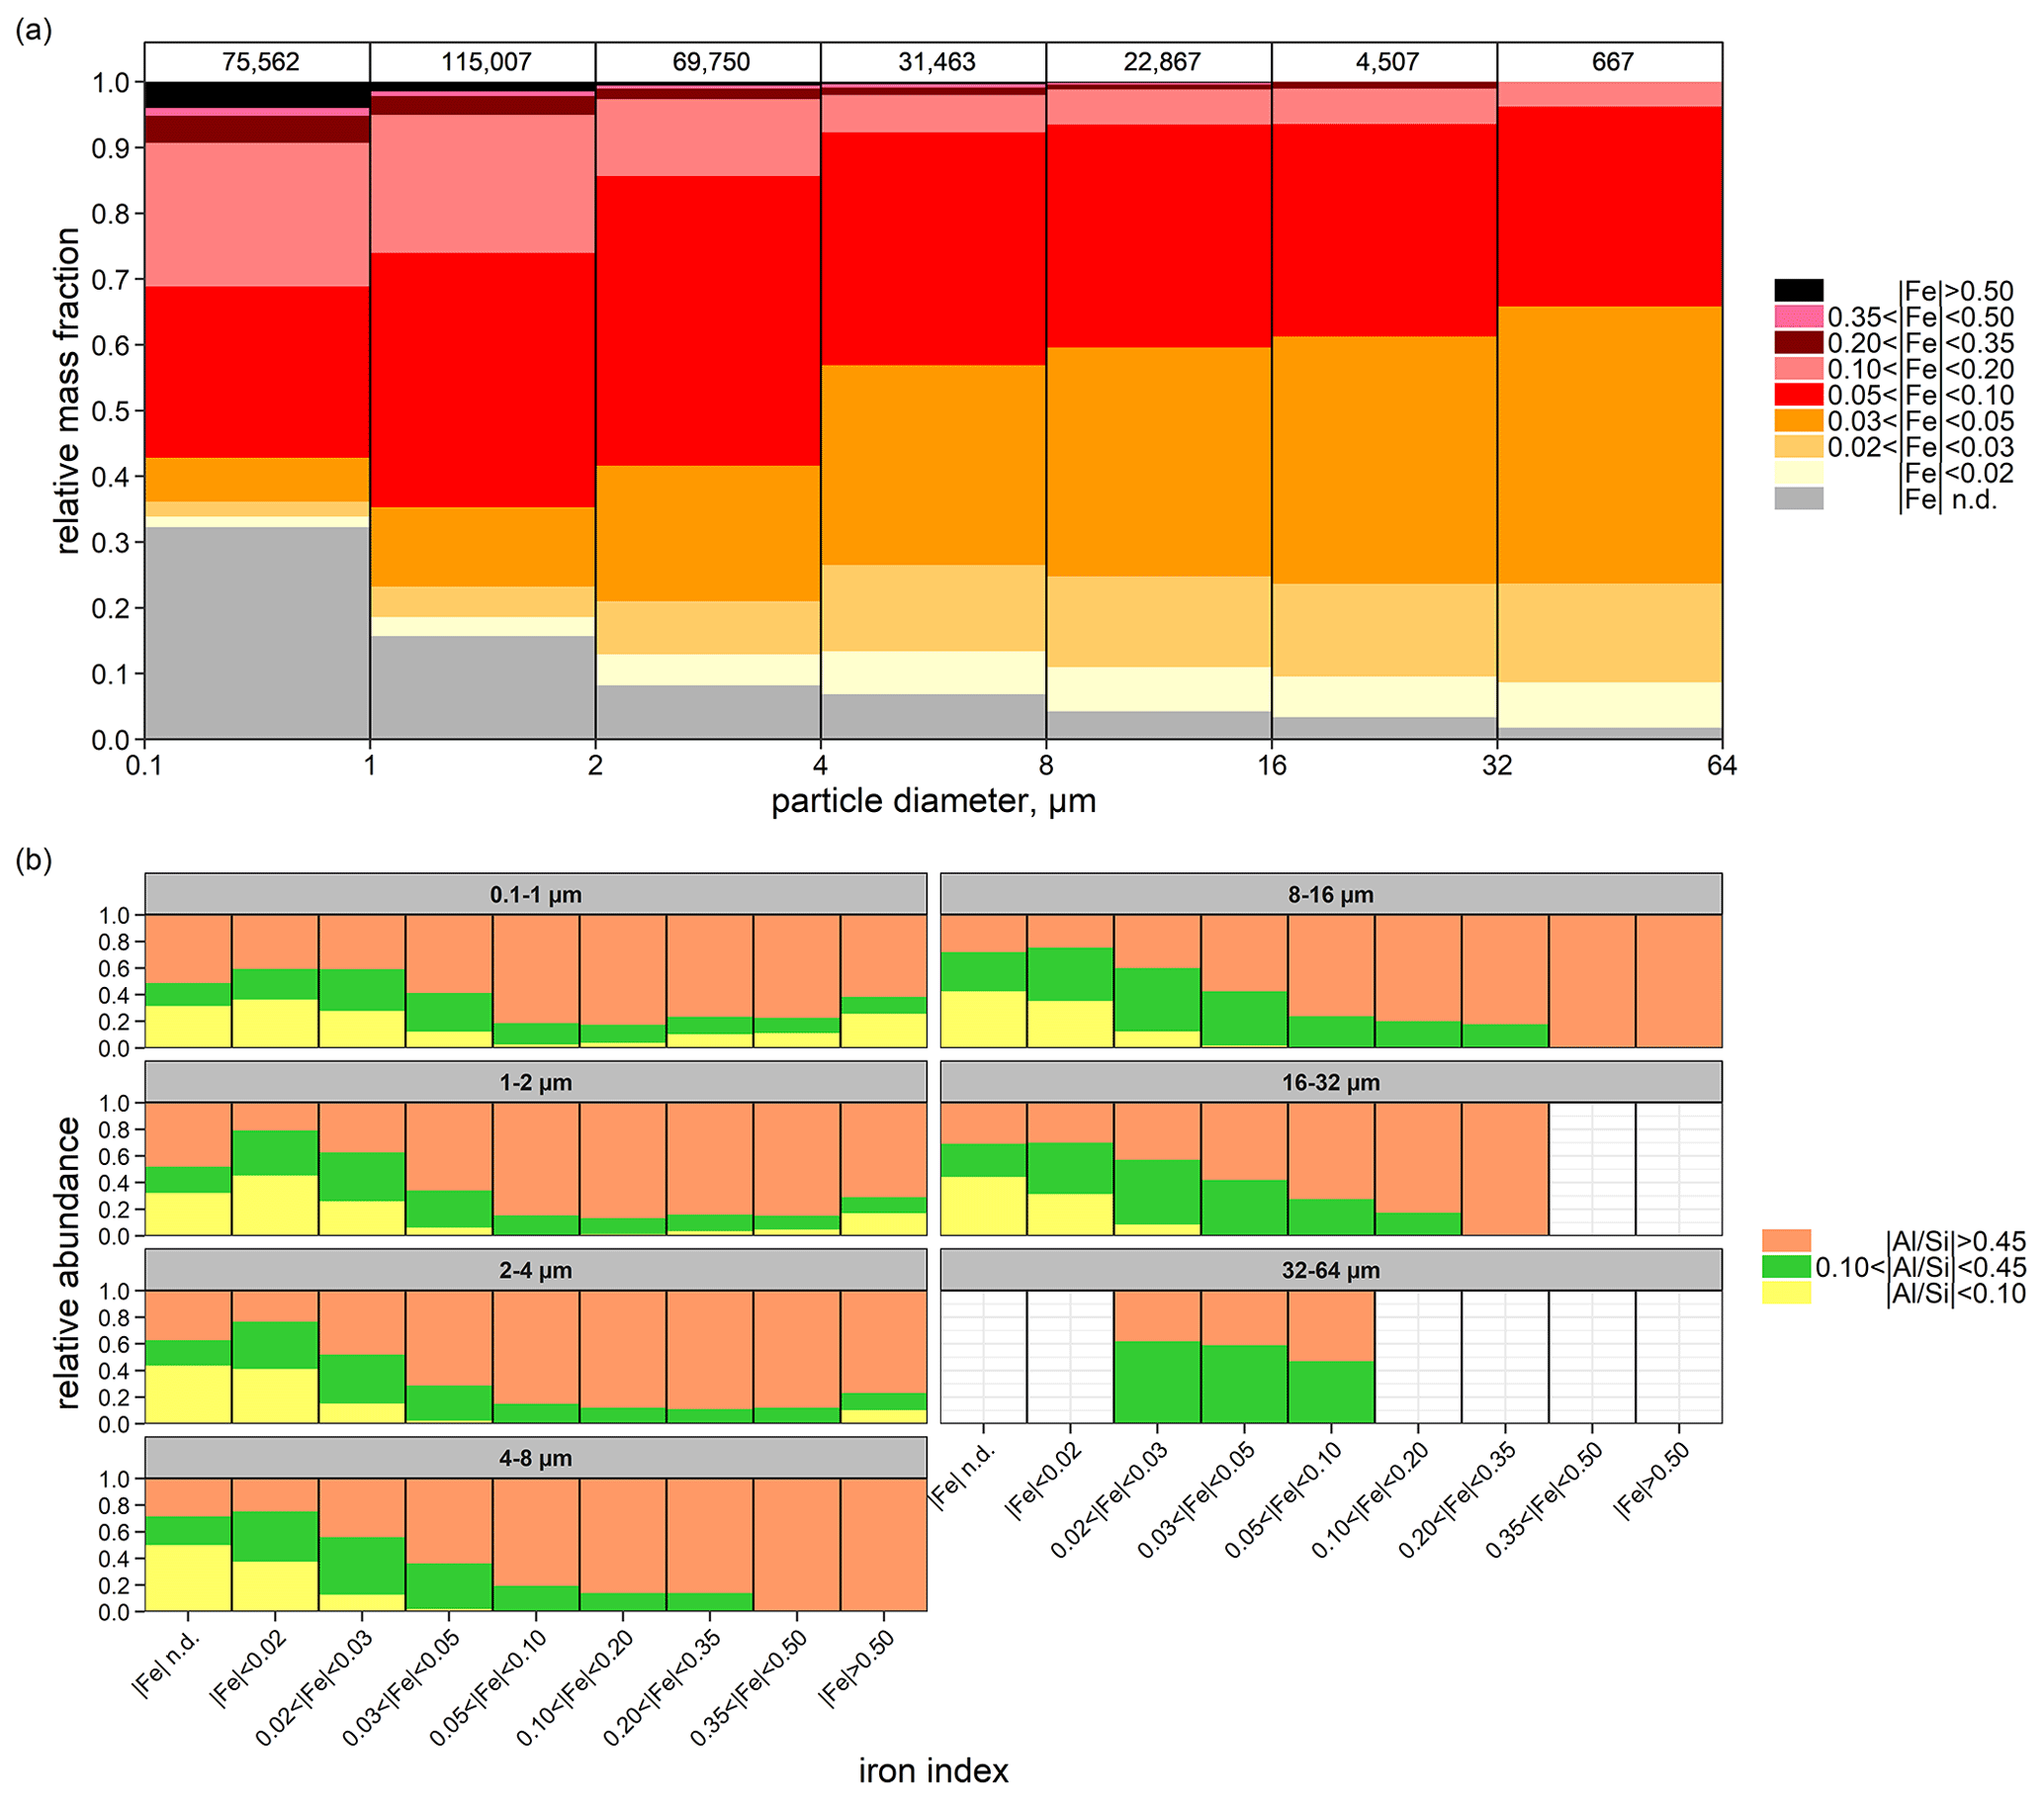
Figure 8(a) Size-resolved iron indices for silicate particles (“n.d.” means Fe not detected). The numbers on top represent total particle counts in the given size bin. (b) Silicate particle with iron association based on Al Si ratio. Abundance bars are not shown for size intervals with fewer than 30 particles because of their high statistical uncertainty.
The relative mass of particles with Fe fractions above 0.1 decreases with increasing particle size. Among these, particles with Fe fractions above 0.5 are hematite-like particles as shown in Fig. 8a; their relative abundance is ∼ 4 % below 1 µm, which decreases steeply with size to the extent that no appreciable amounts are observed above 4 µm. Given the amount of Fe, these hematite-like particles are mostly composed of Fe oxide-hydroxides and to the first order could be taken as externally mixed Fe oxide-hydroxide particles. However, they still show some degree of aggregation with other minerals that increase with particle size. This can be appreciated in Fig. 2, where hematite-like particles show increasing amounts of Si, Al, and Mg with size. Figure 8b shows that aggregation of Fe oxide-hydroxides (Fe > 0.5) in hematite-like particles happens mainly with clays (high Al Si ratios), but particles with low Al Si ratios were also observed for diameters < 4 µm. These are most likely for a fraction of particles (e.g., complex quartz-like particles) with some free Fe oxide-hydroxide (e.g., goethite and hematite) assemblages.
Particles with Fe fractions between 0.2 and 0.5 follow a similar decrease in relative abundance with particle size, although there are still appreciable amounts of particles up to 8 µm. Such particles are mostly classified as chlorite-like particles; in Fig. 2 chlorite particles feature Fe fractions above 0.2, and in Fig. 4 the abundance of chlorite-like particles decreases with particle size. However, the presence of Fe oxide-hydroxide internal mixtures is very likely, particularly in particles with Fe contents towards the higher end of the 0.2–0.5 range. The relative number of particles with Fe fractions between 0.1 and 0.2 also decreases with particle size; such particles have mainly a high Al Si ratio (clay minerals, such as illite, smectite, and chlorite) (Fig. 8b). Interestingly, the relative mass abundance of particles with no Fe detected reaches ∼ 0.32 below 1 m and thereafter also decreases with particle size. All in all, these results show that Fe oxide-hydroxides tend to be increasingly internally mixed with other minerals, especially clays, as particle size increases. In other words, the volume fraction of Fe oxide-hydroxides in aggregates decreases with particle size.
Conversely, with increasing particle size, the relative number of particles with Fe fractions between 0.03–0.05 increase and that of particles with intermediate Fe content (0.05–0.10) tend to increase for particle sizes between 0.1 and 4 µm (26 % to 44 %) while remaining approximately invariant (∼ 30 %) above 4 µm. Such increasing trends with particle size are also visible for particles with Fe contents below 0.03. The increase in particles with lower Fe content with particle size is mostly due to the increasing amount of complex clay–feldspar mixtures and complex feldspar-like and quartz-like aggregates (Fig. 4) with lower Al Si ratios (Fig. 8b).
The mean Fe abundance is 0.09 and is dependent on size with values of 0.095 in the size range 0.1 < d < 2.5 µm and 0.06 for particles 2.5 < d < 64 µm. This is consistent with observations in Tinfou, Morocco (mean 0.053), for particles between 1 and 20 µm (Kandler et al., 2009).
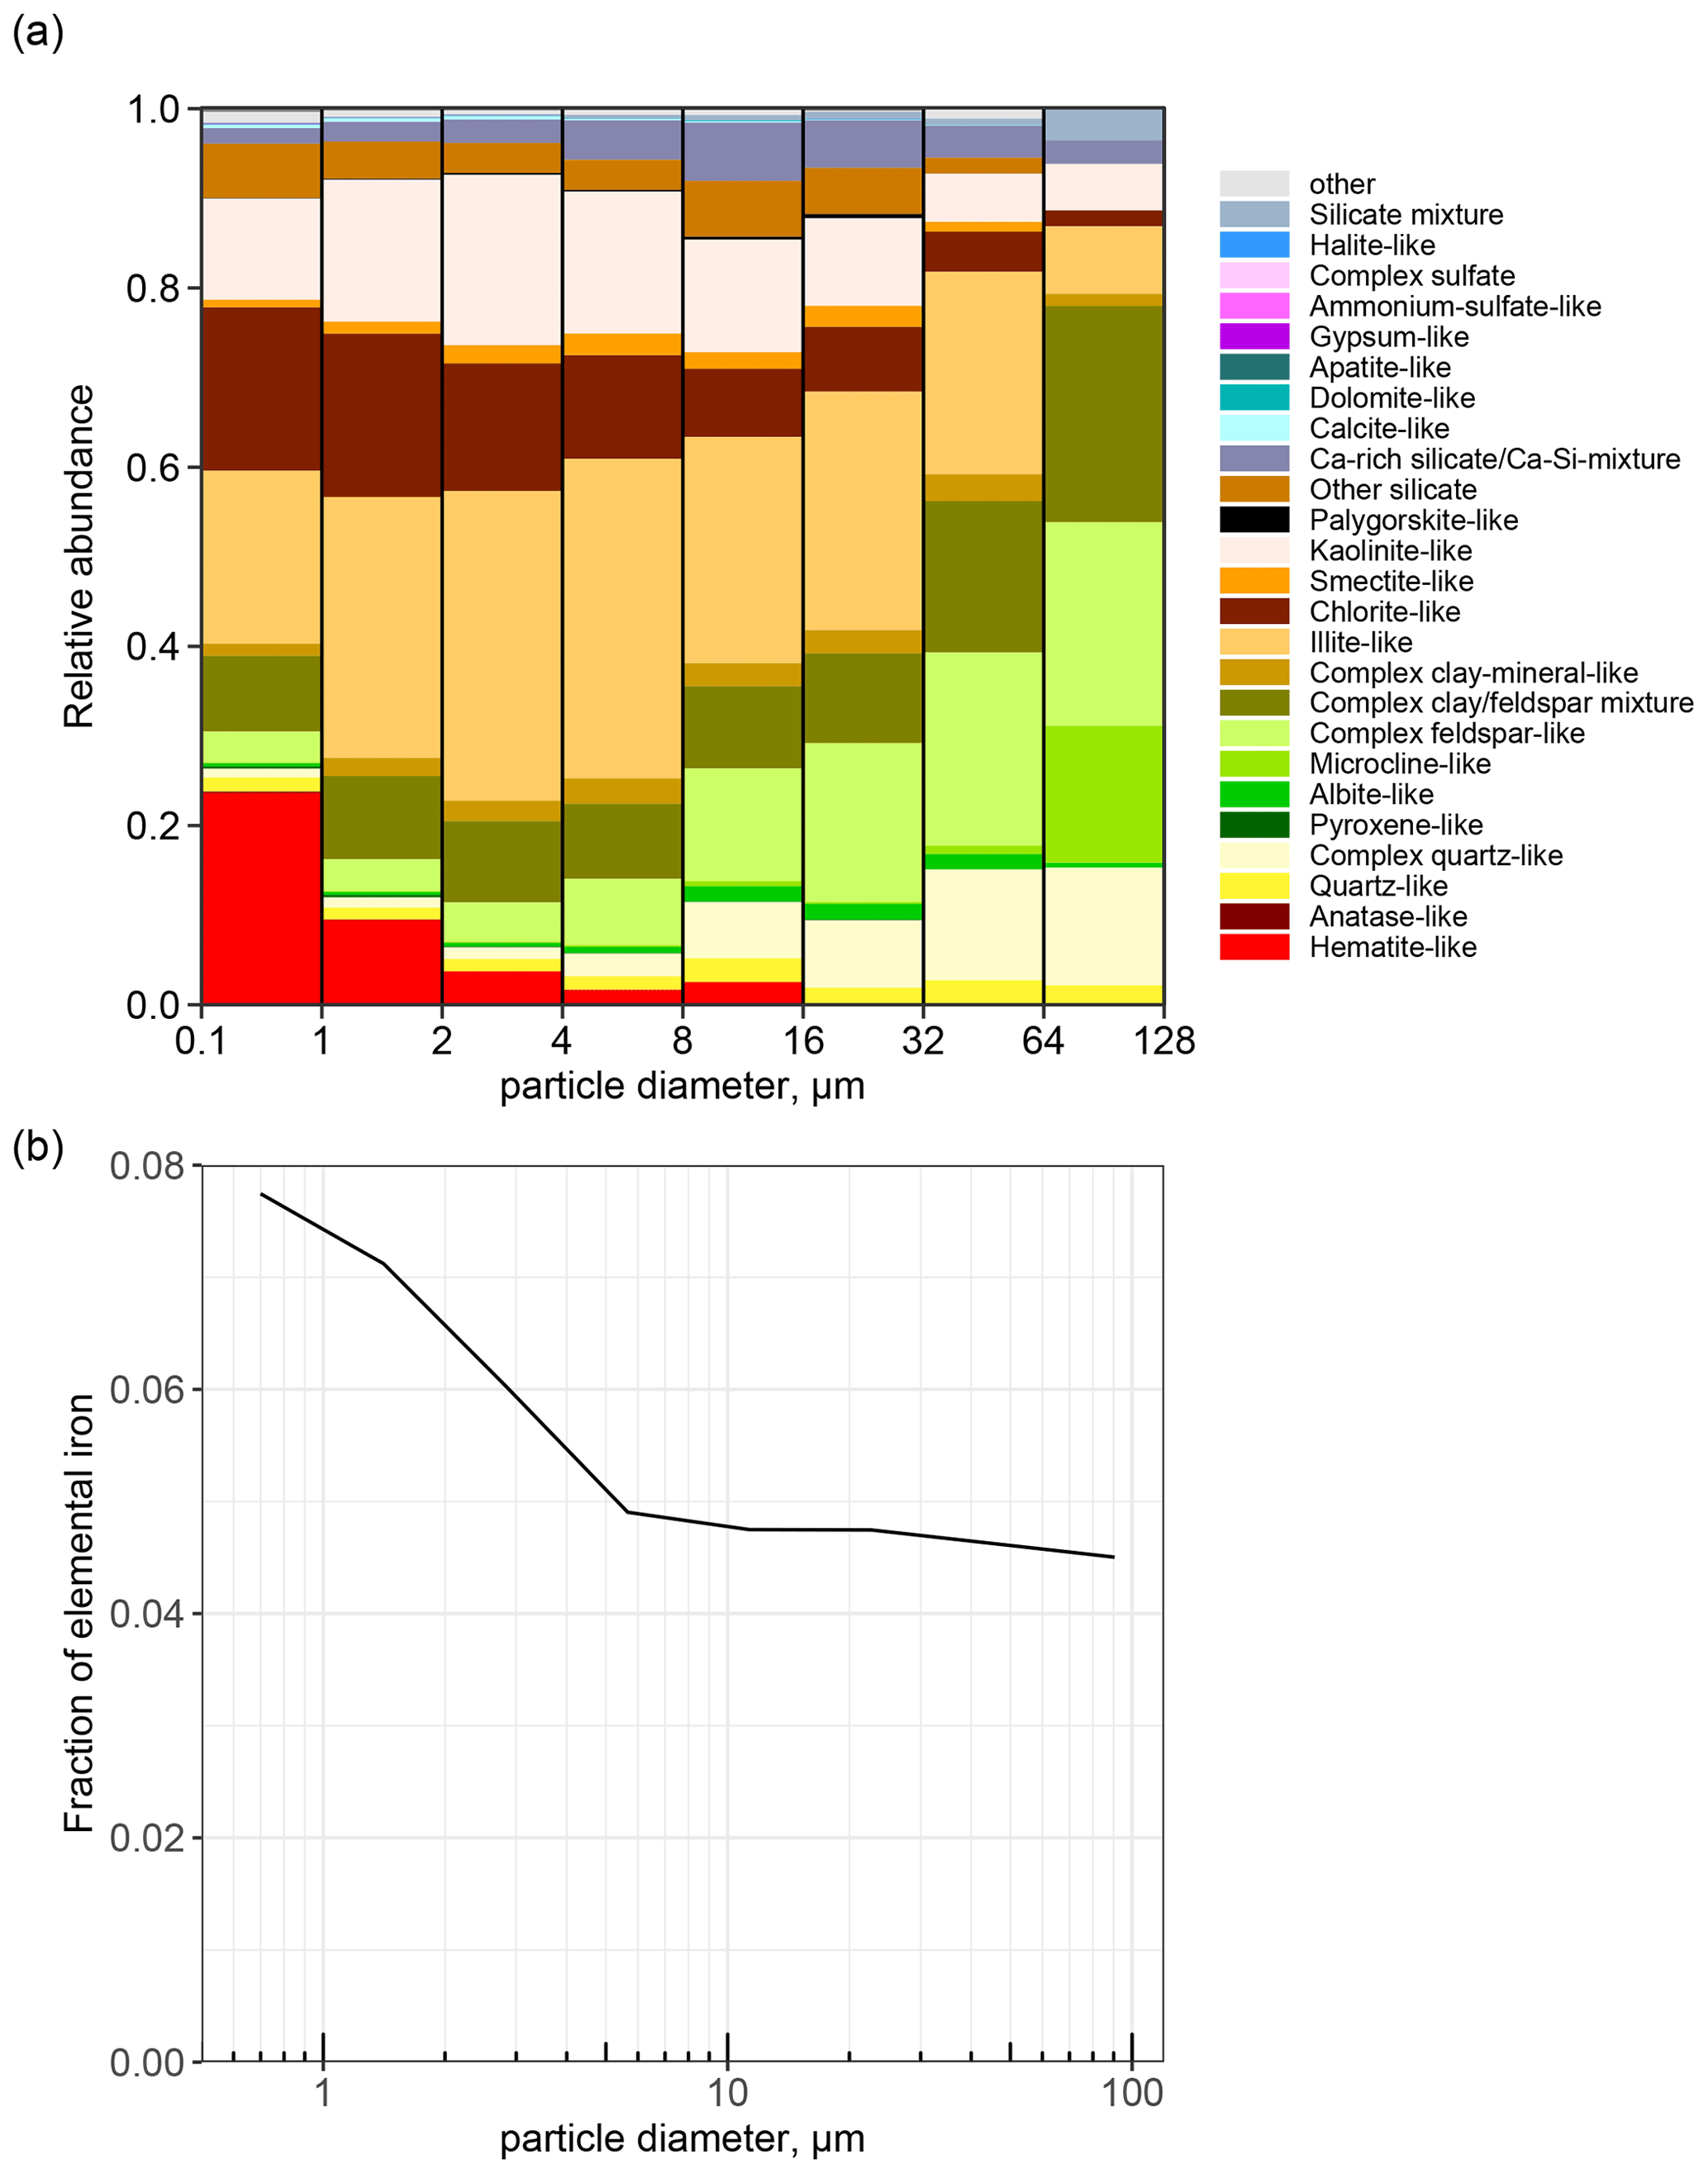
Figure 9(a) Relative contribution of each particle type to total iron and (b) fraction of elemental iron by mass with respect to all the other elements.
Figure 9a shows the relative contribution of each particle type to Fe in every particle class. In comparison to the particle type fractions displayed in Fig. 4, the hematite-like and chlorite-like particles have an increased proportion because of their higher contribution in terms of Fe content, and the calcite-like and Ca-rich silicate group gets substantially diminished due to the absence of Fe in carbonate minerals. It is remarkable to see that the iron contribution of clay-like aggregates (illite, smectite, and kaolinite) increases with particle size up to ∼ 4–8 µm, which suggests (and further confirms) increased internal mixing with Fe oxide-hydroxides. Figure 9b shows the mass fraction of elemental Fe as a function of particle size and is calculated by dividing the average estimated mass of Fe in a particle by the average estimated mass of particle. The total Fe in dust is greatly reduced with size, particularly up to ∼ 5 µm, going from ∼ 8 % below 1 µm to less than 5 % in particles above 6 µm. This is slightly higher than the values of fractional mass of elemental iron obtained for Moroccan soil using X-ray fluorescence (XRF) analysis, which was reported to be 3.6 % for PM10.6 (Caponi et al., 2017; Di Biagio et al., 2019).
Overall, our results suggest that fine dust particles are more enriched with Fe due to both the presence of small-sized Fe oxide-hydroxides (hematite-like) and the increase in feldspar and quartz with particle size, which reduces the fractional abundance of clay-like particles internally mixed with Fe oxide-hydroxides. Scheuvens et al. (2011) also observed Fe-rich particles to be relatively scarce (< 1.5 % in particle number fraction). In contrast, a lower proportion of Fe-rich particles was observed from more southerly source areas (Chou et al., 2008). Usually Fe-rich particles are associated with alumosilicates (Scheuvens et al., 2011; Deboudt et al., 2012; Reynolds et al., 2014; Moskowitz et al., 2016) and are often located at the particle surface and has implications for particle refractive index. All of these observations are complementary to the laboratory results obtained by Baddock et al. (2013) that showed abrasion from saltating particles can release Fe-rich nanoparticles from larger aggregates. As fine dust particles are more prone to long-range transport, this might provide an increased amount of soluble Fe. However, due to the association of Fe in different particle groups, it is difficult to estimate the fraction of soluble Fe available after deposition in ocean biogeochemistry, and thereby the global carbon cycle or terrestrial ecosystem as a nutrient, with the method used in this work. Nevertheless, as observed by Marcotte et al. (2020), the Fe solubility (percentage dissolved Fe and total Fe in the mineral) in pure Fe-bearing clay materials was higher by an order of magnitude than in pure Fe oxide minerals, and thus the dust transported from this region could be a major source of nutrients.
3.3.4 Feldspar
Feldspar, and in particular K-rich feldspar, is discussed as being the most efficient source of ice nuclei among the different mineral constituents found in dust (Atkinson et al., 2013; Harrison et al., 2016; DeMott et al., 2018), and it is therefore of interest for atmospheric processes.
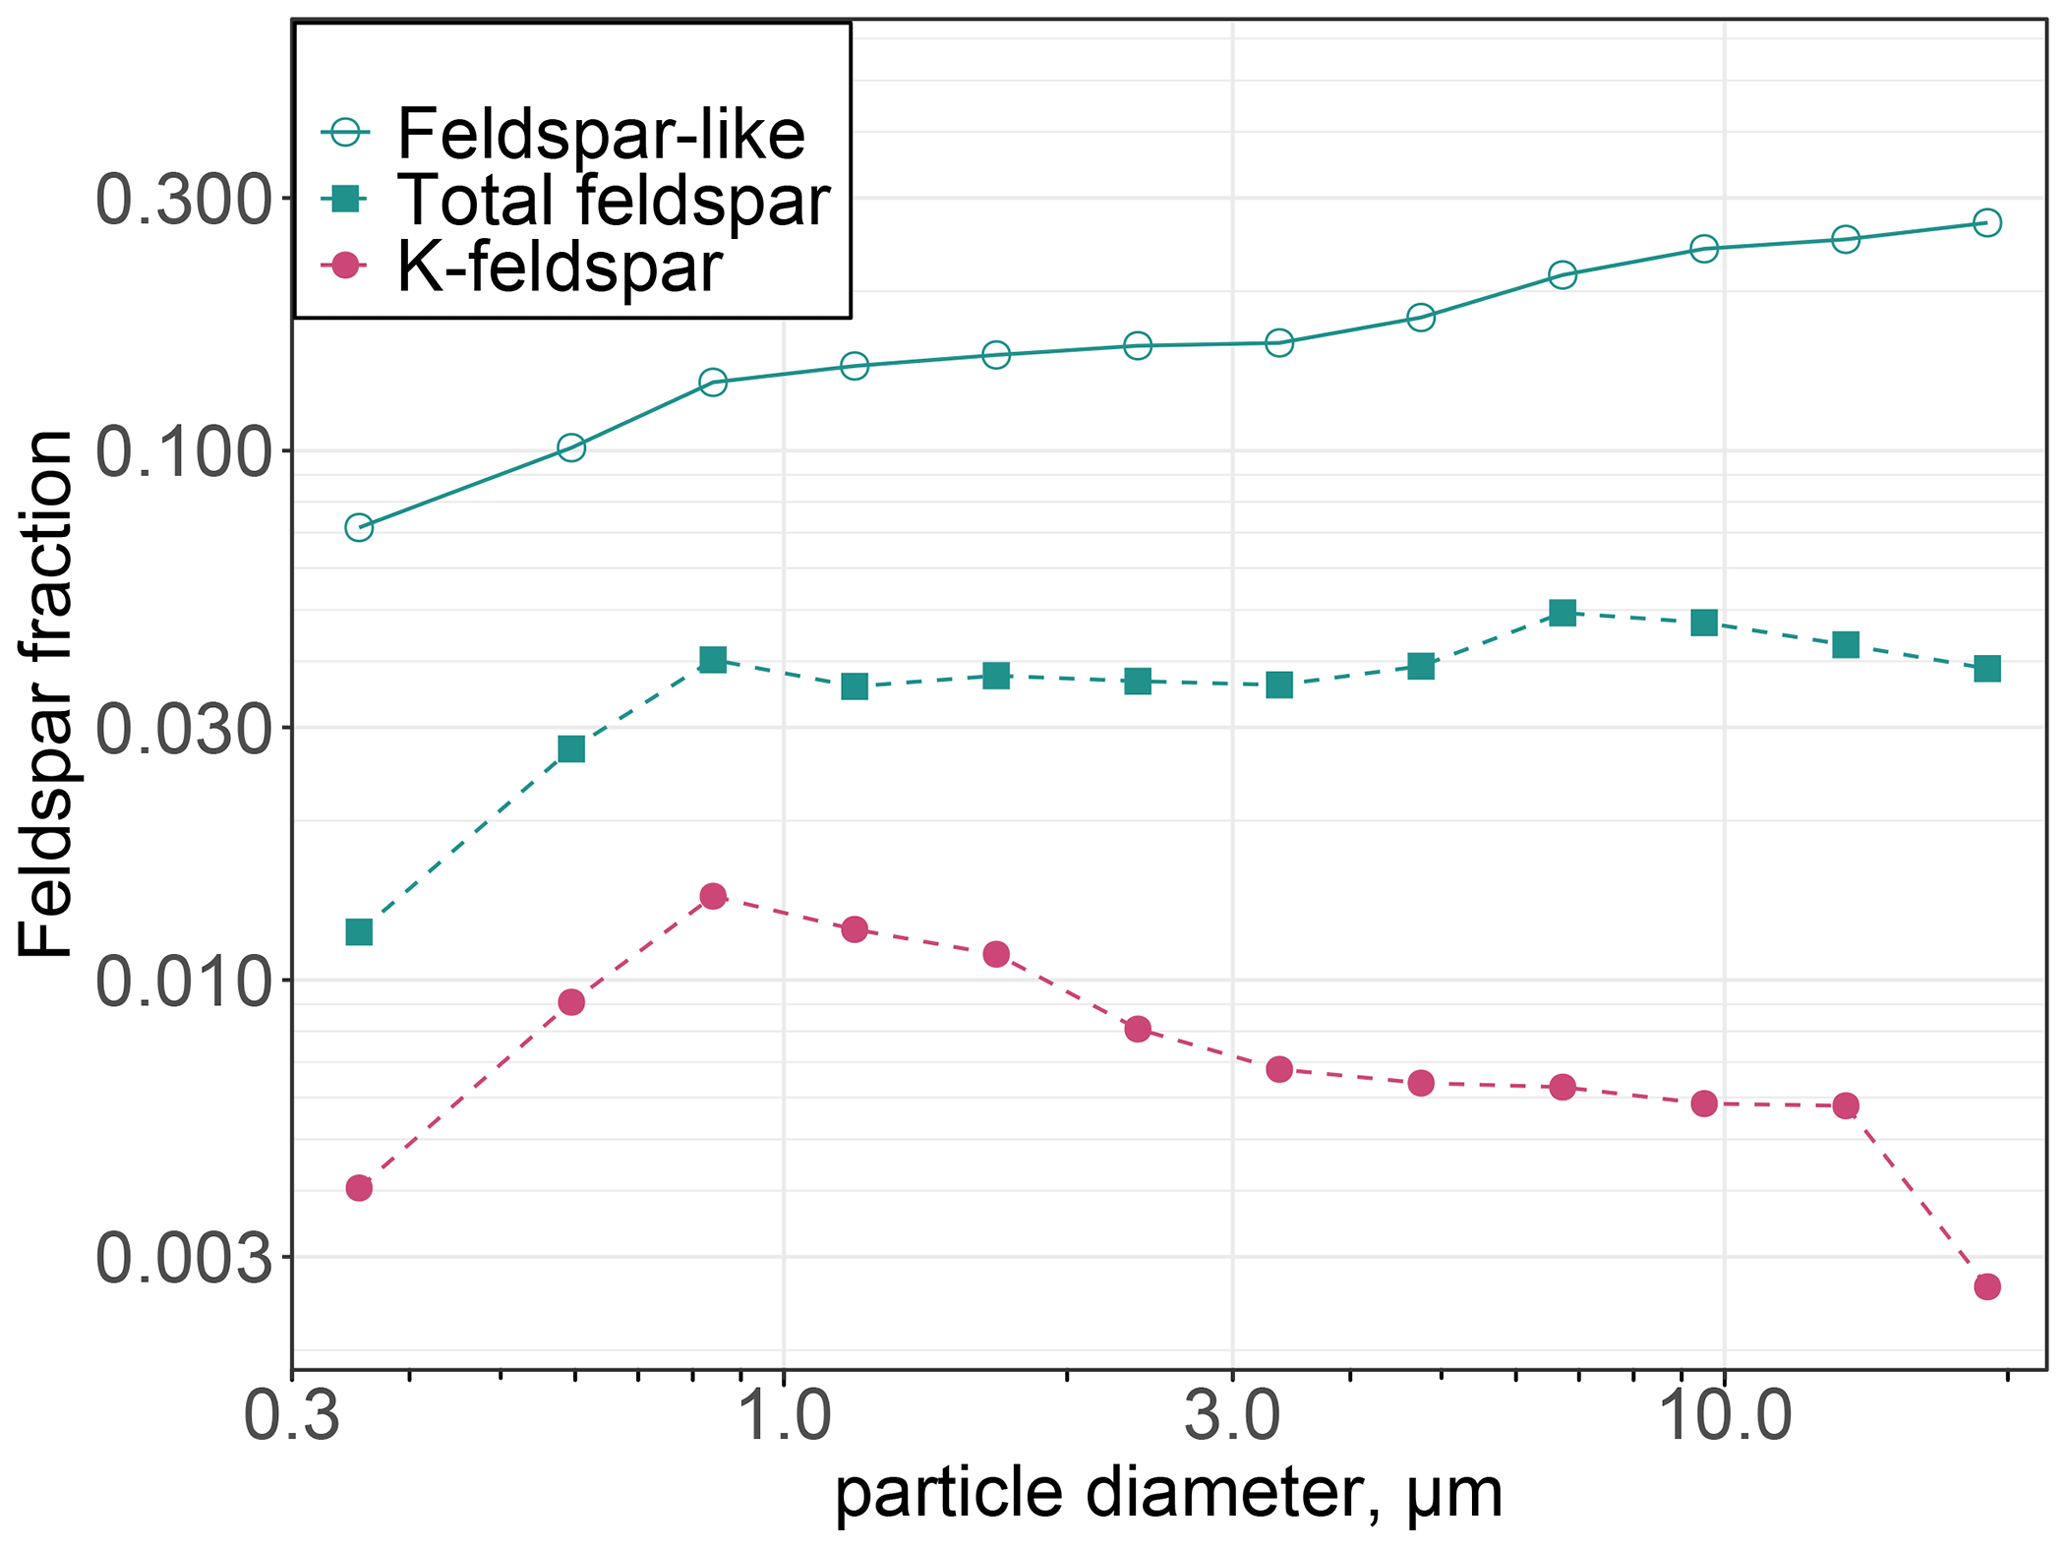
Figure 10Mass ratio of feldspar-like particles, total feldspar (more strict criterion), and K-feldspar (more strict criterion) to total particles.
Figure 10 shows the feldspar relative mass ratio for K-feldspar and total feldspar to total particles as determined by the feldspar index approach (see Sect. S2.3 for the distinction between the two different approaches for feldspar characterization). Here the total feldspar includes K-feldspar, Na-feldspar, and other feldspar. For comparison, the “relaxed classification”, in contrast to the strict classification scheme of feldspar-like particles, is also shown, which includes albite-like, microcline-like particles, anorthite-like particles, complex feldspar-like particles, and complex clay–feldspar mixture. In general, our analysis shows that approximately 3 % of the dust aerosols are relatively pure, externally mixed feldspar particles, whereas relatively pure, externally mixed K-feldspar particles are less than 0.5 % by mass. With the inclusion of internally mixed feldspar, an increasing trend is observed with particle size. Studies have found the K-feldspar content of dust to be highly variable with values up to 25 % for Moroccan dust (Atkinson et al., 2013). Since the PSD of K-feldspar at the source determines how much of it is transported across long distances, our finding shows that the relative amount of externally mixed K-feldspar particle is size independent up to 10 µm. For long-range-transported dust over Barbados, no significant variation was reported for K-feldspar under different dust conditions, but it is slightly lower than the values reported here using the same technique (Kandler et al., 2018; Harrison et al., 2022).
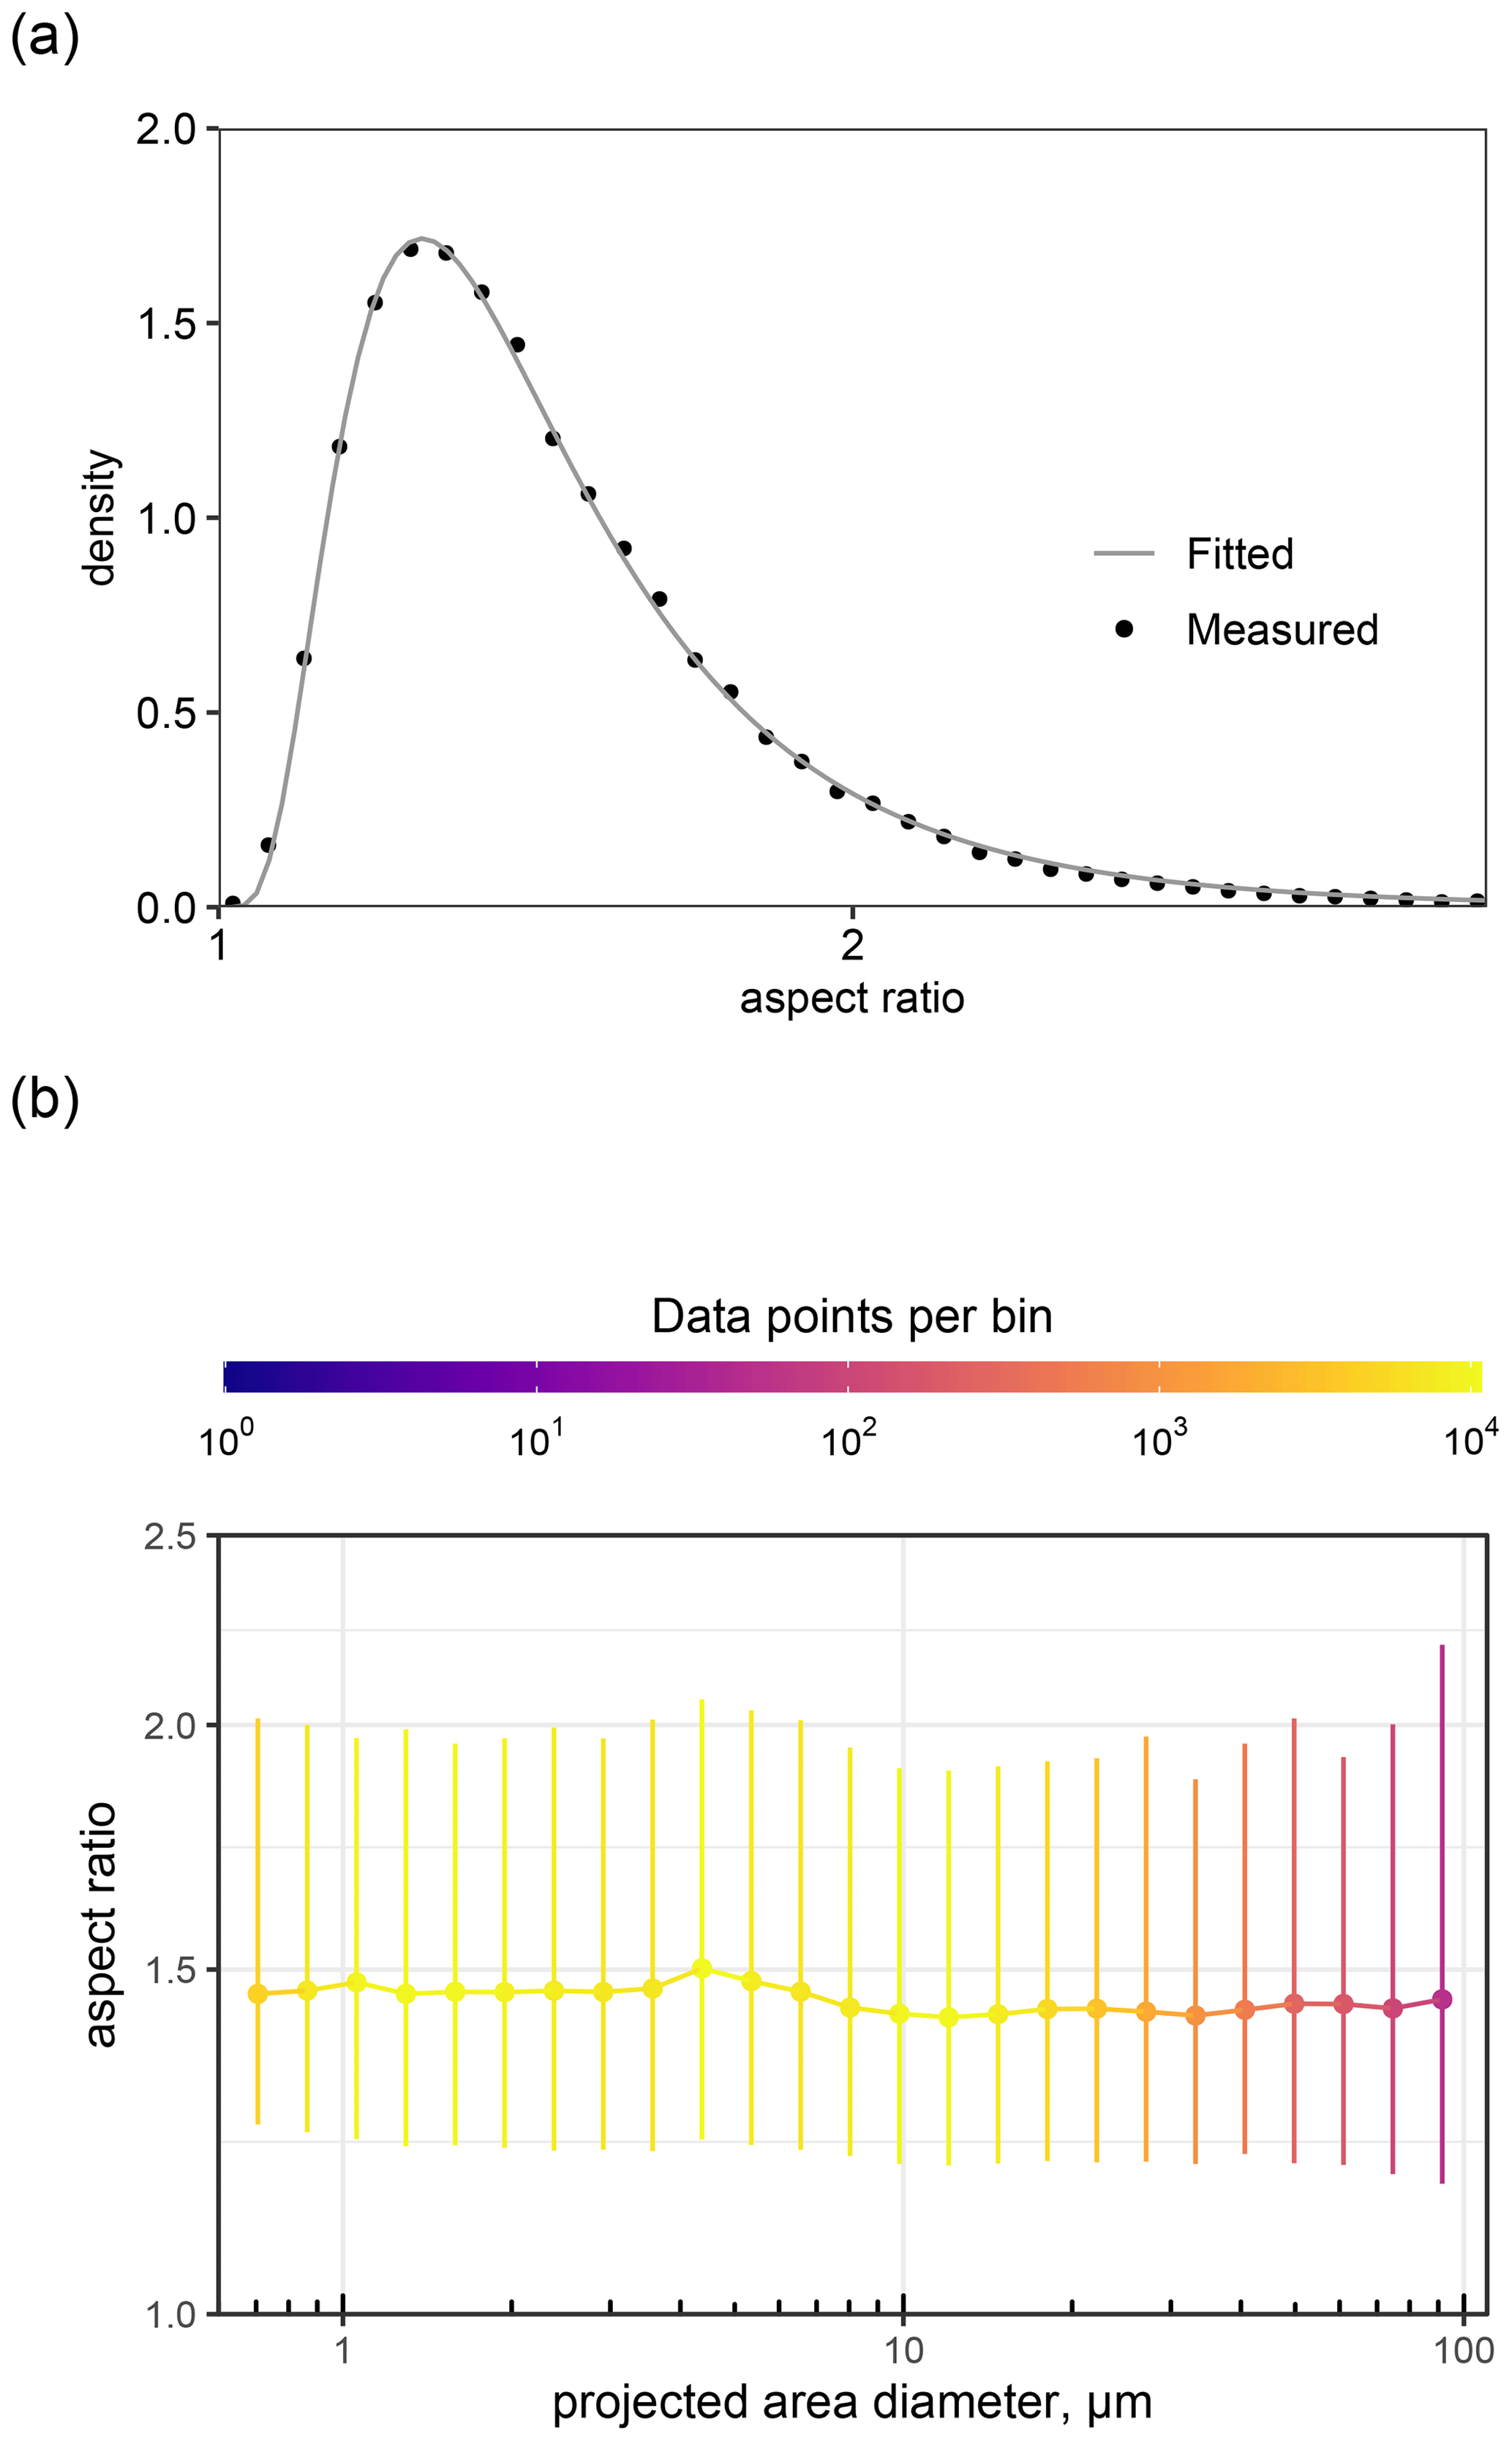
Figure 11(a) Measured and parameterized (solid line) aspect ratio density distribution of dust particles. (b) Size-resolved particle aspect ratio. The bar range represents the range between the 0.1 and 0.9 quantiles, the dot is the median, and the bins are color coded by the number of data points within each bin.
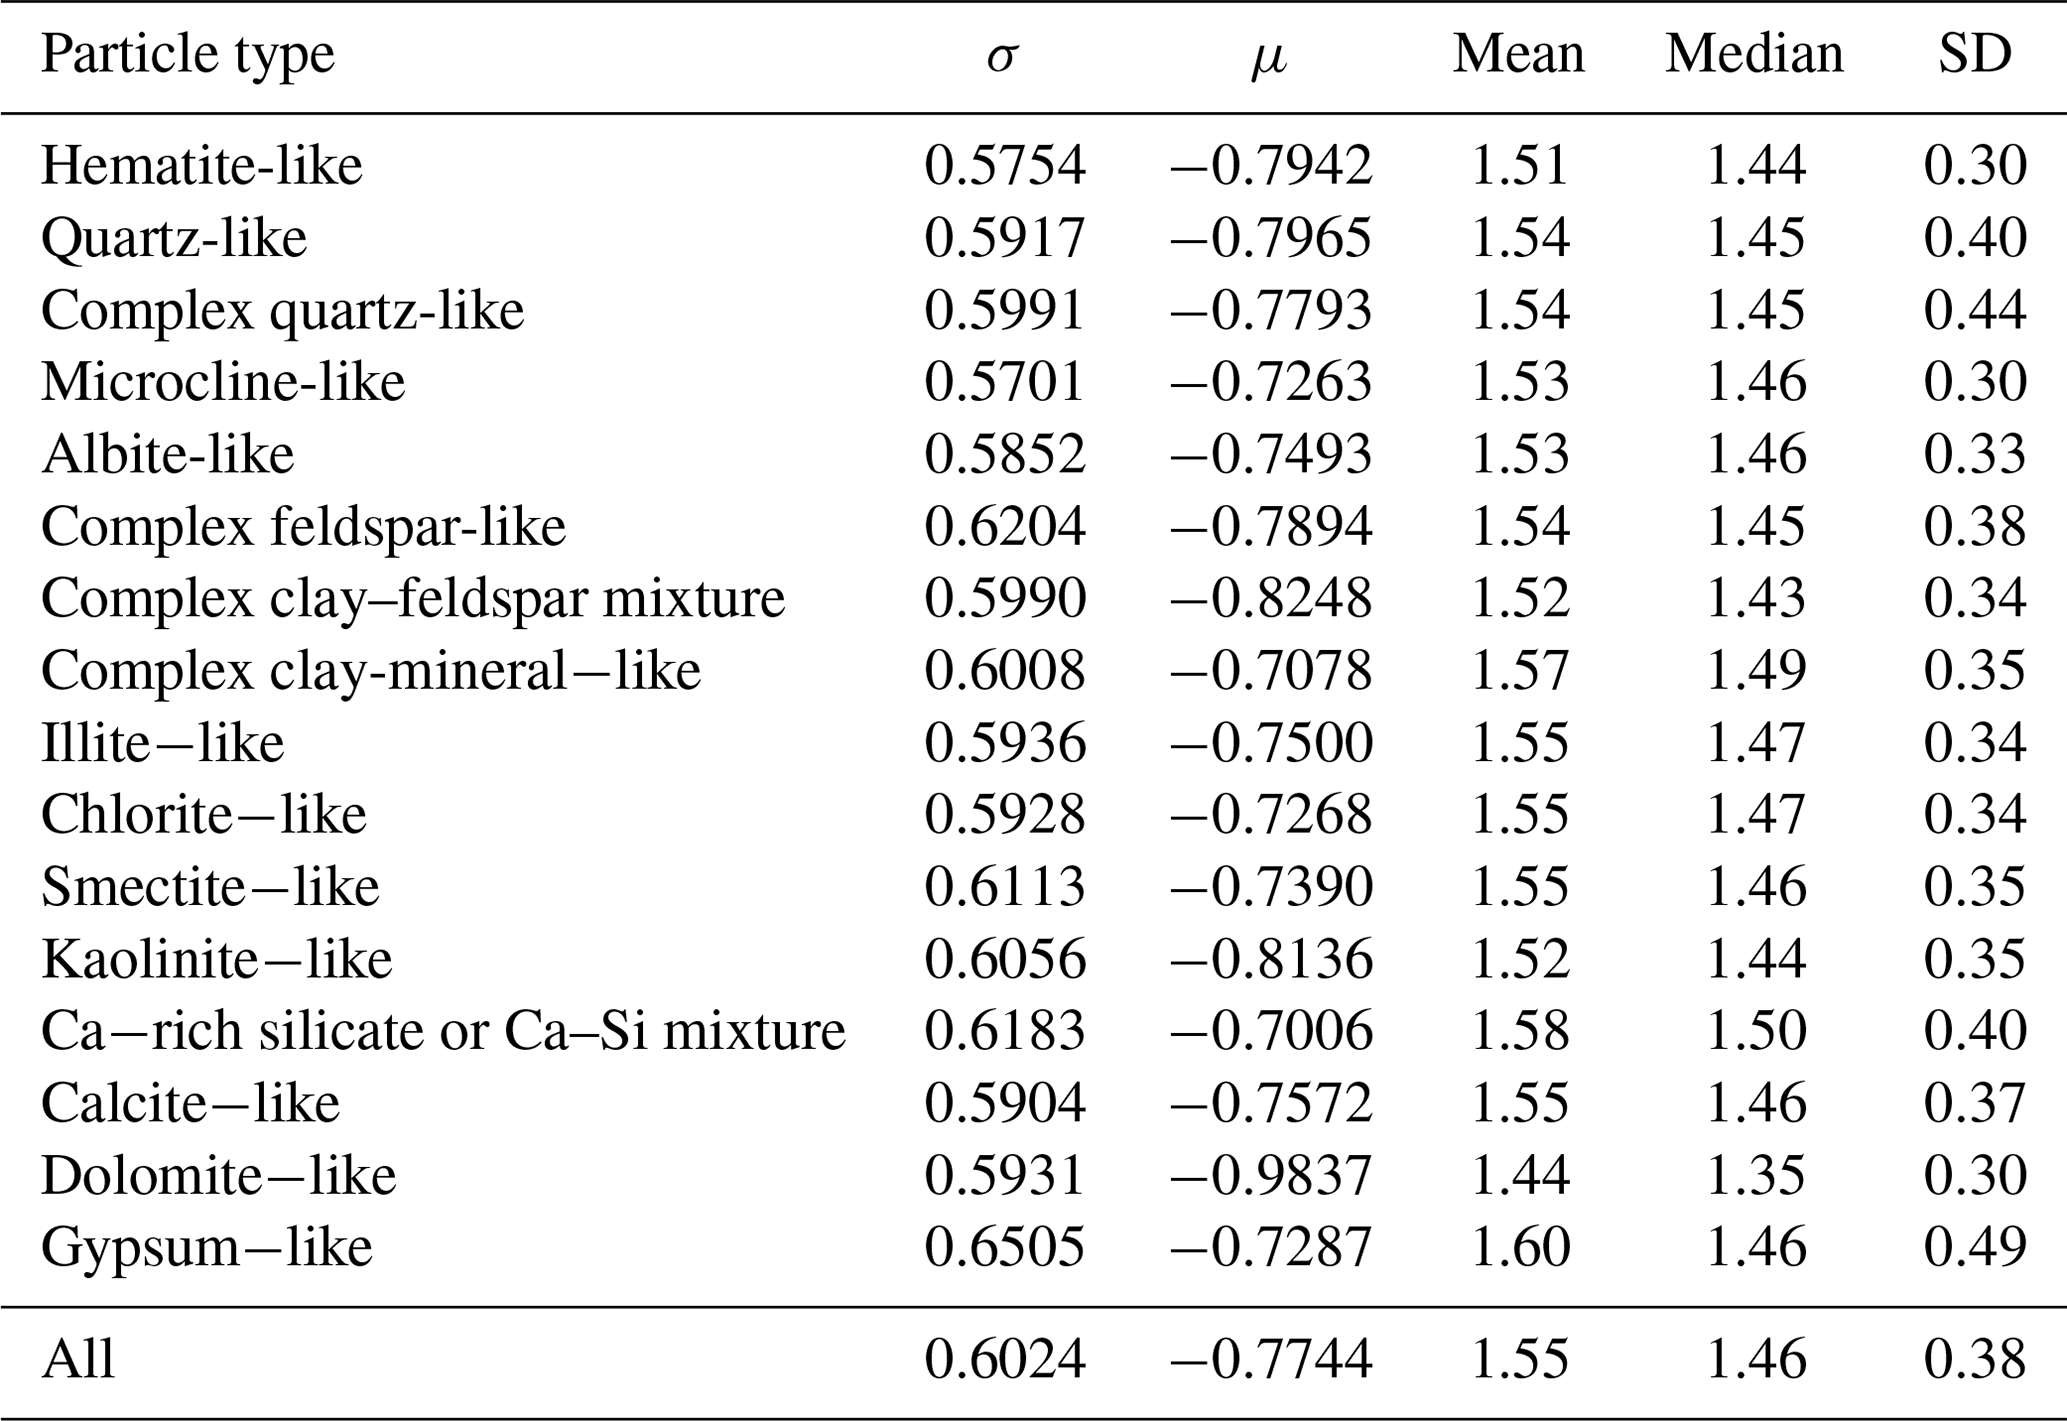
Table 2Parameters of the aspect ratio density distribution, mean, median, and standard deviation (SD) for different particle classes.
3.4 Particle shape
Dust particles were found to be highly aspherical and displayed a wide range of AR values for the size range 0.5 < Dp < 100 µm, which is consistent with previous studies of northern African dust (Chou et al., 2008; Kandler et al., 2009). The median AR of particles is 1.46 and is almost independent of particle diameter, as seen in Fig. 11b. It is slightly lower than the one found in previous AR measurements of Moroccan dust (median 1.6) (Kandler et al., 2009) but is similar to the Asian dust (median 1.4) (Okada et al., 2001) and dust observed in Niger during an aircraft campaign (Matsuki et al., 2010). These are also substantially lower than values reported for long-range-transported Saharan dust (Reid et al., 2003; Coz et al., 2009). The discrepancy in observations at the point of the source region and transported dust could be the preferential removal of lower AR particles at the source due to their higher gravitational settling velocity than elongated particles of the same volume (Yang et al., 2013). Other median values found in the literature at the source location are 1.7 during the African Monsoon Multidisciplinary Analysis (AMMA) campaign in Niger (Chou et al., 2008) and 1.55 during the Geostationary Earth Radiation Budget Intercomparisons of Longwave and Shortwave radiation (GERBILS) campaign over Mauritania, Mali, and Niger (Klaver et al., 2011). A median value of 1.3 was found during the Fennec campaign in the central Sahara (Rocha-Lima et al., 2018) for particles < 5 µm, and during AERosol Properties – Dust (AER-D) an aircraft measurement median of 1.3–1.44 for 0.5 to 5 µm, 1.30 for 5 to 10 µm, and 1.51 for 10 to 40 µm was observed for dust particles collected in the Saharan Air Layer and the marine boundary layer (Ryder et al., 2018). It should be noted that the AR calculation done in several of the studies mentioned are not directly comparable as systematic differences occur as a function of the measurement approach (Huang et al., 2020). While the values here are corrected following Huang et al. (2020), a bias might still remain.
The density distribution with respect to the AR can be parameterized by a modified lognormal distribution (Kandler et al., 2007):
Figure 11a shows the parameterization curve together with the measured values for all particles, and in Table 2 the fitting parameters σ and μ and the median value are given for different particle classes. Most of the particle groups have a similar median AR of 1.46, except for dolomite, which has the lowest median AR of 1.35. While the AR is generally independent of particle size and particle types, slightly higher aspect ratios are observed for internally mixed particles. Differences with other locations could then be at least partly explained by differences in mineralogical composition and mixing state.
We investigated the single particle composition of freshly emitted mineral dust aerosols using SEM-EDX. Samples were collected between 4 and 30 September 2019 during a field campaign at a major source region on the edge of the Sahara in Morocco (29∘49′30′′ N, 5∘52′25′′ W) in the context of the FRAGMENT project. A total of more than 300 000 individual particles were classified into eight major particle classes based on their elemental composition and were (i) oxides and hydroxides, (ii) feldspar, (iii) clay minerals, (iv) quartz-like and complex quartz-like particles, (v) other silicates, (vi) Ca-rich particles, (vii) sulfates, and (viii) mixtures and others. Our analysis shows that clay minerals (illite-like, kaolinite-like) were the most abundant across the size range dv < 64 µm (25 %–48 % in relative mass abundance). In contrast, calcite-like and chlorite-like particles were present mainly in the size range dv < 4 µm, (3.5 %–8 %). Quartz-like particles were present in a relatively constant quantity across different size bins (5.5 %–8.5 %), whereas complex quartz-like particles were present primarily in the size range dv > 4 µm, (5 %–22 %). A similarly high fraction of quartz, feldspars, and clay minerals were reported for Morocco during SAMUM (Kandler et al., 2009), except for Ca-rich particles, which are significantly less abundant in our sample, whereas in Kandler et al. (2009) they appear as a lognormal mode centered around 3 µm. Particles with high iron content (Fe oxides and hydroxides) were also identified, which are crucial for assessing the radiative effect of mineral dust and are essential nutrients for marine and terrestrial ecosystems.
The time series of the overall composition of mineral dust showed relative homogeneity over the campaign. Nevertheless, elevated contents of apatite, calcite, and sulfates were observed on certain days, suggesting the presence of a strong local source.
Most particle groups have median aspect ratios of around 1.46. Slightly higher aspect ratios are observed for internally mixed particles, whereas dolomite-like particles have the lowest median value of 1.35. This implies that dust aggregates with higher internal mixture fractions tend to have higher aspect ratios, which will change the radiative properties of dust. Studies have shown a trend of increasing aspect ratios for northern African dust after transatlantic advection (Huang et al., 2020).
We provided a more exhaustive analysis of Fe oxide-hydroxides and feldspar, including their PSD and potential aggregation or mixing state, which are key to the effects of dust upon radiation and clouds. Compared to clay minerals and quartz, iron-rich particles (either dominated by or externally mixed with Fe oxide-hydroxides) are present mainly in diameters smaller than 1 µm at about 3.75 % abundance by mass. Our analysis suggests that Fe oxide-hydroxides tend to be increasingly internally mixed with other minerals, especially clays, as particle size increases, with the volume fraction of Fe oxide-hydroxides in aggregates decreasing with particle size. All in all, smaller particles are more enriched with Fe due to both the presence of Fe oxide-hydroxides (hematite-like) and the increase in feldspar and quartz with particle size, which reduces the fractional abundance of clay-like particles internally mixed with Fe oxide-hydroxides. The externally mixed total feldspar and K-feldspar abundances are relatively constant, in contrast to the increasing abundance of feldspar-like (internally mixed) aggregates with particle size.
Many Earth system models still assume globally uniform mineralogical composition and therefore introduce errors in the assessment of regional forcing of dust. The detailed single-particle analysis of freshly emitted dust particles in this study is one key element in understanding the relationship of the emitted size-resolved composition to that of the parent soil. This important aspect will be investigated in the subsequent papers from FRAGMENT project, which would help include size-resolved composition dependencies in climate models. More recent FRAGMENT field campaigns in Iceland and Jordan will supplement these measurements in understanding the source-specific mineralogical composition of dust aerosols. Recently, the field of imaging spectrometry satellite missions has progressed with the development of new instruments, and projects like the Earth Surface Mineral Dust Source Investigation (EMIT) (Green et al., 2020), Environmental Mapping and Analysis Program (EnMAP) (Guanter et al., 2015), and DLR Earth Sensing Imaging Spectrometer (DESIS) (Müller et al., 2016) that will retrieve global surface mineralogy. Together, all of these efforts will help advance our knowledge of dust effects upon climate.
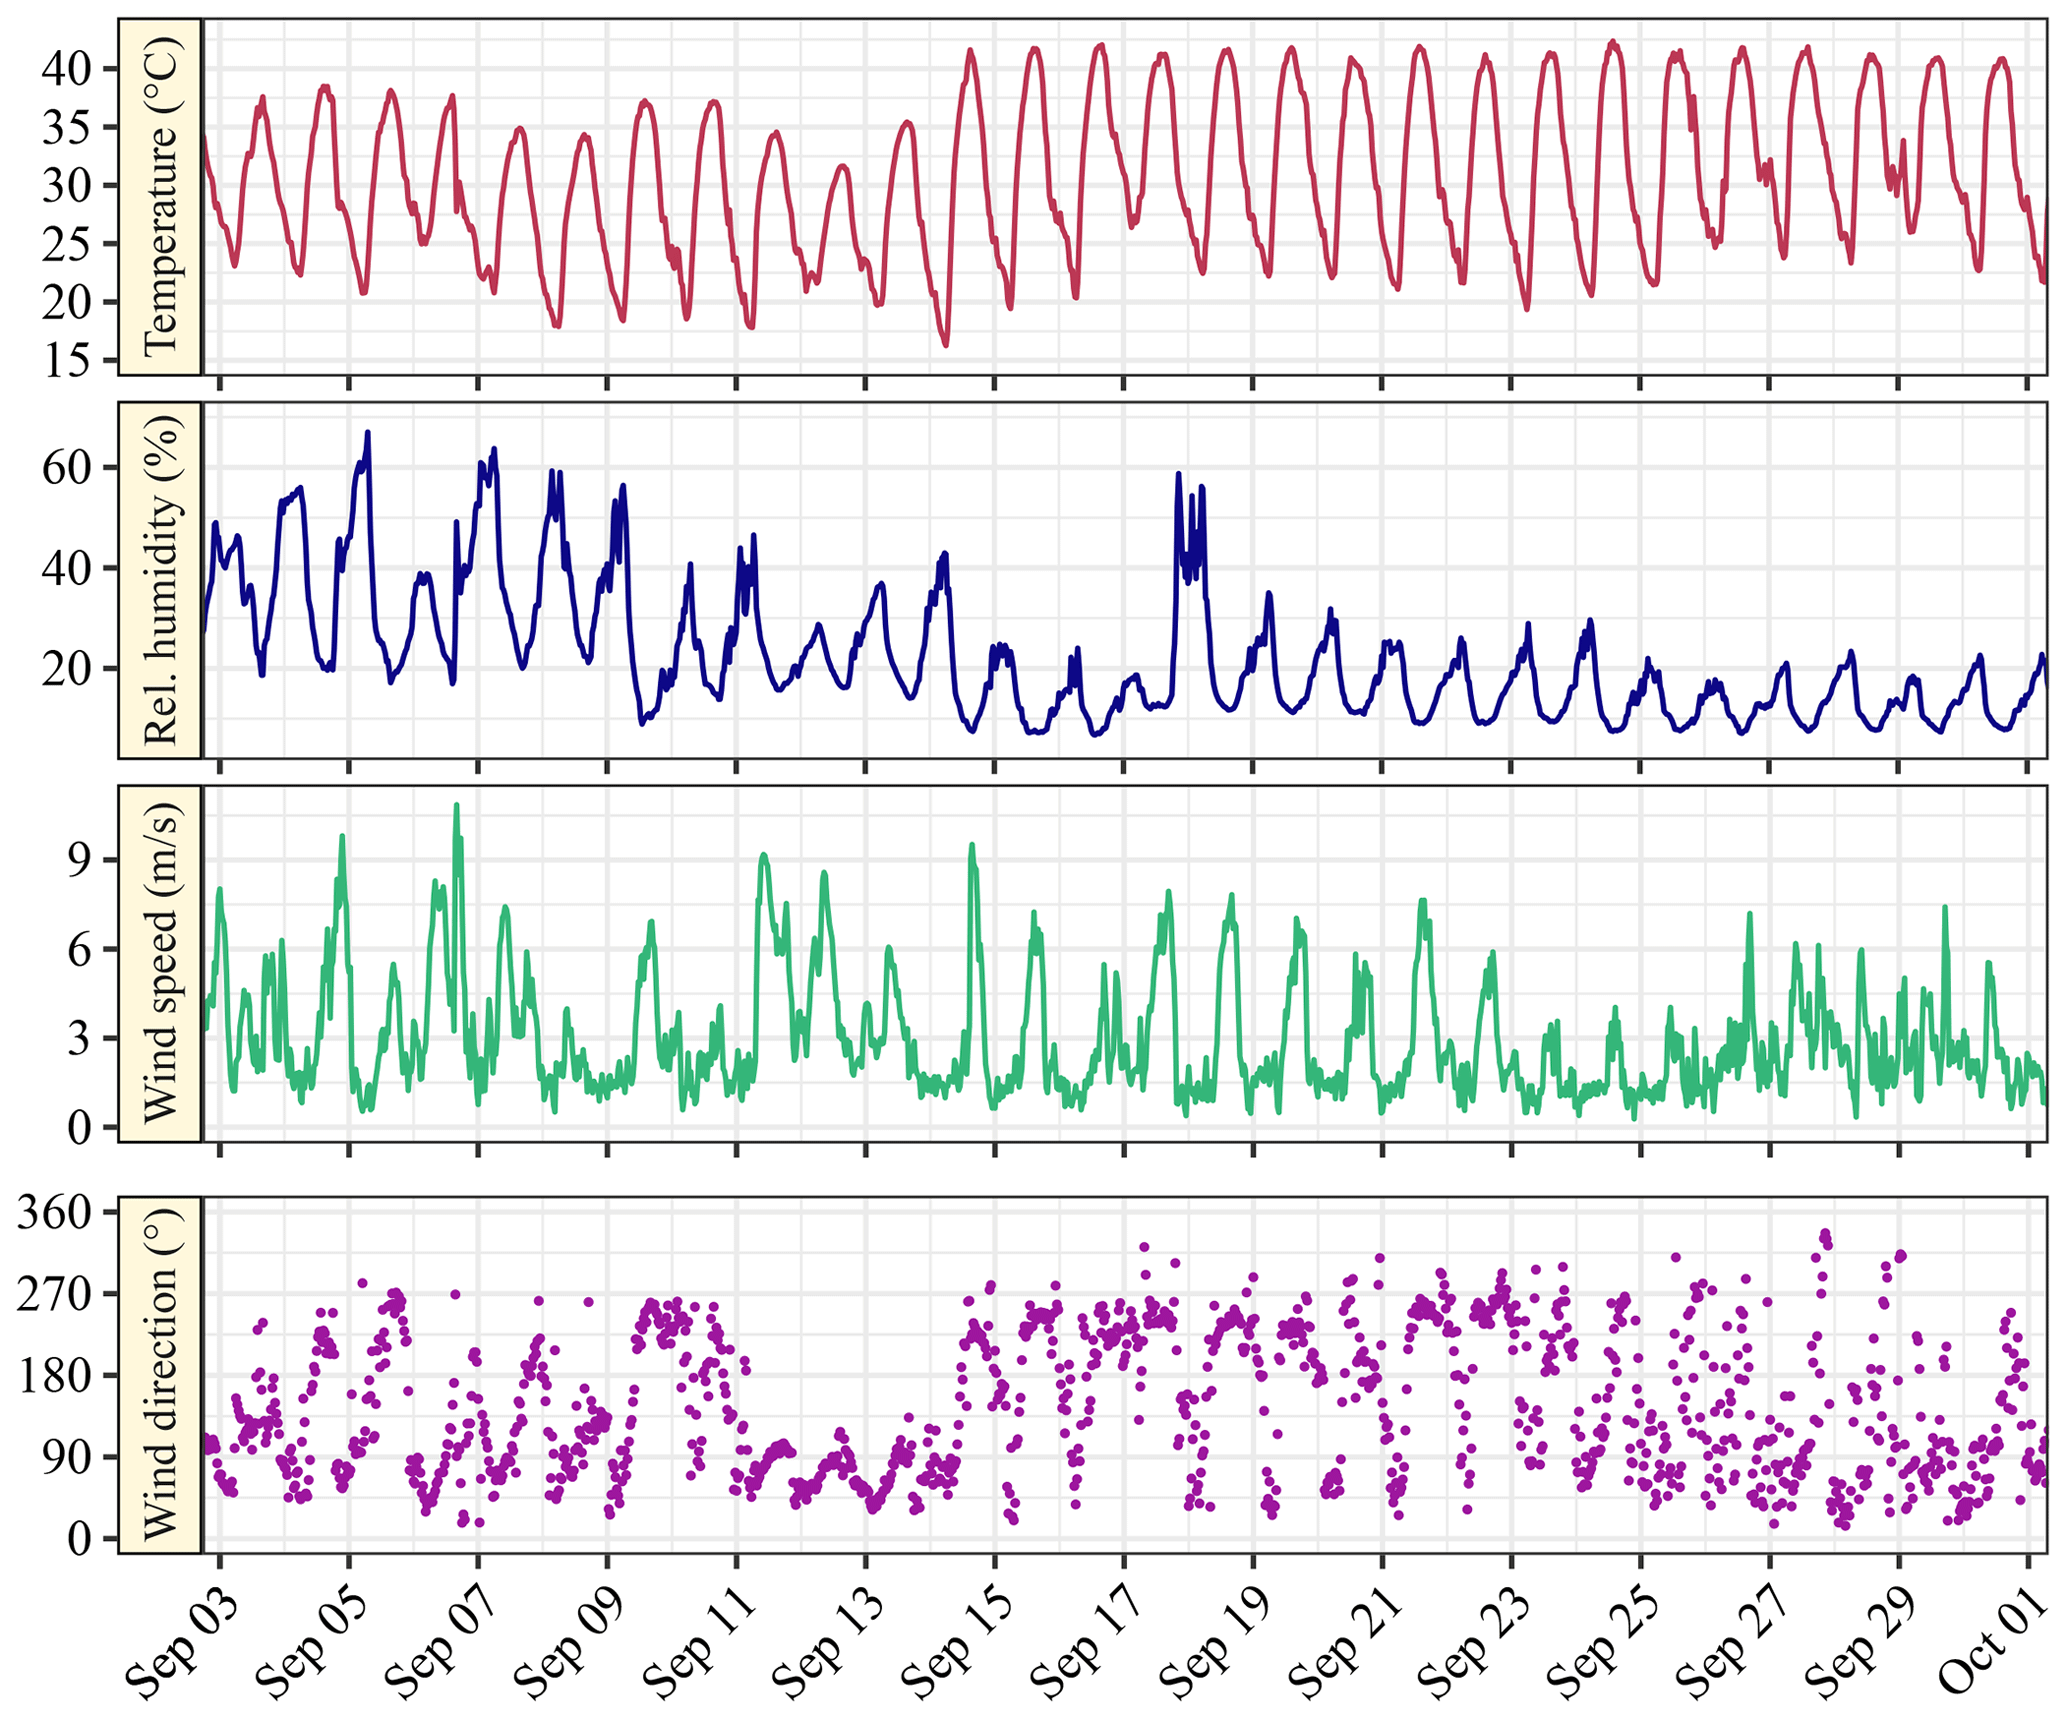
Figure A1Time series of temperature, relative humidity, wind speed, and wind direction at approximately 2 m height. A 30 min average is applied on all time series presented.
Data are available in the Zenodo data repository at https://doi.org/10.5281/zenodo.7649034 (Panta et al., 2023).
The supplement related to this article is available online at: https://doi.org/10.5194/acp-23-3861-2023-supplement.
CPG-P proposed and designed the measurement campaign with contributions from AA, KK, MK, and XQ. AP, KK, AA, CGF, AGR, MK, XQ, CR, JYD, and CPG-P implemented the field campaign. AP collected the samples, analyzed them using electron microscopy, performed formal analysis and visualization (except Fig. 1a, and b), and wrote the original draft manuscript. KK and CPG-P supervised the work. AGR generated Fig. 1a, and MK generated Fig. 1b. KK programmed data processing code and interpreted the results. CPG-P edited the manuscript. All authors contributed to data discussion and manuscript finalization.
The contact author has declared that none of the authors has any competing interests.
Publisher's note: Copernicus Publications remains neutral with regard to jurisdictional claims in published maps and institutional affiliations.
This article is part of the special issue “Dust aerosol measurements, modeling and multidisciplinary effects (AMT/ACP inter-journal SI)”. It is not associated with a conference.
We acknowledge the EMIT project, which is supported by the NASA Earth Venture Instrument program, under the Earth Science Division of the Science Mission Directorate. We thank Santiago Beguería from the National Scientific Council of Spain for facilitating our use of a field site in Zaragoza, Spain, to test our instrumentation and field procedures prior to our campaign in Morocco. We thank Kamal Taj Eddine from Cady Ayyad University, Marrakesh, Morocco, for his invaluable support and suggestions for the preparation of the field campaign. We thank Houssine Dakhamat and the crew of Hotel Chez le Pacha in M'hamid El Ghizlane for their support during the campaign.
We acknowledge support from the Deutsche Forschungsgemeinschaft (DFG, German Research Foundation) and the Open Access Publishing Fund of the Technical University of Darmstadt.
The field campaign and its associated research, including this work, was primarily funded by the European Research Council under the Horizon 2020 research and innovation programme through the ERC Consolidator Grant FRAGMENT (grant agreement no. 773051) and the AXA Research Fund through the AXA Chair on Sand and Dust Storms at BSC. Cristina González-Flórez was supported by a PhD fellowship from the Agència de Gestió d'Ajuts Universitaris i de Recerca (AGAUR) grant 2020_FI B 00678. Konrad Kandler was funded by the Deutsche Forschungsgemeinschaft (DFG, German Research Foundation) (grant nos. 264907654 and 416816480). Martina Klose received funding through the Helmholtz Association's Initiative and Networking Fund (grant agreement no. VH-NG-1533).
This paper was edited by Roya Bahreini and reviewed by two anonymous referees.
Adebiyi, A., Kok, J. F., Murray, B. J., Ryder, C. L., Stuut, J.-B. W., Kahn, R. A., Knippertz, P., Formenti, P., Mahowald, N. M., Pérez García-Pando, C., Klose, M., Ansmann, A., Samset, B. H., Ito, A., Balkanski, Y., Di Biagio, C., Romanias, M. N., Huang, Y., and Meng, J.: A review of coarse mineral dust in the Earth system, Aeolian Res., 60, 100849, https://doi.org/10.1016/j.aeolia.2022.100849, 2023. a
Adebiyi, A. A. and Kok, J. F.: Climate models miss most of the coarse dust in the atmosphere, Science Advances, 6, eaaz9507, https://doi.org/10.1126/sciadv.aaz9507, 2020. a
Aluko, O. and Noll, K. E.: Deposition and Suspension of Large, Airborne Particles, Aerosol Sci. Tech., 40, 503–513, https://doi.org/10.1080/02786820600664152, 2006. a
Atkinson, J. D., Murray, B. J., Woodhouse, M. T., Whale, T. F., Baustian, K. J., Carslaw, K. S., Dobbie, S., O’Sullivan, D., and Malkin, T. L.: The importance of feldspar for ice nucleation by mineral dust in mixed-phase clouds, Nature, 498, 355–358, https://doi.org/10.1038/nature12278, 2013. a, b, c, d
Baddock, M., Boskovic, L., Strong, C., McTainsh, G., Bullard, J., Agranovski, I., and Cropp, R.: Iron-rich nanoparticles formed by aeolian abrasion of desert dune sand, Geochem. Geophy. Geosy., 14, 3720–3729, https://doi.org/10.1002/ggge.20229, 2013. a
Baker, A. R. and Jickells, T. D.: Mineral particle size as a control on aerosol iron solubility, Geophys. Res. Lett., 33, L17608, https://doi.org/10.1029/2006GL026557, 2006. a
Bateman, A. P., Belassein, H., and Martin, S. T.: Impactor Apparatus for the Study of Particle Rebound: Relative Humidity and Capillary Forces, Aerosol Sci. Tech., 48, 42–52, https://doi.org/10.1080/02786826.2013.853866, 2014. a
Caponi, L., Formenti, P., Massabó, D., Di Biagio, C., Cazaunau, M., Pangui, E., Chevaillier, S., Landrot, G., Andreae, M. O., Kandler, K., Piketh, S., Saeed, T., Seibert, D., Williams, E., Balkanski, Y., Prati, P., and Doussin, J.-F.: Spectral- and size-resolved mass absorption efficiency of mineral dust aerosols in the shortwave spectrum: a simulation chamber study, Atmos. Chem. Phys., 17, 7175–7191, https://doi.org/10.5194/acp-17-7175-2017, 2017. a, b
Choobari, O. A., Zawar-Reza, P., and Sturman, A.: The global distribution of mineral dust and its impacts on the climate system: A review, Atmos. Res., 138, 152–165, https://doi.org/10.1016/j.atmosres.2013.11.007, 2014. a
Chou, C., Formenti, P., Maille, M., Ausset, P., Helas, G., Harrison, M., and Osborne, S.: Size distribution, shape, and composition of mineral dust aerosols collected during the African Monsoon Multidisciplinary Analysis Special Observation Period 0: Dust and Biomass-Burning Experiment field campaign in Niger, January 2006, J. Geophys. Res., 113, D00C10, https://doi.org/10.1029/2008JD009897, 2008. a, b, c, d, e, f
Claquin, T., Schulz, M., and Balkanski, Y. J.: Modeling the mineralogy of atmospheric dust sources, J. Geophys. Res.-Atmos., 104, 22243–22256, https://doi.org/10.1029/1999JD900416, 1999. a
Coz, E., Gómez-Moreno, F. J., Pujadas, M., Casuccio, G. S., Lersch, T. L., and Artíñano, B.: Individual particle characteristics of North African dust under different long-range transport scenarios, Atmos. Environ., 43, 1850–1863, https://doi.org/10.1016/j.atmosenv.2008.12.045, 2009. a
Cwiertny, D. M., Young, M. A., and Grassian, V. H.: Chemistry and Photochemistry of Mineral Dust Aerosol, Annu. Rev. Phys. Chem., 59, 27–51, https://doi.org/10.1146/annurev.physchem.59.032607.093630, 2008. a
Deboudt, K., Gloter, A., Mussi, A., and Flament, P.: Red-ox speciation and mixing state of iron in individual African dust particles, J. Geophys. Res., 117, D12307, https://doi.org/10.1029/2011JD017298, 2012. a
DeMott, P. J., Möhler, O., Cziczo, D. J., Hiranuma, N., Petters, M. D., Petters, S. S., Belosi, F., Bingemer, H. G., Brooks, S. D., Budke, C., Burkert-Kohn, M., Collier, K. N., Danielczok, A., Eppers, O., Felgitsch, L., Garimella, S., Grothe, H., Herenz, P., Hill, T. C. J., Höhler, K., Kanji, Z. A., Kiselev, A., Koop, T., Kristensen, T. B., Krüger, K., Kulkarni, G., Levin, E. J. T., Murray, B. J., Nicosia, A., O'Sullivan, D., Peckhaus, A., Polen, M. J., Price, H. C., Reicher, N., Rothenberg, D. A., Rudich, Y., Santachiara, G., Schiebel, T., Schrod, J., Seifried, T. M., Stratmann, F., Sullivan, R. C., Suski, K. J., Szakáll, M., Taylor, H. P., Ullrich, R., Vergara-Temprado, J., Wagner, R., Whale, T. F., Weber, D., Welti, A., Wilson, T. W., Wolf, M. J., and Zenker, J.: The Fifth International Workshop on Ice Nucleation phase 2 (FIN-02): laboratory intercomparison of ice nucleation measurements, Atmos. Meas. Tech., 11, 6231–6257, https://doi.org/10.5194/amt-11-6231-2018, 2018. a
Di Biagio, C., Formenti, P., Balkanski, Y., Caponi, L., Cazaunau, M., Pangui, E., Journet, E., Nowak, S., Andreae, M. O., Kandler, K., Saeed, T., Piketh, S., Seibert, D., Williams, E., and Doussin, J.-F.: Complex refractive indices and single-scattering albedo of global dust aerosols in the shortwave spectrum and relationship to size and iron content, Atmos. Chem. Phys., 19, 15503–15531, https://doi.org/10.5194/acp-19-15503-2019, 2019. a, b, c
Dubovik, O., Sinyuk, A., Lapyonok, T., Holben, B. N., Mishchenko, M., Yang, P., Eck, T. F., Volten, H., Muñoz, O., Veihelmann, B., van der Zande, W. J., Leon, J.-F., Sorokin, M., and Slutsker, I.: Application of spheroid models to account for aerosol particle nonsphericity in remote sensing of desert dust, J. Geophys. Res., 111, D11208, https://doi.org/10.1029/2005JD006619, 2006. a
Ebert, M., Dahmen, J., Hoffmann, P., and Ortner, H.: Examination of clean room aerosol particle composition by total reflection X-ray analysis and electron probe microanalysis, Spectrochim. Acta B, 52, 967–975, https://doi.org/10.1016/S0584-8547(96)01634-5, 1997. a
Engelbrecht, J. P., McDonald, E. V., Gillies, J. A., Jayanty, R. K. J., Casuccio, G., and Gertler, A. W.: Characterizing Mineral Dusts and Other Aerosols from the Middle East – Part 2: Grab Samples and Re-Suspensions, Inhal. Toxicol., 21, 327–336, https://doi.org/10.1080/08958370802464299, 2009a. a
Engelbrecht, J. P., McDonald, E. V., Gillies, J. A., Jayanty, R. K. M., Casuccio, G., and Gertler, A. W.: Characterizing Mineral Dusts and Other Aerosols from the Middle East – Part 1: Ambient Sampling, Inhal. Toxicol., 21, 297–326, https://doi.org/10.1080/08958370802464273, 2009b. a
Engelbrecht, J. P., Moosmüller, H., Pincock, S., Jayanty, R. K. M., Lersch, T., and Casuccio, G.: Technical note: Mineralogical, chemical, morphological, and optical interrelationships of mineral dust re-suspensions, Atmos. Chem. Phys., 16, 10809–10830, https://doi.org/10.5194/acp-16-10809-2016, 2016. a, b
Engelbrecht, J. P., Stenchikov, G., Prakash, P. J., Lersch, T., Anisimov, A., and Shevchenko, I.: Physical and chemical properties of deposited airborne particulates over the Arabian Red Sea coastal plain, Atmos. Chem. Phys., 17, 11467–11490, https://doi.org/10.5194/acp-17-11467-2017, 2017. a, b
Engelstaedter, S., Tegen, I., and Washington, R.: North African dust emissions and transport, Earth-Sci. Rev., 79, 73–100, https://doi.org/10.1016/j.earscirev.2006.06.004, 2006. a
Fang, C. P., McMurry, P. H., Marple, V. A., and Rubow, K. L.: Effect of Flow-induced Relative Humidity Changes on Size Cuts for Sulfuric Acid Droplets in the Microorifice Uniform Deposit Impactor (MOUDI), Aerosol Sci. Tech., 14, 266–277, https://doi.org/10.1080/02786829108959489, 1991. a
Fitzgerald, E., Ault, A. P., Zauscher, M. D., Mayol-Bracero, O. L., and Prather, K. A.: Comparison of the mixing state of long-range transported Asian and African mineral dust, Atmos. Environ., 115, 19–25, https://doi.org/10.1016/j.atmosenv.2015.04.031, 2015. a
Formenti, P., Schütz, L., Balkanski, Y., Desboeufs, K., Ebert, M., Kandler, K., Petzold, A., Scheuvens, D., Weinbruch, S., and Zhang, D.: Recent progress in understanding physical and chemical properties of African and Asian mineral dust, Atmos. Chem. Phys., 11, 8231–8256, https://doi.org/10.5194/acp-11-8231-2011, 2011. a
Froyd, K. D., Yu, P., Schill, G. P., Brock, C. A., Kupc, A., Williamson, C. J., Jensen, E. J., Ray, E., Rosenlof, K. H., Bian H., Darmenov, A. S., Colarco, P. R., Diskin, G. S., Bui T., and Murphy, D. M.: Dominant role of mineral dust in cirrus cloud formation revealed by global-scale measurements, Nat. Geosci., 15, 177–183, https://doi.org/10.1038/s41561-022-00901-w, 2022. a
Giannadaki, D., Pozzer, A., and Lelieveld, J.: Modeled global effects of airborne desert dust on air quality and premature mortality, Atmos. Chem. Phys., 14, 957–968, https://doi.org/10.5194/acp-14-957-2014, 2014. a
Ginoux, P.: Effects of nonsphericity on mineral dust modeling, J. Geophys. Res., 108, 4052, https://doi.org/10.1029/2002JD002516, 2003. a
Ginoux, P., Prospero, J. M., Gill, T. E., Hsu, N. C., and Zhao, M.: Global-scale attribution of anthropogenic and natural dust sources and their emission rates based on MODIS Deep Blue aerosol products, Rev. Geophys., 50, RG3005, https://doi.org/10.1029/2012RG000388, 2012. a
Gliß, J., Mortier, A., Schulz, M., Andrews, E., Balkanski, Y., Bauer, S. E., Benedictow, A. M. K., Bian, H., Checa-Garcia, R., Chin, M., Ginoux, P., Griesfeller, J. J., Heckel, A., Kipling, Z., Kirkevåg, A., Kokkola, H., Laj, P., Le Sager, P., Lund, M. T., Lund Myhre, C., Matsui, H., Myhre, G., Neubauer, D., van Noije, T., North, P., Olivié, D. J. L., Rémy, S., Sogacheva, L., Takemura, T., Tsigaridis, K., and Tsyro, S. G.: AeroCom phase III multi-model evaluation of the aerosol life cycle and optical properties using ground- and space-based remote sensing as well as surface in situ observations, Atmos. Chem. Phys., 21, 87–128, https://doi.org/10.5194/acp-21-87-2021, 2021. a
González-Flórez, C., Klose, M., Alastuey, A., Dupont, S., Escribano, J., Etyemezian, V., Gonzalez-Romero, A., Huang, Y., Kandler, K., Nikolich, G., Panta, A., Querol, X., Reche, C., Yus-Díez, J., and Pérez García-Pando, C.: Insights into the size-resolved dust emission from field measurements in the Moroccan Sahara, Atmos. Chem. Phys. Discuss. [preprint], https://doi.org/10.5194/acp-2022-758, in review, 2022. a, b, c, d, e
González-Romero, A., Querol, X., Alastuey, A., González-Flórez, C., Kandler, K., Klose, M., Panta, A., Reche, C., Yús-Díez, J., and Perez García-Pando, C.: Properties of dust-source sediment and their importance on dust emission: a local example in S Morocco, in preparation, 2023. a, b, c
Green, R. O., Mahowald, N., Ung, C., Thompson, D. R., Bator, L., Bennet, M., Bernas, M., Blackway, N., Bradley, C., Cha, J., Clark, P., Clark, R., Cloud, D., Diaz, E., Ben Dor, E., Duren, R., Eastwood, M., Ehlmann, B. L., Fuentes, L., Ginoux, P., Gross, J., He, Y., Kalashnikova, O., Kert, W., Keymeulen, D., Klimesh, M., Ku, D., Kwong-Fu, H., Liggett, E., Li, L., Lundeen, S., Makowski, M. D., Mazer, A., Miller, R., Mouroulis, P., Oaida, B., Okin, G. S., Ortega, A., Oyake, A., Nguyen, H., Pace, T., Painter, T. H., Pempejian, J., Garcia-Pando, C. P., Pham, T., Phillips, B., Pollock, R., Purcell, R., Realmuto, V., Schoolcraft, J., Sen, A., Shin, S., Shaw, L., Soriano, M., Swayze, G., Thingvold, E., Vaid, A., and Zan, J.: The Earth Surface Mineral Dust Source Investigation: An Earth Science Imaging Spectroscopy Mission, in: 2020 IEEE Aerospace Conference, 7–14 March 2020, Big Sky, Montana, USA, 1–15, https://doi.org/10.1109/AERO47225.2020.9172731, 2020. a, b
Guanter, L., Kaufmann, H., Segl, K., Foerster, S., Rogass, C., Chabrillat, S., Kuester, T., Hollstein, A., Rossner, G., Chlebek, C., Straif, C., Fischer, S., Schrader, S., Storch, T., Heiden, U., Mueller, A., Bachmann, M., Mühle, H., Müller, R., Habermeyer, M., Ohndorf, A., Hill, J., Buddenbaum, H., Hostert, P., Van der Linden, S., Leitão, P. J., Rabe, A., Doerffer, R., Krasemann, H., Xi, H., Mauser, W., Hank, T., Locherer, M., Rast, M., Staenz, K., and Sang, B.: The EnMAP Spaceborne Imaging Spectroscopy Mission for Earth Observation, Remote Sensing, 7, 8830–8857, https://doi.org/10.3390/rs70708830, 2015. a
Harrison, A. D., Whale, T. F., Carpenter, M. A., Holden, M. A., Neve, L., O'Sullivan, D., Vergara Temprado, J., and Murray, B. J.: Not all feldspars are equal: a survey of ice nucleating properties across the feldspar group of minerals, Atmos. Chem. Phys., 16, 10927–10940, https://doi.org/10.5194/acp-16-10927-2016, 2016. a, b
Harrison, A. D., O'Sullivan, D., Adams, M. P., Porter, G. C. E., Blades, E., Brathwaite, C., Chewitt-Lucas, R., Gaston, C., Hawker, R., Krüger, O. O., Neve, L., Pöhlker, M. L., Pöhlker, C., Pöschl, U., Sanchez-Marroquin, A., Sealy, A., Sealy, P., Tarn, M. D., Whitehall, S., McQuaid, J. B., Carslaw, K. S., Prospero, J. M., and Murray, B. J.: The ice-nucleating activity of African mineral dust in the Caribbean boundary layer, Atmos. Chem. Phys., 22, 9663–9680, https://doi.org/10.5194/acp-22-9663-2022, 2022. a
Hartung, J., Elpelt, B., and Klösener, K.-H.: Statistik: Lehr- und Handbuch der angewandten Statistik, Oldenbourg Wissenschaftsverlag, https://doi.org/10.1524/9783486710540, 2012. a
Hettiarachchi, E., Ivanov, S., Kieft, T., Goldstein, H. L., Moskowitz, B. M., Reynolds, R. L., and Rubasinghege, G.: Atmospheric Processing of Iron-Bearing Mineral Dust Aerosol and Its Effect on Growth of a Marine Diatom, Cyclotella meneghiniana, Environ. Sci. Technol., 55, 871–881, https://doi.org/10.1021/acs.est.0c06995, 2021. a
Hoose, C. and Möhler, O.: Heterogeneous ice nucleation on atmospheric aerosols: a review of results from laboratory experiments, Atmos. Chem. Phys., 12, 9817–9854, https://doi.org/10.5194/acp-12-9817-2012, 2012. a
Huang, Y., Kok, J. F., Kandler, K., Lindqvist, H., Nousiainen, T., Sakai, T., Adebiyi, A., and Jokinen, O.: Climate Models and Remote Sensing Retrievals Neglect Substantial Desert Dust Asphericity, Geophys. Res. Lett., 47, e2019GL086592, https://doi.org/10.1029/2019GL086592, 2020. a, b, c, d, e, f, g
Ito, A., Adebiyi, A. A., Huang, Y., and Kok, J. F.: Less atmospheric radiative heating by dust due to the synergy of coarser size and aspherical shape, Atmos. Chem. Phys., 21, 16869–16891, https://doi.org/10.5194/acp-21-16869-2021, 2021. a, b
Jeong, G. Y.: Bulk and single-particle mineralogy of Asian dust and a comparison with its source soils, J. Geophys. Res., 113, D02208, https://doi.org/10.1029/2007JD008606, 2008. a
Jickells, T. D., An, Z. S., Andersen, K. K., Baker, A. R., Bergametti, G., Brooks, N., Cao, J. J., Boyd, P. W., Duce, R. A., Hunter, K. A., Kawahata, H., Kubilay, N., laRoche, J., Liss, P. S., Mahowald, N., Prospero, J. M., Ridgwell, A. J., Tegen, I., and Torres, R.: Global Iron Connections Between Desert Dust, Ocean Biogeochemistry, and Climate, Science, 308, 67–71, https://doi.org/10.1126/science.1105959, 2005. a
Jish Prakash, P., Stenchikov, G., Tao, W., Yapici, T., Warsama, B., and Engelbrecht, J. P.: Arabian Red Sea coastal soils as potential mineral dust sources, Atmos. Chem. Phys., 16, 11991–12004, https://doi.org/10.5194/acp-16-11991-2016, 2016. a, b
Journet, E., Balkanski, Y., and Harrison, S. P.: A new data set of soil mineralogy for dust-cycle modeling, Atmos. Chem. Phys., 14, 3801–3816, https://doi.org/10.5194/acp-14-3801-2014, 2014. a
Kaaden, N., Massling, A., Schladitz, A., Müller, T., Kandler, K., Schütz, L., Weinzierl, B., Petzold, A., Tesche, M., Leinert, S., Deutscher, C., Ebert, M., Weinbruch, S., and Wiedensohler, A.: State of mixing, shape factor, number size distribution, and hygroscopic growth of the Saharan anthropogenic and mineral dust aerosol at Tinfou, Morocco, Tellus B, 61, 51–63, https://doi.org/10.1111/j.1600-0889.2008.00388.x, 2009. a
Kandler, K., Benker, N., Bundke, U., Cuevas, E., Ebert, M., Knippertz, P., Rodríguez, S., Schütz, L., and Weinbruch, S.: Chemical composition and complex refractive index of Saharan Mineral Dust at Izaña, Tenerife (Spain) derived by electron microscopy, Atmos. Environ., 41, 8058–8074, https://doi.org/10.1016/j.atmosenv.2007.06.047, 2007. a, b, c, d
Kandler, K., Schütz, L., Deutscher, C., Ebert, M., Hofmann, H., Jäckel, S., Jaenicke, R., Knippertz, P., Lieke, K., Massling, A., Petzold, A., Schladitz, A., Weinzierl, B., Wiedensohler, A., Zorn, S., and Weinbruch, S.: Size distribution, mass concentration, chemical and mineralogical composition and derived optical parameters of the boundary layer aerosol at Tinfou, Morocco, during SAMUM 2006, Tellus B, 61, 32–50, https://doi.org/10.1111/j.1600-0889.2008.00385.x, 2009. a, b, c, d, e, f, g, h, i, j, k, l, m
Kandler, K., Lieke, K., Benker, N., Emmel, C., Küpper, M., Müller-Ebert, D., Ebert, M., Scheuvens, D., Schladitz, A., Schütz, L., and Weinbruch, S.: Electron microscopy of particles collected at Praia, Cape Verde, during the Saharan Mineral Dust Experiment: particle chemistry, shape, mixing state and complex refractive index, Tellus B, 63, 475–496, https://doi.org/10.1111/j.1600-0889.2011.00550.x, 2011. a, b, c
Kandler, K., Schneiders, K., Ebert, M., Hartmann, M., Weinbruch, S., Prass, M., and Pöhlker, C.: Composition and mixing state of atmospheric aerosols determined by electron microscopy: method development and application to aged Saharan dust deposition in the Caribbean boundary layer, Atmos. Chem. Phys., 18, 13429–13455, https://doi.org/10.5194/acp-18-13429-2018, 2018. a, b, c, d, e, f, g, h
Kandler, K., Schneiders, K., Heuser, J., Waza, A., Aryasree, S., Althausen, D., Hofer, J., Abdullaev, S. F., and Makhmudov, A. N.: Differences and Similarities of Central Asian, African, and Arctic Dust Composition from a Single Particle Perspective, Atmosphere, 11, 269, https://doi.org/10.3390/atmos11030269, 2020. a, b
Kiselev, A., Bachmann, F., Pedevilla, P., Cox, S. J., Michaelides, A., Gerthsen, D., and Leisner, T.: Active sites in heterogeneous ice nucleation – the example of K-rich feldspars, Science, 355, 367–371, https://doi.org/10.1126/science.aai8034, 2017. a
Klaver, A., Formenti, P., Caquineau, S., Chevaillier, S., Ausset, P., Calzolai, G., Osborne, S., Johnson, B., Harrison, M., and Dubovik, O.: Physico-chemical and optical properties of Sahelian and Saharan mineral dust: in situ measurements during the GERBILS campaign, Q. J. Roy. Meteor. Soc., 137, 1193–1210, https://doi.org/10.1002/qj.889, 2011. a
Klose, M., Jorba, O., Gonçalves Ageitos, M., Escribano, J., Dawson, M. L., Obiso, V., Di Tomaso, E., Basart, S., Montané Pinto, G., Macchia, F., Ginoux, P., Guerschman, J., Prigent, C., Huang, Y., Kok, J. F., Miller, R. L., and Pérez García-Pando, C.: Mineral dust cycle in the Multiscale Online Nonhydrostatic AtmospheRe CHemistry model (MONARCH) Version 2.0, Geosci. Model Dev., 14, 6403–6444, https://doi.org/10.5194/gmd-14-6403-2021, 2021. a
Kok, J. F.: A scaling theory for the size distribution of emitted dust aerosols suggests climate models underestimate the size of the global dust cycle, P. Natl. Acad. Sci. USA, 108, 1016–1021, https://doi.org/10.1073/pnas.1014798108, 2011. a
Kok, J. F., Adebiyi, A. A., Albani, S., Balkanski, Y., Checa-Garcia, R., Chin, M., Colarco, P. R., Hamilton, D. S., Huang, Y., Ito, A., Klose, M., Li, L., Mahowald, N. M., Miller, R. L., Obiso, V., Pérez García-Pando, C., Rocha-Lima, A., and Wan, J. S.: Contribution of the world's main dust source regions to the global cycle of desert dust, Atmos. Chem. Phys., 21, 8169–8193, https://doi.org/10.5194/acp-21-8169-2021, 2021a. a
Kok, J. F., Adebiyi, A. A., Albani, S., Balkanski, Y., Checa-Garcia, R., Chin, M., Colarco, P. R., Hamilton, D. S., Huang, Y., Ito, A., Klose, M., Leung, D. M., Li, L., Mahowald, N. M., Miller, R. L., Obiso, V., Pérez García-Pando, C., Rocha-Lima, A., Wan, J. S., and Whicker, C. A.: Improved representation of the global dust cycle using observational constraints on dust properties and abundance, Atmos. Chem. Phys., 21, 8127–8167, https://doi.org/10.5194/acp-21-8127-2021, 2021b. a
Kumar, P., Sokolik, I. N., and Nenes, A.: Cloud condensation nuclei activity and droplet activation kinetics of wet processed regional dust samples and minerals, Atmos. Chem. Phys., 11, 8661–8676, https://doi.org/10.5194/acp-11-8661-2011, 2011. a
Lafon, S., Sokolik, I. N., Rajot, J. L., Caquineau, S., and Gaudichet, A.: Characterization of iron oxides in mineral dust aerosols: Implications for light absorption, J. Geophys. Res., 111, D21207, https://doi.org/10.1029/2005JD007016, 2006. a
Li, J. and Osada, K.: Preferential settling of elongated mineral dust particles in the atmosphere, Geophys. Res. Lett., 34, L17807, https://doi.org/10.1029/2007GL030262, 2007. a
Li, L., Mahowald, N. M., Miller, R. L., Pérez García-Pando, C., Klose, M., Hamilton, D. S., Gonçalves Ageitos, M., Ginoux, P., Balkanski, Y., Green, R. O., Kalashnikova, O., Kok, J. F., Obiso, V., Paynter, D., and Thompson, D. R.: Quantifying the range of the dust direct radiative effect due to source mineralogy uncertainty, Atmos. Chem. Phys., 21, 3973–4005, https://doi.org/10.5194/acp-21-3973-2021, 2021. a, b, c
Lindqvist, H., Jokinen, O., Kandler, K., Scheuvens, D., and Nousiainen, T.: Single scattering by realistic, inhomogeneous mineral dust particles with stereogrammetric shapes, Atmos. Chem. Phys., 14, 143–157, https://doi.org/10.5194/acp-14-143-2014, 2014. a, b, c
Liu, D., Taylor, J. W., Crosier, J., Marsden, N., Bower, K. N., Lloyd, G., Ryder, C. L., Brooke, J. K., Cotton, R., Marenco, F., Blyth, A., Cui, Z., Estelles, V., Gallagher, M., Coe, H., and Choularton, T. W.: Aircraft and ground measurements of dust aerosols over the west African coast in summer 2015 during ICE-D and AER-D, Atmos. Chem. Phys., 18, 3817–3838, https://doi.org/10.5194/acp-18-3817-2018, 2018. a
Mahowald, N., Albani, S., Kok, J. F., Engelstaeder, S., Scanza, R., Ward, D. S., and Flanner, M. G.: The size distribution of desert dust aerosols and its impact on the Earth system, Aeolian Res., 15, 53–71, https://doi.org/10.1016/j.aeolia.2013.09.002, 2014. a, b
Mahowald, N. M., Engelstaedter, S., Luo, C., Sealy, A., Artaxo, P., Benitez-Nelson, C., Bonnet, S., Chen, Y., Chuang, P. Y., Cohen, D. D., Dulac, F., Herut, B., Johansen, A. M., Kubilay, N., Losno, R., Maenhaut, W., Paytan, A., Prospero, J. M., Shank, L. M., and Siefert, R. L.: Atmospheric Iron Deposition: Global Distribution, Variability, and Human Perturbations, Annu. Rev. Mar. Sci., 1, 245–278, https://doi.org/10.1146/annurev.marine.010908.163727, 2009. a
Mallios, S. A., Drakaki, E., and Amiridis, V.: Effects of dust particle sphericity and orientation on their gravitational settling in the earth’s atmosphere, J. Aerosol Sci., 150, 105634, https://doi.org/10.1016/j.jaerosci.2020.105634, 2020. a
Marcotte, A. R., Anbar, A. D., Majestic, B. J., and Herckes, P.: Mineral Dust and Iron Solubility: Effects of Composition, Particle Size, and Surface Area, Atmosphere, 11, 533, https://doi.org/10.3390/atmos11050533, 2020. a, b
Marsden, N. A., Ullrich, R., Möhler, O., Eriksen Hammer, S., Kandler, K., Cui, Z., Williams, P. I., Flynn, M. J., Liu, D., Allan, J. D., and Coe, H.: Mineralogy and mixing state of north African mineral dust by online single-particle mass spectrometry, Atmos. Chem. Phys., 19, 2259–2281, https://doi.org/10.5194/acp-19-2259-2019, 2019. a, b
Matsuki, A., Schwarzenboeck, A., Venzac, H., Laj, P., Crumeyrolle, S., and Gomes, L.: Cloud processing of mineral dust: direct comparison of cloud residual and clear sky particles during AMMA aircraft campaign in summer 2006, Atmos. Chem. Phys., 10, 1057–1069, https://doi.org/10.5194/acp-10-1057-2010, 2010. a
Middleton, N.: Desert dust hazards: A global review, Aeolian Res., 24, 53–63, https://doi.org/10.1016/j.aeolia.2016.12.001, 2017. a
Mishchenko, M. I., Travis, L. D., Kahn, R. A., and West, R. A.: Modeling phase functions for dustlike tropospheric aerosols using a shape mixture of randomly oriented polydisperse spheroids, J. Geophys. Res.-Atmos., 102, 16831–16847, https://doi.org/10.1029/96JD02110, 1997. a
Monteiro, A., Basart, S., Kazadzis, S., Votsis, A., Gkikas, A., Vandenbussche, S., Tobias, A., Gama, C., García-Pando, C. P., Terradellas, E., Notas, G., Middleton, N., Kushta, J., Amiridis, V., Lagouvardos, K., Kosmopoulos, P., Kotroni, V., Kanakidou, M., Mihalopoulos, N., Kalivitis, N., Dagsson-Waldhauserová, P., El-Askary, H., Sievers, K., Giannaros, T., Mona, L., Hirtl, M., Skomorowski, P., Virtanen, T. H., Christoudias, T., Di Mauro, B., Trippetta, S., Kutuzov, S., Meinander, O., and Nickovic, S.: Multi-sectoral impact assessment of an extreme African dust episode in the Eastern Mediterranean in March 2018, Sci. Total Environ., 843, 156861, https://doi.org/10.1016/j.scitotenv.2022.156861, 2022. a
Moosmüller, H., Engelbrecht, J. P., Skiba, M., Frey, G., Chakrabarty, R. K., and Arnott, W. P.: Single scattering albedo of fine mineral dust aerosols controlled by iron concentration, J. Geophys. Res.-Atmos., 117, D11210, https://doi.org/10.1029/2011JD016909, 2012. a
Moskowitz, B. M., Reynolds, R. L., Goldstein, H. L., Berquó, T. S., Kokaly, R. F., and Bristow, C. S.: Iron oxide minerals in dust-source sediments from the Bodélé Depression, Chad: Implications for radiative properties and Fe bioavailability of dust plumes from the Sahara, Aeolian Res., 22, 93–106, https://doi.org/10.1016/j.aeolia.2016.07.001, 2016. a
Müller,R., Avbelj, J., Carmona, E., Eckardt, A., Gerasch, B., Graham, C. L., Günther,B., Heiden, U., Ickes, J., Kerr, G., Knodt, U., Krutz, D., Krawczyk, H., Makarau, A., Miller, R., Perkins, R., and Walter, I.: The new hyperspectral sensor DESIS on the multi-payload platform MUSES installed on the ISS, The International Archives of the Photogrammetry, Remote Sensing and Spatial Information Sciences, 41, 461–467, https://doi.org/10.5194/isprsarchives-XLI-B1-461-2016, 2016. a
Myriokefalitakis, S., Bergas-Massó, E., Gonçalves-Ageitos, M., Pérez García-Pando, C., van Noije, T., Le Sager, P., Ito, A., Athanasopoulou, E., Nenes, A., Kanakidou, M., Krol, M. C., and Gerasopoulos, E.: Multiphase processes in the EC-Earth model and their relevance to the atmospheric oxalate, sulfate, and iron cycles, Geosci. Model Dev., 15, 3079–3120, https://doi.org/10.5194/gmd-15-3079-2022, 2022. a
Ndour, M., DÁnna, B., George, C., Ka, O., Balkanski, Y., Kleffmann, J., Stemmler, K., and Ammann, M.: Photoenhanced uptake of NO2 on mineral dust: Laboratory experiments and model simulations, Geophys. Res. Lett., 35, L05812, https://doi.org/10.1029/2007GL032006, 2008. a
Nickovic, S., Vukovic, A., Vujadinovic, M., Djurdjevic, V., and Pejanovic, G.: Technical Note: High-resolution mineralogical database of dust-productive soils for atmospheric dust modeling, Atmos. Chem. Phys., 12, 845–855, https://doi.org/10.5194/acp-12-845-2012, 2012. a, b
Noll, K. E., Jackson, M. M., and Oskouie, A. K.: Development of an Atmospheric Particle Dry Deposition Model, Aerosol Sci. Tech., 35, 627–636, https://doi.org/10.1080/02786820119835, 2001. a
Nousiainen, T. and Kandler, K.: Light scattering by atmospheric mineral dust particles, in: Light Scattering Reviews 9, Springer, 3–52, https://doi.org/10.1007/978-3-642-37985-7_1, 2015. a, b
Nousiainen, T., Kahnert, M., and Lindqvist, H.: Can particle shape information be retrieved from light-scattering observations using spheroidal model particles?, J. Quant. Spectrosc. Ra., 112, 2213–2225, https://doi.org/10.1016/j.jqsrt.2011.05.008, 2011. a
Okada, K., Heintzenberg, J., Kai, K., and Qin, Y.: Shape of atmospheric mineral particles collected in three Chinese arid-regions, Geophys. Res. Lett., 28, 3123–3126, https://doi.org/10.1029/2000GL012798, 2001. a
Ott, D. K. and Peters, T. M.: A Shelter to Protect a Passive Sampler for Coarse Particulate Matter, PM10−2.5, Aerosol Sci. Tech., 42, 299–309, https://doi.org/10.1080/02786820802054236, 2008. a, b, c
Otto, S., Bierwirth, E., Weinzierl, B., Kandler, K., Esselborn, M., Tesche, M., Schladitz, A., Wendisch, M., and Trautmann, T.: Solar radiative effects of a Saharan dust plume observed during SAMUM assuming spheroidal model particles, Tellus B, 61, 270–296, https://doi.org/10.1111/j.1600-0889.2008.00389.x, 2009. a
Otto, S., Trautmann, T., and Wendisch, M.: On realistic size equivalence and shape of spheroidal Saharan mineral dust particles applied in solar and thermal radiative transfer calculations, Atmos. Chem. Phys., 11, 4469–4490, https://doi.org/10.5194/acp-11-4469-2011, 2011. a
Painter, T. H., Deems, J. S., Belnap, J., Hamlet, A. F., Landry, C. C., and Udall, B.: Response of Colorado River runoff to dust radiative forcing in snow, P. Natl. Acad. Sci. USA, 107, 17125–17130, https://doi.org/10.1073/pnas.0913139107, 2010. a
Panta, A., Kandler, K., Alastuey, A., González-Flórez, C., González-Romero, A., Klose, M., Querol, X., Reche, C., Yus-Díez, J., and Pérez García-Pando, C.: Electron microscopy of particles collected by different techniques from field measurements in the Moroccan Sahara during FRAGMENT 2019, Zenodo [data set], https://doi.org/10.5281/zenodo.7649034, 2023. a
Pérez García-Pando, C., Thomson, M. C., Stanton, M. C., Diggle, P. J., Hopson, T., Pandya, R., Miller, R. L., and Hugonnet, S.: Meningitis and climate: from science to practice, Earth Perspectives, 1, 1–15, https://doi.org/10.1186/2194-6434-1-14, 2014. a
Perlwitz, J. P., Pérez García-Pando, C., and Miller, R. L.: Predicting the mineral composition of dust aerosols – Part 1: Representing key processes, Atmos. Chem. Phys., 15, 11593–11627, https://doi.org/10.5194/acp-15-11593-2015, 2015a. a, b, c, d
Perlwitz, J. P., Pérez García-Pando, C., and Miller, R. L.: Predicting the mineral composition of dust aerosols – Part 2: Model evaluation and identification of key processes with observations, Atmos. Chem. Phys., 15, 11629–11652, https://doi.org/10.5194/acp-15-11629-2015, 2015b. a
Petroff, A. and Zhang, L.: Development and validation of a size-resolved particle dry deposition scheme for application in aerosol transport models, Geosci. Model Dev., 3, 753–769, https://doi.org/10.5194/gmd-3-753-2010, 2010. a
Piedra, P. and Moosmüller, H.: Optical losses of photovoltaic cells due to aerosol deposition: Role of particle refractive index and size, Sol. Energy, 155, 637–646, https://doi.org/10.1016/j.solener.2017.06.047, 2017. a
Piskunov, V.: Parameterization of aerosol dry deposition velocities onto smooth and rough surfaces, J. Aerosol Sci., 40, 664–679, https://doi.org/10.1016/j.jaerosci.2009.04.006, 2009. a
Price, H. C., Baustian, K. J., McQuaid, J. B., Blyth, A., Bower, K. N., Choularton, T., Cotton, R. J., Cui, Z., Field, P. R., Gallagher, M., Hawker, R., Merrington, A., Miltenberger, A., Neely III, R. R., Parker, S. T., Rosenberg, P. D., Taylor, J. W., Trembath, J., Vergara-Temprado, J., Whale, T. F., Wilson, T. W., Young, G., and Murray, B. J.: Atmospheric Ice-Nucleating Particles in the Dusty Tropical Atlantic, J. Geophys. Res.-Atmos., 123, 2175–2193, https://doi.org/10.1002/2017JD027560, 2018. a
Pérez, C., Nickovic, S., Pejanovic, G., Baldasano, J. M., and Özsoy, E.: Interactive dust-radiation modeling: A step to improve weather forecasts, J. Geophys. Res., 111, D16206, https://doi.org/10.1029/2005JD006717, 2006. a
Pérez García-Pando, C., Miller, R. L., Perlwitz, J. P., Rodríguez, S., and Prospero, J. M.: Predicting the mineral composition of dust aerosols: Insights from elemental composition measured at the Izaña Observatory, Geophys. Res. Lett., 43, 10520–10529, https://doi.org/10.1002/2016GL069873, 2016. a
Querol, X., Tobías, A., Pérez, N., Karanasiou, A., Amato, F., Stafoggia, M., Pérez García-Pando, C., Ginoux, P., Forastiere, F., Gumy, S., Mudu, P., and Alastuey, A.: Monitoring the impact of desert dust outbreaks for air quality for health studies, Environ. Int., 130, 104867, https://doi.org/10.1016/j.envint.2019.05.061, 2019. a
Reid, E. A., Reid, J. S., Meier, M. M., Dunlap, M. R., Cliff, S. S., Broumas, A., Perry, K., and Maring, H.: Characterization of African dust transported to Puerto Rico by individual particle and size segregated bulk analysis, J. Geophys. Res., 108, 8591, https://doi.org/10.1029/2002JD002935, 2003. a
Reynolds, R. L., Cattle, S. R., Moskowitz, B. M., Goldstein, H. L., Yauk, K., Flagg, C. B., Berquó, T. S., Kokaly, R. F., Morman, S., and Breit, G. N.: Iron oxide minerals in dust of the Red Dawn event in eastern Australia, September 2009, Aeolian Res., 15, 1–13, https://doi.org/10.1016/j.aeolia.2014.02.003, 2014. a
Rocha-Lima, A., Martins, J. V., Remer, L. A., Todd, M., Marsham, J. H., Engelstaedter, S., Ryder, C. L., Cavazos-Guerra, C., Artaxo, P., Colarco, P., and Washington, R.: A detailed characterization of the Saharan dust collected during the Fennec campaign in 2011: in situ ground-based and laboratory measurements, Atmos. Chem. Phys., 18, 1023–1043, https://doi.org/10.5194/acp-18-1023-2018, 2018. a
Rodríguez, S., Prospero, J. M., López-Darias, J., García-Alvarez, M.-I., Zuidema, P., Nava, S., Lucarelli, F., Gaston, C. J., Galindo, L., and Sosa, E.: Tracking the changes of iron solubility and air pollutants traces as African dust transits the Atlantic in the Saharan dust outbreaks, Atmos. Environ., 246, 118092, https://doi.org/10.1016/j.atmosenv.2020.118092, 2021. a
Ryder, C. L., Marenco, F., Brooke, J. K., Estelles, V., Cotton, R., Formenti, P., McQuaid, J. B., Price, H. C., Liu, D., Ausset, P., Rosenberg, P. D., Taylor, J. W., Choularton, T., Bower, K., Coe, H., Gallagher, M., Crosier, J., Lloyd, G., Highwood, E. J., and Murray, B. J.: Coarse-mode mineral dust size distributions, composition and optical properties from AER-D aircraft measurements over the tropical eastern Atlantic, Atmos. Chem. Phys., 18, 17225–17257, https://doi.org/10.5194/acp-18-17225-2018, 2018. a, b, c
Saito, M. and Yang, P.: Advanced Bulk Optical Models Linking the Backscattering and Microphysical Properties of Mineral Dust Aerosol, Geophys. Res. Lett., 48, e2021GL095121, https://doi.org/10.1029/2021GL095121, 2021. a
Sarangi, C., Qian, Y., Rittger, K., Ruby Leung, L., Chand, D., Bormann, K. J., and Painter, T. H.: Dust dominates high-altitude snow darkening and melt over high-mountain Asia, Nat. Clim. Change, 10, 1045–1051, https://doi.org/10.1038/s41558-020-00909-3, 2020. a
Scanza, R. A., Mahowald, N., Ghan, S., Zender, C. S., Kok, J. F., Liu, X., Zhang, Y., and Albani, S.: Modeling dust as component minerals in the Community Atmosphere Model: development of framework and impact on radiative forcing, Atmos. Chem. Phys., 15, 537–561, https://doi.org/10.5194/acp-15-537-2015, 2015. a, b
Scheuvens, D., Kandler, K., Küpper, M., Lieke, K., Zorn, R., Ebert, M., Schütz, L., and Weinbruch, S.: Individual-particle analysis of airborne dust samples collected over Morocco in 2006 during SAMUM 1, Tellus B, 63, 512–530, https://doi.org/10.1111/j.1600-0889.2011.00554.x, 2011. a, b, c, d
Schulz, M., Prospero, J. M., Baker, A. R., Dentener, F., Ickes, L., Liss, P. S., Mahowald, N. M., Nickovic, S., García-Pando, C. P., Rodríguez, S., Sarin, M., Tegen, I., and Duce, R. A.: Atmospheric Transport and Deposition of Mineral Dust to the Ocean: Implications for Research Needs, Environ. Sci. Technol., 46, 10390–10404, https://doi.org/10.1021/es300073u, 2012. a, b
Shao, Y., Wyrwoll, K.-H., Chappell, A., Huang, J., Lin, Z., McTainsh, G. H., Mikami, M., Tanaka, T. Y., Wang, X., and Yoon, S.: Dust cycle: An emerging core theme in Earth system science, Aeolian Res., 2, 181–204, https://doi.org/10.1016/j.aeolia.2011.02.001, 2011. a
Shi, T., He, C., Zhang, D., Zhang, X., Niu, X., Xing, Y., Chen, Y., Cui, J., Pu, W., and Wang, X.: Opposite Effects of Mineral Dust Nonsphericity and Size on Dust-Induced Snow Albedo Reduction, Geophys. Res. Lett., 49, e2022GL099031, https://doi.org/10.1029/2022GL099031, 2022. a
Sokolik, I. N. and Toon, O. B.: Incorporation of mineralogical composition into models of the radiative properties of mineral aerosol from UV to IR wavelengths, J. Geophys. Res.-Atmos., 104, 9423–9444, https://doi.org/10.1029/1998JD200048, 1999. a, b
Sokolik, I. N., Winker, D. M., Bergametti, G., Gillette, D. A., Carmichael, G., Kaufman, Y. J., Gomes, L., Schuetz, L., and Penner, J. E.: Introduction to special section: Outstanding problems in quantifying the radiative impacts of mineral dust, J. Geophys. Res.-Atmos., 106, 18015–18027, https://doi.org/10.1029/2000JD900498, 2001. a
Stockdale, A., Krom, M. D., Mortimer, R. J. G., Benning, L. G., Carslaw, K. S., Herbert, R. J., Shi, Z., Myriokefalitakis, S., Kanakidou, M., and Nenes, A.: Understanding the nature of atmospheric acid processing of mineral dusts in supplying bioavailable phosphorus to the oceans, P. Natl. Acad. Sci. USA, 113, 14639–14644, https://doi.org/10.1073/pnas.1608136113, 2016. a
Strong, J. D. O., Vecchi, G. A., and Ginoux, P.: The Climatological Effect of Saharan Dust on Global Tropical Cyclones in a Fully Coupled GCM, J. Geophys. Res.-Atmos., 123, 5538–5559, https://doi.org/10.1029/2017JD027808, 2018. a
Textor, C., Schulz, M., Guibert, S., Kinne, S., Balkanski, Y., Bauer, S., Berntsen, T., Berglen, T., Boucher, O., Chin, M., Dentener, F., Diehl, T., Easter, R., Feichter, H., Fillmore, D., Ghan, S., Ginoux, P., Gong, S., Grini, A., Hendricks, J., Horowitz, L., Huang, P., Isaksen, I., Iversen, I., Kloster, S., Koch, D., Kirkevåg, A., Kristjansson, J. E., Krol, M., Lauer, A., Lamarque, J. F., Liu, X., Montanaro, V., Myhre, G., Penner, J., Pitari, G., Reddy, S., Seland, Ø., Stier, P., Takemura, T., and Tie, X.: Analysis and quantification of the diversities of aerosol life cycles within AeroCom, Atmos. Chem. Phys., 6, 1777–1813, https://doi.org/10.5194/acp-6-1777-2006, 2006. a
Valentin, C. and Bresson, L.-M.: Morphology, genesis and classification of surface crusts in loamy and sandy soils, Geoderma, 55, 225–245, https://doi.org/10.1016/0016-7061(92)90085-L, 1992. a
van der Does, M., Knippertz, P., Zschenderlein, P., Harrison, R. G., and Stuut, J.-B. W.: The mysterious long-range transport of giant mineral dust particles, Science Advances, 4, eaau2768, https://doi.org/10.1126/sciadv.aau2768, 2018. a
Vasiliou, J. G., Sorensen, D., and McMurry, P. H.: Sampling at controlled relative humidity with a cascade impactor, Atmos. Environ., 33, 1049–1056, https://doi.org/10.1016/S1352-2310(98)00323-9, 1999. a
Waza, A., Schneiders, K., May, J., Rodríguez, S., Epple, B., and Kandler, K.: Field comparison of dry deposition samplers for collection of atmospheric mineral dust: results from single-particle characterization, Atmos. Meas. Tech., 12, 6647–6665, https://doi.org/10.5194/amt-12-6647-2019, 2019. a, b, c
Welti, A., Lohmann, U., and Kanji, Z. A.: Ice nucleation properties of K-feldspar polymorphs and plagioclase feldspars, Atmos. Chem. Phys., 19, 10901–10918, https://doi.org/10.5194/acp-19-10901-2019, 2019. a
Yang, W., Marshak, A., Kostinski, A. B., and Várnai, T.: Shape-induced gravitational sorting of Saharan dust during transatlantic voyage: Evidence from CALIOP lidar depolarization measurements, Geophys. Res. Lett., 40, 3281–3286, https://doi.org/10.1002/grl.50603, 2013. a, b
Yu, H., Chin, M., Yuan, T., Bian, H., Remer, L. A., Prospero, J. M., Omar, A., Winker, D., Yang, Y., Zhang, Y., Zhang, Z., and Zhao, C.: The fertilizing role of African dust in the Amazon rainforest: A first multiyear assessment based on data from Cloud-Aerosol Lidar and Infrared Pathfinder Satellite Observations, Geophys. Res. Lett., 42, 1984–1991, https://doi.org/10.1002/2015GL063040, 2015. a
Yun, J., Link, N., Kumar, A., Shchukarev, A., Davidson, J., Lam, A., Walters, C., Xi, Y., Boily, J.-F., and Bertram, A. K.: Surface Composition Dependence on the Ice Nucleating Ability of Potassium-Rich Feldspar, ACS Earth and Space Chemistry, 4, 873–881, https://doi.org/10.1021/acsearthspacechem.0c00077, 2020. a
Yus-Díez, J., Pandolfi, M., González-Flórez, C., Escribano, J., Gonzalez-Romero, J., Ivančič, M., Rigler, M., Klose, M., Kandler, K., Panta, A., Querol, X., Reche, C., Perez García-Pando, C., and Alastuey, A.: Quantifying variations in multi-wavelength optical properties of freshly-emitted Saharan dust from the Lower Drâa Valley, Moroccan Sahara, in preparation, 2023. a, b, c
Zhang, X. L., Wu, G. J., Zhang, C. L., Xu, T. L., and Zhou, Q. Q.: What is the real role of iron oxides in the optical properties of dust aerosols?, Atmos. Chem. Phys., 15, 12159–12177, https://doi.org/10.5194/acp-15-12159-2015, 2015. a
Zimmermann, F., Weinbruch, S., Schütz, L., Hofmann, H., Ebert, M., Kandler, K., and Worringen, A.: Ice nucleation properties of the most abundant mineral dust phases, J. Geophys. Res.-Atmos., 113, D23204, https://doi.org/10.1029/2008JD010655, 2008. a