the Creative Commons Attribution 4.0 License.
the Creative Commons Attribution 4.0 License.
 | 28 Jun 2023
Measurement report: MAX-DOAS measurements characterise Central London ozone pollution episodes during 2022 heatwaves
Robert G. Ryan
Eleanor Gershenson-Smith
Robbie Ramsay
Jan-Peter Muller
Jan-Lukas Tirpitz
Udo Frieß
Heatwaves are a substantial health threat in the UK, exacerbated by co-occurrence of ozone pollution episodes. Here we report on the first use of retrieved vertical profiles of nitrogen dioxide (NO2) and formaldehyde (HCHO) over Central London from a newly installed multi-axis differential optical absorption spectroscopy (MAX-DOAS) instrument coincident with two of three heatwaves for the hottest summer on record. We evaluate space-based sensor observations routinely used to quantify temporal changes in air pollution and precursor emissions over London. Collocated daily mean tropospheric column densities from the high-spatial-resolution space-based TROPOspheric Monitoring Instrument (TROPOMI) and MAX-DOAS, after accounting for differences in vertical sensitivities, are temporally consistent for NO2 and HCHO (both R = 0.71). TROPOMI NO2 is 27 %–31 % less than MAX-DOAS NO2, as expected from horizontal dilution of NO2 by TROPOMI pixels in polluted cities. TROPOMI HCHO is 20 % more than MAX-DOAS HCHO, greater than differences in past validation studies but within the range of systematic errors in the MAX-DOAS retrieval. The MAX-DOAS near-surface (0–110 m) retrievals have similar day-to-day and hourly variability to the surface sites for comparison of NO2 (R ≥ 0.7) and for MAX-DOAS HCHO versus surface site isoprene (R ≥ 0.7) that oxidises to HCHO in prompt and high yields. Daytime ozone production, diagnosed with MAX-DOAS HCHO-to-NO2 tropospheric vertical column ratios, is mostly limited by availability of volatile organic compounds (VOCs), except on heatwave days. Temperature-dependent biogenic VOC emissions of isoprene increase exponentially, resulting in ozone concentrations that exceed the regulatory standard for ozone and cause non-compliance at urban background sites in Central London. Locations in Central London heavily influenced by traffic remain in compliance, but this is likely to change with stricter controls on vehicle emissions of NOx and higher likelihood of heatwave frequency, severity, and persistence due to anthropogenic climate change.
- Article
(9054 KB) - Full-text XML
- BibTeX
- EndNote


Heatwaves in the UK cause ozone pollution episodes that worsen heat-related premature mortality (Doherty et al., 2009; Johnson et al., 2005; Pattenden et al., 2010; Rooney et al., 1998; Stedman, 2004). In summer 2022, London experienced three heatwaves, declared when surface air temperatures in Greater London exceed 28 ∘C for at least 3 consecutive days (McCarthy et al., 2019). The first heatwave in June (15–17 June) was unusually early (McCabe, 2022); in the July heatwave (16–19 July) London temperatures exceeded 40 ∘C for the first time in century-long temperature measurement records (Kendon, 2022); and more non-COVID-related excess deaths were registered during the August heatwave (11–15 August) than the more intense heatwave in July (ONS and UKHSA, 2022). The extreme heatwave in July was due to an exceptionally high pressure system and clear conditions causing a so-called “heat dome” over the UK (Kendon, 2022). There was also a surge in residential fires during this heatwave due to ideal ignition conditions following a sustained and intense drought in southeast England (London Fire Brigade, 2022).
Ozone is a secondary pollutant formed from photochemical reaction of nitrogen oxides (NOx ≡ NO + NO2) and volatile organic compounds (VOCs). Concentrations of ozone are typically low in London, as cold and cloudy conditions dominate, and NOx emitted by vehicles titrates ozone via its reaction with nitric oxide (NO) (AQEG, 2009). Due to large traffic sources of NOx, ozone production in London is for most of the year limited by availability of VOCs (Jin et al., 2017). This is despite a decline in NOx emissions in Central London of ∼ 3.3 % a−1, according to the London Atmospheric Emissions Inventory (Mayor of London, 2021). Summertime VOC emissions in Central London, diagnosed with field campaign flux and concentration measurements, are mostly from traffic in the morning and evening and biogenic sources in the middle of the day (Valach et al., 2015). Morning enhancements in VOC emissions likely also include volatile chemical products (VCPs) used in consumer products, as suggested by measurements in other large cities in continental Europe (Coggon et al., 2021). During heatwaves, increases in surface ozone result from a combination of downwelling of ozone-rich air from the free troposphere, advection of polluted surface air from continental Europe, faster kinetics from warm temperatures and sunshine, and large enhancement in the reactive biogenic VOC isoprene due to exponential dependence of emissions on temperature (Lee et al., 2006; Sillman and Samson, 1995).
In mid-June 2022, a multi-axis differential optical absorption spectroscopy (MAX-DOAS) instrument was installed on the rooftop of an 11-storey building at the University College London (UCL) Bloomsbury campus, providing measurements during the July and August heatwaves. These are passive UV–visible instruments that measure direct and scattered sunlight by conducting discrete vertical and horizontal scans of the atmosphere (Hönninger et al., 2004). The instrument was deployed to provide long-term tropospheric observations of the vertical distribution and column-integrated concentrations of UV–visible active chemicals over Central London. This includes nitrogen dioxide (NO2), a regulated air pollutant and constraint on precursor emissions of NOx (Martin et al., 2003), and formaldehyde (HCHO), a prompt and high-yield oxidation product of isoprene and ubiquitous oxidation product of almost all other VOCs (Millet et al., 2006).
The MAX-DOAS instrument at UCL also adds a UK site to the existing extensive global network of MAX-DOAS instruments used to evaluate space-based single-daily-overpass UV–visible instruments (De Smedt et al., 2021; Pinardi et al., 2020; van Geffen et al., 2022) and the anticipated Sentinel-4 geostationary instrument that will provide hourly daytime observations over Europe and North Africa (Timmermans et al., 2019). Satellite observations have been vital for understanding air quality over Greater London, in particular trends quantified from the record of observations of 15+ years from the Ozone Monitoring Instrument (OMI) used to assess the impact of emission control measures on air quality and to evaluate the accuracy of bottom-up emissions inventories (Pope et al., 2018; 2022; Vohra et al., 2021). The recently launched TROPOspheric Monitoring Instrument (TROPOMI) achieves higher spatial resolution than OMI and its other predecessors, resolving column concentrations over Central London. Still, TROPOMI is limited to a single piece of vertical information in the troposphere and to a midday snapshot of the atmosphere.
Here we exploit coincidence of the MAX-DOAS instrument with the July and August 2022 heatwaves to evaluate TROPOMI observations of HCHO and NO2 over Central London, characterise ozone pollution episodes during these heatwaves, and assess the efficacy of snapshot measurements from single-overpass space-based instruments in diagnosing ozone production over Central London.
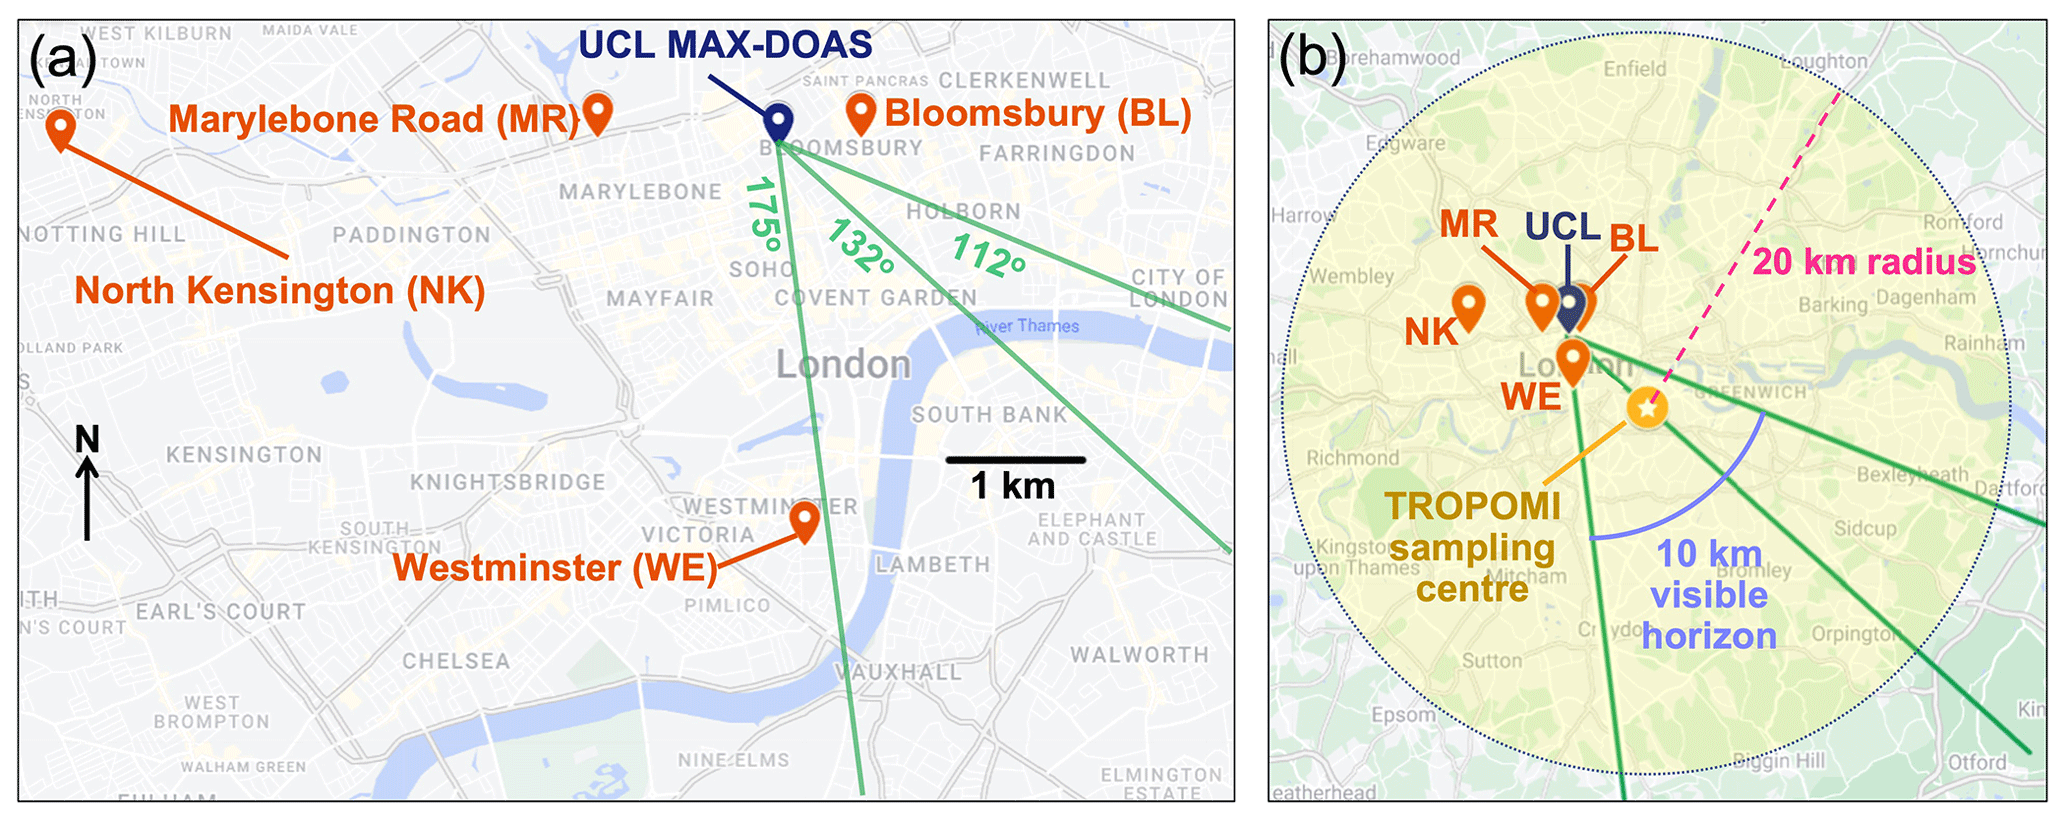
Figure 1Central London MAX-DOAS instrument location. Maps show the MAX-DOAS site on the University College London (UCL) campus (a) and the centre and extent of coincident sampling of the TROPOMI instrument (b). Green lines in (a) and (b) are optimised viewing azimuth angles (see text for details). Red pins in (a) and (b) are nearby surface air quality monitoring sites. In (b), the orange filled circle is the TROPOMI sampling centre, the shaded yellow area the 20 km sampling radius of coincident TROPOMI pixels, and the purple line the 10 km visible horizon of the MAX-DOAS instrument (see text for details). Maps from © Google Maps, 2022.

Figure 2MAX-DOAS colour index () measurements used for azimuth angle optimisation. Intensity ratios at 1∘ (blue circles) and 90∘ (orange circles) elevation angles for a cloud-free horizon scan on 8 July 2022 at 14:15–15:00 UTC. Shaded green boxes indicate unobstructed regions.
2.1 Instrument location and viewing geometry
A SkySpec MAX-DOAS instrument (model SkySpec-2D-210, Airyx GmbH, Germany) has been installed at the 60 m altitude rooftop laboratory on the Bloomsbury campus of UCL at 51.52∘ N, 0.13∘ E (Fig. 1) since mid-June 2022. The instrument has UV (300–410 nm) and visible (410–556 nm) spectrometers, each with 0.6 nm spectral resolution. It is fitted with a temperature sensor that measures ambient temperature every minute and two webcams that image the sky overhead every 8 min. During this measurement period, the UCL MAX-DOAS was configured to measure spectra over a set of positive elevation angles of 1, 2, 3, 5, 10, 20, 40, and 90∘ every 8 min to obtain vertically resolved information from the boundary layer to the free troposphere. Since mid-December 2022, two negative elevation angles (−2∘, −1∘) have been added to the measurement sequence to enhance retrieval of atmospheric composition below 60 m. We briefly assess the effect of these negative elevation angles on retrieval of HCHO and NO2 in Sect. 3.2.
In addition to sampling vertically, the instrument samples horizontally by scanning discrete viewing azimuth angles. The horizon to the north and west is obstructed by rooftop infrastructure. To the south and east, tall buildings along the London skyline may obscure scans at low elevation angles, necessitating that we identify azimuth angles with an unobstructed view of the horizon. On a cloud-free day (8 July 2022), we scanned the horizon from 90∘ to 181∘ at 14:15–15:00 UTC using the horizon scan setting of the instrument. This measures spectra in 1∘ azimuth increments faster and at fewer elevation angles (1, 2, 4, 90∘) than the standard measurement setting. Figure 2 shows colour indices or spectral intensity ratios at 330 to 404 nm () for 1 and 90∘ elevation angles. We use this ratio, as the light intensity in the visible is sensitive to changes in sky colour resulting from interception by buildings and the ratio of the two normalises for atmospheric variability. Such an approach has been used to infer the presence of clouds along the instrument viewing path (Gielen et al., 2014; Ryan et al., 2018; Wagner et al., 2014; Wagner et al., 2016). The variability in at a 90∘ elevation angle, due only to changes in light intensity over the time and horizon sampled, is < 0.03. Given this, we identify azimuth angle windows at a 1∘ elevation angle with variability < 0.03 and select the centres of these (112, 132, and 175∘; Fig. 1). We use these from 9 July onward and the azimuth angles selected prior to optimisation (135, 180∘) for 1–8 July.
Table 1Cross-section fittings for retrieving NO2, HCHO, and O4 differential slant column densities (dSCDs).
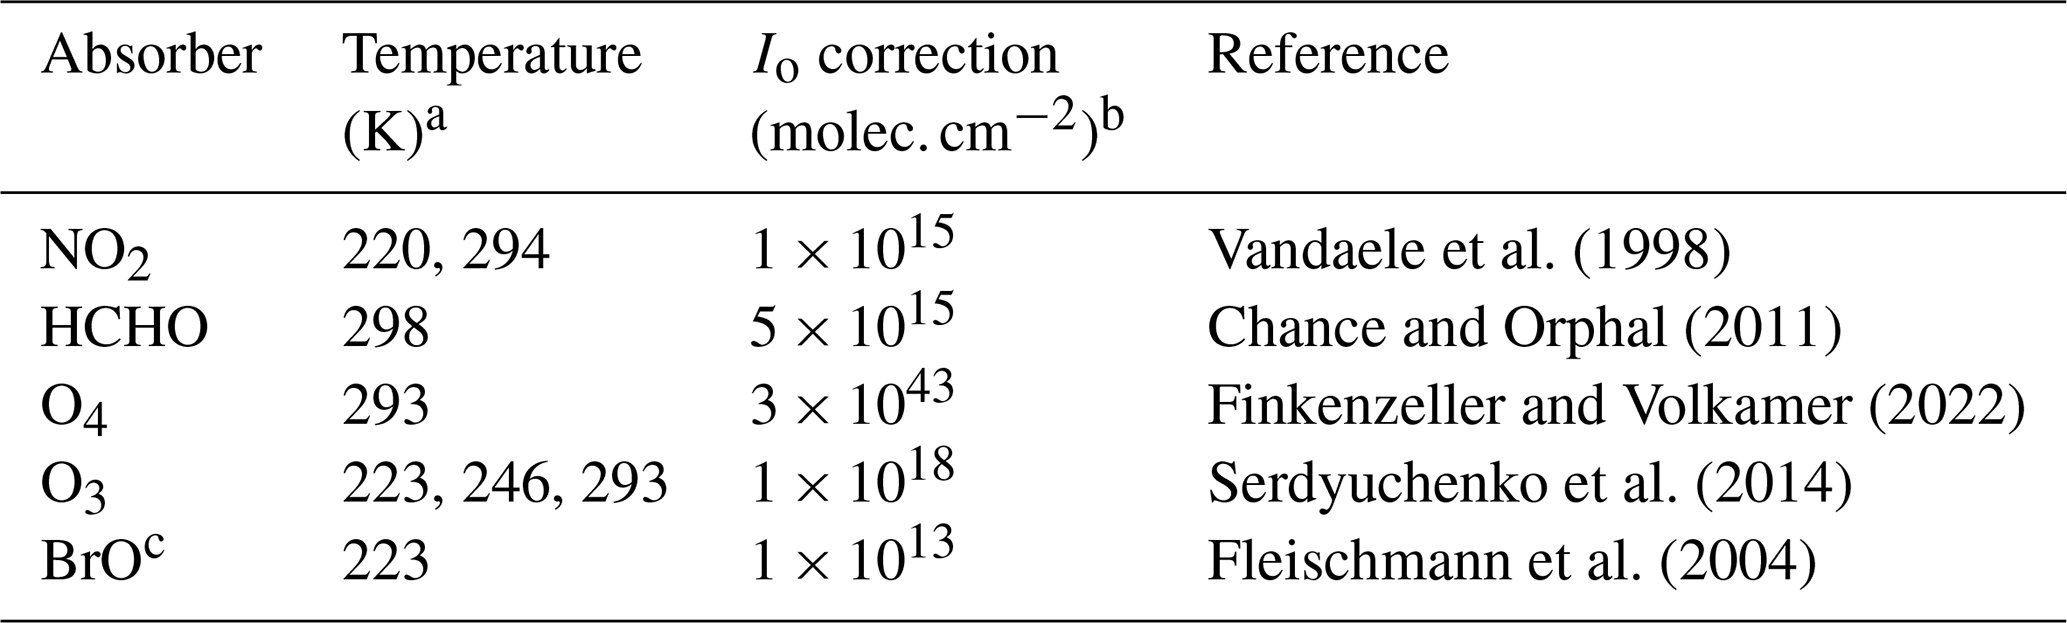
a Temperatures used for cross-section fit. More than one temperature given for trace gases with substantial contribution from the warm troposphere, cold upper troposphere, and stratosphere. b Solar reference intensity (Io) correction. c Bromine monoxide.
2.2 Vertical profile retrieval
MAX-DOAS retrievals follow two major steps to estimate vertical concentrations of trace gases. Column concentrations along the viewing path at each elevation angle (differential slant column densities or dSCDs) are first obtained using the DOAS Intelligent System (DOASIS) proprietary software (Kraus, 2006). DOASIS is founded on a long heritage of MAX-DOAS retrieval algorithm development first described by Platt and Stutz (2008). The software corrects the raw spectra for dark current, electronic offset, and stray light and convolves spectral cross sections of the analysed trace gases with the slit function of the instrument. Optimised wavelength ranges are 338–370 nm for NO2 and the O2–O2 dimer (O4), as recommended following a recent MAX-DOAS intercomparison campaign (Kreher et al., 2020), and 324.5–359 nm for HCHO, as this yields lower relative dSCD fit errors than the other commonly used fit range of 336–359 nm (Ryan et al., 2020b). O4 is used to constrain aerosol impacts on the atmospheric light path. Ozone also absorbs in the UV, but MAX-DOAS observations of ozone include large interference from the stratosphere that is challenging to remove (Wang et al., 2018). The DOASIS dSCD retrieval uses a third-order polynomial with a first-order offset to correct for broadband extinction by Rayleigh scattering and instrumental features such as spectrometer stray light. Also included in the dSCD fit are terms to account for the Ring effect (Grainger and Ring, 1962) modelled using the approach detailed in Wagner et al. (2009) and absorption by other trace gases in the NO2 and HCHO fitting windows. Additional cross-section fitting parameters of target trace gases (HCHO, NO2, O4) and other absorbing gases are in Table 1. Further details of the DOAS fit parameters used by DOASIS are in Kreher et al. (2020).
We determine the detection limits (DLs) of individual dSCDs for each trace gas as follows:
where σmax is the maximum value of the absorption cross section of each trace gas and rms is the root mean square of the fit residuals (Peters et al., 2012). Values of σmax are 1.0 × 10−42 for O4 (Finkenzeller and Volkamer, 2022), 8.4 × 10⁻¹⁹ for NO2 (Vandaele et al., 1998), and 1.3 × 10⁻¹⁹ for HCHO (Chance and Orphal, 2011).
The second retrieval step estimates vertical profiles of aerosol extinction, NO2, and HCHO using the recently developed Retrieval of Atmospheric Parameters from Spectroscopic Observations using DOAS Instruments (RAPSODI) algorithm (Tirpitz, 2021; Tirpitz et al., 2022). Compared to predecessor algorithms, RAPSODI retrieves multiple species at different wavelengths simultaneously in a shared model atmosphere. In so doing, it accounts for cross-correlations and synergistic information that improves inversion accuracy. RAPSODI uses optimal estimation with the Vector Linearized Discrete Ordinate Radiative Transfer (VLIDORT) model (Spurr, 2008, 2006) as the forward model. Vertical profiles are retrieved on a grid that includes 25 layers extending from 0 to 8 km altitude above ground level with a vertical resolution that decreases with altitude from 50 m in the lowest layer to 1 km in the top layer. Negative viewing elevations were not added to the measurement sequence until December 2022 and the top altitude of the lowest retrieval layer is above the instrument, so sensitivity to altitudes below the instrument is low. As a result, we use near-surface (0–110 m) NO2 and HCHO from MAX-DOAS obtained as the mean of the two lowest retrieval layers. The corresponding near-surface error is obtained by adding the errors in these two layers in quadrature.
Optimal estimation is ill-constrained and so requires an initial guess (a priori) of the vertical distribution of aerosols, NO2, and HCHO to determine the maximum likelihood of the atmospheric state by minimising a cost function, given the observed dSCDs at each elevation angle (Rodgers, 2000). Instead of using fixed a priori profiles of NO2 and HCHO, the default option in RAPSODI, we simulate hourly mean profiles with the GEOS-Chem chemical transport model version 13.0.0 (The International GEOS-Chem User Community, 2021) nested over Greater London (49.25–59.50∘ N, 9.375∘ W–3.75∘ E) at 0.25∘ × 0.3125∘ horizontal resolution. Three-hourly boundary conditions are from a global simulation at 4∘ × 5∘ resolution. The model is driven with NASA GEOS FP assimilated meteorology and uses anthropogenic emissions from the UK National Atmospheric Emissions Inventory as detailed in Marais et al. (2021a) and Kelly et al. (2023). Natural emissions of biogenic VOCs, precursors of HCHO, are from the Model of Emissions of Gases and Aerosols from Nature (MEGAN) version 2.1 (Guenther et al., 2012). Model vertical profiles are sampled from the grid box coincident with the MAX-DOAS location (grid-box centre of 51.5∘ N, 0.0∘ E) and interpolated onto the MAX-DOAS vertical retrieval grid. To capture diurnal variability in NO2 and HCHO and dampen influence of day-to-day variability in the model on the retrieval, a priori profiles are averaged into hourly monthly means for July, August, and September. We test the effect of using dynamic a priori profiles from GEOS-Chem on the final retrieved values by comparison to vertical profiles obtained with fixed a priori profiles provided with RAPSODI. The latter are exponential profiles with surface concentrations of 3.9 ppbv for both NO2 and HCHO that decay with altitude with a scale height of 1 km. Surface daytime values from GEOS-Chem on the RAPSODI grid range from 1.6–10.4 ppbv for NO2 and 0.6–1.2 ppbv for HCHO.
The influence of aerosols on light is determined by RAPSODI using the Henyey–Greenstein approximation for Mie scattering, as this offers a computationally efficient alternative to explicitly invoking Mie theory (Tirpitz et al., 2022). Due to availability of measurements of aerosol optical depth (AOD) at a long-term NASA AERONET site at Bayfordbury Observatory, we use a climatology of AOD to derive a priori aerosol extinction vertical profiles rather than using GEOS-Chem. The Bayfordbury Observatory is 35 km north of UCL. There is also an instrument measuring AOD as part of the AERONET network on the UCL rooftop, but the record is too short-term and intermittent (2009, 2010, 2021, 2022) to be representative of a climatological mean. We find that at Bayfordbury daily mean AODs at 340 nm are consistent with AOD at UCL for coincident observations from July 2021 to July 2022 (Pearson's correlation coefficient, R, of 0.94 and mean difference < 10 %), supporting its use. We derive aerosol extinction profiles assuming a typical exponential decline in aerosol extinction with altitude determined using a scale height of 1 km (Tirpitz et al., 2022) and multiyear (2011–2022) mean integrated AOD of 0.23. We assume a priori uncertainties of 75 % for NO2 and HCHO and 50 % for aerosols. The a priori correlation coefficient between each layer decreases exponentially with vertical separation, assuming a scale length of 1 km.
The retrieval also requires knowledge of surface albedo at the site. For this, we use monthly mean surface albedo climatology from the Moderate Resolution Imaging Spectroradiometer (MODIS) gridded 500 m resolution level-3 UV–visible band (300–500 nm) product. We sample data for July–September over London using the NASA Earthdata subsetting tool (ORNL DAAC, 2022). Values are 0.060 ± 0.007 for July–August and 0.061 ± 0.005 for September.
The optimal estimation solution includes an averaging kernel matrix that provides a measure of the sensitivity of the retrieved profile to the true atmospheric state in each layer. The trace of the averaging kernel matrix is the degrees of freedom for signal (DOFS) or the number of independent pieces of information in the retrieved profile. We use the DOFS to remove retrievals with limited information from the observations. These are identified as MAX-DOAS vertical column retrievals with integrated DOFS < 1 and MAX-DOAS near-surface retrievals with summed DOFS in the two lowest layers < 0.2. This discards very few of the retrieved columns (2 %) and the near-surface NO2 (0.1 %), whereas 15 % of near-surface HCHO retrievals are removed.
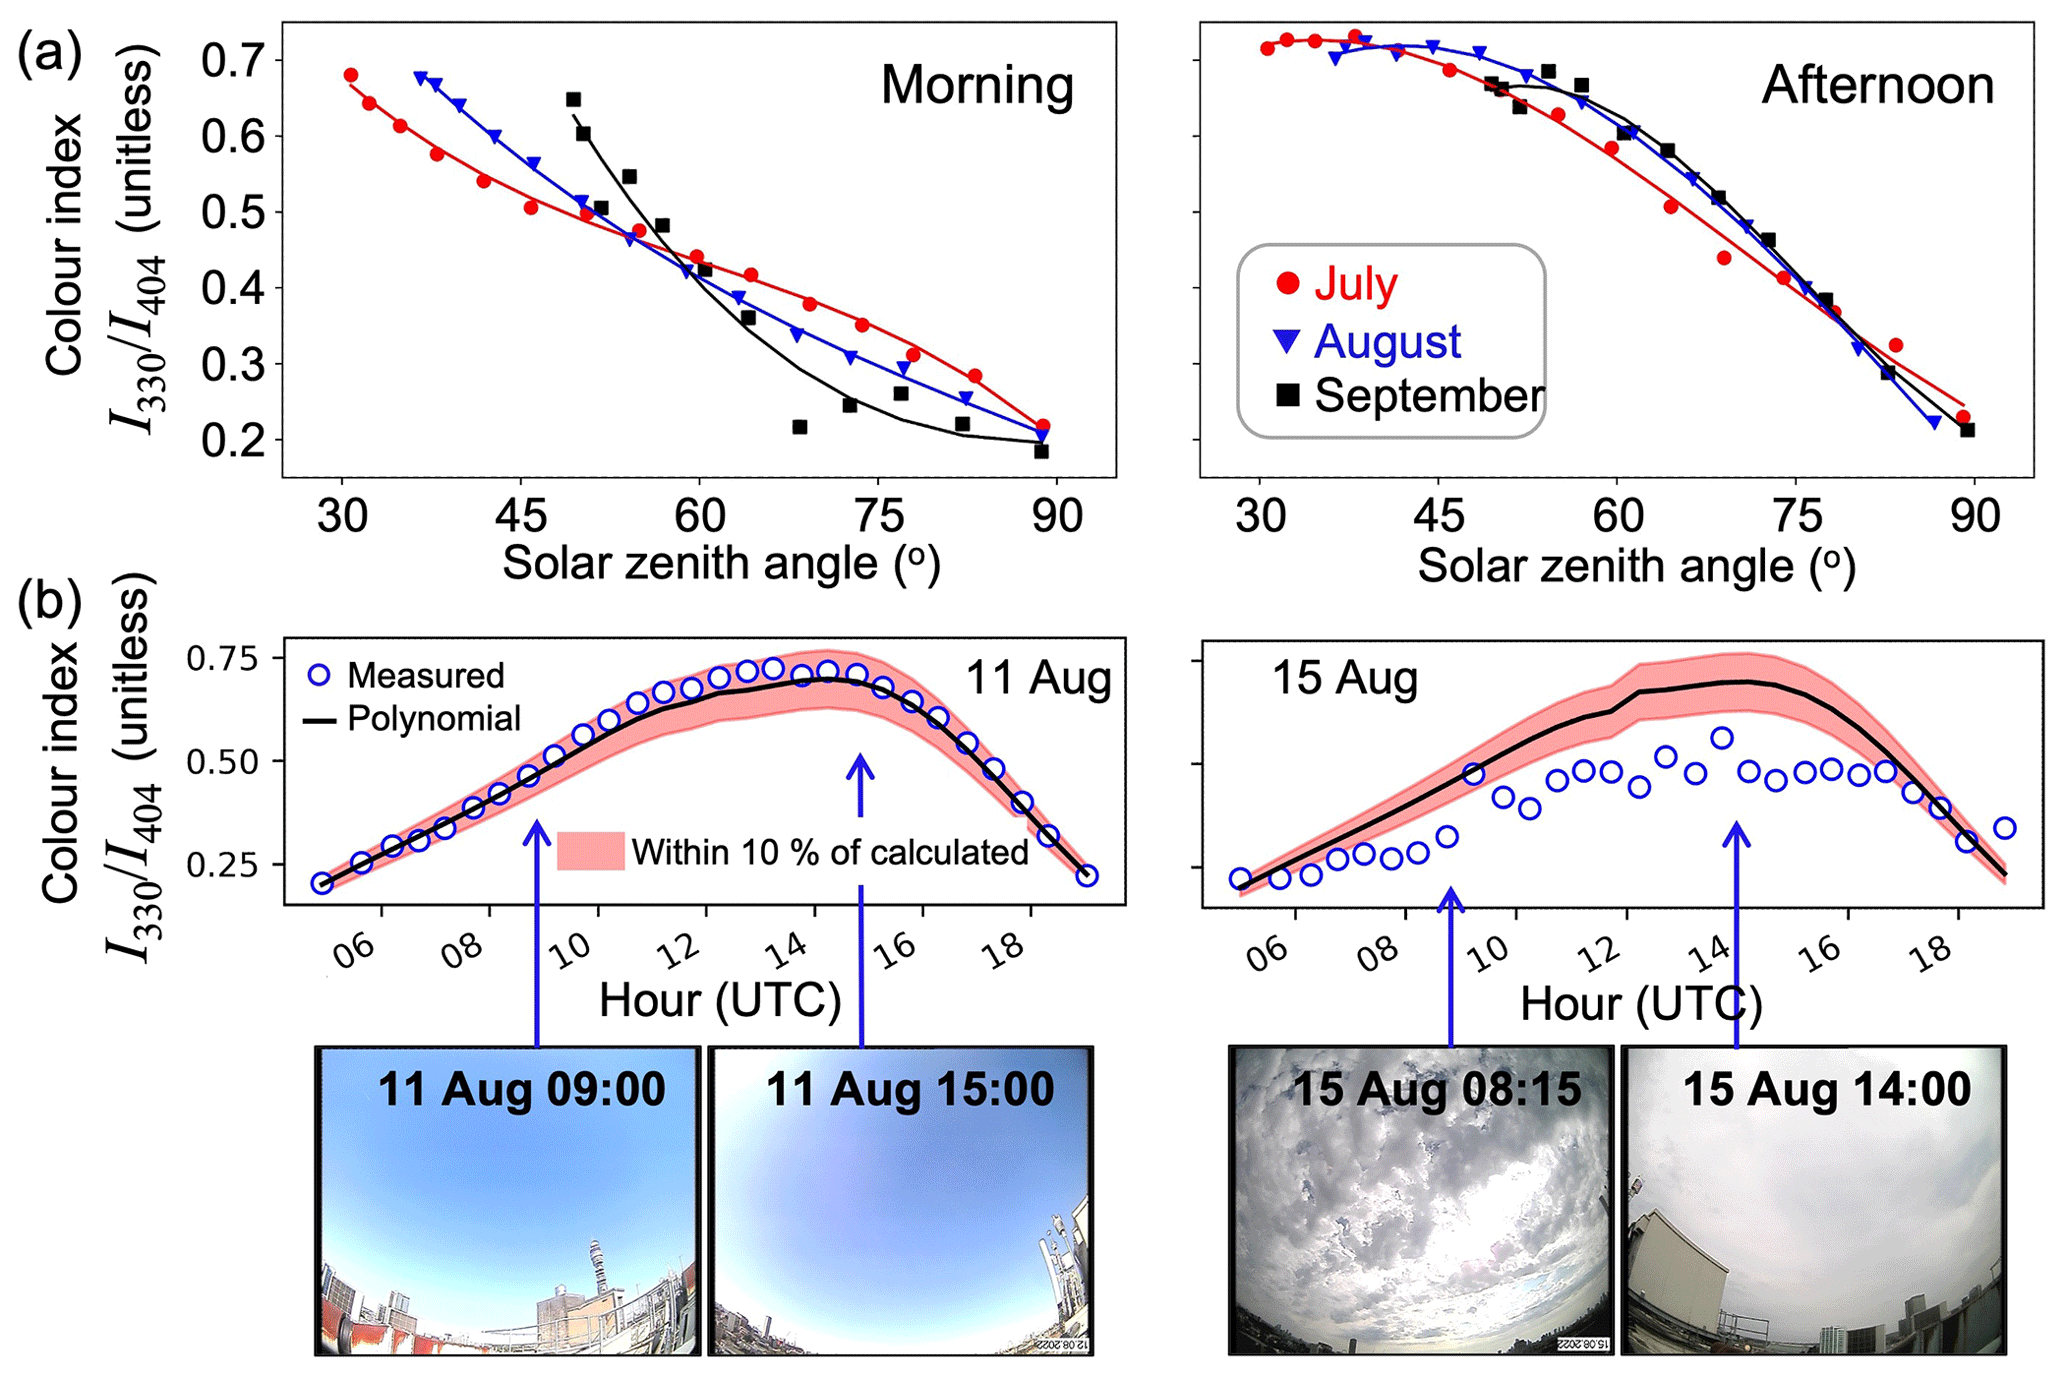
Figure 3Qualitative cloud detection. Panels are morning (left) and afternoon (right) cloud-free colour indices () versus the solar zenith angle (SZA) in July (red), August (blue), and September (black) (a) and diurnal variability in colour indices () on a cloud-free day and a cloudy day in August (b). In (a), symbols are individual measurements and lines are third-order polynomial fits. Black lines in (b) are the cloud-free polynomials from (a) for August, peach shading indicates ± 10 % range from the fit, and open blue circles are individual measurements on 11 (left) and 15 (right) August. Inset camera images show representative sky conditions for each day.
2.3 Qualitative cloud detection
Clouds may induce errors in the retrieval, as these alter the atmospheric light path over the frequently cloudy London sky. We use the colour index to qualitatively identify cloudy scenes, as has been done before (Gielen et al., 2014; Ryan et al., 2018; Wagner et al., 2014, 2016). We first determine the relationship between and the solar zenith angle (SZA) on cloud-free days in each month by visual inspection of the camera images. These include 16 and 18 July and 7 and 10–13 August. There were no completely cloud-free days in September, so we were limited to using measurements on 17 September when there were scattered clouds. Figure 3a shows the relationship between colour indices and SZA for individual observations on the selected days at a 112∘ azimuth angle and 20∘ elevation angle. We use 20∘ as it samples more representative whole-sky conditions than lower elevation angles. We calculate separate third-order polynomial fits for the morning and afternoon in each month, as the azimuth angle is not due south, so the relationship between and SZA is asymmetric across the day. Colour indices in the morning of 17 September deviate from the polynomial fit due to the presence of scattered clouds.
In Fig. 3b we show sensitivity of to clouds over Central London by comparing a cloud-free and a cloudy day in August to the Fig. 3a fit for August. Values on the cloud-free day (11 August) are well within 10 % of the fit, as expected, as this is one of five dates in August used to derive the fit. Cloudy skies on 15 August, confirmed with the camera images, deviate by more than 10 % from the fit. We identify clouds as colour indices that differ from the cloud-free fit by at least 10 % and assess the influence on HCHO and NO2 profile retrievals. This approach will be least effective at detecting clouds in the early morning and late afternoon when the intensity at 404 nm is weak, as is apparent in Fig. 3b.
2.4 Collocated satellite and surface air quality observations
Global observations of tropospheric columns of NO2 and total columns of HCHO are available from the space-based nadir-viewing UV–visible TROPOMI instrument on the Sentinel-5P satellite. Sentinel-5P was launched into low-Earth orbit on 13 October 2017 and passes overhead each day at about 13:30 LST (local solar time). TROPOMI has a ground pixel size of 5.5 × 3.5 km at nadir (Verhoelst et al., 2021) and a swath width of 2600 km, resulting in daily global coverage. We use the offline (OFFL) data products for NO2 (v2.03.01) and HCHO (v2.04.01). MAX-DOAS trace gas retrievals are sampled within 1.5 h of the satellite overpass time.
TROPOMI pixel centres are commonly sampled 0.2∘ around the geographic coordinates of MAX-DOAS instruments for intercomparison of the two (Marais et al., 2021b; Pinardi et al., 2020; Ryan et al., 2020b). Instead, we use a location roughly halfway between the MAX-DOAS instrument and the visible horizon to account for its southeast viewing direction (Fig. 1). The visible horizon at wavelengths relevant to HCHO and NO2 varies between 10 and 15 km (Ortega et al., 2015), so we select a location 6 km from the MAX-DOAS site along the central 132∘ azimuth at 51.49∘ N, 0.07∘ E and sample TROPOMI pixel centres 0.2∘ (∼ 20 km) around this point. This location falls within the GEOS-Chem grid sampled for the a priori in the MAX-DOAS retrievals (Sect. 2.2). We average MAX-DOAS vertical profiles at all viewing azimuth angles, account for differences in vertical sensitivity between the two instruments by smoothing MAX-DOAS vertical profiles with the TROPOMI averaging kernels (Dimitropoulou et al., 2020; Rodgers and Connor, 2003), and integrate the smoothed profiles to calculate MAX-DOAS vertical columns. MAX-DOAS profiles inherit TROPOMI values from above the MAX-DOAS retrieval ceiling (8 km) due to this smoothing. We rely on data quality flags in the TROPOMI data products to filter for cloudy scenes. Data are removed with quality assurance flag < 0.75 for NO2 and with quality assurance flag < 0.5 for HCHO. This removes scenes with cloud radiance fraction ≥ 0.5 and poor-quality retrievals (De Smedt et al., 2021; Verhoelst et al., 2021).
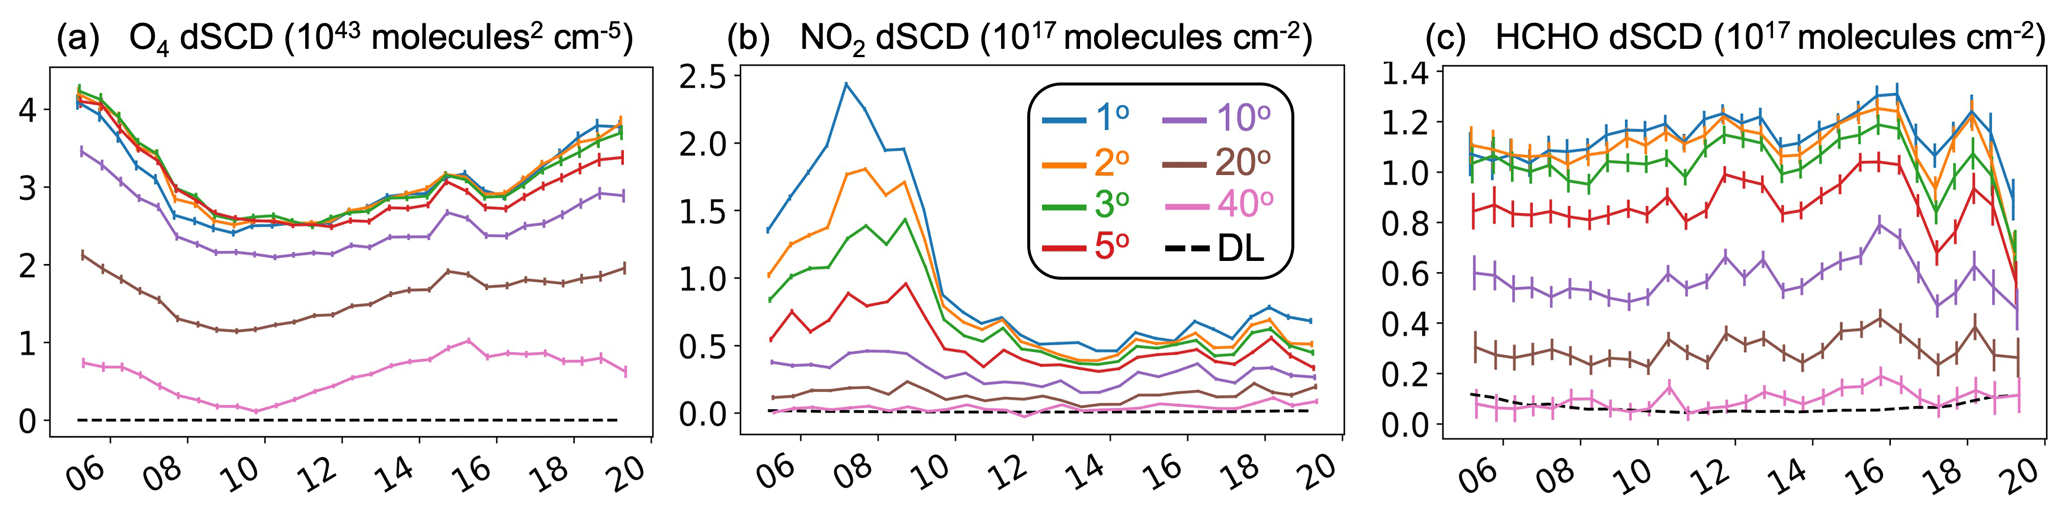
Figure 4Time series of O4, NO2, and HCHO differential slant column densities (dSCDs) on 18 July 2022. DOASIS-retrieved dSCDs of O4 (a), NO2 (b), and HCHO (c) at 1∘ (blue), 2∘ (orange), 3∘ (green), 5∘ (red), 10∘ (mauve), 20∘ (brown), and 40∘ (pink) elevation angles at the 132∘ azimuth angle (Fig. 1). Error bars are dSCD uncertainties. Dashed black lines are detection limits (DLs) at 1∘ elevation (see text for details).
There are no permanent surface air quality sites within 10 km of the MAX-DOAS instrument along its line of sight, but there are four sites within 6 km of the instrument location. These are Westminster, Bloomsbury, North Kensington, and Marylebone Road (Fig. 1). All are part of the national Automatic Urban and Rural Network (AURN), and all except Marylebone Road are classified as urban background sites. The Westminster site is in a mixed commercial and residential district 17 m from the nearest road, Bloomsbury is surrounded by a congested two-lane road, and North Kensington is in the grounds of a school 5 m from a quiet residential road. Marylebone Road, an urban traffic site 1 m from a frequently congested six-lane road, also measures the HCHO precursor VOC isoprene as part of the UK Automatic Hydrocarbon Network. Measurements are hourly means of NO2 at all urban background sites, ozone at Bloomsbury and North Kensington, and isoprene at Marylebone Road. The isoprene measurements have intermittent data gaps. Almost 24 h is missing during the July heatwave (17:00 on 18 July to 14:00 on 19 July; all times are in UTC). To fill these gaps in data, we derive isoprene concentrations using the strong (R = 0.83) linear relationship between hourly July–October isoprene measurements at Marylebone Road and at Eltham, a suburban background site 16 km southeast of the MAX-DOAS. The linear relationship we fit to the isoprene measurements (in ppbv) is orthogonal distance regression: isopreneMarylebone = (0.23 ± 0.004) × isopreneEltham . All surface air quality data were downloaded from the UK Air Information Resource website (DEFRA, 2023). NO2 is also available at Marylebone Road, but mean NO2 in July–September 2022 at this site is 2.5 times more than the mean of the other sites due to large local traffic NOx emissions. We compare the surface air quality measurements to MAX-DOAS near-surface (0–110 m) HCHO and NO2 mixing ratios averaged over all three azimuth angles (Fig. 1).
3.1 MAX-DOAS differential slant column density retrievals
Figure 4 shows a sample of DOASIS-retrieved dSCDs of O4, NO2, and HCHO on 18 July 2022 at all elevation angles below 90∘. The most recent 90∘ (zenith) spectrum serves as a reference (Leser et al., 2003). Hourly variations in dSCDs are a function of the atmospheric light path length and trace gas concentration. Longer light paths at lower elevation angles and in the morning and evening cause larger dSCDs in all three trace gases. Greater abundance of these trace gases in the boundary layer contributes to a decline in dSCDs with elevation angle. NO2 peaks in the morning and to a lesser extent in the late afternoon and is at a minimum at midday at all elevation angles below 10∘, whereas HCHO is relatively constant throughout the day at all elevation angles. We interpret diurnal variability in MAX-DOAS vertical column retrievals of NO2 and HCHO in Sect. 3.3. Uncertainties in the dSCDs calculated by DOASIS are relatively small (< 5 %) for all three trace gases. This is as expected for urban MAX-DOAS NO2 and O4 (Dimitropoulou et al., 2020; Ortega et al., 2015), but it is lower than is typical of urban MAX-DOAS HCHO (Benavent et al., 2019; Heckel et al., 2005; Ryan et al., 2020b). This may be because HCHO dSCDs in Central London are 3 times larger than those over Melbourne, Australia, in Ryan et al. (2020b) and due to differences in HCHO wavelength ranges used by Heckel et al. (2005) and Benavent et al. (2019).
Also in Fig. 4 are DLs of each trace gas at 1∘ elevation (Eq. 1). Mean rms values for O4, HCHO, and NO2 fitting windows across the whole period are 4 × 10⁻⁴. The DLs in Fig. 4 represent maximum values, as there is lower signal (less UV light) at low elevations, leading to relatively large residual rms values. The larger relative uncertainties in HCHO dSCDs lead to relatively large DLs for HCHO, evident in Fig. 4c in the early morning and late afternoon when relatively weak light intensity causes larger rms values. The mean DLs are 9.3 × 1038 for O4, 1.1 × 10¹⁵ for NO2, and 6.5 × 10¹⁵ for HCHO. All dSCDs on 18 July exceed the DLs, and this is typical of the other days in the measurement period.
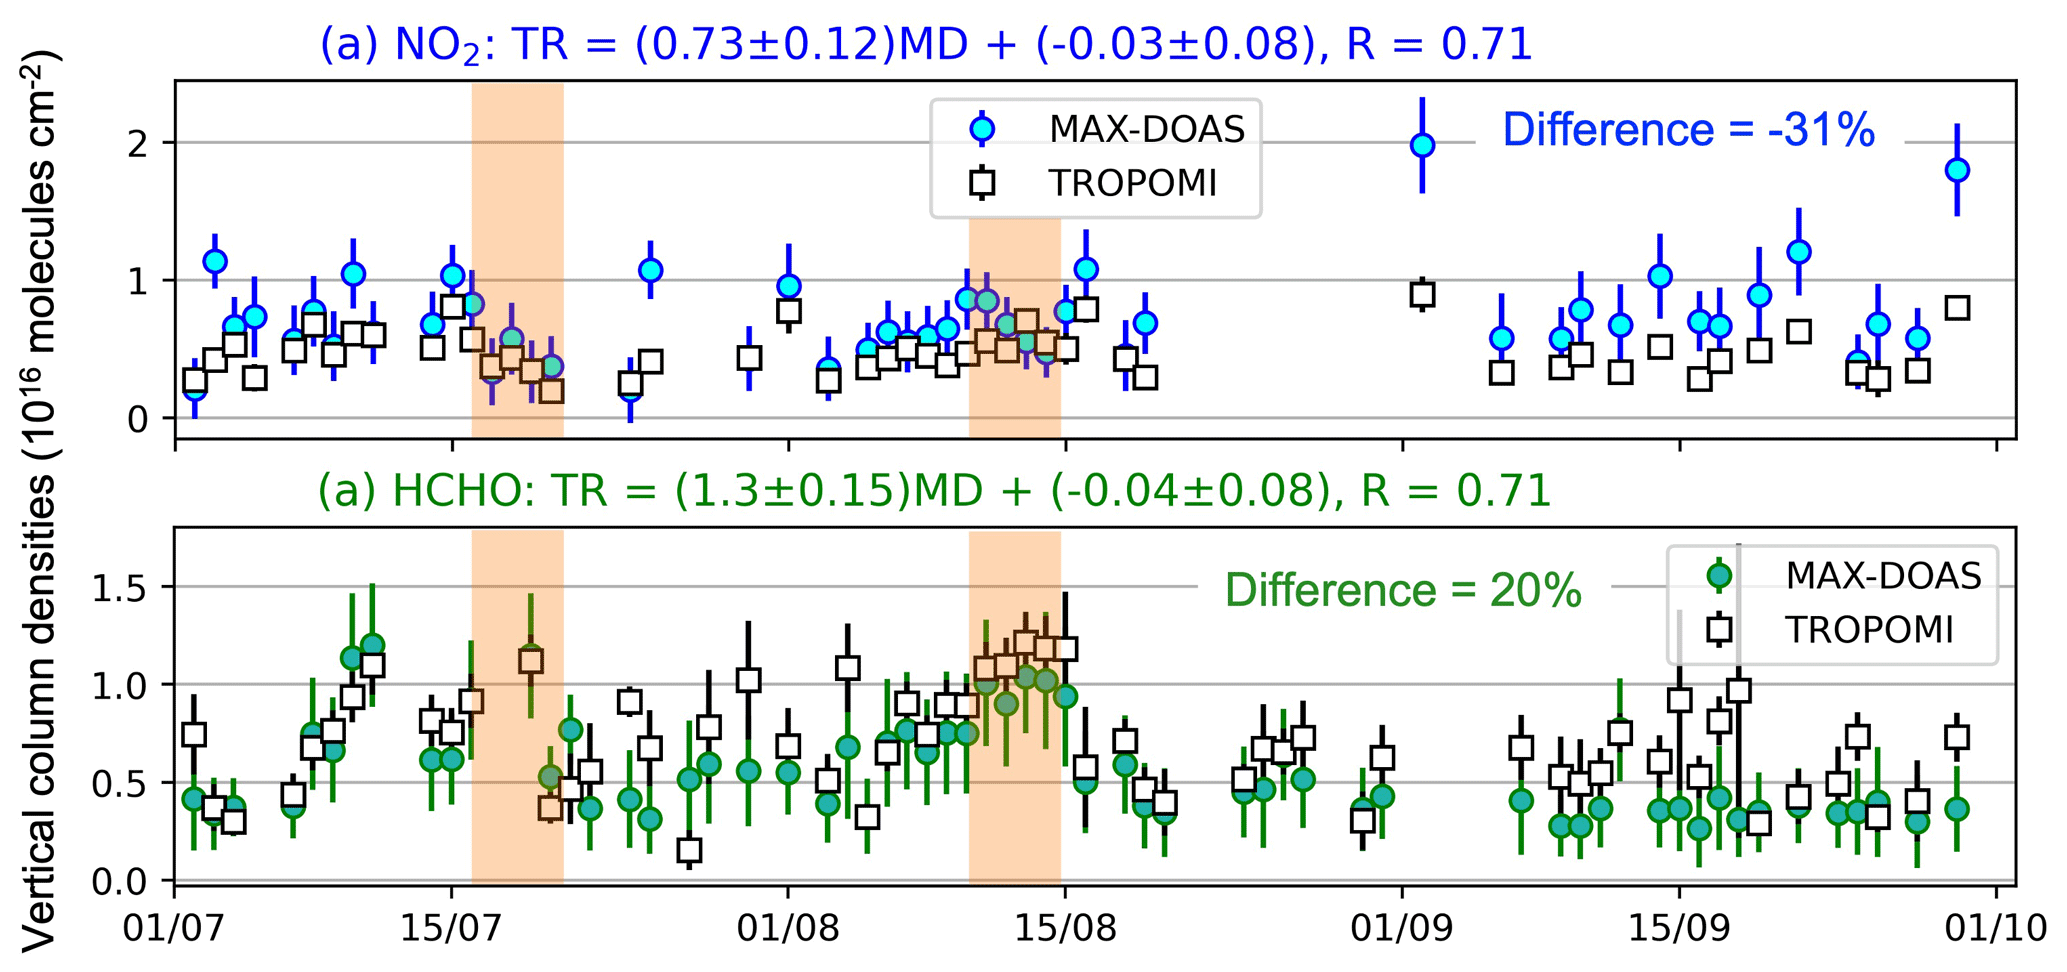
Figure 5Comparison of TROPOMI and MAX-DOAS over Central London in July–September 2022. Panels compare coincident NO2 (a) and HCHO (b) tropospheric vertical column densities from TROPOMI (open squares) and from MAX-DOAS smoothed with TROPOMI averaging kernels (filled circles). Error bars are retrieval uncertainties added in quadrature. Text above each panel gives the orthogonal distance regression of TROPOMI (TR) versus MAX-DOAS (MD), as well as Pearson's correlation coefficient (R). Text in each panel is the median relative difference (TROPOMI minus MAX-DOAS). Heatwave periods are shaded orange.
3.2 MAX-DOAS comparison to TROPOMI
Figure 5 compares coincident MAX-DOAS and TROPOMI NO2 and HCHO tropospheric vertical column densities. The TROPOMI cloud detection and retrieval quality flag filtering (Sect. 2.4) removes 43 of the 92 d in the comparison period for NO2 and 31 for HCHO. Larger errors in TROPOMI HCHO than TROPOMI NO2 daily means, obtained by adding reported retrieval uncertainties in quadrature, are due to relatively large uncertainty in individual columns (on average ∼ 6 × 10¹⁵ ) and fewer coincident pixels each day for HCHO (typically 18) than NO2 (typically 48). TROPOMI sensitivity peaks in the upper troposphere, whereas MAX-DOAS sensitivity typically peaks at or near the surface (De Smedt et al., 2021; Dimitropoulou et al., 2020). As a result of these differences in sensitivity and because NO2 and HCHO concentrations peak in the boundary layer over polluted cities, smoothing MAX-DOAS with the TROPOMI averaging kernels decreases the MAX-DOAS columns by ∼ 26 % for NO2 and ∼ 48 % for HCHO. The greater decline in MAX-DOAS HCHO than NO2 suggests weaker sensitivity of TROPOMI to boundary-layer HCHO than to NO2 over Central London. The information content of TROPOMI is also limited to one piece of vertical information. DOFS for TROPOMI are typically ∼ 1 for NO2 and HCHO, whereas MAX-DOAS DOFS are ∼ 3 for NO2 and ∼ 2 for HCHO for coincident observations in Fig. 5. Addition of negative angles will further enhance MAX-DOAS DOFS. Preliminary retrievals of NO2 in March 2023 at the 112∘ azimuth angle suggest a 0.4–0.6 increase in DOFS at midday when TROPOMI passes overhead.
TROPOMI and MAX-DOAS NO2 and HCHO in Fig. 5 are temporally consistent (R = 0.71 for both). Both also capture the steep increase in HCHO in the August heatwave of 43 % from 6 to 11 August for MAX-DOAS and 65 % for TROPOMI. The increase is likely due to an increase in biogenic emissions with warming that we investigate further with the surface air quality network measurements in the next section. During the comparison period, TROPOMI is on median 31 % less than MAX-DOAS for NO2 and 20 % more than MAX-DOAS for HCHO. The regression statistics indicate that the difference is because TROPOMI exhibits less variance in NO2 than MAX-DOAS (slope = 0.73 ± 0.12) and more variance in HCHO than MAX-DOAS (slope = 1.30 ± 0.15). The statistics are relatively unaffected by increasing the 3 h sampling time window to 5 h. A robust assessment of the effect of narrowing the sampling extent of TROPOMI to 0.1∘, as in Pinardi et al. (2020), is not possible, as our measurement period is brief and so will be affected by a decline in the number of coincident days from 49 to 38 for NO2 and 61 to 45 for HCHO.
TROPOMI low bias in NO2 is consistent with other global and regional intercomparison studies over cities (Chan et al., 2020; Dimitropoulou et al., 2020; Verhoelst et al., 2021; Wang et al., 2020). These studies used earlier versions of the TROPOMI NO2 data product that underestimates cloud top pressure of low-altitude clouds, contributing to a low bias in NO2 over polluted regions. This is addressed in the version we use and, as shown by van Geffen et al. (2022), reduces the negative bias in comparison to the global network of MAX-DOAS instruments over urban areas from 32 % to 23 % (Lambert et al., 2021; van Geffen et al., 2022). The difference over Central London is more consistent with the earlier product versions, although this is sensitive to the two MAX-DOAS columns on 3 August and 27 September that are 2 times more than TROPOMI. The difference after excluding these points improves to −27 %. In Central London, mean NO2 at road traffic sites is almost 3 times more than mean NO2 at urban background sites (Harrison et al., 2021), so horizontal dilution of NO2 by TROPOMI pixels likely exacerbates the discrepancies between TROPOMI and MAX-DOAS (Pinardi et al., 2020).
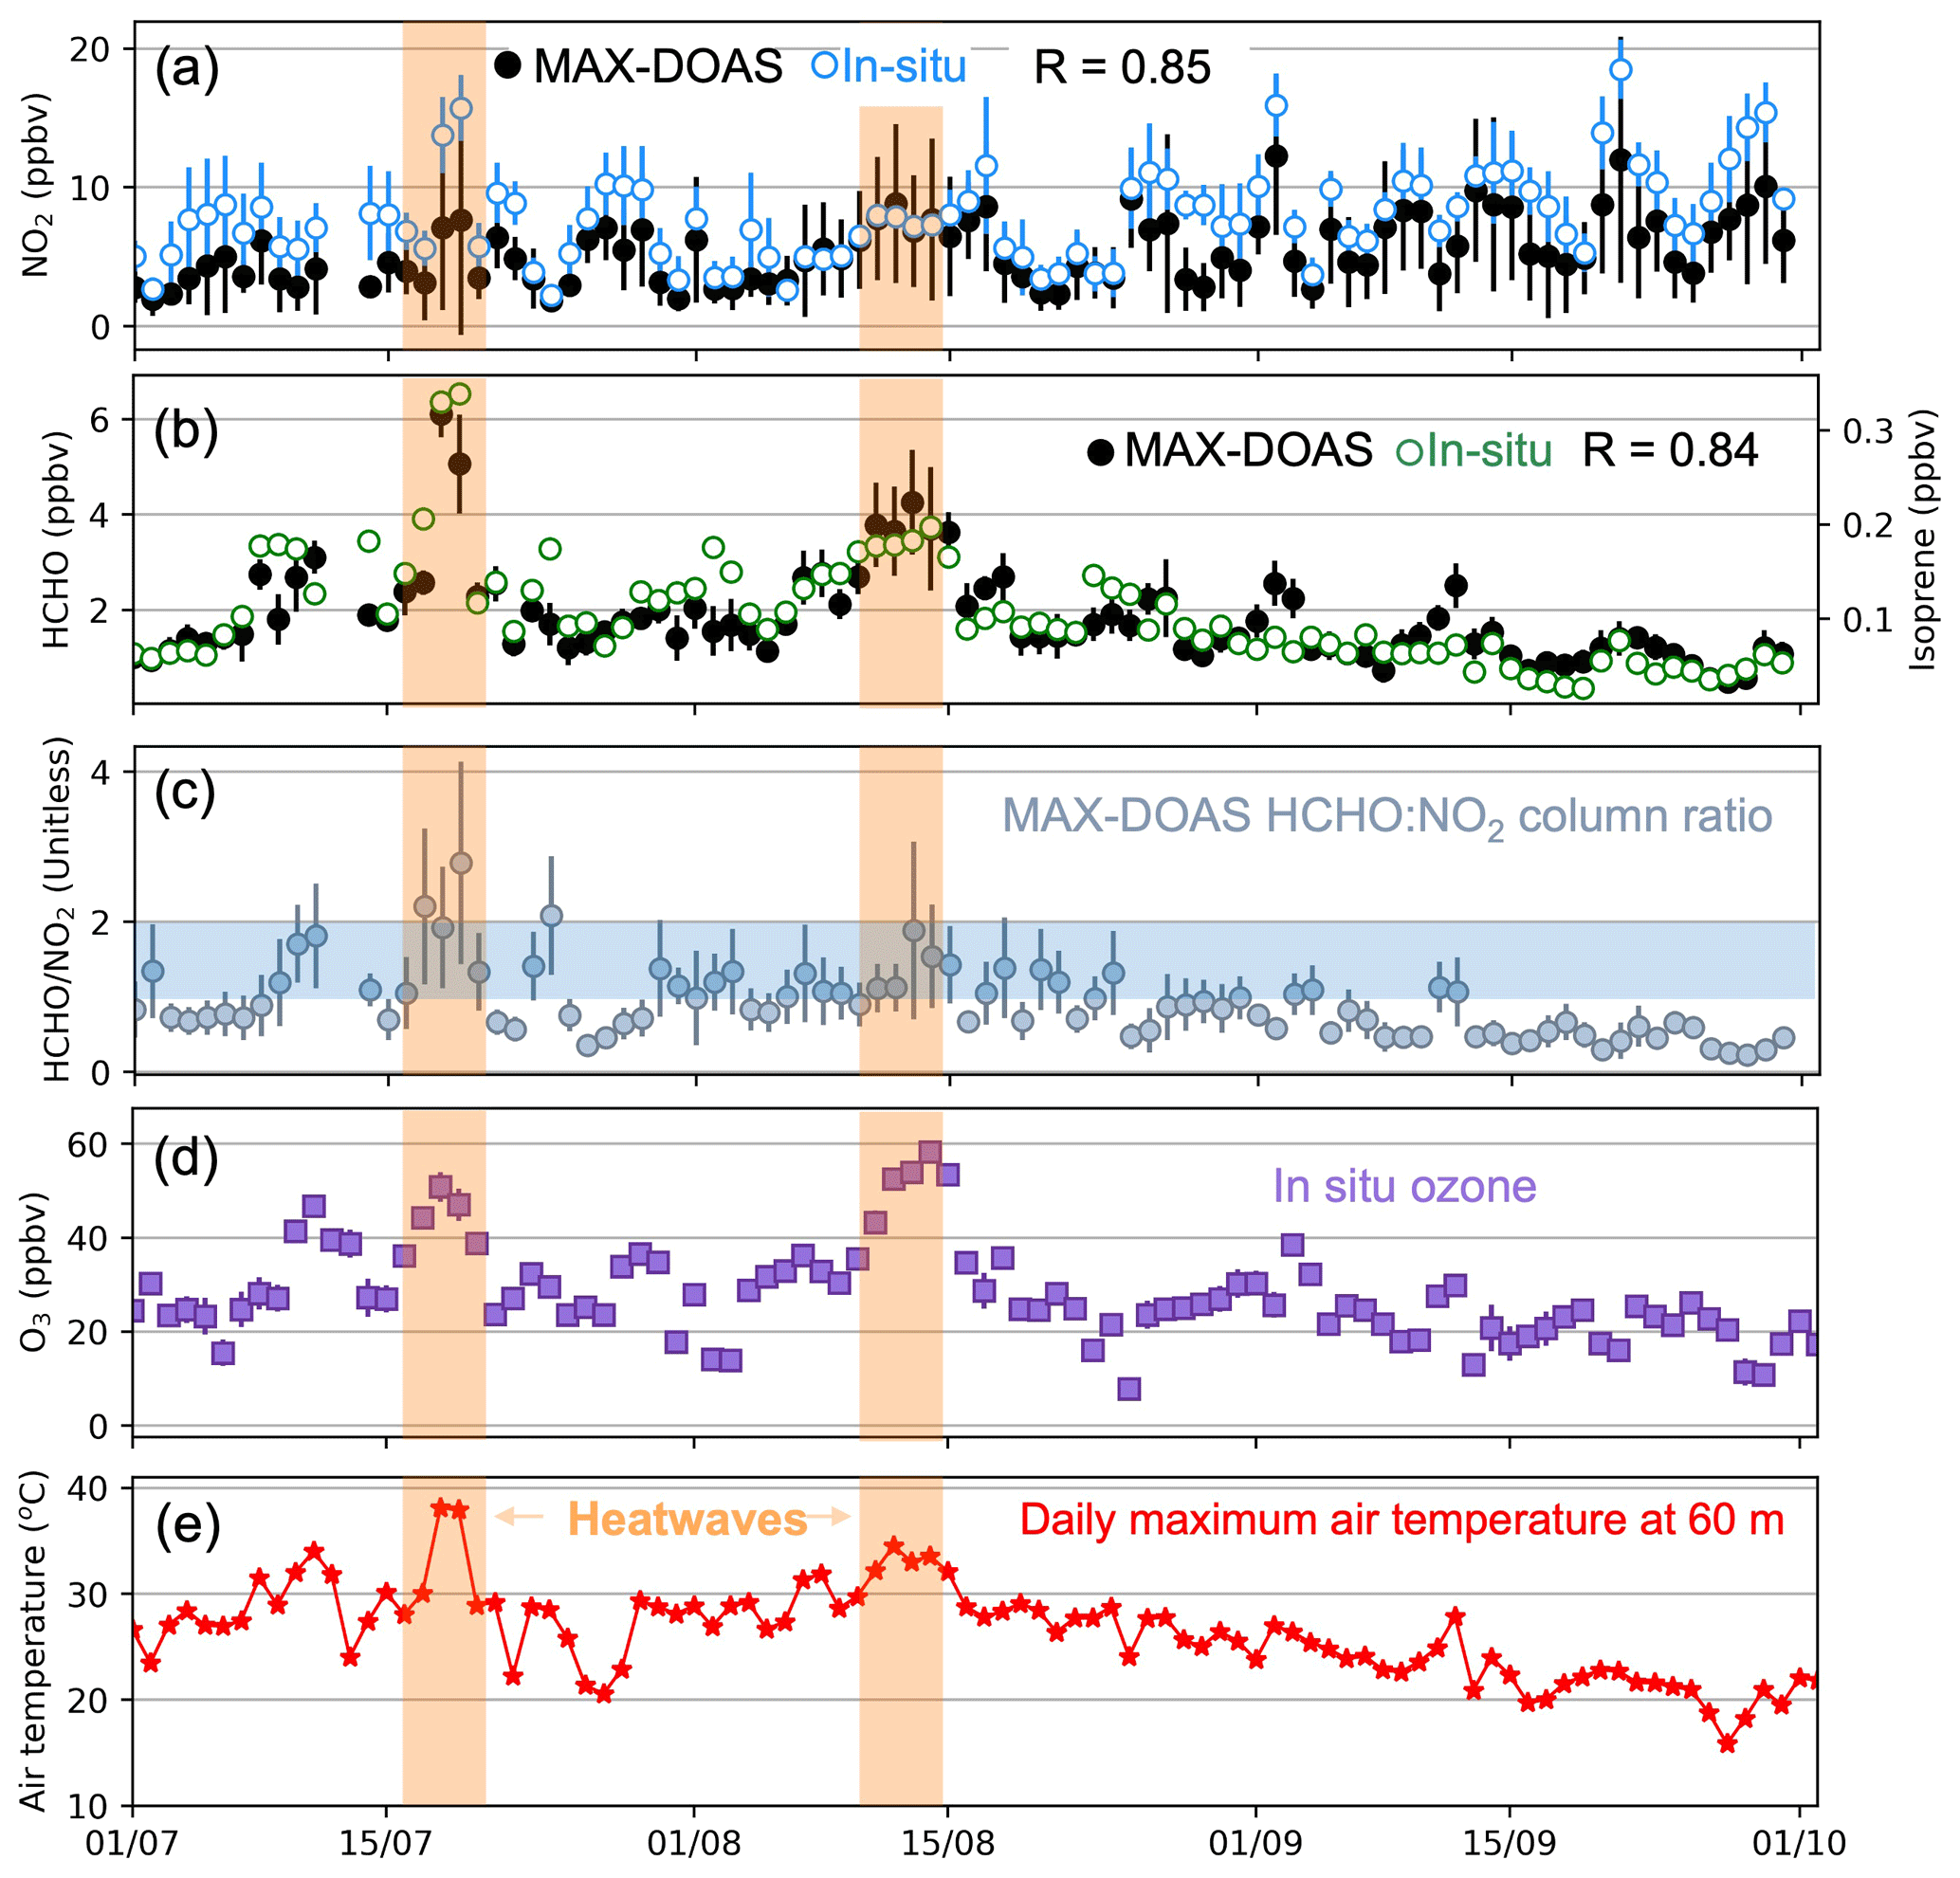
Figure 6Comparison of daily daytime mean observations in July–September 2022. Daytime data are those coincident with MAX-DOAS solar zenith angle < 90∘. Panels are daily mean MAX-DOAS and surface site NO2 (a), MAX-DOAS HCHO and surface site isoprene (b), MAX-DOAS HCHO:NO2 vertical column density ratios (c), surface site ozone (d), and maximum air temperature at 60 m (e). MAX-DOAS values are the lowest retrieved layer in (a) and (b) and the vertical 0–8 km column in (c). MAX-DOAS results are the mean of all azimuth angles, and surface sites are the mean of multiple sites for NO2 and ozone and of Marylebone Road only for isoprene (Sect. 2.4). Error bars are standard deviations of the multi-azimuth daytime means for MAX-DOAS, the site and daytime variability for in situ NO2 and ozone, and daytime variability only for in situ isoprene. Inset values in (a) and (b) are Pearson's correlation coefficients (R). Shading shows heatwave periods (orange) in all panels and transition in ozone production regimes (blue-grey) in (c). In situ daytime means are included if all sites have at least four hourly measurements that day.
The difference in HCHO over Central London is opposite in sign to and larger in magnitude than the median bias from global comparison studies of −10 % (Chan et al., 2020; De Smedt et al., 2021). Only the site at Madrid exhibited a positive bias of 10 % (De Smedt et al., 2021), less than the 20 % we obtain over Central London. The cause for a larger difference in TROPOMI and MAX-DOAS HCHO over Central London is challenging to isolate, as the TROPOMI data version we use has updated radiances used in the slant column retrieval and an updated background correction for addressing systematic offsets (De Smedt et al., 2022). Also, the MAX-DOAS HCHO data at the sites in the De Smedt et al. (2021) global comparison employ different retrieval algorithms. According to a MAX-DOAS intercomparison study, HCHO retrieval differences can account for systematic errors in dSCDs of up to 20 % (Pinardi et al., 2013).

Figure 7Comparison of mean diurnal variation in NO2, HCHO, and isoprene averaged over July–September 2022. Columns are surface site NO2 (a) and isoprene (c) and MAX-DOAS near-surface (0–110 m) NO2 (b) and HCHO (d). Solid lines are means and shaded areas standard deviations of all July–September multi-site mean data in (a), Marylebone Road data in (c), and multi-azimuth angle mean data in (b) and (d).
3.3 MAX-DOAS comparison to surface air quality monitors
Figure 6 shows daytime daily mean observations at the MAX-DOAS and surface monitoring sites for July–September 2022. Clouds are a large source of error in retrieval of trace gas column densities from space-based instruments (Millet et al., 2006). Previous tests have identified that clouds affect MAX-DOAS retrieval of AOD (Gielen et al., 2014; Wagner et al., 2014, 2016), but there is no equivalent assessment for trace gases. We evaluate the effect on MAX-DOAS retrievals by averaging cloud-free observations identified with colour indices () at 20∘ elevation angles that deviate by at least 10 % from the cloud-free fits in Fig. 3a (Sect. 2.3). This removes almost 60 % of retrieved NO2 and HCHO, and the difference in July–September mean all-sky and cloudy near-surface mixing ratios and vertical column densities of both trace gases is at most 3 %. The limited influence of clouds is likely because of the strong sensitivity of the retrieval to the observations. Informed by the weak sensitivity of trace gas retrievals to clouds, we use all-sky MAX-DOAS trace gas concentrations.
We also find that retrieved trace gas profiles are relatively insensitive to the choice of a priori. Retrievals of vertical column densities and near-surface mixing ratios of both NO2 and HCHO at the 175∘ azimuth angle in July, for example, differ by < 10 % using the default static RAPSODI a priori profile versus July average hourly mean a priori profiles from GEOS-Chem (Sect. 2.2), as most retrieval information is from the observations.
In Fig. 6a, daytime near-surface MAX-DOAS NO2 and surface site NO2 exhibit consistent day-to-day (R = 0.85) and hourly (R = 0.69; not shown) variability. Daytime mean NO2 is 7.4 ± 3.0 ppbv at the surface and 5.4 ± 2.3 ppbv averaged over the 0–110 m MAX-DOAS layers centred at ∼ 55 m. Based on this, the vertical gradient in NO2 is −36 pptv m−1. An autumn multiyear (October 2006 and October–November 2007) campaign in London calculated 24 h mean NO2 of 22 ± 12 ppbv at the North Kensington site (Fig. 1) and measured 24 h mean NO2 of 17 ± 9 ppbv with an in situ instrument installed at 160 m on the BT Tower located ∼ 500 m west of the MAX-DOAS site (Harrison et al., 2012). This yields a similar vertical gradient of −31 pptv m−1, despite differences in the magnitude of surface NO2 resulting from differing averaging periods (24 h vs. daytime, autumn vs. summer, 2006–2007 vs. 2022) that influence NO2 lifetime and precursor emissions. Decline in surface concentrations of NO2 in Greater London from 2006–2007 to 2022 is ∼ 43 %, based on the 2.5 % a−1 decline in tropospheric column densities of NO2 from OMI, a reasonable proxy for trends in surface NO2 (Vohra et al., 2021). The vertical gradient of 24 h mean GEOS-Chem NO2 in July–September 2022 from the lowest layer centred at 58 m to the layer above centred at 123 m is weaker than both at −17 pptv m−1.
MAX-DOAS HCHO is compared to surface isoprene concentration data, as HCHO is a prompt, high-yield oxidation product of isoprene in locations with elevated NOx such as Central London (Marais et al., 2012) and in situ observations of HCHO in Central London are limited to short-term intermittent field campaigns. Daytime isoprene averages 0.10 ± 0.06 ppbv in July–September (Fig. 6b) and includes emissions from trees and anthropogenic sources (mostly vehicles) in London (Valach et al., 2015). Biogenic emissions are enhanced in summer due to warm temperatures, sunlight, and large leaves (Guenther et al., 1995, 2006). The contribution of biogenic sources to isoprene in summer in London ranges from 50 % at the Marylebone Road traffic site in Central London to 90 % at the Eltham suburban background site (Khan et al., 2018; von Schneidemesser et al., 2011). Abundant tree species in London that are high isoprene emitters include oak and sycamore (Greater London Authority Environment Team, 2021). July–September surface isoprene and MAX-DOAS HCHO have similar day-to-day (R = 0.84) and hourly (R = 0.68; not shown) variability. The correlation in daytime daily means is weaker in September (R = 0.60) than the other months (R = 0.83) due to decline in isoprene emissions resulting from cooler temperatures and shorter days. This may have been exacerbated in 2022 by early senescence of trees across southeast England due to a sustained drought (Rosane, 2022).
Figure 7 shows July–September average hourly mean near-surface MAX-DOAS and surface site NO2 and near-surface MAX-DOAS HCHO and surface site isoprene. The MAX-DOAS near-surface diurnal variability is similar to the integrated column (0–8 km) for HCHO and NO2. The two lowest layers account on average for 28 % of the integrated column for NO2 and 12 % for HCHO. Surface site NO2 peaks at night when there is no photolytic loss of NO2 and during morning and afternoon rush hours. The magnitude of the morning peak is similar (9 ppbv at 07:00) for MAX-DOAS and the surface sites, whereas MAX-DOAS is less than the surface sites during the midday minimum (by 54 %) and the afternoon traffic peak (by 40 %). This suggests that the vertical gradient between the two lowest MAX-DOAS retrieval layers and the surface sites, averaging −36 pptv m−1 throughout the day, evolves from negligible in the early morning to about −50 pptv m−1 by late afternoon due to an increase in the efficiency of photolytic loss of NO2.
Diurnal variability in isoprene and HCHO differ, despite consistent day-to-day variability (Fig. 6b). Isoprene concentrations are at a minimum (< 0.1 ppbv) at night and maximum (0.25 ppbv) at 14:00 due to exponential dependence of isoprene emissions on temperature (Guenther et al., 1995, 2006; Valach et al., 2015). HCHO diurnal variability is relatively flat during most of the day, varying by no more than 43 %. This is because of a balance of HCHO sources and sinks; the latter is dominated by photolysis (Marais et al., 2012). In the morning and late afternoon, HCHO is mostly from oxidation of anthropogenic VOCs that have accumulated overnight or that are emitted by vehicles during rush-hour traffic as unburned hydrocarbons (Valach et al., 2015). At midday, isoprene emissions and photolysis rates peak (Valach et al., 2015). The same flat HCHO diurnal shape has been reported for summer ground-based column measurements in Beijing (De Smedt et al., 2015; Stavrakou et al., 2015). HCHO over other cities (Uccle in Belgium, Melbourne in Australia, Seoul in South Korea) has a distinct early-afternoon peak during summer (De Smedt et al., 2015; Ryan et al., 2020a; Spinei et al., 2018; Stavrakou et al., 2015), reflecting larger contribution of biogenic sources (Leuchner et al., 2016; Vigouroux et al., 2018; Xiaoyan et al., 2010). The MAX-DOAS site in Melbourne, for example, is in a suburban area with lower traffic density than Central London and near high-isoprene-emitting Eucalyptus forests (Ryan et al., 2020a).
3.4 Heatwaves and ozone pollution in summer 2022
Figure 6 also includes day-to-day variability in the ratio of MAX-DOAS vertical column densities of HCHO and NO2 (HCHO:NO2). These range from ∼ 0.2 to ∼ 2.8. The range of this ratio for the near-surface MAX-DOAS observations is narrower (∼ 0.1 to ∼ 1.8) due to a greater free tropospheric contribution to the total tropospheric column for HCHO than for NO2 (Sect. 3.2). HCHO:NO2 decreases over the period examined, as cooler temperatures and shorter days lead to a decline in isoprene emissions and increase in NO2 lifetime and abundance. Values of HCHO:NO2 are often used to diagnose whether ozone production depends on VOCs or NOx for informing policy measures to address ozone pollution (Jin et al., 2017; Ryan et al., 2020a; Vohra et al., 2022; Xue et al., 2022). Typically, ozone production regimes are diagnosed as NOx-saturated or as limited by the availability of VOCs at HCHO:NO2 < 1 and NOx-sensitive at HCHO:NO2 > 2 (Duncan et al., 2010). Ozone production in warm months in London is gradually transitioning to the NOx-sensitive regime, based on trends inferred from OMI for 2005 to 2015 and attributed to NOx emission controls (Jin et al., 2017). The exact values that define ozone production regimes depend on the oxidative state of the atmosphere and so should ideally be calibrated to local conditions (Souri et al., 2020). We use the threshold values from Duncan et al. (2010) as an approximate interpretation of ozone production. According to the daytime daily means in Fig. 7c, ozone production in July–September 2022 is mostly NOx-saturated, despite continued decline in NOx emissions in London since 2015 (Mayor of London, 2021), the last year of the Jin et al. (2017) trend analysis. During the July heatwave, daytime daily means occupy the upper end of the transition from NOx-saturated to NOx-sensitive.
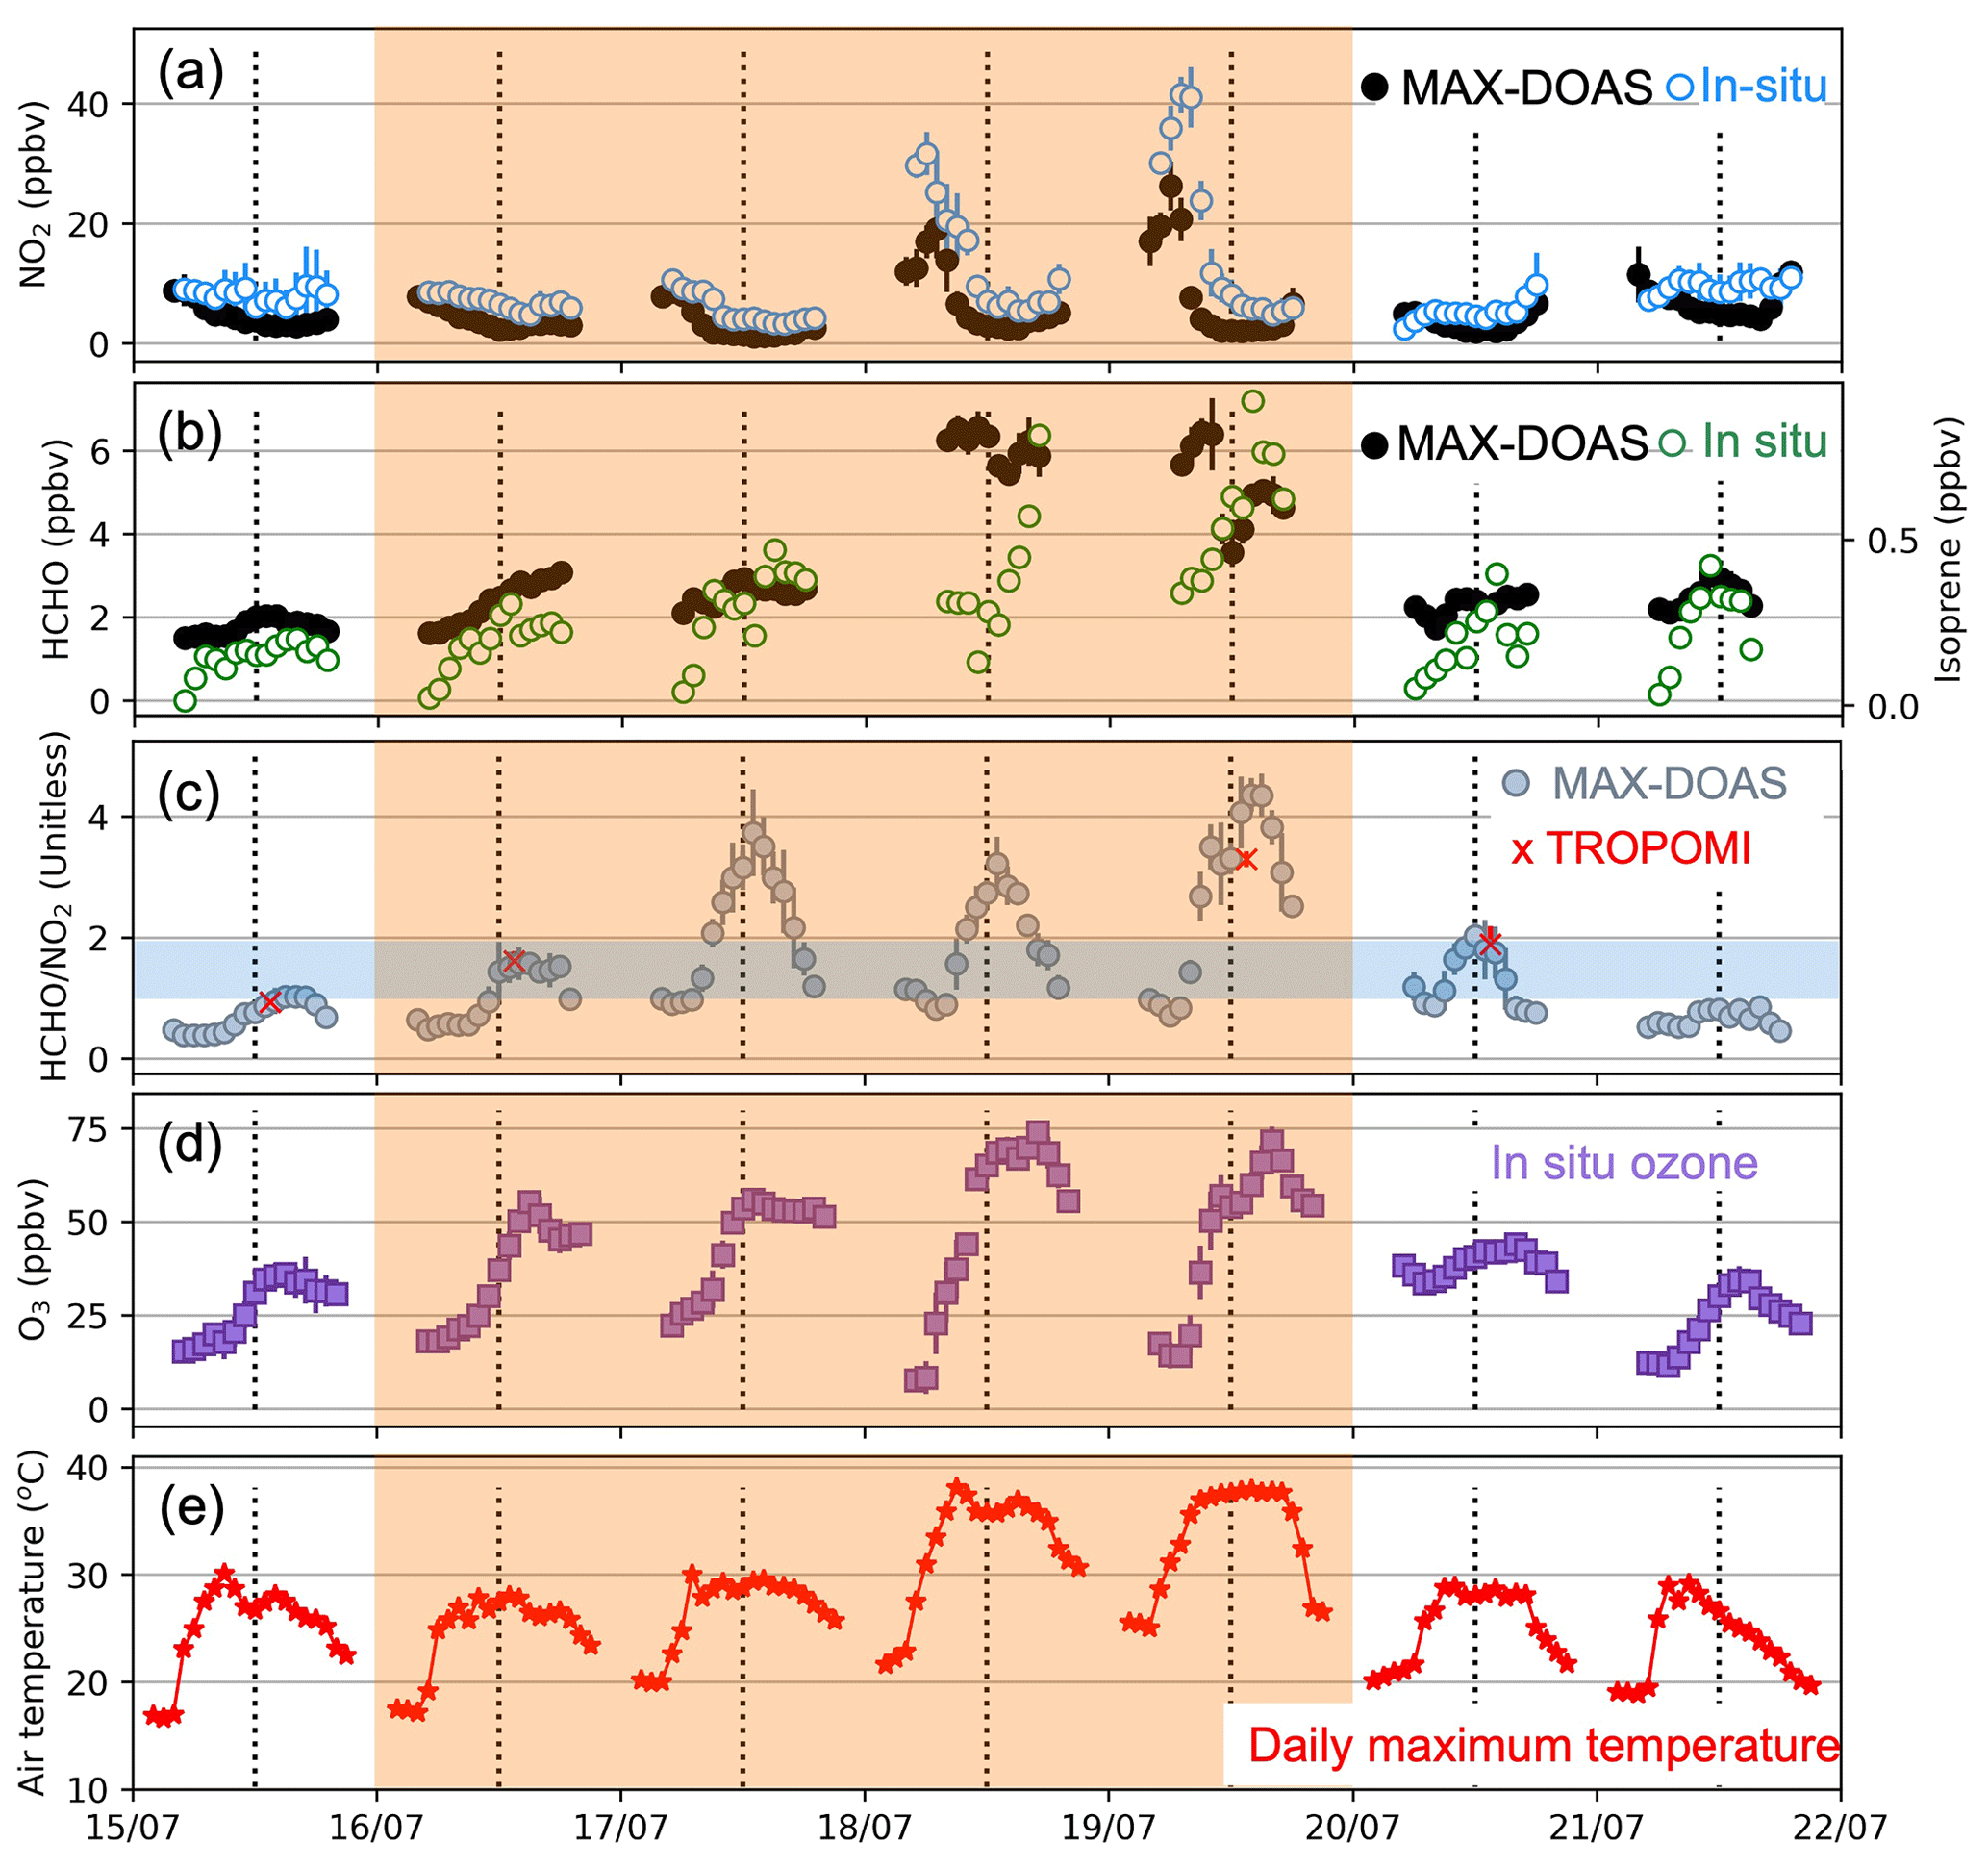
Figure 8Comparison of hourly mean observations during the July heatwave. Panels and features are the same as in Fig. 6, except individual points are daytime (MAX-DOAS solar zenith angle < 90∘) hourly means for 15–21 July 2022 and error bars are standard deviations of multi-azimuth hourly means for MAX-DOAS and site means for in situ NO2 and ozone. Vertical lines show noon UTC as a guide. Additional data in (c) are collocated TROPOMI HCHO:NO2 means (red crosses) and standard deviations (red error bars). MAX-DOAS and TROPOMI vertical sensitivities differ in (c).
Figure 8 shows hourly variability in the observations during the July heatwave. The maximum air temperature at 60 m of 38 ∘C is on 18 July and is ∼ 2 ∘C cooler than the maximum surface air temperature recorded in London during the heatwave. Due to very stable high-pressure conditions (Kendon, 2022), nocturnal accumulation of surface NO2 leads to morning concentrations on 18–19 July that are up to 30 ppbv more than the July–September mean morning peak (Fig. 7a). Surface NO2 on the morning of 19 July is just below the World Health Organization (WHO) 2021 guideline for short-term (24 h mean) exposure to NO2 of 25 µg m−3 (equivalent to ∼ 48 ppbv) (WHO, 2021).
The isoprene data in Fig. 8 suggest a substantial increase in isoprene emissions during the afternoons of the 2 hottest days in July. Isoprene emissions have a well-known exponential dependence on temperature that is parameterised in models like the widely used MEGAN with current and recent past air temperature. We find with the temperature parameterisation from Guenther et al. (2006) that the 10 ∘C increase in air temperature from the start of the heatwave on 17 July to the hottest hour on 19 July may have caused a 3-fold increase in isoprene emissions. Increased HCHO from ∼ 2 ppbv on 15–17 July to ∼ 4–6 ppbv on 18 July is likely due to night-time accumulation of HCHO under very stagnant conditions caused by the meteorological heat dome over London during the July heatwave. As a result of co-occurrence of high isoprene emissions and HCHO concentrations, daytime mean isoprene:HCHO ratios are the same before (89 ± 43 pptv ppbv−1 for 15–17 July) and on the 2 hottest days (89 ± 46 pptv ppbv−1 for 18–19 July). Yields of HCHO from isoprene oxidation increase with increasing NOx (Marais et al., 2012), but we expect that this effect is negligible in London, as surface NOx concentrations are routinely high (> 1 ppbv). HCHO is enhanced throughout 19 July, likely due to its overnight accumulation and from local fires. Large fires also occurred in France and Spain due to severe and sustained hot and dry conditions (Copernicus Atmosphere Monitoring Service, 2022; Henley and Jones, 2022; Imbach et al., 2022). The Copernicus Atmosphere Monitoring Service forecast of AOD (Benedetti et al., 2009; Morcrette et al., 2009) places smoke plumes from fires in Spain and France over London from the morning of 17 July until the afternoon of 19 July. This likely led to the 0.1–0.2 km−1 enhancements in aerosol extinction above background levels retrieved by the MAX-DOAS instrument at 1–2 km altitude from 11:00 on 18 July. There was no corresponding enhancement in NO2 and HCHO in this altitude range.
The large enhancements in morning NO2 and associated ozone depletion during the July heatwave in Fig. 8 mask severe ozone pollution and large hourly variability in the ozone production HCHO:NO2 diagnostic in the daytime means in Fig. 6. On 17–19 July, anticorrelation of peak NO2 in the morning and peak HCHO at midday leads to hourly HCHO:NO2 in Fig. 8c that ranges from 1 (ozone production transition regime) to 4.4 (strongly NOx-sensitive). Near-surface HCHO:NO2 ranges from 0.1 to 2.6 over the same period. On these days, the large increase in isoprene, and likely other biogenic VOCs, shifts ozone production to the NOx-sensitive regime for 8–9 h of the day and surface ozone increases to 50–75 ppbv. A low-pressure system moves in from the west at noon on 19 July, breaking up the stable high-pressure system (Kendon, 2022) and leading to cooler conditions on 20 July that decrease isoprene emissions, flatten diurnal variability in HCHO, and lessen the morning NO2 peak. Diurnal variability in ozone, NO2, HCHO, and HCHO:NO2 during the August heatwave (not shown) mimics the July heatwave.
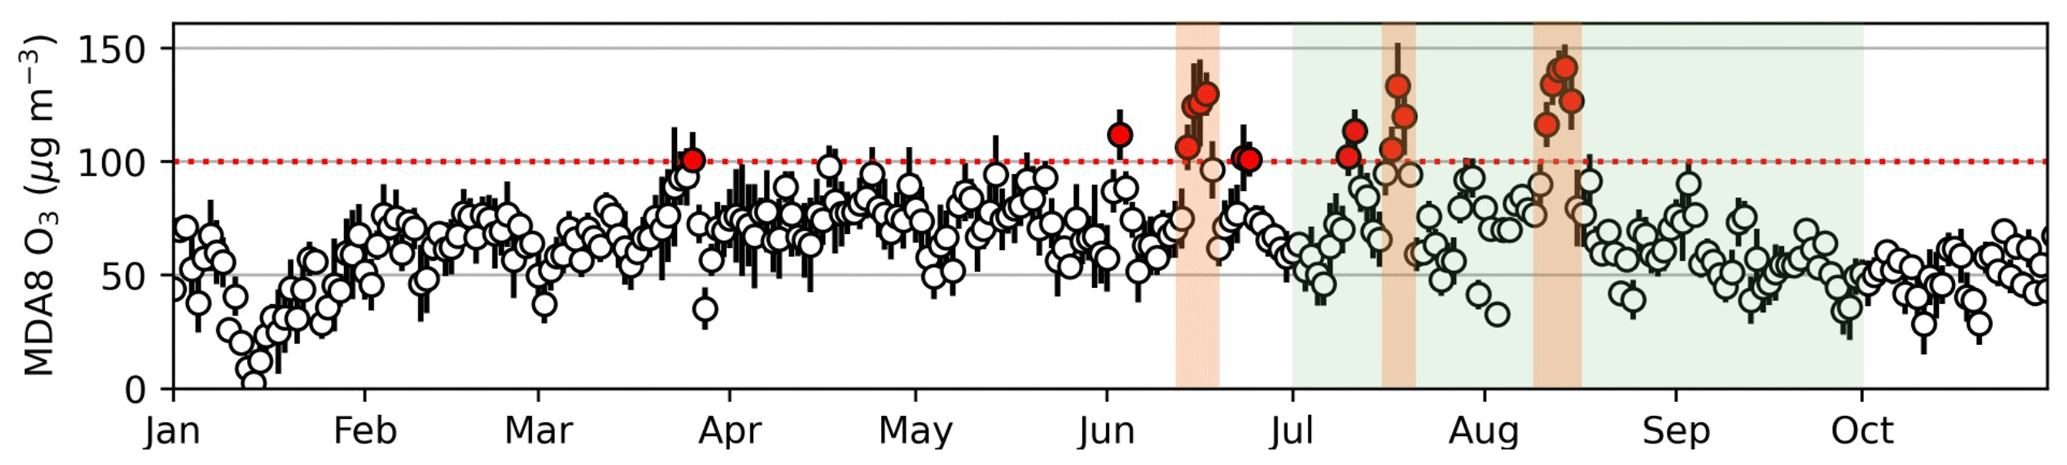
Figure 9Maximum daily 8 h average (MDA8) ozone in Central London from 1 January to 31 October 2022. Points are MDA8 ozone values from multi-site mean hourly ozone (Sect. 2.4). Error bars are the multi-site standard deviations. The horizontal dashed red line is the UK standard of 100 µg m−3 (DEFRA, 2022). Points coloured red exceed the standard. Shading shows the 2022 heatwave periods (orange) and the MAX-DOAS measurement period (green).
Single-overpass instruments would diagnose ozone production during the heatwave in Central London as exhibiting weak sensitivity to NOx (HCHO:NO2 ∼ 2) for a morning overpass and very NOx-sensitive (HCHO:NO2 of 3–4) for an afternoon overpass. TROPOMI HCHO:NO2 data are missing on 2 of the 4 heatwave days due to loss of HCHO data (Fig. 5). On days with TROPOMI data, HCHO:NO2 replicates that from MAX-DOAS on 15, 16, and 20 August but is slightly less than MAX-DOAS on 19 July (Fig. 8c), despite consistent TROPOMI and MAX-DOAS HCHO and NO2 on that day (Fig. 5). The lower TROPOMI HCHO:NO2 ratios in Fig. 8 are due to differences in instrument sensitivity that cause greater decline in MAX-DOAS HCHO (48 %) than in MAX-DOAS NO2 (26 %) in the comparison between TROPOMI and MAX-DOAS in Fig. 5. Across the whole measurement period, mean TROPOMI HCHO:NO2 is 45 % more than MAX-DOAS, suggesting that systematic differences in HCHO (TROPOMI > MAX-DOAS) and NO2 (TROPOMI < MAX-DOAS) have a greater influence on this discrepancy than differences in the vertical sensitivity of TROPOMI (Sect. 3.2).
The UK air quality standard for surface ozone pollution is maximum daily 8 h average (MDA8) ozone of 100 µg m−3 (equivalent to ∼ 50 ppbv) not to be exceeded more than 10 times a year (DEFRA, 2022). We show in Fig. 9 the time series of MDA8 ozone averaged over the two urban background sites (Bloomsbury and North Kensington) from 1 January to 31 October 2022 (Sect. 2.4). For most of 2022, MDA8 ozone is below 80 µg m−3. The standard is exceeded 18 times in 2022, and all exceedances are associated with increases in temperature. The three heatwaves account for most (67 %) exceedances: four in June, three in July, and five in August. Site-to-site variability in the number of MDA8 ozone exceedances tracks proximity to NOx sources from traffic. Marylebone Road, not included in the multi-site mean MDA8 ozone due to very large influence from local traffic, has one exceedance. At each of the two sites included in the multi-site mean MDA8 ozone in Fig. 9, exceedances total 15 at Bloomsbury and 24 at North Kensington. Fewer exceedances at the Bloomsbury site are due to its proximity to a congested two-lane road (Sect. 2.4).
In past heatwave years studied for ozone pollution episodes, MDA8 ozone exceedances averaged across all urban background sites in Greater London in May–September totalled 17 in 1995, 19 in 1999, and 27 in 2003 (Doherty et al., 2009). This likely includes a greater proportion of sites with less local traffic influence than the urban background sites in Fig. 9. Isoprene concentrations at Marylebone Road in the 2003 heatwave peaked at 1.6 ppbv (Lee et al., 2006), ∼ 0.6 ppbv more than the peak in Fig. 8. Future increases in the number of ozone exceedances in Central London are highly likely. The UK has committed to a continued decline in national anthropogenic NOx emissions of 55 % relative to 2005 values by any year in 2021–2029 and of 73 % relative to 2005 by any year from 2030 (Office of the European Union, 2016). Heatwaves are also projected to increase in severity, frequency, and persistence due to climate change caused by anthropogenic emissions of long-lived greenhouse gases (Christidis et al., 2020; Pörtner et al., 2022).
Here we report on ambient nitrogen dioxide (NO2) and formaldehyde (HCHO) concentrations in Central London retrieved for July–September 2022 from a recently installed MAX-DOAS instrument on the rooftop of an 11-storey building at University College London.
The high-spatial-resolution space-based TROPOMI instrument, capable of resolving sub-city atmospheric composition, replicates day-to-day variability in MAX-DOAS NO2 and HCHO (both with R = 0.71) but retrieves NO2 columns that are 27 %–31 % less than MAX-DOAS and HCHO columns that are 20 % more than MAX-DOAS.
Over Central London, clouds are detected in 60 % of all observations using ratios of spectral intensity in the UV (330 nm) and visible (404 nm). We find though that MAX-DOAS July–September mean retrievals obtained with and without clouds differ by < 3 %, so MAX-DOAS offers complete daytime temporal coverage of UV–visible active components over frequently cloudy Central London, as long as most information in the retrieval is from the observations.
The NO2 diurnal variability typically includes morning and evening peaks due to rush-hour traffic and a midday minimum when photolytic loss of NO2 dominates. HCHO diurnal variability is flat most days, except during heatwaves when warm conditions increase temperature-dependent emissions of the biogenic VOC isoprene that oxidises to form HCHO. On these days, ozone production shifts from weakly NOx-saturated in the early morning to strongly NOx-limited at and around midday, resulting in midday ozone concentrations of 50–75 ppbv. The regulatory standard of maximum daily 8 h average (MDA8) ozone is exceeded 18 times in Central London in 2022, mostly during heatwaves.
Current single-overpass space-based instruments observe Central London when NO2 is at a midday minimum or undergoing steep decline following the morning rush hour, suffer data loss due to contamination by clouds and retrieval issues, and lead to different conclusions about ozone production regimes on heatwave days. The future Sentinel-4 geostationary instrument will address limited temporal sampling by observing Central London every daylight hour.
Continued emission controls targeting NOx sources and predicted climate-change-driven increases in heatwave occurrence, severity, and longevity will inevitably increase ozone pollution episodes, necessitating continued reliance on forecasting and warning systems to mitigate harmful effects of heatwaves on public health.
The Python code of the RAPSODI retrieval algorithm can be requested from Jan-Lukas Tirpitz (jan-lukas.tirpitz@airyx.de).
MAX-DOAS vertical profiles of O4, NO2, and HCHO during the measurement period used to calculate column densities and near-surface concentrations and the gap-filled Marylebone Road hourly isoprene concentration data are available for download in NetCDF format from the UCL Research Data Repository (https://doi.org/10.5522/04/21610533) (Marais et al., 2022). The surface air quality measurements are available for download from the UK Air Information Resource website (UK-AIR) (DEFRA, 2023).
Study concept was by RGR and EAM. Instrument installation was by RGR and EAM with assistance from RR and JPM. JLT and UF provided the RAPSODI code and guidance on its use. RGR and EGS developed the cloud-flagging algorithm. EAM simulated GEOS-Chem. RGR led the data analysis. The manuscript was co-written by RGR and EAM. All authors reviewed and edited the manuscript.
The contact author has declared that none of the authors has any competing interests.
Publisher's note: Copernicus Publications remains neutral with regard to jurisdictional claims in published maps and institutional affiliations.
This research has been supported by the European Research Council under the European Union's Horizon 2020 research and innovation programme (through the Starting Grant awarded to Eloise A. Marais, UpTrop; grant no. 851854) and by the UCL Research Capital Infrastructure Fund 2021–2022 awarded to Robert G. Ryan and Eloise A. Marais.
This paper was edited by Jianzhong Ma and reviewed by two anonymous referees.
AQEG: Ozone in the United Kingdom, UK Air Quality Experts Group (AQEG), DEFRA, London, https://uk-air.defra.gov.uk/assets/documents/reports/aqeg/aqeg-ozone-report.pdf (last access: 27 November 2022), 2009.
Benavent, N., Garcia-Nieto, D., Wang, S., and Saiz-Lopez, A.: MAX-DOAS measurements and vertical profiles of glyoxal and formaldehyde in Madrid, Spain, Atmos. Environ., 199, 357–367, https://doi.org/10.1016/j.atmosenv.2018.11.047, 2019.
Benedetti, A., Morcrette, J. J., Boucher, O., Dethof, A., Engelen, R., Fisher, M., Flentje, H., Huneeus, N., Jones, L., and Kaiser, J.: Aerosol analysis and forecast in the European centre for medium-range weather forecasts integrated forecast system: 2. Data assimilation, J. Geophys. Res.-Atmos., 114, D13205, https://doi.org/10.1029/2008JD011115, 2009.
Chan, K. L., Wiegner, M., van Geffen, J., De Smedt, I., Alberti, C., Cheng, Z., Ye, S., and Wenig, M.: MAX-DOAS measurements of tropospheric NO2 and HCHO in Munich and the comparison to OMI and TROPOMI satellite observations, Atmos. Meas. Tech., 13, 4499–4520, https://doi.org/10.5194/amt-13-4499-2020, 2020.
Chance, K. and Orphal, J.: Revised ultraviolet absorption cross sections of H2CO for the HITRAN database, J. Quant. Spectrosc. Ra., 112, 1509–1510, https://doi.org/10.1016/j.jqsrt.2011.02.002, 2011.
Christidis, N., McCarthy, M., and Stott, P. A.: The increasing likelihood of temperatures above 30 to 40 ∘C in the United Kingdom, Nat. Commun., 11, 3093, https://doi.org/10.1038/s41467-020-16834-0, 2020.
Coggon, M. M., Gkatzelis, G. I., McDonald, B. C., Gilman, J. B., Schwantes, R. H., Abuhassan, N., Aikin, K. C., Arend, M. F., Berkoff, T. A., Brown, S. S., Campos, T. L., Dickerson, R. R., Gronoff, G., Hurley, J. F., Isaacman-VanWertz, G., Koss, A. R., Li, M., McKeen, S. A., Moshary, F., Peischl, J., Pospisilova, V., Ren, X., Wilson, A., Wu, Y., Trainer, M., and Warneke, C.: Volatile chemical product emissions enhance ozone and modulate urban chemistry, P. Natl. Acad. Sci. USA, 118, e2026653118, https://doi.org/10.1073/pnas.2026653118, 2021.
Copernicus Atmosphere Monitoring Service: Europe's summer wildfire emissions highest in 15 years, ECMWF, https://atmosphere.copernicus.eu/europes-summer-wildfire-emissions-highest-15-years (last access: 20 September 2022), 2022.
DEFRA: UK Air Quality Limits, Department for Environment, Food and Rural Affairs (DEFRA), https://uk-air.defra.gov.uk/air-pollution/uk-eu-limits (last access: 24 November 2022), 2022.
DEFRA: UK Air Information Resource (UK AIR), Department for the Environmenta, Food and Rural Affairs [data set], https://uk-air.defra.gov.uk/data/, last access: 28 March, 2023.
De Smedt, I., Stavrakou, T., Hendrick, F., Danckaert, T., Vlemmix, T., Pinardi, G., Theys, N., Lerot, C., Gielen, C., Vigouroux, C., Hermans, C., Fayt, C., Veefkind, P., Müller, J.-F., and Van Roozendael, M.: Diurnal, seasonal and long-term variations of global formaldehyde columns inferred from combined OMI and GOME-2 observations, Atmos. Chem. Phys., 15, 12519–12545, https://doi.org/10.5194/acp-15-12519-2015, 2015.
De Smedt, I., Pinardi, G., Vigouroux, C., Compernolle, S., Bais, A., Benavent, N., Boersma, F., Chan, K.-L., Donner, S., Eichmann, K.-U., Hedelt, P., Hendrick, F., Irie, H., Kumar, V., Lambert, J.-C., Langerock, B., Lerot, C., Liu, C., Loyola, D., Piters, A., Richter, A., Rivera Cárdenas, C., Romahn, F., Ryan, R. G., Sinha, V., Theys, N., Vlietinck, J., Wagner, T., Wang, T., Yu, H., and Van Roozendael, M.: Comparative assessment of TROPOMI and OMI formaldehyde observations and validation against MAX-DOAS network column measurements, Atmos. Chem. Phys., 21, 12561–12593, https://doi.org/10.5194/acp-21-12561-2021, 2021.
De Smedt, I., Romahn, F., and Eichmann, K.-U.: S5P Mission Performance Centre: Formaldehyde [L2_chemHCHO_] Readme, https://sentinels.copernicus.eu/documents/247904/3541451/Sentinel-5P-Formaldehyde-Readme.pdf (last access: 27 November 2022), 2022.
Dimitropoulou, E., Hendrick, F., Pinardi, G., Friedrich, M. M., Merlaud, A., Tack, F., De Longueville, H., Fayt, C., Hermans, C., Laffineur, Q., Fierens, F., and Van Roozendael, M.: Validation of TROPOMI tropospheric NO2 columns using dual-scan multi-axis differential optical absorption spectroscopy (MAX-DOAS) measurements in Uccle, Brussels, Atmos. Meas. Tech., 13, 5165–5191, https://doi.org/10.5194/amt-13-5165-2020, 2020.
Doherty, R. M., Heal, M. R., Wilkinson, P., Pattenden, S., Vieno, M., Armstrong, B., Atkinson, R., Chalabi, Z., Kovats, S., and Milojevic, A.: Current and future climate- and air pollution-mediated impacts on human health, Environ. Health, 8, 1–8, https://doi.org/10.1186/1476-069X-8-S1-S8, 2009.
Duncan, B. N., Yoshida, Y., Olson, J. R., Sillman, S., Martin, R. V., Lamsal, L., Hu, Y., Pickering, K. E., Retscher, C., and Allen, D. J.: Application of OMI observations to a space-based indicator of NOx and VOC controls on surface ozone formation, Atmos. Environ., 44, 2213–2223, https://doi.org/10.1016/j.atmosenv.2010.03.010, 2010.
Finkenzeller, H. and Volkamer, R.: O2–O2 CIA in the gas phase: Cross-section of weak bands, and continuum absorption between 297–500 nm, J. Quant. Spectrosc. Ra., 279, 108063, https://doi.org/10.1016/j.jqsrt.2021.108063, 2022.
Fleischmann, O. C., Hartmann, M., Burrows, J. P., and Orphal, J.: New ultraviolet absorption cross-sections of BrO at atmospheric temperatures measured by time-windowing Fourier transform spectroscopy, J. Photoch. Photobio. A, 168, 117–132, https://doi.org/10.1016/j.jphotochem.2004.03.026, 2004.
Gielen, C., Van Roozendael, M., Hendrick, F., Pinardi, G., Vlemmix, T., De Bock, V., De Backer, H., Fayt, C., Hermans, C., Gillotay, D., and Wang, P.: A simple and versatile cloud-screening method for MAX-DOAS retrievals, Atmos. Meas. Tech., 7, 3509–3527, https://doi.org/10.5194/amt-7-3509-2014, 2014.
Grainger, J. and Ring, J.: Anomalous Fraunhofer line profiles, Nature, 193, 762–762, https://doi.org/10.1038/193762a0, 1962.
Greater London Authority Environment Team: Local Authority Maintained Trees, Greater London Authority, London, UK, https://data.london.gov.uk/dataset/local-authority-maintained-trees (last access: 13 November 2022), 2021.
Guenther, A., Hewitt, C. N., Erickson, D., Fall, R., Geron, C., Graedel, T., Harley, P., Klinger, L., Lerdau, M., Mckay, W. A., Pierce, T., Scholes, B., Steinbrecher, R., Tallamraju, R., Taylor, J., and Zimmerman, P.: A global model of natural volatile organic compound emissions, J. Geophys. Res.-Atmos., 100, 8873–8892, https://doi.org/10.1029/94JD02950, 1995.
Guenther, A., Karl, T., Harley, P., Wiedinmyer, C., Palmer, P. I., and Geron, C.: Estimates of global terrestrial isoprene emissions using MEGAN (Model of Emissions of Gases and Aerosols from Nature), Atmos. Chem. Phys., 6, 3181–3210, https://doi.org/10.5194/acp-6-3181-2006, 2006.
Guenther, A. B., Jiang, X., Heald, C. L., Sakulyanontvittaya, T., Duhl, T., Emmons, L. K., and Wang, X.: The Model of Emissions of Gases and Aerosols from Nature version 2.1 (MEGAN2.1): an extended and updated framework for modeling biogenic emissions, Geosci. Model Dev., 5, 1471–1492, https://doi.org/10.5194/gmd-5-1471-2012, 2012.
Harrison, R. M., Dall'Osto, M., Beddows, D. C. S., Thorpe, A. J., Bloss, W. J., Allan, J. D., Coe, H., Dorsey, J. R., Gallagher, M., Martin, C., Whitehead, J., Williams, P. I., Jones, R. L., Langridge, J. M., Benton, A. K., Ball, S. M., Langford, B., Hewitt, C. N., Davison, B., Martin, D., Petersson, K. F., Henshaw, S. J., White, I. R., Shallcross, D. E., Barlow, J. F., Dunbar, T., Davies, F., Nemitz, E., Phillips, G. J., Helfter, C., Di Marco, C. F., and Smith, S.: Atmospheric chemistry and physics in the atmosphere of a developed megacity (London): an overview of the REPARTEE experiment and its conclusions, Atmos. Chem. Phys., 12, 3065–3114, https://doi.org/10.5194/acp-12-3065-2012, 2012.
Harrison, R. M., Vu, T. V., Jafar, H., and Shi, Z.: More mileage in reducing urban air pollution from road traffic, Environ. Int., 149, 106329, https://doi.org/10.1016/j.envint.2020.106329, 2021.
Heckel, A., Richter, A., Tarsu, T., Wittrock, F., Hak, C., Pundt, I., Junkermann, W., and Burrows, J. P.: MAX-DOAS measurements of formaldehyde in the Po-Valley, Atmos. Chem. Phys., 5, 909–918, https://doi.org/10.5194/acp-5-909-2005, 2005.
Henley, J. and Jones, S.: Wildfires continue to burn across France and Spain, https://www.theguardian.com/world/2022/jul/25/wildfires-continue-to-burn-across-france-and-spain (last access: 24 November 2022), 2022.
Hönninger, G., von Friedeburg, C., and Platt, U.: Multi axis differential optical absorption spectroscopy (MAX-DOAS), Atmos. Chem. Phys., 4, 231–254, https://doi.org/10.5194/acp-4-231-2004, 2004.
Imbach, R., Romain, M., and Bretau, P.: France's unprecedented summer of wildfires, in maps and graphs, https://www.lemonde.fr/en/les-decodeurs/article/2022/08/25/fires-in-france-maps-and-graphs-to-visualize-an-unprecedented-summer_5994672_8. (last access: 24 November 2022), 2022.
Jin, X., Fiore, A. M., Murray, L. T., Valin, L. C., Lamsal, L. N., Duncan, B., Boersma, K. F., De Smedt, I., Abad, G. G., and Chance, K.: Evaluating a space-based indicator of surface ozone-NOx-VOC sensitivity over midlatitude source regions and application to decadal trends, J. Geophys. Res.-Atmos., 122, 10439–10461, https://doi.org/10.1002/2017JD026720, 2017.
Johnson, H., Kovats, S., McGregor, G., Stedman, J., Gibbs, M., and Walton, H.: The impact of the 2003 heat wave on daily mortality in England and Wales and the use of rapid weekly mortality estimates, Eurosurveillance, 10, 558, https://doi.org/10.2807/esm.10.07.00558-en, 2005.
Kelly, J. M., Marais, E. A., Lu, G., Obszynska, J., Mace, M., White, J., and Leigh, R. J.: Diagnosing domestic and transboundary sources of fine particulate matter (PM2.5) in UK cities using GEOS-Chem, City and Environment Interactions, 18, 100100, https://doi.org/10.1016/j.cacint.2023.100100, 2023.
Kendon, M.: Unprecedented extreme heatwave, July 2022, UK Met Office, https://www.metoffice.gov.uk/binaries/content/assets/metofficegovuk/pdf/weather/learn-about/uk-past-events/interesting/2022/2022_03_july_heatwave_v1.pdf (last access: 27 November 2022), 2022.
Khan, M. A. H., Schlich, B.-L., Jenkin, M. E., Shallcross, B. M., Moseley, K., Walker, C., Morris, W. C., Derwent, R. G., Percival, C. J., and Shallcross, D. E.: A two-decade anthropogenic and biogenic isoprene emissions study in a London urban background and a London urban traffic site, Atmosphere, 9, 387, https://doi.org/10.3390/atmos9100387, 2018.
Kraus, S.: DOASIS – A framework design for DOAS, PhD thesis, University of Heidelberg, Heidelberg, Germany, 184 pp., 2006.
Kreher, K., Van Roozendael, M., Hendrick, F., Apituley, A., Dimitropoulou, E., Frieß, U., Richter, A., Wagner, T., Lampel, J., Abuhassan, N., Ang, L., Anguas, M., Bais, A., Benavent, N., Bösch, T., Bognar, K., Borovski, A., Bruchkouski, I., Cede, A., Chan, K. L., Donner, S., Drosoglou, T., Fayt, C., Finkenzeller, H., Garcia-Nieto, D., Gielen, C., Gómez-Martín, L., Hao, N., Henzing, B., Herman, J. R., Hermans, C., Hoque, S., Irie, H., Jin, J., Johnston, P., Khayyam Butt, J., Khokhar, F., Koenig, T. K., Kuhn, J., Kumar, V., Liu, C., Ma, J., Merlaud, A., Mishra, A. K., Müller, M., Navarro-Comas, M., Ostendorf, M., Pazmino, A., Peters, E., Pinardi, G., Pinharanda, M., Piters, A., Platt, U., Postylyakov, O., Prados-Roman, C., Puentedura, O., Querel, R., Saiz-Lopez, A., Schönhardt, A., Schreier, S. F., Seyler, A., Sinha, V., Spinei, E., Strong, K., Tack, F., Tian, X., Tiefengraber, M., Tirpitz, J.-L., van Gent, J., Volkamer, R., Vrekoussis, M., Wang, S., Wang, Z., Wenig, M., Wittrock, F., Xie, P. H., Xu, J., Yela, M., Zhang, C., and Zhao, X.: Intercomparison of NO2, O4, O3 and HCHO slant column measurements by MAX-DOAS and zenith-sky UV–visible spectrometers during CINDI-2, Atmos. Meas. Tech., 13, 2169–2208, https://doi.org/10.5194/amt-13-2169-2020, 2020.
Lambert, J.-C., Compernolle, S., Eichmann, K.-U., de Graaf, M., Hubert, D., Keppens, A., Kleipool, Q., Langerock, B., Sha, M. K., Verhoelst, T., Wagner, T., Ahn, C., Argyrouli, A., Balis, D., Chan, K. L., De Smedt, I., Eskes, H., Fjæraa, A. M., Garane, K., Gleason, J. F., Goutail, F., Granville, J., Hedelt, P., Heue, K.-P., Jaross, G., Koukouli, M. L., Landgraf, J., Lutz, R., Nanda, S., Niemeijer, S., Pazmiño, A., Pinardi, G., Pommereau, J.-P., Richter, A., Rozemeijer, N., Sneep, M., Stein Zweers, D., Theys, N., Tilstra, G., Torres, O., Valks, P., van Geffen, J., Vigouroux, C., Wang, P., and Weber, M.: Quarterly Validation Report of the Copernicus Sentinel-5 Precursor Operational Data Products #10: April 2018–March 2021, Version 10.01.00, https://mpc-vdaf.tropomi.eu/ProjectDir/reports//pdf/S5P-MPC-IASB-ROCVR-10.01.00-20210326-signed.pdf (last access: 23 November 2022), 2021.
Lee, J., Lewis, A., Monks, P., Jacob, M., Hamilton, J., Hopkins, J., Watson, N., Saxton, J., Ennis, C., and Carpenter, L.: Ozone photochemistry and elevated isoprene during the UK heatwave of August 2003, Atmos. Environ., 40, 7598–7613, https://doi.org/10.1016/j.atmosenv.2006.06.057, 2006.
Leser, H., Hönninger, G., and Platt, U.: MAX-DOAS measurements of BrO and NO2 in the marine boundary layer, Geophys. Res. Lett., 30, 1537, https://doi.org/10.1029/2002gl015811, 2003.
Leuchner, M., Ghasemifard, H., Lu, M., Ries, L., Schunk, C., and Menzel, A.: Seasonal and diurnal variation of formaldehyde and its meteorological drivers at the GAW site Zugspitze, Aerosol Air Qual. Res., 16, 801–815, https://doi.org/10.4209/aaqr.2015.05.0334, 2016.
London Fire Brigade: London Fire Brigade declares major incident as second day of heatwave sparks several significant fires across the capital, https://www.london-fire.gov.uk/news/2022-news/july/london-fire-brigade-declares-major-incident-as-second-day-of-heatwave-sparks-several-significant-fires-across-the-capital/ (last access: 27 November 2022), London Fire Brigade, 2022.
Marais, E. A., Jacob, D. J., Kurosu, T. P., Chance, K., Murphy, J. G., Reeves, C., Mills, G., Casadio, S., Millet, D. B., Barkley, M. P., Paulot, F., and Mao, J.: Isoprene emissions in Africa inferred from OMI observations of formaldehyde columns, Atmos. Chem. Phys., 12, 6219–6235, https://doi.org/10.5194/acp-12-6219-2012, 2012.
Marais, E. A., Pandey, A. K., Van Damme, M., Clarisse, L., Coheur, P. F., Shephard, M. W., Cady-Pereira, K. E., Misselbrook, T., Zhu, L., and Luo, G.: UK ammonia emissions estimated with satellite observations and GEOS-Chem, J. Geophys. Res.-Atmos., 126, e2021JD035237, https://doi.org/10.1029/2021JD035237, 2021a.
Marais, E. A., Roberts, J. F., Ryan, R. G., Eskes, H., Boersma, K. F., Choi, S., Joiner, J., Abuhassan, N., Redondas, A., Grutter, M., Cede, A., Gomez, L., and Navarro-Comas, M.: New observations of NO2 in the upper troposphere from TROPOMI, Atmos. Meas. Tech., 14, 2389–2408, https://doi.org/10.5194/amt-14-2389-2021, 2021b.
Marais, E. A., Ryan, R., Tirpitz, J.-L., Frieß, U., and Gershenson-Smith, E.: MAX-DOAS retrievals of formaldehyde (HCHO) and nitrogen dioxide (NO2) vertical profiles over Central London [data set], UCL Research Data Repository, University College London (UCL), https://doi.org/10.5522/04/21610533, 2022.
Martin, R. V., Jacob, D. J., Chance, K., Kurosu, T. P., Palmer, P. I., and Evans, M. J.: Global inventory of nitrogen oxide emissions constrained by space-based observations of NO2 columns, J. Geophys. Res.-Atmos., 108, 4537, https://doi.org/10.1029/2003jd003453, 2003.
Mayor of London: London Atmospheric Emissions Inventory 2019, Mayor of London, https://data.london.gov.uk/download/london-atmospheric-emissions-inventory–laei–2019/06aab8a6-79a6-40ae-8038-8303ac82a3aa/LAEI%202019%20Summary%20Note%20FINAL.pdf (last access: 27 November 2022), 2021.
McCabe, F.: Heatwaves: how unusual is it to get high temperatures in June?, in: MetMatters, edited by: Royal Meteorological Society, https://www.rmets.org/metmatters/heatwaves-how-unusual-it-get-high-temperatures-june (last access: 27 November 2022), 2022.
McCarthy, M., Armstrong, L., and Armstrong, N.: A new heatwave definition for the UK, Weather, 74, 382–387, https://doi.org/10.1002/wea.3629, 2019.
Millet, D. B., Jacob, D. J., Turquety, S., Hudman, R. C., Wu, S., Fried, A., Walega, J., Heikes, B. G., Blake, D. R., Singh, H. B., Anderson, B. E., and Clarke, A. D.: Formaldehyde distribution over North America: Implications for satellite retrievals of formaldehyde columns and isoprene emission, J. Geophys. Res.-Atmos., 111, D24S02, https://doi.org/10.1029/2005jd006853, 2006.
Morcrette, J. J., Boucher, O., Jones, L., Salmond, D., Bechtold, P., Beljaars, A., Benedetti, A., Bonet, A., Kaiser, J., and Razinger, M.: Aerosol analysis and forecast in the European Centre for medium-range weather forecasts integrated forecast system: Forward modeling, J. Geophys. Res.-Atmos., 114, D06206, https://doi.org/10.1029/2008JD011235, 2009.
Office of the European Union: Directive (EU) 2016/2284 of the European parliament and of the Council, https://eur-lex.europa.eu/legal-content/EN/TXT/PDF/?uri=CELEX:32016L2284&from=EN (last access: 27 November 2022), 2016.
ONS and UKHSA: Excess mortality during heat-periods: 1 June to 31 August 2022, Office for National Statistics (ONS) and UK Health Security Agency (UKHSA), https://www.ons.gov.uk/peoplepopulationandcommunity/birthsdeathsandmarriages/deaths/articles/excessmortalityduringheatperiods/englandandwales1juneto31august2022 (last access: 27 November 2022), 2022.
ORNL DAAC: MODIS and VIIRS Land Products Global Subsetting and Visualization Tool, ORNL DAAC, ORNL DAAC, Oak Ridge, Tennessee, USA, https://doi.org/10.3334/ORNLDAAC/1379 (last access: 11 September 2022), 2022.
Ortega, I., Koenig, T., Sinreich, R., Thomson, D., and Volkamer, R.: The CU 2-D-MAX-DOAS instrument – Part 1: Retrieval of 3-D distributions of NO2 and azimuth-dependent OVOC ratios, Atmos. Meas. Tech., 8, 2371–2395, https://doi.org/10.5194/amt-8-2371-2015, 2015.
Pattenden, S., Armstrong, B., Milojevic, A., Heal, M. R., Chalabi, Z., Doherty, R., Barratt, B., Kovats, R. S., and Wilkinson, P.: Ozone, heat and mortality: acute effects in 15 British conurbations, Occup. Environ. Med., 67, 699–707, https://doi.org/10.1136/oem.2009.051714, 2010.
Peters, E., Wittrock, F., Großmann, K., Frieß, U., Richter, A., and Burrows, J. P.: Formaldehyde and nitrogen dioxide over the remote western Pacific Ocean: SCIAMACHY and GOME-2 validation using ship-based MAX-DOAS observations, Atmos. Chem. Phys., 12, 11179–11197, https://doi.org/10.5194/acp-12-11179-2012, 2012.
Pinardi, G., Van Roozendael, M., Abuhassan, N., Adams, C., Cede, A., Clémer, K., Fayt, C., Frieß, U., Gil, M., Herman, J., Hermans, C., Hendrick, F., Irie, H., Merlaud, A., Navarro Comas, M., Peters, E., Piters, A. J. M., Puentedura, O., Richter, A., Schönhardt, A., Shaiganfar, R., Spinei, E., Strong, K., Takashima, H., Vrekoussis, M., Wagner, T., Wittrock, F., and Yilmaz, S.: MAX-DOAS formaldehyde slant column measurements during CINDI: intercomparison and analysis improvement, Atmos. Meas. Tech., 6, 167–185, https://doi.org/10.5194/amt-6-167-2013, 2013.
Pinardi, G., Van Roozendael, M., Hendrick, F., Theys, N., Abuhassan, N., Bais, A., Boersma, F., Cede, A., Chong, J., Donner, S., Drosoglou, T., Dzhola, A., Eskes, H., Frieß, U., Granville, J., Herman, J. R., Holla, R., Hovila, J., Irie, H., Kanaya, Y., Karagkiozidis, D., Kouremeti, N., Lambert, J.-C., Ma, J., Peters, E., Piters, A., Postylyakov, O., Richter, A., Remmers, J., Takashima, H., Tiefengraber, M., Valks, P., Vlemmix, T., Wagner, T., and Wittrock, F.: Validation of tropospheric NO2 column measurements of GOME-2A and OMI using MAX-DOAS and direct sun network observations, Atmos. Meas. Tech., 13, 6141–6174, https://doi.org/10.5194/amt-13-6141-2020, 2020.
Platt, U. and Stutz, J.: Differential Optical Absorption Spectroscopy, Part of the book series: Physics of Earth and Space Environments, Springer, Berlin, Germany, https://doi.org/10.1007/978-3-540-75776-4, 2008.
Pope, R. J., Arnold, S. R., Chipperfield, M. P., Latter, B. G., Siddans, R., and Kerridge, B. J.: Widespread changes in UK air quality observed from space, Atmos. Sci. Lett., 19, e817, https://doi.org/10.1002/asl.817, 2018.
Pope, R. J., Kelly, R., Marais, E. A., Graham, A. M., Wilson, C., Harrison, J. J., Moniz, S. J. A., Ghalaieny, M., Arnold, S. R., and Chipperfield, M. P.: Exploiting satellite measurements to explore uncertainties in UK bottom-up NOx emission estimates, Atmos. Chem. Phys., 22, 4323–4338, https://doi.org/10.5194/acp-22-4323-2022, 2022.
Pörtner, H.-O., Roberts, D. C., Adams, H., Adler, C., Aldunce, P., Ali, E., Begum, R. A., Betts, R., Kerr, R. B., and Biesbroek, R.: Climate change 2022: Impacts, adaptation and vulnerability, IPCC Sixth Assessment Report, Cambridge University Press, Cambridge, UK and New York, NY, USA, https://doi.org/10.1017/9781009325844, 2022.
Rodgers, C. D.: Inverse methods for atmospheric sounding: theory and practice, World Scientific, London, UK, ISBN 9814498688, 2000.
Rodgers, C. D. and Connor, B. J.: Intercomparison of remote sounding instruments, J. Geophys. Res.-Atmos., 108, 4116, https://doi.org/10.1029/2002jd002299, 2003.
Rooney, C., McMichael, A. J., Kovats, R. S., and Coleman, M. P.: Excess mortality in England and Wales, and in Greater London, during the 1995 heatwave, J. Epidemiol. Commun. H., 52, 482–486, https://doi.org/10.1136/jech.52.8.482, 1998.
Rosane, O.: Drought and Heat Bring 'False Autumn' to UK Trees, EcoWatch, https://www.ecowatch.com/trees-uk-drought-heat.html (last access: 23 November 2022), 2022.
Ryan, R. G., Rhodes, S., Tully, M., Wilson, S., Jones, N., Frieß, U., and Schofield, R.: Daytime HONO, NO2 and aerosol distributions from MAX-DOAS observations in Melbourne, Atmos. Chem. Phys., 18, 13969–13985, https://doi.org/10.5194/acp-18-13969-2018, 2018.
Ryan, R. G., Rhodes, S., Tully, M., and Schofield, R.: Surface ozone exceedances in Melbourne, Australia are shown to be under NOx control, as demonstrated using formaldehyde:NO2 and glyoxal:formaldehyde ratios, Sci. Total Environ., 749, 141460, https://doi.org/10.1016/j.scitotenv.2020.141460, 2020a.
Ryan, R. G., Silver, J. D., Querel, R., Smale, D., Rhodes, S., Tully, M., Jones, N., and Schofield, R.: Comparison of formaldehyde tropospheric columns in Australia and New Zealand using MAX-DOAS, FTIR and TROPOMI, Atmos. Meas. Tech., 13, 6501–6519, https://doi.org/10.5194/amt-13-6501-2020, 2020b.
Serdyuchenko, A., Gorshelev, V., Weber, M., Chehade, W., and Burrows, J. P.: High spectral resolution ozone absorption cross-sections – Part 2: Temperature dependence, Atmos. Meas. Tech., 7, 625–636, https://doi.org/10.5194/amt-7-625-2014, 2014.
Sillman, S. and Samson, P. J.: Impact of temperature on oxidant photochemistry in urban, polluted rural and remote environments, J. Geophys. Res.-Atmos., 100, 11497–11508, https://doi.org/10.1029/94JD02146, 1995.
Souri, A. H., Nowlan, C. R., Wolfe, G. M., Lamsal, L. N., Miller, C. E. C., Abad, G. G., Janz, S. J., Fried, A., Blake, D. R., and Weinheimer, A. J.: Revisiting the effectiveness of ratios for inferring ozone sensitivity to its precursors using high resolution airborne remote sensing observations in a high ozone episode during the KORUS-AQ campaign, Atmos. Environ., 224, 117341, https://doi.org/10.1016/j.atmosenv.2020.117341, 2020.
Spinei, E., Whitehill, A., Fried, A., Tiefengraber, M., Knepp, T. N., Herndon, S., Herman, J. R., Müller, M., Abuhassan, N., Cede, A., Richter, D., Walega, J., Crawford, J., Szykman, J., Valin, L., Williams, D. J., Long, R., Swap, R. J., Lee, Y., Nowak, N., and Poche, B.: The first evaluation of formaldehyde column observations by improved Pandora spectrometers during the KORUS-AQ field study, Atmos. Meas. Tech., 11, 4943–4961, https://doi.org/10.5194/amt-11-4943-2018, 2018.
Spurr, R.: LIDORT and VLIDORT: Linearized pseudo-spherical scalar and vector discrete ordinate radiative transfer models for use in remote sensing retrieval problems, in: Light Scattering Reviews 3, edited by: Kokhanovsky, A. A., Springer, Berlin, Germany, https://doi.org/10.1007/978-3-540-48546-9_7, 229–275, 2008.
Spurr, R. J. D.: VLIDORT: A linearized pseudo-spherical vector discrete ordinate radiative transfer code for forward model and retrieval studies in multilayer multiple scattering media, J. Quant. Spectrosc. Ra., 102, 316–342, https://doi.org/10.1016/j.jqsrt.2006.05.005, 2006.
Stavrakou, T., Müller, J.-F., Bauwens, M., De Smedt, I., Van Roozendael, M., De Mazière, M., Vigouroux, C., Hendrick, F., George, M., Clerbaux, C., Coheur, P.-F., and Guenther, A.: How consistent are top-down hydrocarbon emissions based on formaldehyde observations from GOME-2 and OMI?, Atmos. Chem. Phys., 15, 11861–11884, https://doi.org/10.5194/acp-15-11861-2015, 2015.
Stedman, J. R.: The predicted number of air pollution related deaths in the UK during the August 2003 heatwave, Atmos. Environ., 38, 1087–1090, https://doi.org/10.1016/j.atmosenv.2003.11.011, 2004.
The International GEOS-Chem User Community: GEOS-Chem Version 13.0.0, Zenodo [code], https://doi.org/10.5281/zenodo.4618180, 2021.
Timmermans, R., Segers, A., Curier, L., Abida, R., Attié, J.-L., El Amraoui, L., Eskes, H., de Haan, J., Kujanpää, J., Lahoz, W., Oude Nijhuis, A., Quesada-Ruiz, S., Ricaud, P., Veefkind, P., and Schaap, M.: Impact of synthetic space-borne NO2 observations from the Sentinel-4 and Sentinel-5P missions on tropospheric NO2 analyses , Atmos. Chem. Phys., 19, 12811–12833, https://doi.org/10.5194/acp-19-12811-2019, 2019.
Tirpitz, J.-L.: Enhancing MAX-DOAS atmospheric remote sensing by multispectral polarimetry, PhD thesis, University of Heidelberg, Heidelberg, https://doi.org/10.11588/heidok.00030159, 241 pp., 2021.
Tirpitz, J.-L., Frieß, U., Spurr, R., and Platt, U.: Enhancing MAX-DOAS atmospheric state retrievals by multispectral polarimetry – studies using synthetic data, Atmos. Meas. Tech., 15, 2077–2098, https://doi.org/10.5194/amt-15-2077-2022, 2022.
Valach, A. C., Langford, B., Nemitz, E., MacKenzie, A. R., and Hewitt, C. N.: Seasonal and diurnal trends in concentrations and fluxes of volatile organic compounds in central London, Atmos. Chem. Phys., 15, 7777–7796, https://doi.org/10.5194/acp-15-7777-2015, 2015.
van Geffen, J., Eskes, H., Compernolle, S., Pinardi, G., Verhoelst, T., Lambert, J.-C., Sneep, M., ter Linden, M., Ludewig, A., Boersma, K. F., and Veefkind, J. P.: Sentinel-5P TROPOMI NO2 retrieval: impact of version v2.2 improvements and comparisons with OMI and ground-based data, Atmos. Meas. Tech., 15, 2037–2060, https://doi.org/10.5194/amt-15-2037-2022, 2022.
Vandaele, A. C., Hermans, C., Simon, P. C., Carleer, M., Colin, R., Fally, S., Merienne, M.-F., Jenouvrier, A., and Coquart, B.: Measurements of the NO2 absorption cross-section from 42 000 cm−1 to 10 000 cm−1 (238–1000 nm) at 220 K and 294 K, J. Quant. Spectrosc. Ra., 59, 171–184, https://doi.org/10.1016/S0022-4073(97)00168-4, 1998.
Verhoelst, T., Compernolle, S., Pinardi, G., Lambert, J.-C., Eskes, H. J., Eichmann, K.-U., Fjæraa, A. M., Granville, J., Niemeijer, S., Cede, A., Tiefengraber, M., Hendrick, F., Pazmiño, A., Bais, A., Bazureau, A., Boersma, K. F., Bognar, K., Dehn, A., Donner, S., Elokhov, A., Gebetsberger, M., Goutail, F., Grutter de la Mora, M., Gruzdev, A., Gratsea, M., Hansen, G. H., Irie, H., Jepsen, N., Kanaya, Y., Karagkiozidis, D., Kivi, R., Kreher, K., Levelt, P. F., Liu, C., Müller, M., Navarro Comas, M., Piters, A. J. M., Pommereau, J.-P., Portafaix, T., Prados-Roman, C., Puentedura, O., Querel, R., Remmers, J., Richter, A., Rimmer, J., Rivera Cárdenas, C., Saavedra de Miguel, L., Sinyakov, V. P., Stremme, W., Strong, K., Van Roozendael, M., Veefkind, J. P., Wagner, T., Wittrock, F., Yela González, M., and Zehner, C.: Ground-based validation of the Copernicus Sentinel-5P TROPOMI NO2 measurements with the NDACC ZSL-DOAS, MAX-DOAS and Pandonia global networks, Atmos. Meas. Tech., 14, 481–510, https://doi.org/10.5194/amt-14-481-2021, 2021.
Vigouroux, C., Bauer Aquino, C. A., Bauwens, M., Becker, C., Blumenstock, T., De Mazière, M., García, O., Grutter, M., Guarin, C., Hannigan, J., Hase, F., Jones, N., Kivi, R., Koshelev, D., Langerock, B., Lutsch, E., Makarova, M., Metzger, J.-M., Müller, J.-F., Notholt, J., Ortega, I., Palm, M., Paton-Walsh, C., Poberovskii, A., Rettinger, M., Robinson, J., Smale, D., Stavrakou, T., Stremme, W., Strong, K., Sussmann, R., Té, Y., and Toon, G.: NDACC harmonized formaldehyde time series from 21 FTIR stations covering a wide range of column abundances, Atmos. Meas. Tech., 11, 5049–5073, https://doi.org/10.5194/amt-11-5049-2018, 2018.
Vohra, K., Marais, E. A., Suckra, S., Kramer, L., Bloss, W. J., Sahu, R., Gaur, A., Tripathi, S. N., Van Damme, M., Clarisse, L., and Coheur, P.-F.: Long-term trends in air quality in major cities in the UK and India: a view from space, Atmos. Chem. Phys., 21, 6275–6296, https://doi.org/10.5194/acp-21-6275-2021, 2021.
Vohra, K., Marais, E. A., Bloss, W. J., Schwartz, J., Mickley, L. J., Van Damme, M., Clarisse, L., and Coheur, P.-F.: Rapid rise in premature mortality due to anthropogenic air pollution in fast-growing tropical cities from 2005 to 2018, Sci. Adv., 8, eabm4435, https://doi.org/10.1126/sciadv.abm4435, 2022.
von Schneidemesser, E., Monks, P. S., Gros, V., Gauduin, J., and Sanchez, O.: How important is biogenic isoprene in an urban environment? A study in London and Paris, Geophys. Res. Lett., 38, L19804, https://doi.org/10.1029/2011GL048647, 2011.
Wagner, T., Beirle, S., and Deutschmann, T.: Three-dimensional simulation of the Ring effect in observations of scattered sun light using Monte Carlo radiative transfer models, Atmos. Meas. Tech., 2, 113–124, https://doi.org/10.5194/amt-2-113-2009, 2009.
Wagner, T., Apituley, A., Beirle, S., Dörner, S., Friess, U., Remmers, J., and Shaiganfar, R.: Cloud detection and classification based on MAX-DOAS observations, Atmos. Meas. Tech., 7, 1289–1320, https://doi.org/10.5194/amt-7-1289-2014, 2014.
Wagner, T., Beirle, S., Remmers, J., Shaiganfar, R., and Wang, Y.: Absolute calibration of the colour index and O4 absorption derived from Multi AXis (MAX-)DOAS measurements and their application to a standardised cloud classification algorithm, Atmos. Meas. Tech., 9, 4803–4823, https://doi.org/10.5194/amt-9-4803-2016, 2016.
Wang, C., Wang, T., Wang, P., and Rakitin, V.: Comparison and validation of TROPOMI and OMI NO2 observations over China, Atmosphere, 11, 636, https://doi.org/10.3390/atmos11060636, 2020.
Wang, Y., Pukite, J., Wagner, T., Donner, S., Beirle, S., Hilboll, A., Vrekoussis, M., Richter, A., Apituley, A., and Piters, A.: Vertical profiles of tropospheric ozone from MAX-DOAS measurements during the CINDI-2 campaign: Part 1—Development of a new retrieval algorithm, J. Geophys. Res.-Atmos., 123, 10637–10670, https://doi.org/10.1029/2018JD028647, 2018.
WHO: WHO global air quality guidelines: particulate matter (PM2.5 and PM10), ozone, nitrogen dioxide, sulfur dioxide and carbon monoxide, World Health Organization, https://apps.who.int/iris/handle/10665/345329, (last accessd: 12 April 2022), 2021.
Xiaoyan, W., Huixiang, W., and Shaoli, W.: Ambient formaldehyde and its contributing factor to ozone and OH radical in a rural area, Atmos. Environ., 44, 2074–2078, https://doi.org/10.1016/j.atmosenv.2010.03.023, 2010.
Xue, J., Zhao, T., Luo, Y., Miao, C., Su, P., Liu, F., Zhang, G., Qin, S., Song, Y., and Bu, N.: Identification of ozone sensitivity for NO2 and secondary HCHO based on MAX-DOAS measurements in northeast China, Environ. Int., 160, 107048, https://doi.org/10.1016/j.envint.2021.107048, 2022.