the Creative Commons Attribution 4.0 License.
the Creative Commons Attribution 4.0 License.
 | 27 Jun 2023
Global nitrogen and sulfur deposition mapping using a measurement–model fusion approach
Hannah J. Rubin
Frank Dentener
Rui Li
Kan Huang
Hongbo Fu
Global reactive nitrogen (N) deposition has more than tripled since 1860 and is expected to remain high due to food production and fossil fuel consumption. Global sulfur emissions have been decreasing worldwide over the last 30 years, but many regions are still experiencing unhealthily high levels of deposition. We update the 2010 global deposition budget for reactive nitrogen and sulfur components with new regional wet deposition measurements from Asia, improving the ensemble results of 11 global chemistry transport models from the second phase of the United Nations Economic Commission for Europe's Task Force on Hemispheric Transport of Air Pollution (HTAP II). The observationally adjusted global N deposition budget is 114.5 Tg N, representing a minor increase of 1 % from the model-only derived values, and the adjusted global sulfur deposition budget is 88.9 Tg S, representing a 6.5 % increase from the modeled values, using an interpolation distance of 2.5∘. Regionally, deposition adjustments can be up to ∼ 73 % for nitrogen and 112 % for sulfur. Our study demonstrates that a global measurement–model fusion approach can improve N and S deposition model estimates at a regional scale, with sufficient availability of observations; however, in large parts of the world, alternative approaches need to be explored. The analysis presented here represents a step forward toward the World Meteorological Organization's goal of global fusion products for accurately mapping harmful air pollution deposition.
- Article
(1574 KB) - Full-text XML
-
Supplement
(1363 KB) - BibTeX
- EndNote


Atmospheric nitrogen and sulfur deposition from human activities related to the use of fossils and land use have significant implications for ecosystem and human health. Elevated levels of nitrogen and sulfur can lead to eutrophication (Anderson et al., 2008; Heisler et al., 2008), changes in carbon sequestration (Kicklighter et al., 2019; de Vries et al., 2009; Zhu et al., 2020), loss of biodiversity (Bobbink et al., 2010; Clark et al., 2013; Dise and Stevens, 2005), and acidification (Bowman et al., 2008). While sulfur deposition is expected to decrease over the next 80 years (Lamarque et al., 2013), it will remain a serious hazard in many emerging economies. For instance, sulfur deposition in East Asia peaked in 2006 (Lu et al., 2010) but is still high enough to be concerning, especially in natural and seminatural regions (Doney et al., 2007; Luo et al., 2014).
Oxidized nitrogen (NOy) and reduced nitrogen (NHx), together called reactive nitrogen (Nr), and oxidized sulfur (SOx) deposition occur as wet and dry processes (Dentener et al., 2006). Wet deposition is measured at hundreds of locations in Europe, North America, and Asia, but dry deposition is harder to measure and is often instead derived from ambient concentrations and modeled deposition velocities (Xu et al., 2015). For example, dry deposition is inferred from continuous concentration measurements combined with modeled dry deposition velocities at a few locations in North America (Clean Air Status and Trends Network (CASTNET), 2021) and Asia (Acid Deposition Monitoring Network in East Asia (EANET), 2021).
The United Nations Economic Commission for Europe's Task Force on Hemispheric Transport of Air Pollution (HTAP) is an international effort to improve the understanding of air pollution transport science with emissions models. The second phase of HTAP was launched in 2012. Tan et al. (2018a) used the multi-model mean (MMM) of 11 HTAP II chemistry transport models to estimate the sulfur and nitrogen deposition budgets for 2010. Significant uncertainty remained due to a lack of station measurements, especially in East Asia, a large contributor to the overall budget. Tan et al. (2018a) compared Acid Deposition Monitoring Network in East Asia (EANET - Acid Deposition Monitoring Network in East Asia, 2021) measurements to the MMM output; however, there were very few measurements in East Asia, and they were all located along the southeastern coast. In contrast, the highest emissions and modeled deposition were inland and in the north, making it challenging to evaluate model performance.
Combining measurements and model estimates using a “measurement–model fusion” (MMF) approach has the advantage of retaining the broad spatial coverage of models while accurately matching observations. Generally speaking, MMF takes model estimates of concentrations or fluxes for a region and modifies them based on in situ point measurements to force the model towards the observed values (Labrador et al., 2020). One global MMF approach for wet deposition combined measurements with HTAP I ensemble model values for 2000–2002 (Vet et al., 2014) where model estimates filled empty grid cells lacking a 3-year observed mean. Another MMF approach in North America (Atmospheric Deposition Analysis Generated from optimal Interpolation from Observations, ADAGIO) used observed concentrations to adjust predicted concentrations from the Global Environmental Multiscale–Modelling Air Quality and Chemistry (GEM-MACH) model (Schwede et al., 2019). Recent work in the USA (Schwede and Lear, 2014; Zhang et al., 2019) has incorporated Community Multiscale Air Quality (CMAQ) model output and precipitation data generated by the Parameter-elevation Regressions on Independent Slopes Model (PRISM; https://prism.oregonstate.edu/, last access: 1 October 2022) as well as observations using inverse distance weighting to create total deposition (TDep; https://nadp.slh.wisc.edu/committees/tdep/#tdep-maps, last access: 1 October 2022) maps that are publicly available.
More details of the MMF approach are described in Fu et al. (2022): they lay out a roadmap for future work, following the World Meteorological Organization's Global Atmosphere Watch Program (WMO GAW) and the intended role of the MMF Global Total Atmospheric Deposition (MMF-GTAD) project. This study updates the global S and N deposition budgets of Tan et al. (2018a) using a variation of the TDep methodology (Schwede and Lear, 2014) to merge NHx, NOy, and SOx modeled gridded deposition flux results with deposition fluxes derived from observations of , , and in precipitation and precipitation amounts. The main purpose of our study is to demonstrate the viability of a straightforward but globally applicable MMF approach, while remaining consistent with previous work that provided datasets for impact assessments for various communities. This approach is an important intermediate step towards the WMO's goal of reliable deposition products to aid decision-making. We update the 2010 deposition budgets using MMF to combine the broad spatial coverage of a model with accurate in situ measurements.
All data are from 2010 and are reported monthly, with the sources summarized in Table 1. Wet deposition measurements (, , and ) from the US National Trends Network (NTN) and US Atmospheric Integrated Research Monitoring Network (AIRMoN) are available through the National Atmospheric Deposition Program (NADP; National Atmospheric Deposition Program, 2021, https://nadp.slh.wisc.edu/, last access: 18 November 2021). Measurements were filtered for completeness and quality, following Schwede and Lear (2014). Sites without a full year of measurements or with quality tags indicating collection issues were not included, resulting in 247 observations in the USA. Generated dry deposition valuescomm are available from the Clean Air Status and Trends Network (Clean Air Status and Trends Network (CASTNET), 2021) at 84 locations. CASTNET uses an inferential method to calculate dry deposition fluxes as a product of surface concentration and modeled dry deposition velocity.
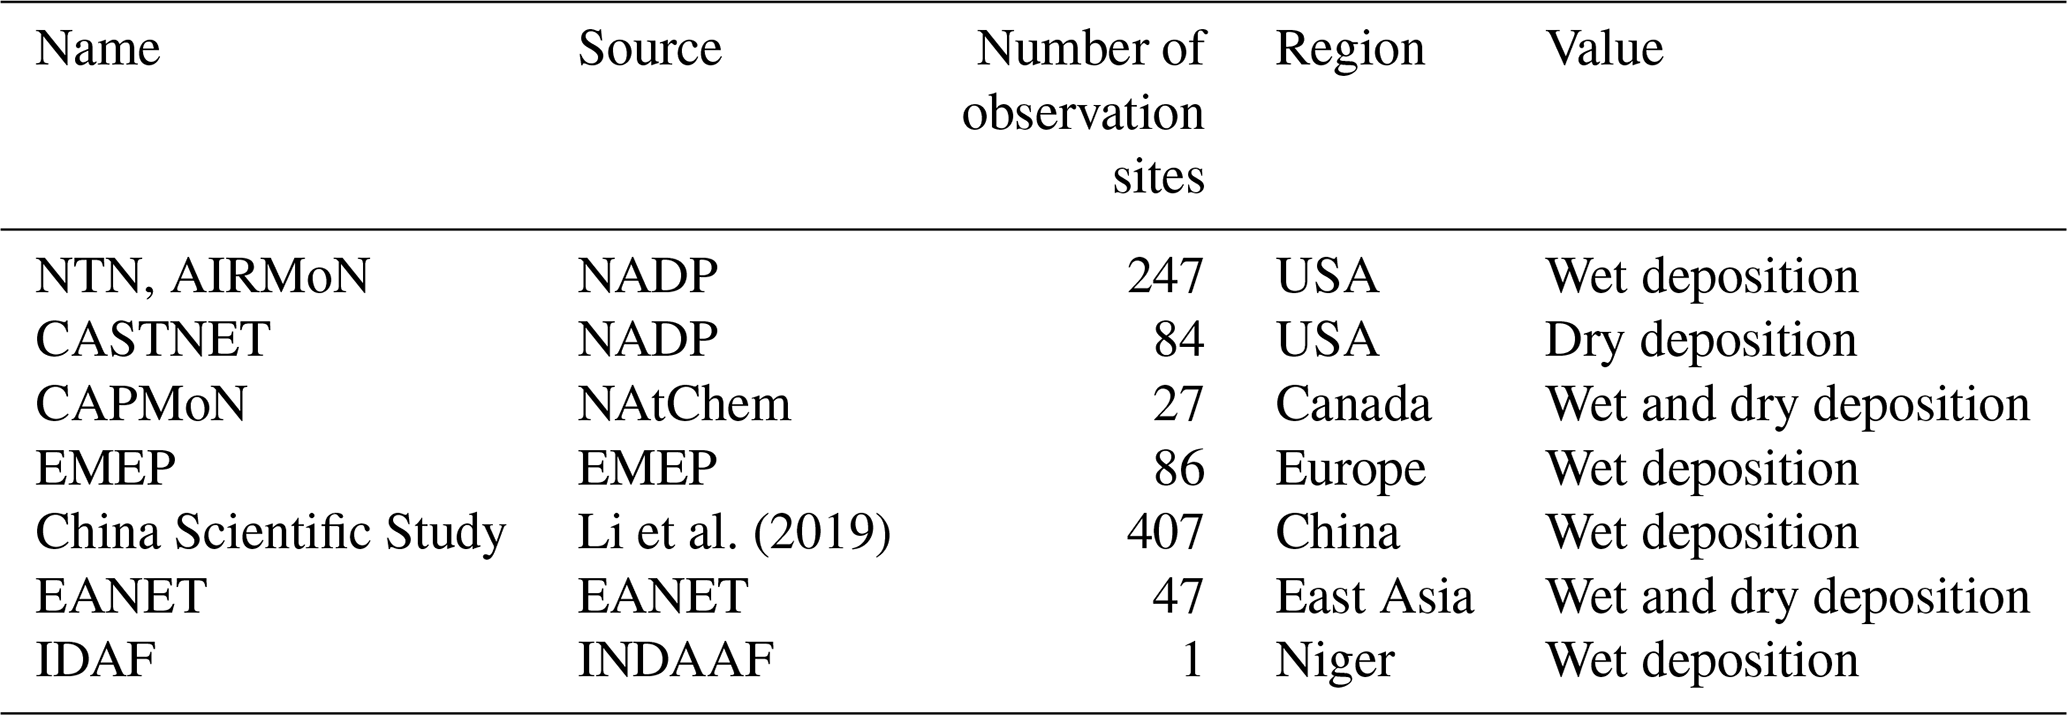
Nitrogen and sulfur wet deposition measurements and dry deposition estimates throughout Canada are recorded by the Canadian Air and Precipitation Monitoring Network (CAPMoN; Canadian Air and Precipitation Monitoring Network, 2021) and are available through the National Atmospheric Chemistry (NAtChem) database (https://donnees.ec.gc.ca/data/air/monitor/, last access: 18 November 2021). Dry deposition estimates from CAPMoN are calculated by multiplying the atmospheric concentration by the deposition velocity. There were 27 sites with a full year of quality-checked data for 2010.
The European Monitoring and Evaluation Programme (EMEP; European Monitoring and Evaluation Programme (EMEP), 2021; Tørseth et al., 2012), http://ebas-data.nilu.no/, last access: 18 November 2021) provides records of precipitation chemistry (, , and ) and precipitation depths for Europe. There were 86 sites with a full year of quality-checked data in 2010.
In China, a multiyear nationwide field study, including some Nationwide Nitrogen Deposition Monitoring Network (NNDMN) data, was compiled by Li et al. (2019). Daily , , and site measurements (in mg L−1) were averaged for 2010 for each of the 407 site locations with complete records by multiplying the concentration by the precipitation recorded at that same site (in mm) and then aggregating the values to produce annual precipitation-weighted deposition (in m2) (Sirois, 1990). For a wider Asian region, EANET (Acid Deposition Monitoring Network in East Asia (EANET), 2021, https://www.eanet.asia/, last access: 18 November 2021) wet and dry deposition and precipitation data were available at 47 sites.
The International Global Atmospheric Chemistry (IGAC) Deposition of Biogeochemically Important Trace Species (DEBITS) Africa (IDAF) program (Adon et al., 2010; Galy-Lacaux et al., 2014) has and precipitation concentrations on the International Network to Study Deposition and Atmospheric Chemistry in Africa (INDAAF, INDAAF – International Network to study Deposition and Atmospheric chemistry in AFrica, 2021a) website (https://indaaf.obs-mip.fr/, last access: 18 November 2021) for one site in Niger. All measurements were converted to milligrams of nitrogen (or S) per square meter per year.
Global yearly wet and dry , , and deposition observations (for wet deposition) or estimates derived from near-surface concentrations and modeled deposition velocities (for dry deposition) were combined with the respective HTAP II model average grid cell estimates, using model output interpolated to common 1∘ × 1∘ grid cells (Fig. 1). For example, wet deposition observations are combined with the wet modeled deposition in the nearest HTAP II MMM grid cell to the observation, where observations exist. An inverse-distance-weighted 1∘ × 1∘ gridded dataset was created based on the distance from each observation to the center of the nearest HTAP II model grid cell. Inverse distance weighting (IDW) was selected as the most straightforward method to implement in order to introduce MMF on a global scale while remaining consistent with previous work (Schwede and Lear, 2014).
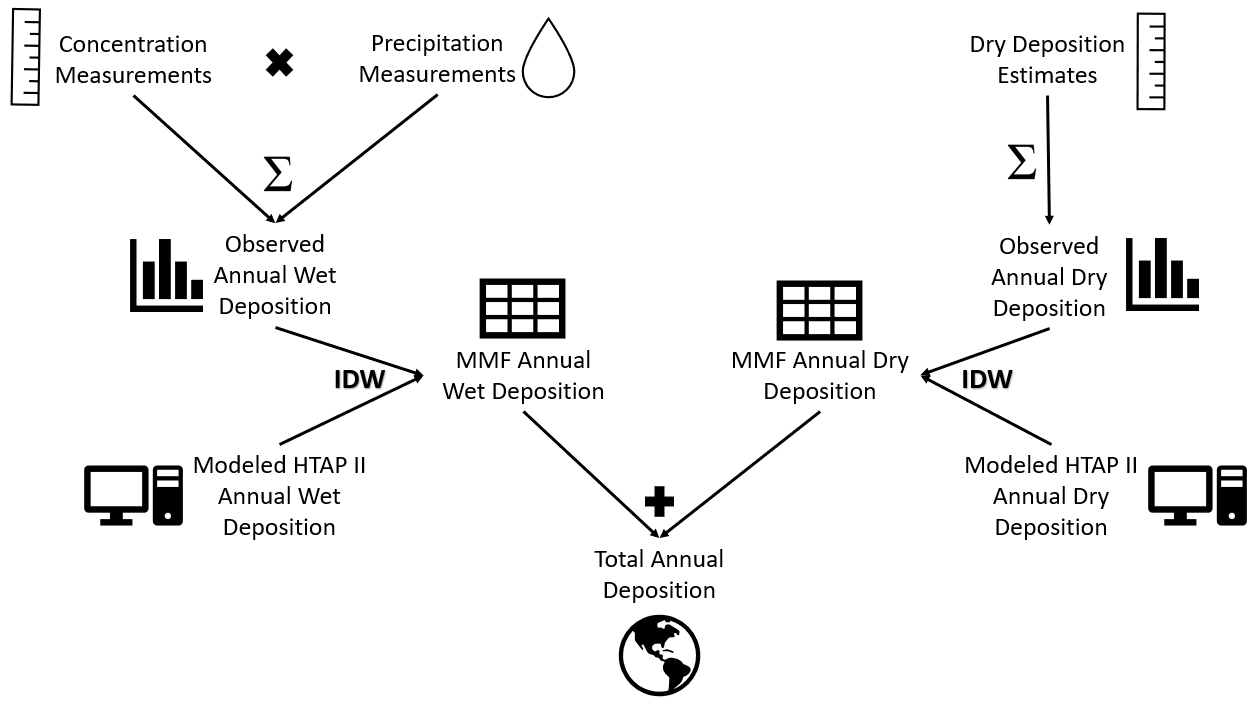
Figure 1A flowchart describing the MMF methodology implemented in this paper.
The weighting function was calculated as follows:
using the Schwede and Lear (2014) approach for the TDep product, where “distance” is the distance between the site location and the center of the HTAP II model grid cell nearest to that sampling site location, within a maximum distance of 2.5∘ (approximately 280 km at middle latitudes). The choice of the maximum distance is a crucial parameter for the inverse distance weighting method in MMF. Prior analysis (e.g., Tan et al., 2018b) has shown that gaseous and particulate sulfur and nitrogen emissions can travel several hundreds of kilometers before being deposited, although there is likely to be a large variation in transport distances due to regional differences in chemistry, meteorological conditions, transport patterns, and removal processes. These processes interact with spatially heterogeneous emissions. As there will not be a single distance that captures the heterogeneity of all processes at play, we present a base case using a 2.5∘ interpolation distance as well as two respective sensitivity cases – (1) reducing the distance to 1∘ and (2) increasing it to 5∘. The 5∘ distance can be seen as an upper limit of the distance to which deposition observations can constrain deposition. The output values of the weighting function at each observation location are then multiplied by the observed deposition. For the center of every HTAP II model grid cell near that site, the modeled deposition is multiplied by 1 minus the value of the weighting function. Consequently, if there are no observations near the model grid cells, the cell value remains the same. The two grid values, (weighting function times observed deposition) and (1 minus the weighting function times modeled deposition), are added together to give the value of the MMF estimate. This has the effect of modifying the HTAP II grid values only in locations where there are observations within the maximum interpolation distance.
The MMF gridded surfaces were then summed by species along with the remaining unchanged HTAP II gridded surfaces that lacked in situ measurements to create total N and S deposition gridded surfaces (e.g., the MMF wet and dry gridded surfaces were added to the HTAP II wet and dry SO2 gridded surfaces to get total S deposition). The MMF wet deposition surfaces include measurements from Europe, Asia, and North America, and the dry deposition MMF surfaces include estimates from the USA and Asia (see Sect. 2)
The total global NHx deposition in 2010 increased from 54.0 Tg N (from HTAP II models) to 54.9 Tg N (Table 2). Combined with an NOy deposition of 59.6 Tg N (from a modeled HTAP II value of 59.3 Tg N), the total global deposition is adjusted to 114.5 Tg N (from 113 Tg N), an increase of 1 %. While IDW tends to decrease deposition over the continents, an increase is calculated over coastal regions and open oceans using the 2.5∘ maximum distance. Total S deposition is adjusted to 88.91 Tg S (Table 2), an increase of 6.5 % compared with the HTAP II model prediction of 83.5 Tg S (Fig. 2b). Regional changes greater than or equal to 10 % are shown in Table 2 in italics.
Table 2The 2010 adjusted global wet and dry deposition (in Tg N or Tg S). MMM indicates the multi-model mean of Tan et al. (2018a), and MMF is this measurement–model fusion work with a 2.5∘ interpolation distance. The 1 and 5∘ interpolation distance results are shown in Tables S1 and S2 in the Supplement. “Coastal” refers to deposition on sea within 1∘ of the coastline. RBU is an abbreviation for Russia, Belarus, and Ukraine. “Open oceans” do not include near-land coastal waters. The regions can be seen in the world map in Fig. S1 in the Supplement. Regional changes greater than or equal to 10 % are italicized.
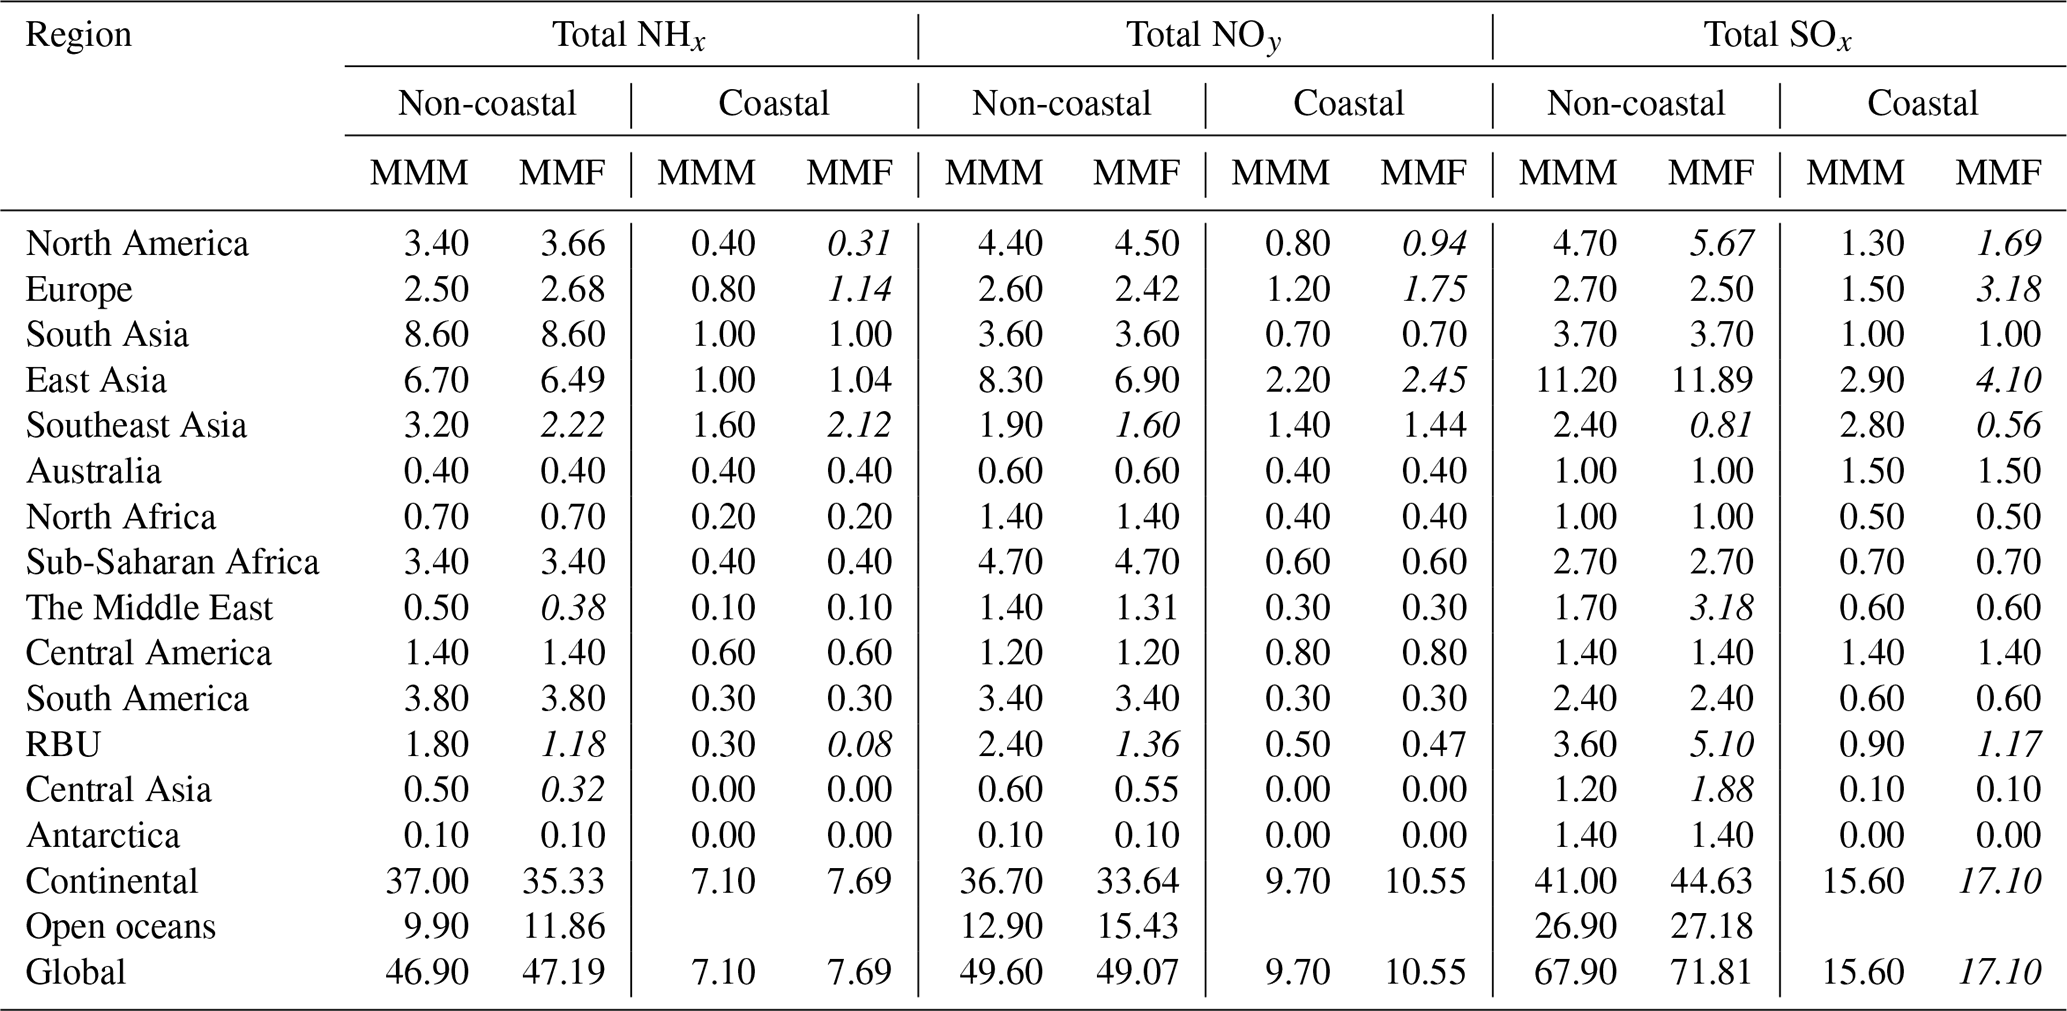
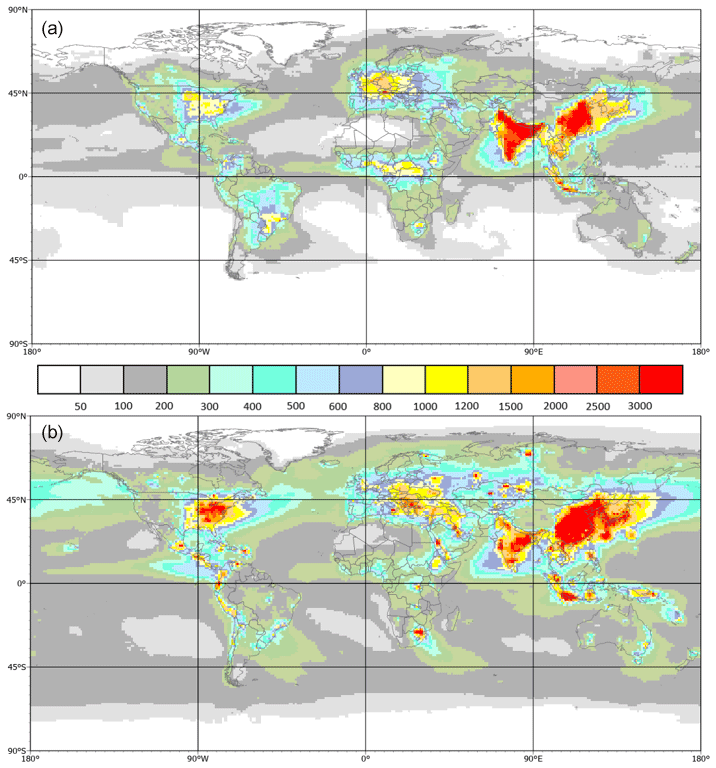
Figure 2Total N and S deposition in 2010 using the MMF approach: (a) total annual N deposition (mg N m−2), the sum of wet and dry and after applying the MMF approach, as well as HTAP II gridded surfaces of dry deposition of NH3, HNO3, and NO2 with no MMF adjustment due to the lack of measurements; (b) total S deposition (mg S m−2), the sum of wet and dry MMF and wet and dry HTAP II SO2.
Tan et al. (2018a) report that their MMM underestimates the high observations of total N deposition at some EMEP stations in Europe. We find that our 2.5∘ interpolation value for European wet N deposition (8.0 Tg) is increased by 12.5 % relative to the MMM surface (7.1 Tg), although the distance to the observations remains high (Fig. 3). Figures 4, S4, and S5 show the difference between HTAP II MMM and MMF nitrogen and sulfur deposition in North America, Europe, and Asia (in mg m−2) with different interpolation distances. As the interpolation distance increases, locations with a single measurement that is very different from the model will influence the surrounding grid cells, causing them to be higher than the model. This effect is particularly pronounced for sulfur deposition in Southeast Asia (Fig. 4 B3) where the MMF procedure increases deposition by up to 250 mg m−2 relative to the MMM values.
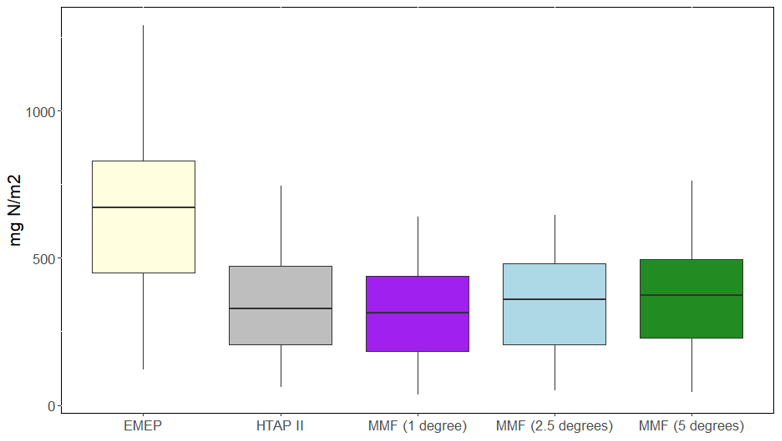
Figure 3A comparison between HTAP II, MMF, and EMEP wet deposition flux results at EMEP observation sites in Europe. A box plot shows the distribution of the EMEP, HTAP II, and MMF modeled wet reactive nitrogen deposition (NHx and NOy) results at each EMEP observation location. Three different interpolation distances are compared using MMF: 1, 2.5, and 5∘.
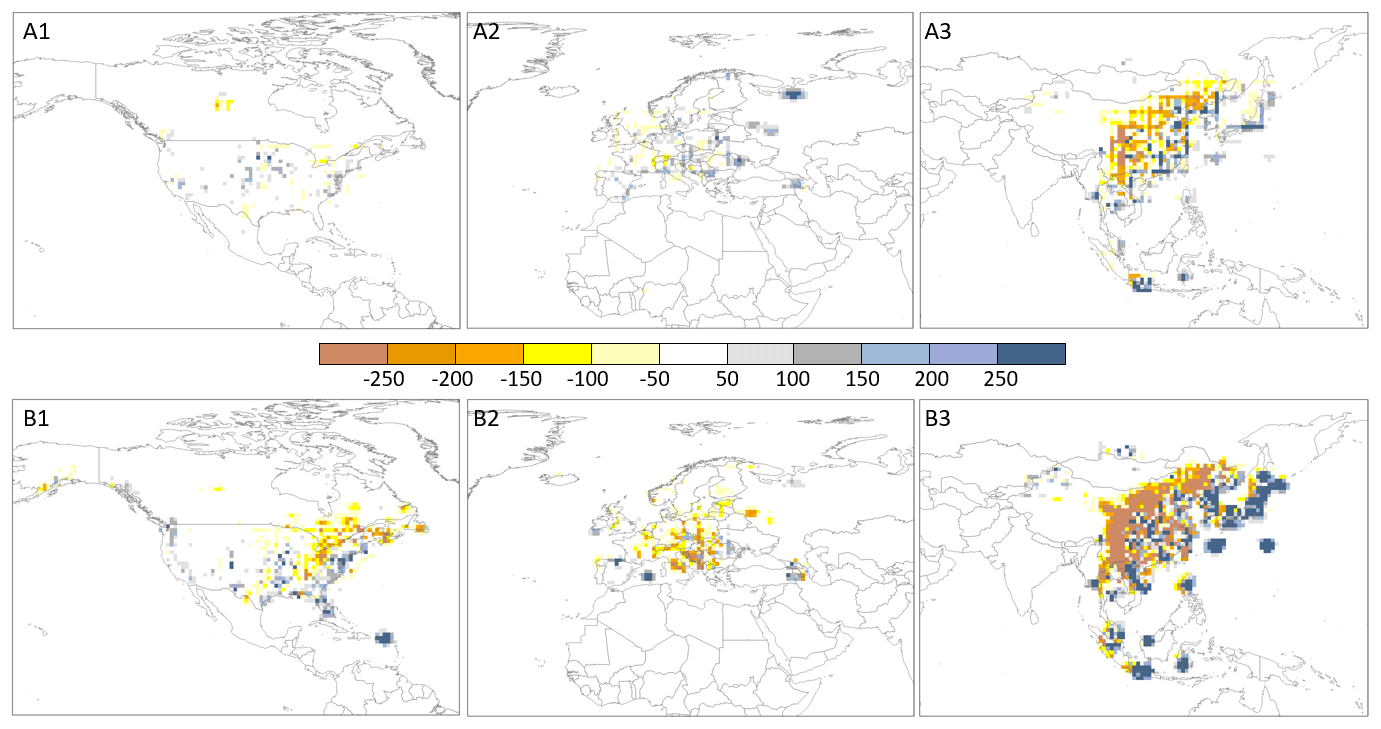
Figure 4The difference between MMF and MMM deposition with a 2.5∘ interpolation distance: (a) MMF minus MMM reactive nitrogen deposition in (A1) North America, (A2) Europe, and (A3) East Asia (in mg N m−2); (b) MMF minus MMM sulfate deposition in (B1) North America, (B2) Europe, and (B3) East Asia (in mg S m−2). Results for other interpolation distances are shown in Figs. S4 and S5, respectively.
The spatial distribution is slightly different, with more deposition in coastal areas in the MMF estimate (Table 2). Tan et al. (2018a) report that the HTAP II MMM overestimates wet deposition in North America but underestimates deposition. We find that the MMF interpolated deposition slightly improves these estimates, although the spatial distribution is very similar to the MMM (Figs. 2, 5). The largest change for S deposition (comparing MMM and MMF) is in grid cells classified as ocean because of an increase in deposition in East and Southeast Asia; this deposition mostly occurs in areas classified as ocean due to the small island size relative to the coarse spatial resolution of the models. We note that, ocean cells were classified as such if they were located further than 1∘ from the mainland; therefore, any islands smaller than 1∘ were counted as the ocean.
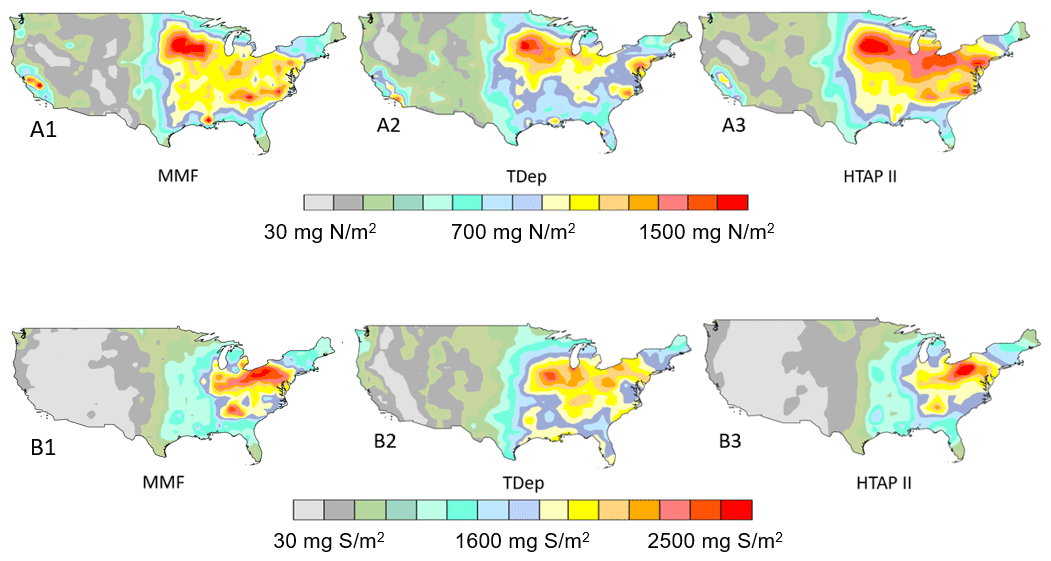
Figure 5(a) The 2010 total N deposition in the continental USA as modeled with (1) MMF (this work), (2) the TDep annual map available from the NADP, and (3) the multi-model mean HTAP II output of Tan et al. (2018a). (b) The 2010 SOx wet deposition in the USA as modeled with (1) MMF (this work), (2) the TDep annual map available from the NADP, and (3) the multi-model mean HTAP II output of Tan et al. (2018a).
There are spatial differences between an aggregated 1∘ × 1∘ version of the original TDep map of nitrogen deposition for the USA, as available from the NADP (Fig. 5 A2); the HTAP II (Fig. 5 A3) deposition produced by Tan et al. (2018a), corresponding to the same area; and the deposition map produced in this work (Fig. 5 A1). A similar pattern is seen in the map of deposition (Fig. 5 B1–B3). While the TDep maps have been aggregated to the 1∘ × 1∘ resolution of the HTAP fields, there is still different regional variation in the deposition patterns in the TDep maps compared with the HTAP II maps. In particular, TDep captures higher west coast values that HTAP II does not while showing lower values in the Midwest, New York, and Pennsylvania regions.
The R2 value for the linear regression between MMF wet and observed NHx wet in the USA is 0.64 (Fig. 6). The R2 value for the linear regression between the HTAP II wet and observed NHx is 0.0.60, whereas this value is 0.89 for the linear regression between the TDep wet and observed NHx (Fig. 6). This means that TDep more successfully reproduces the NADP-NTN measurements and their spatial differences, whereas the MMF fields remain more similar to the HTAP II ensemble model output. The higher TDep R2 value likely occurs because of the finer mesh (12 km) used in the TDep product, the closer proximity to individual stations compared with HTAP II used in the MMF approach, and the ability of the regional model to capture gradients. In principle, emissions should be the same, but they are averaged over larger areas in global models. All three datasets produce similar values to the measured wet SOx deposition at the NADP-NTN sites (Fig. 6). The NH4 and NO3 wet deposition values are shown in Figs. S2 and S3, and they have much lower correlations (for all three interpolation distances), with R2 values of 0.1 for NO3 and 0.53 for NH4 at a 2.5∘ weighted distance.
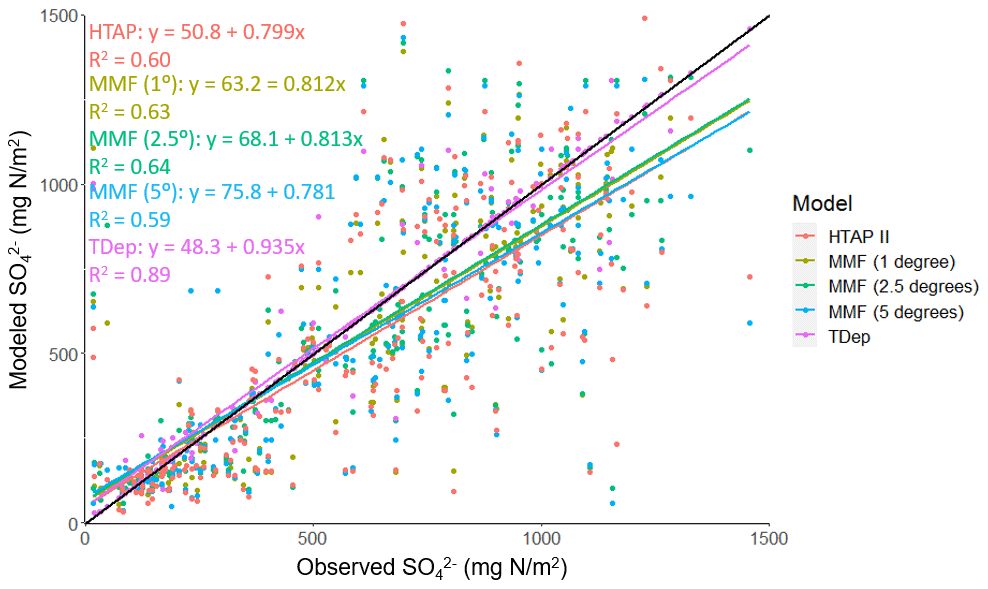
Figure 6Observed and modeled wet deposition in the USA in 2010. Each point represents an NADP-NTN wet deposition measurement and the associated HTAP II, TDep, or MMF NHx wet deposition modeled value. The black line is the 1:1 line. Similar plots are shown in Figs. S2 and S3 for wet NO3 and wet NH4.
5.1 Consistency of MMF deposition with global emission estimates
Geddes and Martin (2017) used satellite observations to report global NOy emissions of 57.5 Tg N yr−1 in 2010, similar to the 60.4 Tg N emissions reported by HTAP II. This matches well with our total global MMF-derived NOy deposition (58.1 Tg N). HTAP II ammonia emissions were 59.3 Tg N, slightly lower than the MMF NH3 and deposition of 62.3 Tg N. The total MMM sulfur emissions for 2010 were 90.7 Tg S, very similar to the MMF sulfur deposition of 88.9 Tg N.
5.2 Deposition over China
A promising dataset of wet deposition measurements (, , and ) in China is available through the NNDMN (Xu et al., 2019). It is comparable to other regional measurements (Wen et al., 2020). However, these data only exist for a fraction of 2010 (from September onwards) for a few sites; rather than use partial data to represent an entire year, these sites were not included in our study. Research in China (Liu et al., 2020) analyzed the spatial pattern of N deposition by combining satellite observations with NNDMN deposition measurements (Xu et al., 2019); they found a 2012 average of 18.21 kg N ha−1 for China. Additional work combining the GEOS-Chem (https://geoschem.github.io/, last access: 10 June 2023) model with satellite observations and surface measurements reported the average annual deposition from 2008 to 2012 as 16.4 Tg N, with 10.2 Tg N from NHx and 6.2 Tg N from NOy (Zhao et al., 2017). The averages reported by these studies are consistent with ours (16.9 ), despite the difference in year and spatial resolution. The spatial pattern of N deposition in 2010 (Fig. 2a) also remains similar to that of previous decades (Jia et al., 2014), with high deposition in eastern China and low deposition over the Tibetan Plateau. This pattern is confirmed in 2006 and 2013 (Qu et al., 2017).
5.3 Limitations of interpolation
As seen in Table 2, the largest difference between MMM and MMF is found in coastal regions and particularly the open ocean. While MMF does give improved deposition estimates by incorporating in situ measurements, it is worth considering the scale of the model. Observations of deposition are probably not representative in all regions for a 1∘ or larger resolution, and observations of precipitation may also not be homogenous in all directions at that scale, especially over heterogeneous terrain. Therefore, for example, the coarse resolution of the model, even with added measurements, is likely not accurately capturing gradients between coastal and inland deposition. While higher-resolution precipitation values are available in some regions (e.g., PRISM in the USA), there is still a dearth of both wet and dry deposition measurements. Even on the North American continental scale, Schwede et al. (2011) showed that partially overlapping dry deposition estimates from CASTNET (USA) and CAPMoN (Canada) can be very different, despite using similar methodologies. This adds uncertainty to the dry deposition data (although there are very few dry deposition estimates included in this study) and emphasizes the importance of understanding deposition velocity model methodology.
The differences between the TDep, MMM, and MMF gridded deposition (Fig. 5) are clearly visible in the center of the USA. While the general patterns of deposition are similar for the three products, the magnitude of deposition in the aggregated TDep dataset (1∘ × 1∘) is higher in the eastern USA and lower in the western USA than either of the other two deposition fields. This difference is likely due to the precipitation dataset used to calculate wet deposition. The MMF deposition is based on the MMM dataset; therefore, both utilize the same precipitation dataset, from a combination of 11 global models. However, TDep wet deposition is produced by multiplying PRISM precipitation data and an interpolated gridded surface dataset of wet concentrations. PRISM is a reanalysis product designed to interpolate precipitation in particularly complex landscapes using weather radar and rainfall gauge observations, although it is not identical to observations because it used long-term averages as predictor grids (Zhang et al., 2018). It captures much more localized variation in precipitation due to geographical variations which are not captured in the lower-resolution global precipitation models used in the HTAP II MMM (Tan et al., 2018a). To illustrate this, we compare PRISM to the available Community Atmosphere Model with Chemistry (CAM-Chem; https://www2.acom.ucar.edu/gcm/cam-chem, last access: 1 October 2022), which was one of the models in the HTAP II ensemble. Subtracting the CAM-Chem precipitation output over the USA from aggregated PRISM precipitation shows that CAM-Chem greatly underestimates precipitation volume in the USA in 2010 (Fig. S6). We note, however, that this comparison does not take differences in precipitation frequency between the model and observations into account. This matters because the difference in precipitation volume will not influence the overall wet deposition values much if it comes from a few large-magnitude storms. This is a good example of the differences that occur when comparing global and regional climate models and serves to emphasize the importance of resolving spatial and temporal scales. The total deposition within the USA borders is similar for the MMF, HTAP II, and aggregated TDep gridded surfaces; however, the spatial distribution is different.
MMF and MMM deposition distributions are similar because MMF is based on HTAP II. Likewise, the MMF results are similar to the TDep values at observation locations because, despite the difference in precipitation, both utilize the same NADP-NTN measurements to constrain the models. The key difference between MMF, when compared to MMM, is that measurement locations are not centered in each 1∘ × 1∘ grid cell; therefore, the center of each grid cell (the value compared to the observation, by interpolation to the station location) will not exactly equal the measured deposition but will instead be equal to the measurements weighted proportionally to distance from the centroid. This means that the graphical comparison in Fig. 6 is showing the actual measurement locations and three different model results with some meaningful influence from measurements that are nonetheless unique values, except in the very rare instance that the measurement corresponds exactly to the center of a grid cell. Figure 6 shows a stronger correlation for SO4 than Figs. S2 and S3 do for the nitrogen species. This could be related to the relatively shorter timescales of NOy and NHx in the atmosphere. The relatively coarse resolution of the global models cannot deal with these gradients, so the shorter timescales are reflected in the observations which are, therefore, less representative of the larger grid scales of the models.
TDep maps of North American nitrogen deposition created with the methodology of Schwede and Lear (2014), using IDW, are widely in use and freely available from the NADP. The sensitivity analysis demonstrates that the influence of the observations on the HTAP II grid increases as the interpolation distance increases, thereby smoothing some of the artifacts that can occur using a small interpolation distance (Figs. 6, S2, S3). In this respect, it is worth mentioning that the original TDep dataset for North America used a maximum distance of 30 km plus half the cell size of PRISM (2.07 km). While it is not entirely clear how this distance was determined, operational factors such as the station density and the grid size of the regional model are likely important factors. In contrast, the maximum distances explored in this study are much larger (1, 2.5, and 5∘) and are more adapted to the grid size of the current generation of global atmospheric chemistry transport models and to considerations of transport distances of atmospheric components. From our analysis, there is no obvious better weighting distance that improves the comparison with observations. An adaptive distance weighting that considers the expected gradients between the observation point and the remote model grid could be explored as a way forward.
However, there are strong limitations associated with using IDW (Sahu et al., 2010), and other interpolation methods such as kriging or geographically weighted regression could provide smoother surfaces with fewer artifacts. IDW is a fast and flexible interpolation method, but it does not minimize error and can produce inaccurate results in regions with sparse measurements and large sub-grid variability. This problem is relevant to much of the world. The lack of measurement sites globally is a hindrance that can be alleviated by including information obtained from satellite remote sensing (Walker et al., 2019). Future work should also investigate methods such as machine learning techniques with spatial information to avoid these limitations.
These results from measurement–model fusion are important because previous methods on a global scale have relied primarily on models (Vet et al., 2014; Tan et al., 2018a). They compare their results with measurements, of course, in order to demonstrate the model capabilities, but they do not explicitly incorporate point measurements into the final product. Our results serve to emphasize that global models are adequately simulating deposition (in terms of total deposition budgets) but that the regional discrepancies between models and measurements can still be quite large; measurement–model fusion helps to ameliorate this without changing the fundamental model parameters and processes that actually capture the overall deposition reasonably well.
The deposition of sulfur and nitrogen remains a serious concern for human and ecosystem health. We update the 2010 deposition budgets using measurement–model fusion to combine the broad spatial coverage of a model with accurate in situ measurements. The total nitrogen deposition budget is recalculated to 114.50 Tg N and the sulfur budget is recalculated to 88.91 Tg N, representing about a 1 % and 6.5 % increase, respectively, from the modeled values. This work emphasizes the necessity to combine models with observations wherever possible in order to better capture regional patterns and to inform policy and decision-making. Future work to improve measurement–model fusion should investigate more advanced MMF methods to avoid the limitations associated with IDW, such as surface artifacts and high error in regions with sparse measurements. It could also incorporate satellite remote-sensing-derived concentrations to improve model estimates where in situ measurements are not available, but a careful error analysis is needed to avoid spurious results.
The original code is available in the author’s GitHub repository: https://github.com/HJRubin/Rubin_et_al_ACP2023 (Rubin, 2023). The HTAP II models to create the 11-model ensemble (Tan et al., 2018a, https://doi.org/10.5194/acp-18-6847-2018) can be accessed via the United Nations' Task Force on Hemispheric Transport of Air Pollution participating modeling groups. The NTN observations can be accessed through the NADP website data export portal (https://nadp.slh.wisc.edu/networks/national-trends-network/, National Atmospheric Deposition Program, 2023). The AIRMoN observations are also available through the NADP website (https://nadp2.slh.wisc.edu/data/AIRMoN/, National Atmospheric Deposition Program, 2020). The CASTNET observations are available through the EPA website (https://www.epa.gov/castnet/download-data, US Environmental Protection Agency, 2023b). CAPMoN observations are available through the Environment Canada Data Catalogue (https://donnees.ec.gc.ca/data/air/monitor/, Government of Canada, 2021). EMEP observations are available through the EBAS repository operated by the Norwegian Institute for Air Research (https://ebas-data.nilu.no/Default.aspx, NILU, 2023). The China Scientific Study observations were compiled by Li et al. (2019, https://doi.org/10.5194/acp-19-11043-2019). EANET observations can be downloaded from the EANET website (https://monitoring.eanet.asia/document/public/index, Acid Deposition Monitoring Network in East Asia, 2021). IDAF observations are available through the INDAAF website (https://indaaf.obs-mip.fr/catalogue/, International Network to study Deposition and Atmospheric composition in AFrica, 2021b). CMAQ can be compiled from source code available on the US EPA website (https://www.epa.gov/cmaq/access-cmaq-source-code, US Environmental Protection Agency, 2023a). CAM-Chem (Lamarque et al., 2012, https://doi.org/10.5194/gmd-5-369-2012) and other models can be accessed through the National Center for Atmospheric Research (NCAR) website (https://www2.acom.ucar.edu/gcm/cam-chem, NCAR, 2023). PRISM climate grids can be found through the PRISM Climate Group at Oregon State University (https://prism.oregonstate.edu/recent/, PRISM Climate Group, 2023).
The supplement related to this article is available online at: https://doi.org/10.5194/acp-23-7091-2023-supplement.
HJR carried out the methods and analyzed the results. JSF and FD designed the project. HJR prepared the manuscript with contributions from JSF and FD. RL, KH, and HF provided data.
The contact author has declared that none of the authors has any competing interests.
Publisher's note: Copernicus Publications remains neutral with regard to jurisdictional claims in published maps and institutional affiliations.
This research used resources of the Oak Ridge Leadership Computing Facility at the Oak Ridge National Laboratory, which is supported by the Office of Science of the U.S. Department of Energy.
This research has been supported by the Office of Science of the U.S. Department of Energy (contract no. DE-AC05-00OR22725).
This paper was edited by Yafang Cheng and reviewed by three anonymous referees.
Acid Deposition Monitoring Network in East Asia (EANET): EANET observations, Data Report, https://monitoring.eanet.asia/document/public/index (last access: 19 June 2023), 2021.
Adon, M., Galy-Lacaux, C., Yoboué, V., Delon, C., Lacaux, J. P., Castera, P., Gardrat, E., Pienaar, J., Al Ourabi, H., Laouali, D., Diop, B., Sigha-Nkamdjou, L., Akpo, A., Tathy, J. P., Lavenu, F., and Mougin, E.: Long term measurements of sulfur dioxide, nitrogen dioxide, ammonia, nitric acid and ozone in Africa using passive samplers, Atmos. Chem. Phys., 10, 7467–7487, https://doi.org/10.5194/acp-10-7467-2010, 2010.
Anderson, D. M., Burkholder, J. M., Cochlan, W. P., Glibert, P. M., Gobler, C. J., Heil, C. A., Kudela, R. M., Parsons, M. L., Rensel, J. E. J., Townsend, D. W., Trainer, V. L., and Vargo, G. A.: Harmful algal blooms and eutrophication: Examining linkages from selected coastal regions of the United States, Harmful Algae, 8, 39–53, https://doi.org/10.1016/j.hal.2008.08.017, 2008.
Bobbink, R., Hicks, K., Galloway, J., Spranger, T., Alkemade, R., Ashmore, M., Bustamante, M., Cinderby, S., Davidson, E., Dentener, F., Emmett, B., Erisman, J.-W., Fenn, M., Gilliam, F., Nordin, A., Pardo, L., and Vries, W. D.: Global assessment of nitrogen deposition effects on terrestrial plant diversity: a synthesis, Ecol. Appl., 20, 30–59, https://doi.org/10.1890/08-1140.1, 2010.
Bowman, W. D., Cleveland, C. C., Halada, Ĺ., Hreško, J., and Baron, J. S.: Negative impact of nitrogen deposition on soil buffering capacity, Nat. Geosci., 1, 767–770, https://doi.org/10.1038/ngeo339, 2008.
Canadian Air and Precipitation Monitoring Network, https://www.canada.ca/en/environment-climate-change/services/air-pollution/monitoring-networks-data/canadian-air-precipitation.html (last access: 18 November 2021), 2021.
Clark, C. M., Bai, Y., Bowman, W. D., Cowles, J. M., Fenn, M. E., Gilliam, F. S., Phoenix, G. K., Siddique, I., Stevens, C. J., Sverdrup, H. U., and Throop, H. L.: Nitrogen Deposition and Terrestrial Biodiversity, in: Encyclopedia of Biodiversity, Elsevier, 519–536, https://doi.org/10.1016/B978-0-12-384719-5.00366-X, 2013.
Clean Air Status and Trends Network (CASTNET), https://www.epa.gov/castnet (last access: 18 November 2021), 2021.
de Vries, W., Solberg, S., Dobbertin, M., Sterba, H., Laubhann, D., van Oijen, M., Evans, C., Gundersen, P., Kros, J., Wamelink, G. W. W., Reinds, G. J., and Sutton, M. A.: The impact of nitrogen deposition on carbon sequestration by European forests and heathlands, Forest Ecol. Manag., 258, 1814–1823, https://doi.org/10.1016/j.foreco.2009.02.034, 2009.
Dentener, F., Drevet, J., Lamarque, J. F., Bey, I., Eickhout, B., Fiore, A. M., Hauglustaine, D., Horowitz, L. W., Krol, M., Kulshrestha, U. C., Lawrence, M., Galy-Lacaux, C., Rast, S., Shindell, D., Stevenson, D., Noije, T. V., Atherton, C., Bell, N., Bergman, D., Butler, T., Cofala, J., Collins, B., Doherty, R., Ellingsen, K., Galloway, J., Gauss, M., Montanaro, V., Müller, J. F., Pitari, G., Rodriguez, J., Sanderson, M., Solmon, F., Strahan, S., Schultz, M., Sudo, K., Szopa, S., and Wild, O.: Nitrogen and sulfur deposition on regional and global scales: A multimodel evaluation, Global Biogeochem. Cy., 20, GB4003, https://doi.org/10.1029/2005GB002672, 2006.
Dise, N. B. and Stevens, J.: Nitrogen deposition and reduction of terrestrial biodiversity: Evidence from temperate grasslands, Sci. China Ser. C, 48, 720–728, 2005.
Doney, S. C., Mahowald, N., Lima, I., Feely, R. A., Mackenzie, F. T., Lamarque, J.-F., and Rasch, P. J.: Impact of anthropogenic atmospheric nitrogen and sulfur deposition on ocean acidification and the inorganic carbon system, P. Natl. Acad. Sci. USA, 104, 14580–14585, https://doi.org/10.1073/pnas.0702218104, 2007.
EANET – Acid Deposition Monitoring Network in East Asia, https://www.eanet.asia/ (last access: 18 November 2021), 2021.
European Monitoring and Evaluation Programme (EMEP), https://www.emep.int/ (last access: 18 November 2021), 2021.
Fu, J. S., Carmichael, G. R., Dentener, F., Aas, W., Andersson, C., Barrie, L. A., Cole, A., Galy-Lacaux, C., Geddes, J., Itahashi, S., Kanakidou, M., Labrador, L., Paulot, F., Schwede, D., Tan, J., and Vet, R.: Improving Estimates of Sulfur, Nitrogen, and Ozone Total Deposition through Multi-Model and Measurement-Model Fusion Approaches, Environ. Sci. Technol., 56, 2134–2142, https://doi.org/10.1021/acs.est.1c05929, 2022.
Galy-Lacaux, C., Delon, C., Solmon, F., Adon, M., Yoboué, V., Mphepya, J., Pienaar, J. J., Diop, B., Sigha, L., Dungall, L., Akpo, A., Mougin, E., Gardrat, E., and Castera, P.: Dry and Wet Atmospheric Nitrogen Deposition in West Central Africa, in: Nitrogen Deposition, Critical Loads and Biodiversity, edited by: Sutton, M. A., Mason, K. E., Sheppard, L. J., Sverdrup, H., Haeuber, R., and Hicks, W. K., Springer Netherlands, Dordrecht, 83–91, https://doi.org/10.1007/978-94-007-7939-6_10, 2014.
Geddes, J. A. and Martin, R. V.: Global deposition of total reactive nitrogen oxides from 1996 to 2014 constrained with satellite observations of NO2 columns, Atmos. Chem. Phys., 17, 10071–10091, https://doi.org/10.5194/acp-17-10071-2017, 2017.
Government of Canada: Environment and Climate Change Canada Data: CAPMoN observations, Government of Canada [data set], https://donnees.ec.gc.ca/data/air/monitor/ (last access: 19 June 2023), 2021.
Heisler, J., Glibert, P. M., Burkholder, J. M., Anderson, D. M., Cochlan, W., Dennison, W. C., Dortch, Q., Gobler, C. J., Heil, C. A., Humphries, E., Lewitus, A., Magnien, R., Marshall, H. G., Sellner, K., Stockwell, D. A., Stoecker, D. K., and Suddleson, M.: Eutrophication and harmful algal blooms: A scientific consensus, Harmful Algae, 8, 3–13, https://doi.org/10.1016/j.hal.2008.08.006, 2008.
International Network to study Deposition and Atmospheric composition in AFrica (INDAAF): https://indaaf.obs-mip.fr/ (last access: 18 November 2021), 2021a.
International Network to study Deposition and Atmospheric composition in AFrica (INDAAF): Database, https://indaaf.obs-mip.fr/catalogue/ (last access: 19 June 2023), 2021b.
Jia, Y., Yu, G., He, N., Zhan, X., Fang, H., Sheng, W., Zuo, Y., Zhang, D., and Wang, Q.: Spatial and decadal variations in inorganic nitrogen wet deposition in China induced by human activity, Sci. Rep., 4, 3763, https://doi.org/10.1038/srep03763, 2014.
Kicklighter, D. W., Melillo, J. M., Monier, E., Sokolov, A. P., and Zhuang, Q.: Future nitrogen availability and its effect on carbon sequestration in Northern Eurasia, Nat. Commun., 10, 3024, https://doi.org/10.1038/s41467-019-10944-0, 2019.
Labrador, L., Volosciuk, C., and Cole, A.: Measurement-Model Fusion for Global Total Atmospheric Deposition, a WMO initiative, World Meteorological Organization, https://public.wmo.int/en/resources/bulletin/measurement- model-fusion-global-total-atmospheric-deposition-wmo-initiative (last access: 1 October 2022), 2020.
Lamarque, J.-F., Emmons, L. K., Hess, P. G., Kinnison, D. E., Tilmes, S., Vitt, F., Heald, C. L., Holland, E. A., Lauritzen, P. H., Neu, J., Orlando, J. J., Rasch, P. J., and Tyndall, G. K.: CAM-chem: description and evaluation of interactive atmospheric chemistry in the Community Earth System Model, Geosci. Model Dev., 5, 369–411, https://doi.org/10.5194/gmd-5-369-2012, 2012.
Lamarque, J.-F., Dentener, F., McConnell, J., Ro, C.-U., Shaw, M., Vet, R., Bergmann, D., Cameron-Smith, P., Dalsoren, S., Doherty, R., Faluvegi, G., Ghan, S. J., Josse, B., Lee, Y. H., MacKenzie, I. A., Plummer, D., Shindell, D. T., Skeie, R. B., Stevenson, D. S., Strode, S., Zeng, G., Curran, M., Dahl-Jensen, D., Das, S., Fritzsche, D., and Nolan, M.: Multi-model mean nitrogen and sulfur deposition from the Atmospheric Chemistry and Climate Model Intercomparison Project (ACCMIP): evaluation of historical and projected future changes, Atmos. Chem. Phys., 13, 7997–8018, https://doi.org/10.5194/acp-13-7997-2013, 2013.
Li, R., Cui, L., Zhao, Y., Zhang, Z., Sun, T., Li, J., Zhou, W., Meng, Y., Huang, K., and Fu, H.: Wet deposition of inorganic ions in 320 cities across China: spatio-temporal variation, source apportionment, and dominant factors, Atmos. Chem. Phys., 19, 11043–11070, https://doi.org/10.5194/acp-19-11043-2019, 2019.
Liu, L., Zhang, X., Xu, W., Liu, X., Zhang, Y., Li, Y., Wei, J., Lu, X., Wang, S., Zhang, W., Zhao, L., Wang, Z., and Wu, X.: Fall of oxidized while rise of reduced reactive nitrogen deposition in China, J. Clean. Prod., 272, 122875, https://doi.org/10.1016/j.jclepro.2020.122875, 2020.
Lu, Z., Streets, D. G., Zhang, Q., Wang, S., Carmichael, G. R., Cheng, Y. F., Wei, C., Chin, M., Diehl, T., and Tan, Q.: Sulfur dioxide emissions in China and sulfur trends in East Asia since 2000, Atmos. Chem. Phys., 10, 6311–6331, https://doi.org/10.5194/acp-10-6311-2010, 2010.
Luo, X. S., Tang, A. H., Shi, K., Wu, L. H., Li, W. Q., Shi, W. Q., Shi, X. K., Erisman, J. W., Zhang, F. S., and Liu, X. J.: Chinese coastal seas are facing heavy atmospheric nitrogen deposition, Environ. Res. Lett., 9, 095007, https://doi.org/10.1088/1748-9326/9/9/095007, 2014.
National Atmospheric Deposition Program (NADP): AIRMoN observations: AIRMoN Data, NADP [data set] https://nadp2.slh.wisc.edu/data/AIRMoN/, 2020.
National Atmospheric Deposition Program (NADP): https://nadp.slh.wisc.edu/ (last access: 18 November 2021), 2021.
National Atmospheric Deposition Program (NADP): National Trends Network, https://nadp.slh.wisc.edu/networks/national-trends-network/ (last access: 19 June 2023), 2023.
National Center for Atmospheric Research (NCAR): Community Atmosphere Model with Chemistry (CAM-chem), https://www2.acom.ucar.edu/gcm/cam-chem, last access: 1 October 2022.
NILU (Norwegian Institute for Air Research): EBAS database, https://ebas-data.nilu.no/Default.aspx (last access: 19 June 2023), 2023.
PRISM Climate Group: https://prism.oregonstate.edu/recent/ (last access: 19 June 2023), 2023.
Qu, L., Xiao, H., Zheng, N., Zhang, Z., and Xu, Y.: Comparison of four methods for spatial interpolation of estimated atmospheric nitrogen deposition in South China, Environ. Sci. Pollut. R., 24, 2578–2588, https://doi.org/10.1007/s11356-016-7995-0, 2017.
Rubin, H. J.: Rubin_et_al_ACP2023, GitHub [code] https://github.com/HJRubin/Rubin_et_al_ACP2023 (last access: 16 June 2023), 2023.
Sahu, S. K., Gelfand, A. E., and Holland, D. M.: Fusing point and areal level space–time data with application to wet deposition, J. R. Stat. Soc. C-Appl., 59, 77–103, https://doi.org/10.1111/j.1467-9876.2009.00685.x, 2010.
Schwede, D., Zhang, L., Vet, R., and Lear, G.: An intercomparison of the deposition models used in the CASTNET and CAPMoN networks, Atmos. Environ., 45, 1337–1346, https://doi.org/10.1016/j.atmosenv.2010.11.050, 2011.
Schwede, D., Cole, A., Vet, R., and Lear, G.: Ongoing US-Canada collaborations on nitrogen and sulfur deposition, EM (Pittsburgh Pa), PMID: 33658748; PMCID: PMC7923747, 2019.
Schwede, D. B. and Lear, G. G.: A novel hybrid approach for estimating total deposition in the United States, Atmos. Environ., 92, 207–220, https://doi.org/10.1016/j.atmosenv.2014.04.008, 2014.
Sirois, A.: The effects of missing data on the calculation of precipitation-weighted-mean concentrations in wet deposition, Atmos. Environ. A-Gen., 24, 2277–2288, https://doi.org/10.1016/0960-1686(90)90321-D, 1990.
Tan, J., Fu, J. S., Dentener, F., Sun, J., Emmons, L., Tilmes, S., Sudo, K., Flemming, J., Jonson, J. E., Gravel, S., Bian, H., Davila, Y., Henze, D. K., Lund, M. T., Kucsera, T., Takemura, T., and Keating, T.: Multi-model study of HTAP II on sulfur and nitrogen deposition, Atmos. Chem. Phys., 18, 6847–6866, https://doi.org/10.5194/acp-18-6847-2018, 2018a.
Tan, J., Fu, J. S., Dentener, F., Sun, J., Emmons, L., Tilmes, S., Flemming, J., Takemura, T., Bian, H., Zhu, Q., Yang, C.-E., and Keating, T.: Source contributions to sulfur and nitrogen deposition – an HTAP II multi-model study on hemispheric transport, Atmos. Chem. Phys., 18, 12223–12240, https://doi.org/10.5194/acp-18-12223-2018, 2018b.
Tørseth, K., Aas, W., Breivik, K., Fjæraa, A. M., Fiebig, M., Hjellbrekke, A. G., Lund Myhre, C., Solberg, S., and Yttri, K. E.: Introduction to the European Monitoring and Evaluation Programme (EMEP) and observed atmospheric composition change during 1972–2009, Atmos. Chem. Phys., 12, 5447–5481, https://doi.org/10.5194/acp-12-5447-2012, 2012.
US Environmental Protection Agency (EPA): CMAQ, Github [code], https://github.com/USEPA/CMAQ (last access: 19 June 2023), 2023a.
US Environmental Protection Agency (EPA): CASTNET observations: CASTNET, US EPA [data set], https://www.epa.gov/castnet/download-data (last access: 19 June 2023), 2023b.
Vet, R., Artz, R. S., Carou, S., Shaw, M., Ro, C.-U., Aas, W., Baker, A., Bowersox, V. C., Dentener, F., Galy-Lacaux, C., Hou, A., Pienaar, J. J., Gillett, R., Forti, M. C., Gromov, S., Hara, H., Khodzher, T., Mahowald, N. M., Nickovic, S., Rao, P. S. P., and Reid, N. W.: A global assessment of precipitation chemistry and deposition of sulfur, nitrogen, sea salt, base cations, organic acids, acidity and pH, and phosphorus, Atmos. Environ., 93, 3–100, https://doi.org/10.1016/j.atmosenv.2013.10.060, 2014.
Walker, J. T., Beachley, G., Amos, H. M., Baron, J. S., Bash, J., Baumgardner, R., Bell, M. D., Benedict, K. B., Chen, X., Clow, D. W., Cole, A., Coughlin, J. G., Cruz, K., Daly, R. W., Decina, S. M., Elliott, E. M., Fenn, M. E., Ganzeveld, L., Gebhart, K., Isil, S. S., Kerschner, B. M., Larson, R. S., Lavery, T., Lear, G. G., Macy, T., Mast, M. A., Mishoe, K., Morris, K. H., Padgett, P. E., Pouyat, R. V., Puchalski, M., Pye, H. O. T., Rea, A. W., Rhodes, M. F., Rogers, C. M., Saylor, R., Scheffe, R., Schichtel, B. A., Schwede, D. B., Sexstone, G. A., Sive, B. C., Sosa Echeverría, R., Templer, P. H., Thompson, T., Tong, D., Wetherbee, G. A., Whitlow, T. H., Wu, Z., Yu, Z., and Zhang, L.: Toward the improvement of total nitrogen deposition budgets in the United States, Sci. Total Environ., 691, 1328–1352, https://doi.org/10.1016/j.scitotenv.2019.07.058, 2019.
Wen, Z., Xu, W., Li, Q., Han, M., Tang, A., Zhang, Y., Luo, X., Shen, J., Wang, W., Li, K., Pan, Y., Zhang, L., Li, W., Collett, J. L., Zhong, B., Wang, X., Goulding, K., Zhang, F., and Liu, X.: Changes of nitrogen deposition in China from 1980 to 2018, Environ. Int., 144, 106022, https://doi.org/10.1016/j.envint.2020.106022, 2020.
Xu, W., Luo, X. S., Pan, Y. P., Zhang, L., Tang, A. H., Shen, J. L., Zhang, Y., Li, K. H., Wu, Q. H., Yang, D. W., Zhang, Y. Y., Xue, J., Li, W. Q., Li, Q. Q., Tang, L., Lu, S. H., Liang, T., Tong, Y. A., Liu, P., Zhang, Q., Xiong, Z. Q., Shi, X. J., Wu, L. H., Shi, W. Q., Tian, K., Zhong, X. H., Shi, K., Tang, Q. Y., Zhang, L. J., Huang, J. L., He, C. E., Kuang, F. H., Zhu, B., Liu, H., Jin, X., Xin, Y. J., Shi, X. K., Du, E. Z., Dore, A. J., Tang, S., Collett Jr., J. L., Goulding, K., Sun, Y. X., Ren, J., Zhang, F. S., and Liu, X. J.: Quantifying atmospheric nitrogen deposition through a nationwide monitoring network across China, Atmos. Chem. Phys., 15, 12345–12360, https://doi.org/10.5194/acp-15-12345-2015, 2015.
Xu, W., Zhang, L., and Liu, X.: A database of atmospheric nitrogen concentration and deposition from the nationwide monitoring network in China, Sci. Data, 6, 51, https://doi.org/10.1038/s41597-019-0061-2, 2019.
Zhang, M., Leon, C. de, and Migliaccio, K.: Evaluation and comparison of interpolated gauge rainfall data and gridded rainfall data in Florida, USA, Hydrolog. Sci. J., 63, 561–582, https://doi.org/10.1080/02626667.2018.1444767, 2018.
Zhang, Y., Foley, K. M., Schwede, D. B., Bash, J. O., Pinto, J. P., and Dennis, R. L.: A Measurement-Model Fusion Approach for Improved Wet Deposition Maps and Trends, J. Geophys. Res.-Atmos., 124, 4237–4251, https://doi.org/10.1029/2018JD029051, 2019.
Zhao, Y., Zhang, L., Chen, Y., Liu, X., Xu, W., Pan, Y., and Duan, L.: Atmospheric nitrogen deposition to China: A model analysis on nitrogen budget and critical load exceedance, Atmos. Environ., 153, 32–40, https://doi.org/10.1016/j.atmosenv.2017.01.018, 2017.
Zhu, J., Chen, Z., Wang, Q., Xu, L., He, N., Jia, Y., Zhang, Q., and Yu, G.: Potential transition in the effects of atmospheric nitrogen deposition in China, Environ. Pollut., 258, 113739, https://doi.org/10.1016/j.envpol.2019.113739, 2020.